86 Journal of the National Cancer Institute Monographs, No. 36, 2006 Background: We present a simulation model that predicts U.S. breast cancer mortality trends from 1975 to 2000 and quantifies the impact of screening mammography and adju- vant therapy on these trends. This model was developed within the Cancer Intervention and Surveillance Network (CISNET) consortium. Method: A Monte Carlo simulation is developed to generate the life history of individual breast cancer patients by using CISNET base case inputs that describe the secular trend in breast cancer risk, dissemina- tion patterns for screening mammography and adjuvant treatment, and death from causes other than breast cancer. The model generates the patient’s age, tumor size and stage at detection, mode of detection, age at death, and cause of death (breast cancer versus other) based in part on assump- tions on the natural history of breast cancer. Outcomes from multiple birth cohorts are summarized in terms of breast cancer mortality rates by calendar year. Result: Predicted breast cancer mortality rates follow the general shape of U.S. breast cancer mortality rates from 1975 to 1995 but level off after 1995 as opposed to following an observed decline. Sen- sitivity analysis revealed that the impact adjuvant treatment may be underestimated given the lack of data on temporal variation in treatment efficacy. Conclusion: We developed a simulation model that uses CISNET base case inputs and closely, but not exactly, reproduces U.S. breast cancer mor- tality rates. Screening mammography and adjuvant therapy are shown to have both contributed to a decline in U.S. breast cancer mortality. [J Natl Cancer Inst Monogr 2006;36:86–95] Age-adjusted breast cancer mortality rates in the United States have been decreasing from 1990 to 2001 (1). Together with six other research teams, we participated in the Cancer Intervention and Surveillance Network (CISNET) consortium to answer the base case question: “What are the contributions of screening and Affiliations of authors: Departments of Radiology (SKP, BMS, PS, JR) and Management Science and Engineering (PS, PG), Stanford University, Stanford, CA. Correspondence to: Sylvia K. Plevritis, PhD, Department of Radiology, School of Medicine, Stanford University, Stanford CA 94305 (e-mail: sylvia.plevritis@ stanford.edu). See “Note” following “References.” DOI: 10.1093/jncimonographs/lgj012 © The Author 2006. Published by Oxford University Press. All rights reserved. For Permissions, please e-mail: [email protected]. Chapter 12: A Stochastic Simulation Model of U.S. Breast Cancer Mortality Trends From 1975 to 2000 Sylvia K. Plevritis, Bronislava M. Sigal, Peter Salzman, Jarrett Rosenberg, Peter Glynn adjuvant therapy to the reduction of U.S. breast cancer mortal- ity?” (2). In this report, we describe the stochastic simulation model that we built to answer the CISNET base case question and related questions. Model Purpose Broadly stated, our CISNET model was developed for multi- ple purposes: First, our model can generate a virtual comprehen- sive tumor registry of breast cancer patients diagnosed in the United States since 1975 and, at the individual level, specifies the patient’s screening history, mode of detection, adjuvant treat- ment and survival; second, our model can quantify the impact of screening mammography and adjuvant therapy on breast cancer mortality trends from 1975 to 2000; third, our model can predict what the incidence and mortality trends would have been had alternative age groups been targeted for screening, had there been changes to the interval between screening examinations, and/or had there been changes to the subgroups targeted for adjuvant therapy; fourth, our model can predict how future trends in breast cancer mortality may be affected by new screening and treatment protocols shown to be beneficial at the clinical trial level. This report is focused primarily on how well our model predicts the observed U.S. breast cancer mortality rates from 1975 to 2000 and what our model predicts about the effects of screening mam- mography and adjuvant therapy on these rates. by guest on June 15, 2015 http://jncimono.oxfordjournals.org/ Downloaded from

Welcome message from author
This document is posted to help you gain knowledge. Please leave a comment to let me know what you think about it! Share it to your friends and learn new things together.
Transcript
86 Journal of the National Cancer Institute Monographs, No. 36, 2006
Background: We present a simulation model that predicts U.S. breast cancer mortality trends from 1975 to 2000 and quantifi es the impact of screening mammography and adju-vant therapy on these trends. This model was developed within the Cancer Intervention and Surveillance Network (CISNET) consortium. Method: A Monte Carlo simulation is developed to generate the life history of individual breast cancer patients by using CISNET base case inputs that describe the secular trend in breast cancer risk, dissemina-tion patterns for screening mammography and adjuvant treatment, and death from causes other than breast cancer. The model generates the patient’s age, tumor size and stage at detection, mode of detection, age at death, and cause of death (breast cancer versus other) based in part on assump-tions on the natural history of breast cancer. Outcomes from multiple birth cohorts are summarized in terms of breast cancer mortality rates by calendar year. Result: Predicted breast cancer mortality rates follow the general shape of U.S. breast cancer mortality rates from 1975 to 1995 but level off after 1995 as opposed to following an observed decline. Sen-sitivity analysis revealed that the impact adjuvant treatment may be underestimated given the lack of data on temporal variation in treatment effi cacy. Conclusion: We developed a simulation model that uses CISNET base case inputs and closely, but not exactly, reproduces U.S. breast cancer mor-tality rates. Screening mammography and adjuvant therapy are shown to have both contributed to a decline in U.S. breast cancer mortality. [J Natl Cancer Inst Monogr 2006;36: 86 – 95 ]
Age-adjusted breast cancer mortality rates in the United States have been decreasing from 1990 to 2001 ( 1 ) . Together with six other research teams, we participated in the Cancer Intervention and Surveillance Network (CISNET) consortium to answer the base case question: “ What are the contributions of screening and
Affi liations of authors: Departments of Radiology (SKP, BMS, PS, JR) and Management Science and Engineering (PS, PG), Stanford University, Stanford, CA.
Correspondence to: Sylvia K. Plevritis, PhD, Department of Radiology, School of Medicine, Stanford University, Stanford CA 94305 (e-mail: [email protected] ).
See “ Note ” following “ References. ”
DOI: 10.1093/jncimonographs/lgj012 © The Author 2006. Published by Oxford University Press. All rights reserved. For Permissions, please e-mail: [email protected].
Chapter 12: A Stochastic Simulation Model of U.S. Breast Cancer Mortality Trends From 1975 to 2000 Sylvia K. Plevritis , Bronislava M. Sigal , Peter Salzman , Jarrett Rosenberg , Peter Glynn
adjuvant therapy to the reduction of U.S. breast cancer mortal-ity? ” ( 2 ) . In this report, we describe the stochastic simulation model that we built to answer the CISNET base case question and related questions.
Model Purpose
Broadly stated, our CISNET model was developed for multi-ple purposes: First, our model can generate a virtual comprehen-sive tumor registry of breast cancer patients diagnosed in the United States since 1975 and, at the individual level, specifi es the patient’s screening history, mode of detection, adjuvant treat-ment and survival; second, our model can quantify the impact of screening mammography and adjuvant therapy on breast cancer mortality trends from 1975 to 2000; third, our model can predict what the incidence and mortality trends would have been had alternative age groups been targeted for screening, had there been changes to the interval between screening examinations, and/or had there been changes to the subgroups targeted for adjuvant therapy; fourth, our model can predict how future trends in breast cancer mortality may be affected by new screening and treatment protocols shown to be benefi cial at the clinical trial level. This report is focused primarily on how well our model predicts the observed U.S. breast cancer mortality rates from 1975 to 2000 and what our model predicts about the effects of screening mam-mography and adjuvant therapy on these rates.
by guest on June 15, 2015http://jncim
ono.oxfordjournals.org/D
ownloaded from
Journal of the National Cancer Institute Monographs, No. 36, 2006 87
Model Overview
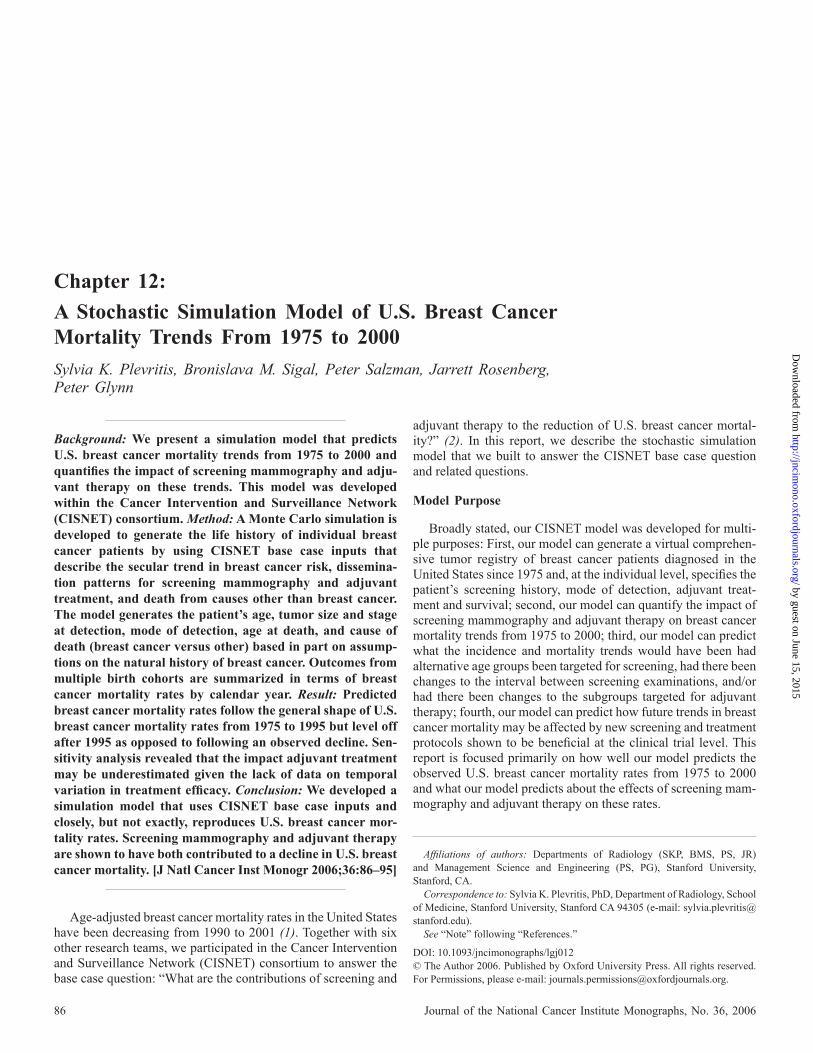
Figure 1 presents a fl owchart of our simulation model. The model is a continuous-time Monte Carlo simulation that can gen-erate the life histories of individual patients under various dis-semination profi les of screening mammography and adjuvant treatment. Characteristics generated for a simulated individual breast cancer patient include the following: 1) the date of her birth; 2) the age of her death from causes other than breast can-cer; 3) her primary tumor volume doubling time, tumor volume at clinical detection, and tumor volume at the transitions to re-gional and distant stages; 4) the ages that she undergoes mam-mographic screening examinations; 5) the ages that she is detected with invasive breast cancer in the absence and presence of screening; 6) her primary tumor volume, extent of nodal and distant involvement ER status at detection, in the presence and absence of screening; 7) the adjuvant treatment that she received, dependent on her tumor characteristics and disease stage at de-tection; 8) her breast cancer survival time given her disease stage, size, and age at detection; and 9) her cause of death (i.e., breast cancer versus other causes).
In brief, to predict outcomes of breast cancer patients in the presence and the absence of screening, we start by reconstruct-ing the natural history of the patient’s disease; next, we super-
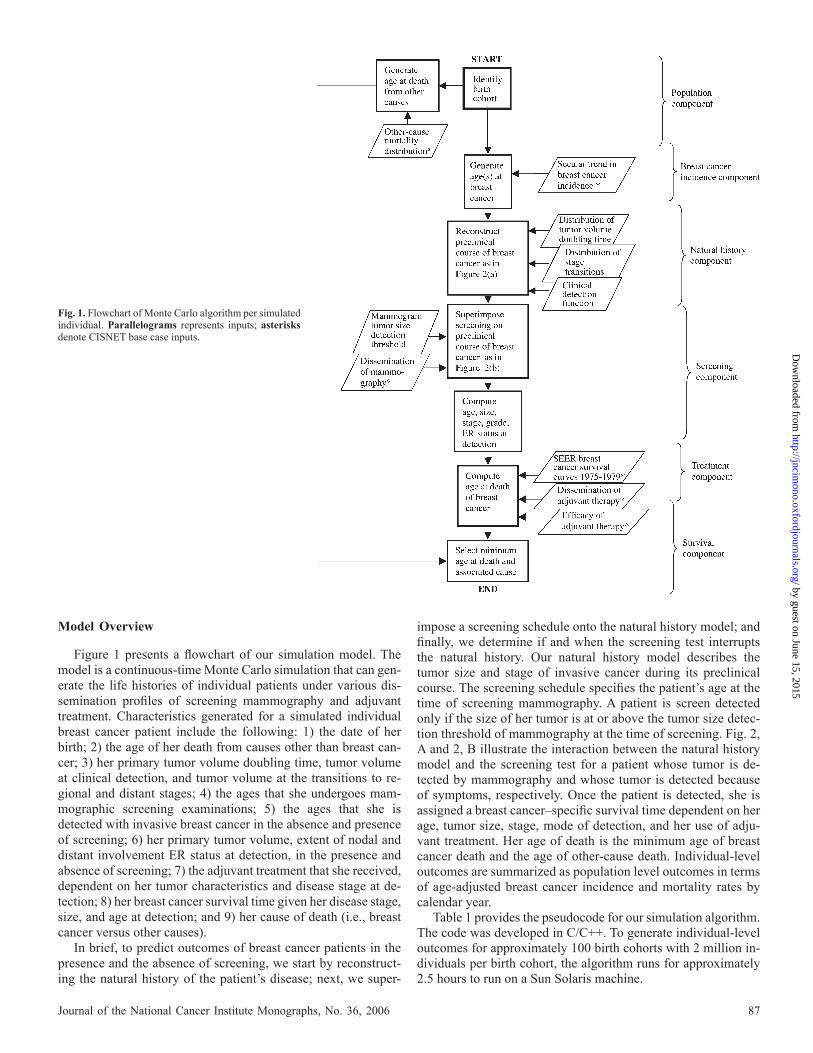
impose a screening schedule onto the natural history model; and fi nally, we determine if and when the screening test interrupts the natural history. Our natural history model describes the tumor size and stage of invasive cancer during its preclinical course. The screening schedule specifi es the patient’s age at the time of screening mammography. A patient is screen detected only if the size of her tumor is at or above the tumor size detec-tion threshold of mammography at the time of screening. Fig. 2, A and 2, B illustrate the interaction between the natural history model and the screening test for a patient whose tumor is de-tected by mammography and whose tumor is detected because of symptoms, respectively. Once the patient is detected, she is assigned a breast cancer – specifi c survival time dependent on her age, tumor size, stage, mode of detection, and her use of adju-vant treatment. Her age of death is the minimum age of breast cancer death and the age of other-cause death. Individual-level outcomes are summarized as population level outcomes in terms of age-adjusted breast cancer incidence and mortality rates by calendar year.
Table 1 provides the pseudocode for our simulation algorithm. The code was developed in C/C++. To generate individual-level outcomes for approximately 100 birth cohorts with 2 million in-dividuals per birth cohort, the algorithm runs for approximately 2.5 hours to run on a Sun Solaris machine.
Fig. 1. Flowchart of Monte Carlo algorithm per simulated individual. Parallelograms represents inputs; asterisks denote CISNET base case inputs.
by guest on June 15, 2015http://jncim
ono.oxfordjournals.org/D
ownloaded from

88 Journal of the National Cancer Institute Monographs, No. 36, 2006
Model Building
We built our model by fi rst identifying clinically and biologi-cally reasonable components that would infl uence breast cancer mortality. Two examples of such components include the natural history of the disease and the detection characteristics of the screening test; all model components are described in “ Model Components. ” Many of the components rely on the use of CIS-NET base case inputs ( 3 ) . To enable a direct comparison between our model and other models that were built in the CISNET Breast Cancer Consortium, we did not modify the CISNET base case in-puts. Inputs unique to our model describe the natural history of breast cancer and the detection characteristics of screening. We
formulated these model-specifi c inputs with a few parameters to ensure identifi ability. We merged all components into a Monte Carlo simulation algorithm that generates the breast cancer out-comes for individuals across multiple birth cohorts. We evaluated our model by demonstrating how well it reproduces breast cancer mortality trends. Because all factors infl uencing breast cancer mortality are not known, we did not calibrate to breast cancer mor-tality in the model building process. We regard a reasonable differ-ence between the predicted and observed mortality rates as a measure of the effect of other factors that we did not incorporate in our model because of the lack of informative data.
M ODEL C OMPONENTS
Figure 1 identifi es the underlying components of our simula-tion model and the input(s) to each component.
Population Component
Our population component specifi es the birth cohorts underly-ing the U.S. breast cancer trends from 1975 to 2000. To reproduce the outcomes of women aged 30 – 84 years in each calendar year from 1975 to 2000, we generated a sample of U.S. women born between 1887 and 1970. Each birth cohort consists of 2 million women, which we found to be a large enough number to reduce the sampling variability of the Monte Carlo method. Even though factors such as population immigration and emigration are likely to vary the relative sizes of the birth cohorts in the real world, the size of each birth cohort is kept constant in our simulation model because the incidence and mortality trends are reported as age-adjusted rates. Each simulated woman is assigned a birth date and an age at death from other causes. Given the year of birth, the date is uniformly distributed within the year. Similarly, given integer age at death of other causes, actual age is simulated uniformly within the year. Death from breast cancer and other causes are assumed to be independent. This component relies on a CISNET base case input, which specifi es the other-cause death rate, by birth cohort, based on the Berkeley Mortality Database ( 4 ) .
Breast Cancer Incidence Component
Our breast cancer incidence component determines whether or not an individual from a particular birth cohort would become
Fig. 2. A ) Natural history of breast cancer modeled in a patient whose tumor is screen detected. B ) Natural history of breast cancer modeled in a patient whose tumor is clinically detected between two screening examinations. Arrows represent screening events.
Table 1. Pseudocode of Monte Carlo simulation algorithm developed to predict U.S. breast cancer incidence and mortality rates from 1975 to 2000
For birth cohorts 1887 to 1970 For individuals 1 to 2 000 000 Step 1: Generate date of birth (see Population Component) Step 2: Generate age at other-cause death given birth cohort (see Population Component) Step 3: Generate age at clinical detection (see Breast Cancer Incidence Component) Step 4: Generate tumor volume doubling time (see Natural History Component). Step 5: Generate tumor size at clinical detection given the tumor volume doubling time (see Natural History Component) Step 6: Generate tumor size at the onset of regional and distant stage (see Natural History Component) Step 7: Compute stage of the tumor at clinical detection Step 8: Generate age at breast cancer death following clinical detection given age and stage at clinical detection (see Breast Cancer Survival Component) Step 9: Generate the ages undergoing screening given birth cohort (see Screening Component) Step 10: Generate the tumor size detection threshold of mammography (see Screening Component) Step 11: Compute age, tumor size and stage at screen detection (see Screening Component) Step 12: Generate type of adjuvant therapy (see Breast Cancer Treatment Component) Step 13: Generate age at breast cancer death following screen detection given age and stage at breast cancer death (see Breast Cancer Survival) Step 14: Compute age of death as the minimum between age of breast cancer death and age of other cause of deathRepeat for next individualRepeat for next birth cohort
by guest on June 15, 2015http://jncim
ono.oxfordjournals.org/D
ownloaded from
Journal of the National Cancer Institute Monographs, No. 36, 2006 89
clinically detected with invasive breast cancer in the absence of the screening and other-cause mortality. The breast cancer patient is assigned the age that her fi rst primary invasive tumor clinically surfaces.
This component relies on a CISNET base case input com-monly referred to as the “ secular trend in breast cancer inci-dence, ” which was estimated from the historic Connecticut Tumor Registry (CTR) and Surveillance, Epidemiology, and End Results (SEER) ( 5 ) . The base case input estimates incidence rate of the fi rst primary breast cancer (invasive and in situ) in the ab-sence of screening for annual birth cohorts starting 1891 by sin-gle year of age, for ages 25 – 84 years. The base case incidence is assumed to be zero for women younger than 25 years and older than 84 years.
We treat the base case incidence as the hazard rate of the fi rst cancer and apply it to our estimated cancer-free population. For each birth cohort we interpret the given incidence per 100 000 women ( h a )as the hazard rate for age a . To reduce the computa-tional time for multiple runs, we generate and sample from a distribution function of the clinical detection age ( A BC ) at symp-tomatic detection of the fi rst invasive breast cancer for each birth cohort as follows:
PðABC � aÞ ¼ 1�Yai¼25
ð1� hi=100 000Þ
where the age a is an integer. Because this is a discrete distribu-tion function of the woman’s age at the fi rst symptomatic detec-tion, we generate the exact age by assuming a uniform distribution within a year. The same calculation is made for all the birth cohorts.
Because the base case input provides the estimated trend for the sum of clinically detected in situ and invasive cases, we mod-ifi ed it to estimate the incidence for clinically detected invasive disease only. We adjusted it by removing an estimated proportion of ductal carcinoma in situ (DCIS) cases as a function of age from Surveillance, Epidemiology, and End Results (SEER) 1975 – 1979 data. The same correction factor was applied to all birth cohorts. It is possible that temporal and/or birth cohort vari-ations affect this relationship, but we do not have informative data to produce such estimates. If we are underestimating the proportion of DCIS, we are overestimating the incidence and mortality of invasive breast cancer, and vice versa.
Further, the CISNET base case input on breast cancer secular trend exist may be overestimating the true hazard of the fi rst pri-mary, particularly in the older age groups. The base case inci-dence was approximated as the observed count of “ new cancers ” divided by the size of the midyear population based on data from the CTR and SEER, whereas the true incidence is defi ned as the count of “ fi rst cancers ” divided by the size of the cancer-free population ( 6 ) . This approximation is made because SEER does not include the size of the cancer-free population. It would pro-duce the true incidence if women are equally at risk for breast cancer regardless of their history of breast cancer. However, the risk of breast cancer probably increases with a prior history of primaries as evidenced by the Gail model ( 7 ) ; hence, the approx-imation biases toward a larger number of fi rst primaries and a possibly a larger breast cancer mortality. Its exact effect on breast cancer mortality is not obvious without taking into account the differences in the stage distribution and survival of a fi rst primary and subsequent primaries.
Natural History Component
Our natural history component specifi es the size of a breast cancer patient’s fi rst primary invasive breast tumor and its SEER historic stage from the moment the tumor is invasive and 2 mm in diameter to the moment it clinically surfaces. It also specifi es the mechanism under which the fi rst primary invasive tumor clinically surfaces. (By “ clinically surfaces ” we refer to the event due to a patient experiencing physical symptoms associated with breast cancer.) In this section, we describe the parameterization of the natural history model and parameter estimation. Tumor size and stage during preclinical period. The tumor is assumed to be spherical and grow exponentially during its pre-clinical period. We defi ne the preclinical period from the moment the tumor is invasive and 2 mm in diameter to the moment it clinically surfaces. The volume of the tumor at time t is expressed as V(t) = c 0 exp (t/R), where the inverse growth rate R [which is the doubling time divided by ln( 2 ) ] has gamma distribution with rate α and shape β , as suggested by others ( 8 ) .
We assumed that the disease starts in the local stage and pro-gresses to regional and distant stages as the primary tumor in-creases in size ( 9 ) . We defi ne the onset of the regional stage as the point at which nodal involvement fi rst becomes detectable by methods commonly used in clinical practice. Similarly, we defi ne the onset of the distant stage as the point at which distant disease fi rst becomes detectable by techniques commonly used in clinical practice. If the tumor is clinically detected before the onset of the regional or distant disease, it is staged as local disease. If the tumor is clinically detected after regional transition but before distant transition, it is staged as regional disease. If the tumor is clinically detected after the distant transition, it is staged as distant disease.
The hazard of the time to onset of observable regional disease is analytically modeled as
PðTN 2 ½t; t þ dtÞjTN � tÞ ¼ ðg0 þ g1VðtÞÞdt þ oðdtÞ This event is modeled as two processes: the hazard of the fi rst
process is constant over time; the hazard of the second process is proportional to the volume of the tumor at time t, V(t) and there-fore increases as the tumor grows in volume.
Similarly, the hazard of the time to onset of observable distant metastasis ( T M ), measured from the onset of the observable re-gional disease, is
PðTM 2 ½t; t þ dtÞjTM � t; TN ¼ tN Þ
¼ ðx0 þ x1V ðtÞÞdt þ oðdtÞ; t � tN
0; t < tN:
�
We do not include a temporal trend in the onset of regional and distant disease due to the lack of informative data; yet, it is possible that technology advancements have caused a stage migration ( 10 ) .
Clinical detection function. The hazard of the time to clini-cal detection ( T D ) is assumed to be proportional to the tumor volume,
PðTD 2 ½t; t þ dtÞjTD � tÞ ¼ cV ðtÞÞdt þ oðdtÞ This clinical detection function was considered previously for
breast cancer ( 8 ) . Estimation of parameters in natural history model. Our
natural history model has seven parameters: α , β , η 0 , η 1 , ω 0 , ω 1 and γ . Maximum likelihood estimates for these parameters are based on SEER data of the tumor size and stage of invasive
by guest on June 15, 2015http://jncim
ono.oxfordjournals.org/D
ownloaded from
90 Journal of the National Cancer Institute Monographs, No. 36, 2006
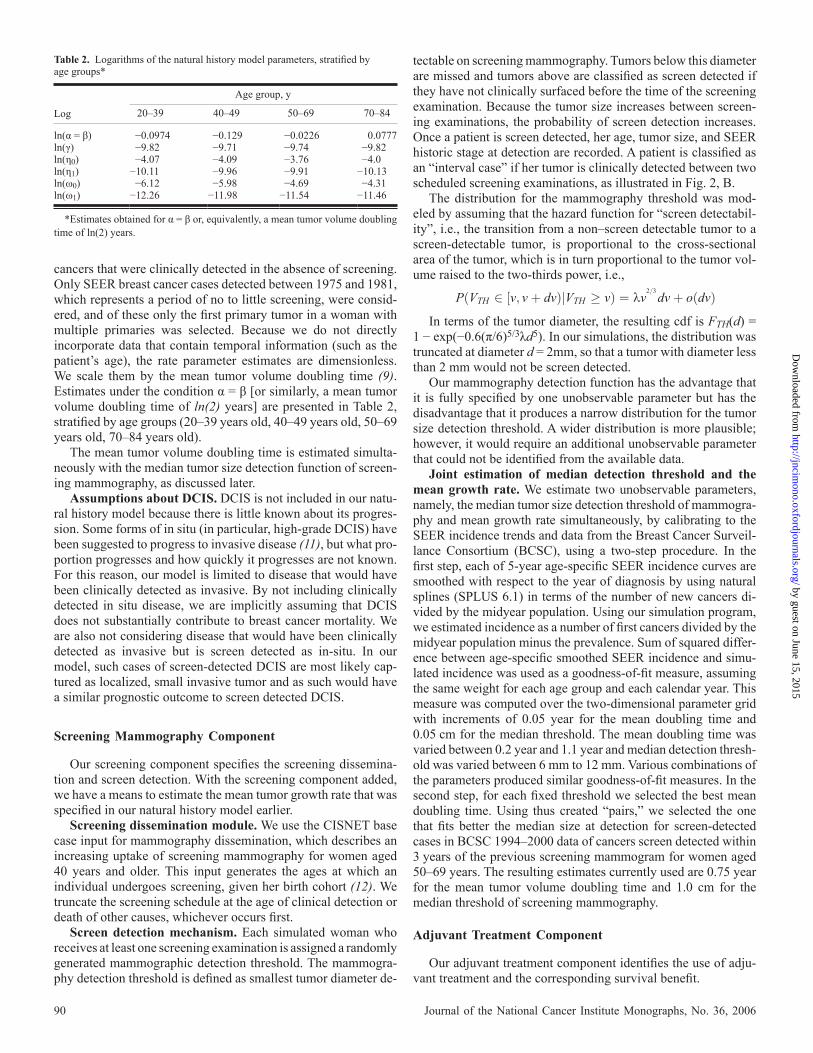
cancers that were clinically detected in the absence of screening. Only SEER breast cancer cases detected between 1975 and 1981, which represents a period of no to little screening, were consid-ered, and of these only the fi rst primary tumor in a woman with multiple primaries was selected. Because we do not directly incorporate data that contain temporal information (such as the patient’s age), the rate parameter estimates are dimensionless. We scale them by the mean tumor volume doubling time ( 9 ) . Estimates under the condition α = β [or similarly, a mean tumor volume doubling time of ln( 2 ) years] are presented in Table 2 , stratifi ed by age groups (20 – 39 years old, 40 – 49 years old, 50 – 69 years old, 70 – 84 years old).
The mean tumor volume doubling time is estimated simulta-neously with the median tumor size detection function of screen-ing mammography, as discussed later.
Assumptions about DCIS. DCIS is not included in our natu-ral history model because there is little known about its progres-sion. Some forms of in situ (in particular, high-grade DCIS) have been suggested to progress to invasive disease ( 11 ) , but what pro-portion progresses and how quickly it progresses are not known. For this reason, our model is limited to disease that would have been clinically detected as invasive. By not including clinically detected in situ disease, we are implicitly assuming that DCIS does not substantially contribute to breast cancer mortality. We are also not considering disease that would have been clinically detected as invasive but is screen detected as in-situ. In our model, such cases of screen-detected DCIS are most likely cap-tured as localized, small invasive tumor and as such would have a similar prognostic outcome to screen detected DCIS.
Screening Mammography Component
Our screening component specifi es the screening dissemina-tion and screen detection. With the screening component added, we have a means to estimate the mean tumor growth rate that was specifi ed in our natural history model earlier.
Screening dissemination module. We use the CISNET base case input for mammography dissemination, which describes an increasing uptake of screening mammography for women aged 40 years and older. This input generates the ages at which an individual undergoes screening, given her birth cohort ( 12 ) . We truncate the screening schedule at the age of clinical detection or death of other causes, whichever occurs fi rst.
Screen detection mechanism. Each simulated woman who receives at least one screening examination is assigned a randomly generated mammographic detection threshold. The mammogra-phy detection threshold is defi ned as smallest tumor diameter de-
tectable on screening mammography. Tumors below this diameter are missed and tumors above are classifi ed as screen detected if they have not clinically surfaced before the time of the screening examination. Because the tumor size increases between screen-ing examinations, the probability of screen detection increases. Once a patient is screen detected, her age, tumor size, and SEER historic stage at detection are recorded. A patient is classifi ed as an “ interval case ” if her tumor is clinically detected between two scheduled screening examinations, as illustrated in Fig. 2, B.
The distribution for the mammography threshold was mod-eled by assuming that the hazard function for “ screen detectabil-ity ” , i.e., the transition from a non – screen detectable tumor to a screen-detectable tumor, is proportional to the cross-sectional area of the tumor, which is in turn proportional to the tumor vol-ume raised to the two-thirds power, i.e.,
PðVTH 2 ½v; vþ dvÞjVTH � vÞ ¼ kv2=3
dvþ oðdvÞ In terms of the tumor diameter, the resulting cdf is F TH (d) =
1 − exp ( − 0.6( π /6) 5/3 λ d 5 ). In our simulations, the distribution was truncated at diameter d = 2mm, so that a tumor with diameter less than 2 mm would not be screen detected.
Our mammography detection function has the advantage that it is fully specifi ed by one unobservable parameter but has the disadvantage that it produces a narrow distribution for the tumor size detection threshold. A wider distribution is more plausible; however, it would require an additional unobservable parameter that could not be identifi ed from the available data.
Joint estimation of median detection threshold and the mean growth rate. We estimate two unobservable parameters, namely, the median tumor size detection threshold of mammogra-phy and mean growth rate simultaneously, by calibrating to the SEER incidence trends and data from the Breast Cancer Surveil-lance Consortium (BCSC), using a two-step procedure. In the fi rst step, each of 5-year age-specifi c SEER incidence curves are smoothed with respect to the year of diagnosis by using natural splines (SPLUS 6.1) in terms of the number of new cancers di-vided by the midyear population. Using our simulation program, we estimated incidence as a number of fi rst cancers divided by the midyear population minus the prevalence. Sum of squared differ-ence between age-specifi c smoothed SEER incidence and simu-lated incidence was used as a goodness-of-fi t measure, assuming the same weight for each age group and each calendar year. This measure was computed over the two-dimensional parameter grid with increments of 0.05 year for the mean doubling time and 0.05 cm for the median threshold. The mean doubling time was varied between 0.2 year and 1.1 year and median detection thresh-old was varied between 6 mm to 12 mm. Various combinations of the parameters produced similar goodness-of-fi t measures. In the second step, for each fi xed threshold we selected the best mean doubling time. Using thus created “ pairs, ” we selected the one that fi ts better the median size at detection for screen-detected cases in BCSC 1994 – 2000 data of cancers screen detected within 3 years of the previous screening mammogram for women aged 50 – 69 years. The resulting estimates currently used are 0.75 year for the mean tumor volume doubling time and 1.0 cm for the median threshold of screening mammography.
Adjuvant Treatment Component
Our adjuvant treatment component identifi es the use of adju-vant treatment and the corresponding survival benefi t.
Table 2. Logarithms of the natural history model parameters, stratifi ed by age groups*
Log
Age group, y
20 – 39 40 – 49 50 – 69 70 – 84
ln( α = β ) − 0.0974 − 0.129 − 0.0226 0.0777ln( γ ) − 9.82 − 9.71 − 9.74 − 9.82ln( η 0 ) − 4.07 − 4.09 − 3.76 − 4.0ln( η 1 ) − 10.11 − 9.96 − 9.91 − 10.13ln( ω 0 ) − 6.12 − 5.98 − 4.69 − 4.31ln( ω 1 ) − 12.26 − 11.98 − 11.54 − 11.46
*Estimates obtained for α = β or, equivalently, a mean tumor volume doubling time of ln(2) years.
by guest on June 15, 2015http://jncim
ono.oxfordjournals.org/D
ownloaded from
Journal of the National Cancer Institute Monographs, No. 36, 2006 91
Treatment dissemination. Each breast cancer patient is as-signed adjuvant treatment (tamoxifen, multiagent chemotherapy, both, neither) depending on the patient’s age, tumor size, stage, estrogen receptor (ER) status, and year at detection, as specifi ed by the NCI treatment dissemination base case input ( 13 ) .
Tamoxifen dissemination targets ER-positive tumors in more recent years. Because ER status was not part of the natural his-tory model, we assume that ER status does not vary over the pre-clinical course of the disease and does not affect the probability of screen detection. The probability that an individual breast can-cer patient has an ER-positive tumor was based on the proportion of women with ER-positive disease in the SEER data 1990 – 1994: The proportion is 62%, 75%, and 83% for women younger than 50, 50 – 69, and 70 years or older at detection, respectively.
Treatment effi cacy. We assume proportional benefi ts due to adjuvant treatment using published hazard ratios ( 14 – 16 ) . For che-motherapy, the hazard ratio for the breast cancer – specifi c survival depends on the age at detection: 0.72 for women aged less than 40 years, 0.73 for women aged 40 – 49 years, 0.84 for women aged 50 – 59 years, and 0.91 for women aged 60 years and older. For tamoxifen, the benefi t is assigned only to patients with ER-positive tumor and depends on the number of years that the treatment is assigned (2 years versus 5 years). The associated hazard ratios used are 2 years of tamoxifen and 0.69 for 5 years of tamoxifen. These hazard ratios were modifi ed by 10% to convert the reported overall survival effect due to tamoxifen to a breast cancer – specifi c survival effect. If a woman receives both chemotherapy and tamoxifen, the product of hazard ratios is applied.
Survival/Mortality Component
Our survival component specifi es a patient’s breast cancer survival time from the moment her fi rst primary invasive tumor is detected. Breast cancer survival depends on the patient’s age, tumor size, and SEER historic stage at detection, as well as the mode of detection and use of adjuvant therapy.
Baseline breast cancer survival. Breast cancer survival curves for patients detected in the absence of screening and adjuvant therapy are a CISNET base case input, referred to as baseline breast cancer survival curves. These are Kaplan – Meier estimates obtained from SEER data for female breast cancer patients who were detected between 1975 and 1979 and for whom breast can-cer was their fi rst primary tumor. Because 1975 – 1979 is associ-ated with minimal levels of screening and adjuvant therapy, the baseline survival curves are assumed to capture only the effects of primary breast cancer treatment, namely, surgery with the possi-bility of radiation. The curves are stratifi ed by age at detection (i.e., 30 – 39 years old, 40 – 49 years old, 50 – 59 years old, 60 – 69 years old, 70 – 84 years old) and SEER historic stage (i.e., local, regional, distant); local and regional stages curves are further stratifi ed by tumor size (i.e., <2 cm, 2 – 5 cm, and ≥ 5 cm). The tail of the Kaplan – Meier curve is assumed to represent a cure fraction.
Breast cancer survival post – screen detection without adju-vant therapy. The breast cancer survival curve post – screen detection is taken to be the maximum of two curves: 1) the baseline survival curve that corresponds to the age, size, and stage at screen detection and 2) the baseline survival curve that corresponds to the age, size, and stage at clinical detection. Both survival curves are initiated at the corresponding age of detection, and the probability of sur-vival for clinical detection is set at 100% during the lead time. This approach rules out the possibility of death during the lead time.
The assignment of breast cancer survival post – screen detec-tion is arbitrary. Lower breast cancer mortality rates would be obtained by using the baseline breast cancer survival curve that corresponds to the screen-detected tumor characteristics initiated at the age of clinical detection. Higher breast cancer mortality rates would be obtained by using the baseline breast cancer sur-vival curve that corresponds to the screen-detected tumor charac-teristics initiated at the age of screen detection, because it would allow for death in the lead time. In a sensitivity analysis, we found that these two extremes do not produce outcomes that deviate substantially from the decision rule that we applied.
Breast cancer survival following adjuvant therapy with and without screening. We assume a proportional hazard reduc-tion in breast cancer mortality due to adjuvant treatment (see “ Treatment effi cacy ” ). In the absence of screening, the hazard ratio is applied to the base case baseline breast cancer curves. In the presence of screening, the hazard ratio is applied to the result-ing breast cancer survival curve obtained in “ Breast cancer sur-vival post – screen detection without adjuvant therapy. ”
M ODEL V ERIFICATION
Three approaches were taken to demonstrate that our simula-tion model produces known or expected outcomes. First, we verifi ed that the base case input distributions were correctly re-produced by our simulation, in particular, the distribution of time to death from breast cancer not subject to death from other causes; the distribution of time to death from other causes; the age- specifi c breast cancer incidence by birth cohort; the distribution of the time to fi rst mammogram; the proportion of women receiv-ing 1, 2, 3, 4, 5, 6, and 7 or more mammograms from 1994 to 2000; and the treatment dissemination profi le. We also verifi ed that the model-specifi c input distributions were correctly repro-duced by our simulation, in particular, the distribution of clini-cally detected tumor sizes, the tumor size at nodal and distant involvement, and the growth rate distribution.
Second, we ran a series of hypothetical, diagnostic tests and verifi ed that our simulation produces reasonable responses. We considered the following scenarios: a breast cancer risk of zero, no screening, 100% annual screening for women aged 40 – 79 years, low median detection threshold of mammography (2 mm), large median detection threshold of mammography (5 cm); low mean tumor volume doubling time (1 month); high mean tumor volume doubling time (18 months), and a fl at secular trend.
Third, we performed internal validation tests and verifi ed that our simulation produces reasonable responses. We analyzed the growth rate and tumor size distributions of screen-detected and interval cases to confi rm that screen-detected cancers are more likely to be smaller and slower growing than interval cancers.
M ODEL V ALIDATION
We evaluate our simulation model based on how well it predicts the observed U.S. breast cancer mortality rates from 1975 to 2000.
Comparison of Predicted and Observed U.S. Breast Cancer Mortality
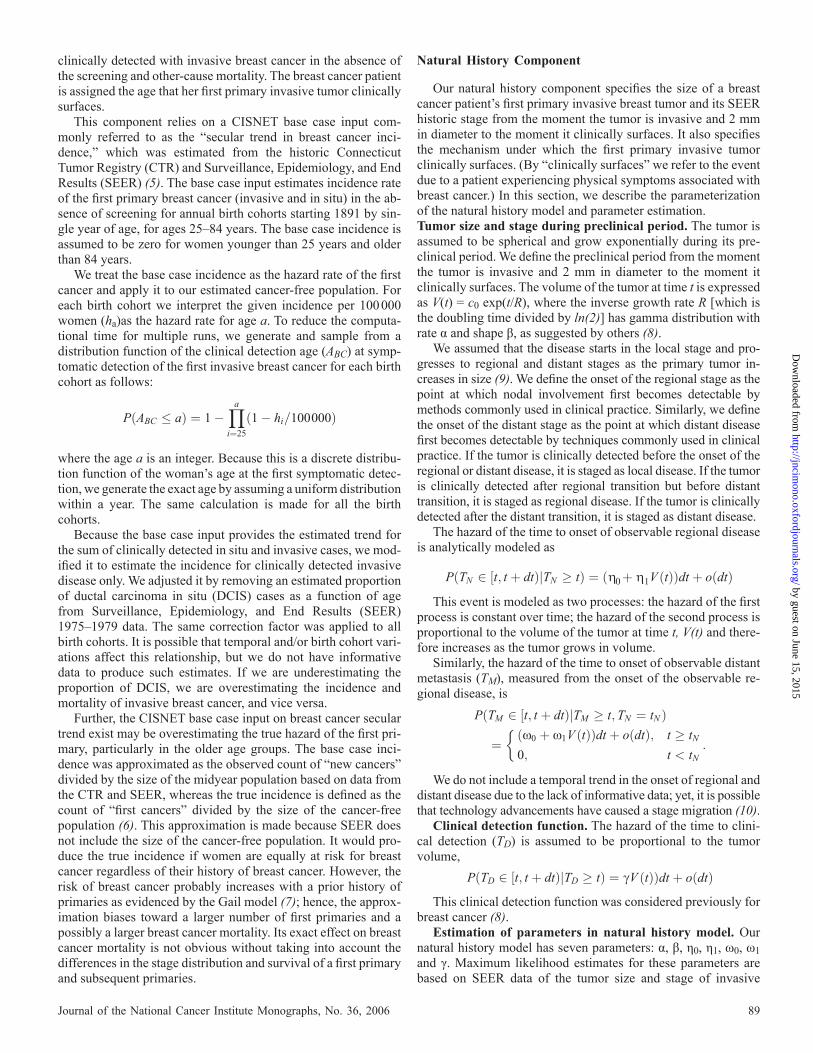
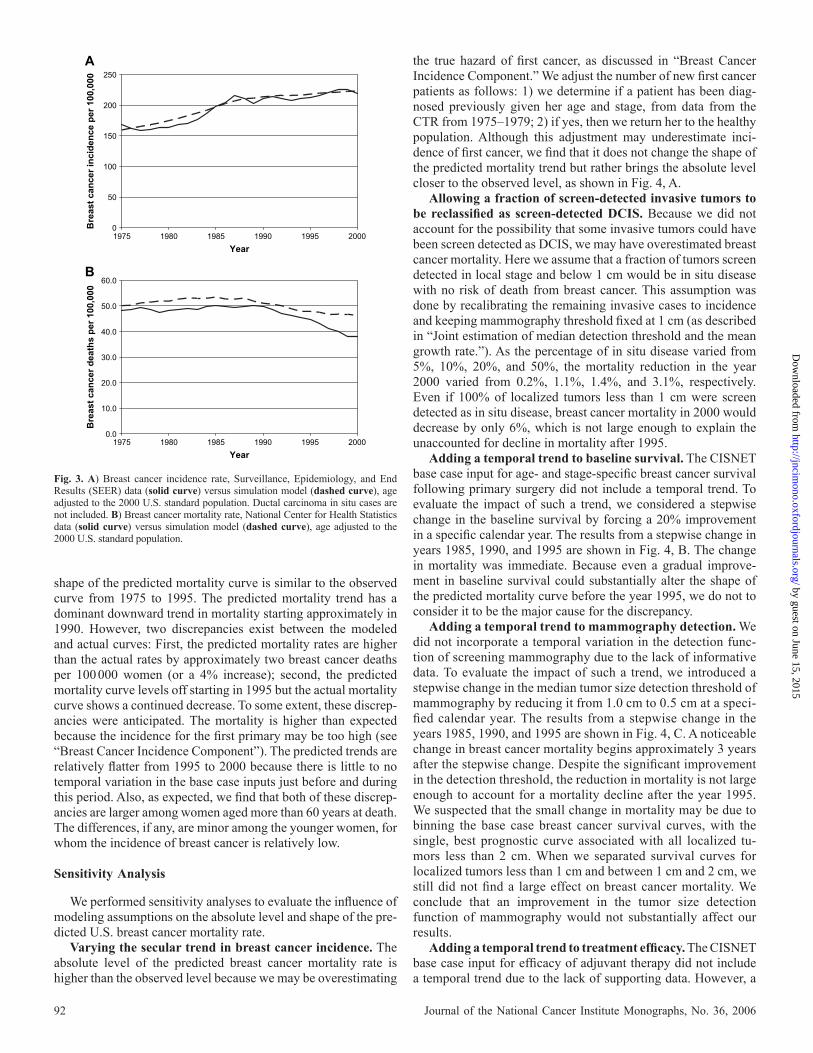
Figure 3, B compares the predicted and actual age-adjusted breast cancer mortality rates from 1975 to 2000. The general
by guest on June 15, 2015http://jncim
ono.oxfordjournals.org/D
ownloaded from
92 Journal of the National Cancer Institute Monographs, No. 36, 2006
shape of the predicted mortality curve is similar to the observed curve from 1975 to 1995. The predicted mortality trend has a dominant downward trend in mortality starting approximately in 1990. However, two discrepancies exist between the modeled and actual curves: First, the predicted mortality rates are higher than the actual rates by approximately two breast cancer deaths per 100 000 women (or a 4% increase); second, the predicted mortality curve levels off starting in 1995 but the actual mortality curve shows a continued decrease. To some extent, these discrep-ancies were anticipated. The mortality is higher than expected because the incidence for the fi rst primary may be too high (see “ Breast Cancer Incidence Component ” ). The predicted trends are relatively fl atter from 1995 to 2000 because there is little to no temporal variation in the base case inputs just before and during this period. Also, as expected, we fi nd that both of these discrep-ancies are larger among women aged more than 60 years at death. The differences, if any, are minor among the younger women, for whom the incidence of breast cancer is relatively low.
Sensitivity Analysis
We performed sensitivity analyses to evaluate the infl uence of modeling assumptions on the absolute level and shape of the pre-dicted U.S. breast cancer mortality rate.
Varying the secular trend in breast cancer incidence. The absolute level of the predicted breast cancer mortality rate is higher than the observed level because we may be overestimating
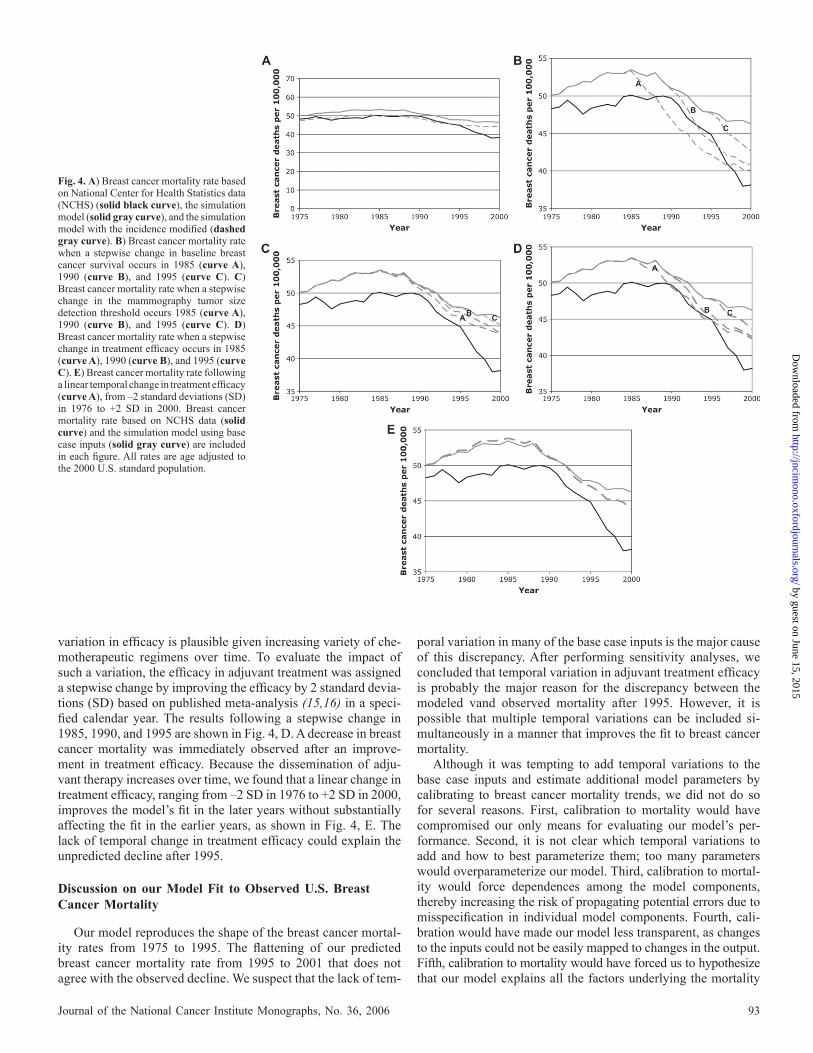
the true hazard of fi rst cancer, as discussed in “ Breast Cancer Incidence Component. ” We adjust the number of new fi rst cancer patients as follows: 1) we determine if a patient has been diag-nosed previously given her age and stage, from data from the CTR from 1975 – 1979; 2) if yes, then we return her to the healthy population. Although this adjustment may underestimate inci-dence of fi rst cancer, we fi nd that it does not change the shape of the predicted mortality trend but rather brings the absolute level closer to the observed level, as shown in Fig. 4, A.
Allowing a fraction of screen-detected invasive tumors to be reclassifi ed as screen-detected DCIS. Because we did not account for the possibility that some invasive tumors could have been screen detected as DCIS, we may have overestimated breast cancer mortality. Here we assume that a fraction of tumors screen detected in local stage and below 1 cm would be in situ disease with no risk of death from breast cancer. This assumption was done by recalibrating the remaining invasive cases to incidence and keeping mammography threshold fi xed at 1 cm (as described in “ Joint estimation of median detection threshold and the mean growth rate. ” ). As the percentage of in situ disease varied from 5%, 10%, 20%, and 50%, the mortality reduction in the year 2000 varied from 0.2%, 1.1%, 1.4%, and 3.1%, respectively. Even if 100% of localized tumors less than 1 cm were screen detected as in situ disease, breast cancer mortality in 2000 would decrease by only 6%, which is not large enough to explain the unaccounted for decline in mortality after 1995.
Adding a temporal trend to baseline survival. The CISNET base case input for age- and stage-specifi c breast cancer survival following primary surgery did not include a temporal trend. To evaluate the impact of such a trend, we considered a stepwise change in the baseline survival by forcing a 20% improvement in a specifi c calendar year. The results from a stepwise change in years 1985, 1990, and 1995 are shown in Fig. 4, B. The change in mortality was immediate. Because even a gradual improve-ment in baseline survival could substantially alter the shape of the predicted mortality curve before the year 1995, we do not to consider it to be the major cause for the discrepancy.
Adding a temporal trend to mammography detection. We did not incorporate a temporal variation in the detection func-tion of screening mammography due to the lack of informative data. To evaluate the impact of such a trend, we introduced a stepwise change in the median tumor size detection threshold of mammography by reducing it from 1.0 cm to 0.5 cm at a speci-fi ed calendar year. The results from a step wise change in the years 1985, 1990, and 1995 are shown in Fig. 4, C. A noticeable change in breast cancer mortality begins approximately 3 years after the stepwise change. Despite the signifi cant improvement in the detection threshold, the reduction in mortality is not large enough to account for a mortality decline after the year 1995. We suspected that the small change in mortality may be due to binning the base case breast cancer survival curves, with the single, best prognostic curve associated with all localized tu-mors less than 2 cm. When we separated survival curves for localized tumors less than 1 cm and between 1 cm and 2 cm, we still did not fi nd a large effect on breast cancer mortality. We conclude that an improvement in the tumor size detection function of mammography would not substantially affect our results.
Adding a temporal trend to treatment effi cacy. The CISNET base case input for effi cacy of adjuvant therapy did not include a temporal trend due to the lack of supporting data. However, a
Fig. 3. A ) Breast cancer incidence rate, Surveillance, Epidemiology, and End Re sults (SEER) data ( solid curve ) versus simulation model ( dashed curve ), age adjusted to the 2000 U.S. standard population. Ductal carcinoma in situ cases are not included. B ) Breast cancer mortality rate, National Center for Health Statistics data ( solid curve ) versus simulation model ( dashed curve ), age adjusted to the 2000 U.S. standard population.
0
50
100
150
200
250
1975 1980 1985 1990 1995 2000Year
1975 1980 1985 1990 1995 2000Year
Breast can
cer in
cid
en
ce p
er 100,000
0.0
10.0
20.0
30.0
40.0
50.0
60.0
Breast can
cer d
eath
s p
er 100,000
A
B
by guest on June 15, 2015http://jncim
ono.oxfordjournals.org/D
ownloaded from
Journal of the National Cancer Institute Monographs, No. 36, 2006 93
variation in effi cacy is plausible given increasing variety of che-motherapeutic regimens over time. To evaluate the impact of such a variation, the effi cacy in adjuvant treatment was assigned a stepwise change by improving the effi cacy by 2 standard devia-tions (SD) based on published meta-analysis ( 15 , 16 ) in a speci-fi ed calendar year. The results following a stepwise change in 1985, 1990, and 1995 are shown in Fig. 4, D. A decrease in breast cancer mortality was immediately observed after an improve-ment in treatment effi cacy. Because the dissemination of adju-vant therapy increases over time, we found that a linear change in treatment effi cacy, ranging from – 2 SD in 1976 to +2 SD in 2000, improves the model’s fi t in the later years with out substantially affecting the fi t in the earlier years, as shown in Fig. 4, E. The lack of temporal change in treatment effi cacy could explain the unpredicted decline after 1995.
Discussion on our Model Fit to Observed U.S. Breast Cancer Mortality
Our model reproduces the shape of the breast cancer mortal-ity rates from 1975 to 1995. The fl attening of our predicted breast cancer mortality rate from 1995 to 2001 that does not agree with the observed decline. We suspect that the lack of tem-
poral variation in many of the base case inputs is the major cause of this discrepancy. After performing sensitivity analyses, we concluded that temporal variation in adjuvant treatment effi cacy is probably the major reason for the discrepancy between the modeled vand observed mortality after 1995. However, it is possible that multiple temporal variations can be included si-multaneously in a manner that improves the fi t to breast cancer mortality.
Although it was tempting to add temporal variations to the base case inputs and estimate additional model parameters by calibrating to breast cancer mortality trends, we did not do so for several reasons. First, calibration to mortality would have compromised our only means for evaluating our model’s per-formance. Second, it is not clear which temporal variations to add and how to best parameterize them; too many parameters would overparameterize our model. Third, calibration to mortal-ity would force dependences among the model components, thereby increasing the risk of propagating potential errors due to misspecifi cation in individual model components. Fourth, cali-bration would have made our model less transparent, as changes to the inputs could not be easily mapped to changes in the output. Fifth, calibration to mortality would have forced us to hypothesize that our model explains all the factors underlying the mortality
Fig. 4. A ) Breast cancer mortality rate based on National Center for Health Statistics data (NCHS) ( solid black curve ), the simulation model ( solid gray curve ), and the simulation model with the incidence modifi ed ( dashed gray curve ). B ) Breast cancer mortality rate when a stepwise change in baseline breast cancer survival occurs in 1985 ( curve A ), 1990 ( curve B ), and 1995 ( curve C ). C ) Breast cancer mortality rate when a stepwise change in the mammography tumor size detection threshold occurs 1985 ( curve A ), 1990 ( curve B ), and 1995 ( curve C ). D ) Breast cancer mortality rate when a stepwise change in treatment effi cacy occurs in 1985 ( curve A ), 1990 ( curve B ), and 1995 ( curve C ). E ) Breast cancer mortality rate following a linear temporal change in treatment effi cacy ( curve A ), from –2 standard deviations (SD) in 1976 to +2 SD in 2000. Breast cancer mortality rate based on NCHS data ( solid curve ) and the simulation model using base case inputs ( solid gray curve ) are included in each fi gure. All rates are age adjusted to the 2000 U.S. standard population.
by guest on June 15, 2015http://jncim
ono.oxfordjournals.org/D
ownloaded from
94 Journal of the National Cancer Institute Monographs, No. 36, 2006
trends. Finally, calibration would have forced us to modify the CISNET base case inputs and thereby make our model not di-rectly comparable to other CISNET models.
Even though we did not include DCIS in our base case analy-sis, we produced a reasonable match to breast cancer mortality. If screen-detected DCIS has had a dominant impact on breast cancer mortality, then we should have generated a much worse prediction of breast cancer mortality since DCIS accounts for a substantial fraction of incident breast cancer in the presence of screening. Breast cancer that would have been clinically detected as invasive disease in the absence of screening but is detected as DCIS in the presence of screening is probably being represented in our model as small, localized tumors with comparable progno-sis. However, this fi nding does not imply that screen detecting disease as DCIS instead of small, localized disease is not clini-cally relevant. A more in-depth analysis needs to consider the complex detection characteristics of mammography for in situ versus invasive cancer.
CISNET B ASE C ASE R ESULT
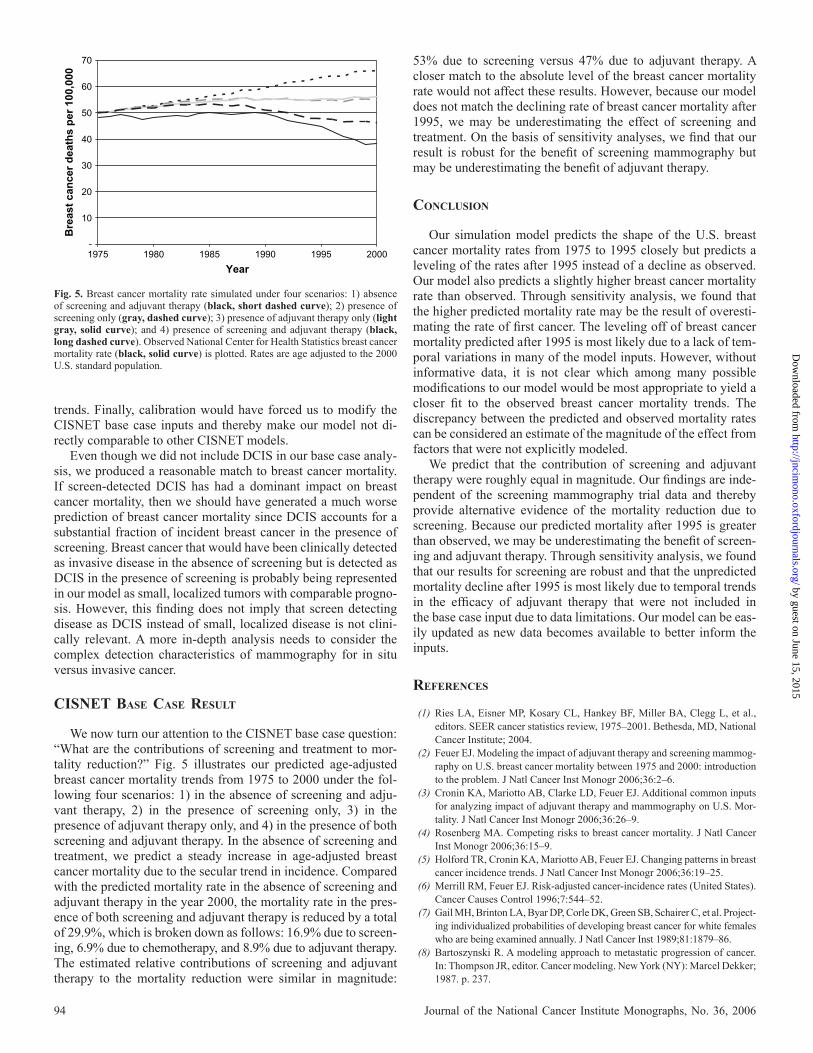
We now turn our attention to the CISNET base case question: “ What are the contributions of screening and treatment to mor-tality reduction? ” Fig. 5 illustrates our predicted age-adjusted breast cancer mortality trends from 1975 to 2000 under the fol-lowing four scenarios: 1) in the absence of screening and adju-vant therapy, 2) in the presence of screening only, 3) in the presence of adjuvant therapy only, and 4) in the presence of both screening and adjuvant therapy. In the absence of screening and treatment, we predict a steady increase in age-adjusted breast cancer mortality due to the secular trend in incidence. Compared with the predicted mortality rate in the absence of screening and adjuvant therapy in the year 2000, the mortality rate in the pres-ence of both screening and adjuvant therapy is reduced by a total of 29.9%, which is broken down as follows: 16.9% due to screen-ing, 6.9% due to chemotherapy, and 8.9% due to adjuvant therapy. The estimated relative contributions of screening and adjuvant therapy to the mortality reduction were similar in magnitude:
53% due to screening versus 47% due to adjuvant therapy. A closer match to the absolute level of the breast cancer mortality rate would not affect these results. However, because our model does not match the declining rate of breast cancer mortality after 1995, we may be underestimating the effect of screening and treatment. On the basis of sensitivity analyses, we fi nd that our result is robust for the benefi t of screening mammography but may be underestimating the benefi t of adjuvant therapy.
C ONCLUSION
Our simulation model predicts the shape of the U.S. breast cancer mortality rates from 1975 to 1995 closely but predicts a leveling of the rates after 1995 instead of a decline as observed. Our model also predicts a slightly higher breast cancer mortality rate than observed. Through sensitivity analysis, we found that the higher predicted mortality rate may be the result of overesti-mating the rate of fi rst cancer. The leveling off of breast cancer mortality predicted after 1995 is most likely due to a lack of tem-poral variations in many of the model inputs. However, without informative data, it is not clear which among many possible modifi cations to our model would be most appropriate to yield a closer fi t to the observed breast cancer mortality trends. The discrepancy between the predicted and observed mortality rates can be considered an estimate of the magnitude of the effect from factors that were not explicitly modeled.
We predict that the contribution of screening and adjuvant therapy were roughly equal in magnitude. Our fi ndings are inde-pendent of the screening mammography trial data and thereby provide alternative evidence of the mortality reduction due to screening. Because our predicted mortality after 1995 is greater than observed, we may be underestimating the benefi t of screen-ing and adjuvant therapy. Through sensitivity analysis, we found that our results for screening are robust and that the unpredicted mortality decline after 1995 is most likely due to temporal trends in the effi cacy of adjuvant therapy that were not included in the base case input due to data limitations. Our model can be eas-ily updated as new data becomes available to better inform the inputs.
REFERENCES
(1) Ries LA, Eisner MP, Kosary CL, Hankey BF, Miller BA, Clegg L, et al., editors. SEER cancer statistics review, 1975–2001. Bethesda, MD, National Cancer Institute; 2004 .
(2) Feuer EJ. Modeling the impact of adjuvant therapy and screening mammog-raphy on U.S. breast cancer mortality between 1975 and 2000: introduction to the problem. J Natl Cancer Inst Monogr 2006 ; 36 : 2 – 6.
(3) Cronin KA, Mariotto AB, Clarke LD, Feuer EJ. Additional common inputs for analyzing impact of adjuvant therapy and mammography on U.S. Mor-tality. J Natl Cancer Inst Monogr 2006 ; 36 : 26 – 9.
(4) Rosenberg MA. Competing risks to breast cancer mortality. J Natl Cancer Inst Monogr 2006 ; 36 : 15 – 9.
(5) Holford TR, Cronin KA, Mariotto AB, Feuer EJ. Changing patterns in breast cancer incidence trends. J Natl Cancer Inst Monogr 2006 ; 36 : 19 – 25.
(6) Merrill RM, Feuer EJ. Risk-adjusted cancer-incidence rates (United States). Cancer Causes Control 1996 ; 7 : 544 – 52.
(7) Gail MH, Brinton LA, Byar DP, Corle DK, Green SB, Schairer C, et al. Project-ing individualized probabilities of developing breast cancer for white females who are being examined annually. J Natl Cancer Inst 1989 ; 81 : 1879 – 86.
(8) Bartoszynski R. A modeling approach to metastatic progression of cancer. In: Thompson JR, editor. Cancer modeling. New York (NY): Marcel Dekker; 1987 . p. 237.
Fig. 5. Breast cancer mortality rate simulated under four scenarios: 1) absence of screening and adjuvant therapy ( black, short dashed curve ); 2) presence of screening only ( gray, dashed curve ); 3) presence of adjuvant therapy only ( light gray, solid curve ); and 4) presence of screening and adjuvant therapy ( black, long dashed curve ). Observed National Center for Health Statistics breast cancer mortality rate ( black, solid curve ) is plotted. Rates are age adjusted to the 2000 U.S. standard population.
-
10
20
30
40
50
60
70
1975 1980 1985 1990 1995 2000Year
Breast can
cer d
eath
s p
er 100,000
by guest on June 15, 2015http://jncim
ono.oxfordjournals.org/D
ownloaded from
Journal of the National Cancer Institute Monographs, No. 36, 2006 95
(9) Plevritis SK, Salzman P, Sigal BM, Glynn PW. A natural history model of stage progression applied to breast cancer. Stat Med 2006 ; [Epub ahead of print, PMID: 16598706].
(10) Feinstein AR, Sosin DM, Wells CK. The Will Rogers phenomenon. Stage migration and new diagnostic techniques as a source of misleading statistics for survival in cancer. N Engl J Med 1985 ; 312 : 1604 – 8.
(11) Kerlikowske K, Molinaro A, Cha I, Ljung BM, Ernster VL, Stewart K, et al. Characteristics associated with recurrence among women with ductal carcinoma in situ treated by lumpectomy. J Natl Cancer Inst 2003 ; 95 : 1692 – 702.
(12) Cronin KA, Yu B, Krapcho M, Miglioretti DL, Fay MP, Izmirlian G, et al. Modeling the dissemination of mammography in the United States. Cancer Causes Control 2005 ; 16 : 701 – 12.
(13) Mariotto A, Feuer EJ, Harlan LC, Wun LM, Johnson KA, Abrams J. Trends in use of adjuvant multi-agent chemotherapy and tamoxifen for breast can-cer in the United States: 1975–1999. J Natl Cancer Inst 2002 ; 94 : 1626 – 34.
(14) Early Breast Cancer Trialists’ Collaborative Group. Systemic treatment of early breast cancer by hormonal, cytotoxic, or immune therapy. 133 randomised trials involving 31,000 recurrences and 24,000 deaths among 75,000 women. Lancet 1992 ; 339 : 1 – 15.
(15) Early Breast Cancer Trialists’ Collaborative Group. Tamoxifen for early breast cancer: an overview of the randomised trials. Lancet 1998 ; 351 : 1451 – 67.
(16) Early Breast Cancer Trialists’ Collaborative Group. Polychemotherapy for early breast cancer: an overview of the randomised trials. Lancet 1998 ; 352 : 930 – 42.
NOTE
We gratefully acknowledge funding from the NCI (1 U01 CA116532), the CISNET Consortium for the base case inputs, and the Breast Cancer Surveillance Consortium for research data on screening mammography.
by guest on June 15, 2015http://jncim
ono.oxfordjournals.org/D
ownloaded from
Related Documents