O-360 J. Chem. Thermo&namics 1990, 22. 1-19 A statistical-thermodynamic view of cooperative structural changes in phospholipid bilayer membranes: their potential role in biological function RODNEY L. BILTONEN Departments of’ Biochemistry and Pharmacology, University of Virginia School of Medicine. Charlottesville, VA 22908, U.S.A. Being the 37tht HUFFMAN MEMORIAL AWARD LECTURE of the Calorimetry Conference delivered on 31 July 1989 at its 44th annual conference held at Oak Ridge. TN, U.S.A. 1. Introduction It is a great honor to receive the Huffman Memorial Award from the Calorimetry Conference. Such an honor was certainly not on my list of expectations when I first became interested in calorimetric experimentation over 20 years ago. I thank the conference for this honor and the many of you who have aided and encouraged the work which this award recognizes. In 1969, I had the opportunity to spend three months in the laboratories of the late Stig Sunner and Ingemar Wadsii at the University of Lund, Sweden. It was during that visit that I first became acquainted with state-of-the-art calorimetric equipment. That visit provided me the opportunity to explore from a practical perspective the many possibilities of applying calorimetric techniques to probe the thermodynamic details of questions of biological interest. My interest in, and motivation for, using calorimetric techniques has always been driven by specific thermodynamic questions related to biological systems. The original questions were related to understanding the thermodynamic mechanism of unfolding of globular proteins in aqueous solution. In the early sixties these thermally induced unfolding transitions were assessed by spectroscopic changes primarily and calculation of thermodynamic quantities associated with the process required that the two-state approximation (i.e. the protein existed in one of only two thermodynamic states) be valid, an assumption which had no previous means of being proven. Additionally, in 1964 Brandts(‘**) put forth a phenomenological t The 36th Huffman Lecture can be found in 1988, 20, 1361-1382. 0021-9614/90/010001 + 19 %02.00/O (Q 1990 Academic Press Limited

Welcome message from author
This document is posted to help you gain knowledge. Please leave a comment to let me know what you think about it! Share it to your friends and learn new things together.
Transcript
O-360
J. Chem. Thermo&namics 1990, 22. 1-19
A statistical-thermodynamic view of cooperative structural changes in phospholipid bilayer membranes: their potential role in biological function
RODNEY L. BILTONEN
Departments of’ Biochemistry and Pharmacology, University of Virginia School of Medicine. Charlottesville, VA 22908, U.S.A.
Being the 37tht
HUFFMAN MEMORIAL AWARD LECTURE
of the Calorimetry Conference delivered on 31 July 1989 at its 44th annual conference held at Oak Ridge. TN, U.S.A.
1. Introduction
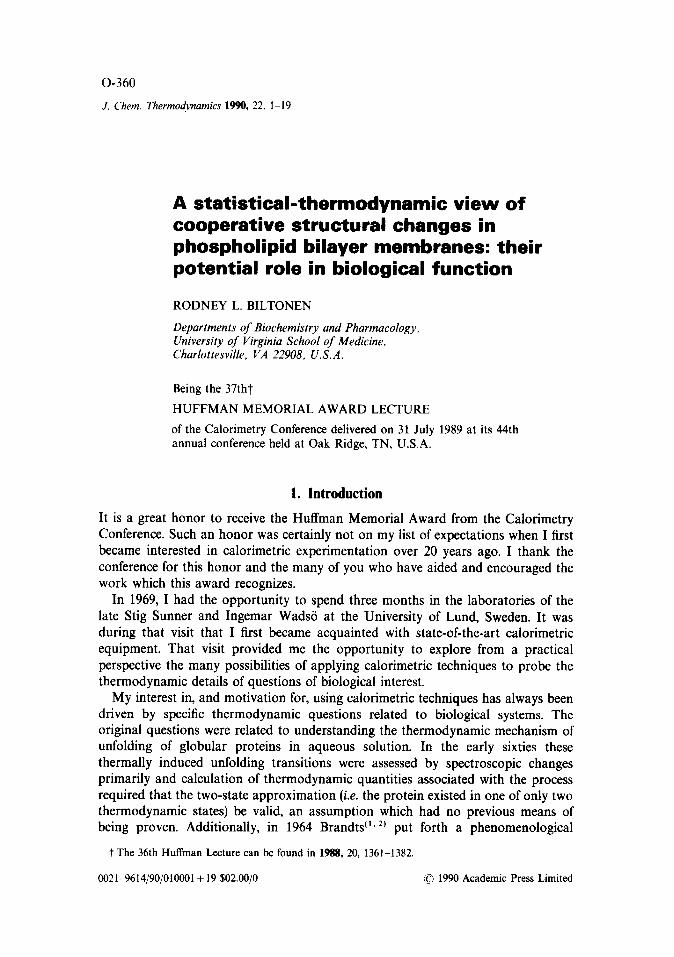
It is a great honor to receive the Huffman Memorial Award from the Calorimetry Conference. Such an honor was certainly not on my list of expectations when I first became interested in calorimetric experimentation over 20 years ago. I thank the conference for this honor and the many of you who have aided and encouraged the work which this award recognizes.
In 1969, I had the opportunity to spend three months in the laboratories of the late Stig Sunner and Ingemar Wadsii at the University of Lund, Sweden. It was during that visit that I first became acquainted with state-of-the-art calorimetric equipment. That visit provided me the opportunity to explore from a practical perspective the many possibilities of applying calorimetric techniques to probe the thermodynamic details of questions of biological interest.
My interest in, and motivation for, using calorimetric techniques has always been driven by specific thermodynamic questions related to biological systems. The original questions were related to understanding the thermodynamic mechanism of unfolding of globular proteins in aqueous solution. In the early sixties these thermally induced unfolding transitions were assessed by spectroscopic changes primarily and calculation of thermodynamic quantities associated with the process required that the two-state approximation (i.e. the protein existed in one of only two thermodynamic states) be valid, an assumption which had no previous means of being proven. Additionally, in 1964 Brandts(‘**) put forth a phenomenological
t The 36th Huffman Lecture can be found in 1988, 20, 1361-1382.
0021-9614/90/010001 + 19 %02.00/O (Q 1990 Academic Press Limited
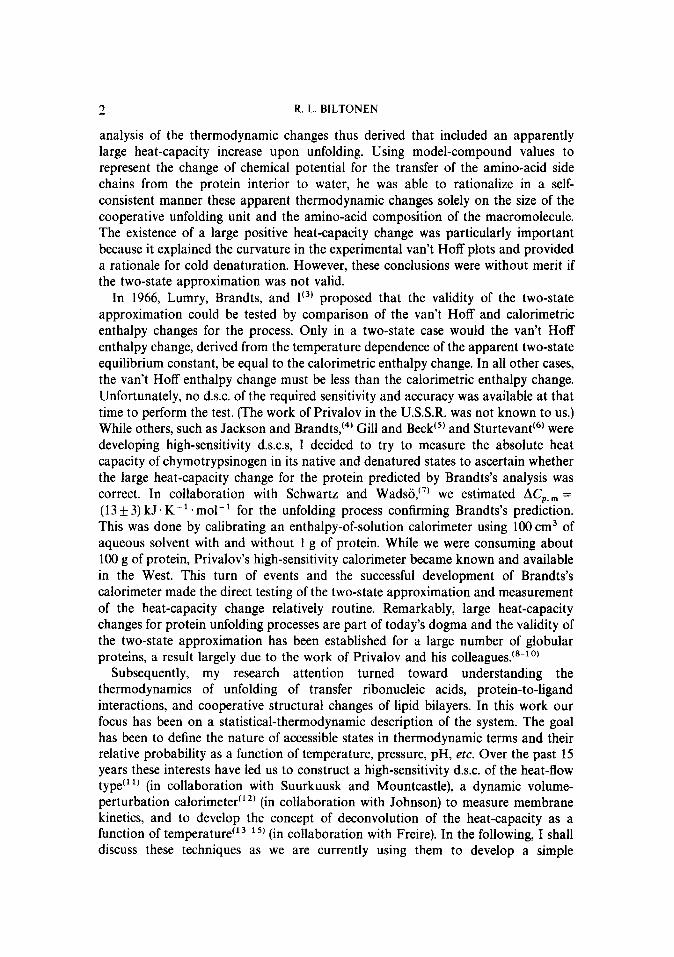
2 R. L. BILTONEN
analysis of the thermodynamic changes thus derived that included an apparently large heat-capacity increase upon unfolding. Using model-compound values to represent the change of chemical potential for the transfer of the amino-acid side chains from the protein interior to water, he was able to rationalize in a self- consistent manner these apparent thermodynamic changes solely on the size of the cooperative unfolding unit and the amino-acid composition of the macromolecule. The existence of a large positive heat-capacity change was particularly important because it explained the curvature in the experimental van? Hoff plots and provided a rationale for cold denaturation. However, these conclusions were without merit if the two-state approximation was not valid.
In 1966, Lumry, Brandts, and Ic3) proposed that the validity of the two-state approximation could be tested by comparison of the van? Hoff and calorimetric enthalpy changes for the process. Only in a two-state case would the van? Hoff enthalpy change, derived from the temperature dependence of the apparent two-state equilibrium constant, be equal to the calorimetric enthalpy change. In all other cases, the van’t Hoff enthalpy change must be less than the calorimetric enthalpy change. Unfortunately, no d.s.c. of the required sensitivity and accuracy was available at that time to perform the test. (The work of Privalov in the U.S.S.R. was not known to us.) While others, such as Jackson and Brandts, (4) Gill and Beck@) and Sturtevant’@ were developing high-sensitivity d.s.c.s, I decided to try to measure the absolute heat capacity of chymotrypsinogen in its native and denatured states to ascertain whether the large heat-capacity change for the protein predicted by Brandts’s analysis was correct. In collaboration with Schwartz and Wadsii,‘7) we estimated AC,,, = (13 k 3) kJ. K- ’ . mol- ’ for the unfolding process confirming Brandts’s prediction. This was done by calibrating an enthalpy-of-solution calorimeter using 100 cm3 of aqueous solvent with and without 1 g of protein. While we were consuming about 100 g of protein, Privalov’s high-sensitivity calorimeter became known and available in the West. This turn of events and the successful development of Brandts’s calorimeter made the direct testing of the two-state approximation and measurement of the heat-capacity change relatively routine. Remarkably, large heat-capacity changes for protein unfolding processes are part of today’s dogma and the validity of the two-state approximation has been established for a large number of globular proteins, a result largely due to the work of Privalov and his colleagues.(*~lO)
Subsequently, my research attention turned toward understanding the thermodynamics of unfolding of transfer ribonucleic acids, protein-to-ligand interactions, and cooperative structural changes of lipid bilayers. In this work our focus has been on a statistical-thermodynamic description of the system. The goal has been to define the nature of accessible states in thermodynamic terms and their relative probability as a function of temperature, pressure, pH, etc. Over the past 15 years these interests have led us to construct a high-sensitivity d.s.c. of the heat-flow type” ‘) (in collaboration with Suurkuusk and Mountcastle), a dynamic volume- perturbation calorimeter”” (in collaboration with Johnson) to measure membrane kinetics, and to develop the concept of deconvolution of the heat-capacity as a function of temperature’13-l 5, (in collaboration with Freire). In the following, I shall discuss these techniques as we are currently using them to develop a simple
STRUCTURAL CHANGES IN PHOSPHOLIPID BILAYER MEMBRANES 3
statistical-thermodynamic description of cooperative structure transitions in lipid bilayer systems and suggest how such processes could play an important role in biological function and regulation.
These introductory comments outline the use of calorimetric instrumentation in my laboratory over the past two decades. The types of questions we have posed are related to the nature of physicochemical processes of biological systems as they are reflected in thermodynamic functions by the connection of these quantities to the partition function of the system. Although highly precise determination of derived thermodynamic quantities is not always achieved, the design (and thus interpretation) of the experiments has always required a high degree of sensitivity and precision in the actual measurement and has pushed the instrumentation to its limits. The focus of the experiments are, for the most part, on a conceptual issue such as the validity of the two-state approximation for protein unfolding. This type of focus will be emphasized in the following discussion.
2. Description of the systems
Several different states of aggregation of lipids can be made depending upon the details of preparation. These include three types of bilayer systems. Multi-lamellar vesicles consist of several (5 or more) bilayer lamellae separated by an aqueous space of about 3 nm. The largest outside lamellar has a radius of 150 nm or more and contains lo5 to lo6 molecules. Small uni-lamellar vesicles, made by sonication of the multi-lamellar vesicles, have a diameter of 20 to 30 nm and contain about 4000 molecules in the outer monolayer. Large uni-lamellar vesicles are made by fusion of the small vesicles and have a diameter of about 100 nm and contain about lo5 molecules in the outer monolayer.
All three types of bilayer systems undergo several thermotropic transitions including a gel-to-“ripple” phase transition described in detail elsewhere”@ and, at slightly higher temperatures, a gel-to-(liquid crystalline) transition. It is this latter transition on which this paper will focus. This transition is characterized structurally by an increase in surface area of about 25 per cent and a shortening of the bilayer thickness by about 1 nm yielding a total increase in volume of 3 to 4 per cent. The transition is one in which the lipid fatty-acid side chains transform from one in which the majority of the carbon-carbon bonds are in the trans configuration to one in which they are mostly in the gauche configuration. This transition is one in which a great degree of rotational freedom about these bonds is acquired. It is this increase in the entropy associated with the freedom of rotation at the expense of van der Waals interactions and gauche bond formation that drives the transition. The overall thermodynamic quantities for the transitions of the systems are summarized in table 1.
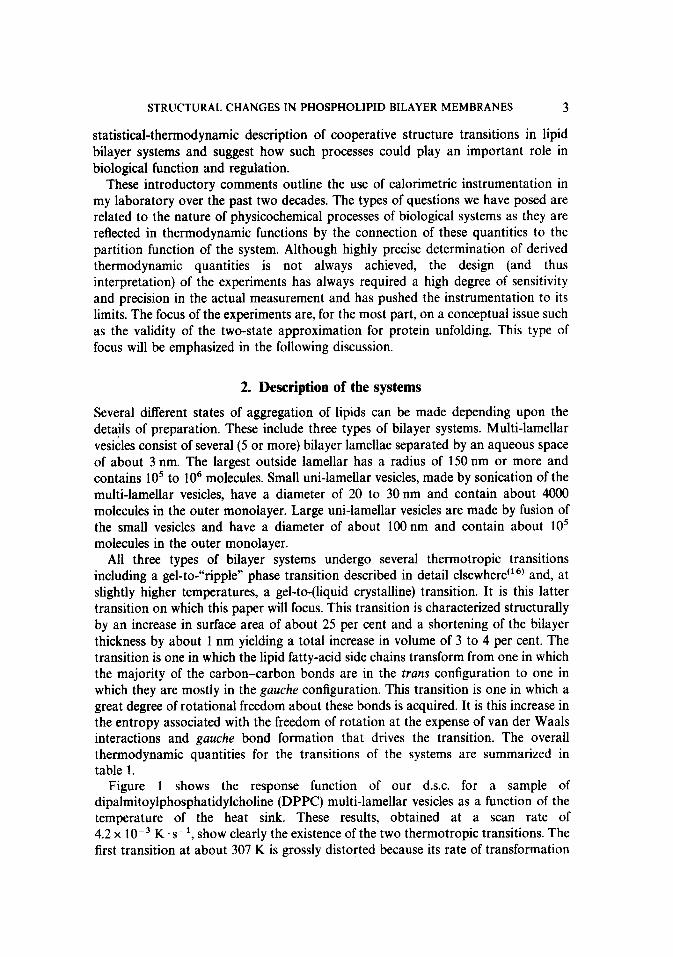
Figure 1 shows the response function of our d.s.c. for a sample of dipalmitoylphosphatidylcholine (DPPC) multi-lamellar vesicles as a function of the temperature of the heat sink. These results, obtained at a scan rate of 4.2 x 10m3 K-s-‘, show clearly the existence of the two thermotropic transitions. The first transition at about 307 K is grossly distorted because its rate of transformation
R. L. BILTONEN
I 500
30.5 310 31s 320 T/K
FIGURE 1. D.s.c. response function P of an aqueous dispersion of 15 mg of DPPC multi-lamellar vesicles. The scan rate was (4200+6) uK. ssi and the temperature reported is that of the heat sink. The results have not been corrected for the temperature difference between the sample cell and the heat sink or for the dynamic response of the calorimeter. A brief description of the calorimeter is given in reference 11.
is about lop3 s1 according to Lentz et al. (17) The second transition, at approximately 315 K, is much faster, but it is distorted because of the slow dynamic response of the calorimeter which has a characteristic time of about 70 s. Furthermore, the recorded temperature is that of the heat sink which is about 1 K higher than that of the sample at this scan rate. In order to obtain the true C,,,(T) associated with the transition it is necessary to correct the results for the dynamic response of the calorimeter, to scan at a slower rate, or both. A simple dynamic correction for the calorimeter response will not suffice for the slow lower- temperature transition and is not particularly accurate for the very sharp higher- temperature transition at this scan rate. The maximum dynamic correction for the second transition is larger than the maximum signal.
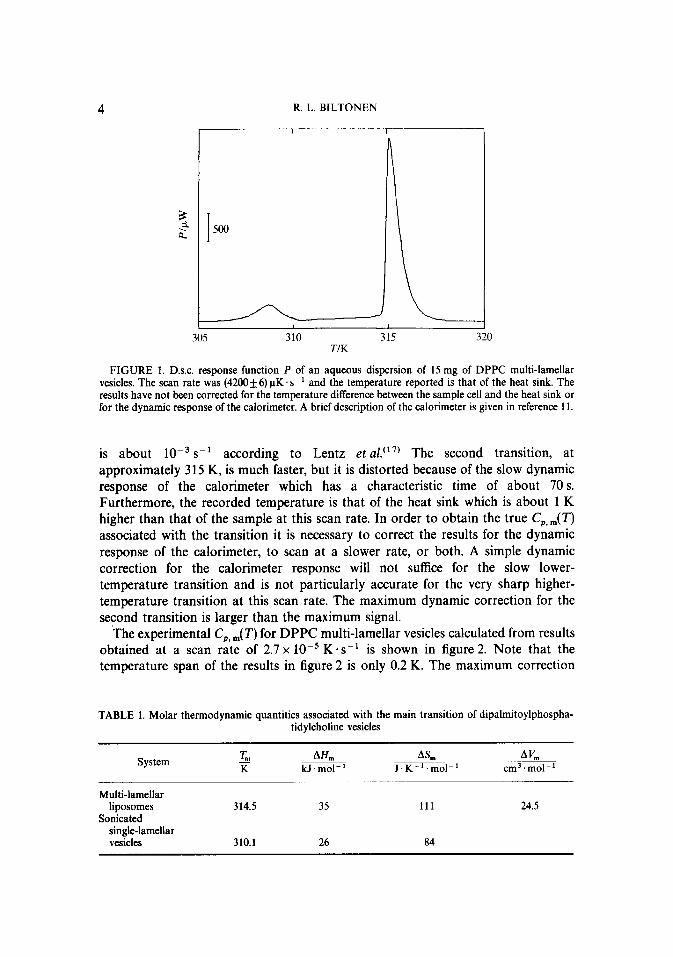
The experimental C,, ,(T) for DPPC multi-lamellar vesicles calculated from results obtained at a scan rate of 2.7 x 10e5 K. s-l is shown in figure 2. Note that the temperature span of the results in figure 2 is only 0.2 K. The maximum correction
TABLE 1. Molar thermodynamic quantities associated with the main transition of dipalmitoylphospha- tidylcholine vesicles
A&n kJ.mol-’
System
Multi-lamellar liposomes
Sonicated single-lamellar vesicles
314.5 35 111 24.5
310.1 26 84
STRUCTURAL CHANGES IN PHOSPHOLIPID BILAYER MEMBRANES 5
01 J 314.45 314.50 314.55 314.60 314.65
TIK
FIGURE 2. The excess heat-capacity of a dispersion of DPPC multi-lamellar vesicles calculated from results similar to those shown in figure 1 except that the scan rate was 27 kK.s-‘.
required for the experimental values was about two per cent of the maximum signal. The molar heat capacities recorded are those of the lipid, a molecule of molar mass approximately 700 g. mol- ‘. The magnitude of the maximum excess molar heat capacity and the narrow width of the transition (0.076 K) suggest strongly that the transition is virtually first-order. However, CP, ,( T) exhibits no discontinuity and the asymmetric shape is consistent with large thermodynamic fluctuations existing both above and below the melting temperature. These results are quantitatively consistent with those of Albon and Sturtevant (l*) who suggested that the transition was truly first-order, and that the finite breadth of the transition was simply the result of minor contamination of the sample.
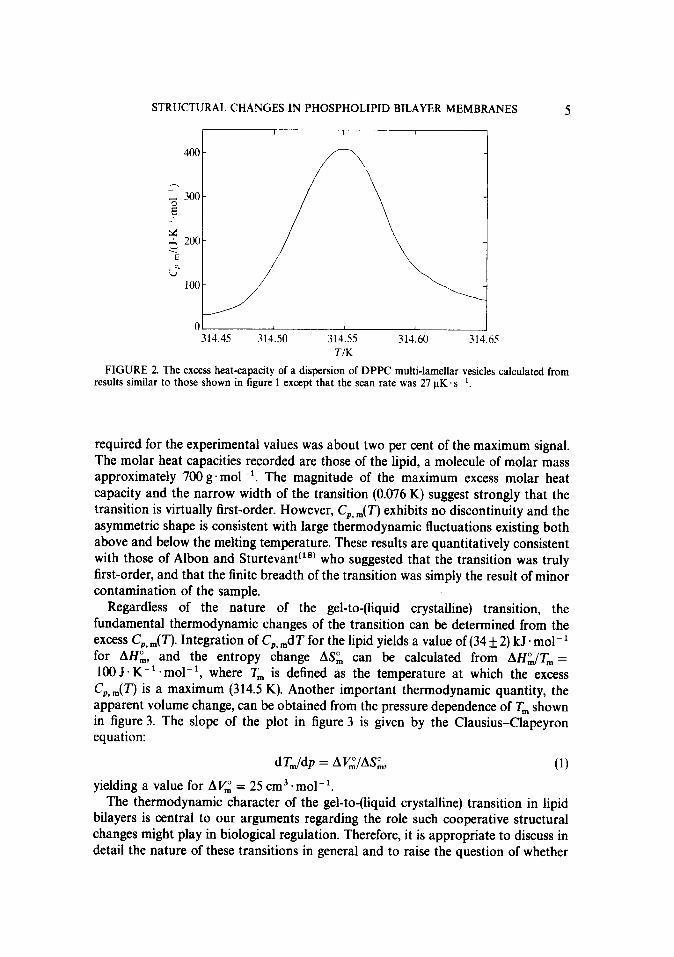
Regardless of the nature of the gel-to-(liquid crystalline) transition, the fundamental thermodynamic changes of the transition can be determined from the excess C,,,(T). Integration of C,, ,dT for the lipid yields a value of (34 + 2) kJ . mol- ’ for AHm, and the entropy change ASm can be calculated from AHYT, = 100 J. K- ’ * mall ‘, where T, is defined as the temperature at which the excess C,,,(T) is a maximum (314.5 K). Another important thermodynamic quantity, the apparent volume change, can be obtained from the pressure dependence of T, shown in figure 3. The slope of the plot in figure 3 is given by the Clausius-Clapeyron equation:
dTddp = AV,“/AS;,
yielding a value for AV,O = 25 cm3.mol-‘.
(1)
The thermodynamic character of the gel-to-(liquid crystalline) transition in lipid bilayers is central to our arguments regarding the role such cooperative structural changes might play in biological regulation. Therefore, it is appropriate to discuss in detail the nature of these transitions in general and to raise the question of whether
R. L. BILTONEN
315.1511 100 1100 2100 3100 4100 5100
plkPa
FIGURE 3. The apparent melting temperature of a DPPC multi-lamellar vesicle dispersion obtained using a calorimeter cell pressurized with argon. The scan rate was 4200 PK .s-l.
or not such transitions are truly first-order. It is clear that, for multi-lamellar systems of the phosphatidylcholines of the highest purity obtainable, the excess C,,,(T) is extremely sharp but of finite width. Assuming that the transition is truly first-order, then it is necessary to rationalize the finite width of the transition. There are several possibilities. First, the curve of C,,, against T is artificially broad in all calorimetric studies because of a finite response time for all calorimeters. This does not appear to be the case since at a very slow scan rate the half-width of C,, ,,,(!I’) becomes independent of the scan rate. Albon and Sturtevantt”) measured a half-width of 0.067 K at a scan rate of 330 pK * s-l. Our laboratory has measured a half width 0.076 K, which is independent of scan rate from 14 to 560 pK * s-l. Thus, the finite breadth of the transition is not an instrumental artifact. This leaves us with the following possibilities: the intrinsic rate of the transition is slow which would produce broadening and hysteresis; all samples are contaminated, with the contaminant solubility in the two phases being different; or we have a distribution of vesicles of differing T,, but all undergoing the equivalent of a first-order transition. Each of these possibilities will be discussed in the following sections.
3. Dynamics of the gel-to-(liquid crystalline) transition
If the structural transformation under consideration is slow compared with the scan rate, then the shape of C, ,,,(T) will be distorted, and, in the case of first-order transitions, this function iill exhibit finite width. Furthermore, if the apparent C,,,(T) is measured in both a heating and cooling mode, hysteresis will be apparent. Previous studies with DPPC liposomes using fluorescence changes of a lipid probe indicated that no hysteresis was apparent. (I’) These experiments suffered from the facts that the error in the estimation of T, was at least 0.1 K and that the inclusion of
STRUCTURAL CHANGES IN PHOSPHOLIPID BILAYER MEMBRANES 7
1’ I 313.65 314.15 314.65 315.15
T’IK
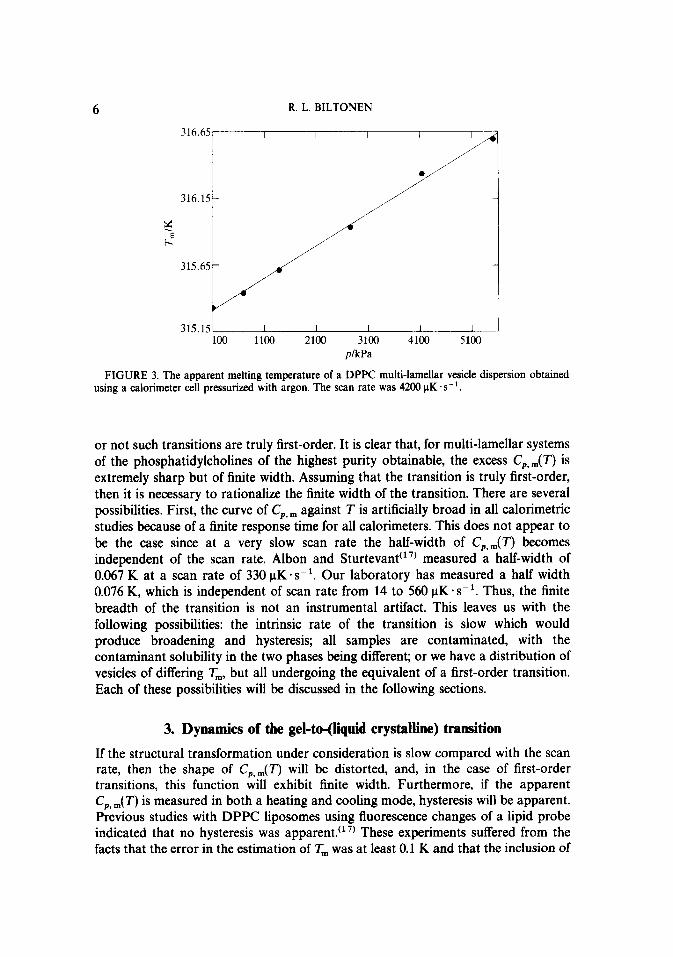
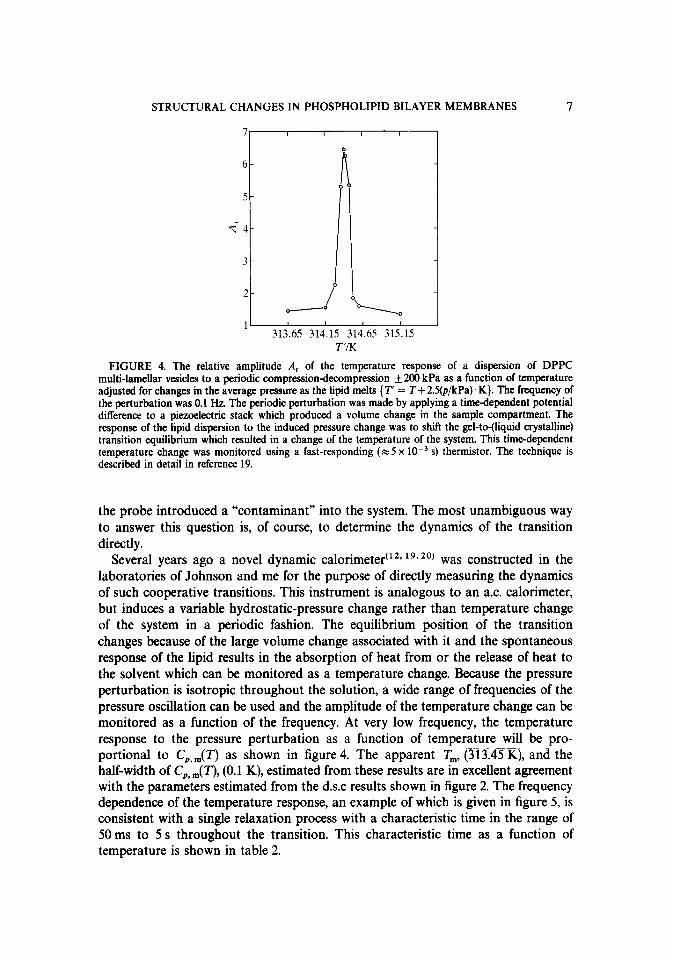
FIGURE 4. The relative amplitude A, of the temperature response of a dispersion of DPPC multi-lamellar vesicles to a periodic compression-decompression +200 kPa as a function of temperature adjusted for changes in the average pressure as the lipid melts { T’ = T + 2S(p/kPa). K}. The frequency of the perturbation was 0.1 Hz. The periodic perturbation was made by applying a timedependent potential difference to a piaoelectric stack which produced a volume change in the sample compartment. The response of the lipid dispersion to the induced pressure change was to shift the gel-to-(liquid crystalline) transition equilibrium which resulted in a change of the temperature of the system. This time-dependent temperature change was monitored using a fast-responding (x 5 x 10m3 s) thermistor. The technique is described in detail in reference 19.
the probe introduced a “contaminant” into the system. The most unambiguous way to answer this question is, of course, to determine the dynamics of the transition directly.
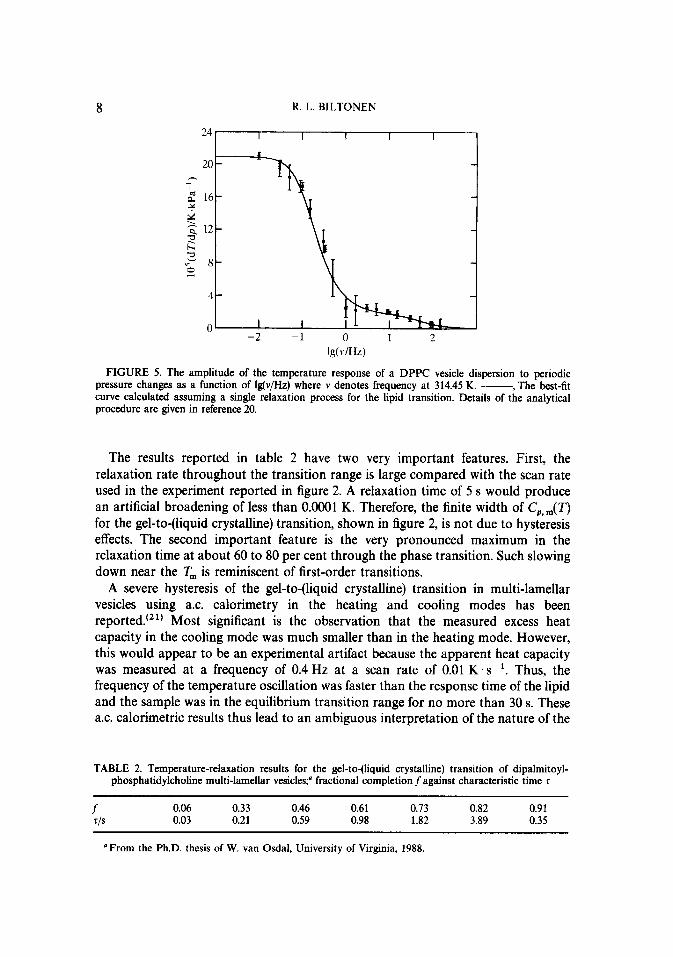
Several years ago a novel dynamic calorimetert’2~ lg. 20) was constructed in the laboratories of Johnson and me for the purpose of directly measuring the dynamics of such cooperative transitions. This instrument is analogous to an a.c. calorimeter, but induces a variable hydrostatic-pressure change rather than temperature change of the system in a periodic fashion. The equilibrium position of the transition changes because of the large volume change associated with it and the spontaneous response of the lipid results in the absorption of heat from or the release of heat to the solvent which can be monitored as a temperature change. Because the pressure perturbation is isotropic throughout the solution, a wide range of frequencies of the pressure oscillation can be used and the amplitude of the temperature change can be monitored as a function of the frequency. At very low frequency, the temperature response to the pressure perturbation as a function of temperature will be pro- portional to C,,,(T) as shown in figure 4. The apparent T,, (313.45 K), and the half-width of CP, ,,,( T), (0.1 K), estimated from these results are in excellent agreement with the parameters estimated from the d.s.c results shown in figure 2. The frequency dependence of the temperature response, an example of which is given in figure 5, is consistent with a single relaxation process with a characteristic time in the range of 50 ms to 5 s throughout the transition. This characteristic time as a function of temperature is shown in table 2.
R. L. BILTONEN
-7 2 16-
z 2 12- 4 h
rz 8-
4-
0 I
-2 -1 0 1 2
Ig( v/Hz)
FIGURE 5. The amplitude of the temperature response of a DPPC vesicle dispersion to periodic pressure changes as a function of lg(v/Hz) where v denotes frequency at 314.45 K. -, The Best-fit curve calculated assuming a single relaxation process for the lipid transition. Details of the analytical procedure are given in reference 20.
The results reported in table 2 have two very important features. First, the relaxation rate throughout the transition range is large compared with the scan rate used in the experiment reported in figure 2. A relaxation time of 5 s would produce an artificial broadening of less than 0.0001 K. Therefore, the finite width of C,,,(T) for the gel-to-(liquid crystalline) transition, shown in figure 2, is not due to hysteresis effects. The second important feature is the very pronounced maximum in the relaxation time at about 60 to 80 per cent through the phase transition. Such slowing down near the T, is reminiscent of first-order transitions.
A severe hysteresis of the gel-to-(liquid crystalline) transition in multi-lamellar vesicles using a.c. calorimetry in the heating and cooling modes has been reported. (“) Most significant is the observation that the measured excess heat capacity in the cooling mode was much smaller than in the heating mode. However, this would appear to be an experimental artifact because the apparent heat capacity was measured at a frequency of 0.4 Hz at a scan rate of 0.01 K. s-‘. Thus, the frequency of the temperature oscillation was faster than the response time of the lipid and the sample was in the equilibrium transition range for no more than 30 s. These a.c. calorimetric results thus lead to an ambiguous interpretation of the nature of the
TABLE 2. Temperature-relaxation results for the gel-to-(liquid crystalline) transition of dipalmitoyl- phosphatidylcholine multi-lamellar vesicles;” fractional completion f against characteristic time r
I 0.06 0.33 0.46 0.61 0.73 0.82 0.91 4s 0.03 0.21 0.59 0.98 1.82 3.89 0.35
‘From the Ph.D. thesis of W. van Osdal, University of Virginia, 1988.
STRUCTURAL CHANGES IN PHOSPHOLIPID BILAYER MEMBRANES 9
transition. It appears quite clear that the gel-to-(liquid crystalline) transition of dipalmitoylphosphatidylchohne multi-lamellar vesicles is quite rapid and the finite width of C,,,(T) for its transition is not the result of any time dependence of the transition, per se.
4. Thermodynamic characterization of uni-lamellar vesicles
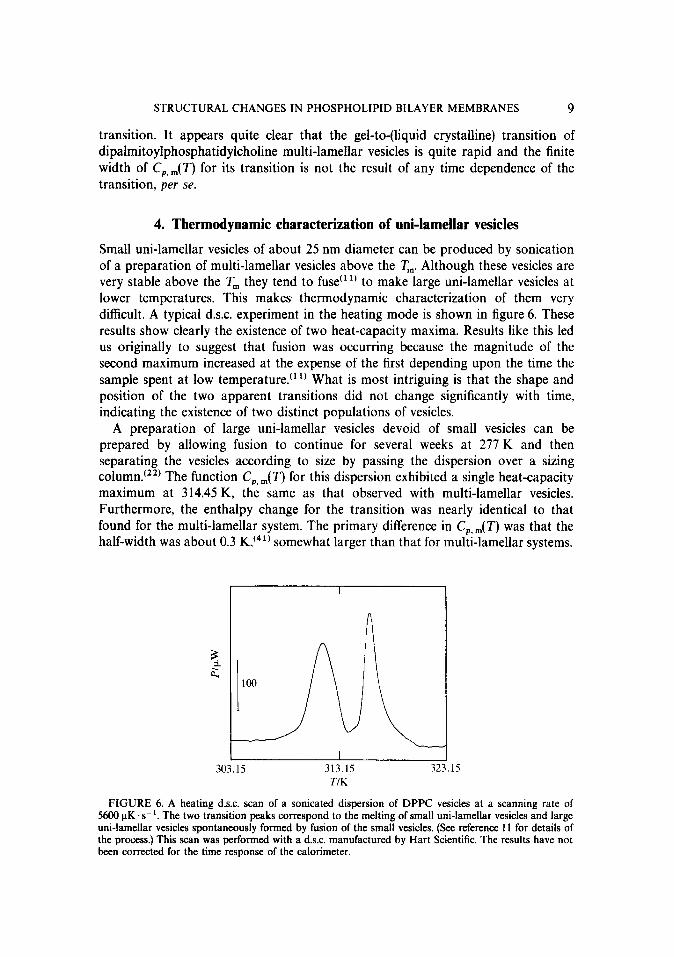
Small uni-lamellar vesicles of about 25 nm diameter can be produced by sonication of a preparation of multi-lamellar vesicles above the Tm Although these vesicles are very stable above the T, they tend to fuse (rl’ to make large uni-lamellar vesicles at lower temperatures. This makes thermodynamic characterization of them very difficult. A typical d.s.c. experiment in the heating mode is shown in figure 6. These results show clearly the existence of two heat-capacity maxima. Results like this led us originally to suggest that fusion was occurring because the magnitude of the second maximum increased at the expense of the first depending upon the time the sample spent at low temperature. (11) What is most intriguing is that the shape and position of the two apparent transitions did not change significantly with time, indicating the existence of two distinct populations of vesicles.
A preparation of large uni-lamellar vesicles devoid of small vesicles can be prepared by allowing fusion to continue for several weeks at 277 K and then separating the vesicles according to size by passing the dispersion over a sizing column.(22) The function C,, ,(T) for this dispersion exhibited a single heat-capacity maximum at 314.45 K, the same as that observed with multi-lamellar vesicles. Furthermore, the enthalpy change for the transition was nearly identical to that found for the multi-lamellar system. The primary difference in C,,,(T) was that the half-width was about 0.3 K,(41) somewhat larger than that for multi-lamellar systems.
I
T/K
FIGURE 6. A heating d.s.c. scan of a sonicated dispersion of DPPC vesicles at a scanning rate of 5600 uK.s-i. The two transition peaks correspond to the melting of small uni-lamellar vesicles and large uni-lamellar vesicles spontaneously formed by fusion of the small vesicles. (See reference 11 for details of the process.) This scan was performed with a d.s.c. manufactured by Hart Scientific. The results have not been corrected for the time response of the calorimeter.
10 R. L. BILTONEN
I
298.15 306.15 31‘ T/K
.15
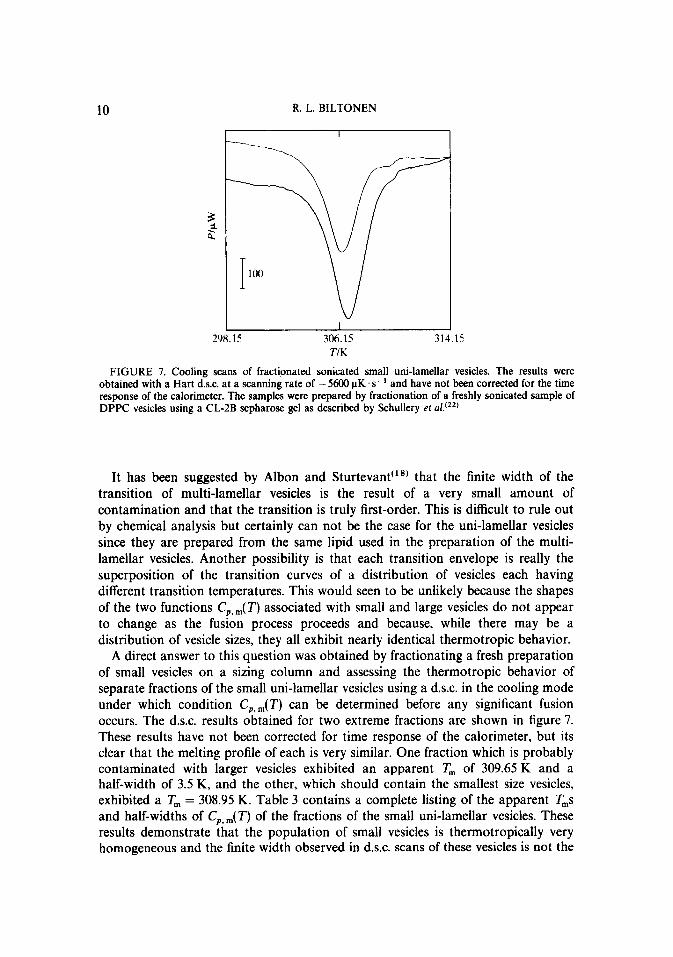
FIGURE 7. Cooling scans of fractionated sonicated small uni-lamellar vesicles. The results were obtained with a Hart d.s.c. at a scanning rate of - 5600 PK. s-’ and have not been corrected for the time response of the calorimeter. The samples were prepared by fractionation of a freshly sonicated sample of DPPC vesicles using a CL-2B sepharose gel as described by Schullery et c1.‘22’
It has been suggested by Albon and Sturtevant”” that the finite width of the transition of multi-lamellar vesicles is the result of a very small amount of contamination and that the transition is truly first-order. This is difficult to rule out by chemical analysis but certainly can not be the case for the uni-lamellar vesicles since they are prepared from the same lipid used in the preparation of the multi- lamellar vesicles. Another possibility is that each transition envelope is really the superposition of the transition curves of a distribution of vesicles each having different transition temperatures. This would seen to be unlikely because the shapes of the two functions C,,,(T) associated with small and large vesicles do not appear to change as the fusion process proceeds and because, while there may be a distribution of vesicle sizes, they all exhibit nearly identical thermotropic behavior.
A direct answer to this question was obtained by fractionating a fresh preparation of small vesicles on a sizing column and assessing the thermotropic behavior of separate fractions of the small uni-lamellar vesicles using a d.s.c. in the cooling mode under which condition C,,,(T) can be determined before any significant fusion occurs. The d.s.c. results obtained for two extreme fractions are shown in figure 7. These results have not been corrected for time response of the calorimeter, but its clear that the melting profile of each is very similar. One fraction which is probably contaminated with larger vesicles exhibited an apparent T, of 309.65 K and a half-width of 3.5 K, and the other, which should contain the smallest size vesicles, exhibited a T, = 308.95 K. Table 3 contains a complete listing of the apparent T,s and half-widths of C,,,(T) of the fractions of the small uni-lamellar vesicles. These results demonstrate that the population of small vesicles is thermotropically very homogeneous and the finite width observed in d.s.c. scans of these vesicles is not the
STRUCTURAL CHANGES IN PHOSPHOLIPID BILAYER MEMBRANES 11
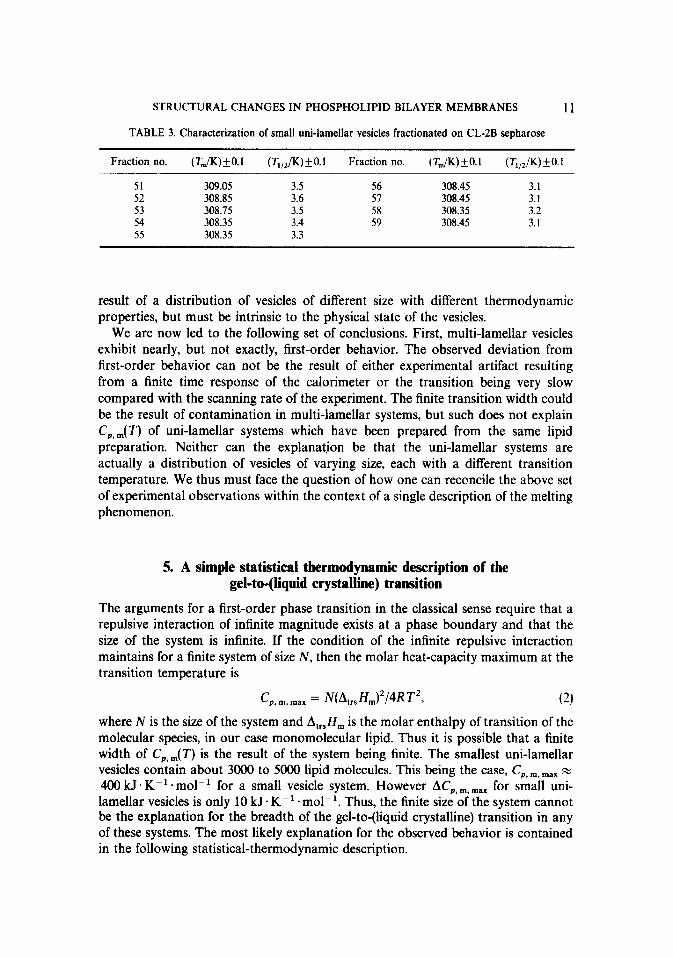
TABLE 3. Characterization of small uni-lamellar vesicles fractionated on CL-2B sepharose
Fraction no. (‘&,/K)kO.l (TL,~/K)~O.l Fraction no. (T,K)ItO.l (T,,,P);trO.l
51 309.05 3.5 56 308.45 3.1 52 308.85 3.6 57 308.45 3.1 53 308.75 3.5 58 308.35 3.2 54 308.35 3.4 59 308.45 3.1 55 308.35 3.3
result of a distribution of vesicles of different size with different thermodynamic properties, but must be intrinsic to the physical state of the vesicles.
We are now led to the following set of conclusions. First, multi-lamellar vesicles exhibit nearly, but not exactly, first-order behavior. The observed deviation from first-order behavior can not be the result of either experimental artifact resulting from a finite time response of the calorimeter or the transition being very slow compared with the scanning rate of the experiment. The finite transition width could be the result of contamination in multi-lamellar systems, but such does not explain C,,,(T) of uni-lamellar systems which have been prepared from the same lipid preparation. Neither can the explanation be that the uni-lamellar systems are actually a distribution of vesicles of varying size, each with a different transition temperature. We thus must face the question of how one can reconcile the above set of experimental observations within the context of a single description of the melting phenomenon.
5. A simple statistical thermodynamic description of the gel-to-(liquid crystalline) transition
The arguments for a first-order phase transition in the classical sense require that a repulsive interaction of infinite magnitude exists at a phase boundary and that the size of the system is infinite. If the condition of the infinite repulsive interaction maintains for a finite system of size N, then the molar heat-capacity maximum at the transition temperature is
C p. m, mm = WWM2/4R T2,
where N is the size of the system and A,,,H, is the molar enthalpy of transition of the molecular species, in our case monomolecular lipid. Thus it is possible that a finite width of C,,,(T) is the result of the system being finite. The smallest uni-lamellar vesicles contain about 3000 to 5000 lipid molecules. This being the case, C,,,,,, z 400 kJ. K ml . mol-’ for a small vesicle system. However AC,,,,,,, for small uni- lamellar vesicles is only 10 kJ * K-r .mol-‘. Thus, the finite size of the system cannot be the explanation for the breadth of the gel-to-(liquid crystalline) transition in any of these systems. The most likely explanation for the observed behavior is contained in the following statistical-thermodynamic description.

12 R. L. BILTONEN
The statistical-thermodynamic model which I shall present so as to discuss in molecular terms the nature of the interactions controlling the transition in phospholipid bilayers is very similar to that used previously to describe the mathematically one-dimensional polypeptide helix-coil transitions.(23) Unfortunately, unlike the one-dimensional case, the two-dimensional situation does not lead to an analytical solution. The description assumes that each lipid in the two- dimensional lattice exists in one of two states, a gel state in which rotation about the carbon bonds is severely restricted and the van der Waals interaction between neighboring chains is maximized, and the liquid-crystalline state in which the lipid molecule has achieved a high degree of rotational freedom at the expense of reduced nearest-neighbor interactions. As well, interactions between the polar head groups change and the energy of the system is increased in the liquid state because of gauche bond formation. The standard molar Gibbs energy change of lipid for the transition from complete gel to complete liquid-crystalline form is
AG; = AH;- TAS;, (3)
where the molar enthalpy and molar entropy change of lipid are determined from calorimetric results as previously described. In a situation where a lipid vesicle exists as a mixture of gel and liquid-crystalline forms of individual lipids, an additional interaction term must be included. The molar Gibbs energy of vesicles in such a mixed state, relative to the pure gel state, is given by
AGi, j = iAGk + js + R T. In ai* j, (4)
where i is the number of liquid crystalline lipids, j the number of unlike nearest neighbors, Ri,j the degeneracy of such a vesicle state, and E, the molar nearest- neighbor interaction term, is defined’24) by
E = 2E12-El,-E22, (5)
where Ebb, .sll, and ~~~ are the interaction molar energies between unlike nearest neighbors, between gel nearest neighbors, and between liquid-crystalline nearest neighbors, respectively. In this representation AG: contains the entropy term derived from the increased number of configurations allowed a single lipid molecule in the liquid-crystalline state, and Ri, j is the number of ways of distributing the i liquid- crystalline lipids of the two-dimensional membrane matrix having exactly j unlike nearest neighbors. The partition function for a vesicle of size N is thus given by
Q = ZC~=oni.XN).exp(-jE/RT).exp(-iAG~RT). (6)
In this partition function the relative weight of each vesicle is relative to a statistical weight of 1 being assigned to the pure gel vesicle and the first sum is taken over all allowable i for a given j. This form of the partition function is similar to that used by Caille et a1.(25’ and Mouritson and his co-workers(26927) in their Monte-Carlo simulations of lipid bilayer structures during the gel-to-(liquid crystalline) transition. The major difference is that Caille et al. and Mouritson and his co-workers assume 10 energy states for each lipid to define the various interactions in explicit structural terms.
STRUCTURAL CHANGES IN PHOSPHOLIPID BILAYER MEMBRANES 13
The above model for the gel-to-(liquid crystalline) transition will lead to a truly first-order transition if and only if both E and N are infinite. If E is infinite, but N is finite a smooth transition will be observed (i.e. no true discontinuity in the thermodynamic functions will exist) and the transition will be, from the perspective of the vesicle, a two-state transition with a heat-capacity maximum given by equation (2) where N is the size of the vesicle. In such a case, each vesicle will always exist in either a totally gel state or a totally liquid-crystalline state. Under no circumstances will clusters of gel and liquid-crystalline lipid coexist within the same vesicle; at the transition temperature half of the vesicles will be gel and half will be liquid crystalline. In cases where E is finite and N infinite, a smooth transition will again be observed, but the shape of C,,,(T) which is a function of E cannot be expressed in analytical form. If N is also finite, C,,,(T) is also dependent on N. However, in all cases, both gel and liquid-crystalline lipid can coexist in a single vesicle and the distribution of the clusters of a particular type of lipid will depend upon both E and N.
Friere and Biltonen(28*29’ have shown that such a representation can be used to calculate the approximate distribution of cluster sizes as a function of the degree of melting from the experimental C,,,(T). This analysis follows from the fact that a “single-particle” partition function 4 can be written as
q(N) = exp
where To is a temperature where the lipid system exists essentially completely in the gel state. Assuming that each lipid exists in one of two states, it was shown’28’ that the average gel-cluster size (I) is given by
(0 = 4/k! - 4. (8)
Furthermore, the complete cluster-distribution function can be calculated using appropriate generating functions. Similar functions describing the liquid-crystalline cluster distribution can be calculated using the pure liquid-crystalline state as a reference state and integrating C,,,(T) from high to low temperature.
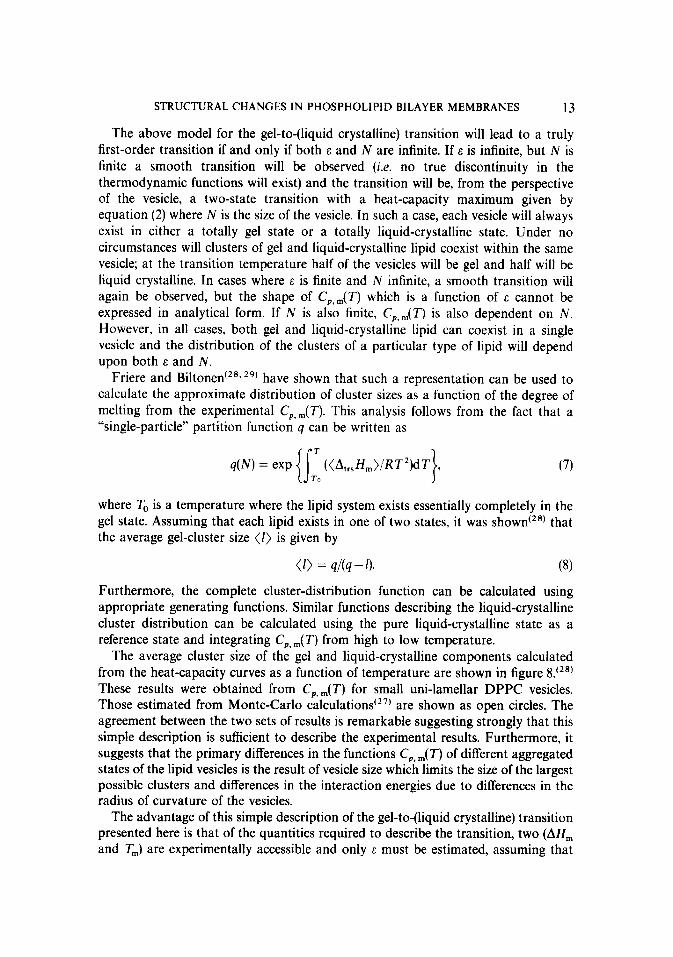
The average cluster size of the gel and liquid-crystalline components calculated from the heat-capacity curves as a function of temperature are shown in figure 8.‘28’ These results were obtained from C,,,(T) for small uni-lamellar DPPC vesicles. Those estimated from Monte-Carlo calculations’27’ are shown as open circles. The agreement between the two sets of results is remarkable suggesting strongly that this simple description is sufficient to describe the experimental results. Furthermore, it suggests that the primary differences in the functions C,,,(T) of different aggregated states of the lipid vesicles is the result of vesicle size which limits the size of the largest possible clusters and differences in the interaction energies due to differences in the radius of curvature of the vesicles.
The advantage of this simple description of the gel-to-(liquid crystalline) transition presented here is that of the quantities required to describe the transition, two (AH, and T,) are experimentally accessible and only E must be estimated, assuming that
R. L. BILTONEN
1200- : _ I
I _ I \ _ 1 \
800- : \
3 - \ \ - \ \
”
309.15 310.15 311.15 T/K
FIGURE 8. The average lipid cluster size (1) of a dispersion of DPPC small uni-lamellar vesicles as a function of temperature. -, Gel clusters; - - -, liquid-crystalline clusters, both calculated from heat capacities;t2*’ 0, Monte-Carlo calculations. The values have been interpolated from results given in reference 26.
the actual sizes of the vesicles are sufficiently large to assume that N equals infinity. This latter assumption and the best estimates of E can be evaluated by comparing the results of Monte-Carlo calculations with experimental heat-capacity curves. Another advantage of this simple representation is that the effects of a second non-lipid component (e.g. an anaesthetic), can be interpreted in terms of its effect on AC& which can be estimated from the shift in the T,, and on E. For example, volatile anaesthetics whose partial pressure is maintained constant decrease the T, and produce a broadening of the heat-capacity function.‘30’ The alteration in T, can be interpreted in terms of the differential solubility of the anaesthetic in the two lipid phases, and the breadth of the transition reflects the anaesthetic’s ability to stabilize interfacial regions between gel and liquid-crystalline clusters (i.e. reduce the absolute magnitude of E).
6. Activation of phospholipase A, by pbospbolipid bilayers
It is interesting to consider whether cooperative structural changes of the type I have just described are of any physiological significance in the real biological membrane. There is some circumstantial evidence which supports this possibility. The first is that the lipids of microorganisms undergo a gel-to-(liquid crystalline) phase transition near their growth temperature and pressure.(3’*32) Alteration of the growth temperature and pressure conditions results in a change in the lipid composition so that the gel-to-(liquid crystalline) transition now occurs near the new growth temperature and pressure. The second, is that the functional behavior of certain biological macromolecules, such as phospholipase A,, is intimately related to the lipid substrate being in the gel-to-liquid transition region.‘33’
STRUCTURAL CHANGES IN PHOSPHOLIPID BILAYER MEMBRANES 15
0 10 20 30 -IO 50 60 Ilmin
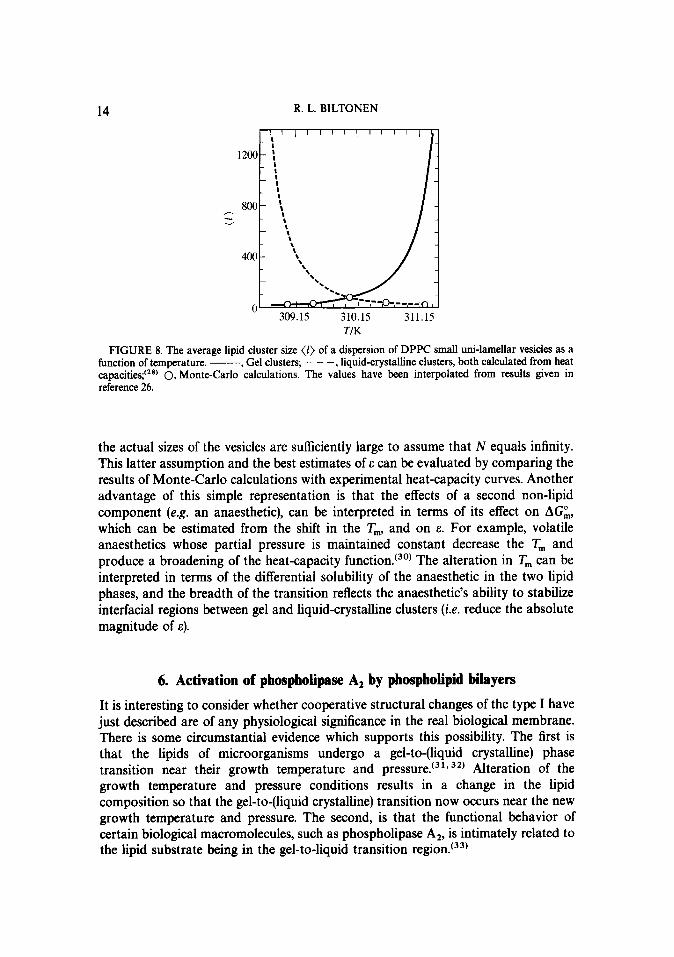
FIGURE 9. The time t course of the product concentration c following hydrolysis of DPPC large uni- lamellar vesicles by porcine pancreatic phospholipase A, at 311.15 K. The experiments were carried out at pH = 8.0 in the presence of 10mmol.dm-3 CaCI,. The initial substrate concentration was 0.39 mmol . dmW3. The total phospholipase A, concentrations used in these experiments were 2.7 x 10e6 mol.dm-3 (curve a), 1.4 x 10e6 mol.dm-3 (curve b), and 0.7 x 10e6 mol.dmm3 (curve c). The curves shown represent drawings of typical recorder traces obtained under the experimental conditions described. (Reproduced from reference 34 with permission.)
Phospholipase A, is a small enzyme (molar mass approximately 14000 g+ mall’) which catalyzes the hydrolysis of the ester linkage between the glycerol backbone and the fatty-acid side chain in the sn-2 position of phospholipids. The extent of hydrolysis can be easily monitored at neutral pH by titrating with base the protons liberated using a pH-stat. Three representative time courses of the hydrolysis of DPPC large uni-lamellar vesicles by porcine phospholipase A, are shown in figure 9. The exact details of such time courses are very dependent upon temperature and the enzyme and substrate concentrations. Analysis of such results obtained at 3 12 K as a function of enzyme and substrate concentrations led to a proposal that enzyme activation occurred on the surface of the lipid vesicle and that the activation process involved enzyme dimerization.‘34’ Subsequently, Cho et ~1.‘~~’ demonstrated that the enzyme isolated following hydrolysis had been acylated at a specific amino-acid residue and no longer required activation for hydrolysis of monomeric substrate and existed in solution as a dimer.
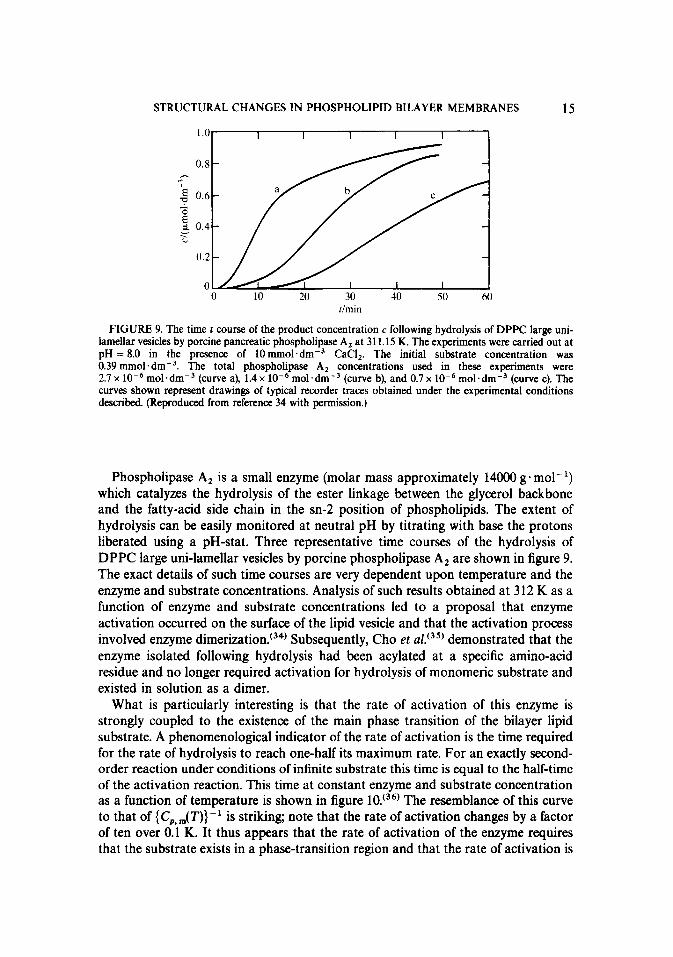
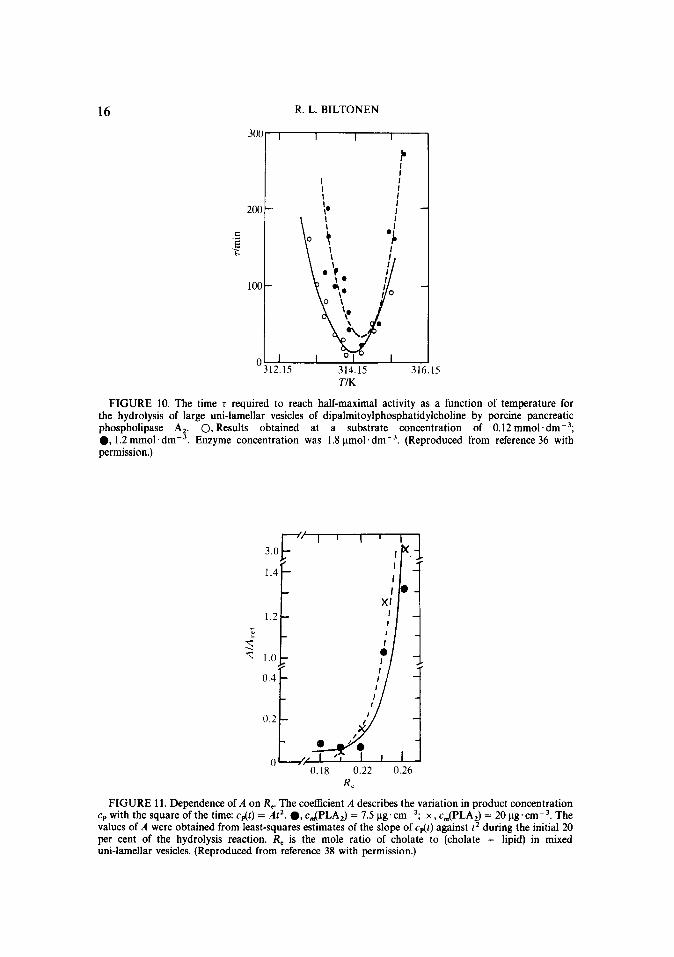
What is particularly interesting is that the rate of activation of this enzyme is strongly coupled to the existence of the main phase transition of the bilayer lipid substrate. A phenomenological indicator of the rate of activation is the time required for the rate of hydrolysis to reach one-half its maximum rate. For an exactly second- order reaction under conditions of infinite substrate this time is equal to the half-time of the activation reaction. This time at constant enzyme and substrate concentration as a function of temperature is shown in figure 10. (36) The resemblance of this curve to that of {C,,,,(T)}- ’ is striking; note that the rate of activation changes by a factor of ten over 0.1 K. It thus appears that the rate of activation of the enzyme requires that the substrate exists in a phase-transition region and that the rate of activation is
16 R. L. BILTONEN
T/K
FIGURE 10. The time r required to reach half-maximal activity as a function of temperature for the hydrolysis of large uni-lamellar vesicles of dipahnitoylphosphatidylcholine by porcine pancreatic phospholipase A,. 0, Results obtained at a substrate concentration of 0.12 mmol.dm-3; l , 1.2 mmol.dm-3. Enzyme concentration was 1.8 umol.dme3. (Reproduced from reference 36 with permission.)
0.18 0.22 0.26 R,
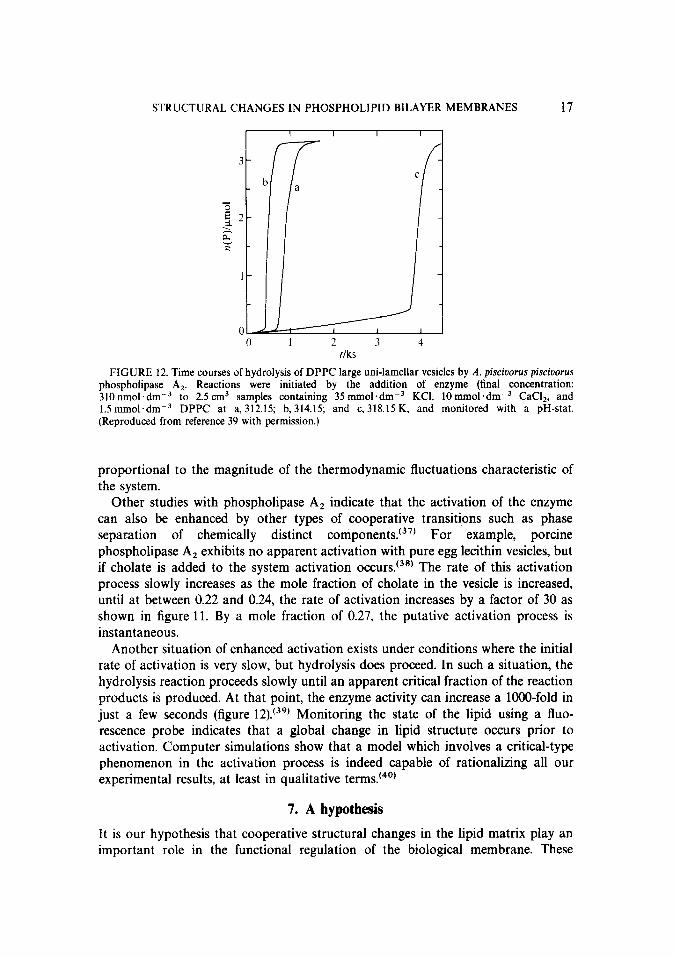
FIGURE 11. Dependence of A on R,. The coefficient A describes the variation in product concentration cp with the square of the time: cdt) = At2. 0, c.JPLA,) = 7.5 ug.cme3; x , c,(PLA,) = 20 ug.crnm3. The values of A were obtained from least-squares estimates of the slope of cdt) against t2 during the initial 20 per cent of the hydrolysis reaction. R, is the mole ratio of cholate to (cholate + lipid) in mixed uni-lamellar vesicles. (Reproduced from reference 38 with permission.)
STRUCTURAL CHANGES IN PHOSPHOLIPID BILAYER MEMBRANES 17
1
1 2 3 4 rlks
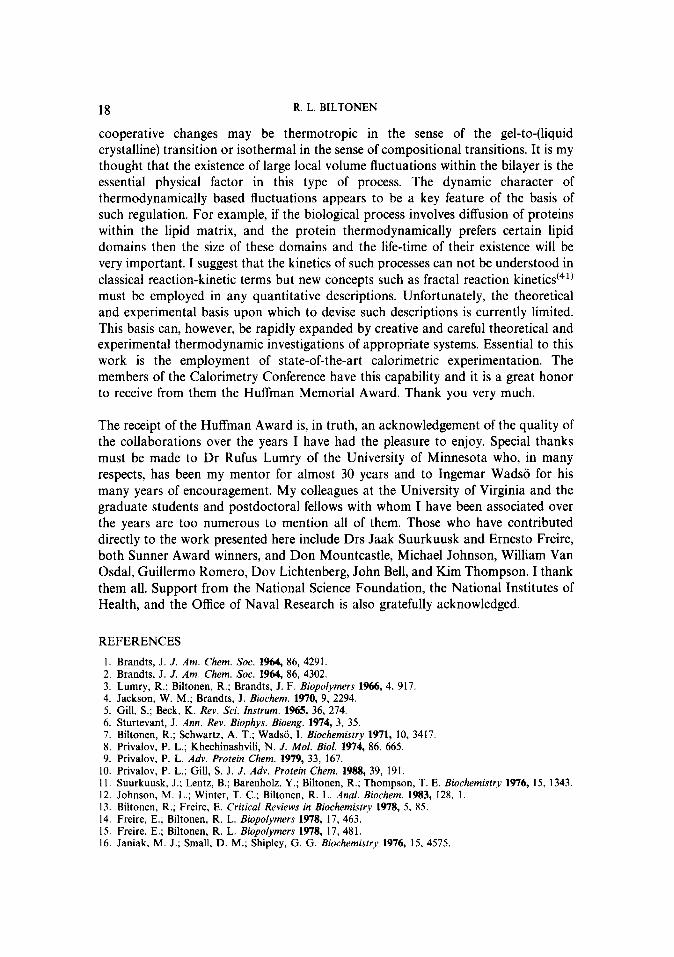
FIGURE 12. Time courses of hydrolysis of DPPC large uni-lamellar vesicles by A. piscioorus piscioorus phospholipase A,. Reactions were initiated by the addition of enzyme (final concentration: 310nmol.dm-3 to 2.5 cm3 samples containing 35 rnmol.dm-3 KCI, 10mmol.dm-3 CaCI,, and 1.5mmol.dmm3 DPPC at a, 312.15; b,314.15; and c. 318.15 K. and monitored with a pH-stat. (Reproduced from reference 39 with permission.)
proportional to the magnitude of the thermodynamic fluctuations characteristic of the system.
Other studies with phospholipase A, indicate that the activation of the enzyme can also be enhanced by other types of cooperative transitions such as phase separation of chemically distinct components.(37’ For example, porcine phospholipase A, exhibits no apparent activation with pure egg lecithin vesicles, but if cholate is added to the system activation occurs. ~3) The rate of this activation process slowly increases as the mole fraction of cholate in the vesicle is increased, until at between 0.22 and 0.24, the rate of activation increases by a factor of 30 as shown in figure 11. By a mole fraction of 0.27, the putative activation process is instantaneous.
Another situation of enhanced activation exists under conditions where the initial rate of activation is very slow, but hydrolysis does proceed. In such a situation, the hydrolysis reaction proceeds slowly until an apparent critical fraction of the reaction products is produced. At that point, the enzyme activity can increase a lOOO-fold in just a few seconds (figure 12). (39) Monitoring the state of the lipid using a fluo- rescence probe indicates that a global change in lipid structure occurs prior to activation. Computer simulations show that a model which involves a critical-type phenomenon in the activation process is indeed capable of rationalizing all our experimental results, at least in qualitative terms.(40)
7. A hypothesis
It is our hypothesis that cooperative structural changes in the lipid matrix play an important role in the functional regulation of the biological membrane. These
18 R. L. BILTONEN
cooperative changes may be thermotropic in the sense of the gel-to-(liquid crystalline) transition or isothermal in the sense of compositional transitions. It is my thought that the existence of large local volume fluctuations within the bilayer is the essential physical factor in this type of process. The dynamic character of thermodynamically based fluctuations appears to be a key feature of the basis of such regulation. For example, if the biological process involves diffusion of proteins within the lipid matrix, and the protein thermodynamically prefers certain lipid domains then the size of these domains and the life-time of their existence will be very important. I suggest that the kinetics of such processes can not be understood in classical reaction-kinetic terms but new concepts such as fractal reaction kineticsc41’ must be employed in any quantitative descriptions. Unfortunately, the theoretical and experimental basis upon which to devise such descriptions is currently limited. This basis can, however, be rapidly expanded by creative and careful theoretical and experimental thermodynamic investigations of appropriate systems. Essential to this work is the employment of state-of-the-art calorimetric experimentation. The members of the Calorimetry Conference have this capability and it is a great honor to receive from them the Huffman Memorial Award. Thank you very much.
The receipt of the Huffman Award is, in truth, an acknowledgement of the quality of the collaborations over the years I have had the pleasure to enjoy. Special thanks must be made to Dr Rufus Lumry of the University of Minnesota who, in many respects, has been my mentor for almost 30 years and to Ingemar Wads6 for his many years of encouragement. My colleagues at the University of Virginia and the graduate students and postdoctoral fellows with whom I have been associated over the years are too numerous to mention all of them. Those who have contributed directly to the work presented here include Drs Jaak Suurkuusk and Ernest0 Freire, both Sunner Award winners, and Don Mountcastle, Michael Johnson, William Van Osdal, Guillermo Romero, Dov Lichtenberg, John Bell, and Kim Thompson. I thank them all. Support from the National Science Foundation, the National Institutes of Health, and the Office of Naval Research is also gratefully acknowledged.
REFERENCES
1. Brand&, J. J. Am. Chem. Sot. 1964, 86.4291. 2. Brand@ J. J. Am. Chem. Sot. 1964, 86, 4302. 3. Lumry, R.: Biltonen, R.; Brandts, J. F. Eiopolymers 1966, 4. 917. 4. Jackson, W. M.; Brandts, J. Biochem. 1970, 9, 2294. 5. Gill, S.; Beck, K. Rev. Sci. Instrum. 1965, 36, 274. 6. Sturtevant, J. Ann. Rev. Biophys. Bioeng. 1974, 3, 35. 7. Biltonen, R.; Schwartz. A. T.; Wads& I. Biochemistry 1971, 10, 3417. 8. Privalov, P. L.; Khechinashvili, N. J. Mol. Biol. 1974, 86. 665. 9. Privalov, P. L. Adv. Protein Chem. 1979, 33, 167.
10. Privalov, P. L.; Gill, S. J. J. Adv. Protein Chem. 1988, 39, 191. 11. Suurkuusk, J.; Lentz, B.; Barenholz. Y.; Biltonen, R.; Thompson, T. E. Biochemistry 1976, 15, 1343. 12. Johnson, M. L.; Winter, T. C.; Biltonen, R. L. Anal. Biochem. 1983, 128. 1. 13. Biltonen, R.; Freire, E. Crifical Reviews in Biochemistry 1978, 5, 85. 14. Freire, E.; Biltonen, R. L. Biopolymers 1978, 17, 463. 15. Freire. E.; Biltonen, R. L. Biopolymers 1978, 17, 481. 16. Janiak. M. J.: Small, D. M.; Shipley, G. G. Biochemistry 1976, 15, 4575
STRUCTURAL CHANGES IN PHOSPHOLIPID BILAYER MEMBRANES 19
17. Lentz, B.: Freire, E.; Biltonen, R. Biochemistry 1978, 17. 4475. 18. Albon. N.: Sturtevant. J. M. Proc. Natl. Acad. Sci. I U.S.A.! 1978. 75. 2258. 19. John&n, i. L.; Van bsdol, W.; Biltonen, R. L. Methoak in Enzymology 1986, 130, 534. 20. Van Osdol, W.; Biltonen, R. L.; Johnson, M. L. J. Biochem. Bioph.vs. Metho&. In press. 21. Black, S. G.; Dixon, G. S. Biochemistry 1981, 20, 6740. 22. Schullery, S. E.; Schmidt, C. F.; Feigner, P.; Tillack. T. W.; Thompson, T. E. Biochemistry 1980, 19,
3919. 23. Zimm, B.; Bragg, J. J. Chem. Phys. 1959, 31, 526. 24. Snyder, B.; Freire. E. Proc. Natl. Acad. Sci. (U.S.A.) 1980, 77. 4055. 25. Caille, A.; Pink, D.; de Verteuil, F.; Zuckermann. M. J. Can. J. Phys. 1980, 58, 581. 26. Cruzeiro-Hanson, L.; Mouritson, 0. G. Eur. Biophys. J. 1988, 944, 63. 27. Mouritson, 0. G.; Zuckermann, M. J. Eur. Biophys. J. 1987, 15, 77 28. Freire. E.: Biltonen. R. Biochim. Bioahvs. Acta 1978. 514. 54. 29. Biltonen, R.; Freire; E. Critical Rev& in Biochemistry 1978, 5. 85. 30. Mountcastle, D. B.: Halsey, M.; Biltonen, R. Proc. Nut/. Acad. Sci. (U.S.A.) 1978, 75. 4906. 31. Melchior, D. L.; Steim, J. M. Prog. Surf. Memb. Sci. 1979, 13, 21 I. 32. Delong, E. F.; Yeyanos. A. A. Science 1985, 229. 1101. 33. Op den Kamp, J. A.; de Gier. J.; van Deenen. L. L. M. Biochim. Biophys. Acta 1975, 345. 253. 34. Romero, G.; Thompson, K.: Biltonen. R. J. Biol. Chem. 1987, 262, 13476. 35. Cho, W.; Tomasselli, A. G.: Heinrickson, R. L.: Kezdy, F. J. Biof. Chem. 1988, 263, 11237. 36. Menashe, M.; Romero, G.; Biltonen, R. L.: Lichtenberg. D. J. Biol. Chem. 1986, 261, 5334. 37. Jain, M. K.; Yu. B.-Z.; Kozubek. A. Biochim. Biophrs. Acta 1989, 980, 23. 38. Gheriani-Gruszka, N.; Shlomo, A.; Biltonen, R. L.: Litchtenberg, D. J. Biol. Chem. 1988, 263. 11808. 39. Bell, J. D.; Biltonen, R. L. J. Biol. Chem. 1989, 264, 12194. 40. Biltonen, R. L.; Bell, J. D. Biochemistry. Molecular Biology. and Physiology of Phospholipase A, and
its Regulatory Factors. In press. 41. Kopelman, R. Science 1988, 241. 1620. 42. Parente. R. A.: Lentz. B. R. Biochemistry 1984, 23, 2354.
Related Documents