arXiv:1004.0948v1 [astro-ph.CO] 6 Apr 2010 Accepted for publication in the Astronomical Journal Preprint typeset using L A T E X style emulateapj v. 11/10/09 A STATISTICAL ANALYSIS OF THE LATE-TYPE STELLAR CONTENT IN THE ANDROMEDA HALO Andreas Koch 1 , and R. Michael Rich 2 Accepted for publication in the Astronomical Journal ABSTRACT We present a statistical characterization of the carbon-star to M-giant (C/M) ratio in the halo of M31. Based on application of pseudo-filter band passes to our Keck/DEIMOS spectra we measure the 81-77-color index of 1288 stars in the giant stellar stream and in halo fields out to large distances. From this well-established narrow-band system, supplemented by V-I colors, we find only a low number (five in total) of C-star candidates. The resulting low C/M ratio of 10% is consistent with the values in the M31 disk and inner halo from the literature. Although our analysis is challenged by small number statistics and our sample selection, there is an indication that the oxygen-rich M-giants occur in similar number throughout the entire halo. We also find no difference in the C-star population of the halo fields compared to the giant stream. The very low C/M ratio is at odds with the observed low metallicities and the presence of intermediate-age stars at large radii. Our observed absence of a substantial carbon star population in the these regions indicates that the (outer) M31 halo cannot be dominated by the debris of disk-like or SMC-type galaxies, but rather resemble the dwarf elliptical NGC 147. Subject headings: stars: carbon — stars: late-type — Galaxies: evolution — Galaxies: stellar content — Galaxies: structure — Galaxies: individual (M31) 1. INTRODUCTION As more observations accumulate, it has become in- creasingly clear that the field population of massive galaxy halos consists largely of the debris of accreted satellites, along the lines of Searle & Zinn (1978). In the case of the Milky Way, the orbital stream of the Sagit- tarius (Sgr) dwarf spheroidal (dSph) is so complicated that it is easy to imagine its members being dispersed throughout much of the halo over a few Gyr timescale (e.g., Law et al. 2005; Fellhauer et al. 2006). Additional observations find coherent structures and satellites over much of the Galactic halo (e.g., Belokurov 2007a,b). Ev- idence of mergers in the form of the giant stream and other structures, is clearly even more striking in M31 (Ibata et al. 2001, 2007; Ferguson et al. 2002). N-body models of these events show that even a single minor merger is capable of filling much of the halo with de- bris after only 2 Gyr (Mori & Rich 2008). One is also struck by both the surface brightness and spatial extent of the giant stream and its shell feature, all of which are attributable to one relatively recent minor merger, that did not disrupt the disk (Fardal et al. 2006, 2008; Mori & Rich 2008). The importance of the giant stream event emphasizes that, as halo histories are stochastic, the pop- ulations of halos may be dominated by the debris of just a few events involving massive satellites – certainly not the picture that one may infer from the study of their globular cluster systems. In the case of M31, direct measurements of the halo star formation history from the main sequence turnoff revealed a complex range of age and abundance (e.g., Brown et al. 2003, 2006, 2008). In all of the M31 halo [email protected]; [email protected] 1 Department of Physics and Astronomy, University of Leices- ter, University Road, Leicester LE1 7RH, UK 2 UCLA, Department of Physics and Astronomy, Los Angeles, CA, USA fields, there exist significant populations of intermediate- age stars, with metallicities ranging from 1/10 to twice Solar. In addition to a contingent of stars ranging from 5–10 Gyr, nearly all M31 halo fields show signs of a blue extension of ∼ 1 Gyr old stars (e.g. Brown et al. 2006; Richardson et al. 2008). If stellar systems are being in- gested then their properties should, in principle, reflect those of similar galaxies in the Local Group. Although star formation likely ceases as a satellite is tidally dis- rupted, it is clear that much of the complexity can be observationally reconstructed, as has been accomplished for the Sagittarius dSph galaxy (e.g., Chou et al. 2007). An efficient tracer of more recent accretion events through intermediate-age populations is the number ra- tio, C/M, of carbon-rich (C) stars to the oxygen-rich (M) stars. C- and M-type stars are the most luminous sin- gle stars found in intermediate-age populations, and their spectral signatures are distinctive. In complex stellar sys- tems, the presence of carbon stars in significant numbers guarantees the presence of substantial intermediate-age populations. The primary correlation in the C/M ra- tio is with metallicity (Iben & Renzini 1983; Brewer et al. 1995); in more metal rich systems, the balance tilts toward the oxygen-rich M-stars. For example, the Galac- tic bulge is dominated by M giants (Blanco et al. 1984). Intermediate-age populations are carbon star dominated, with this tendency to increase at lower metallicity (e.g. Groenewegen 2002; Mouhcine & Lan¸con 2003; Batinelli & Demers 2005). Likewise, radial age and/or metallicity gradients in a given stellar system have been confirmed to be accompanied by gradients in the C/M ratio (e.g., Cioni et al. 2008). Furthermore, the Small Magellanic Cloud is well known to contrast with the LMC in having a high C/M ratio (Blanco et al. 1984). Although carbon stars are known in star clusters of the Magellanic Clouds (see e.g. Mould & Aaronson 1979), no late-type, lumi- nous carbon stars are found in Galactic globular clusters despite there being a large contingent of massive, metal

Welcome message from author
This document is posted to help you gain knowledge. Please leave a comment to let me know what you think about it! Share it to your friends and learn new things together.
Transcript
arX
iv:1
004.
0948
v1 [
astr
o-ph
.CO
] 6
Apr
201
0Accepted for publication in the Astronomical JournalPreprint typeset using LATEX style emulateapj v. 11/10/09
A STATISTICAL ANALYSIS OF THE LATE-TYPE STELLAR CONTENT IN THE ANDROMEDA HALO
Andreas Koch1, and R. Michael Rich2
Accepted for publication in the Astronomical Journal
ABSTRACT
We present a statistical characterization of the carbon-star to M-giant (C/M) ratio in the halo ofM31. Based on application of pseudo-filter band passes to our Keck/DEIMOS spectra we measure the81−77-color index of 1288 stars in the giant stellar stream and in halo fields out to large distances.From this well-established narrow-band system, supplemented by V−I colors, we find only a lownumber (five in total) of C-star candidates. The resulting low C/M ratio of 10% is consistent with thevalues in the M31 disk and inner halo from the literature. Although our analysis is challenged by smallnumber statistics and our sample selection, there is an indication that the oxygen-rich M-giants occurin similar number throughout the entire halo. We also find no difference in the C-star population ofthe halo fields compared to the giant stream. The very low C/M ratio is at odds with the observedlow metallicities and the presence of intermediate-age stars at large radii. Our observed absence of asubstantial carbon star population in the these regions indicates that the (outer) M31 halo cannot bedominated by the debris of disk-like or SMC-type galaxies, but rather resemble the dwarf ellipticalNGC 147.Subject headings: stars: carbon — stars: late-type — Galaxies: evolution — Galaxies: stellar content
— Galaxies: structure — Galaxies: individual (M31)
1. INTRODUCTION
As more observations accumulate, it has become in-creasingly clear that the field population of massivegalaxy halos consists largely of the debris of accretedsatellites, along the lines of Searle & Zinn (1978). In thecase of the Milky Way, the orbital stream of the Sagit-tarius (Sgr) dwarf spheroidal (dSph) is so complicatedthat it is easy to imagine its members being dispersedthroughout much of the halo over a few Gyr timescale(e.g., Law et al. 2005; Fellhauer et al. 2006). Additionalobservations find coherent structures and satellites overmuch of the Galactic halo (e.g., Belokurov 2007a,b). Ev-idence of mergers in the form of the giant stream andother structures, is clearly even more striking in M31(Ibata et al. 2001, 2007; Ferguson et al. 2002). N-bodymodels of these events show that even a single minormerger is capable of filling much of the halo with de-bris after only 2 Gyr (Mori & Rich 2008). One is alsostruck by both the surface brightness and spatial extentof the giant stream and its shell feature, all of which areattributable to one relatively recent minor merger, thatdid not disrupt the disk (Fardal et al. 2006, 2008; Mori& Rich 2008). The importance of the giant stream eventemphasizes that, as halo histories are stochastic, the pop-ulations of halos may be dominated by the debris of justa few events involving massive satellites – certainly notthe picture that one may infer from the study of theirglobular cluster systems.In the case of M31, direct measurements of the halo
star formation history from the main sequence turnoffrevealed a complex range of age and abundance (e.g.,Brown et al. 2003, 2006, 2008). In all of the M31 halo
[email protected]; [email protected] Department of Physics and Astronomy, University of Leices-
ter, University Road, Leicester LE1 7RH, UK2 UCLA, Department of Physics and Astronomy, Los Angeles,
CA, USA
fields, there exist significant populations of intermediate-age stars, with metallicities ranging from 1/10 to twiceSolar. In addition to a contingent of stars ranging from5–10 Gyr, nearly all M31 halo fields show signs of a blueextension of ∼ 1 Gyr old stars (e.g. Brown et al. 2006;Richardson et al. 2008). If stellar systems are being in-gested then their properties should, in principle, reflectthose of similar galaxies in the Local Group. Althoughstar formation likely ceases as a satellite is tidally dis-rupted, it is clear that much of the complexity can beobservationally reconstructed, as has been accomplishedfor the Sagittarius dSph galaxy (e.g., Chou et al. 2007).An efficient tracer of more recent accretion events
through intermediate-age populations is the number ra-tio, C/M, of carbon-rich (C) stars to the oxygen-rich (M)stars. C- and M-type stars are the most luminous sin-gle stars found in intermediate-age populations, and theirspectral signatures are distinctive. In complex stellar sys-tems, the presence of carbon stars in significant numbersguarantees the presence of substantial intermediate-agepopulations. The primary correlation in the C/M ra-tio is with metallicity (Iben & Renzini 1983; Brewer etal. 1995); in more metal rich systems, the balance tiltstoward the oxygen-rich M-stars. For example, the Galac-tic bulge is dominated by M giants (Blanco et al. 1984).Intermediate-age populations are carbon star dominated,with this tendency to increase at lower metallicity (e.g.Groenewegen 2002; Mouhcine & Lancon 2003; Batinelli& Demers 2005). Likewise, radial age and/or metallicitygradients in a given stellar system have been confirmedto be accompanied by gradients in the C/M ratio (e.g.,Cioni et al. 2008). Furthermore, the Small MagellanicCloud is well known to contrast with the LMC in havinga high C/M ratio (Blanco et al. 1984). Although carbonstars are known in star clusters of the Magellanic Clouds(see e.g. Mould & Aaronson 1979), no late-type, lumi-nous carbon stars are found in Galactic globular clustersdespite there being a large contingent of massive, metal
2 A. Koch & R.M. Rich
poor clusters. It may be inferred that the deep mixingon the AGB necessary to produce a carbon star is onlypossible for intermediate age stars.Most studies of the C/M ratio in the Local Group rely
on imaging through narrow band filters that measure therelative strength of CN and TiO bands (e.g., Cook et al.1986). In this context, the 81−77 -color index is a mea-sure for the relative strengths of CN and TiO bands andthus efficiently segregates M-stars with strong TiO andC-stars with strong CN bands. Quantitative analyses re-quire additional color information (such as V−I), in or-der to construct distinctive two-color diagrams (TCDs).Specifically, C-Stars in M31 have been recorded (Breweret al. 1995; Battinelli et al. 2003; Demers & Battinelli2005; Battinelli & Demers 2005). The inferred relativelylow C/M ratios of the order of 0.1 in the M31 disk andthe inner halo (within 10 kpc) are then in agreement withthe metal rich character of these populations.For the present work, we have examined spectra from a
large survey of the M31 halo (Koch et al. 2008; hereafterK08), and we have synthesized the CN and TiO filtersfor our spectra. From those we explore the C/M ratio inM31 halo fields, some of which are further than 100 kpcfrom the nucleus, but we do so without the completenessof a magnitude-limited photometric survey. Even con-sidering these limitations, we can statistically investigatethe late-type stellar content in the Andromeda halo andconnect occurrences of either population to the prevail-ing ages and metallicities out to large radii. This Paper isorganized as follows: In §2 we briefly summarize our ob-servations and the standard reductions, while §3 explainsour definitions of the CN−TiO pseudo-filters. The sep-aration into C- and M-stars from these filters, possiblebiases, and the implications for M31’s halo populationsare discussed in §4. Finally, §5 summarizes our findings.
2. OBSERVATIONS AND REDUCTION
The data used in this work were collected in the courseof a Keck program focusing on the spectroscopic investi-gation of M31’s halo structures based on the kinematicsand chemical analysis of red giants. Since these data areidentical to those presented in K08, we refer the reader tothe latter (and references therein) for details on the tar-get selection, data collection and reduction for the wholeproject.To recapitulate, our data set covers fields on the south-
east minor axis of M31 at projected distances of 9 kpcout to 160 kpc3. These fields were observed using theDEIMOS multislit spectrograph at the Keck II 10m tele-scope over several observing runs from 2002 through2006. The majority of the spectra was centered at awavelength of 7800A, yielding a full spectral coverageof ∼6500–9200A, which also comprises the prominentmolecular TiO and CN bands that are of interest forthe present study.The photometry of our targets comes from two sources:
For the outer halo fields (R&25 kpc) the WashingtonM , DDO51 and T2 photometry of Ostheimer (2003)was transformed into standard Johnson-Cousins V and Imagnitudes following Majewski (2000). Stars from thisphotometry were pre-selected to maximize the number of
3 Adopting a distance to M31 of 784 kpc (Stanek & Garnavich1998).
red giants, combining their location in the color magni-tude diagrams (CMDs) and TCDs built from the Wash-ington filters so as to optimally avoid the dwarf sequence(i.e., blueward of the red giant branch [RGB], and muchbrighter than the tip of the RGB [TRGB]; e.g., Majewskiet al. 2000; Palma et al. 2003), and to cover the entireRGB so as to yield a broad, unbiased metallicity range.The photometry of the inner M31 fields (R.25
kpc) was, on the other hand, taken from the Mega-Cam/MegaPrime archive (Gwyn 2008) and transformedto the Johnson-Cousins magnitudes via the latest Padovastellar isochrones (Marigo et al. 2008), which are avail-able both in the CHFT photometric system and forJohnson-Cousins V and I. As above, the goal of the re-spective target selection was to avoid those regions ofthe CMD with the greatest foreground dwarf contami-nation (and to exclude galaxies based on morphologicalcriteria; e.g., Gilbert et al. 2006). With the aim of tar-geting bright stars to reach sufficient S/N ratios, highestpriority was given to stars with 20.5 . I0 . 22 mag.Since M31’s TRGB lies at approximately 20.5 mag (e.g.,Durrell et al. 2001), some bright AGB stars above theTRGB will have been removed from the initial samples.In fact, our sample retains a number of bright (red) starsabove the RGB tip, so we conclude that our relative com-pleteness does not fall so rapidly. The redder stars areactually fainter in the I-band due to molecular absorp-tion, thus permitting bolometrically bright stars to fallwithin the I-band selection (see also CMDs in Fig. 5).Targets selected from either survey reach similar limit-ing magnitudes (slightly fainter than 22.5 mag) and spana comparably broad color range, so we conclude that noselection criterion has a bias set either in selecting C- orM-stars.Based on stellar radial velocities, the equivalent widths
of the gravity-sensitive Na doublet and the stars’ V−Icolors, we obtained an efficient separation of M31 redgiants from the Milky Way foreground contamination inK08. K08 reject 781 stars as being likely foregrounddwarfs, while 1288 were classified as likely M31 giantsand comprise our present sample.
3. SPECTROSCOPIC FILTER DEFINITION
The narrow band (∆λ ∼300A) 77 and 81 filters cen-tered on molecular bands have proven successful in sepa-rating C and M stars in Local Group galaxies, when cou-pled with temperature sensitive broad-band photometry.In particular, the red giant branch (RGB) bifurcates intothe redder (in 81−77) C-stars and the M-stars with V−Iredder than ∼1.5–2.0 (Cook et al. 1986; Cook & Aaron-son 1989; Nowotny 2001, 2003; Harbeck et al. 2004) withsimilar cuts for other color indices (e.g., R−I; Battinelliet al. 2003; Demers & Battinelli 2005).Our program for K08 was originally designed to fo-
cus on spectroscopy so that no photometry in selectednarrow-band filters was taken. Thus we have to relyon integrating our spectra in band passes mimicking thetraditional filter curves. Depending on the choice of tele-scope and instrument, the exact filter curves will dif-fer and therefore yield slightly different zero points andcolor indices. We investigated the different instrumentalset ups by convolving our spectra with filter curves fromthose three sites that are most widely found in the lit-erature on the late-type stellar content of Local Group
The late-type stellar content of the M31 halo 3
Wavelength [Å]
Tra
nsm
issi
on [%
]
7400 7600 7800 8000 8200 8400 86000
20
40
60
80
100WIYNCFHTAsiago
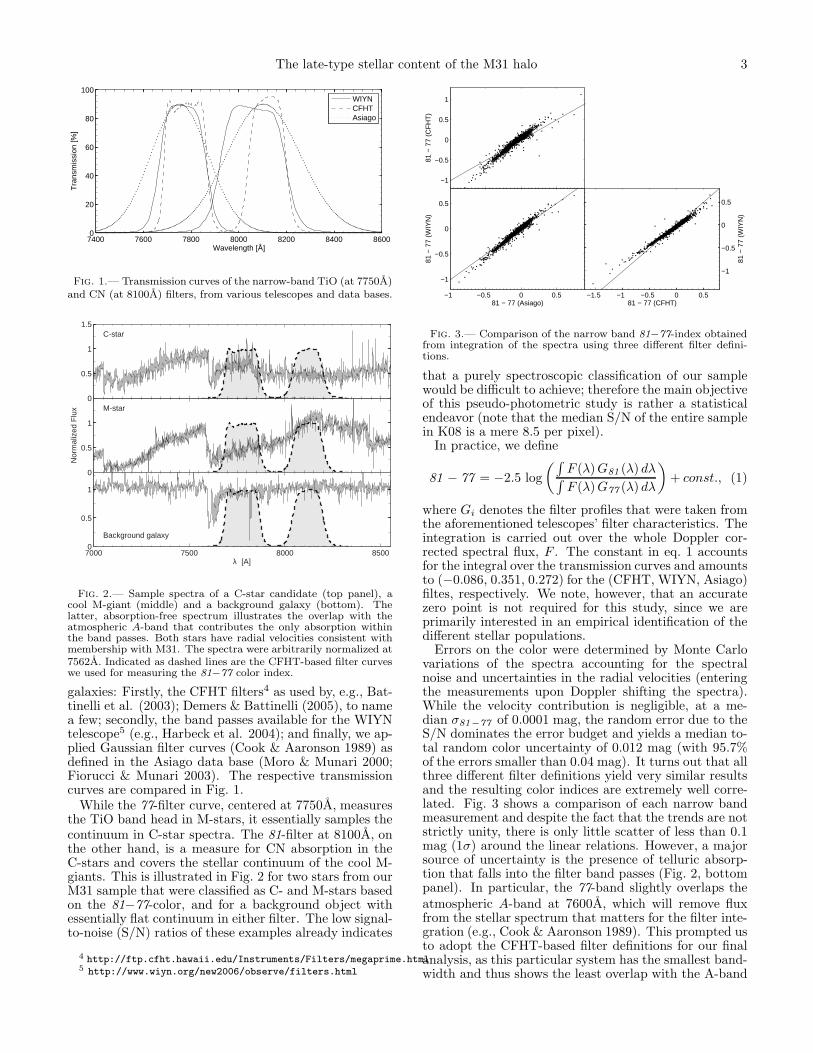
Fig. 1.— Transmission curves of the narrow-band TiO (at 7750A)and CN (at 8100A) filters, from various telescopes and data bases.
λ [AA]
Nor
mal
ized
Flu
x M-star
0
0.5
1
C-star
0
0.5
1
1.5
λ [A]
Background galaxy
7000 7500 8000 85000
0.5
1
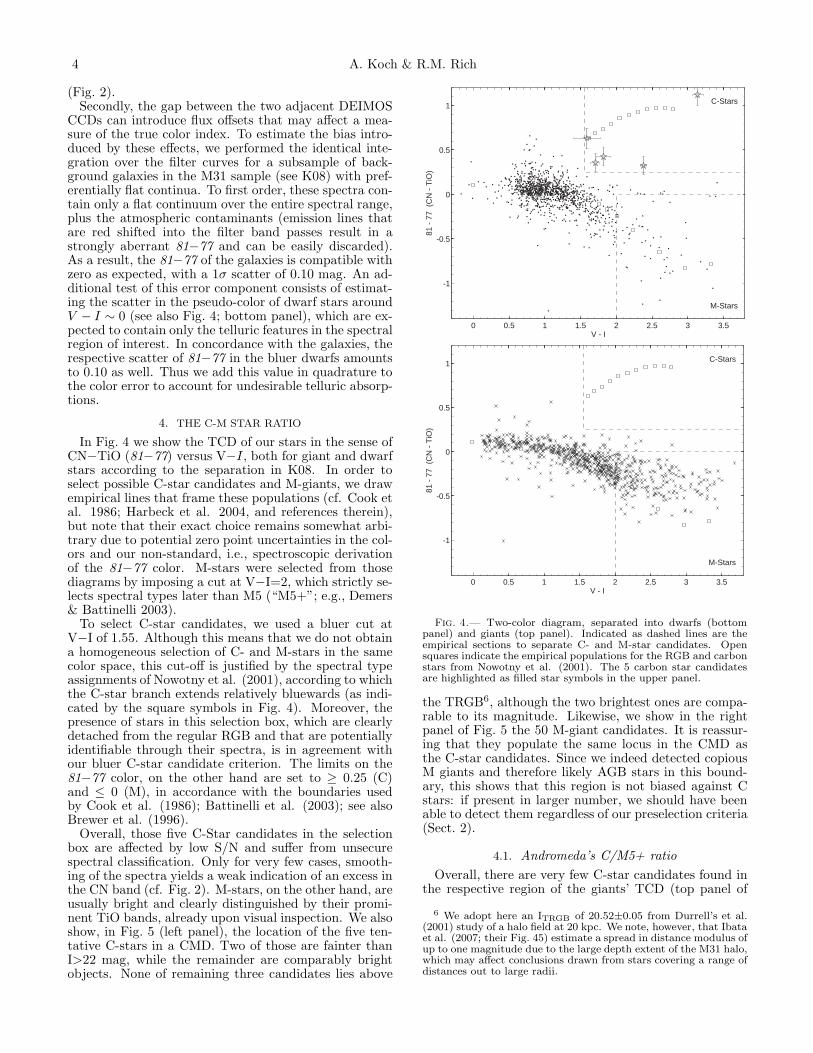
Fig. 2.— Sample spectra of a C-star candidate (top panel), acool M-giant (middle) and a background galaxy (bottom). Thelatter, absorption-free spectrum illustrates the overlap with theatmospheric A-band that contributes the only absorption withinthe band passes. Both stars have radial velocities consistent withmembership with M31. The spectra were arbitrarily normalized at7562A. Indicated as dashed lines are the CFHT-based filter curveswe used for measuring the 81−77 color index.
galaxies: Firstly, the CFHT filters4 as used by, e.g., Bat-tinelli et al. (2003); Demers & Battinelli (2005), to namea few; secondly, the band passes available for the WIYNtelescope5 (e.g., Harbeck et al. 2004); and finally, we ap-plied Gaussian filter curves (Cook & Aaronson 1989) asdefined in the Asiago data base (Moro & Munari 2000;Fiorucci & Munari 2003). The respective transmissioncurves are compared in Fig. 1.While the 77-filter curve, centered at 7750A, measures
the TiO band head in M-stars, it essentially samples thecontinuum in C-star spectra. The 81-filter at 8100A, onthe other hand, is a measure for CN absorption in theC-stars and covers the stellar continuum of the cool M-giants. This is illustrated in Fig. 2 for two stars from ourM31 sample that were classified as C- and M-stars basedon the 81−77-color, and for a background object withessentially flat continuum in either filter. The low signal-to-noise (S/N) ratios of these examples already indicates
4 http://ftp.cfht.hawaii.edu/Instruments/Filters/megaprime.html5 http://www.wiyn.org/new2006/observe/filters.html
81 − 77 (Asiago)
81 −
77
(WIY
N)
−1 −0.5 0 0.5
−1
−0.5
0
0.5
81 − 77 (CFHT)
81 −
77
(WIY
N)
−1.5 −1 −0.5 0 0.5
−1
−0.5
0
0.5
81 −
77
(CF
HT
)
−1
−0.5
0
0.5
1
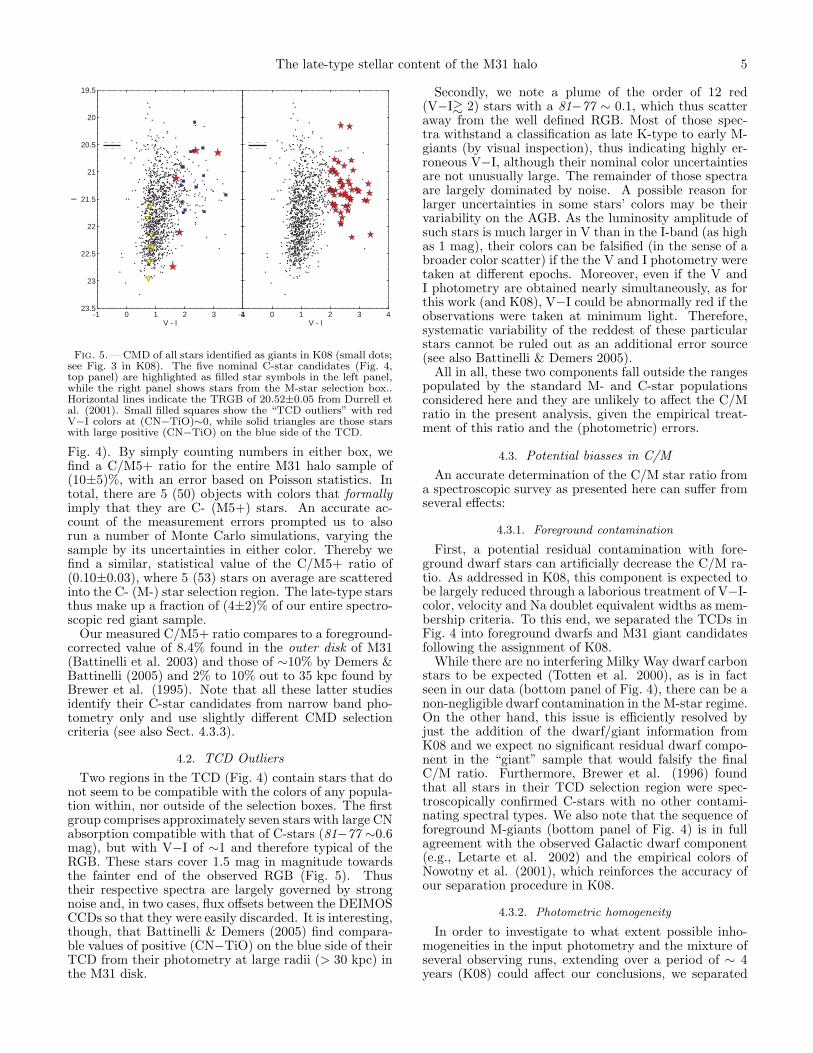
Fig. 3.— Comparison of the narrow band 81−77-index obtainedfrom integration of the spectra using three different filter defini-tions.
that a purely spectroscopic classification of our samplewould be difficult to achieve; therefore the main objectiveof this pseudo-photometric study is rather a statisticalendeavor (note that the median S/N of the entire samplein K08 is a mere 8.5 per pixel).In practice, we define
81 − 77 = −2.5 log
(∫
F (λ)G81 (λ) dλ∫
F (λ)G77 (λ) dλ
)
+ const., (1)
where Gi denotes the filter profiles that were taken fromthe aforementioned telescopes’ filter characteristics. Theintegration is carried out over the whole Doppler cor-rected spectral flux, F . The constant in eq. 1 accountsfor the integral over the transmission curves and amountsto (−0.086, 0.351, 0.272) for the (CFHT, WIYN, Asiago)filtes, respectively. We note, however, that an accuratezero point is not required for this study, since we areprimarily interested in an empirical identification of thedifferent stellar populations.Errors on the color were determined by Monte Carlo
variations of the spectra accounting for the spectralnoise and uncertainties in the radial velocities (enteringthe measurements upon Doppler shifting the spectra).While the velocity contribution is negligible, at a me-dian σ81−77 of 0.0001 mag, the random error due to theS/N dominates the error budget and yields a median to-tal random color uncertainty of 0.012 mag (with 95.7%of the errors smaller than 0.04 mag). It turns out that allthree different filter definitions yield very similar resultsand the resulting color indices are extremely well corre-lated. Fig. 3 shows a comparison of each narrow bandmeasurement and despite the fact that the trends are notstrictly unity, there is only little scatter of less than 0.1mag (1σ) around the linear relations. However, a majorsource of uncertainty is the presence of telluric absorp-tion that falls into the filter band passes (Fig. 2, bottompanel). In particular, the 77-band slightly overlaps theatmospheric A-band at 7600A, which will remove fluxfrom the stellar spectrum that matters for the filter inte-gration (e.g., Cook & Aaronson 1989). This prompted usto adopt the CFHT-based filter definitions for our finalanalysis, as this particular system has the smallest band-width and thus shows the least overlap with the A-band
4 A. Koch & R.M. Rich
(Fig. 2).Secondly, the gap between the two adjacent DEIMOS
CCDs can introduce flux offsets that may affect a mea-sure of the true color index. To estimate the bias intro-duced by these effects, we performed the identical inte-gration over the filter curves for a subsample of back-ground galaxies in the M31 sample (see K08) with pref-erentially flat continua. To first order, these spectra con-tain only a flat continuum over the entire spectral range,plus the atmospheric contaminants (emission lines thatare red shifted into the filter band passes result in astrongly aberrant 81−77 and can be easily discarded).As a result, the 81−77 of the galaxies is compatible withzero as expected, with a 1σ scatter of 0.10 mag. An ad-ditional test of this error component consists of estimat-ing the scatter in the pseudo-color of dwarf stars aroundV − I ∼ 0 (see also Fig. 4; bottom panel), which are ex-pected to contain only the telluric features in the spectralregion of interest. In concordance with the galaxies, therespective scatter of 81−77 in the bluer dwarfs amountsto 0.10 as well. Thus we add this value in quadrature tothe color error to account for undesirable telluric absorp-tions.
4. THE C-M STAR RATIO
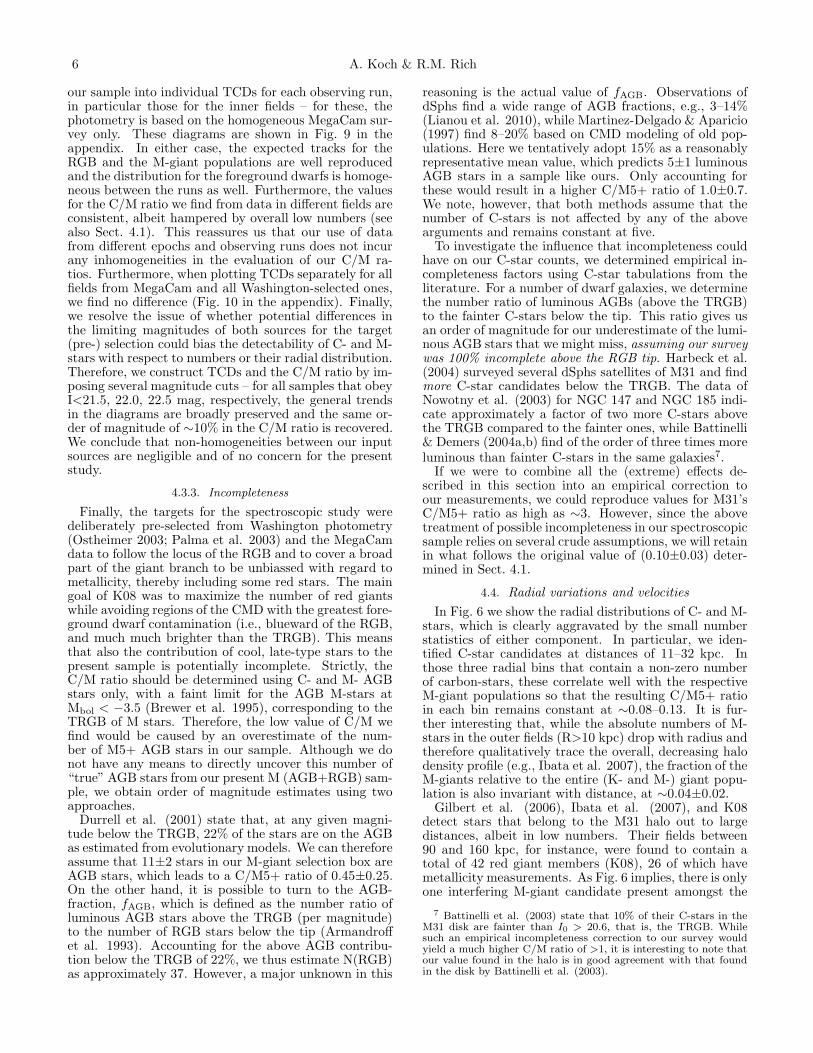
In Fig. 4 we show the TCD of our stars in the sense ofCN−TiO (81−77) versus V−I, both for giant and dwarfstars according to the separation in K08. In order toselect possible C-star candidates and M-giants, we drawempirical lines that frame these populations (cf. Cook etal. 1986; Harbeck et al. 2004, and references therein),but note that their exact choice remains somewhat arbi-trary due to potential zero point uncertainties in the col-ors and our non-standard, i.e., spectroscopic derivationof the 81−77 color. M-stars were selected from thosediagrams by imposing a cut at V−I=2, which strictly se-lects spectral types later than M5 (“M5+”; e.g., Demers& Battinelli 2003).To select C-star candidates, we used a bluer cut at
V−I of 1.55. Although this means that we do not obtaina homogeneous selection of C- and M-stars in the samecolor space, this cut-off is justified by the spectral typeassignments of Nowotny et al. (2001), according to whichthe C-star branch extends relatively bluewards (as indi-cated by the square symbols in Fig. 4). Moreover, thepresence of stars in this selection box, which are clearlydetached from the regular RGB and that are potentiallyidentifiable through their spectra, is in agreement withour bluer C-star candidate criterion. The limits on the81−77 color, on the other hand are set to ≥ 0.25 (C)and ≤ 0 (M), in accordance with the boundaries usedby Cook et al. (1986); Battinelli et al. (2003); see alsoBrewer et al. (1996).Overall, those five C-Star candidates in the selection
box are affected by low S/N and suffer from unsecurespectral classification. Only for very few cases, smooth-ing of the spectra yields a weak indication of an excess inthe CN band (cf. Fig. 2). M-stars, on the other hand, areusually bright and clearly distinguished by their promi-nent TiO bands, already upon visual inspection. We alsoshow, in Fig. 5 (left panel), the location of the five ten-tative C-stars in a CMD. Two of those are fainter thanI>22 mag, while the remainder are comparably brightobjects. None of remaining three candidates lies above
V - I
81 -
77
(C
N -
TiO
)
C-Stars
M-Stars
0 0.5 1 1.5 2 2.5 3 3.5
-1
-0.5
0
0.5
1
V - I
81 -
77
(C
N -
TiO
)
C-Stars
M-Stars
0 0.5 1 1.5 2 2.5 3 3.5
-1
-0.5
0
0.5
1
Fig. 4.— Two-color diagram, separated into dwarfs (bottompanel) and giants (top panel). Indicated as dashed lines are theempirical sections to separate C- and M-star candidates. Opensquares indicate the empirical populations for the RGB and carbonstars from Nowotny et al. (2001). The 5 carbon star candidatesare highlighted as filled star symbols in the upper panel.
the TRGB6, although the two brightest ones are compa-rable to its magnitude. Likewise, we show in the rightpanel of Fig. 5 the 50 M-giant candidates. It is reassur-ing that they populate the same locus in the CMD asthe C-star candidates. Since we indeed detected copiousM giants and therefore likely AGB stars in this bound-ary, this shows that this region is not biased against Cstars: if present in larger number, we should have beenable to detect them regardless of our preselection criteria(Sect. 2).
4.1. Andromeda’s C/M5+ ratio
Overall, there are very few C-star candidates found inthe respective region of the giants’ TCD (top panel of
6 We adopt here an ITRGB of 20.52±0.05 from Durrell’s et al.(2001) study of a halo field at 20 kpc. We note, however, that Ibataet al. (2007; their Fig. 45) estimate a spread in distance modulus ofup to one magnitude due to the large depth extent of the M31 halo,which may affect conclusions drawn from stars covering a range ofdistances out to large radii.
The late-type stellar content of the M31 halo 5
V - I
I
-1 0 1 2 3 4
19.5
20
20.5
21
21.5
22
22.5
23
23.5
V - I-1 0 1 2 3 4
Fig. 5.— CMD of all stars identified as giants in K08 (small dots;see Fig. 3 in K08). The five nominal C-star candidates (Fig. 4,top panel) are highlighted as filled star symbols in the left panel,while the right panel shows stars from the M-star selection box..Horizontal lines indicate the TRGB of 20.52±0.05 from Durrell etal. (2001). Small filled squares show the “TCD outliers” with redV−I colors at (CN−TiO)∼0, while solid triangles are those starswith large positive (CN−TiO) on the blue side of the TCD.
Fig. 4). By simply counting numbers in either box, wefind a C/M5+ ratio for the entire M31 halo sample of(10±5)%, with an error based on Poisson statistics. Intotal, there are 5 (50) objects with colors that formallyimply that they are C- (M5+) stars. An accurate ac-count of the measurement errors prompted us to alsorun a number of Monte Carlo simulations, varying thesample by its uncertainties in either color. Thereby wefind a similar, statistical value of the C/M5+ ratio of(0.10±0.03), where 5 (53) stars on average are scatteredinto the C- (M-) star selection region. The late-type starsthus make up a fraction of (4±2)% of our entire spectro-scopic red giant sample.Our measured C/M5+ ratio compares to a foreground-
corrected value of 8.4% found in the outer disk of M31(Battinelli et al. 2003) and those of ∼10% by Demers &Battinelli (2005) and 2% to 10% out to 35 kpc found byBrewer et al. (1995). Note that all these latter studiesidentify their C-star candidates from narrow band pho-tometry only and use slightly different CMD selectioncriteria (see also Sect. 4.3.3).
4.2. TCD Outliers
Two regions in the TCD (Fig. 4) contain stars that donot seem to be compatible with the colors of any popula-tion within, nor outside of the selection boxes. The firstgroup comprises approximately seven stars with large CNabsorption compatible with that of C-stars (81−77 ∼0.6mag), but with V−I of ∼1 and therefore typical of theRGB. These stars cover 1.5 mag in magnitude towardsthe fainter end of the observed RGB (Fig. 5). Thustheir respective spectra are largely governed by strongnoise and, in two cases, flux offsets between the DEIMOSCCDs so that they were easily discarded. It is interesting,though, that Battinelli & Demers (2005) find compara-ble values of positive (CN−TiO) on the blue side of theirTCD from their photometry at large radii (> 30 kpc) inthe M31 disk.
Secondly, we note a plume of the order of 12 red(V−I& 2) stars with a 81−77 ∼ 0.1, which thus scatteraway from the well defined RGB. Most of those spec-tra withstand a classification as late K-type to early M-giants (by visual inspection), thus indicating highly er-roneous V−I, although their nominal color uncertaintiesare not unusually large. The remainder of those spectraare largely dominated by noise. A possible reason forlarger uncertainties in some stars’ colors may be theirvariability on the AGB. As the luminosity amplitude ofsuch stars is much larger in V than in the I-band (as highas 1 mag), their colors can be falsified (in the sense of abroader color scatter) if the the V and I photometry weretaken at different epochs. Moreover, even if the V andI photometry are obtained nearly simultaneously, as forthis work (and K08), V−I could be abnormally red if theobservations were taken at minimum light. Therefore,systematic variability of the reddest of these particularstars cannot be ruled out as an additional error source(see also Battinelli & Demers 2005).All in all, these two components fall outside the ranges
populated by the standard M- and C-star populationsconsidered here and they are unlikely to affect the C/Mratio in the present analysis, given the empirical treat-ment of this ratio and the (photometric) errors.
4.3. Potential biasses in C/M
An accurate determination of the C/M star ratio froma spectroscopic survey as presented here can suffer fromseveral effects:
4.3.1. Foreground contamination
First, a potential residual contamination with fore-ground dwarf stars can artificially decrease the C/M ra-tio. As addressed in K08, this component is expected tobe largely reduced through a laborious treatment of V−I-color, velocity and Na doublet equivalent widths as mem-bership criteria. To this end, we separated the TCDs inFig. 4 into foreground dwarfs and M31 giant candidatesfollowing the assignment of K08.While there are no interfering Milky Way dwarf carbon
stars to be expected (Totten et al. 2000), as is in factseen in our data (bottom panel of Fig. 4), there can be anon-negligible dwarf contamination in the M-star regime.On the other hand, this issue is efficiently resolved byjust the addition of the dwarf/giant information fromK08 and we expect no significant residual dwarf compo-nent in the “giant” sample that would falsify the finalC/M ratio. Furthermore, Brewer et al. (1996) foundthat all stars in their TCD selection region were spec-troscopically confirmed C-stars with no other contami-nating spectral types. We also note that the sequence offoreground M-giants (bottom panel of Fig. 4) is in fullagreement with the observed Galactic dwarf component(e.g., Letarte et al. 2002) and the empirical colors ofNowotny et al. (2001), which reinforces the accuracy ofour separation procedure in K08.
4.3.2. Photometric homogeneity
In order to investigate to what extent possible inho-mogeneities in the input photometry and the mixture ofseveral observing runs, extending over a period of ∼ 4years (K08) could affect our conclusions, we separated
6 A. Koch & R.M. Rich
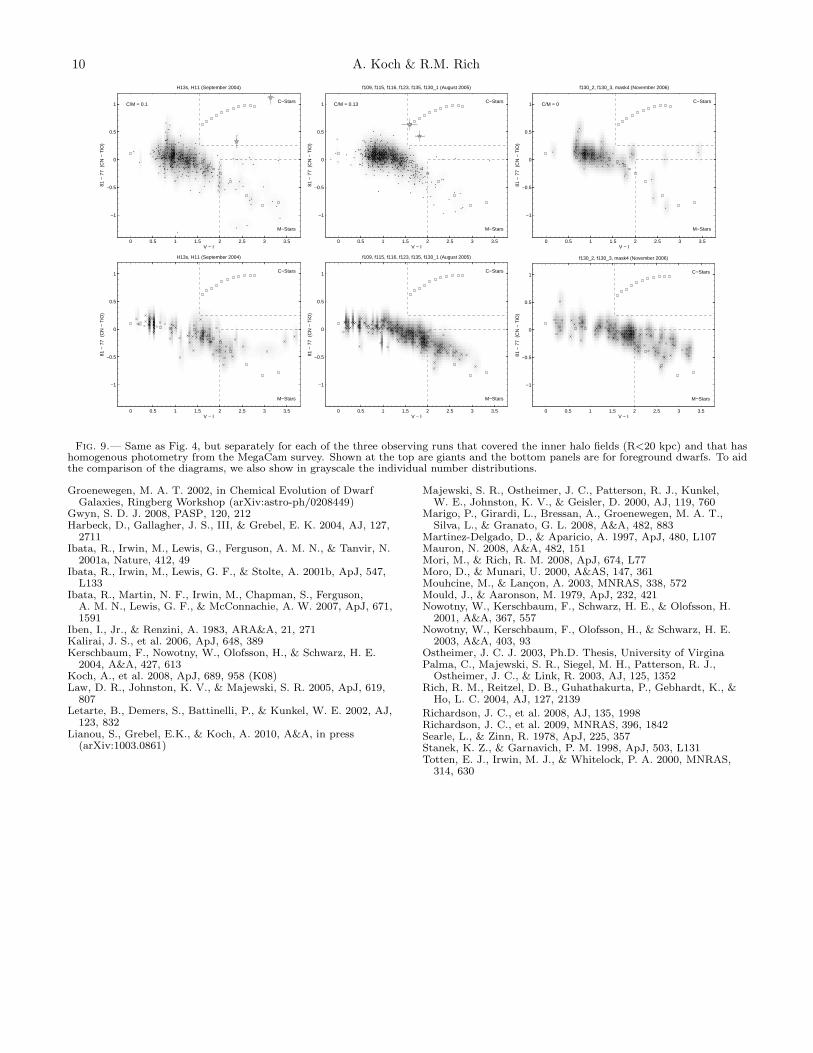
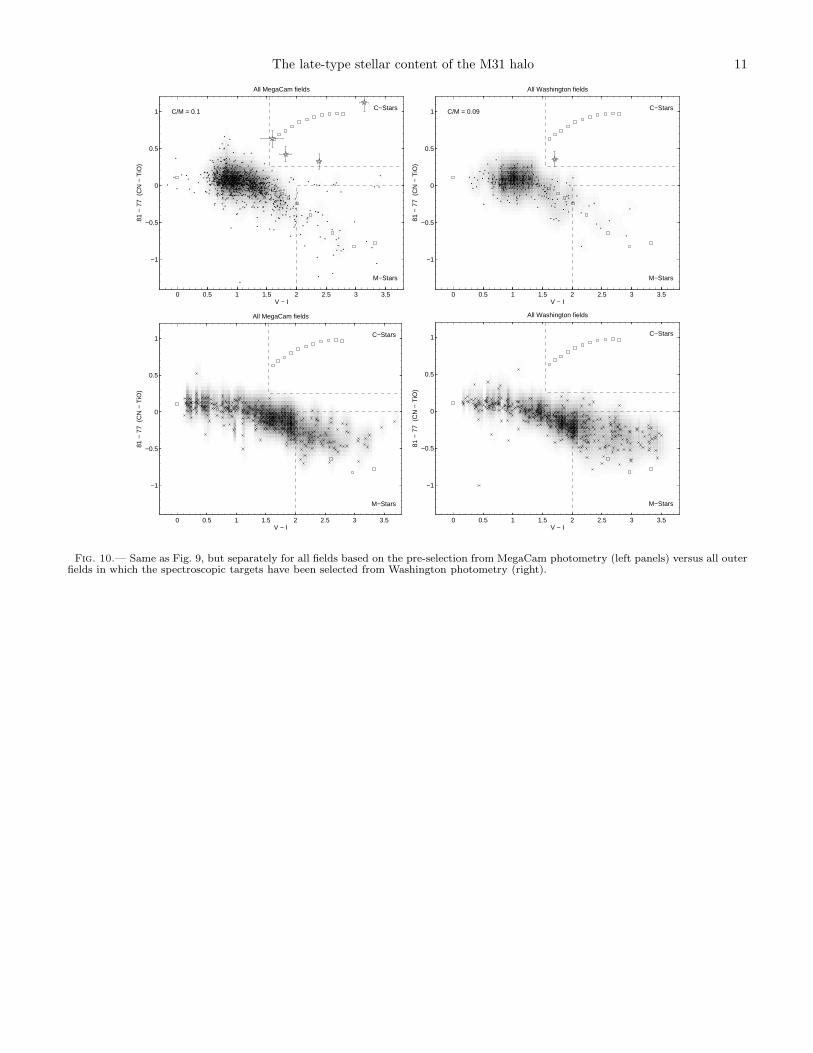
our sample into individual TCDs for each observing run,in particular those for the inner fields – for these, thephotometry is based on the homogeneous MegaCam sur-vey only. These diagrams are shown in Fig. 9 in theappendix. In either case, the expected tracks for theRGB and the M-giant populations are well reproducedand the distribution for the foreground dwarfs is homoge-neous between the runs as well. Furthermore, the valuesfor the C/M ratio we find from data in different fields areconsistent, albeit hampered by overall low numbers (seealso Sect. 4.1). This reassures us that our use of datafrom different epochs and observing runs does not incurany inhomogeneities in the evaluation of our C/M ra-tios. Furthermore, when plotting TCDs separately for allfields from MegaCam and all Washington-selected ones,we find no difference (Fig. 10 in the appendix). Finally,we resolve the issue of whether potential differences inthe limiting magnitudes of both sources for the target(pre-) selection could bias the detectability of C- and M-stars with respect to numbers or their radial distribution.Therefore, we construct TCDs and the C/M ratio by im-posing several magnitude cuts – for all samples that obeyI<21.5, 22.0, 22.5 mag, respectively, the general trendsin the diagrams are broadly preserved and the same or-der of magnitude of ∼10% in the C/M ratio is recovered.We conclude that non-homogeneities between our inputsources are negligible and of no concern for the presentstudy.
4.3.3. Incompleteness
Finally, the targets for the spectroscopic study weredeliberately pre-selected from Washington photometry(Ostheimer 2003; Palma et al. 2003) and the MegaCamdata to follow the locus of the RGB and to cover a broadpart of the giant branch to be unbiassed with regard tometallicity, thereby including some red stars. The maingoal of K08 was to maximize the number of red giantswhile avoiding regions of the CMD with the greatest fore-ground dwarf contamination (i.e., blueward of the RGB,and much much brighter than the TRGB). This meansthat also the contribution of cool, late-type stars to thepresent sample is potentially incomplete. Strictly, theC/M ratio should be determined using C- and M- AGBstars only, with a faint limit for the AGB M-stars atMbol < −3.5 (Brewer et al. 1995), corresponding to theTRGB of M stars. Therefore, the low value of C/M wefind would be caused by an overestimate of the num-ber of M5+ AGB stars in our sample. Although we donot have any means to directly uncover this number of“true” AGB stars from our present M (AGB+RGB) sam-ple, we obtain order of magnitude estimates using twoapproaches.Durrell et al. (2001) state that, at any given magni-
tude below the TRGB, 22% of the stars are on the AGBas estimated from evolutionary models. We can thereforeassume that 11±2 stars in our M-giant selection box areAGB stars, which leads to a C/M5+ ratio of 0.45±0.25.On the other hand, it is possible to turn to the AGB-fraction, fAGB, which is defined as the number ratio ofluminous AGB stars above the TRGB (per magnitude)to the number of RGB stars below the tip (Armandroffet al. 1993). Accounting for the above AGB contribu-tion below the TRGB of 22%, we thus estimate N(RGB)as approximately 37. However, a major unknown in this
reasoning is the actual value of fAGB. Observations ofdSphs find a wide range of AGB fractions, e.g., 3–14%(Lianou et al. 2010), while Martinez-Delgado & Aparicio(1997) find 8–20% based on CMD modeling of old pop-ulations. Here we tentatively adopt 15% as a reasonablyrepresentative mean value, which predicts 5±1 luminousAGB stars in a sample like ours. Only accounting forthese would result in a higher C/M5+ ratio of 1.0±0.7.We note, however, that both methods assume that thenumber of C-stars is not affected by any of the abovearguments and remains constant at five.To investigate the influence that incompleteness could
have on our C-star counts, we determined empirical in-completeness factors using C-star tabulations from theliterature. For a number of dwarf galaxies, we determinethe number ratio of luminous AGBs (above the TRGB)to the fainter C-stars below the tip. This ratio gives usan order of magnitude for our underestimate of the lumi-nous AGB stars that we might miss, assuming our surveywas 100% incomplete above the RGB tip. Harbeck et al.(2004) surveyed several dSphs satellites of M31 and findmore C-star candidates below the TRGB. The data ofNowotny et al. (2003) for NGC 147 and NGC 185 indi-cate approximately a factor of two more C-stars abovethe TRGB compared to the fainter ones, while Battinelli& Demers (2004a,b) find of the order of three times moreluminous than fainter C-stars in the same galaxies7.If we were to combine all the (extreme) effects de-
scribed in this section into an empirical correction toour measurements, we could reproduce values for M31’sC/M5+ ratio as high as ∼3. However, since the abovetreatment of possible incompleteness in our spectroscopicsample relies on several crude assumptions, we will retainin what follows the original value of (0.10±0.03) deter-mined in Sect. 4.1.
4.4. Radial variations and velocities
In Fig. 6 we show the radial distributions of C- and M-stars, which is clearly aggravated by the small numberstatistics of either component. In particular, we iden-tified C-star candidates at distances of 11–32 kpc. Inthose three radial bins that contain a non-zero numberof carbon-stars, these correlate well with the respectiveM-giant populations so that the resulting C/M5+ ratioin each bin remains constant at ∼0.08–0.13. It is fur-ther interesting that, while the absolute numbers of M-stars in the outer fields (R>10 kpc) drop with radius andtherefore qualitatively trace the overall, decreasing halodensity profile (e.g., Ibata et al. 2007), the fraction of theM-giants relative to the entire (K- and M-) giant popu-lation is also invariant with distance, at ∼0.04±0.02.Gilbert et al. (2006), Ibata et al. (2007), and K08
detect stars that belong to the M31 halo out to largedistances, albeit in low numbers. Their fields between90 and 160 kpc, for instance, were found to contain atotal of 42 red giant members (K08), 26 of which havemetallicity measurements. As Fig. 6 implies, there is onlyone interfering M-giant candidate present amongst the
7 Battinelli et al. (2003) state that 10% of their C-stars in theM31 disk are fainter than I0 > 20.6, that is, the TRGB. Whilesuch an empirical incompleteness correction to our survey wouldyield a much higher C/M ratio of >1, it is interesting to note thatour value found in the halo is in good agreement with that foundin the disk by Battinelli et al. (2003).
The late-type stellar content of the M31 halo 7N
(C)
/ N(M
5+)
R [kpc]
101
102
10−2
10−1
100
This workDB05; BDL03B95
Nto
t
100
101
102
M-starsC-stars
R [kpc]
N /
Nto
t
101
102
10-3
10-2
10-1
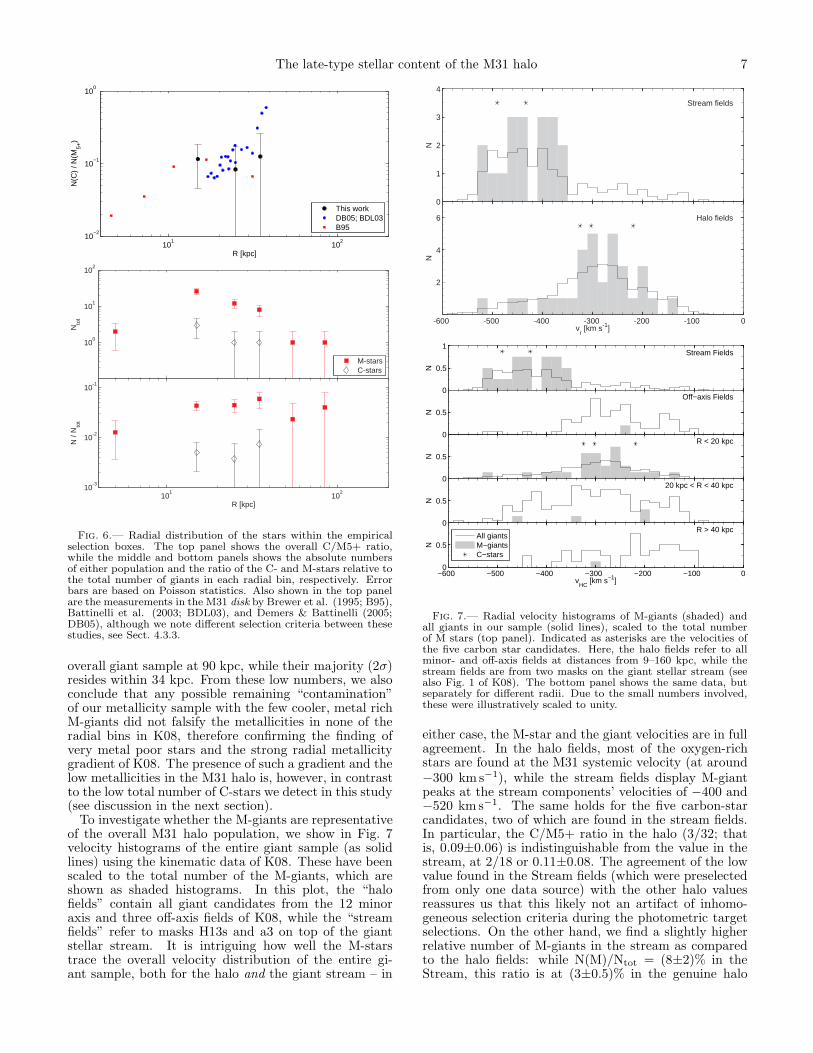
Fig. 6.— Radial distribution of the stars within the empiricalselection boxes. The top panel shows the overall C/M5+ ratio,while the middle and bottom panels shows the absolute numbersof either population and the ratio of the C- and M-stars relative tothe total number of giants in each radial bin, respectively. Errorbars are based on Poisson statistics. Also shown in the top panelare the measurements in the M31 disk by Brewer et al. (1995; B95),Battinelli et al. (2003; BDL03), and Demers & Battinelli (2005;DB05), although we note different selection criteria between thesestudies, see Sect. 4.3.3.
overall giant sample at 90 kpc, while their majority (2σ)resides within 34 kpc. From these low numbers, we alsoconclude that any possible remaining “contamination”of our metallicity sample with the few cooler, metal richM-giants did not falsify the metallicities in none of theradial bins in K08, therefore confirming the finding ofvery metal poor stars and the strong radial metallicitygradient of K08. The presence of such a gradient and thelow metallicities in the M31 halo is, however, in contrastto the low total number of C-stars we detect in this study(see discussion in the next section).To investigate whether the M-giants are representative
of the overall M31 halo population, we show in Fig. 7velocity histograms of the entire giant sample (as solidlines) using the kinematic data of K08. These have beenscaled to the total number of the M-giants, which areshown as shaded histograms. In this plot, the “halofields” contain all giant candidates from the 12 minoraxis and three off-axis fields of K08, while the “streamfields” refer to masks H13s and a3 on top of the giantstellar stream. It is intriguing how well the M-starstrace the overall velocity distribution of the entire gi-ant sample, both for the halo and the giant stream – in
N
Halo fields
vr [km s-1]
-600 -500 -400 -300 -200 -100 0
2
4
6
N
Stream fields
0
1
2
3
4
N
R < 20 kpc
0
0.5
N
20 kpc < R < 40 kpc
0
0.5
vHC
[km s−1]
N
R > 40 kpc
−600 −500 −400 −300 −200 −100 00
0.5All giantsM−giantsC−stars
N
Stream Fields
0
0.5
1
N
Off−axis Fields
0
0.5
Fig. 7.— Radial velocity histograms of M-giants (shaded) andall giants in our sample (solid lines), scaled to the total numberof M stars (top panel). Indicated as asterisks are the velocities ofthe five carbon star candidates. Here, the halo fields refer to allminor- and off-axis fields at distances from 9–160 kpc, while thestream fields are from two masks on the giant stellar stream (seealso Fig. 1 of K08). The bottom panel shows the same data, butseparately for different radii. Due to the small numbers involved,these were illustratively scaled to unity.
either case, the M-star and the giant velocities are in fullagreement. In the halo fields, most of the oxygen-richstars are found at the M31 systemic velocity (at around−300 km s−1), while the stream fields display M-giantpeaks at the stream components’ velocities of −400 and−520 km s−1. The same holds for the five carbon-starcandidates, two of which are found in the stream fields.In particular, the C/M5+ ratio in the halo (3/32; thatis, 0.09±0.06) is indistinguishable from the value in thestream, at 2/18 or 0.11±0.08. The agreement of the lowvalue found in the Stream fields (which were preselectedfrom only one data source) with the other halo valuesreassures us that this likely not an artifact of inhomo-geneous selection criteria during the photometric targetselections. On the other hand, we find a slightly higherrelative number of M-giants in the stream as comparedto the halo fields: while N(M)/Ntot = (8±2)% in theStream, this ratio is at (3±0.5)% in the genuine halo
8 A. Koch & R.M. Rich
[Fe/H]
C/M
NGC205
SMCIC1613
For
Peg
Sag DIGLeoI
Aqu
M31 disk
MW disk
M33
LMC
NGC6822
NGC147
AndVII
NGC185
WLM
AndVI
CetusM31 Halo Stream
AndIIIAndV
SexTuc
AndI
AndII
-2.5 -2 -1.5 -1 -0.5 0 0.510
-2
10-1
100
101
102
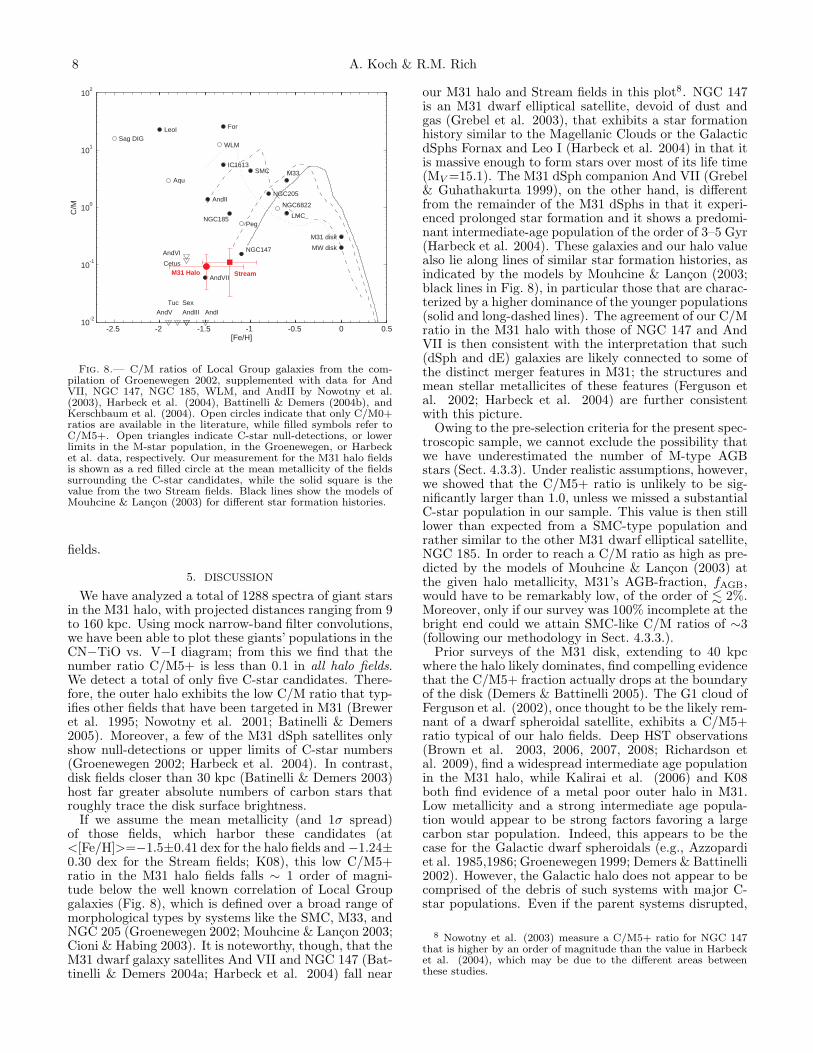
Fig. 8.— C/M ratios of Local Group galaxies from the com-pilation of Groenewegen 2002, supplemented with data for AndVII, NGC 147, NGC 185, WLM, and AndII by Nowotny et al.(2003), Harbeck et al. (2004), Battinelli & Demers (2004b), andKerschbaum et al. (2004). Open circles indicate that only C/M0+ratios are available in the literature, while filled symbols refer toC/M5+. Open triangles indicate C-star null-detections, or lowerlimits in the M-star population, in the Groenewegen, or Harbecket al. data, respectively. Our measurement for the M31 halo fieldsis shown as a red filled circle at the mean metallicity of the fieldssurrounding the C-star candidates, while the solid square is thevalue from the two Stream fields. Black lines show the models ofMouhcine & Lancon (2003) for different star formation histories.
fields.
5. DISCUSSION
We have analyzed a total of 1288 spectra of giant starsin the M31 halo, with projected distances ranging from 9to 160 kpc. Using mock narrow-band filter convolutions,we have been able to plot these giants’ populations in theCN−TiO vs. V−I diagram; from this we find that thenumber ratio C/M5+ is less than 0.1 in all halo fields.We detect a total of only five C-star candidates. There-fore, the outer halo exhibits the low C/M ratio that typ-ifies other fields that have been targeted in M31 (Breweret al. 1995; Nowotny et al. 2001; Batinelli & Demers2005). Moreover, a few of the M31 dSph satellites onlyshow null-detections or upper limits of C-star numbers(Groenewegen 2002; Harbeck et al. 2004). In contrast,disk fields closer than 30 kpc (Batinelli & Demers 2003)host far greater absolute numbers of carbon stars thatroughly trace the disk surface brightness.If we assume the mean metallicity (and 1σ spread)
of those fields, which harbor these candidates (at<[Fe/H]>=−1.5±0.41 dex for the halo fields and−1.24±0.30 dex for the Stream fields; K08), this low C/M5+ratio in the M31 halo fields falls ∼ 1 order of magni-tude below the well known correlation of Local Groupgalaxies (Fig. 8), which is defined over a broad range ofmorphological types by systems like the SMC, M33, andNGC 205 (Groenewegen 2002; Mouhcine & Lancon 2003;Cioni & Habing 2003). It is noteworthy, though, that theM31 dwarf galaxy satellites And VII and NGC 147 (Bat-tinelli & Demers 2004a; Harbeck et al. 2004) fall near
our M31 halo and Stream fields in this plot8. NGC 147is an M31 dwarf elliptical satellite, devoid of dust andgas (Grebel et al. 2003), that exhibits a star formationhistory similar to the Magellanic Clouds or the GalacticdSphs Fornax and Leo I (Harbeck et al. 2004) in that itis massive enough to form stars over most of its life time(MV =15.1). The M31 dSph companion And VII (Grebel& Guhathakurta 1999), on the other hand, is differentfrom the remainder of the M31 dSphs in that it experi-enced prolonged star formation and it shows a predomi-nant intermediate-age population of the order of 3–5 Gyr(Harbeck et al. 2004). These galaxies and our halo valuealso lie along lines of similar star formation histories, asindicated by the models by Mouhcine & Lancon (2003;black lines in Fig. 8), in particular those that are charac-terized by a higher dominance of the younger populations(solid and long-dashed lines). The agreement of our C/Mratio in the M31 halo with those of NGC 147 and AndVII is then consistent with the interpretation that such(dSph and dE) galaxies are likely connected to some ofthe distinct merger features in M31; the structures andmean stellar metallicites of these features (Ferguson etal. 2002; Harbeck et al. 2004) are further consistentwith this picture.Owing to the pre-selection criteria for the present spec-
troscopic sample, we cannot exclude the possibility thatwe have underestimated the number of M-type AGBstars (Sect. 4.3.3). Under realistic assumptions, however,we showed that the C/M5+ ratio is unlikely to be sig-nificantly larger than 1.0, unless we missed a substantialC-star population in our sample. This value is then stilllower than expected from a SMC-type population andrather similar to the other M31 dwarf elliptical satellite,NGC 185. In order to reach a C/M ratio as high as pre-dicted by the models of Mouhcine & Lancon (2003) atthe given halo metallicity, M31’s AGB-fraction, fAGB,would have to be remarkably low, of the order of . 2%.Moreover, only if our survey was 100% incomplete at thebright end could we attain SMC-like C/M ratios of ∼3(following our methodology in Sect. 4.3.3.).Prior surveys of the M31 disk, extending to 40 kpc
where the halo likely dominates, find compelling evidencethat the C/M5+ fraction actually drops at the boundaryof the disk (Demers & Battinelli 2005). The G1 cloud ofFerguson et al. (2002), once thought to be the likely rem-nant of a dwarf spheroidal satellite, exhibits a C/M5+ratio typical of our halo fields. Deep HST observations(Brown et al. 2003, 2006, 2007, 2008; Richardson etal. 2009), find a widespread intermediate age populationin the M31 halo, while Kalirai et al. (2006) and K08both find evidence of a metal poor outer halo in M31.Low metallicity and a strong intermediate age popula-tion would appear to be strong factors favoring a largecarbon star population. Indeed, this appears to be thecase for the Galactic dwarf spheroidals (e.g., Azzopardiet al. 1985,1986; Groenewegen 1999; Demers & Battinelli2002). However, the Galactic halo does not appear to becomprised of the debris of such systems with major C-star populations. Even if the parent systems disrupted,
8 Nowotny et al. (2003) measure a C/M5+ ratio for NGC 147that is higher by an order of magnitude than the value in Harbecket al. (2004), which may be due to the different areas betweenthese studies.
The late-type stellar content of the M31 halo 9
the carbon-rich stars should have survived in the halofield (see Ibata et al. 2001b for the Sgr dwarf).We are left to conclude that two factors may decrease
the expected numbers of carbon stars. First, the agedistribution in the outer halo may be tilted toward olderstars. However, in the G1 clump (at a projected distanceof 34 kpc), there is evidence that the field has a strongintermediate-age component (Rich et al. 2004; Faria etal. 2007) and also an HST field at 35 kpc was shownto contain ∼1/3 of stars younger than 10 Gyr (Brown etal. 2008). The second explanation would argue that thehalo is too metal rich to support a substantial populationof C-stars. However, both Kalirai et al. (2006) and K08agree that [Fe/H]∼ −1.5 and lower at large distances, avalue that is low enough to support carbon star produc-tion; moreover, there is a dispersion in metallicity with ametal rich tail high enough to spawn M giants. Consid-ering that the origin of this metal rich tail must arise inmergers, the absence of a strong carbon star populationin the outer halo must be considered to be noteworthy.Therefore, the low C/M ratio in the M31 field is incon-sistent with a presumed disk-like or dwarf galaxy origin(with properties like those indicated in Fig. 8) of thosehalo fields over a broad radial extent. Although the to-tal numbers of stars are low in the halo, the C/M ratioshould be preserved.The cool M-giants with detectable TiO, on the other
hand, are found throughout the halo, further strength-ening the case for a widespread population with [Fe/H]>−1, even for the most distant giants. Further, stars withmeasureable TiO follow the same kinematics as is foundfor all giants with measurable radial velocities. Both re-garding all M stars and with respect to the C/M ratio (asmeasured by our very small numbers) the giant streamappears to harbor no special stellar population, in con-trast to what has been found for the Sgr dwarf spheroidal
galaxy (Ibata et al. 2001b), which does have a concen-tration of carbon stars.With the explosive discovery of numerous streams and
stellar systems in the halo, the picture of the halo pop-ulation comprised nearly entirely of stellar subsystemshas become the canon. Yet well constructed surveys ofour Milky Way halo (e.g. Mauron et al. 2008) find onlya handful of luminous carbon stars. If indeed halos aredominated by debris, as cannot ruled out from a dy-namical standpoint, they are not similar in populationto the SMC, NGC 6822, or M33. If we appeal to thedisruption of a disk-like galaxy to have created the giantstream (e.g., bearing on the model of Fardal et al. 2008),that progenitor was especially devoid of carbon stars andmore closely resembled NGC 147 rather than M33. Inthe broader picture, the late-type stellar content of theM31 halo must be judged to differ from that of the dwarfgalaxies that one might propose to have contributed itsstars.
We would like to thank M.-R. Cioni for helpful discus-sions and an anonymous referee for a constructive report.AK acknowledges support by an STFC postdoctoral fel-lowship. Support was provided by NSF (AST-0307931,AST-0709479), HST (GO-10265, 10816), and by R.M.Rich. Some of the data presented herein were obtainedusing the W. M. Keck Observatory, which is operatedas a scientific partnership among Caltech, the Universityof California, and NASA. The Observatory was madepossible by the generous financial support of the W. M.Keck Foundation. This research used the facilities of theCanadian Astronomy Data Centre operated by the Na-tional Research Council of Canada with the support ofthe Canadian Space Agency.
APPENDIX
Here we show the TCDs separately for different observing runs and different targeted fields in order to test forphotometric homogeneity, as discussed in Sect. 4.3.2.
REFERENCES
Armandroff, T. E., Da Costa, G. S., Caldwell, N., & Seitzer, P.1993, AJ, 106, 986
Azzopardi, M., Lequeux, J., & Westerlund, B. E. 1986, A&A,161, 232
Azzopardi, M., Lequeux, J., & Westerlund, B. E. 1985, A&A,144, 388
Battinelli, P., Demers, S., & Letarte, B. 2003, AJ, 125, 1298Battinelli, P., & Demers, S. 2004a, A&A, 418, 33Battinelli, P., & Demers, S. 2004b, A&A, 416, 111Battinelli, P., & Demers, S. 2005, A&A, 430, 905Belokurov, V., et al. 2007a, ApJ, 658, 337Belokurov, V., et al. 2007b, ApJ, 654, 897Blanco, V. M., McCarthy, M. F., & Blanco, B. M. 1984, AJ, 89,
636Brewer, J. P., Richer, H. B., & Crabtree, D. R. 1995, AJ, 109,
2480Brewer, J. P., Richer, H. B., & Crabtree, D. R. 1996, AJ, 112, 491Brown, T. M., Ferguson, H. C., Smith, E., Kimble, R. A.,
Sweigart, A. V., Renzini, A., Rich, R. M., & VandenBerg,D. A. 2003, ApJ, 592, L17
Brown, T. M., Smith, E., Ferguson, H. C., Rich, R. M.,Guhathakurta, P., Renzini, A., Sweigart, A. V., & Kimble,R. A. 2006, ApJ, 652, 323
Brown, T. M., et al. 2007, ApJ, 658, L95Brown, T. M., et al. 2008, ApJ, 685, L121
Chou, M.-Y., et al. 2007, ApJ, 670, 346Cioni, M.-R. L., & Habing, H. J. 2003, A&A, 402, 133Cioni, M.-R. L., et al. 2008, A&A, 487, 131Cook, K. H., Aaronson, M., & Norris, J. 1986, ApJ, 305, 634Cook, K. H., & Aaronson, M. 1989, AJ, 97, 923Demers, S., & Battinelli, P. 2002, AJ, 123, 238Demers, S., & Battinelli, P. 2005, A&A, 436, 91Durrell, P. R., Harris, W. E., & Pritchet, C. J. 2001, AJ, 121,
2557Fardal, M. A., Babul, A., Geehan, J. J., & Guhathakurta, P.
2006, MNRAS, 366, 1012Fardal, M. A., Babul, A., Guhathakurta, P., Gilbert, K. M., &
Dodge, C. 2008, ApJ, 682, L33Faria, D., Johnson, R. A., Ferguson, A. M. N., Irwin, M. J.,
Ibata, R. A., Johnston, K. V., Lewis, G. F., & Tanvir, N. R.2007, AJ, 133, 1275
Fellhauer, M., et al. 2006, ApJ, 651, 167Ferguson, A. M. N., Irwin, M. J., Ibata, R. A., Lewis, G. F., &
Tanvir, N. R. 2002, AJ, 124, 1452Fiorucci, M., & Munari, U. 2003, A&A, 401, 781Gilbert, K. M., et al. 2006, ApJ, 652, 1188Grebel, E. K., & Guhathakurta, P. 1999, ApJ, 511, L101Grebel, E. K., Gallagher, J. S., III, & Harbeck, D. 2003, AJ, 125,
1926
10 A. Koch & R.M. Rich
V − I
81 −
77
(C
N −
TiO
)C−Stars
M−Stars
H13s, H11 (September 2004)
C/M = 0.1
0 0.5 1 1.5 2 2.5 3 3.5
−1
−0.5
0
0.5
1
V − I
81 −
77
(C
N −
TiO
)
C−Stars
M−Stars
f109, f115, f116, f123, f135, f130_1 (August 2005)
C/M = 0.13
0 0.5 1 1.5 2 2.5 3 3.5
−1
−0.5
0
0.5
1
V − I
81 −
77
(C
N −
TiO
)
C−Stars
M−Stars
f130_2, f130_3, mask4 (November 2006)
C/M = 0
0 0.5 1 1.5 2 2.5 3 3.5
−1
−0.5
0
0.5
1
V − I
81 −
77
(C
N −
TiO
)
C−Stars
M−Stars
H13s, H11 (September 2004)
0 0.5 1 1.5 2 2.5 3 3.5
−1
−0.5
0
0.5
1
V − I
81 −
77
(C
N −
TiO
)
C−Stars
M−Stars
f109, f115, f116, f123, f135, f130_1 (August 2005)
0 0.5 1 1.5 2 2.5 3 3.5
−1
−0.5
0
0.5
1
V − I
81 −
77
(C
N −
TiO
)
C−Stars
M−Stars
f130_2, f130_3, mask4 (November 2006)
0 0.5 1 1.5 2 2.5 3 3.5
−1
−0.5
0
0.5
1
Fig. 9.— Same as Fig. 4, but separately for each of the three observing runs that covered the inner halo fields (R<20 kpc) and that hashomogenous photometry from the MegaCam survey. Shown at the top are giants and the bottom panels are for foreground dwarfs. To aidthe comparison of the diagrams, we also show in grayscale the individual number distributions.
Groenewegen, M. A. T. 2002, in Chemical Evolution of DwarfGalaxies, Ringberg Workshop (arXiv:astro-ph/0208449)
Gwyn, S. D. J. 2008, PASP, 120, 212Harbeck, D., Gallagher, J. S., III, & Grebel, E. K. 2004, AJ, 127,
2711Ibata, R., Irwin, M., Lewis, G., Ferguson, A. M. N., & Tanvir, N.
2001a, Nature, 412, 49Ibata, R., Irwin, M., Lewis, G. F., & Stolte, A. 2001b, ApJ, 547,
L133Ibata, R., Martin, N. F., Irwin, M., Chapman, S., Ferguson,
A. M. N., Lewis, G. F., & McConnachie, A. W. 2007, ApJ, 671,1591
Iben, I., Jr., & Renzini, A. 1983, ARA&A, 21, 271Kalirai, J. S., et al. 2006, ApJ, 648, 389Kerschbaum, F., Nowotny, W., Olofsson, H., & Schwarz, H. E.
2004, A&A, 427, 613Koch, A., et al. 2008, ApJ, 689, 958 (K08)Law, D. R., Johnston, K. V., & Majewski, S. R. 2005, ApJ, 619,
807Letarte, B., Demers, S., Battinelli, P., & Kunkel, W. E. 2002, AJ,
123, 832Lianou, S., Grebel, E.K., & Koch, A. 2010, A&A, in press
(arXiv:1003.0861)
Majewski, S. R., Ostheimer, J. C., Patterson, R. J., Kunkel,W. E., Johnston, K. V., & Geisler, D. 2000, AJ, 119, 760
Marigo, P., Girardi, L., Bressan, A., Groenewegen, M. A. T.,Silva, L., & Granato, G. L. 2008, A&A, 482, 883
Martinez-Delgado, D., & Aparicio, A. 1997, ApJ, 480, L107Mauron, N. 2008, A&A, 482, 151Mori, M., & Rich, R. M. 2008, ApJ, 674, L77Moro, D., & Munari, U. 2000, A&AS, 147, 361Mouhcine, M., & Lancon, A. 2003, MNRAS, 338, 572Mould, J., & Aaronson, M. 1979, ApJ, 232, 421Nowotny, W., Kerschbaum, F., Schwarz, H. E., & Olofsson, H.
2001, A&A, 367, 557Nowotny, W., Kerschbaum, F., Olofsson, H., & Schwarz, H. E.
2003, A&A, 403, 93Ostheimer, J. C. J. 2003, Ph.D. Thesis, University of VirginaPalma, C., Majewski, S. R., Siegel, M. H., Patterson, R. J.,
Ostheimer, J. C., & Link, R. 2003, AJ, 125, 1352Rich, R. M., Reitzel, D. B., Guhathakurta, P., Gebhardt, K., &
Ho, L. C. 2004, AJ, 127, 2139
Richardson, J. C., et al. 2008, AJ, 135, 1998Richardson, J. C., et al. 2009, MNRAS, 396, 1842Searle, L., & Zinn, R. 1978, ApJ, 225, 357Stanek, K. Z., & Garnavich, P. M. 1998, ApJ, 503, L131Totten, E. J., Irwin, M. J., & Whitelock, P. A. 2000, MNRAS,
314, 630
The late-type stellar content of the M31 halo 11
V − I
81 −
77
(C
N −
TiO
)
C−Stars
M−Stars
All MegaCam fields
C/M = 0.1
0 0.5 1 1.5 2 2.5 3 3.5
−1
−0.5
0
0.5
1
V − I
81 −
77
(C
N −
TiO
)
C−Stars
M−Stars
All Washington fields
C/M = 0.09
0 0.5 1 1.5 2 2.5 3 3.5
−1
−0.5
0
0.5
1
V − I
81 −
77
(C
N −
TiO
)
C−Stars
M−Stars
All MegaCam fields
0 0.5 1 1.5 2 2.5 3 3.5
−1
−0.5
0
0.5
1
V − I
81 −
77
(C
N −
TiO
)
C−Stars
M−Stars
All Washington fields
0 0.5 1 1.5 2 2.5 3 3.5
−1
−0.5
0
0.5
1
Fig. 10.— Same as Fig. 9, but separately for all fields based on the pre-selection from MegaCam photometry (left panels) versus all outerfields in which the spectroscopic targets have been selected from Washington photometry (right).
Related Documents