Understanding Anglers’ Preferences for Fishing Tournament Characteristics and Policies Chi-Ok Oh Robert B. Ditton Robin Riechers Received: 9 January 2006 / Accepted: 12 December 2006 Ó Springer Science+Business Media, LLC 2007 Abstract Saltwater fishing tournaments in the United States are generally not regulated nor are there different fishing regulations for tournament and nontournament an- glers. Although much is known about those who participate in fishing tournaments in terms of their fishing motivations, attitudes, and characteristics, much less is known at the angler population level regarding their preferences for tournament opportunities. Using a stated preference choice model with hypothetical scenarios to simulate participation choices and understand preferences, study objectives were to identify angler preferences for various types of tourna- ment fishing ‘‘products.’’ Four tournament policy charac- teristics were investigated: promotion of catch and release, bait restrictions, whether a percentage of the tournament entrance fee should go to support fishery management activities, and whether a tournament should be a nonprofit or profit-making venture. Three expectation attributes were inserted: tournament size, trip cost per day, and whether a tournament is family friendly. We sent seven different versions of the mail questionnaire to 1,633 anglers. Of 795 returns, 648 were used for estimating conditional logit models. Analysis indicated that a scenario with no man- agement interventions was not most preferred. Anglers most preferred a conservation-oriented option that intro- duced additional management measures. Overall, scenarios with management interventions were more favored than the status quo situation (with no management interventions). Although respondents showed reluctance to adopt other management-related options, results generally indicated they were increasingly concerned with sustainability of fish stocks and potential conflicts between tournament and nontournament users and preferred tournament products that reflect these concerns. Keywords Management preferences Recreational fishing Stated preference choice model Recreational fishing Tournament fishing The number of marine recreational fishing tournaments has increased dramatically in recent years. In Texas, as Christian and Trimm (1986) reported, nearly one half of the 56 saltwater tournament events documented in 1983 were 1 to 3 years old. A recent 2003 inventory by the Texas Parks and Wildlife Department (TPWD) revealed 183 tournaments (or a 227% increase since 1983) (personal communication, J. Leitz, 2006). Although comprehensive data were not available nationwide on the current number and growth of saltwater fishing tournaments, the trend is likely much the same as in Texas. Fishing tournaments have been and continue to be a controversial use of saltwater fishery resources for several reasons (Schmied 1994; Williams 1984). First, only a small minority (14%) of saltwater anglers participate ‡1 d/y in competitive fishing events (Anderson & Ditton 2003). However, these anglers constitute a managerially signifi- cant group because of their numbers (Falk and others 1989), presumed dedication to fishing (Ditton & Loomis Chi-Ok Oh (&) Department of Parks, Recreation, and Tourism Management, Clemson University, Clemson, SC 29634-0735, USA e-mail: [email protected] R. B. Ditton Department of Wildlife and Fisheries Sciences, Texas A & M University, College Station, TX 77843-2258, USA R. Riechers Coastal Fisheries Division, Texas Parks and Wildlife Department, 4200 Smith School Road, Austin, TX 78744, USA 123 Environ Manage (2007) 40:123–133 DOI 10.1007/s00267-006-0010-7

Welcome message from author
This document is posted to help you gain knowledge. Please leave a comment to let me know what you think about it! Share it to your friends and learn new things together.
Transcript
Understanding Anglers’ Preferences for Fishing TournamentCharacteristics and Policies
Chi-Ok Oh Æ Robert B. Ditton Æ Robin Riechers
Received: 9 January 2006 / Accepted: 12 December 2006
� Springer Science+Business Media, LLC 2007
Abstract Saltwater fishing tournaments in the United
States are generally not regulated nor are there different
fishing regulations for tournament and nontournament an-
glers. Although much is known about those who participate
in fishing tournaments in terms of their fishing motivations,
attitudes, and characteristics, much less is known at the
angler population level regarding their preferences for
tournament opportunities. Using a stated preference choice
model with hypothetical scenarios to simulate participation
choices and understand preferences, study objectives were
to identify angler preferences for various types of tourna-
ment fishing ‘‘products.’’ Four tournament policy charac-
teristics were investigated: promotion of catch and release,
bait restrictions, whether a percentage of the tournament
entrance fee should go to support fishery management
activities, and whether a tournament should be a nonprofit
or profit-making venture. Three expectation attributes were
inserted: tournament size, trip cost per day, and whether a
tournament is family friendly. We sent seven different
versions of the mail questionnaire to 1,633 anglers. Of 795
returns, 648 were used for estimating conditional logit
models. Analysis indicated that a scenario with no man-
agement interventions was not most preferred. Anglers
most preferred a conservation-oriented option that intro-
duced additional management measures. Overall, scenarios
with management interventions were more favored than the
status quo situation (with no management interventions).
Although respondents showed reluctance to adopt other
management-related options, results generally indicated
they were increasingly concerned with sustainability of fish
stocks and potential conflicts between tournament and
nontournament users and preferred tournament products
that reflect these concerns.
Keywords Management preferences � Recreationalfishing � Stated preference choice model � Recreationalfishing � Tournament fishing
The number of marine recreational fishing tournaments has
increased dramatically in recent years. In Texas, as
Christian and Trimm (1986) reported, nearly one half of
the 56 saltwater tournament events documented in 1983
were 1 to 3 years old. A recent 2003 inventory by the Texas
Parks and Wildlife Department (TPWD) revealed 183
tournaments (or a 227% increase since 1983) (personal
communication, J. Leitz, 2006). Although comprehensive
data were not available nationwide on the current number
and growth of saltwater fishing tournaments, the trend is
likely much the same as in Texas.
Fishing tournaments have been and continue to be a
controversial use of saltwater fishery resources for several
reasons (Schmied 1994; Williams 1984). First, only a small
minority (14%) of saltwater anglers participate ‡1 d/y in
competitive fishing events (Anderson & Ditton 2003).
However, these anglers constitute a managerially signifi-
cant group because of their numbers (Falk and others
1989), presumed dedication to fishing (Ditton & Loomis
Chi-Ok Oh (&)
Department of Parks, Recreation, and Tourism Management,
Clemson University, Clemson, SC 29634-0735, USA
e-mail: [email protected]
R. B. Ditton
Department of Wildlife and Fisheries Sciences, Texas A & M
University, College Station, TX 77843-2258, USA
R. Riechers
Coastal Fisheries Division, Texas Parks and Wildlife
Department, 4200 Smith School Road, Austin, TX 78744, USA
123
Environ Manage (2007) 40:123–133
DOI 10.1007/s00267-006-0010-7
1985), ability to catch fish, and likelihood of greater
involvement in fishery management activities than non-
tournament anglers. In contrast to tournament participants,
most anglers do not view recreational fishing in competi-
tive terms and hence do not share the values held by
tournament anglers (Loomis & Ditton 1987). Second, some
tournament events are run as profit-making businesses that
provide financial returns to fee-paying participants but
make use of public fishery resources at no cost to event
organizers. All anglers in Texas (as in many other states)
must be licensed to fish in saltwater and hence contribute to
fishery management costs. However, tournaments are not
generally licensed or charged fees above and beyond those
borne by the individuals who purchase licenses. In states
without a saltwater fishing license, neither anglers nor
tournament events are required to help cover the costs of
fishery management. Third, because the number of tour-
naments is likely increasing, there has been pressure on
state agencies to establish permit systems for purposes of
knowing the temporal and spatial distributions of tourna-
ment events in state waters in support of their fishery
management responsibilities. Fourth, although the local
and regional economic impacts of saltwater fishing tour-
naments are well documented (Ditton and others 1999a,
1999b; Thailing and others 2001), there is increasing
concern for possible social and biological costs of tourna-
ment events. This is difficult for fisheries management
agencies because they, too, are in the ‘‘recreation and
tourism business’’ and seek to generate state and regional
economic impacts while maintaining resource quality. In
this regard, they also have responsibilities for providing
new fishing opportunities on a fair and equitable basis
(Loomis & Ditton 1993). Accordingly, fishery managers
want to know to what extent various tournament charac-
teristics and policies are preferred by tournament anglers as
well as by those who are not tournament participants but
who could participate under the right circumstances.
Along with the goals of protecting and managing fishery
resources on a sustainable basis, some management agen-
cies also seek to provide anglers with a diversity of fishing
‘‘products’’ to help increase overall angler satisfaction.
Although the rate of tournament participation (percent of
anglers who participate in tournaments), fishing motiva-
tions, attitudes, and sociodemographic characteristics are
known (Antia and others 2002; Falk and others 1989),
much less is known at the angler-population level in terms
of understanding their overall preferences for tournament
opportunities currently being provided or that could be
provided. Such a study, if undertaken, would likely use a
traditional opinion measurement research design whereby
anglers would be asked to indicate their level of support
for or opposition to various tournament characteristics
and policies in use or contemplated. Such an approach,
however, would likely yield little insight to the relative
importance of each tournament policy option. Anglers
would likely respond to all of the various options in a
socially acceptable way with no insight to the tradeoffs
they may be willing to make when considering tournament
options jointly.
Instead, a stated preference choice model (SPCM)
makes use of hypothetical scenarios to simulate participa-
tion choices and better understand preferences. This tech-
nique assumes that complex decisions involve several
factors being considered simultaneously. Based on this
rational assumption, SPCMs allow for an understanding of
the relationship of multiple factors as they contribute to
preferences or choice behavior (Louviere and others 2000;
Louviere & Timmermans 1990). Whereas SPCMs have
been used previously to understand consumer preferences
for a variety of new multiattribute recreational fishing
products and services, they have not been used to under-
stand consumer preferences for various aspects of saltwater
fishing tournaments.
Two previous studies have used an SPCM to have an-
glers indicate their preferred trips making use of various
characteristics. First, Aas and others (2000) used an SPCM
to study anglers’ responses to various trip profiles (three
harvest variables and two expectation variables to explore
group differences). They found major choice differences
between angler groups based on gear use (fly-only, general,
and nonfly anglers). Although the status quo condition was
more favorable to nonfly anglers, fly-only anglers were
more likely to support regulation changes than other
groups. The preference differences in harvest regulations
suggested that conflict and dissatisfaction could be re-
solved by spatial segregation of the angler segments (i.e.,
use of zoning). Second, Oh and others (2005) investigated
the choices that red drum (Sciaenops ocellatus) anglers
made between hypothetical fishing trips as defined by four
harvest regulations and three fishing expectation variables
(including trip costs) and ranked the various management
scenarios being considered. Not surprisingly, the status quo
management scenario (with the most conservative harvest
restrictions) was least preferred by anglers and the most
liberal harvest restriction scenario was most preferred.
When anglers’ fishing expectations were taken into
account, however, anglers likely wanted more strict man-
agement that closely resembled the status quo management
option. They were willing to relax certain management
regulations but overall were guided more by conservation
than exploitation.
Although most states have left the matter of tournament
formats to private sector providers, some management
agencies, i.e., TPWD, want to encourage more fishery-
conservation practices in fishing tournaments and event
characteristics that are preferred by a broader cross-section
124 Environ Manage (2007) 40:123–133
123
of anglers (including current participants and those not now
participating in tournament events). Management officials
wanted to know the extent to which various event char-
acteristics and policies were preferred by the angling
community. In particular, they wanted to know which
tournament policies and characteristics were most and least
preferred before any policy decision-making efforts were
undertaken. Overall, they sought to enhance the positive
aspects of tournaments, decrease the negative aspects of
tournament events, and make them attractive overall to
more anglers. The purpose of this article is to (1) under-
stand the underlying rationale for anglers making trade-offs
in multiattribute tournament trip profiles associated with
various event characteristics and policies and (2) identify
the differences in concerns and preference for management
of tournament fishing based on previous tournament par-
ticipation (i.e., tournament anglers and nontournament
anglers). In doing so, we sought to provide managers with a
means for making pragmatic decisions (Nielsen 1985) that
maximize angler satisfaction consistent with their more
traditional fishery management responsibilities.
Methods
The methods section includes some background on the
selection of model attributes and levels, SPCMs in general,
and survey design considerations. The basic steps for using
an SPCM include identifying the important management
attributes; allocating appropriate levels to each attribute;
generating choice sets with identified attributes and levels;
presenting scenarios and acquiring responses from target
samples; and analyzing the preferences and management
program with an appropriate model. In the following sec-
tions, we provide insight and details for each step in
implementing a stated preference discrete choice model.
Identification of Attributes and Levels
The first step in developing an SPCM requires the selection
of tournament angler preference attributes and respective
levels. Relevant attributes and levels were identified from
open-ended comments provided by nontournament anglers
in previous statewide angler surveys (e.g., Anderson &
Ditton 2003) as well as from previous studies of tourna-
ment anglers and their fishing behavior, preferences, and
expenditures (e.g., Ditton & Loomis 1985; Loomis &
Ditton 1987). We also met with fisheries managers to better
understand angler preferences in light of current or future
management regulations. Four tournament selection char-
acteristics were identified as relevant policy attributes to
anglers: (1) promotion of catch and release, (2) bait
restriction, (3) whether a percentage of the tournament
entrance fee should go to support fishery management
activities, and (4) whether a tournament is a nonprofit or a
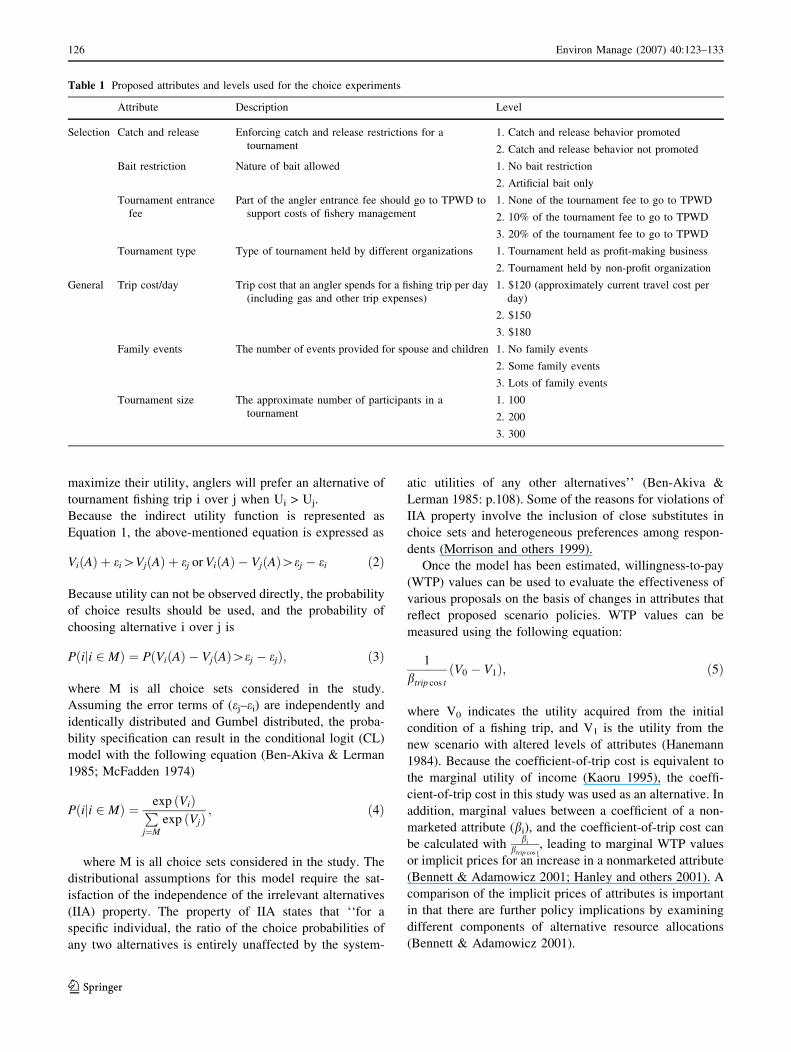
profit-making venture. A detailed description of the levels
of each attribute is listed in Table 1. Two or three levels
were assigned to each attribute to describe the particular
policy options involved.
The insertion of general expectation attributes was
beneficial in that attributes beyond agency control (such as
trip cost, including tournament fees and other trip ex-
penses, and attributes related to tournament size and
structure) were likely important to anglers’ decision mak-
ing regarding their participation in fishing tournaments
(Aas and others 2000; Fedler 1998; Gillis & Ditton 2002;
Oh and others 2005). Consequently, issues such as tour-
nament size, trip cost per day, and whether or not a tour-
nament is family friendly were integrated into the study
design. Revisions of levels and attributes were made as a
result of feedback from a series of pretests with anglers in
local fishing clubs. The goal of pretesting was to determine
whether the attributes used were significantly meaningful
to respondents as well as whether the range of levels for
each attribute was sufficiently substantial to reflect all of
the policy options considered (Bennett & Adamowicz
2001)
Model
The choice experiment model (or SPCM) was originally
developed in transportation choice research (Hensher 1994;
Louviere, 1988a) and later extended and further refined
in marketing and environmental studies (Ben-Akiva &
Lerman 1985; Louviere 1988b; Louviere and others 2000).
The SPCM is derived from well-grounded random utility
theory, which indicates that individuals make choices
to maximize utility (i.e., random utility maximization)
(Louviere 2000, 2001; Louviere and others 2000).
Based on obtained preferences, utility can be estimated
using the indirect utility function, which is comprised of a
deterministic component and a random error component
(Louviere 1988b; Louviere and others 2000). A determin-
istic component can be estimated to represent the vector of
coefficients of levels and attributes to obtain the part-worth
utilities for attributes. The indirect utility function of a
representative angler on a choice of fishing trip j can be
represented as
[Uj ¼ VjðAÞ þ ej ¼ lA0b þ ej; ð1Þ
where Uj is the utility of an alternative fishing trip j, Vj is
the deterministic component of utility to be estimated, and
ej is the unobservable error component of utility; l, a
scale parameter, is normally assumed to be 1. Because it
is rationally assumed that individuals always seek to
Environ Manage (2007) 40:123–133 125
123
maximize their utility, anglers will prefer an alternative of
tournament fishing trip i over j when Ui > Uj.
Because the indirect utility function is represented as
Equation 1, the above-mentioned equation is expressed as
ViðAÞ þ ei[VjðAÞ þ ej orViðAÞ � VjðAÞ[ej � ei ð2Þ
Because utility can not be observed directly, the probability
of choice results should be used, and the probability of
choosing alternative i over j is
Pðiji 2 MÞ ¼ PðViðAÞ � VjðAÞ[ej � ejÞ; ð3Þ
where M is all choice sets considered in the study.
Assuming the error terms of (ej–ei) are independently and
identically distributed and Gumbel distributed, the proba-
bility specification can result in the conditional logit (CL)
model with the following equation (Ben-Akiva & Lerman
1985; McFadden 1974)
Pðiji 2 MÞ ¼ exp ðViÞP
j¼M
exp ðVjÞ; ð4Þ
where M is all choice sets considered in the study. The
distributional assumptions for this model require the sat-
isfaction of the independence of the irrelevant alternatives
(IIA) property. The property of IIA states that ‘‘for a
specific individual, the ratio of the choice probabilities of
any two alternatives is entirely unaffected by the system-
atic utilities of any other alternatives’’ (Ben-Akiva &
Lerman 1985: p.108). Some of the reasons for violations of
IIA property involve the inclusion of close substitutes in
choice sets and heterogeneous preferences among respon-
dents (Morrison and others 1999).
Once the model has been estimated, willingness-to-pay
(WTP) values can be used to evaluate the effectiveness of
various proposals on the basis of changes in attributes that
reflect proposed scenario policies. WTP values can be
measured using the following equation:
1
btrip cos tðV0 � V1Þ; ð5Þ
where V0 indicates the utility acquired from the initial
condition of a fishing trip, and V1 is the utility from the
new scenario with altered levels of attributes (Hanemann
1984). Because the coefficient-of-trip cost is equivalent to
the marginal utility of income (Kaoru 1995), the coeffi-
cient-of-trip cost in this study was used as an alternative. In
addition, marginal values between a coefficient of a non-
marketed attribute (bi), and the coefficient-of-trip cost can
be calculated withbi
btrip cos t, leading to marginal WTP values
or implicit prices for an increase in a nonmarketed attribute
(Bennett & Adamowicz 2001; Hanley and others 2001). A
comparison of the implicit prices of attributes is important
in that there are further policy implications by examining
different components of alternative resource allocations
(Bennett & Adamowicz 2001).
Table 1 Proposed attributes and levels used for the choice experiments
Attribute Description Level
Selection Catch and release Enforcing catch and release restrictions for a
tournament
1. Catch and release behavior promoted
2. Catch and release behavior not promoted
Bait restriction Nature of bait allowed 1. No bait restriction
2. Artificial bait only
Tournament entrance
fee
Part of the angler entrance fee should go to TPWD to
support costs of fishery management
1. None of the tournament fee to go to TPWD
2. 10% of the tournament fee to go to TPWD
3. 20% of the tournament fee to go to TPWD
Tournament type Type of tournament held by different organizations 1. Tournament held as profit-making business
2. Tournament held by non-profit organization
General Trip cost/day Trip cost that an angler spends for a fishing trip per day
(including gas and other trip expenses)
1. $120 (approximately current travel cost per
day)
2. $150
3. $180
Family events The number of events provided for spouse and children 1. No family events
2. Some family events
3. Lots of family events
Tournament size The approximate number of participants in a
tournament
1. 100
2. 200
3. 300
126 Environ Manage (2007) 40:123–133
123
Survey Design
From the listing of 1.4 million resident anglers who pur-
chased a Texas fishing license in fiscal year 2001, a random
sample of 10,000 license holders was selected and an initial
mail survey conducted in spring 2002 (Anderson & Ditton
2003). Because most licensed saltwater anglers (86%) did
not participate in saltwater fishing tournaments, we con-
ducted a follow-up survey of those anglers who fished in
saltwater ‡1 day in the previous 12 months (N = 1633). In
summer 2004, a mail questionnaire using a choice exper-
imental design was sent to these anglers, and they were
asked about their tournament fishing trip preferences and
whether or not they had participated in fishing tournaments
during the previous year.
A fractional factorial design with main effects and two-
way interaction effects was used to generate a manageable
number of 56 choice sets. Because of a concern that
respondents always choose choice set i over choice set j, all
dominant choice sets were deliberately eliminated in the
design stage. Choice sets were then divided into seven
blocks of eight paired choice sets that were uncorrelated
(Bennett & Adamowicz 2001; Hanley and others 1998).
This was considered an effective way to decrease the
number of trip choice sets any one respondent might face.
Thus, seven different versions of the survey questionnaire
were used, each version having eight choice sets. Although
respondents may have a cognitive burden when required to
repeat a number of tasks (Bennett & Blamey 2001), eight
choice sets have been used previously and appears to be
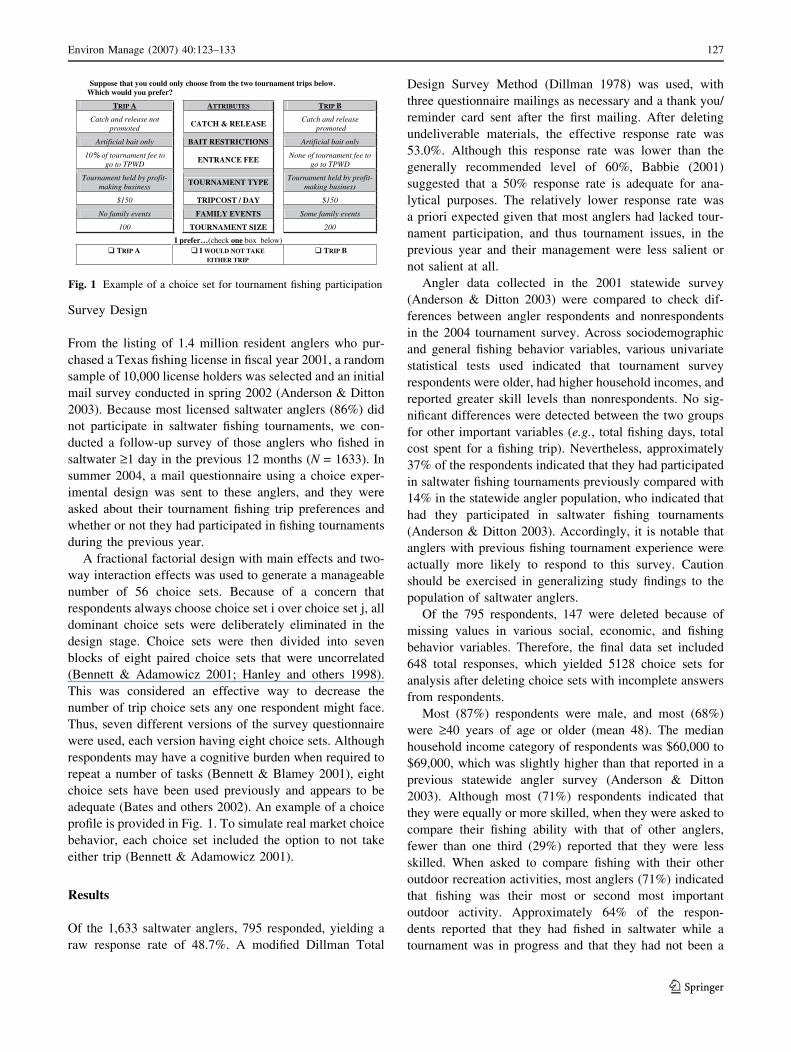
adequate (Bates and others 2002). An example of a choice
profile is provided in Fig. 1. To simulate real market choice
behavior, each choice set included the option to not take
either trip (Bennett & Adamowicz 2001).
Results
Of the 1,633 saltwater anglers, 795 responded, yielding a
raw response rate of 48.7%. A modified Dillman Total
Design Survey Method (Dillman 1978) was used, with
three questionnaire mailings as necessary and a thank you/
reminder card sent after the first mailing. After deleting
undeliverable materials, the effective response rate was
53.0%. Although this response rate was lower than the
generally recommended level of 60%, Babbie (2001)
suggested that a 50% response rate is adequate for ana-
lytical purposes. The relatively lower response rate was
a priori expected given that most anglers had lacked tour-
nament participation, and thus tournament issues, in the
previous year and their management were less salient or
not salient at all.
Angler data collected in the 2001 statewide survey
(Anderson & Ditton 2003) were compared to check dif-
ferences between angler respondents and nonrespondents
in the 2004 tournament survey. Across sociodemographic
and general fishing behavior variables, various univariate
statistical tests used indicated that tournament survey
respondents were older, had higher household incomes, and
reported greater skill levels than nonrespondents. No sig-
nificant differences were detected between the two groups
for other important variables (e.g., total fishing days, total
cost spent for a fishing trip). Nevertheless, approximately
37% of the respondents indicated that they had participated
in saltwater fishing tournaments previously compared with
14% in the statewide angler population, who indicated that
had they participated in saltwater fishing tournaments
(Anderson & Ditton 2003). Accordingly, it is notable that
anglers with previous fishing tournament experience were
actually more likely to respond to this survey. Caution
should be exercised in generalizing study findings to the
population of saltwater anglers.
Of the 795 respondents, 147 were deleted because of
missing values in various social, economic, and fishing
behavior variables. Therefore, the final data set included
648 total responses, which yielded 5128 choice sets for
analysis after deleting choice sets with incomplete answers
from respondents.
Most (87%) respondents were male, and most (68%)
were ‡40 years of age or older (mean 48). The median
household income category of respondents was $60,000 to
$69,000, which was slightly higher than that reported in a
previous statewide angler survey (Anderson & Ditton
2003). Although most (71%) respondents indicated that
they were equally or more skilled, when they were asked to
compare their fishing ability with that of other anglers,
fewer than one third (29%) reported that they were less
skilled. When asked to compare fishing with their other
outdoor recreation activities, most anglers (71%) indicated
that fishing was their most or second most important
outdoor activity. Approximately 64% of the respon-
dents reported that they had fished in saltwater while a
tournament was in progress and that they had not been a
Suppose that you could only choose from the two tournament trips below. Which would you prefer?
TRIP A ATTRIBUTES TRIP B
Catch and release not promoted
CATCH & RELEASE Catch and release
promoted
Artificial bait only BAIT RESTRICTIONS Artificial bait only
10% of tournament fee to go to TPWD
ENTRANCE FEE None of tournament fee to
go to TPWD
Tournament held by profit-making business
TOURNAMENT TYPE Tournament held by profit-
making business
$150 TRIPCOST / DAY $150
No family events FAMILY EVENTS Some family events
100 TOURNAMENT SIZE 200
I prefer…(check one box below) TRIP A I WOULD NOT TAKE
EITHER TRIPTRIP B
Fig. 1 Example of a choice set for tournament fishing participation
Environ Manage (2007) 40:123–133 127
123
participant. When asked to indicate if tournaments nega-
tively affected the quality of their fishing, >74% of anglers
indicated no negative impacts.
CL Results
The parameter estimates of CL models are listed in
Table 2. To test the violation of the IIA property, the
likelihood ratio test between the CL (restricted) model and
the nested logit (unrestricted) model was conducted as well
as a Hausman-type test developed by Hausman and McF-
adden (1984). Although the latter test did not provide a
clear indication of results depending on which base choice
was excluded, the former test, in general, indicated a failure
to reject the null at p <.05 (Greene 2000). Consequently,
estimation results were made using the CL model and
random-parameter logit models, but only estimates of the
former with group segments are reported here because of
its methodologic simplicity. Although the random-param-
eter logit model, (which does not exhibit a concern for the
IIA property) takes into account the heterogeneous pref-
erences of angler clientele, a segmentation approach using
the CL model sufficiently reflects this concern for different
preference structures within the participant groups. This
approach also alleviates the IIA problem by relaxing the
assumption of common preferences (Oh & Ditton 2006).
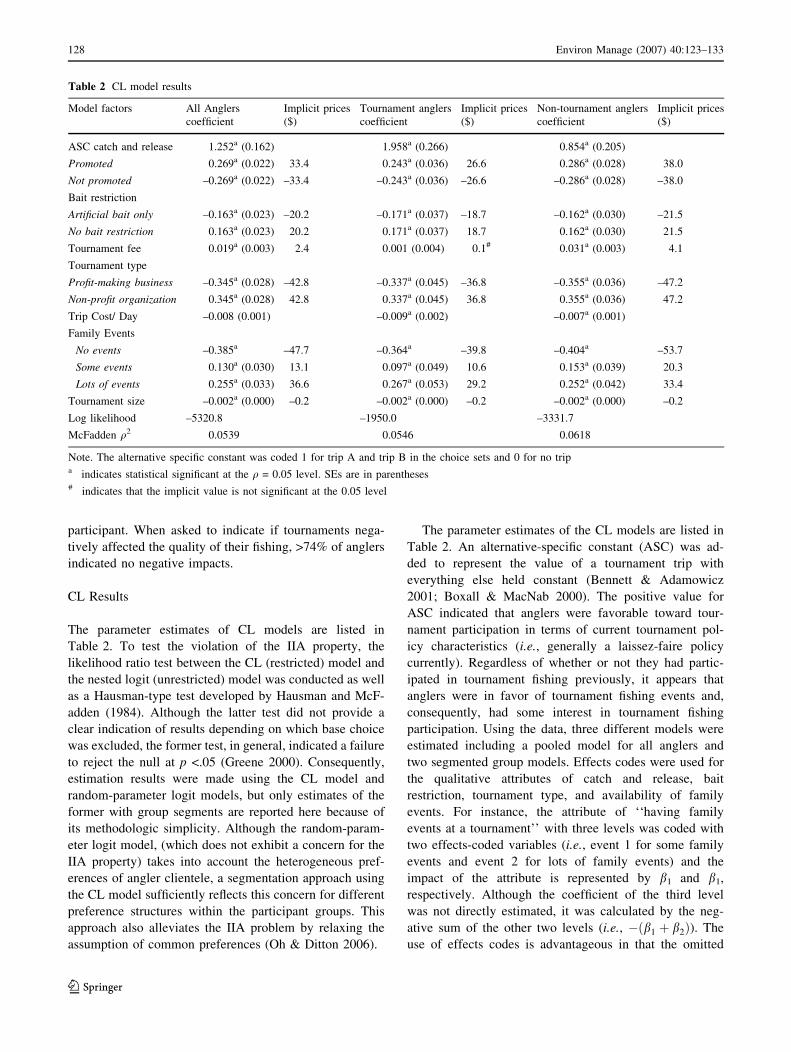
The parameter estimates of the CL models are listed in
Table 2. An alternative-specific constant (ASC) was ad-
ded to represent the value of a tournament trip with
everything else held constant (Bennett & Adamowicz
2001; Boxall & MacNab 2000). The positive value for
ASC indicated that anglers were favorable toward tour-
nament participation in terms of current tournament pol-
icy characteristics (i.e., generally a laissez-faire policy
currently). Regardless of whether or not they had partic-
ipated in tournament fishing previously, it appears that
anglers were in favor of tournament fishing events and,
consequently, had some interest in tournament fishing
participation. Using the data, three different models were
estimated including a pooled model for all anglers and
two segmented group models. Effects codes were used for
the qualitative attributes of catch and release, bait
restriction, tournament type, and availability of family
events. For instance, the attribute of ‘‘having family
events at a tournament’’ with three levels was coded with
two effects-coded variables (i.e., event 1 for some family
events and event 2 for lots of family events) and the
impact of the attribute is represented by b1 and b1,respectively. Although the coefficient of the third level
was not directly estimated, it was calculated by the neg-
ative sum of the other two levels (i.e., �ðb1 þ b2Þ). Theuse of effects codes is advantageous in that the omitted
Table 2 CL model results
Model factors All Anglers Implicit prices Tournament anglers Implicit prices Non-tournament anglers Implicit prices
coefficient ($) coefficient ($) coefficient ($)
ASC catch and release 1.252a (0.162) 1.958a (0.266) 0.854a (0.205)
Promoted 0.269a (0.022) 33.4 0.243a (0.036) 26.6 0.286a (0.028) 38.0
Not promoted –0.269a (0.022) –33.4 –0.243a (0.036) –26.6 –0.286a (0.028) –38.0
Bait restriction
Artificial bait only –0.163a (0.023) –20.2 –0.171a (0.037) –18.7 –0.162a (0.030) –21.5
No bait restriction 0.163a (0.023) 20.2 0.171a (0.037) 18.7 0.162a (0.030) 21.5
Tournament fee 0.019a (0.003) 2.4 0.001 (0.004) 0.1# 0.031a (0.003) 4.1
Tournament type
Profit-making business –0.345a (0.028) –42.8 –0.337a (0.045) –36.8 –0.355a (0.036) –47.2
Non-profit organization 0.345a (0.028) 42.8 0.337a (0.045) 36.8 0.355a (0.036) 47.2
Trip Cost/ Day –0.008 (0.001) –0.009a (0.002) –0.007a (0.001)
Family Events
No events –0.385a –47.7 –0.364a –39.8 –0.404a –53.7
Some events 0.130a (0.030) 13.1 0.097a (0.049) 10.6 0.153a (0.039) 20.3
Lots of events 0.255a (0.033) 36.6 0.267a (0.053) 29.2 0.252a (0.042) 33.4
Tournament size –0.002a (0.000) –0.2 –0.002a (0.000) –0.2 –0.002a (0.000) –0.2
Log likelihood –5320.8 –1950.0 –3331.7
McFadden q2 0.0539 0.0546 0.0618
Note. The alternative specific constant was coded 1 for trip A and trip B in the choice sets and 0 for no tripa indicates statistical significant at the q = 0.05 level. SEs are in parentheses# indicates that the implicit value is not significant at the 0.05 level
128 Environ Manage (2007) 40:123–133
123
levels of attributes are uncorrelated with the intercept of
the model (Holmes & Adamowicz 2003; Louviere and
others 2000).
A goodness-of-fit measure of the pooled model (i.e.,
McFadden’s q2) was 0.054, which could be considered a
relatively low explanatory power. Although this measure is
analogous to the R2 in a conventional regression model
(Greene, 2000), there are no general guidelines for an
acceptable level of McFadden’s q2 (Ben-Akiva & Lerman
1985). All effects of the primary attributes were statisti-
cally significant (p < 0.05) (Table 2). Most attributes had
the expected signs except for promotion of catch-and-re-
lease restrictions (catch and release) as well as the one
designating part of the tournament entrance to the agency
to help defray saltwater fishery management costs (tour-
nament fee). Contrary to initial expectations, anglers pre-
ferred the option of having catch and release promoted in
tournaments compared with the option of no catch and
release in tournaments. Similarly, the positive coefficient
for tournament fee indicated that anglers were in favor of a
percentage of each tournament fee being available to the
agency for fishery management. In both cases, these
expectations were based on current practice among Texas
saltwater tournaments. Also, because most saltwater an-
glers (i.e., 63% in our sample or 86% in the previous state-
wide survey; Anderson & Ditton 2003) had not participated
in tournament events in the previous 12 months, these
unexpected signs may also reflect an increased interest in
or preference for the introduction of new types of fishing
tournaments. The options of artificial bait only (bait
restriction) and tournaments being held as profit-making
businesses (tournament type) were less preferred
(decreasing the choice probability for tournament partici-
pation) compared with the alternative of no bait restriction
and tournaments being held only by nonprofit organiza-
tions, respectively. Likewise, although the number of
family events held during tournaments (family events) was
likely to increase the choice probability for tournament
fishing participation, a strong preference was revealed for
having fewer participants in tournaments (tournament
size). Finally, the negative coefficient of travel cost (trip
cost per day) implies that anglers with higher expenditures
were less likely to participate in tournament fishing, which
coincides with consumer-demand theory.
However, the patterns of angler preferences for the
management options proposed differed between groups for
each specified model (i.e., tournament anglers and non-
tournament anglers). To test whether the parameters were
identical across the segmented models, a likelihood ratio
test of parameter equality (i.e., Chow test) was used. The
results (v2 = 78.25, p £ 0.01) indicated that the null
hypothesis of parameter indifference between two groups
was rejected. Thus, each segmented model is highly likely
to have a heterogeneous structure of underlying indirect
utility functions (Hanley and others 2006).
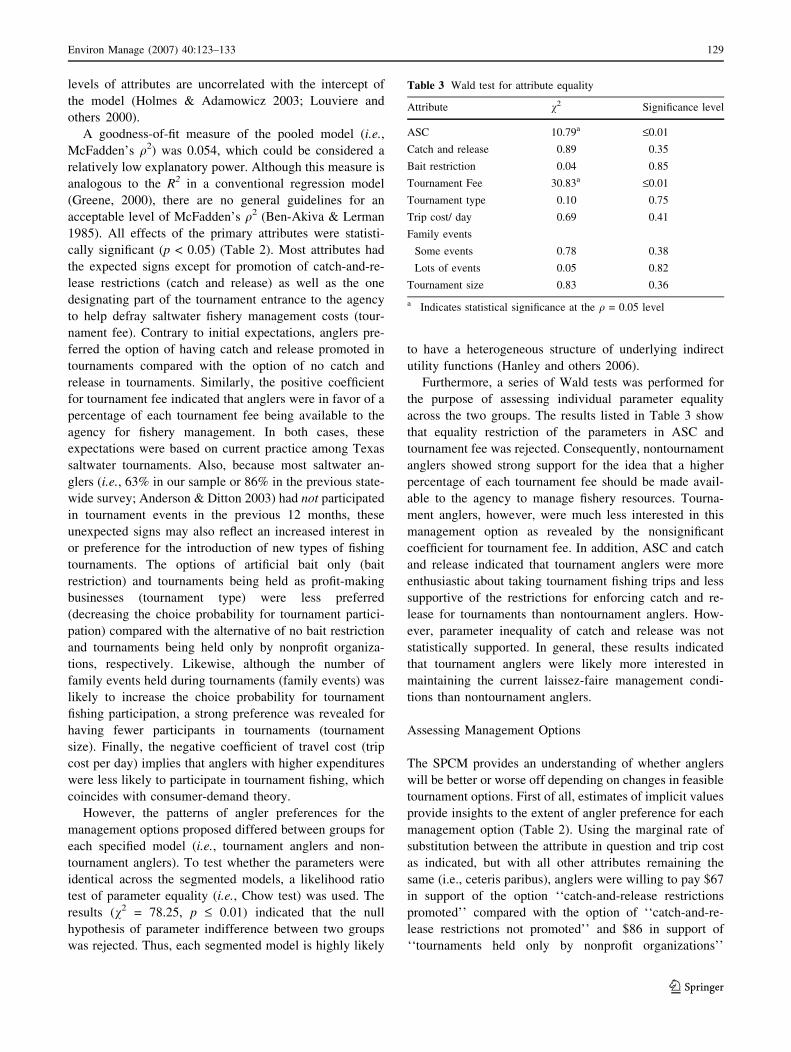
Furthermore, a series of Wald tests was performed for
the purpose of assessing individual parameter equality
across the two groups. The results listed in Table 3 show
that equality restriction of the parameters in ASC and
tournament fee was rejected. Consequently, nontournament
anglers showed strong support for the idea that a higher
percentage of each tournament fee should be made avail-
able to the agency to manage fishery resources. Tourna-
ment anglers, however, were much less interested in this
management option as revealed by the nonsignificant
coefficient for tournament fee. In addition, ASC and catch
and release indicated that tournament anglers were more
enthusiastic about taking tournament fishing trips and less
supportive of the restrictions for enforcing catch and re-
lease for tournaments than nontournament anglers. How-
ever, parameter inequality of catch and release was not
statistically supported. In general, these results indicated
that tournament anglers were likely more interested in
maintaining the current laissez-faire management condi-
tions than nontournament anglers.
Assessing Management Options
The SPCM provides an understanding of whether anglers
will be better or worse off depending on changes in feasible
tournament options. First of all, estimates of implicit values
provide insights to the extent of angler preference for each
management option (Table 2). Using the marginal rate of
substitution between the attribute in question and trip cost
as indicated, but with all other attributes remaining the
same (i.e., ceteris paribus), anglers were willing to pay $67
in support of the option ‘‘catch-and-release restrictions
promoted’’ compared with the option of ‘‘catch-and-re-
lease restrictions not promoted’’ and $86 in support of
‘‘tournaments held only by nonprofit organizations’’
Table 3 Wald test for attribute equality
Attribute v2 Significance level
ASC 10.79a £0.01Catch and release 0.89 0.35
Bait restriction 0.04 0.85
Tournament Fee 30.83a £0.01Tournament type 0.10 0.75
Trip cost/ day 0.69 0.41
Family events
Some events 0.78 0.38
Lots of events 0.05 0.82
Tournament size 0.83 0.36
a Indicates statistical significance at the q = 0.05 level
Environ Manage (2007) 40:123–133 129
123
compared with the option of ‘‘tournaments held by profit-
making business.’’ Furthermore, ignoring the presence of
other effects, anglers were willing to pay approximately $2
to have 10 fewer tournament participants in their event
(Table 2). The same interpretation can be applied to the
estimates of implicit values for each segmentation group.
With all other attributes remaining the same (i.e., ceteris
paribus), tournament anglers were willing to pay $74 in
support of the option ‘‘tournament held only by nonprofit
organization’’ compared with the option of ‘‘tournament
held as profit-making business’’ and $53 in support of the
option ‘‘catch-and-release restrictions promoted’’ com-
pared with the option of ‘‘catch-and-release restrictions not
promoted.’’ However, nontournament anglers were willing
to pay $20 (i.e., implicit value of $94) and $23 (i.e., im-
plicit value of $76) more to acquire the same options of
tournament type and catch and release, respectively, than
their tournament angler counterparts (Table 2).
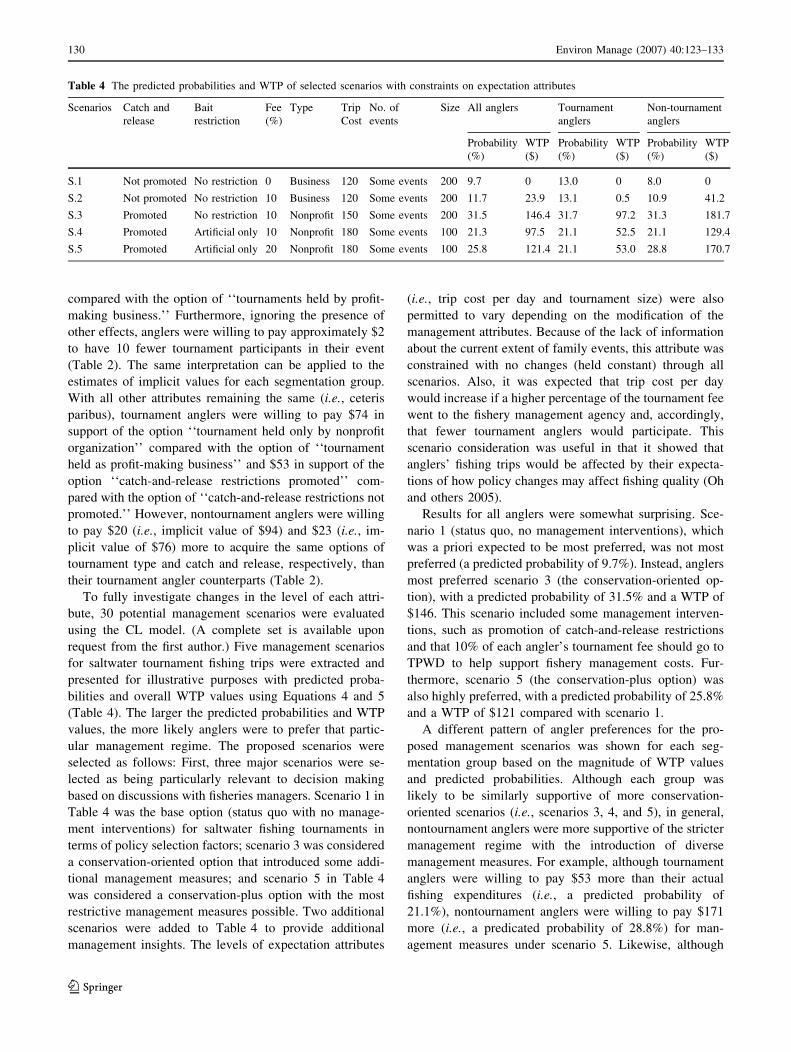
To fully investigate changes in the level of each attri-
bute, 30 potential management scenarios were evaluated
using the CL model. (A complete set is available upon
request from the first author.) Five management scenarios
for saltwater tournament fishing trips were extracted and
presented for illustrative purposes with predicted proba-
bilities and overall WTP values using Equations 4 and 5
(Table 4). The larger the predicted probabilities and WTP
values, the more likely anglers were to prefer that partic-
ular management regime. The proposed scenarios were
selected as follows: First, three major scenarios were se-
lected as being particularly relevant to decision making
based on discussions with fisheries managers. Scenario 1 in
Table 4 was the base option (status quo with no manage-
ment interventions) for saltwater fishing tournaments in
terms of policy selection factors; scenario 3 was considered
a conservation-oriented option that introduced some addi-
tional management measures; and scenario 5 in Table 4
was considered a conservation-plus option with the most
restrictive management measures possible. Two additional
scenarios were added to Table 4 to provide additional
management insights. The levels of expectation attributes
(i.e., trip cost per day and tournament size) were also
permitted to vary depending on the modification of the
management attributes. Because of the lack of information
about the current extent of family events, this attribute was
constrained with no changes (held constant) through all
scenarios. Also, it was expected that trip cost per day
would increase if a higher percentage of the tournament fee
went to the fishery management agency and, accordingly,
that fewer tournament anglers would participate. This
scenario consideration was useful in that it showed that
anglers’ fishing trips would be affected by their expecta-
tions of how policy changes may affect fishing quality (Oh
and others 2005).
Results for all anglers were somewhat surprising. Sce-
nario 1 (status quo, no management interventions), which
was a priori expected to be most preferred, was not most
preferred (a predicted probability of 9.7%). Instead, anglers
most preferred scenario 3 (the conservation-oriented op-
tion), with a predicted probability of 31.5% and a WTP of
$146. This scenario included some management interven-
tions, such as promotion of catch-and-release restrictions
and that 10% of each angler’s tournament fee should go to
TPWD to help support fishery management costs. Fur-
thermore, scenario 5 (the conservation-plus option) was
also highly preferred, with a predicted probability of 25.8%
and a WTP of $121 compared with scenario 1.
A different pattern of angler preferences for the pro-
posed management scenarios was shown for each seg-
mentation group based on the magnitude of WTP values
and predicted probabilities. Although each group was
likely to be similarly supportive of more conservation-
oriented scenarios (i.e., scenarios 3, 4, and 5), in general,
nontournament anglers were more supportive of the stricter
management regime with the introduction of diverse
management measures. For example, although tournament
anglers were willing to pay $53 more than their actual
fishing expenditures (i.e., a predicted probability of
21.1%), nontournament anglers were willing to pay $171
more (i.e., a predicated probability of 28.8%) for man-
agement measures under scenario 5. Likewise, although
Table 4 The predicted probabilities and WTP of selected scenarios with constraints on expectation attributes
Scenarios Catch and
release
Bait
restriction
Fee
(%)
Type Trip
Cost
No. of
events
Size All anglers Tournament
anglers
Non-tournament
anglers
Probability
(%)
WTP
($)
Probability
(%)
WTP
($)
Probability
(%)
WTP
($)
S.1 Not promoted No restriction 0 Business 120 Some events 200 9.7 0 13.0 0 8.0 0
S.2 Not promoted No restriction 10 Business 120 Some events 200 11.7 23.9 13.1 0.5 10.9 41.2
S.3 Promoted No restriction 10 Nonprofit 150 Some events 200 31.5 146.4 31.7 97.2 31.3 181.7
S.4 Promoted Artificial only 10 Nonprofit 180 Some events 100 21.3 97.5 21.1 52.5 21.1 129.4
S.5 Promoted Artificial only 20 Nonprofit 180 Some events 100 25.8 121.4 21.1 53.0 28.8 170.7
130 Environ Manage (2007) 40:123–133
123
nontournament anglers least preferred scenario 1 (i.e.,
current restrictive management conditions), with a pre-
dicted probability of 8.0%, tournament anglers were very
much in favor of this management regime, with a predicted
probability of 13.0%. Overall, it was noted that manage-
ment scenarios with varying degrees of management
intervention were generally more favored than the status
quo situation with no management interventions. However,
nontournament anglers were more supportive of stricter
management scenarios for regulating tournament angler
behaviors than tournament anglers, who were compara-
tively more supportive of the management scenarios
reflecting the current laissez-faire policy.
Discussion
In this article, we sought a comprehensive understanding of
anglers’ preferences (irrespective of previous involvement
in saltwater tournament fishing) for various management
attributes of tournament fishing trips and their willingness
to make trade-offs among them. Fortunately, we had a
sufficient mix of tournament anglers (n = 237) and non-
tournament anglers (n = 411) to reflect the diversity of
preferences for tournament fishing management for these
two groups. A major concern at the start of the project was
whether the mail survey would be sufficiently salient to the
latter group of anglers for them to take the time to respond.
A special effort was made in the letters sent to anglers with
the questionnaire to encourage them to participate. Anglers
in the sample were told the following: ‘‘Whether you have
participated recently, previously, or at all in tournaments,
we want to know your opinions and preferences for tour-
naments as they are held today or may be held in the future.
Everybody’s preferences are important on this subject.’’
Thus, tournaments were considered a topic of concern to
all saltwater anglers and one where all saltwater anglers’
views should be taken into account.
Preference results generally indicated a certain degree of
support for the introduction of management interventions,
such as catch-and-release restrictions and making a portion
of each angler’s tournament fee available to the manage-
ment agency, perhaps because of concerns for possible
tournament-induced negative impacts. Although respon-
dents showed reluctance to adopt other management-re-
lated options (e.g., bait restrictions and type of tournament
administration), results confirmed that anglers have con-
sidered issues dealing with the sustainability of fish stocks
and potential conflicts between tournament and nontour-
nament anglers (Aas and others 2000; Gillis & Ditton
2002; Jacob & Schreyer 1980). More restrictive manage-
ment-related options were included in scenarios 3 and 5
(Table 4), but the high predicted probabilities and WTP for
these scenarios showed anglers’ willingness to accept
stricter management interventions (Gillis & Ditton 2002;
Oh and others 2005). The support for the conservation
option (scenario 3) exceeded that for the status quo option
(scenario 1). This was also likely caused by having both
tournament and nontournament anglers in the analysis.
Because no special licenses or rules have been established
for tournament anglers, it was more appropriate to conduct
the analysis using a sample of the general saltwater angler
population because all anglers have a right to be heard on
this important issue.
Although various approaches exist for taking into ac-
count the heterogeneous preferences of angler clientele, a
segmentation approach using a CL model was used in this
study to uncover underlying segments. Random-parameter
logit modeling, which assumes that parameters are ran-
domly distributed in the population, could also have been
used to incorporate preference heterogeneity (Train 1998).
Although the random-parameter logit model was also
estimated, the segmentation approach was seen as advan-
tageous in support of management decision making and
was used here for two main reasons. First, the random-
parameter logit model is limited in explaining the under-
lying sources of heterogeneity (Boxall & Adamowicz
2002), which are commonly related to the characteristics of
individual anglers. Second, although identifying segments
is often criticized because of the discretionary nature of
researchers’ arbitrary decisions (Hunt and others 2005), the
two groups used here were rigidly set using a predeter-
mined segmentation variable (i.e., previous tournament
participation or not).
Thus, to avoid possible displacement of affected angler
types, a segmentation approach based on tournament
experience was considered advantageous for understanding
how changes in management options have a differential
influence on angler segments. Overall, the results indicated
that compared with nontournament anglers, tournament
anglers likely prefer to maintain the more current laissez-
faire policy regarding fishing tournaments. Under current
management rules and regulations in Texas, all saltwater
anglers are treated the same whether or not they participate
in tournaments. However, our study findings showed that
those anglers who currently participate in tournaments
more likely favor the status quo without many management
interventions, and the remainder favor the more conser-
vation-oriented alternatives.
Some study limitations should be kept in mind. First,
this is a hypothetical contingent model, and, accordingly, it
is not known whether people’s stated behavior will match
their actual or revealed behavior. Nevertheless, the model
is useful for providing informed hypotheses for testing and
application elsewhere and insights not otherwise possible
using traditional opinion measurement techniques. Second,
Environ Manage (2007) 40:123–133 131
123
there is a concern for strategic behavior on the part of some
anglers who wanted perhaps to perpetuate the status quo
and discourage any form of change. Other anglers may
have provided socially desirable responses and even if
positive changes are made in tournaments, may still choose
not to participate. Third, compared with the finding that
only 14% of licensed saltwater anglers participated in
tournaments (Anderson & Ditton 2003), a greater per-
centage of tournament anglers (37%) in this study sample
provided their opinions and preferences. Because of the
heterogeneous concerns and preferences for management
of tournament fishing, further analysis is necessary to avoid
developing policies biased to any one group. Fourth, the
focus of this study was on a sample of the population of
licensed anglers who fish in salt water where differences in
skill, knowledge, commitment, and behavior are masked
because of an aggregate analysis. Just as it would be useful
to understand group differences in preferences based on
previous tournament participation (i.e., tournament and
nontournament anglers), it would also be beneficial in the
future to test for differences based on anglers’ specializa-
tion level (e.g., Bryan 1977; Ditton & others 1992). This
would require a much more sophisticated study design with
inclusion of various behavioral and attitudinal questions
and a much larger sample size than we had available here.
Specialization is ‘‘a continuum of behavior from the gen-
eral to the particular reflected by equipment and skills used
in the sport and activity/setting experiences’’ (Bryan 1977,
p.175). In the future, this concept will hopefully provide a
useful means for comprehending and acting on the diver-
sity found within the population of saltwater anglers.
Finally, there is the matter of the extent to which
natural resources agencies should become involved in
matters beyond traditional natural resource protection
concerns. At a recent meeting of the Texas Parks and
Wildlife Commission (TPWD), a constituent accused the
agency of engaging in social engineering, or, in other
words, promulgating rules and regulations intended to
produce desired social outcomes or in this case, particular
recreational fishing experiences. We consider this a part
of their management responsibilities. Particularly in this
case, the mission of the TPWD is clear in its support for
traditional natural resources management and conserva-
tion but also in providing ‘‘outdoor recreation opportu-
nities for the use and enjoyment of present and future
generations’’ (excerpted from TPWD Mission Statement,
http://www.tpwd.state.tx.us/business/about/mission/)
TPWD Mission Statement). In addition to the usual
concerns for overfishing and habitat requirements, each
state’s fishery agency has an opportunity to be involved in
promulgating rules and regulations that create additional
fishing ‘‘products’’ (Driver 1985) or in developing rec-
reation opportunities for its citizens, while enhancing the
state’s tourism economy. In this case, this could involve
reconfiguring fishing tournaments to make them more
attractive to anglers as well as more conservation friendly.
Acknowledgments Funding support for this research, which came
from the TPWD Coastal Fisheries Division and the Texas Agricul-
tural Experiment Station, was much appreciated.
Literature Cited
Aas O, Haider W, Hunt L (2000) Angler responses to harvest
regulations in Engerdal, Norway: a conjoint based choice
modeling approach. North American Journal of Fisheries
Management 20:940–950
Anderson DK, Ditton RB (2003) Demographics, participation,
attitudes, and management preferences of Texas anglers, 2001
(TAMU-WFSC-HD-624). Texas A & M University, Department
of Wildlife and Fisheries Sciences, College Station, TX
Antia U, McConney P, Ditton RB (2002) The socio-economic
characteristics of tournament anglers in Barbados. Gulf and
Caribbean Fisheries Institute 53:357–366
Babbie E (2001) The practice of social research, ninth edition.
Wadsworth/Thomson Learning, Belmont, CA
Bates IJ, Carson RT, Day B, Hanemann M, Hanley N, Hett T, et al.
(2002) Economic valuation with stated preference techniques: a
manual. Edward Elgar, Northampton, MA
Ben-Akiva M, Lerman SR (1985) Discrete choice analysis: theory
and application to travel demand. MIT Press, Cambridge, MA
Bennett J, Adamowicz V (2001) Some fundamentals of environmen-
tal choice modeling. In Bennett J, Blamey R (eds.) The choice
modeling approach to environmental valuation. Edward Elgar,
Northampton, MA. pp 37–69
Bennett JW, Blamey R (2001) The strengths and weaknesses of
environmental choice modeling. In Bennett JW, Blamey R
(eds.), The choice modeling approach to environmental valua-
tion. Edward Elgar, Northampton, MA. pp 227–242
Boxall P, Adamocwicz WL (2002) Understanding heterogeneous
preferences in random utility models: a latent class approach.
Environmental and Resource Economics 23:421–446
Boxall PC, MacNab B (2000) Exploring the preferences of wildlife
recreationists for features of boreal forest management: a choice
experiment approach. Canadian Journal of Forest Research
30:1931–1941
Bryan H (1977) Leisure value systems and recreational specialization:
the case of trout fishermen. Journal of Leisure Research 9:174–
187
Christian RT, Trimm DL (1986) An inventory of Texas saltwater
fishing tournaments: spatial, temporal and participation patterns
in 1983 (Management Data Series No. 97). Texas Parks and
Wildlife Department Coastal Fisheries Branch, Austin, TX
Dillman DA (1978) Mail and telephone surveys: the total design
method. Wiley, New York, NY
Ditton RB, Anderson DK, Bohnsack BL, Sutton SG (1999a) Texas
International Fishing Tournament: participants’ characteristics,
participation in fishing, attitudes, expenditures, and economic
impacts. (TAMU-WFSC-HD- 621). Texas A & M University,
Human Dimensions of Fisheries, College Station, TX
Ditton RB, Anderson DK, Thigpen III JF, Bohnsack BL, Sutton
SG (1999b) Pirate’s Cove Big Game Tournaments: partici-
pants’ characteristics, participation in fishing, attitudes, expen-
ditures, and economic impacts. (TAMU-WFSC-HD-615).
Texas A & M University, Human Dimensions of Fisheries,
College Station, TX
132 Environ Manage (2007) 40:123–133
123
Ditton RB, Loomis DK (1985) 1983 Texas International Fishing
Tournament: an analysis of participants’ characteristics, attitudes
and expenditures. (TAMU-SG-85-202). Texas A & M University
Sea Grant Program, College Station, TX
Ditton RB, Loomis DK, Choi S (1992) Recreation specialization: re-
conceptualization from social world’s perspective. Journal of
Leisure Research 24:33–51
Driver BL (1985) Specifying what is produced by management of
wildlife by public agencies. Leisure Sciences 7:281–295
Falk JM, Graefe AR, Ditton RB (1989) Patterns of participation and
motivation among saltwater tournament anglers. Fisheries
14(4):10–16
Fedler AJ (1998) Applying human dimensions information to
recreational fisheries management in the Gulf and Caribbean.
Gulf and Caribbean Fisheries Institute 50:1075–1088
Gillis KS, Ditton RB (2002) A conjoint analysis of U.S. Atlantic
billfish fishery management alternatives. North American Jour-
nal of Fisheries Management 22:1218–1228
Greene WH (2000) Econometric analysis. Prentice Hall, Upper
Saddle River, N .J
Hanemann WM (1984) Welfare evaluations in contingent valuation
experiments with discrete responses. American Journal of
Agricultural Economics 66:332–341
Hanley N, Mourato S, Wright RE (2001) Choice modeling
approaches: a superior alternative for environmental valuation?
Journal of Economic Surveys 15(3):435–462
Hanley N, Wright R, Adamowicz V (1998) Using choice experiments
to value the environment. Environmental and Resource Eco-
nomics 11:413–428
Hanley N, Wright R, Alvarez-Farizo B (2006) Estimating the
economic value of improvements in river ecology using choice
experiments: an application to the water framework directive.
Journal of Environmental Management 78(2):183–193
Hausman J, McFadden D (1984) Specification tests for the multi-
nomial logit model. Econometrica 52:1219–1240
Hensher DA (1994) Stated preference analysis of travel choices: the
state of practice. Transportation 21:107–133
Holmes TP, Adamowicz V (2003) Attribute-based methods. In
Champ PA, Boyle KJ, Brown TC (eds.) A primer on nonmarket
valuation. Kluwer Academic, Boston, MA. pp 171–220
Hunt LM, Haider W, Bottan B (2005). Accounting for varying setting
preferences among moose hunters. Leisure Sciences 27:297–314
Jacob GR, R. Schreyer (1981) Conflict in outdoor recreation: a
theoretical perspective. Journal of Leisure Research 12:368–380
Kaoru Y (1995) Measuring marine recreation benefits of water quality
improvements by the nested random utility model. Resource and
Energy Economics 17:119–136
Loomis DK, Ditton RB (1987) Analysis of motive and participation
differences between saltwater sport and tournament fishermen.
North American Journal of Fisheries Management 7:482–487
Loomis DK, Ditton RB (1993) Distributive justice in fisheries
management. Fisheries 18:14–18
Louviere JJ (1988a) Conjoint analysis modeling of stated prefer-
ence: A review of theory, methods, recent developments and
external validity. Journal of Transport Economics and Policy
22: 93–119
Louviere JJ (1988b) Analyzing individual decision-making: metric
conjoint analysis. Sage University Series on Quantitative
Applications in the Social Sciences No. 67. Sage, Newbury
Park, CA
Louviere JJ (2000) Why stated preference discrete choice modeling is
NOT conjoint analysis (and what SPDCM is?). Memetrics White
Paper
Louviere JJ (2001) Choice experiments: An overview of concepts and
issues. In J.W. Bennett, R. Blamey (eds.) The choice modeling
approach to environmental valuation. Edward Elgar, Northamp-
ton, MA. pp 13–36
Louviere JJ, Hensher D, Swait J (2000) Stated choice methods:
analysis and application. Cambridge University Press, UK
Louviere JJ, Timmermans H (1990) Stated preference and choice
models applied to recreation research: a review. Leisure Sciences
12:9–32
McFadden D (1974) Conditional logit analysis of qualitative choice
behavior. In Zarembka P (eds.) Frontiers in econometrics.
Academic, New York, NY. pp 105–142
Morrison M, Bennett JW, Blamey R (1999) Valuing improved
wetland quality using choice modeling. Water Resources
Research 35(9):2805–2814
Nielsen LA (1985) Philosophies for managing competitive fishing.
Fisheries 10(3):5–7
Oh C, Ditton RB, Gentner B, Riechers R (2005) A stated discrete
choice approach to understanding angler preferences and trade-
offs for management options. Human Dimensions of Wildlife
10(3):173–186
Oh C, Ditton RB (2006) Using recreation specialization to understand
multi-attribute management preferences. Leisure Sciences
28:369–384
Schmied RL (1994) A history and overview of fishing tournaments
(Special Report No. 46). In Proceedings of the Workshop on
Saltwater Tournaments. Atlantic States Marine Fisheries Com-
mission, Washington, DC. pp 1–8
Thailing CE, Ditton RB, Anderson DK, Murray TJ, Kirkley JE, and J.
Lucy (2001) The 2000 Virginia Beach Red, White, and Blue
Fishing Tournament: participants’ characteristics, attitudes,
expenditures, and economic impacts (Virginia Marine Resource
Report No. 2001-9, VSG-01-88). College of William and Mary,
Virginia Institute of Marine Science. Gloucester Point, VA
Train KE (1998) Recreation demand models with taste differences
over people. Land Economics 74:230–239
Williams T (1984) Fishing to win. Audubon 86(3):82–95
Environ Manage (2007) 40:123–133 133
123
Related Documents