Conor Clarke BScEng, Dip Eng, MIEI Head of Energy Conservation Unit/Senior Engineer Office of Public Works, Dublin, Ireland. IEA Buildings, Energy Efficiency & Behaviour Workshop A Staff Energy Awareness Campaign

Welcome message from author
This document is posted to help you gain knowledge. Please leave a comment to let me know what you think about it! Share it to your friends and learn new things together.
Transcript
Conor Clarke BScEng, Dip Eng, MIEI
Head of Energy Conservation Unit/Senior Engineer
Office of Public Works, Dublin, Ireland.
IEA Buildings, Energy Efficiency & Behaviour Workshop
A Staff Energy Awareness Campaign
Office of Public Works
• Property Management (Central Government Portfolio) is one of the main activities of the Office of Public Works (OPW)
• Approximately 2000 properties, many small, Total Floor Space of 1.4M m2 (for 50,000 Staff)
• Predominantly office accommodation but also includes data centres, laboratories, heritage buildings, etc.
• Total Energy Spend = €35M - €40M

Our Clients
• OPW provides a central service in terms of technical expertise and management of buildings
• Work closely with all our customers on a day to day basis.
• OPW owns/leases the properties on behalf of the State
• Individual occupying Departments pay for Maintenance and Energy
Energy Conservation in the Public Service
• Ireland’s National Energy Efficiency Action Plan (NEEAP) requires Public Service Organisations to provide exemplary role
• Public Sector Target = 33% energy reduction by 2020
• Originally thought to be ambitious but OPW well on the way to achieving this goal
• No room for complacency
• Energy Conservation Programmes – easiest savings are the initial savings.
Background
• 2007: 2 Pilot Studies in 10 Buildings
– Demonstrated savings of up to 19% Possible
• 2008 - 2010: Optimising Power @ Work 1
• 2010 – 2015: Optimising Power @ Work 2
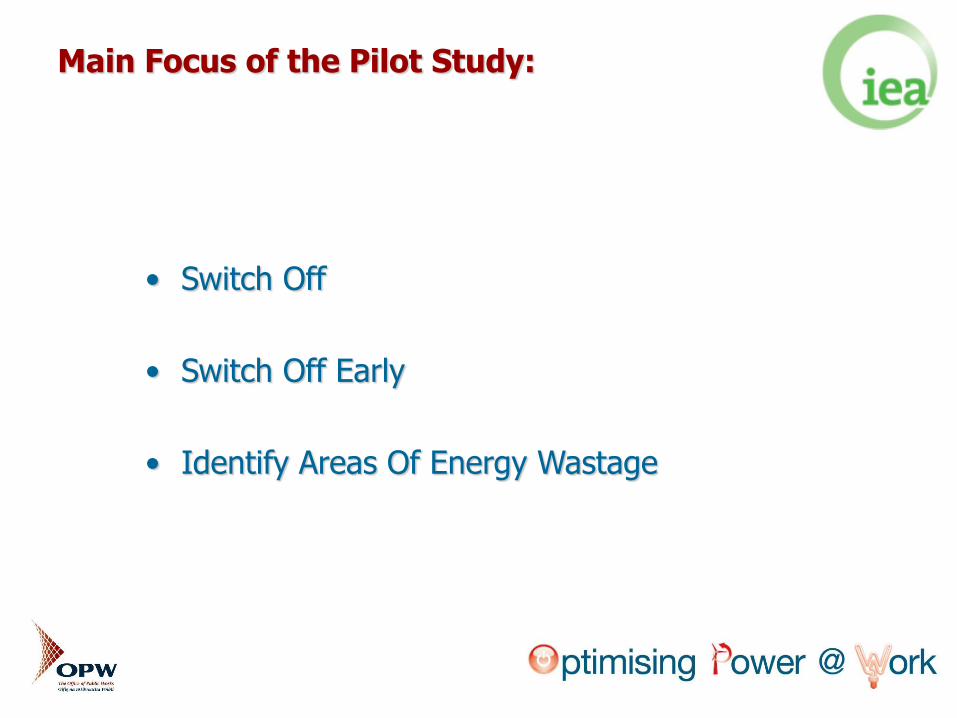
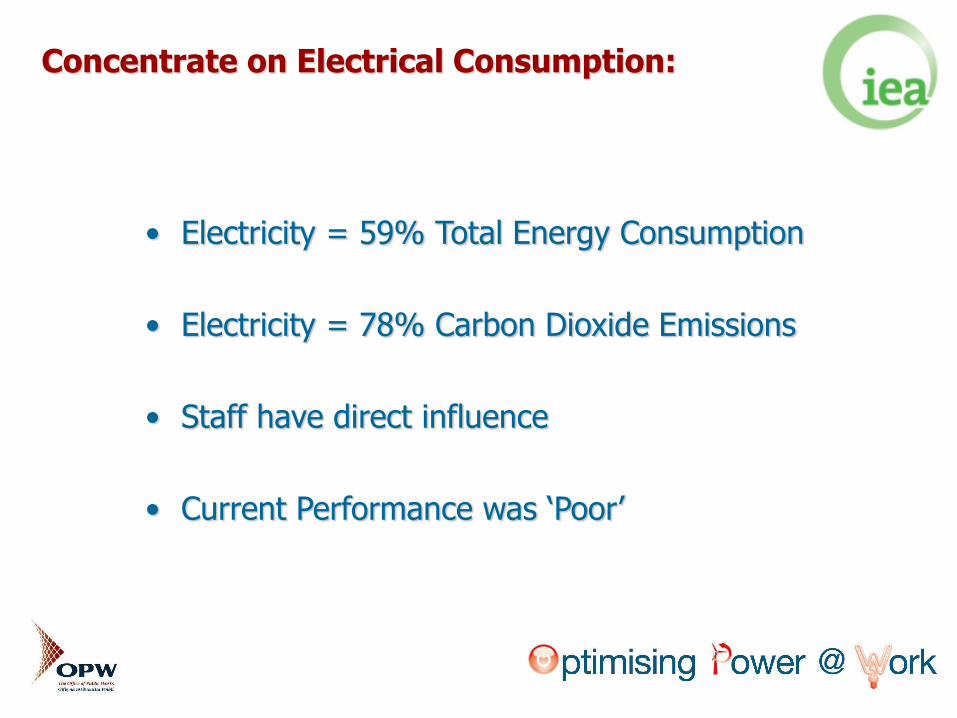
Concentrate on Electrical Consumption:
• Electricity = 59% Total Energy Consumption
• Electricity = 78% Carbon Dioxide Emissions
• Staff have direct influence
• Current Performance was ‘Poor’
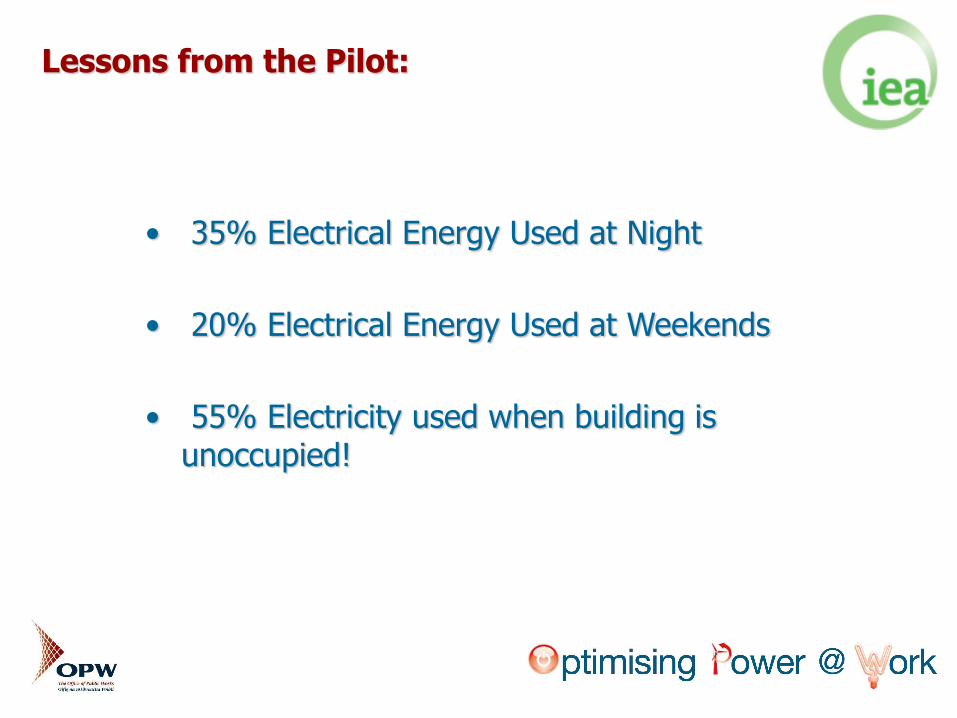
Lessons from the Pilot:
• 35% Electrical Energy Used at Night
• 20% Electrical Energy Used at Weekends
• 55% Electricity used when building is unoccupied!
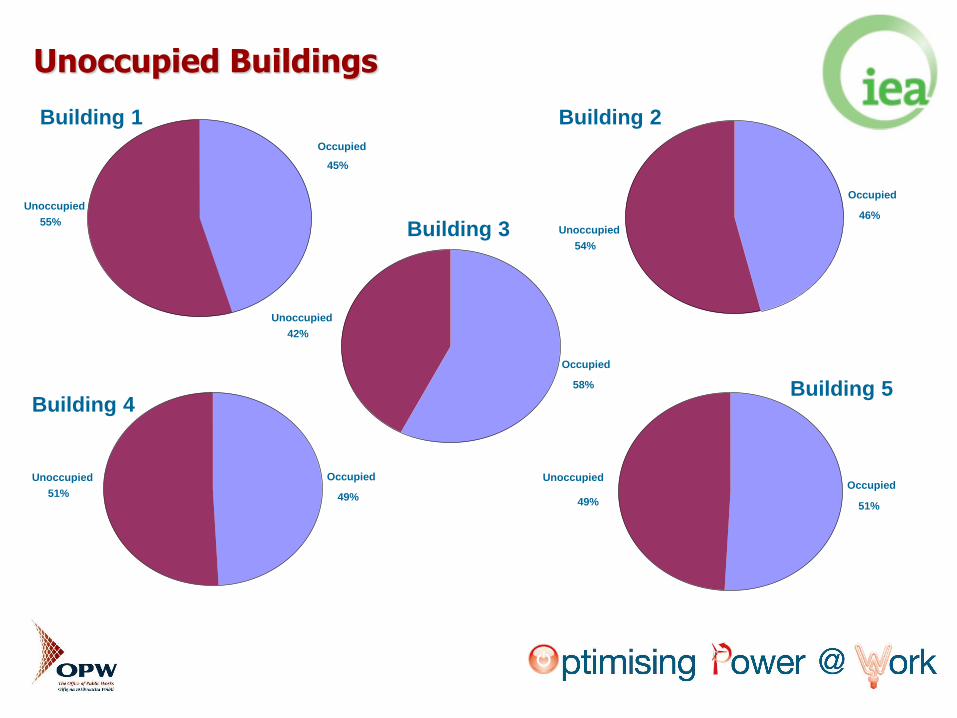
Unoccupied Buildings
Unoccupied
Building 1
Occupied
45%
55%
Occupied
46%
Unoccupied
54%
Occupied
49%
Unoccupied
51%
Occupied
58%
Unoccupied
42%
Occupied
51%
Unoccupied
49%
Building 2
Building 3
Building 4 Building 5
Optimising Power @ Work 1
• 250 Buildings in the campaign
• 2 Service Providers Appointed
• 15% Reduction Target
• Actual average savings of 12% achieved
Optimising Power @ Work 2 - Targets
• Target 20% average energy saving.
• Minimum saving of 15% in each building i.e. buildings that did not achieve a 15% in Phase 1 were intensively targeted.
• Buildings, which have already achieved >20%, a 5% further reduction
The key success factors:
• Three key elements to programme:
1. Technology
2. Specialist Resources
3. Continuous Staff Engagement
• Endorsement at CEO & Senior Management level essential for
success
• Active energy teams within participating buildings is the
cornerstone of the campaign
The OPW Programme
1) Technology - Availability of up to date reliable energy data
– OPW installed dedicated energy monitoring equipment in all buildings which have floor areas over 1000m2.
– Approximately 270 buildings in total
– Best estimates indicate that these are responsible for 80% of our expenditure on energy.
The OPW Programme
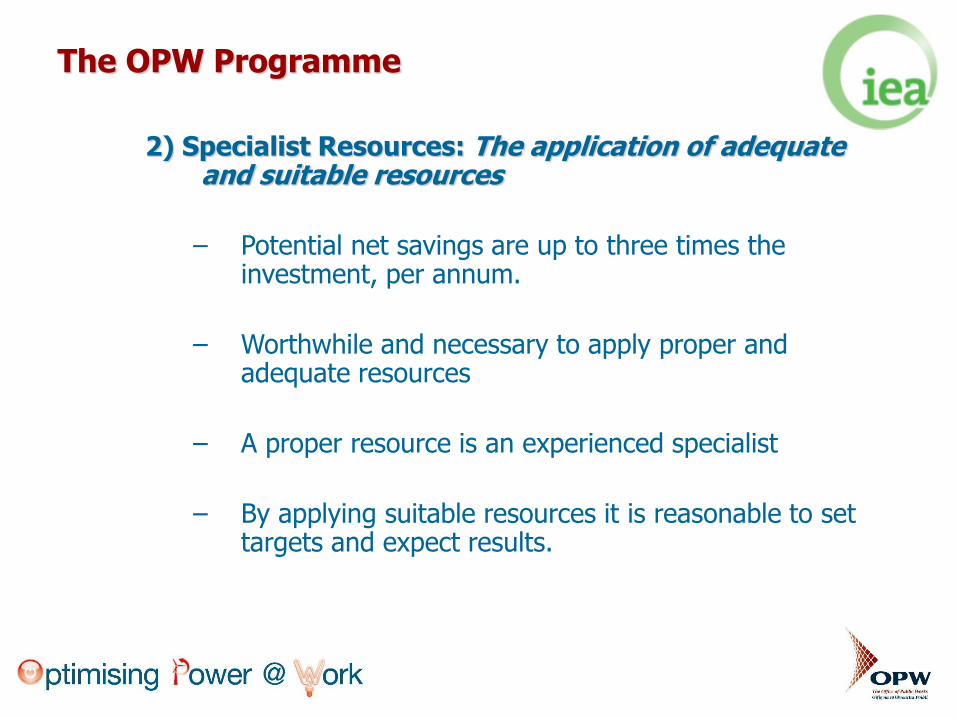
2) Specialist Resources: The application of adequate and suitable resources
– Potential net savings are up to three times the investment, per annum.
– Worthwhile and necessary to apply proper and adequate resources
– A proper resource is an experienced specialist
– By applying suitable resources it is reasonable to set targets and expect results.
The OPW Programme
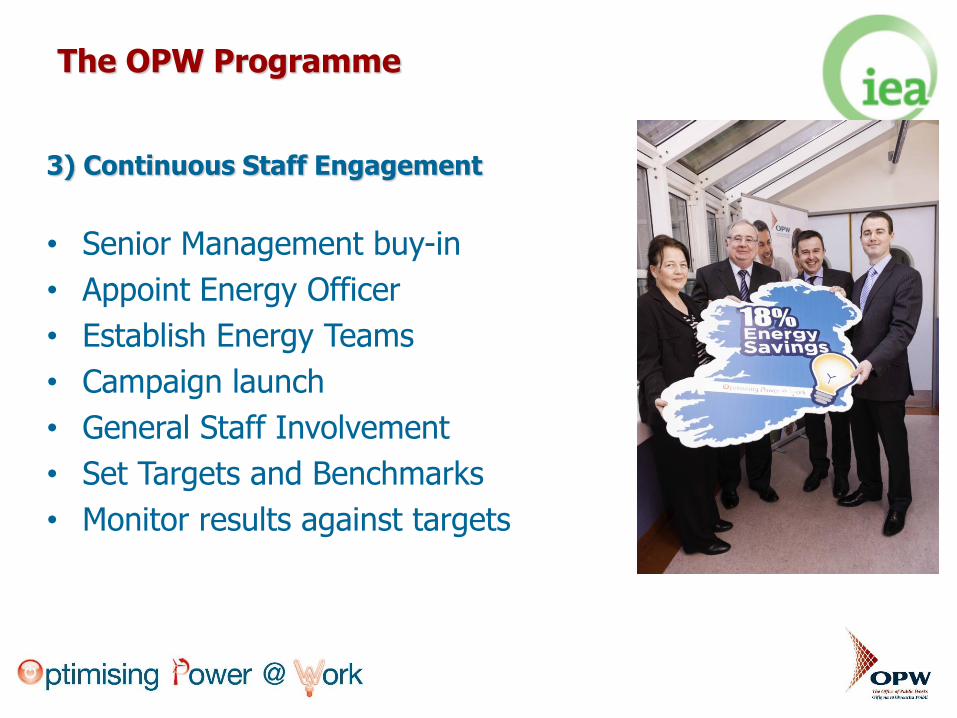
3) Continuous Staff Engagement
• Senior Management buy-in
• Appoint Energy Officer
• Establish Energy Teams
• Campaign launch
• General Staff Involvement
• Set Targets and Benchmarks
• Monitor results against targets
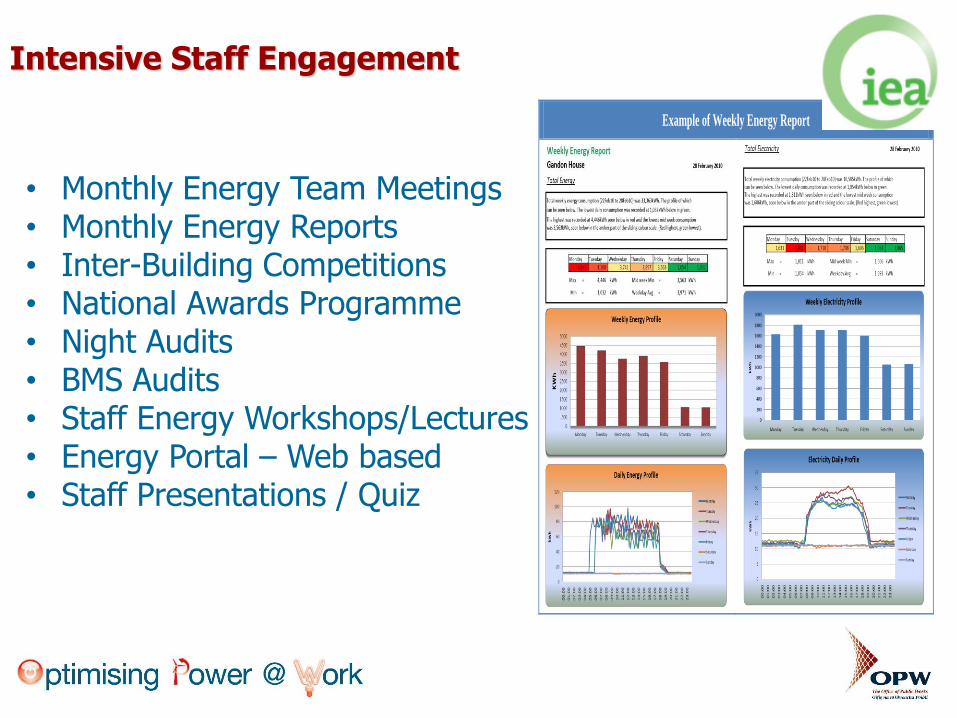
Intensive Staff Engagement
Example of Weekly Energy Report
• Monthly Energy Team Meetings • Monthly Energy Reports • Inter-Building Competitions • National Awards Programme • Night Audits • BMS Audits • Staff Energy Workshops/Lectures • Energy Portal – Web based • Staff Presentations / Quiz
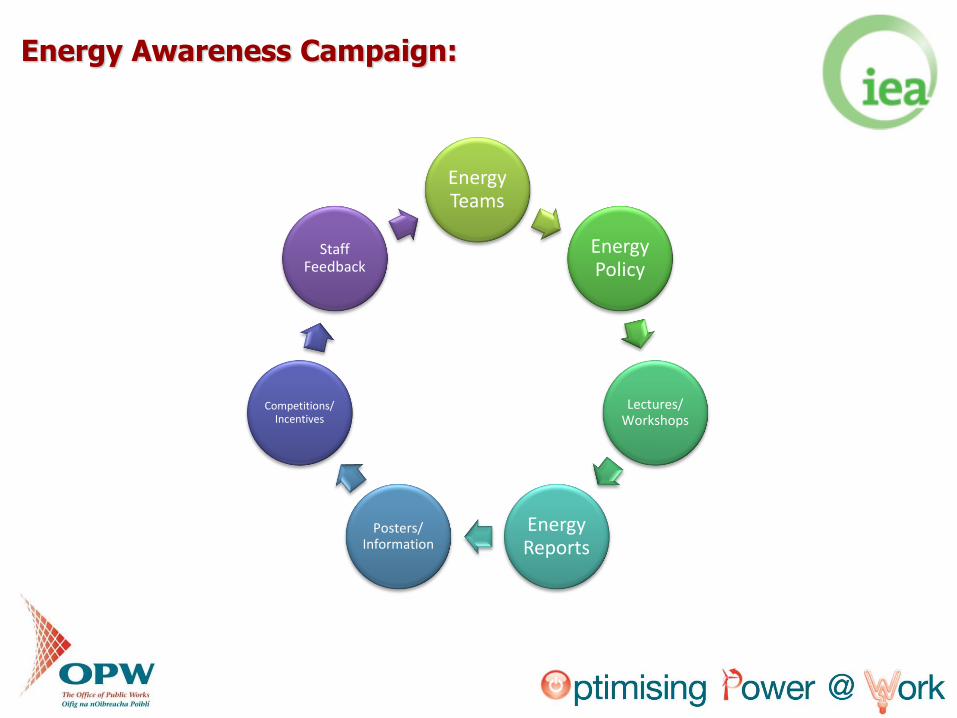
Energy Awareness Campaign:
Energy Teams
Energy Policy
Lectures/ Workshops
Energy Reports
Posters/ Information
Competitions/ Incentives
Staff Feedback
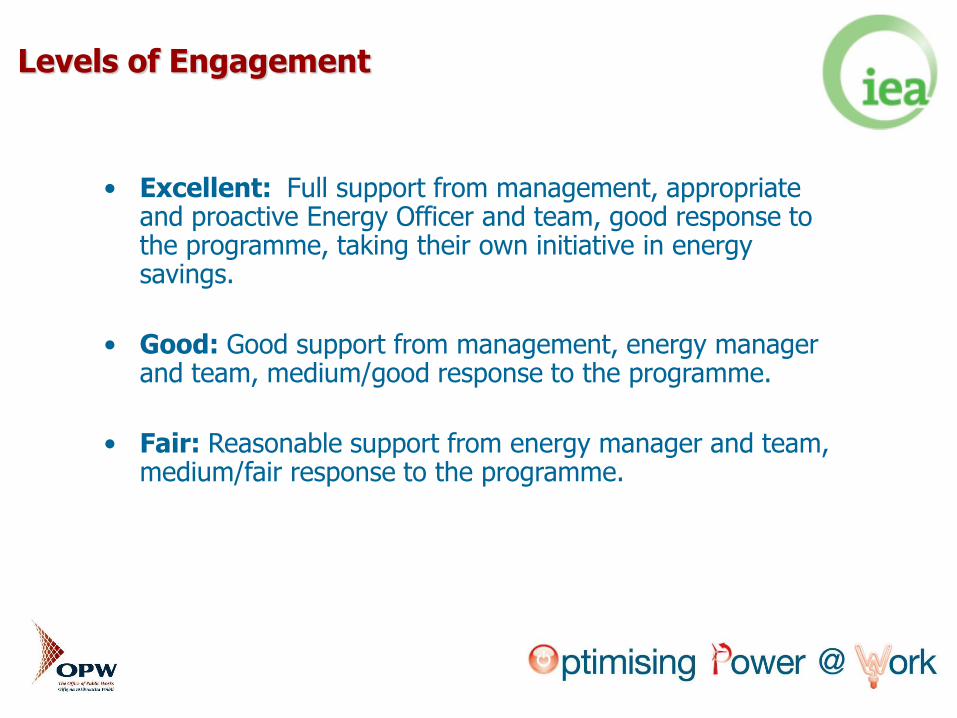
Levels of Engagement
• Excellent: Full support from management, appropriate and proactive Energy Officer and team, good response to the programme, taking their own initiative in energy savings.
• Good: Good support from management, energy manager and team, medium/good response to the programme.
• Fair: Reasonable support from energy manager and team, medium/fair response to the programme.
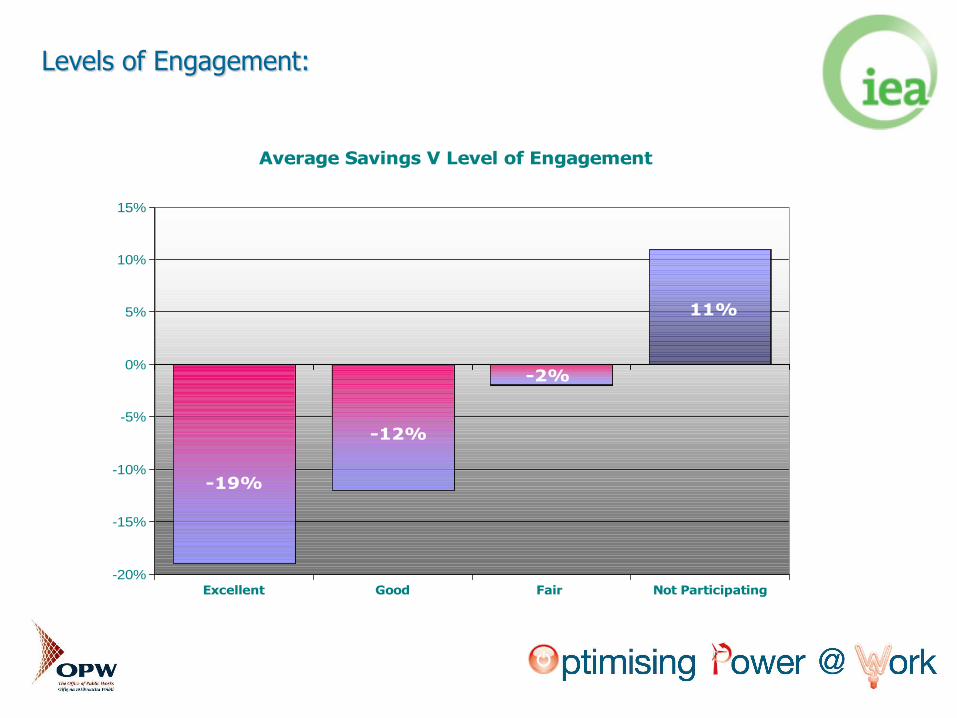
Levels of Engagement:
-19%
-12%
-2%
11%
-20%
-15%
-10%
-5%
0%
5%
10%
15%
Excellent Good Fair Not Participating
Average Savings V Level of Engagement
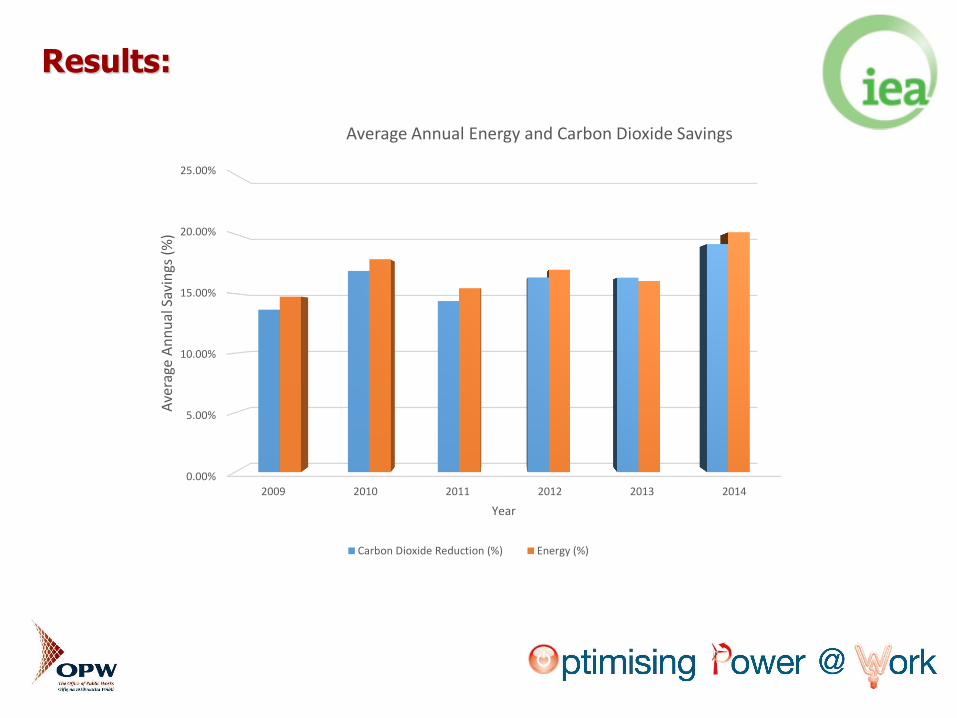
Results:
0.00%
5.00%
10.00%
15.00%
20.00%
25.00%
2009 2010 2011 2012 2013 2014
Ave
rage
An
nu
al S
avin
gs (
%)
Year
Average Annual Energy and Carbon Dioxide Savings
Carbon Dioxide Reduction (%) Energy (%)
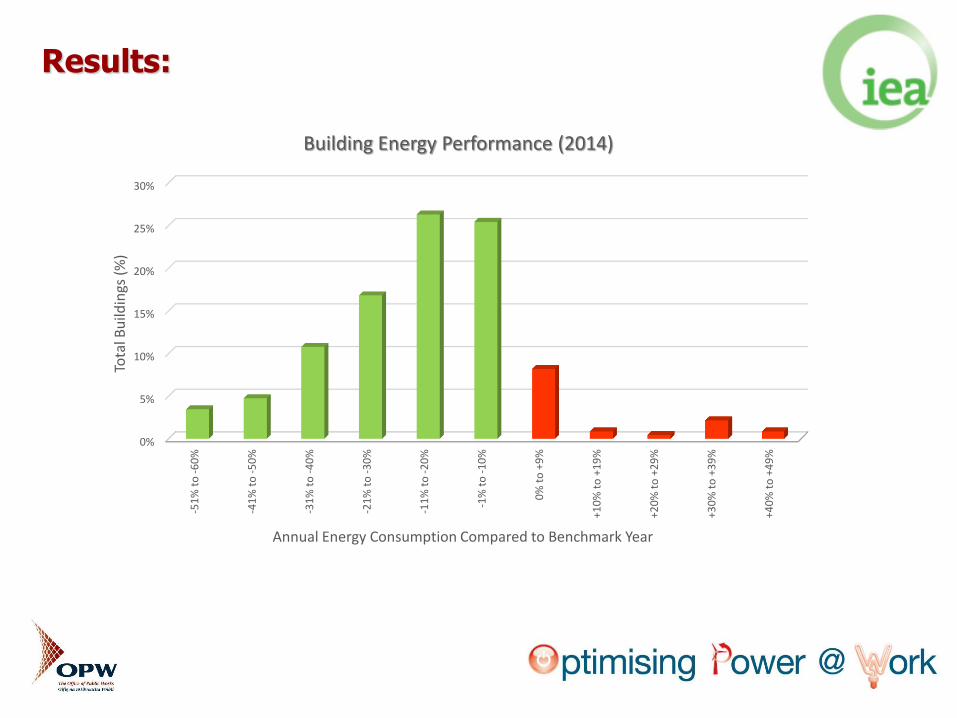
Results:
0%
5%
10%
15%
20%
25%
30%-5
1%
to
-6
0%
-41
% t
o -
50
%
-31
% t
o -
40
%
-21
% t
o -
30
%
-11
% t
o -
20
%
-1%
to
-1
0%
0%
to
+9
%
+10
% t
o +
19
%
+20
% t
o +
29
%
+30
% t
o +
39
%
+40
% t
o +
49
%
Tota
l Bu
ildin
gs (
%)
Annual Energy Consumption Compared to Benchmark Year
Building Energy Performance (2014)
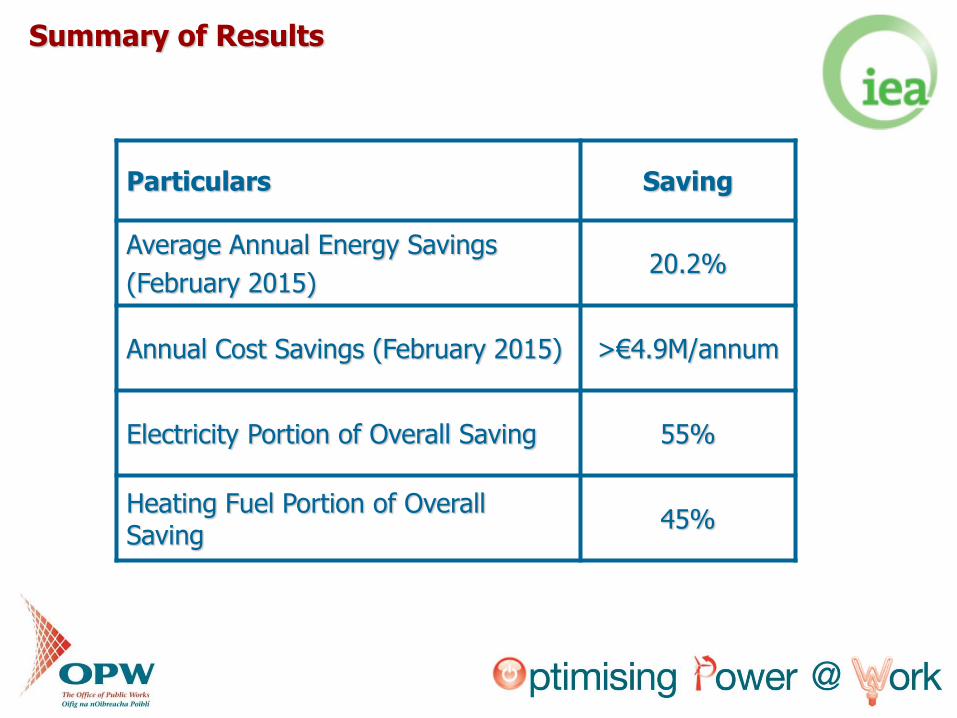
Summary of Results
Particulars Saving
Average Annual Energy Savings
(February 2015) 20.2%
Annual Cost Savings (February 2015) >€4.9M/annum
Electricity Portion of Overall Saving 55%
Heating Fuel Portion of Overall Saving
45%
The Future: New Public Sector Programme:
• Following the success of OPW’s existing Optimising Power @ Work Energy Conservation Campaign, Government Decision to use as a model for roll-out to wider public sector.
• OPW identified as the best organisation to deliver this.
• €9M allocated over a 3 year period.
• Hospitals, Prisons, Universities, Institutes of Technology, Local Authorities, etc.
Related Documents