JOURNAL OF GEOPHYSICAL RESEARCH, VOL. 104, NO. D24, PAGES 31,657-31,669, DECEMBER 27, 1999 A spatiotemporal model for downscaling precipitation occurrence and amounts Stephen P. Charlesand Bryson C. Bates Commonwealth Scientific and Industrial Research Organisation (CSIRO) Land and Water, Wembley, Australia James P. Hughes Department of Biostatistics, Universityof Washington, Seattle Abstract. A stochastic model that relatessynoptic atmospheric data to daily precipitation at a networkof gages is presented. The model extends the nonhomogeneous hidden Markov model (NHMM) of Hughes et al. by incorporating precipitation amounts. The NHMM assumes that multisite, daily precipitation occurrence patterns are drivenby a finite numberof unobserved weatherstates that evolve temporally according to a first- order Markov chain. The statetransition probabilities are a functionof observed or modeled synoptic scale atmospheric variables such as mean sealevel pressure. For each weather statewe evaluatethe joint distribution of daily precipitation amounts at n sites throughthe specification of n conditional distributions. The conditional distributions consist of regressions of transformed amounts at a givensite on precipitation occurrence at neighboring sites within a set radius.Results for a network of 30 daily precipitation gages and historical atmospheric circulationdata in southwestern Australia indicate that the extended NHMM accurately simulates the wet-dayprobabilities, survival curves for dry- and wet-spell lengths, daily precipitation amountdistributions at each site, and intersite correlations for daily precipitation amounts over the 15 year period from 1978 to 1992. 1. Introduction The need for improvedquantitative precipitation forecasts, and realistic assessments of the regional impacts of natural climatevariabilityand possible climatechange due to the en- hancedgreenhouse effect, has generatedincreased interest in regional climatesimulation. Althoughcurrentgeneralcircula- tionmodels (GCMs) andlimitedarea models (LAMs) perform reasonably well in simulating synoptic scale atmospheric fields, theytend to overestimate the frequency and underestimate the intensity of daily precipitationand thus fail to reproduce the statistics of historical records at localscales [e.g., Mearns et al., 1995;Walsh and McGregor, 1995, 1997; Bates et al., 1998]. The above limitations have led to the development of sta- tistical downscaling techniques to derive sub-grid-scale weather from the coarsespatialresolutionatmospheric data available from GCMs and LAMs [Hewitson and Crane, 1996]. Early techniques classified large-scale atmospheric circulation patterns and then modeled the daily precipitation process through multivariate probability distributions conditional on the derivedpatterns[e.g.,Bardossy and Plate, 1991, 1992; Bo- gardi et al., 1993;Matyasovszky et al., 1993a,b; Bartholy et al., 1995]. These schemes produceweather patternsthat are de- fined independently of precipitation, and they have had only limited success in reproducing wet and dry spelllength statis- tics [Hay et al., 1991; Wilson et al., 1991, 1992;Zorita et al., 1995]. Recent approaches include regressions on continuous atmospheric circulation indices, geographic locationand topo- Copyright1999 by the American Geophysical Union. Paper number 1999JD900119. 0148-0227/99/1999JD 900119509.00 graphical variables[e.g., Enke and Spekat,1997;Huth, 1997; Kidson and Thompson, 1998;Kilsby et al., 1998; Wilbyet al., 1998], and neural networks[e.g., Crane and Hewitson,1998]. However, the success of these methods in simulating the his- torical process is not always high. For example, Huth [1997] and Enke and Spekat [1997] were able to explainonly 20% of the at-sitevarianceof historicaldaily precipitation. The downscaling methoddescribed here uses the nonhomo- geneous hidden Markov model (NHMM) of Hughes et al. [1999]to simulate precipitation occurrence andmultiplelinear regression to simulateprecipitation amounts in southwestern Australia. The NHMM determines the most distinctpatterns in a dailymultisite precipitation occurrence recordrather than patternsin atmospheric circulation. These patterns are then defined as conditionally dependenton a set of atmospheric predictorvariables. In this way, the NHMM captures much of the spatialand temporalvariability of the precipitation occur- rence process. The joint distribution of daily precipitation amounts at n sites is evaluated throughthe specification of n conditional distributions. The conditional distributions consist of regressions of transformed amounts at a given site on pre- cipitation occurrence at neighboring sites within a set radius. An automatic variable selection procedure is used to identify the key neighboring sites. The paper is divided into seven sections. Section 2 describes the study area and the historical precipitation and atmospheric data used, while section 3 details the NHMM and the multiple linear regression and variable selection procedures used.Sec- tions 4 and 5 present the approach and the results of the analysis, respectively. Section 6 contains a general discussion of the issues raised in the paper,with final conclusions presented in section 7. 31,657

Welcome message from author
This document is posted to help you gain knowledge. Please leave a comment to let me know what you think about it! Share it to your friends and learn new things together.
Transcript
JOURNAL OF GEOPHYSICAL RESEARCH, VOL. 104, NO. D24, PAGES 31,657-31,669, DECEMBER 27, 1999
A spatiotemporal model for downscaling precipitation occurrence and amounts
Stephen P. Charles and Bryson C. Bates Commonwealth Scientific and Industrial Research Organisation (CSIRO) Land and Water, Wembley, Australia
James P. Hughes Department of Biostatistics, University of Washington, Seattle
Abstract. A stochastic model that relates synoptic atmospheric data to daily precipitation at a network of gages is presented. The model extends the nonhomogeneous hidden Markov model (NHMM) of Hughes et al. by incorporating precipitation amounts. The NHMM assumes that multisite, daily precipitation occurrence patterns are driven by a finite number of unobserved weather states that evolve temporally according to a first- order Markov chain. The state transition probabilities are a function of observed or modeled synoptic scale atmospheric variables such as mean sea level pressure. For each weather state we evaluate the joint distribution of daily precipitation amounts at n sites through the specification of n conditional distributions. The conditional distributions consist of regressions of transformed amounts at a given site on precipitation occurrence at neighboring sites within a set radius. Results for a network of 30 daily precipitation gages and historical atmospheric circulation data in southwestern Australia indicate that the extended NHMM accurately simulates the wet-day probabilities, survival curves for dry- and wet-spell lengths, daily precipitation amount distributions at each site, and intersite correlations for daily precipitation amounts over the 15 year period from 1978 to 1992.
1. Introduction
The need for improved quantitative precipitation forecasts, and realistic assessments of the regional impacts of natural climate variability and possible climate change due to the en- hanced greenhouse effect, has generated increased interest in regional climate simulation. Although current general circula- tion models (GCMs) and limited area models (LAMs) perform reasonably well in simulating synoptic scale atmospheric fields, they tend to overestimate the frequency and underestimate the intensity of daily precipitation and thus fail to reproduce the statistics of historical records at local scales [e.g., Mearns et al., 1995; Walsh and McGregor, 1995, 1997; Bates et al., 1998].
The above limitations have led to the development of sta- tistical downscaling techniques to derive sub-grid-scale weather from the coarse spatial resolution atmospheric data available from GCMs and LAMs [Hewitson and Crane, 1996]. Early techniques classified large-scale atmospheric circulation patterns and then modeled the daily precipitation process through multivariate probability distributions conditional on the derived patterns [e.g., Bardossy and Plate, 1991, 1992; Bo- gardi et al., 1993; Matyasovszky et al., 1993a, b; Bartholy et al., 1995]. These schemes produce weather patterns that are de- fined independently of precipitation, and they have had only limited success in reproducing wet and dry spell length statis- tics [Hay et al., 1991; Wilson et al., 1991, 1992; Zorita et al., 1995]. Recent approaches include regressions on continuous atmospheric circulation indices, geographic location and topo-
Copyright 1999 by the American Geophysical Union.
Paper number 1999JD900119. 0148-0227/99/1999JD 900119509.00
graphical variables [e.g., Enke and Spekat, 1997; Huth, 1997; Kidson and Thompson, 1998; Kilsby et al., 1998; Wilby et al., 1998], and neural networks [e.g., Crane and Hewitson, 1998]. However, the success of these methods in simulating the his- torical process is not always high. For example, Huth [1997] and Enke and Spekat [1997] were able to explain only 20% of the at-site variance of historical daily precipitation.
The downscaling method described here uses the nonhomo- geneous hidden Markov model (NHMM) of Hughes et al. [1999] to simulate precipitation occurrence and multiple linear regression to simulate precipitation amounts in southwestern Australia. The NHMM determines the most distinct patterns in a daily multisite precipitation occurrence record rather than patterns in atmospheric circulation. These patterns are then defined as conditionally dependent on a set of atmospheric predictor variables. In this way, the NHMM captures much of the spatial and temporal variability of the precipitation occur- rence process. The joint distribution of daily precipitation amounts at n sites is evaluated through the specification of n conditional distributions. The conditional distributions consist
of regressions of transformed amounts at a given site on pre- cipitation occurrence at neighboring sites within a set radius. An automatic variable selection procedure is used to identify the key neighboring sites.
The paper is divided into seven sections. Section 2 describes the study area and the historical precipitation and atmospheric data used, while section 3 details the NHMM and the multiple linear regression and variable selection procedures used. Sec- tions 4 and 5 present the approach and the results of the analysis, respectively. Section 6 contains a general discussion of the issues raised in the paper, with final conclusions presented in section 7.
31,657
31,658 CHARLES ET AL.' DOWNSCALING OF DAILY MULTISITE PRECIPITATION
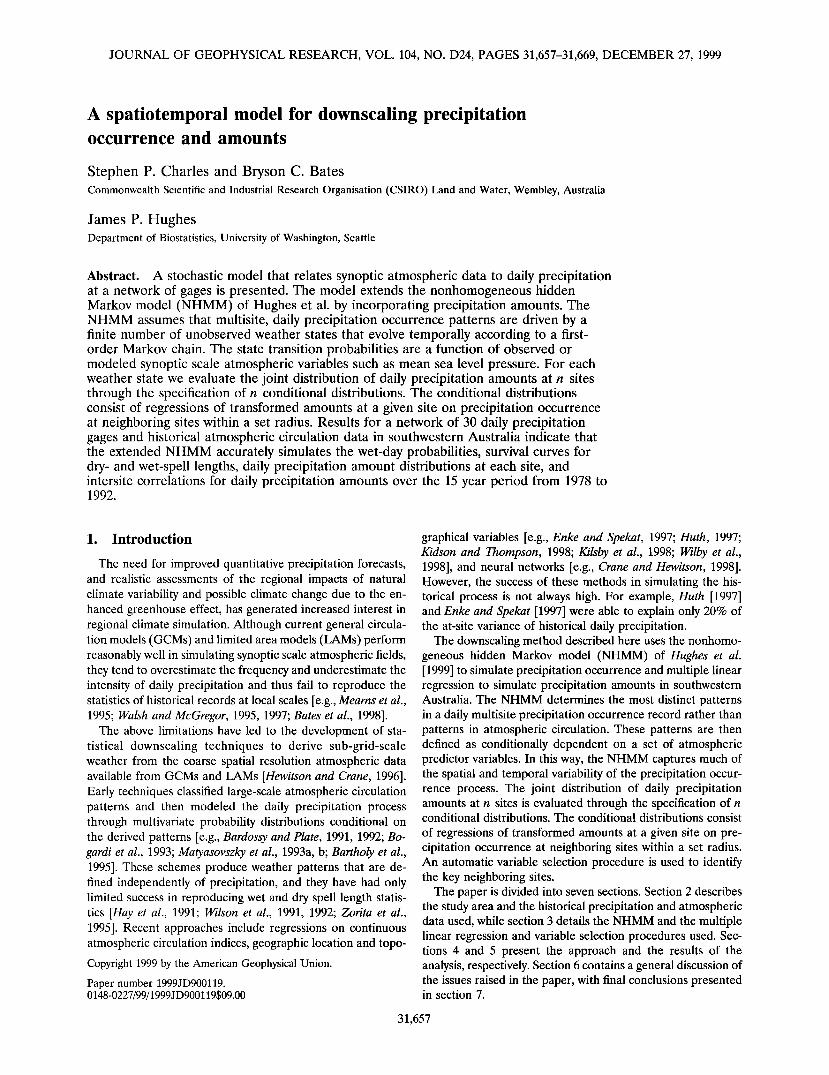
2. Study Area and Data The study area, the southwestern Australia (SWA) region,
extends approximately from 30 ø to 35 ø south and from 115 ø to 120 ø east (Figure 1). SWA is bounded by the Indian Ocean to the west and the Southern Ocean to the south. The region experiences a "mediterranean" climate with abundant winter rains, which are nearly double that of any similarly exposed location in any other continent, and intense summer drought. Eighty percent of annual precipitation falls in the period from May to October, and most of the winter rains come from low-pressure frontal systems [GentJill, 1972; Wright, 1974]. Thus we divided the year into "winter" (May-October) and "summer" (November-April) seasons. A full set of winter re- sults are presented here.
Atmospheric data on a Lambert conformal grid were ob- tained from the Commonwealth Bureau of Meteorology, Aus- tralia, for the period from 1978 to 1992. The data at 1100 UT were chosen on the basis that they are close to the midpoint of the daily precipitation recording period for SWA (2400-0100 UT). The available variables included mean sea level pressure (mslp, hPa) and, at the 850 and 500 hPa levels, geopotential height (GPH, m), air temperature (T, øK), dew point temper- ature (Td, øK), and meridional and zonal wind components (knots). Bates et al. [1998, Table 1] derived 24 variables from this data set. These included the raw variables listed above, the north-south and east-west gradients of the raw variables, and lagged raw variables. Here we add the dew point temperature depression at 850 hPa:
z) = r - (1)
where T 85ø and -r850 denote the air and dew point tempera- --d
ture at 850 hPa, respectively. D'rssø is a measure of how close --d
the atmosphere at 850 hPa is to saturation with water vapor. The data for the 25 atmospheric variables were interpolated to a rectangular 3.75 ø longitudinal by 2.25 ø latitudinal grid (Figure 1).
Daily precipitation data for 30 sites were obtained from the same data source for the same period. The locations of the sites are shown in Figure 1. These sites were chosen because they had no missing records over this period. The 0, 25, 50, 75, and 100% quantiles for the 30 site mean annual precipitation are 309 (at site 20), 371, 514, 824, and 1280 mm (at site 12) and
7• -5 -2 '1 + 6L .3 -+ +
'• 18. .19 .20 i ß 4 .21 22 .26
+ /.•s •.- + 2s + 10•.J '11 23
L ß 8 24' '27 •
+ -t- -t-
I I I
114 118 122
Longitude E
Figure 1. Map of study area showing site locations. Pluses denote grid points for atmospheric circulation data.
for elevation are 2 (at site 7), 102, 252, 293, and 353 m (at site 17). These ranges are representative of conditions in SWA. There is a 300 m escarpment arising from the coastal plain along the line of sites 5, 4, 12, 15, 11, and 14 with rain shadow effects eastward.
3. Model Description 3.1. Precipitation Occurrence
A detailed description and split-sample validation of the NHMM is given by Hughes et al. [1999] and thus only a brief description will be given here. The NHMM relates M synoptic scale, atmospheric circulation variables through a finite num- ber of "hidden" (unobserved) weather states (N) to multisite, daily precipitation occurrence data. The atmospheric circula- tion data may include raw variables such as mslp or derived variables such as north-south mslp gradient. Unlike other downscaling techniques based on classification schemes, the weather states are not defined a priori.
The NHMM defines the stochastic conditional relationships that link the multisite, daily precipitation occurrence patterns to the discrete set of weather states. A first-order Markov
process defines the daily transitions from weather state to weather state, with its transition probabilities conditional on a set of atmospheric circulation predictors. Throughout this pa- per, vectors and matrices will be written in boldface and all vectors are row vectors. Also, lowercase letters will be used to indicate the actual value of a random variable. Let R t = {R• •), '-', R? ) } denote the precipitation occurrence pattern at n sites on day t with observed values r = {r (•), ..., r (n)} where r © = 1 if precipitation greater than or equal to 0.3 mm occurs at site i and 0 otherwise, St denote the unobserved weather state at day t, and Xt denote a summary of historical or modeled atmospheric circulation data at day t, for t = 1,..., T.
The NHMM makes two assumptions:
P(Rt S• r, R'•-', X• r) = P(Rt St) (2)
Table 1. Comparison of Conditional Independence and Spatial Models
Number of Hidden Number of Output NHMM* Parameters? Parameters• BIC
3 - . 6 90 61484 4 - . 12 120 59110
4 • 1, 4 36 120 57168 5 • . 20 150 57067
5 • 1, 4 60 150 54954 6 - . 30 180 56356
6 • 1, 4 90 180 54249 6 - 1, 3, 4 120 180 54365 6 • 1, 4, 8 120 180 54195 6 • 1, 4, 8õ 120 192 50450 6 - 1, 4, 25 120 180 54217 6 • 1, 4, 25õ 120 192 50178 7 •. 42 210 55731
7 - 1, 4 126 210 53836 7 • 1, 4, 8 168 210 53869
'1 is mslp, 3 is T• 85ø, 4 is north-south mslp gradient, 8 is east-west GPH gradient at 850 hPa, 25 is D T• 85ø.
t(M + 1)[N(N- 1)]. :]:nN for conditional independence model; nN + 2N for spatial
model.
õSpatial model.
CHARLES ET AL.: DOWNSCALING OF DAILY MULTISITE PRECIPITATION 31,659
o o 0 0
0 .4 .6 .8 1.0 o o
; øøø 0 ,.,0
OOVo • • 0 •/• O0 0
I'h o o 0 0 .4
• •o•o
o 0 0 0 .4 .6 .8 1.0
03 0 (D 0 o • l• ooo
•oO
I
4
o o o ß . .6 .8 1.0
2
I• o o 0 0 0 2 .4 .6 .8 1.0
CO o o •
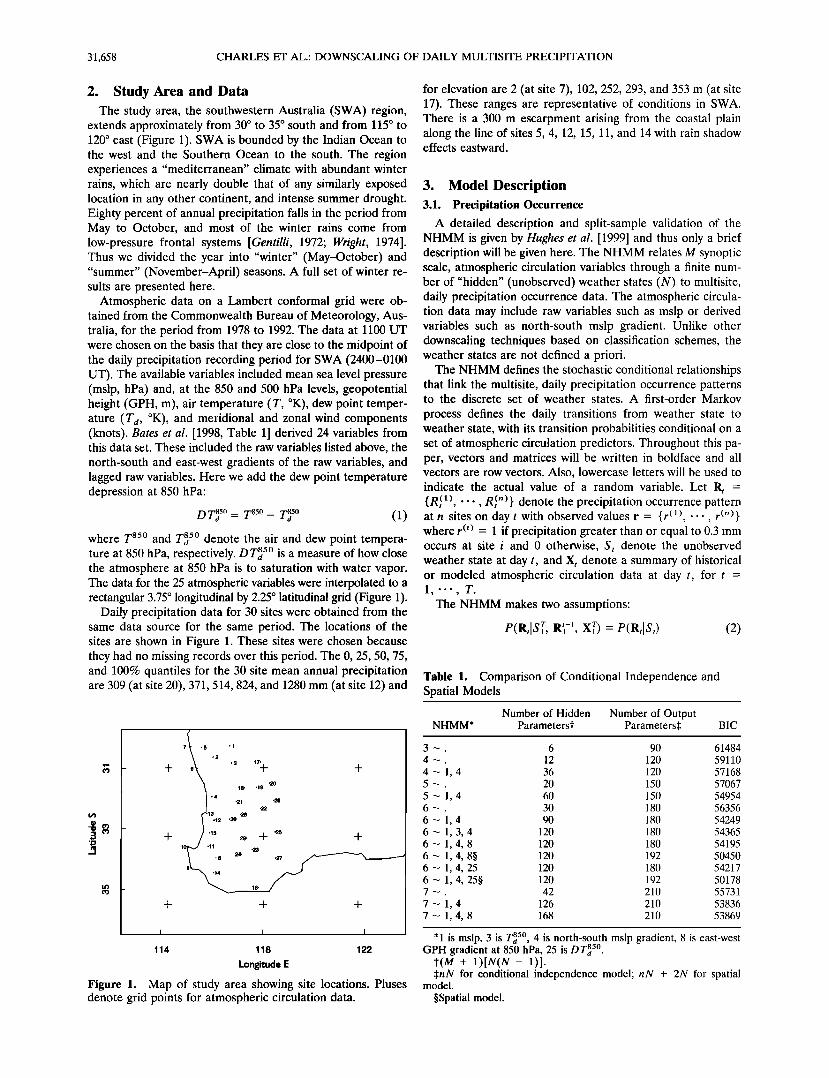
Figure 2. Precipitation occurrence patterns and mslp averaged over all days classified under each weather state for the 6 --- 1, 4, 25 spatial model.
31,660 CHARLES ET AL.' DOWNSCALING OF DAILY MULTISITE PRECIPITATION
OOL 08 09 Off O• 0
OOk 08 09 Off 0•3 0
O0 I. 08 09 Off O• 0
001. 08 09 Off 0;• 0
OOk
i , , ,
08 09 Off O•
peu!eldxe eoue!.•e^ eõe•,ueoJed
oot 08 09 Off O•
peu!eldxe @OUe!Jea @be),u@oJ@d
CHARLES ET AL.' DOWNSCALING OF DAILY MULTISITE PRECIPITATION 31,661
P(S, St1-1, XT) : P(S, St_l, Xt) (3)
where the notation Xl r means all values of X t from day 1 to day T (similarly for Sir). That is, (2) states that the n site precip- itation occurrence pattern on day t (R t) is conditional only on the weather state of day t (S,); and (3) states that this weather state is conditional on both the weather state of the preceding day (S,_ •) and the values of the atmospheric data (Xt) on day t. A particular NHMM is defined by parameterizations of the precipitation occurrence probability distribution P(R, IS,) and the weather state transition matrix P(s,Is,_,, x,).
The autologistic model [Besag, 1974; Cressie, 1991] for mul- tivariate binary data is used to parameterize P(R,I$,):
: F(t)F(J) P(R, rS,=s) o• exp • a,,r (')+ • /3•, (4)
where both axi and/3,ij must be finite. To reduce the number of model parameters, ½sij can be modeled as a function of the distance and direction between sites i and j:
13•,j = box + b•s log [d,• (cos (0s + h,•) 2 + sin (Os +
where d o and hi• are the distance and direction between sites i and j, respectively. For computational reasons the parame- ters qb s and e s were fixed at values determined by a prior nonlinear least squares regression. See Hughes et al. [1999] for more details. The b parameters were determined by the max- imum likelihood estimation procedure described below. Equa- tions (4) and (5) define a "spatial model" for multisite rainfall occurrence (conditional on the weather state). When/3si j = 0 for all i, j, and s,
: t: Ps, t 1 - Ps,) , (6)
where Psi = exp (ozsi)/[1 + exp (as/)] is the probability of precipitation at site i in weather state s. Although the R? ) in (6) are assumed to be spatially independent, conditional on the weather state, they are unconditionally correlated due to the influence of the common weather state. Thus (6) is referred to as a "conditional independence model."
Table 2. Summary of Weather States
Number
of Rainfall, State Description of Synoptic Situation Days, % %*
low-pressure trough associated with a 6.5 7.8 midlevel moisture source or spring thunderstorms
ridging low-pressure system, frontal 19.8 65.9 westerly winds
coastal convergence, light winds 14.1 16.4 postfrontal, southwesterly winds 20.2 6.9 high-pressure system centered east of 27.8 0.5
SWA, east to northeast winds ridging high-pressure system, moist 11.6 2.5
southerly winds
*Percentage of mean winter rainfall (average of the 30 sites shown in Figure 1).
Suppose X, is multivariate normal. Then the state transition probability matrix can be parameterized as
P(S, = j S,_• = i, X,)
P(S, = j St_ 1 --' i) P(X, S,_• = i, S, = j) e(x,Is,_,- i)
o•3,,s exp [-5(X,- tz,s)V (X,- tz,s ) ] (7)
where t% is the mean of X,, conditional on S,_ 1 and St, and V is the corresponding covariance matrix. The •/parameters contain information about the baseline state transition proba- bility matrix corresponding to the transition matrix of a stan- dard hidden Markov model (HMM), with the exponential term quantifying the effect of the atmospheric circulation data on the baseline transition probabilities.
Maximum likelihood estimates of the NHMM parameters are obtained using a modified EM algorithm [Baum et al., 1970; Dempster et al., 1977] and the method of Monte Carlo maximum likelihood [Geyer and Thompson, 1992]. See Hughes et al. [1999] for details. The selection of a NHMM involves sequential fitting of several NHMMs with an increasing num- ber of weather states and atmospheric variables. The fit is evaluated in terms of the physical realism and distinctness of the identified weather states as well as the Bayes information criterion'
BIC: -2L +p log (T) (8)
where L is the log-likelihood and p is the number of model parameters. The objective is to select an NHMM that mini- mizes the BIC, thus identifying a relatively parsimonious model that fits the data well. Throughout this paper, we use the compact notation N --•. to represent a standard N-state HMM and N --- i.j to represent an N-state NHMM with M = 2 observed covariates that correspond to the ith and jth atmo- spheric variables. The most likely weather state sequence is obtained from the selected NHMM using the Viterbi algo- rithm [Forney, 1978]. This permits the assignment of each day to its respective state [Hughes et al., 1999].
o .M
0.2 0.4 0.6 0.8
Historical precipitation probability
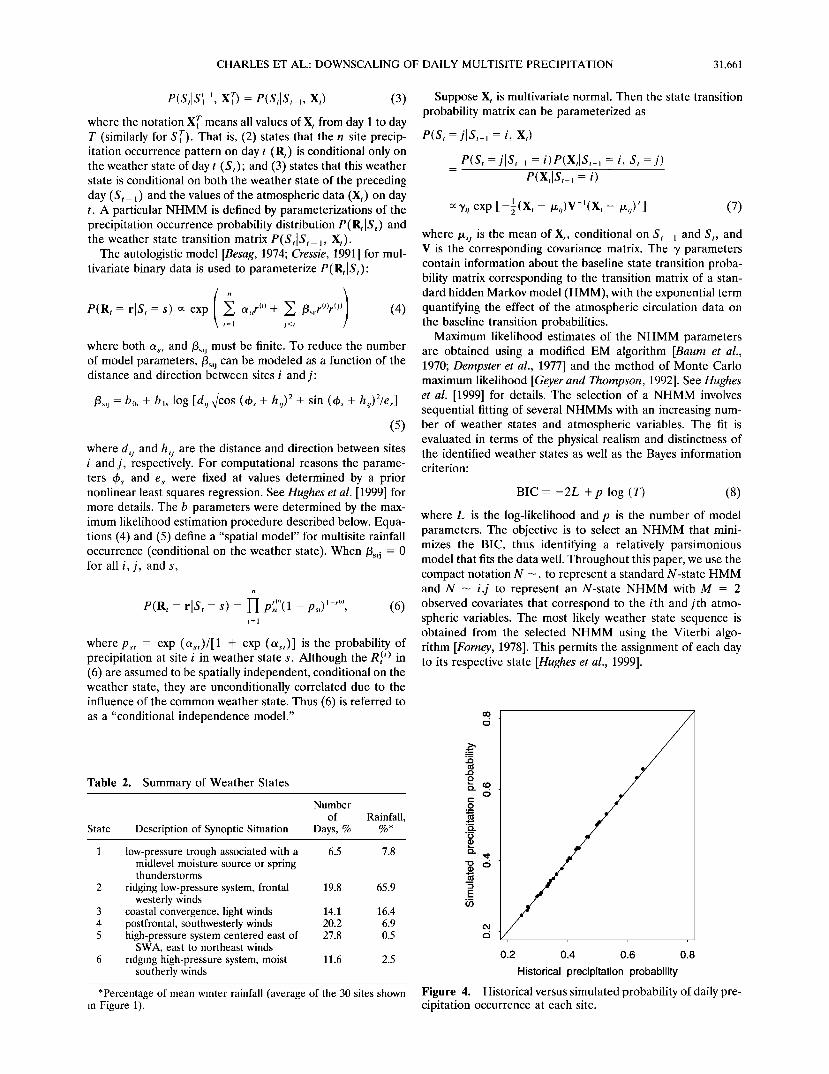
Figure 4. Historical versus simulated probability of daily pre- cipitation occurrence at each site.
31,662 CHARLES ET AL.: DOWNSCALING OF DAILY MULTISITE PRECIPITATION
o'[ ['o [o'o
o
!
!
!
/
/
/ !
/' o 0'1. I.'0 1.0'0
0'1. ['o I.O'O
0'1. I.'0 1.0'0
CHARLES ET AL.' DOWNSCALING OF DAILY MULTISITE PRECIPITATION 31,663
o't t'o to'o
/
/
/
/
i !
o't t'o to'o
o't ['o [o'o
(s•ep =< •eM)d
O' L L'O LO'O
o
o'• •'o •o'o
i I i
O'L •'0 LO'O
(s/•-<
31,664 CHARLES ET AL.: DOWNSCALING OF DAILY MULTISITE PRECIPITATION
3.2. Precipitation Amounts
The joint distribution of daily precipitation amounts at n sites is evaluated through the specification of n conditional distributions for each weather state (s -- 1,..., N). The conditional distributions consist of regressions of inverse nor- mal transformed amounts at a given site on precipitation oc- currence at neighboring sites within a given radius (/5, km). An automatic variable selection procedure is used to identify the key neighboring sites. Thus the precipitation amounts model can be expressed as
z?) = a(,)+ • al,),.(a)+ e?), i= 1 ''' n (9) t] Os t• kst 2
where the O• are regression parameters, n•(/5) denotes the set of indices of the key neighboring sites for site i, eJ •) is an error
•(i)), term modeled stochastically by assuming es © - N(0, o- s and
z? ) = •-l(l•(yji))) (10) in which cI) denotes the normal cumulative distribution func-
tion and P(ys ©) is the empirical distribution function of ys ©, the precipitation amounts on days with r © = 1.
Radii of 0, 100, 300, and 600 km were investigated in this study. Setting /5 = 0 produces a "conditional independence amounts model." The greatest distance between any two sites is 576 km. Thus setting /5 = 600, initially puts all n - 1 surrounding sites in the neighborhood of site i.
4. Approach Hughes et al. [1999] report the results of a successful split-
sample test of the NHMM using the historical atmospheric and precipitation data set described in section 2, and this test will not be repeated here. The atmospheric variables used did not exhibit any departures from normality. We applied a suite of NHMMs to the entire (15 years) data set and used the BIC from (8) and the distinctness and realism of the weather states as guides to appropriate values for M and N. Preference was given to NHMMs using a greater number of atmospheric vari- ables (and hence more atmospheric information) rather than a greater number of weather states.
Least squares estimates of parameters in the at-site precip- itation amount models from (9) were obtained for each site and weather state combination. For 0 </5 -< 600, an automated backward elimination procedure was used to determine the adjacent sites that provided useful information about at-site precipitation amounts. The procedure used tends to be cau- tious in rejecting and generous in accepting terms [l/enables and Ripley, 1994].
Ten 15 year sequences of daily precipitation occurrence pat- terns were generated from the selected NHMM, conditionally on the 15 year sequence of historical atmospheric data, using the procedure described by Hughes and Guttorp [1994]. At-site daily precipitation amounts were then simulated conditionally on the weather state and daily precipitation occurrences at neighboring sites. Summary statistics for the simulated daily precipitation series were then compared with their historical counterparts.
5. Results
5.1. Parameter Estimation
Table 1 reports a subset of the results of fitting the condi- tional independence model (6) and the spatial model (equa-
tions (4) and (5)) to the data set described above. Consider the results for the conditional independence model. The BIC cri- terion (8) suggests that the use of the atmospheric circulation data results in a marked improvement in the model fit. Al- though the BIC decreases with increasing N, the rate of de- crease declines sharply at N - 5 regardless of the number of covariates used. Also, the use of three covariates rather than two leads to a marginal decrease in the BIC.
Comparison of the precipitation occurrence patterns and corresponding composite mslp fields for the weather states of the six state NHMMs indicated that the states are reasonably distinct (see, for example, Figure 2). Moreover, the six states have a high degree of physical realism in terms of the synoptic situation, their relative frequency, and precipitation amounts (as summarized in Table 2). In contrast, the seven state NHMMs have two weather states that are almost indistinguish- able. These two states have precipitation occurrence patterns and composite mslp fields that are very similar to those for state 4 in Figure 2. Thus a six state NHMM is appropriate. Further experimentation with six state, conditional indepen- dence models indicated that the 6 - 1, 4, 8 and 6 • 1, 4, 25 NHMMs provided the lowest values of the BIC. (A key to the atmospheric variables nominated herein appears in Table 1.) Finally, comparison of the corresponding spatial models led to the selection of the 6 • 1, 4, 25 spatial model.
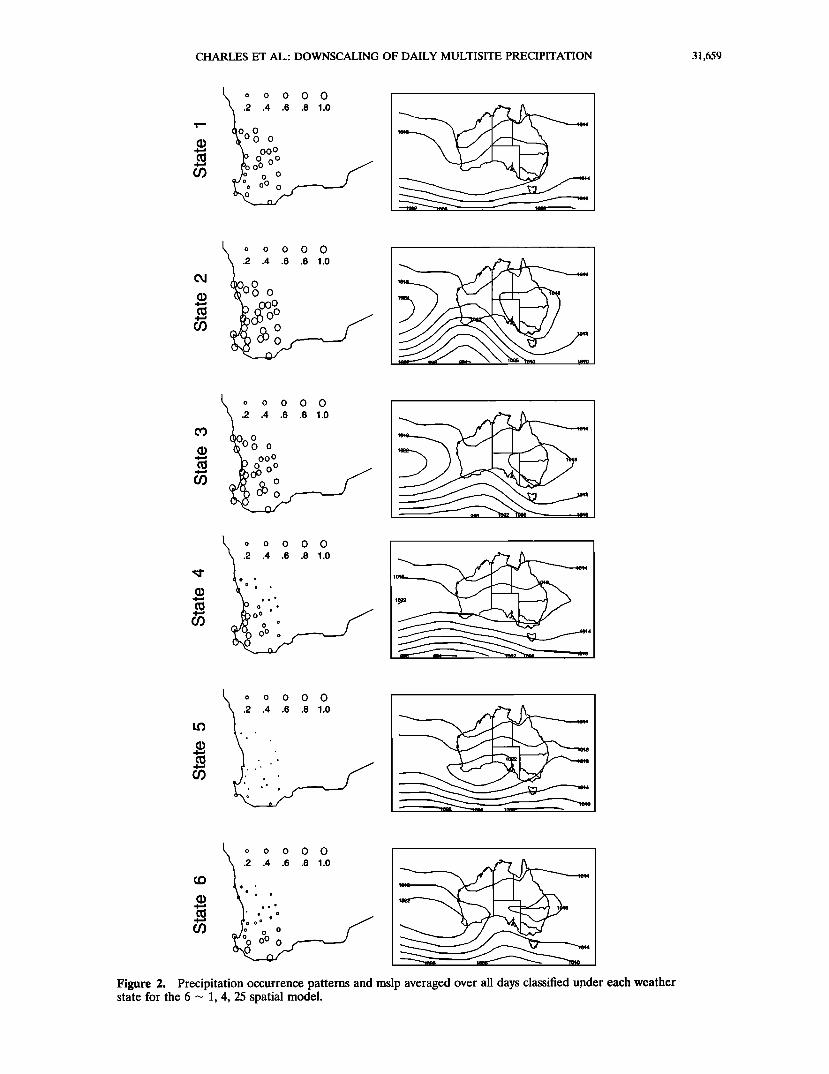
Figure 3 shows box plots of the variances explained by the at-site precipitation amounts models (9) on a weather state and neighborhood radius basis. Each box and its associated whis- kers represents the range of variances explained for the 30 sites. Overall, there is a marked increase in explained variance when/5 is increased from 100 to 300 km and a relatively slight increase when /5 is increased from 300 to 600 km. The ex-
plained variance is low for state 2 and relatively high for state 1. The comparatively poor result for state 2 suggests that in- formation in addition to daily precipitation occurrence at neighboring sites is required to capture the total variance in at-site precipitation amounts for days in that state.
5.2. Simulated Precipitation Occurrence
Figure 4 compares the mean simulated daily precipitation occurrence probabilities with historical values for the 30 sites.
•ete
1 2 3 4 5
Historical log-odds ratio
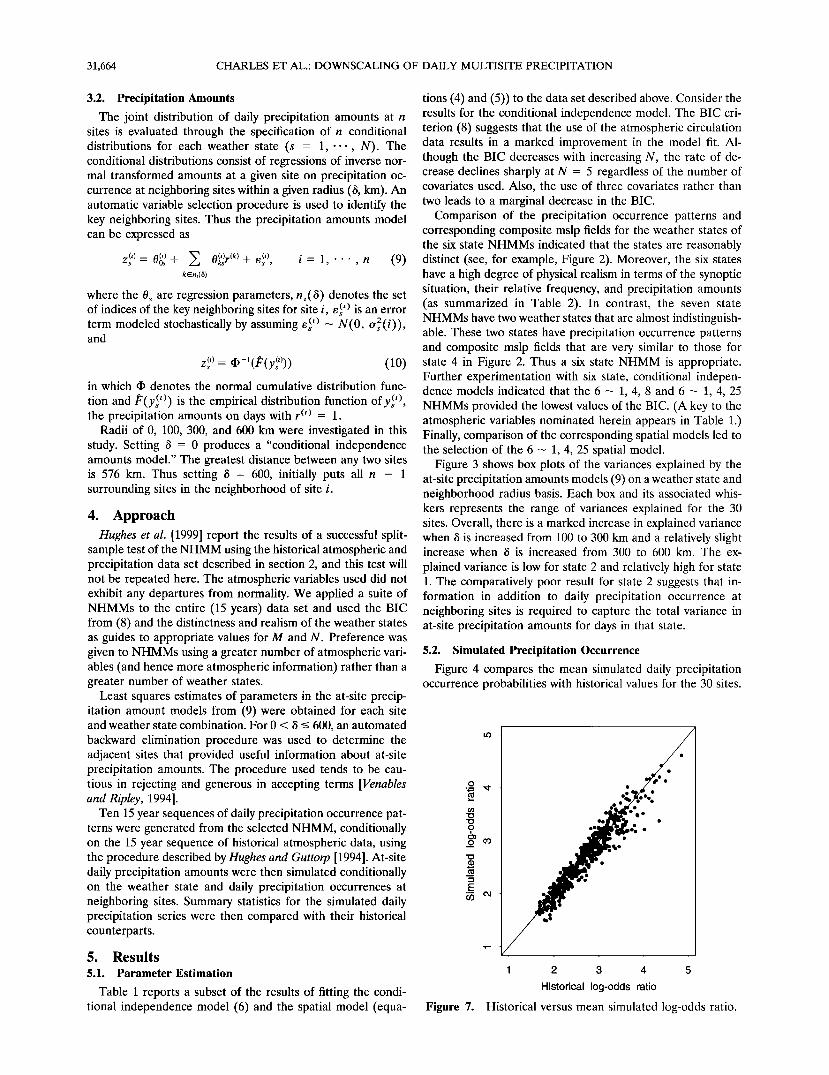
Figure 7. Historical versus mean simulated log-odds ratio.
CHARLES ET AL.: DOWNSCALING OF DAILY MULTISITE PRECIPITATION 31,665
0O 09 O• Og 0
00• OO 09 Ot• Og 0
og o1• o[• og o I. o
(LULU) IlelU!eJ peIelnLu!S
09 Og Ot• 0[• 0g 0 [ 0
0[• 0g 0 I. 0
081. 001. O0 09 0•, 08 0
(LULU) IlelU!eJ pelelnLu!S
31,666 CHARLES ET AL.: DOWNSCALING OF DAILY MULTISITE PRECIPITATION
The simulated precipitation probabilities are close to the ob- served across all sites.
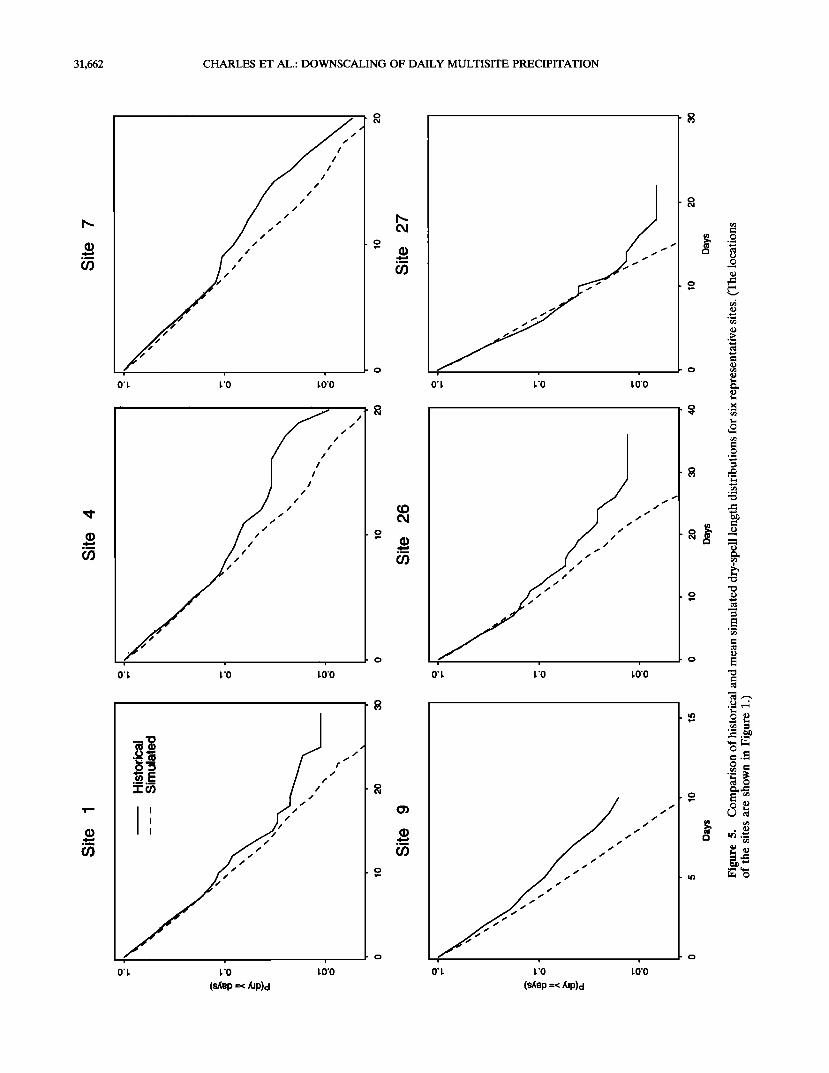
Figure 5 compares the historical distributions and mean simulated distributions of dry spell lengths at six representative sites spread across SWA. (A dry spell is defined as a sequence of consecutive days during which daily precipitation remains below 0.3 mm.) The mean simulated distributions provide good approximations to the historical distributions, particu- larly for the short-duration spells that encompass about 90% of dry events. The discrepancies for the remaining 10% of events may be attributable to uncertainty in their probability esti- mates due to the small sample sizes involved. Also, the ten- dency to underestimate the lengths of extreme dry spells is exaggerated by the use of a log probability scale.
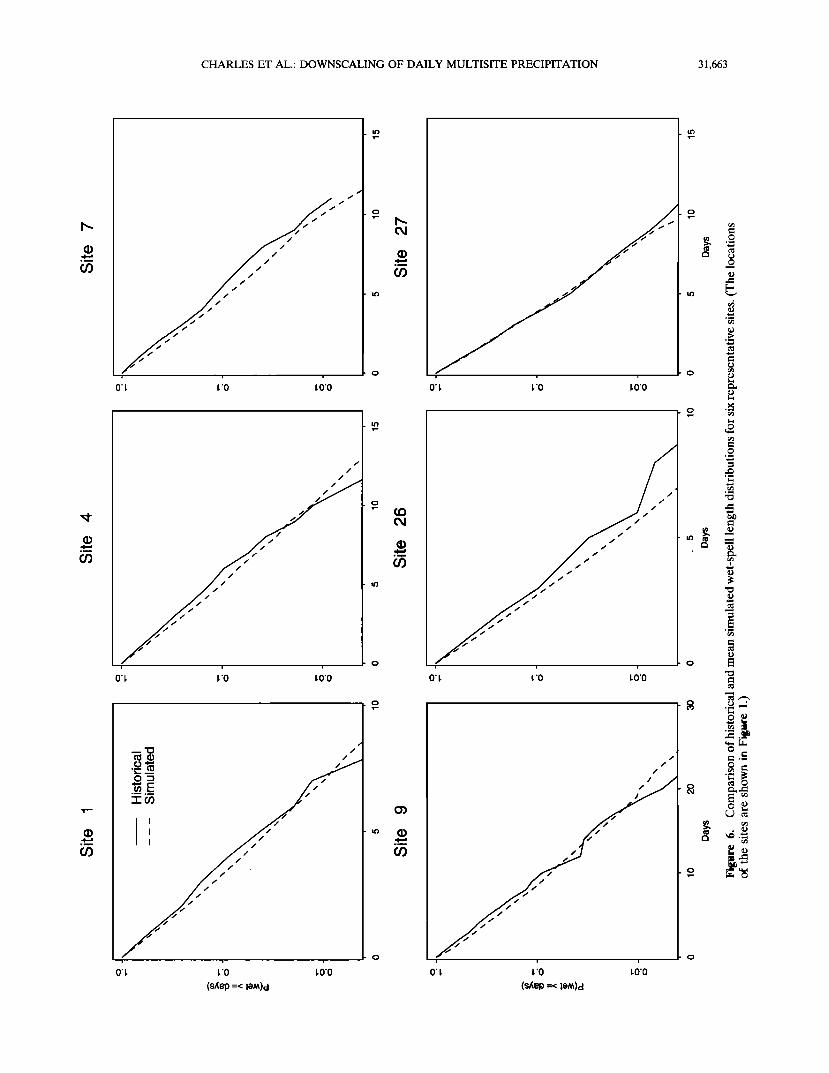
Figure 6 compares the historical distributions and the mean simulated distributions for wet-spell lengths at the six repre- sentative sites. (A wet spell is defined as a sequence of con- secutive days during which the daily precipitation equals or exceeds 0.3 mm.) The mean simulated distributions provide good approximations to the historical distributions, particu- larly for the short-duration spells that encompass --•99% of wet events.
Figure 7 compares the mean simulated log-odds ratio for precipitation occurrence with the observed. (The log-odds ra- tio is a measure of association for binary data, which is anal- ogous to spatial correlation of continuous variables [Kotz and Johnson, 1985].) The selected NHMM clearly captures the spatial correlation between sites, which is induced by the weather states and other effects such as local orography and aspect.
5.3. Simulated Precipitation Amounts
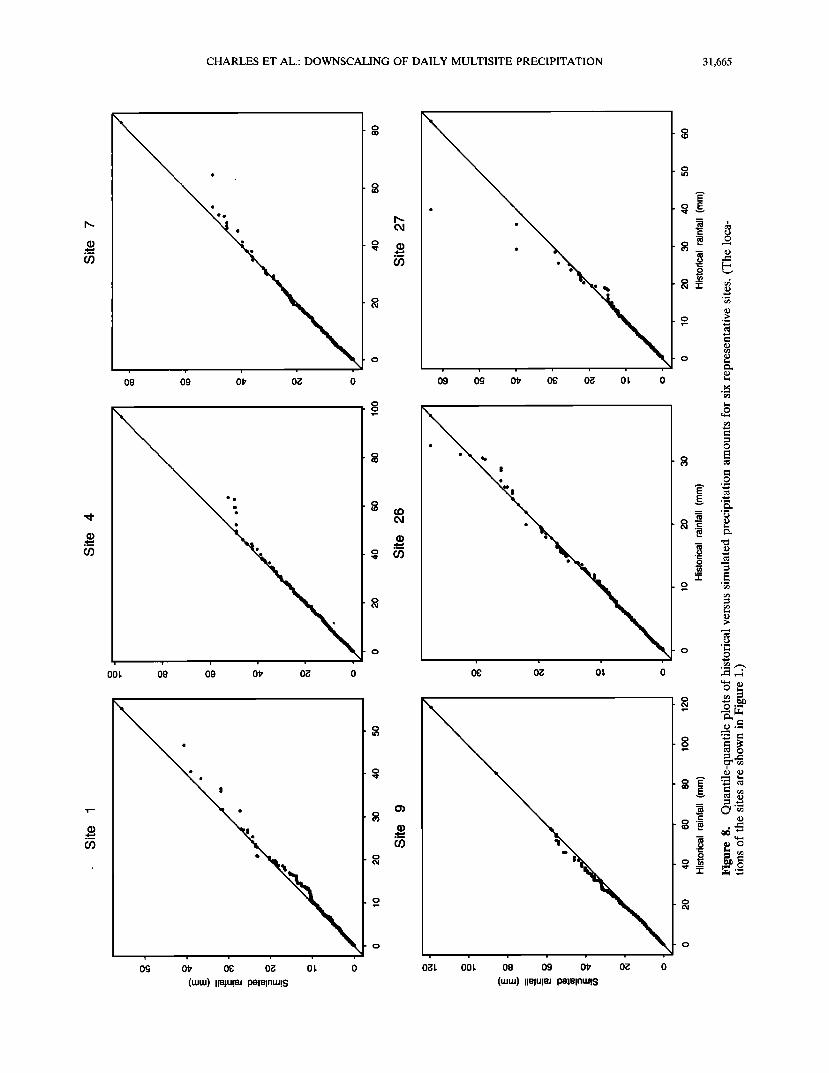
Figure 8 compares the distributions of the historical and simulated precipitation amounts (for 8 = 300) at the six rep- resentative sites, for one of the 10 generated sequences chosen at random. Some discrepancies in the upper tails of the distri- butions are evident due to the deficiencies in simulating amounts for days in state 2. However, the model does well in reproducing all but the largest quantlies of at-site precipita- tion.
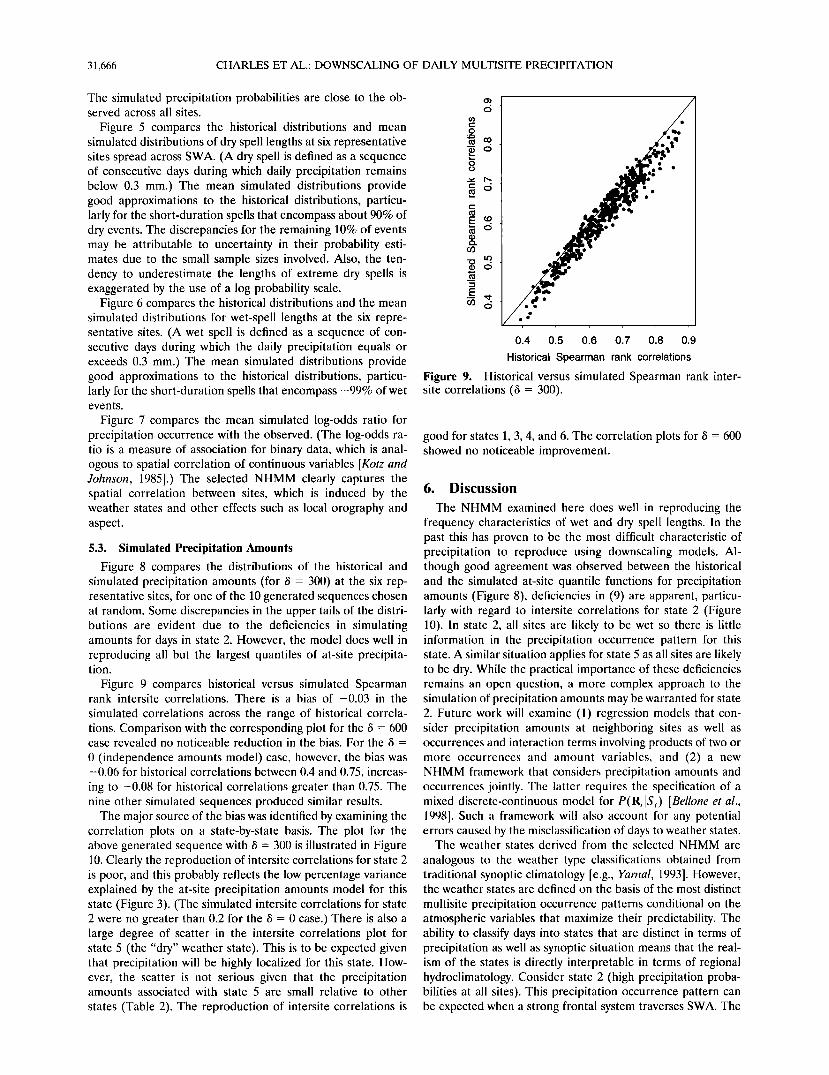
Figure 9 compares historical versus simulated Spearman rank intersite correlations. There is a bias of -0.03 in the
simulated correlations across the range of historical correla- tions. Comparison with the corresponding plot for the 8 = 600 case revealed no noticeable reduction in the bias. For the 8 =
0 (independence amounts model) case, however, the bias was -0.06 for historical correlations between 0.4 and 0.75, increas-
ing to -0.08 for historical correlations greater than 0.75. The nine other simulated sequences produced similar results.
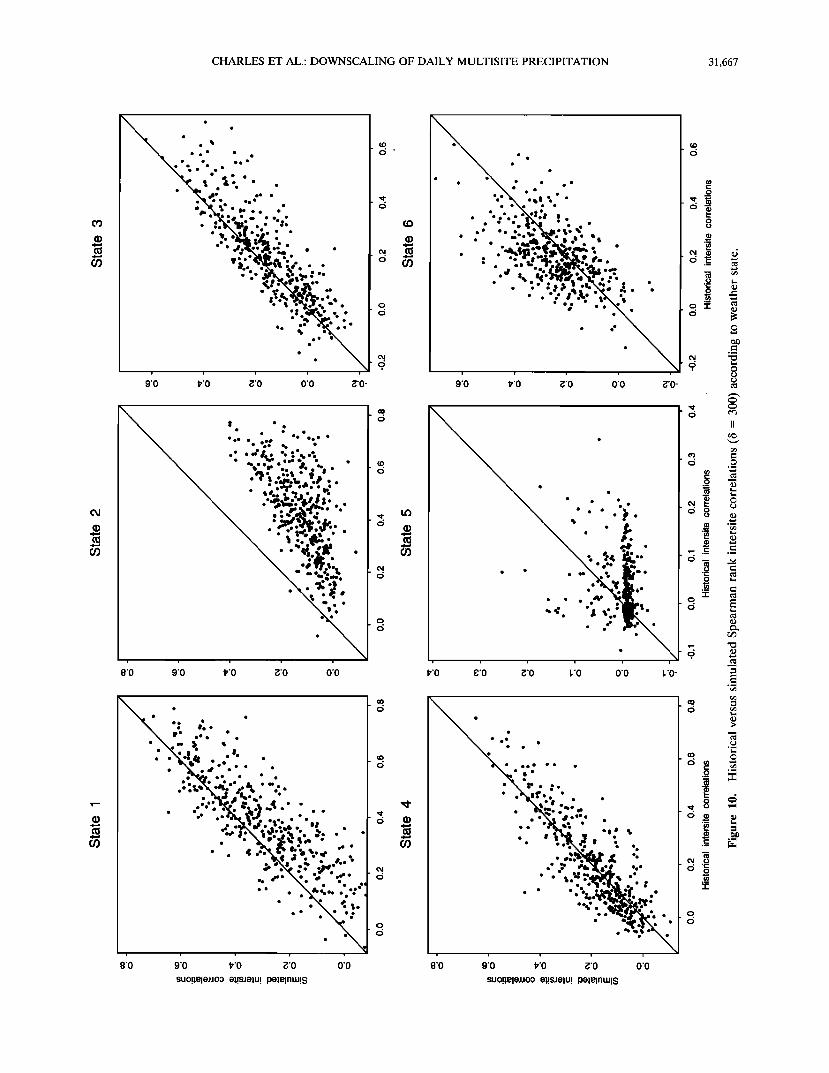
The major source of the bias was identified by examining the correlation plots on a state-by-state basis. The plot for the above generated sequence with 8 = 300 is illustrated in Figure 10. Clearly the reproduction of intersite correlations for state 2 is poor, and this probably reflects the low percentage variance explained by the at-site precipitation amounts model for this state (Figure 3). (The simulated intersite correlations for state 2 were no greater than 0.2 for the 8 = 0 case.) There is also a large degree of scatter in the intersite correlations plot for state 5 (the "dry" weather state). This is to be expected given that precipitation will be highly localized for this state. How- ever, the scatter is not serious given that the precipitation amounts associated with state 5 are small relative to other
states (Table 2). The reproduction of intersite correlations is
0.4 0.5 0.6 0.7 0.8 0.9
Historical Spearman rank correlations
Figure 9. Historical versus simulated Spearman rank inter- site correlations (8 = 300).
good for states 1, 3, 4, and 6. The correlation plots for 8 -- 600 showed no noticeable improvement.
6. Discussion
The NHMM examined here does well in reproducing the frequency characteristics of wet and dry spell lengths. In the past this has proven to be the most difficult characteristic of precipitation to reproduce using downscaling models. Al- though good agreement was observed between the historical and the simulated at-site quantile functions for precipitation amounts (Figure 8), deficiencies in (9) are apparent, particu- larly with regard to intersite correlations for state 2 (Figure 10). In state 2, all sites are likely to be wet so there is little information in the precipitation occurrence pattern for this state. A similar situation applies for state 5 as all sites are likely to be dry. While the practical importance of these deficiencies remains an open question, a more complex approach to the simulation of precipitation amounts may be warranted for state 2. Future work will examine (1) regression models that con- sider precipitation amounts at neighboring sites as well as occurrences and interaction terms involving products of two or more occurrences and amount variables, and (2) a new NHMM framework that considers precipitation amounts and occurrences jointly. The latter requires the specification of a mixed discrete-continuous model for ?(R,l$,) [Bellone et al., 1998]. Such a framework will also account for any potential errors caused by the misclassification of days to weather states.
The weather states derived from the selected NHMM are
analogous to the weather type classifications obtained from traditional synoptic climatology [e.g., Yarnal, 1993]. However, the weather states are defined on the basis of the most distinct
multisite precipitation occurrence patterns conditional on the atmospheric variables that maximize their predictability. The ability to classify days into states that are distinct in terms of precipitation as well as synoptic situation means that the real- ism of the states is directly interpretable in terms of regional hydroclimatology. Consider state 2 (high precipitation proba- bilities at all sites). This precipitation occurrence pattern can be expected when a strong frontal system traverses SWA. The
CHARLES ET AL.: DOWNSCALING OF DAILY MULTISITE PRECIPITATION 31,667
o
o•** * o o o ,0o **o ß
•. :.o '** .* ** **. ß *** *•* ß *•.
ß ß .,r.•:. ' ß øø $ oøLøo ß ß
,...• .%.•....
.. oo ß
, i , ß i ß •
o
o
øo.8 q o ß ß ß oo ß
:;. ß ':.- '. •.••
o
o o
8'0 9'0 •'0 g'O 0'0
suo!leleJJOO el!sJelU! pelelnLu!S
o
*** .ql •, * *
o '..'..' ':.': ,. •,_.. ß :' .. :..-•.- •.s.•.•.. ß ß . .. ::•.•:;•*.
: . "..•' "•.•:._-:•- ,-.. o ß ' ,,r-; -;'._-,LPJC_'."•,,s '"' ..- ,,..,.•.•.•,',,.'•...:;. .
-.
, , , , ,
9'0 1•'0 •'0 0'0 •'0-
.!.
o
ß ß ß øil •
• ß • ß ß 'o ß oo ø
ß ß ø ß ß .øC 0 ø ß ß ß d•ø ß
, i , , i
1•'0 •;'0 •:'0 I. '0 0'0 I. '0-
o
oø , ø
ß 't.,• :. ß ß •ooo ß
o• ø ß ß
- . 0.•% d'**** ß ß ß q• ß
ß .. •, % ß
ß .: .'..'. •,.•,._., ...
_..-,•::.•.• .:.. ß ß ß ß • ß
øoq• o ß
...4L.• ß ... '.
, , , , ,
8'0 9'0 1•'0 •'0 0'0
suo!leleJJoo el!sJelu! pelelnLu!S
31,668 CHARLES ET AL.: DOWNSCALING OF DAILY MULTISITE PRECIPITATION
corresponding synoptic situation in the fitted NHMM is indic- ative of such a system, showing a ridging low-pressure system dominating the region (Figure 2). In comparison, state 3 (wide- spread precipitation occurrence across SWA but high precip- itation probabilities confined to the coast) is indicative of a weak frontal system associated with a low-pressure system lo- cated south of the region. Thus frontal rains are less likely to spread into the hinterland. Similar interpretations can be made for the four remaining states.
It is noteworthy that the 6 - 1, 4, 25 NHMM is preferable to the 6 - 1, 3, 4 NHMM according to the BIC (Table 1). Although variable 3 (T• sø) is a proxy for the absolute mois- ture content of the lower atmosphere, it can be argued that the probability of precipitation occurrence would be better related to a measure of saturation, and so probability of cloud forma- tion, such as variable 25 (DT•Sø). This result has important implications for climate change research. Wilby and Wigley [1997] found that the use of airflow variables (such as mslp) alone in downscaling schemes may not lead to realistic precip- itation changes under projected future climates. They recom- mended the incorporation of measures of atmospheric mois- ture.
7. Conclusions
Our downscaling study was motivated by the need for im- proved quantitative precipitation forecasts, and realistic assess- ments of the regional impacts of natural climate variability and possible climate change due to the enhanced greenhouse ef- fect, at local and regional scales. We restricted our attention to a dense network of 30 precipitation gages in the southwest region of Western Australia. Our main findings may be sum- marized as follows:
1. The nonhomogeneous hidden Markov model (NHMM) of Hughes et al. [1999] reproduces the key statistics of daily precipitation occurrence in the network.
2. Regression models conditioned on the weather states identified by the NHMM provide a simple and parsimonious method of simulating daily precipitation amounts in the net- work. The performance of the conditional independence amounts model confirms that the weather states capture much of the spatial and temporal variability of precipitation and that the regression models incorporate local spatial dependencies in precipitation amounts. There is scope for refinement of precipitation amount simulation, and this will be the subject of future research efforts.
3. Given that the extended NHMM is successful in down-
scaling historical atmospheric circulation data to local and regional scales, it may be useful for identifying weather types for traditional synoptic climatology, downscaling dynamical cli- mate model simulations, and diagnosing problems with scale relationships in climate models. However, a fundamental ca- veat of all statistical downscaling models is that they are not necessarily valid beyond the range of the atmospheric and precipitation data used to fit the model.
4. Our findings apply to one geographical region and sea- son where precipitation is generated by frontal systems. The generality of these findings needs to be tested in other regions where a mix of generation mechanisms is responsible for pre- cipitation.
Acknowledgments. The atmospheric and precipitation data were provided by the National Climate Centre, Commonwealth Bureau of
Meteorology, Australia. This work contributes to the CSIRO Climate Change Research Program and is part funded through the Australian Government's National Greenhouse Research Program. SPC and BCB are grateful for their visiting scholarships held at the National Research Center for Statistics and the Environment, University of Washington, during which the work on the precipitation amounts model was carried out. We also appreciate the constructive comments made by the anonymous reviewers.
References
Bardossy, A., and E. J. Plate, Modeling daily rainfall using a semi- Markov representation of circulation pattern occurrence, J. Hydrol., 122, 33-47, 1991.
Bardossy, A., and E. J. Plate, Space-time model for daily rainfall using atmospheric circulation patterns, Water Resour. Res., 28(5), 1247- 1259, 1992.
Bartholy, J., I. Bogardi, and I. Matyasovszky, Effect of climate change on regional precipitation in Lake Balaton watershed, Theor. Appl. Climatol., 51,237-250, 1995.
Bates, B.C., S. P. Charles, and J.P. Hughes, Stochastic downscaling of numerical climate model simulations, Environ. Modell. Software, •3(3-4), 325-331, 1998.
Baum, L. E., T. Petrie, G. Soules, and N. Weiss, A maximization technique occurring in the statistical analysis of probabilistic func- tions of Markov chains, Ann. Math. Stat., 41, 164-171, 1970.
Bellone, E., P. Guttorp, and J.P. Hughes, A stochastic model for precipitation amounts at multiple stations, paper presented at Sixth International Conference on Precipitation: Predictability of Rainfall at the Various Scales, Natl. Sci. Found. Mauna Lani Bay, Hawaii, June 29-July 1, 1998.
Besag, J. E., Spatial interaction and the statistical analysis of lattice systems, J. R. Stat. Soc., Set. B, 36, 192-236, 1974.
Bogardi, I., I. Matyasovszky, A. Bardossy, and L. Duckstein, Applica- tion of a space-time stochastic model for daily precipitation using atmospheric circulation patterns, J. Geophys. Res., 98, 16,653-16,667, 1993.
Crane, R. G., and B.C. Hewitson, Doubled CO2 precipitation changes for the Susquehanna basin: Down-scaling from the GENESIS gen- eral circulation model, Int. J. Climatol., 18, 65-76, 1998.
Cressie, N. A. C., Statistics for Spatial Data, 900 pp., John Wiley, New York, 1991.
Dempster, A. P., N.M. Laird, and D. B. Rubin, Maximum likelihood from incomplete data via the EM algorithm (with discussion), J. R. Stat. Soc., Set. B, 39, 1-38, 1977.
Enke, W., and A. Spekat, Downscaling climate model outputs into local and regional weather elements by classification and regression, Clim. Res., 8, 195-207, 1997.
Forney, G. D., Jr., The Viterbi algorithm, Proc. IEEE, 61,268-278, 1978.
Gentilli, J., Australian Climate Patterns, 285 pp., Nelson, Melbourne, 1972.
Geyer, C. J., and E. A. Thompson, Constrained Monte Carlo maxi- mum likelihood for dependent data, J. R. Stat. Soc., Set. B, 54, 657-699, 1992.
Hay, L. E., G. J. McCabe, D. M. Wolock, and M. A. Ayers, Simulation of precipitation by weather type analysis, Water Resour. Res., 27(4), 493-501, 1991.
Hewitson, B.C., and R. G. Crane, Climate downscaling: Techniques and application, Clim. Res., 7, 85-95, 1996.
Hughes, J.P., and P. Guttorp, Incorporating spatial dependence and atmospheric data in a model of precipitation, J. Appl. Meteorol., 33(12), 1503-1515, 1994.
Hughes, J.P., P. Guttorp, and S. P. Charles, A non-homogeneous hidden Markov model for precipitation occurrence, Appl. Stat., 48(1), 15-30, 1999.
Huth, R., Potential of continental-scale circulation for the determina- tion of local daily surface variables, Theor. Appl. Climatol., 56, 165- 186, 1997.
Kidson, J. W., and C. S. Thompson, A comparison of statistical and model-based downscaling techniques for estimating local climate variations, J. Clim., 11 (4), 735-753, 1998.
Kilsby, C. G., P.S. P. Cowpertwait, P. E. O'Connell, and P. D. Jones, Predicting rainfall statistics in England and Wales using atmospheric circulation variables, Int. J. Climatol., 18, 523-539, 1998.
Kotz, S., and N. L. Johnson, Encyclopedia of Statistical Sciences, vol. 6, 758 pp., John Wiley, New York, 1985.
CHARLES ET AL.: DOWNSCALING OF DAILY MULTISITE PRECIPITATION 31,669
Matyasovszky, I., I. Bogardi, A. Bardossy, and L. Duckstein, Estima- tion of local precipitation statistics reflecting climate change, Water Resour. Res., 29(12), 3955-3968, 1993a.
Matyasovszky, I., I. Bogardi, A. Bardossy, and L. Duckstein, Space- time precipitation reflecting climate change, Hydrol. Sci. J., 38(6), 539-558, 1993b.
Mearns, L. O., F. Giorgi, L. McDaniel, and C, Shields, Analysis of daily variability of precipitation in a nested regional climate model: Com- parison with observations and doubled CO2 results, Global Planet. Change, 10, 55-78, 1995.
Venables, W. N., and B. D. Ripley, Modem Applied Statistics With S-Plus, 462 pp., Springer-Verlag, New York, 1994.
Walsh, K. J. E., and J. L. McGregor, January and July climate simu- lations over the Australian region using a limited-area model, J. Clim., 8(10), 2387-2403, 1995.
Walsh, K. J. E., and J. L. McGregor, An assessment of simulations of climate variability over Australia with a limited area model, Int. J. Climatol., 17, 201-223, 1997.
Wilby, R. L., and T. M. L. Wigley, Downscaling general circulation model output: A review of methods and limitations, Prog. Phys. Geogr., 2•(4), 530-548, 1997.
Wilby, R. L., H. Hassan, and K. Hanaki, Statistical downscaling of hydrometeorological variables using general circulation model out- put, J. Hydrol., 205, 1-19, 1998.
Wilson, L. L., D. P. Lettenmaier, and E. F. Wood, Simulation of daily
precipitation in the Pacific Northwest using a weather classification scheme, Surv. Geophys., 12, 127-142, 1991.
Wilson, L. L., D. P. Lettenmaier, and E. Skyllingstad, A hierarchical stochastic model of large-scale atmospheric circulation patterns and multiple station daily precipitation, J. Geophys. Res., 97, 2791-2809, 1992.
Wright, P. B., Seasonal rainfall in Southwestern Australia and the general circulation, Mon. Weather Rev., 102, 219-232, 1974.
Yarnal, B., Synoptic Climatology in Environmental Analysis: A Primer., 195 pp., Belhaven, London, 1993.
Zorita, E., J.P. Hughes, D. P. Lettenmaier, and H. Von Storch, Stochastic characterization of regional circulation patterns for cli- mate model diagnosis and estimation of local precipitation, J. Clim., 8(5), 1023-1042, 1995.
B.C. Bates, and S. P. Charles, CSIRO Land and Water, Private Bag P.O., Wembley, Western Australia 6014, Australia. (stephen.charles@ per.clw.csiro.au; [email protected])
J.P. Hughes, Department of Biostatistics, University of Washington, Seattle, WA 98195. ([email protected])
(Received October 15, 1998; revised February 18, 1999; accepted February 23, 1999.)
Related Documents