A Software Reference Architecture for Semantic-Aware Big Data Systems Sergi Nadal a,* , Victor Herrero a , Oscar Romero a , Alberto Abelló a , Xavier Franch a , Stijn Vansummeren b , Danilo Valerio c a Universitat Politècnica de Catalunya - BarcelonaTech b Université Libre de Bruxelles c Corporate Research and Technology, Siemens AG Österreich Abstract Context: Big Data systems are a class of software systems that ingest, store, process and serve massive amounts of heterogeneous data, from multiple sources. Despite their undisputed impact in current society, their engineering is still in its infancy and companies find it difficult to adopt them due to their inherent complexity. Existing attempts to provide architectural guidelines for their engi- neering fail to take into account important Big Data characteristics, such as the management, evolution and quality of the data. Objective: In this paper, we follow software engineering principles to refine the λ-architecture, a reference model for Big Data systems, and use it as seed to create Bolster, a software reference architecture (SRA) for semantic-aware Big Data systems. Method: By including a new layer into the λ-architecture, the Semantic Layer, Bolster is capable of handling the most representative Big Data characteristics (i.e., Volume, Velocity, Variety, Variability and Veracity). Results: We present the successful implementation of Bolster in three industrial projects, involving five organizations. The validation results show high level of agreement among practitioners from all organizations with respect to standard quality factors. Conclusion: As an SRA, Bolster allows organizations to design concrete ar- chitectures tailored to their specific needs. A distinguishing feature is that it provides semantic-awareness in Big Data Systems. These are Big Data sys- tem implementations that have components to simplify data definition and exploitation. In particular, they leverage metadata (i.e., data describing data) to enable (partial) automation of data exploitation and to aid the user in their * Corresponding author. Address: Campus Nord Omega-125, UPC - dept ESSI, C/Jordi Girona Salgado 1-3, 08034 Barcelona, Spain Email addresses: [email protected] (Sergi Nadal), [email protected] (Victor Herrero), [email protected] (Oscar Romero), [email protected] (Alberto Abelló), [email protected] (Xavier Franch), [email protected] (Stijn Vansummeren), [email protected] (Danilo Valerio) Preprint submitted to Information and Software Technology May 22, 2017

Welcome message from author
This document is posted to help you gain knowledge. Please leave a comment to let me know what you think about it! Share it to your friends and learn new things together.
Transcript
A Software Reference Architecture for Semantic-AwareBig Data Systems
Sergi Nadala,∗, Victor Herreroa, Oscar Romeroa, Alberto Abellóa, XavierFrancha, Stijn Vansummerenb, Danilo Valerioc
aUniversitat Politècnica de Catalunya - BarcelonaTechbUniversité Libre de Bruxelles
cCorporate Research and Technology, Siemens AG Österreich
Abstract
Context: Big Data systems are a class of software systems that ingest, store,process and serve massive amounts of heterogeneous data, from multiple sources.Despite their undisputed impact in current society, their engineering is still inits infancy and companies find it difficult to adopt them due to their inherentcomplexity. Existing attempts to provide architectural guidelines for their engi-neering fail to take into account important Big Data characteristics, such as themanagement, evolution and quality of the data.Objective: In this paper, we follow software engineering principles to refine theλ-architecture, a reference model for Big Data systems, and use it as seed tocreate Bolster, a software reference architecture (SRA) for semantic-aware BigData systems.Method: By including a new layer into the λ-architecture, the Semantic Layer,Bolster is capable of handling the most representative Big Data characteristics(i.e., Volume, Velocity, Variety, Variability and Veracity).Results: We present the successful implementation of Bolster in three industrialprojects, involving five organizations. The validation results show high level ofagreement among practitioners from all organizations with respect to standardquality factors.Conclusion: As an SRA, Bolster allows organizations to design concrete ar-chitectures tailored to their specific needs. A distinguishing feature is that itprovides semantic-awareness in Big Data Systems. These are Big Data sys-tem implementations that have components to simplify data definition andexploitation. In particular, they leverage metadata (i.e., data describing data)to enable (partial) automation of data exploitation and to aid the user in their
∗Corresponding author. Address: Campus Nord Omega-125, UPC - dept ESSI, C/JordiGirona Salgado 1-3, 08034 Barcelona, Spain
Email addresses: [email protected] (Sergi Nadal), [email protected] (VictorHerrero), [email protected] (Oscar Romero), [email protected] (Alberto Abelló),[email protected] (Xavier Franch), [email protected] (Stijn Vansummeren),[email protected] (Danilo Valerio)
Preprint submitted to Information and Software Technology May 22, 2017
decision making processes. This simplification supports the differentiation ofresponsibilities into cohesive roles enhancing data governance.
Keywords: Big Data, Software Reference Architecture, Semantic-Aware, DataManagement, Data Analysis
1. Introduction1
Major Big Data players, such as Google or Amazon, have developed large2
Big Data systems that align their business goals with complex data management3
and analysis. These companies exemplify an emerging paradigm shift towards4
data-driven organizations, where data are turned into valuable knowledge that5
becomes a key asset for their business. In spite of the inherent complexity of6
these systems, software engineering methods are still not widely adopted in their7
construction (Gorton and Klein, 2015). Instead, they are currently developed8
as ad-hoc, complex architectural solutions that blend together several software9
components (usually coming from open-source projects) according to the system10
requirements.11
An example is the Hadoop ecosystem. In Hadoop, lots of specialized Apache12
projects co-exist and it is up to Big Data system architects to select and orches-13
trate some of them to produce the desired result. This scenario, typical from14
immature technologies, raises high-entry barriers for non-expert players who15
struggle to deploy their own solutions overwhelmed by the amount of available16
and overlapping components. Furthermore, the complexity of the solutions17
currently produced requires an extremely high degree of specialization. The18
system end-user needs to be what is nowadays called a “data scientist”, a data19
analysis expert proficient in managing data stored in distributed systems to20
accommodate them to his/her analysis tasks. Thus, s/he needs to master two21
profiles that are clearly differentiated in traditional Business Intelligence (BI)22
settings: the data steward and the data analyst, the former responsible of data23
management and the latter of data analysis. Such combined profile is rare and24
subsequently entails an increment of costs and knowledge lock-in.25
Since the current practice of ad-hoc design when implementing Big Data26
systems is hence undesirable, improved software engineering approaches special-27
ized for Big Data systems are required. In order to contribute towards this goal,28
we explore the notion of Software Reference Architecture (SRA) and present29
Bolster, an SRA for Big Data systems. SRAs are generic architectures for a30
class of software systems (Angelov et al., 2012). They are used as a foundation31
to derive software architectures adapted to the requirements of a particular32
organizational context. Therefore, they open the door to effective and efficient33
production of complex systems. Furthermore, in an emergent class of systems34
(such as Big Data systems), they make it possible to synthesize in a systematic35
way a consolidated solution from available knowledge. As a matter of fact,36
the detailed design of such a complex architecture has already been designated37
as a major Big Data software engineering research challenge (Madhavji et al.,38
2
2015; Esteban, 2016). Well-known examples of SRAs include the successful39
AUTOSAR SRA (Martínez-Fernández et al., 2015) for the automotive industry,40
the Internet of Things Architecture (IoT-A) (Weyrich and Ebert, 2016), an41
SRA for web browsers (Grosskurth and Godfrey, 2005) and the NIST Cloud42
Computing Reference Architecture (Liu et al., 2012).43
As an SRA, Bolster paves the road to the prescriptive development of software44
architectures that lie at the heart of every new Big Data system. Using Bolster,45
the work of the software architect is not to produce a new architecture from a46
set of independent components that need to be assembled. Instead, the software47
architect knows beforehand what type of components are needed and how they48
are interconnected. Therefore, his/her main responsibility is the selection of49
technologies for those components given the concrete requirements and the50
goals of the organization. Bolster is a step towards the homogeneization and51
definition of a Big Data Management System (BDMS), as done in the past52
for Database Management Systems (DBMS) (Garcia-Molina et al., 2009) and53
Distributed Database Management Systems (DDBMS) (Özsu and Valduriez,54
2011). A distinguishing feature of Bolster is that it provides an SRA for semantic-55
aware Big Data Systems. These are Big Data system implementations that have56
components to simplify data definition and data exploitation. In particular,57
such type of systems leverage on metadata (i.e., data describing data) to enable58
(partial) automation of data exploitation and to aid the user in their decision59
making processes. This definition supports the differentiation of responsibilities60
into cohesive roles, the data steward and the data analyst, enhancing data61
governance.62
Contributions. The main contributions of this paper are as follows:63
• Taking as building blocks the five “V’s” that define Big Data systems (see64
Section 2), we define the set of functional requirements sought in each to65
realize a semantic-aware Big Data architecture. Such requirements will66
further drive the design of Bolster.67
• Aiming to study the related work on Big Data architectures, we perform a68
lightweight Systematic Literature Review. Its main outcome consists on69
the division of 21 works into two great families of Big Data architectures.70
• We present Bolster, an SRA for semantic-aware Big Data systems. Com-71
bining principles from the two identified families, it succeeds on satisfying72
all the posed Big Data requirements. Bolster relies on the systematic73
use of semantic annotations to govern its data lifecycle, overcoming the74
shortcomings present in the studied architectures.75
• We propose a framework to simplify the instantiation of Bolster to different76
Big Data ecosystems. For the sake of this paper, we precisely focus on77
the components of the Apache Hadoop and Amazon Web Services (AWS)78
ecosystems.79
3
• We detail the deployment of Bolster in three different industrial scenarios,80
showcasing how it adapts to their specific requirements. Furthermore, we81
provide the results of its validation after interviewing practitioners in such82
organizations.83
Outline. The paper is structured as follows. Section 2 introduces the Big84
Data dimensions and requirements sought. Section 3 presents the Systematic85
Literature Review. Sections 4, 5 and 6 detail the elements that compose Bolster,86
an exemplar case study implementing it and the proposed instantiation method87
respectively. Further, Sections 7 report the industrial deployments and validation.88
Finally, Section 8 wraps up the main conclusions derived from this work.89
2. Big Data Definition and Dimensions90
Big Data is a natural evolution of BI, and inherits its ultimate goal of91
transforming raw data into valuable knowledge. Nevertheless, traditional BI92
architectures, whose de-facto architectural standard is the Data Warehouse93
(DW), cannot be reused in Big Data settings. Indeed, the so-popular characteri-94
zation of Big Data in terms of the three “V’s (Volume, Velocity and Variety)”95
(Jagadish et al., 2014), refers to the inability of DW architectures, which typically96
rely on relational databases, to deal and adapt to such large, rapidly arriving97
and heterogeneous amounts of data. To overcome such limitations, Big Data98
architectures rely on NOSQL (Not Only SQL), co-relational database systems99
where the core data structure is not the relation (Meijer and Bierman, 2011), as100
their building blocks. Such systems propose new solutions to address the three101
V’s by (i) distributing data and processing in a cluster (typically of commod-102
ity machines) and (ii) by introducing alternative data models. Most NOSQL103
systems distribute data (i.e., fragment and replicate it) in order to parallelize104
its processing while exploiting the data locality principle, ideally yielding a105
close-to-linear scale-up and speed-up (Özsu and Valduriez, 2011). As enunciated106
by the CAP theorem (Brewer, 2000), distributed NOSQL systems must relax the107
well-known ACID (Atomicity, Consistency, Isolation, Durability) set of properties108
and the traditional concept of transaction to cope with large-scale distributed109
processing. As result, data consistency may be compromised but it enables the110
creation of fault-tolerant systems able to parallelize complex and time-consuming111
data processing tasks. Orthogonally, NOSQL systems also focus on new data112
models to reduce the impedance mismatch (Gray et al., 2005). Graph, key-value113
or document-based modeling provide the needed flexibility to accommodate114
dynamic data evolution and overcome the traditional staticity of relational DWs.115
Such flexibility is many times acknowledged by referring to such systems as116
schemaless databases. These two premises entailed a complete rethought of117
the internal structures as well as the means to couple data analytics on top of118
such systems. Consequently, it also gave rise to the Small and Big Analytics119
concepts (Stonebraker, 2012), which refer to performing traditional OLAP/-120
Query&Reporting to gain quick insight into the data sets by means of descriptive121
4
analytics (i.e., Small Analytics) and Data Mining/Machine Learning to enable122
predictive analytics (i.e., Big Analytics) on Big Data systems, respectively.123
In the last years, researchers and practitioners have widely extended the124
three “V’s” definition of Big Data as new challenges appear. Among all existing125
definitions of Big Data, we claim that the real nature of Big Data can be126
covered by five of those “V’s”, namely: (a) Volume, (b) Velocity, (c) Variety,127
(d) Variability and (e) Veracity. Note that, in contrast to other works, we do128
not consider Value. Considering that any decision support system (DSS) is the129
result of a tightly coupled collaboration between business and IT (García et al.,130
2016), Value falls into the business side while the aforementioned dimensions131
focus on the IT side. In the rest of this paper we refer to the above-mentioned132
“V’s” also as Big Data dimensions.133
In this section, we provide insights on each dimension as well as a list of134
linked requirements that we consider a Big Data architecture should fulfill. Such135
requirements were obtained in two ways: firstly inspired by reviewing related136
literature on Big Data requirements (Gani et al., 2016; Agrawal et al., 2011;137
Russom, 2011; Fox and Chang, 2015; Chen and Zhang, 2014); secondly they138
were validated and refined by informally discussing with the stakeholders from139
several industrial Big Data projects (see Section 7) and obtaining their feedback.140
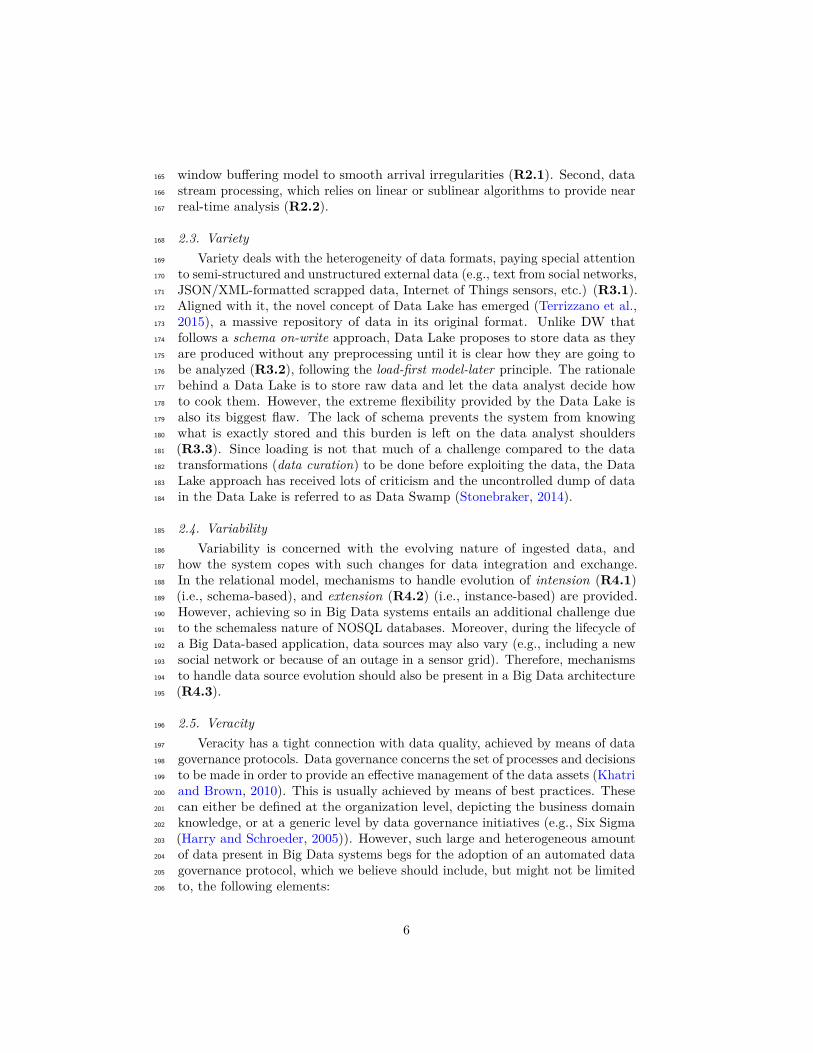
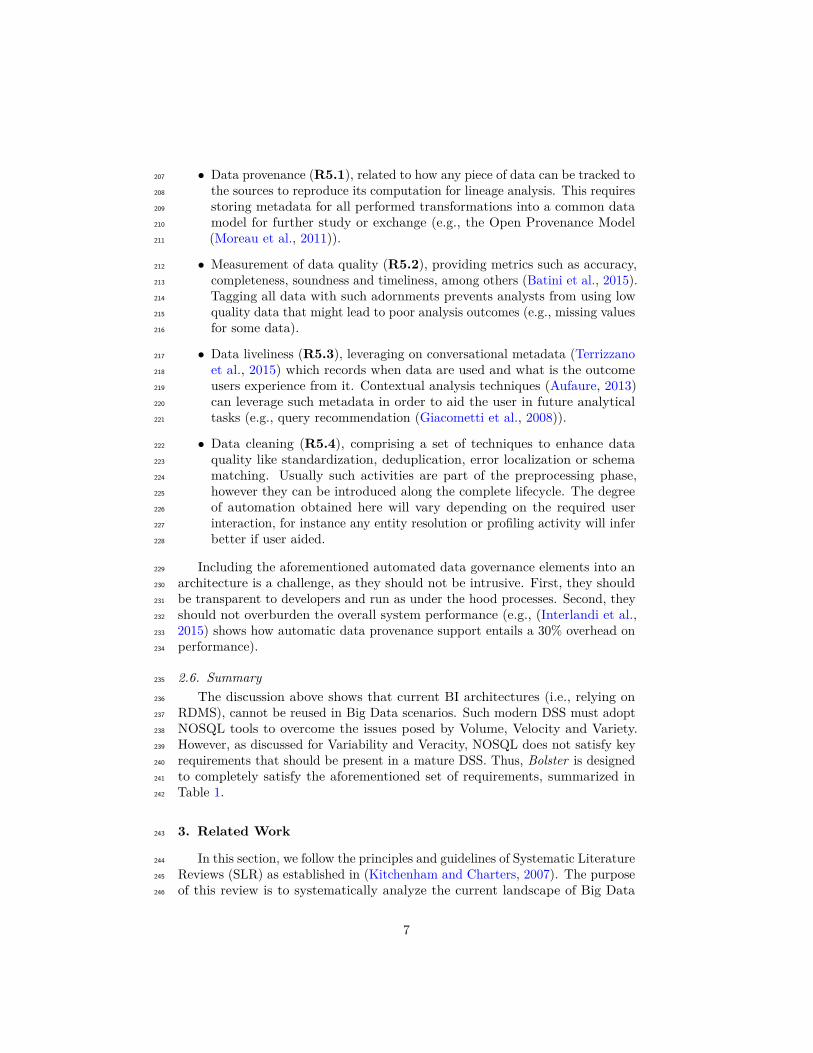
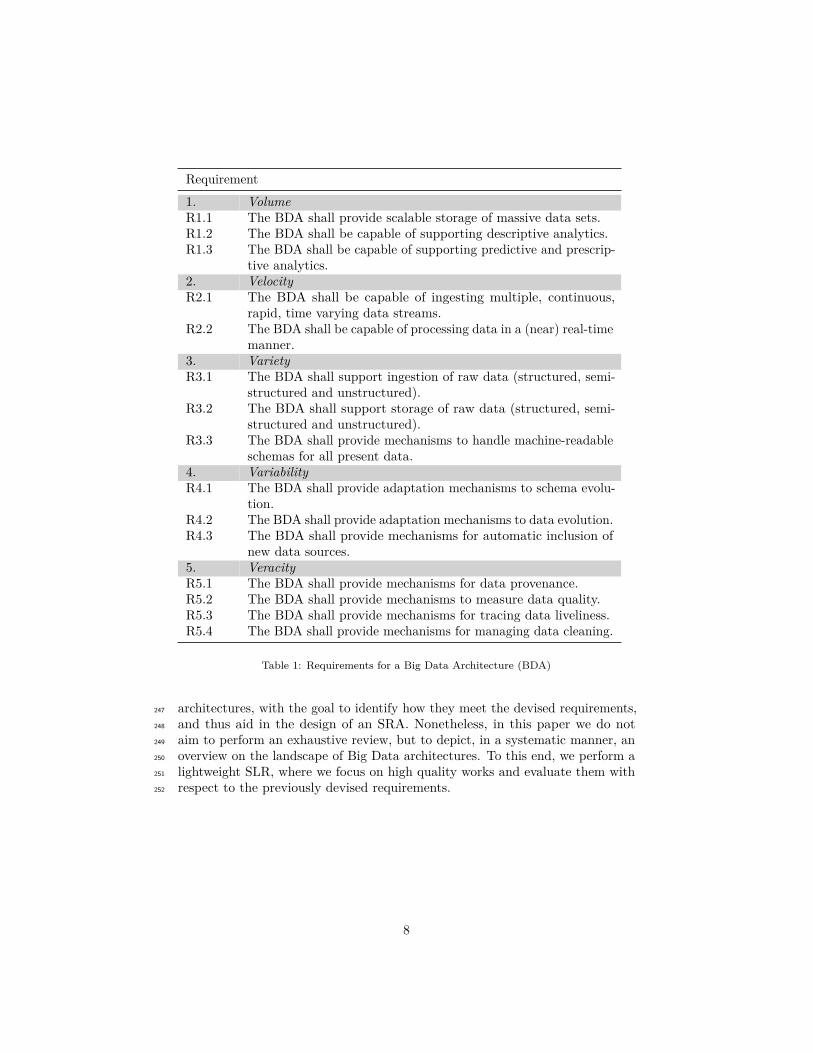
Finally, a summary of devised requirements for each Big Data dimension is141
depicted in Table 1. Note that such list does not aim to provide an exhaustive142
set of requirements for Big Data architectures, but a high-level baseline on the143
main requirements any Big Data architecture should achieve to support each144
dimension.145
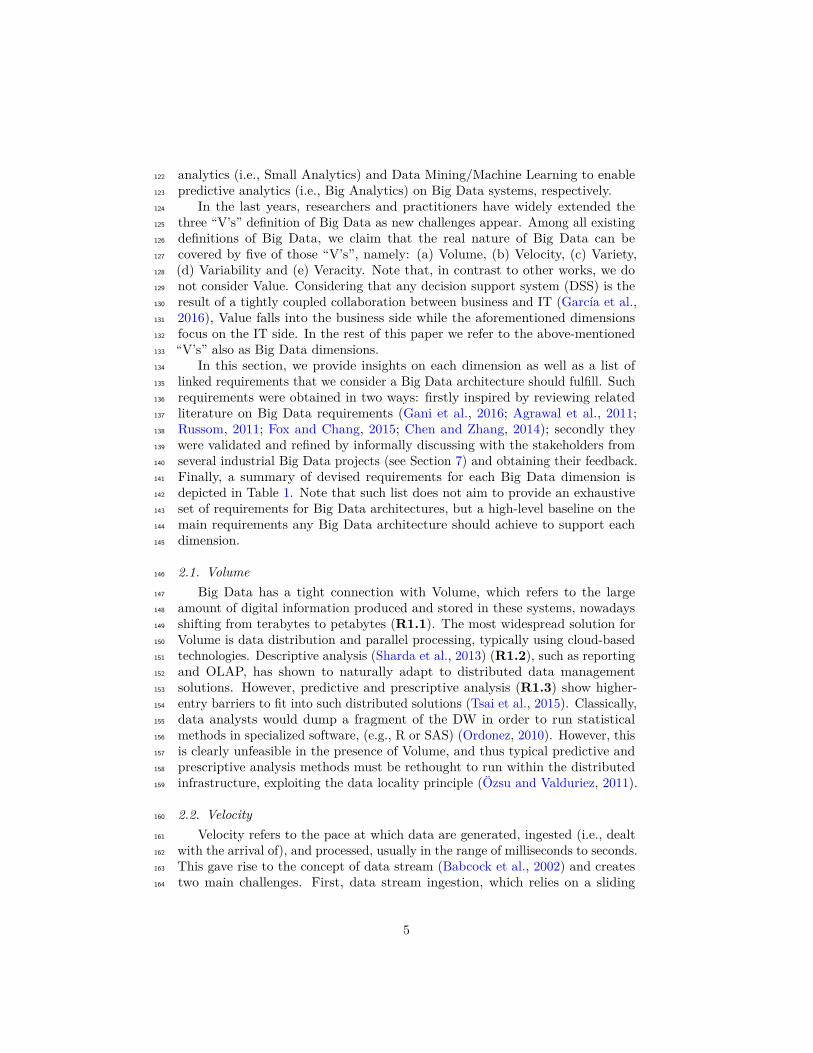
2.1. Volume146
Big Data has a tight connection with Volume, which refers to the large147
amount of digital information produced and stored in these systems, nowadays148
shifting from terabytes to petabytes (R1.1). The most widespread solution for149
Volume is data distribution and parallel processing, typically using cloud-based150
technologies. Descriptive analysis (Sharda et al., 2013) (R1.2), such as reporting151
and OLAP, has shown to naturally adapt to distributed data management152
solutions. However, predictive and prescriptive analysis (R1.3) show higher-153
entry barriers to fit into such distributed solutions (Tsai et al., 2015). Classically,154
data analysts would dump a fragment of the DW in order to run statistical155
methods in specialized software, (e.g., R or SAS) (Ordonez, 2010). However, this156
is clearly unfeasible in the presence of Volume, and thus typical predictive and157
prescriptive analysis methods must be rethought to run within the distributed158
infrastructure, exploiting the data locality principle (Özsu and Valduriez, 2011).159
2.2. Velocity160
Velocity refers to the pace at which data are generated, ingested (i.e., dealt161
with the arrival of), and processed, usually in the range of milliseconds to seconds.162
This gave rise to the concept of data stream (Babcock et al., 2002) and creates163
two main challenges. First, data stream ingestion, which relies on a sliding164
5
window buffering model to smooth arrival irregularities (R2.1). Second, data165
stream processing, which relies on linear or sublinear algorithms to provide near166
real-time analysis (R2.2).167
2.3. Variety168
Variety deals with the heterogeneity of data formats, paying special attention169
to semi-structured and unstructured external data (e.g., text from social networks,170
JSON/XML-formatted scrapped data, Internet of Things sensors, etc.) (R3.1).171
Aligned with it, the novel concept of Data Lake has emerged (Terrizzano et al.,172
2015), a massive repository of data in its original format. Unlike DW that173
follows a schema on-write approach, Data Lake proposes to store data as they174
are produced without any preprocessing until it is clear how they are going to175
be analyzed (R3.2), following the load-first model-later principle. The rationale176
behind a Data Lake is to store raw data and let the data analyst decide how177
to cook them. However, the extreme flexibility provided by the Data Lake is178
also its biggest flaw. The lack of schema prevents the system from knowing179
what is exactly stored and this burden is left on the data analyst shoulders180
(R3.3). Since loading is not that much of a challenge compared to the data181
transformations (data curation) to be done before exploiting the data, the Data182
Lake approach has received lots of criticism and the uncontrolled dump of data183
in the Data Lake is referred to as Data Swamp (Stonebraker, 2014).184
2.4. Variability185
Variability is concerned with the evolving nature of ingested data, and186
how the system copes with such changes for data integration and exchange.187
In the relational model, mechanisms to handle evolution of intension (R4.1)188
(i.e., schema-based), and extension (R4.2) (i.e., instance-based) are provided.189
However, achieving so in Big Data systems entails an additional challenge due190
to the schemaless nature of NOSQL databases. Moreover, during the lifecycle of191
a Big Data-based application, data sources may also vary (e.g., including a new192
social network or because of an outage in a sensor grid). Therefore, mechanisms193
to handle data source evolution should also be present in a Big Data architecture194
(R4.3).195
2.5. Veracity196
Veracity has a tight connection with data quality, achieved by means of data197
governance protocols. Data governance concerns the set of processes and decisions198
to be made in order to provide an effective management of the data assets (Khatri199
and Brown, 2010). This is usually achieved by means of best practices. These200
can either be defined at the organization level, depicting the business domain201
knowledge, or at a generic level by data governance initiatives (e.g., Six Sigma202
(Harry and Schroeder, 2005)). However, such large and heterogeneous amount203
of data present in Big Data systems begs for the adoption of an automated data204
governance protocol, which we believe should include, but might not be limited205
to, the following elements:206
6
• Data provenance (R5.1), related to how any piece of data can be tracked to207
the sources to reproduce its computation for lineage analysis. This requires208
storing metadata for all performed transformations into a common data209
model for further study or exchange (e.g., the Open Provenance Model210
(Moreau et al., 2011)).211
• Measurement of data quality (R5.2), providing metrics such as accuracy,212
completeness, soundness and timeliness, among others (Batini et al., 2015).213
Tagging all data with such adornments prevents analysts from using low214
quality data that might lead to poor analysis outcomes (e.g., missing values215
for some data).216
• Data liveliness (R5.3), leveraging on conversational metadata (Terrizzano217
et al., 2015) which records when data are used and what is the outcome218
users experience from it. Contextual analysis techniques (Aufaure, 2013)219
can leverage such metadata in order to aid the user in future analytical220
tasks (e.g., query recommendation (Giacometti et al., 2008)).221
• Data cleaning (R5.4), comprising a set of techniques to enhance data222
quality like standardization, deduplication, error localization or schema223
matching. Usually such activities are part of the preprocessing phase,224
however they can be introduced along the complete lifecycle. The degree225
of automation obtained here will vary depending on the required user226
interaction, for instance any entity resolution or profiling activity will infer227
better if user aided.228
Including the aforementioned automated data governance elements into an229
architecture is a challenge, as they should not be intrusive. First, they should230
be transparent to developers and run as under the hood processes. Second, they231
should not overburden the overall system performance (e.g., (Interlandi et al.,232
2015) shows how automatic data provenance support entails a 30% overhead on233
performance).234
2.6. Summary235
The discussion above shows that current BI architectures (i.e., relying on236
RDMS), cannot be reused in Big Data scenarios. Such modern DSS must adopt237
NOSQL tools to overcome the issues posed by Volume, Velocity and Variety.238
However, as discussed for Variability and Veracity, NOSQL does not satisfy key239
requirements that should be present in a mature DSS. Thus, Bolster is designed240
to completely satisfy the aforementioned set of requirements, summarized in241
Table 1.242
3. Related Work243
In this section, we follow the principles and guidelines of Systematic Literature244
Reviews (SLR) as established in (Kitchenham and Charters, 2007). The purpose245
of this review is to systematically analyze the current landscape of Big Data246
7
Requirement1. VolumeR1.1 The BDA shall provide scalable storage of massive data sets.R1.2 The BDA shall be capable of supporting descriptive analytics.R1.3 The BDA shall be capable of supporting predictive and prescrip-
tive analytics.2. VelocityR2.1 The BDA shall be capable of ingesting multiple, continuous,
rapid, time varying data streams.R2.2 The BDA shall be capable of processing data in a (near) real-time
manner.3. VarietyR3.1 The BDA shall support ingestion of raw data (structured, semi-
structured and unstructured).R3.2 The BDA shall support storage of raw data (structured, semi-
structured and unstructured).R3.3 The BDA shall provide mechanisms to handle machine-readable
schemas for all present data.4. VariabilityR4.1 The BDA shall provide adaptation mechanisms to schema evolu-
tion.R4.2 The BDA shall provide adaptation mechanisms to data evolution.R4.3 The BDA shall provide mechanisms for automatic inclusion of
new data sources.5. VeracityR5.1 The BDA shall provide mechanisms for data provenance.R5.2 The BDA shall provide mechanisms to measure data quality.R5.3 The BDA shall provide mechanisms for tracing data liveliness.R5.4 The BDA shall provide mechanisms for managing data cleaning.
Table 1: Requirements for a Big Data Architecture (BDA)
architectures, with the goal to identify how they meet the devised requirements,247
and thus aid in the design of an SRA. Nonetheless, in this paper we do not248
aim to perform an exhaustive review, but to depict, in a systematic manner, an249
overview on the landscape of Big Data architectures. To this end, we perform a250
lightweight SLR, where we focus on high quality works and evaluate them with251
respect to the previously devised requirements.252
8
3.1. Selection of papers253
The search was ranged from 2010 to 2016, as the first works on Big Data254
architectures appeared by then. The search engine selected was Scopus1, as255
it indexes all journals with a JCR impact factor, as well as the most relevant256
conferences based on the CORE index2. We have searched papers with title,257
abstract or keywords matching the terms “big data” AND “architecture”. The258
list was further refined by selecting papers only in the “Computer Science”259
and “Engineering” subject areas and only documents in English. Finally, only260
conference papers, articles, book chapters and books were selected.261
By applying the search protocol we obtained 1681 papers covering the search262
criteria. After a filter by title, 116 papers were kept. We further applied a263
filter by abstract in order to specifically remove works describing middlewares264
as part of a Big Data architecture (e.g., distributed storage or data stream265
management systems). This phase resulted in 44 selected papers. Finally, after266
reading them, sixteen papers were considered relevant to be included in this267
section. Furthermore, five non-indexed works considered grey literature were268
additionally added to the list, as considered relevant to depict the state of the269
practice in industry. The process was performed by our research team, and270
in case of contradictions a meeting was organized in order to reach consensus.271
Details of the search and filtering process are available at (Nadal et al., 2016).272
3.2. Analysis273
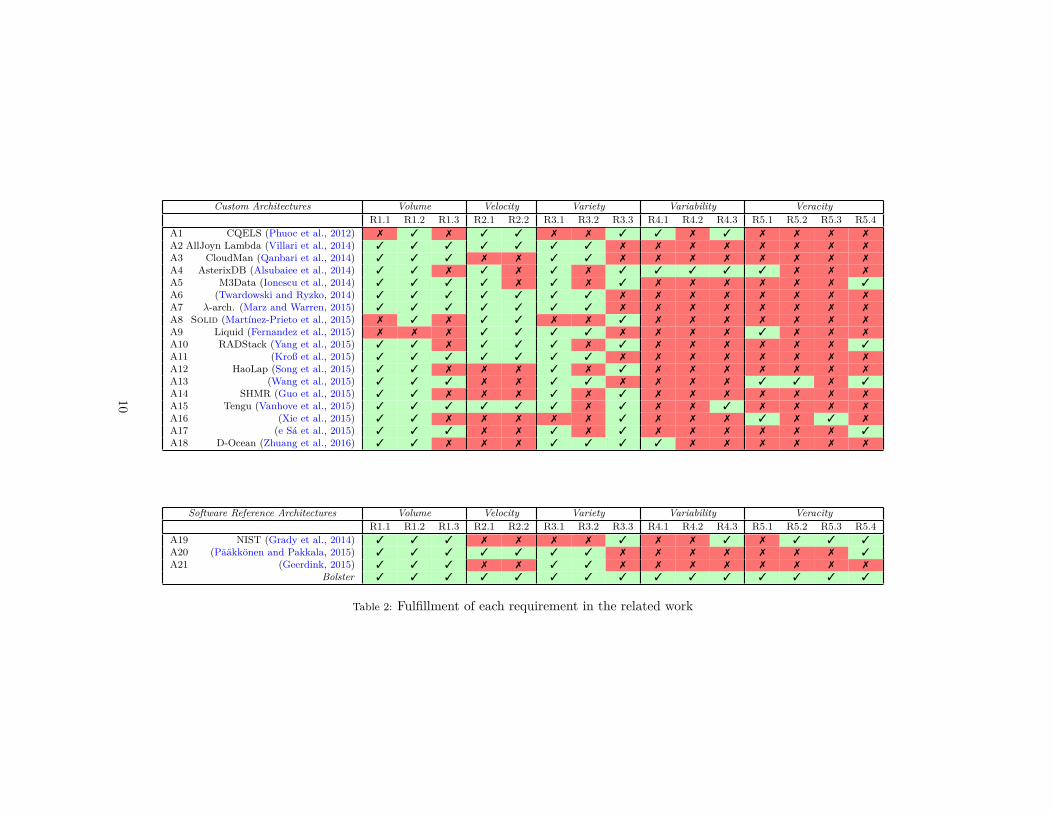
In the following subsections, we analyze to which extent the selected Big Data274
architectures fulfill the requirements devised in Section 2. Each architecture is275
evaluated by checking whether it satisfies a given requirement (3) or it does not276
(7). Results are summarized in Table 2, where we make the distinction between277
custom architectures and SRAs. For the sake of readability, references to studied278
papers have been substituted for their position in Table 2.279
3.2.1. Requirements on Volume280
Most architectures are capable of dealing with storage of massive data sets281
(R1.1). However, we claim those relying on Semantic Web principles (i.e. storing282
RDF data), [A1,A8] cannot deal with such requirement as they are inherently283
limited by the storage capabilities of triplestores. Great effort is put on improving284
such capabilities (Zeng et al., 2013), however no mature scalable solution is285
available in the W3C recommendations3. There is an exception to the previous286
discussion, as SHMR [A14] stores semantic data on HBase. However, this impacts287
its analytical capabilities with respect to those offered by triplestores. Oppositely,288
Liquid [A9] is the only case where no data are stored, offering only real-time289
support and thus not addressing the Volume dimension of Big Data. Regarding290
analytical capabilities, most architectures satisfy the descriptive level (R1.2) via291
1http://www.scopus.com2http://www.core.edu.au/conference-portal3https://www.w3.org/2001/sw/wiki/Category:Triple_Store
9
Custom Architectures Volume Velocity Variety Variability VeracityR1.1 R1.2 R1.3 R2.1 R2.2 R3.1 R3.2 R3.3 R4.1 R4.2 R4.3 R5.1 R5.2 R5.3 R5.4
A1 CQELS (Phuoc et al., 2012) 7 3 7 3 3 7 7 3 3 7 3 7 7 7 7
A2 AllJoyn Lambda (Villari et al., 2014) 3 3 3 3 3 3 3 7 7 7 7 7 7 7 7
A3 CloudMan (Qanbari et al., 2014) 3 3 3 7 7 3 3 7 7 7 7 7 7 7 7
A4 AsterixDB (Alsubaiee et al., 2014) 3 3 7 3 7 3 7 3 3 3 3 3 7 7 7
A5 M3Data (Ionescu et al., 2014) 3 3 3 3 7 3 7 3 7 7 7 7 7 7 3
A6 (Twardowski and Ryzko, 2014) 3 3 3 3 3 3 3 7 7 7 7 7 7 7 7
A7 λ-arch. (Marz and Warren, 2015) 3 3 3 3 3 3 3 7 7 7 7 7 7 7 7
A8 Solid (Martínez-Prieto et al., 2015) 7 3 7 3 3 7 7 3 7 7 7 7 7 7 7
A9 Liquid (Fernandez et al., 2015) 7 7 7 3 3 3 3 7 7 7 7 3 7 7 7
A10 RADStack (Yang et al., 2015) 3 3 7 3 3 3 7 3 7 7 7 7 7 7 3
A11 (Kroß et al., 2015) 3 3 3 3 3 3 3 7 7 7 7 7 7 7 7
A12 HaoLap (Song et al., 2015) 3 3 7 7 7 3 7 3 7 7 7 7 7 7 7
A13 (Wang et al., 2015) 3 3 3 7 7 3 3 7 7 7 7 3 3 7 3
A14 SHMR (Guo et al., 2015) 3 3 7 7 7 3 7 3 7 7 7 7 7 7 7
A15 Tengu (Vanhove et al., 2015) 3 3 3 3 3 3 7 3 7 7 3 7 7 7 7
A16 (Xie et al., 2015) 3 3 7 7 7 7 7 3 7 7 7 3 7 3 7
A17 (e Sá et al., 2015) 3 3 3 7 7 3 7 3 7 7 7 7 7 7 3
A18 D-Ocean (Zhuang et al., 2016) 3 3 7 7 7 3 3 3 3 7 7 7 7 7 7
Software Reference Architectures Volume Velocity Variety Variability VeracityR1.1 R1.2 R1.3 R2.1 R2.2 R3.1 R3.2 R3.3 R4.1 R4.2 R4.3 R5.1 R5.2 R5.3 R5.4
A19 NIST (Grady et al., 2014) 3 3 3 7 7 7 7 3 7 7 3 7 3 3 3
A20 (Pääkkönen and Pakkala, 2015) 3 3 3 3 3 3 3 7 7 7 7 7 7 7 3
A21 (Geerdink, 2015) 3 3 3 7 7 3 3 7 7 7 7 7 7 7 7
Bolster 3 3 3 3 3 3 3 3 3 3 3 3 3 3 3
Table 2: Fulfillment of each requirement in the related work
10
SQL-like [A4,A10,A11,A18] or SPARQL [A1,A8] languages. Furthermore, those292
offering MapReduce or similar interfaces [A2,A3,A6,A13,A14,A15,A20] meet the293
predictive and prescriptive level (R1.3). HaoLap [A12] and SHMR [A14] are294
the only works where MapReduce is narrowed to descriptive queries.295
3.2.2. Requirements on Velocity296
Several architectures are capable of ingesting data streams (R2.1), ei-297
ther by dividing the architecture in specialized Batch and Real-time Layers298
[A2,A6,A7,A10,A11,A15,A20], by providing specific channels like data feeds [A4]299
or by solely considering streams as input type [A1,A8,A9]. Regarding processing300
of such data streams (R2.2), all architectures dealing with its ingestion can addi-301
tionally perform processing, with the exception of AsterixDB [A4] and M3Data302
[A5], where data streams are stored prior to querying them.303
3.2.3. Requirements on Variety304
Variety is handled in diverse ways in the studied architectures. Concerning305
ingestion of raw data (R3.1), few proposals cannot deal with such requirement,306
either because they are narrowed to ingest specific data formats [A8,A16], or307
because specific wrappers need to be defined on the sources [A1,A19]. Concerning308
storage of raw data (R3.2), many architectures define views to merge and309
homogenize different formats into a common one (including those that do it310
at ingestion time) [A4,A5,A10,A12,A14,A15,A17]. On the other hand, the λ-311
architecture and some of the akin architectures [A2,A6,A7,A11] and [A20] are the312
only ones natively storing raw data. In schema management (R3.3), all those313
architectures that favored ingesting and storing raw data cannot deal with such314
requirement, as no additional mechanism is present to handle it. Oppositely, the315
ones defining unified views are able to manage them, likewise relational database316
schemas. There is an exception to the previous discussion, D-Ocean [A18], which317
defines a data model for unstructured data, hence favouring all requirements.318
3.2.4. Requirements on Variability319
Requirements on Variability are poorly covered among the reviewed works.320
Schema evolution is only handled by CQELS [A1], AsterixDB [A4] and D-Ocean321
[A18]. CQELS uses specific wrapper configuration files which via a user interface322
map new elements to ontology concepts. On the other hand, AsterixDB parses323
schemas at runtime. Finally, D-Ocean’s unstructured data model embraces the324
addition of new features. Furthermore, only AsterixDB considers data evolution325
(R4.2) using adaptive query processing techniques. With respect to automatic326
inclusion of data sources (R4.3), CQELS has a service allowing wrappers to327
be plugged at runtime. Moreover, other architectures provide such feature as328
AsterixDB with the definition of external tables at runtime, [A19] providing a329
discovery channel or Tengu [A15] by means of an Enterprise Service Bus.330
3.2.5. Requirements on Veracity331
Few of the studied architectures satisfy requirements on Veracity. All works332
covering data provenance (R5.1) log the operations applied on derived data in333
11
order to be reproduced later. On the other hand, measurement of data quality334
(R5.2) is only found in [A19] and [A13], the former by storing such metadata as335
part of its Big Data lifecycle and the latter by tracking data quality rules that336
validate the stored data. Regarding data liveliness (R5.3), [A16] tracks it in order337
to boost reusage of results computed by other users. Alternatively, [A19] as part338
of its Preservation Management activity applies aging strategies, however it is339
limited to its data retention policy. Finally, with respect to data cleaning (R5.4)340
we see two different architectures. In [A5,A13,A17,A19] cleansing processes341
are triggered as part of the data integration phase (i.e. before being stored).342
Differently, [A10,A20] execute such processes on unprocessed raw data before343
serving them to the user.344
3.3. Discussion345
Besides new technological proposals, we devise two main families of works in346
the Big Data architectures landscape. On the one hand, those presented as an347
evolution of the λ-architecture [A7] after refining it [A2,A6,A10,A11,A15]; and,348
on the other hand, those positioned on the Semantic Web principles [A1,A8].349
Some architectures aim to be of general-purpose, while others are tailored to350
specific domains, such as: multimedia data [A14], cloud manufacturing [A3],351
scientific testing [A15], Internet of Things [A2] or healthcare [A13].352
It can be concluded from Table 2 that requirements related to Volume,353
Velocity and Variety are more fulfilled with respect to those related to Variability354
and Veracity. This is due to the fact, to some extent, that Volume, Velocity and355
partly Variety (i.e., R3.1, R3.2) are core functionalities in NOSQL systems,356
and thus all architectures adopting them benefit from that. Furthermore, such357
dimensions have a clear impact on the performance of the system. Most of the358
architectures based on the λ-architecture naturally fulfil them for such reason.359
On the other hand, partly Variety (i.e., R3.3), Variability and Veracity are360
dimensions that need to be addressed by respectively considering evolution and361
data governance as first-class citizens. However, this fact has an impact on the362
architecture as a whole, and not on individual components, hence causing such363
low fulfiment across the studied works.364
4. Bolster: a Semantic Extension for the λ-Architecture365
In this section, we present Bolster, an SRA solution for Big Data systems366
that deals with the 5 “Vs”. Briefly, Bolster adopts the best out of the two367
families of Big Data architectures (i.e., λ-architecture and those relying on368
Semantic Web principles). Building on top of the λ-architecture, it ensures the369
fulfillment of requirements related to Volume and Velocity. However, in contrast370
to other approaches, it is capable of completely handling Variety, Variability371
and Veracity leveraging on Semantic Web technologies to represent machine-372
readable metadata, oppositely to the studied Semantic Web-based architectures373
representing data. We first present the methodology used to design the SRA.374
Next, we present the conceptual view of the SRA and describe its components.375
12
4.1. The design of Bolster376
Bolster has been designed following the framework for the design of empirically-377
grounded reference architectures (Galster and Avgeriou, 2011), which consists of378
a six-step process described as follows:379
Step 1: decision on type of SRA. The first step consists on deciding the type of380
SRA to be designed, which is driven by its purpose. Using the characterization381
from (Angelov et al., 2012), we conclude that Bolster should be of type 5 (a382
preliminary, facilitation architecture designed to be implemented in multiple383
organizations). This entails that the purpose of its design is to facilitate the384
design of Big Data systems, in multiple organizations and performed by a385
research-oriented team.386
Step 2: selection of design strategy. There are two strategies to design SRAs,387
from scratch or from existing architectures. We will design Bolster based on the388
two families of Big Data architectures identified in Section 3.389
Step 3: empirical acquisition of data. In this case, we leverage on the Big Data390
dimensions (the five “V’s”) discussed in Section 2 and the requirements defined391
for each of them. Such requirements, together with the design strategy, will392
drive the design of Bolster.393
Step 4: construction of SRA. The rationale and construction of Bolster is394
depicted in Section 4.2, where a conceptual view is presented. A functional395
description of its components is later presented in Section 4.3, and a functional396
example in Section 5.397
Step 5: enabling SRA with variability. The goal of enabling an SRA with398
variability is to facilitate its instantiation towards different use cases. To this399
end, we provide the annotated SRA using a conceptual view as well as the400
description of components, which can be selectively instantiated. Later, in401
Section 6, we present methods for its instantiation.402
Step 6: evaluation of the SRA. The last step of the design of an SRA is its403
evaluation. Here, and leveraging on the industrial projects where Bolster has404
been adopted, in Section 7.2, we present the results of its validation.405
4.2. Adding semantics to the λ-architecture406
The λ-architecture is the most widespread framework for scalable and fault-407
tolerant processing of Big Data. Its goal is to enable efficient real-time data408
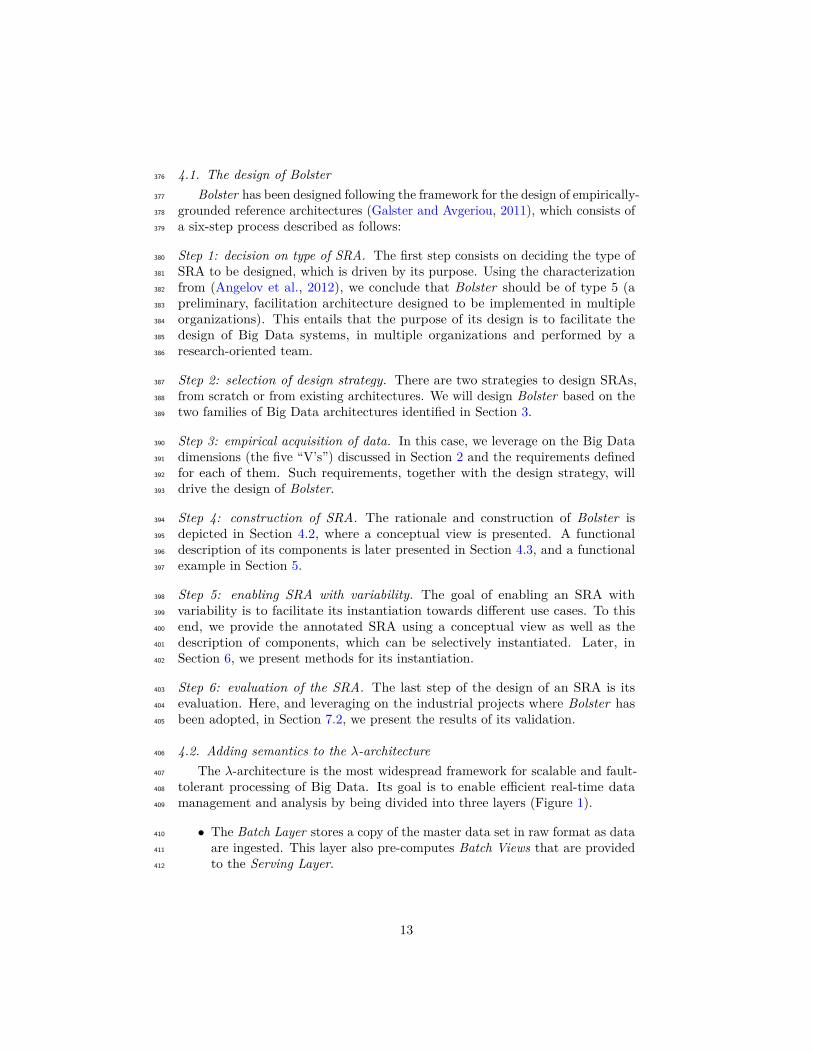
management and analysis by being divided into three layers (Figure 1).409
• The Batch Layer stores a copy of the master data set in raw format as data410
are ingested. This layer also pre-computes Batch Views that are provided411
to the Serving Layer.412
13
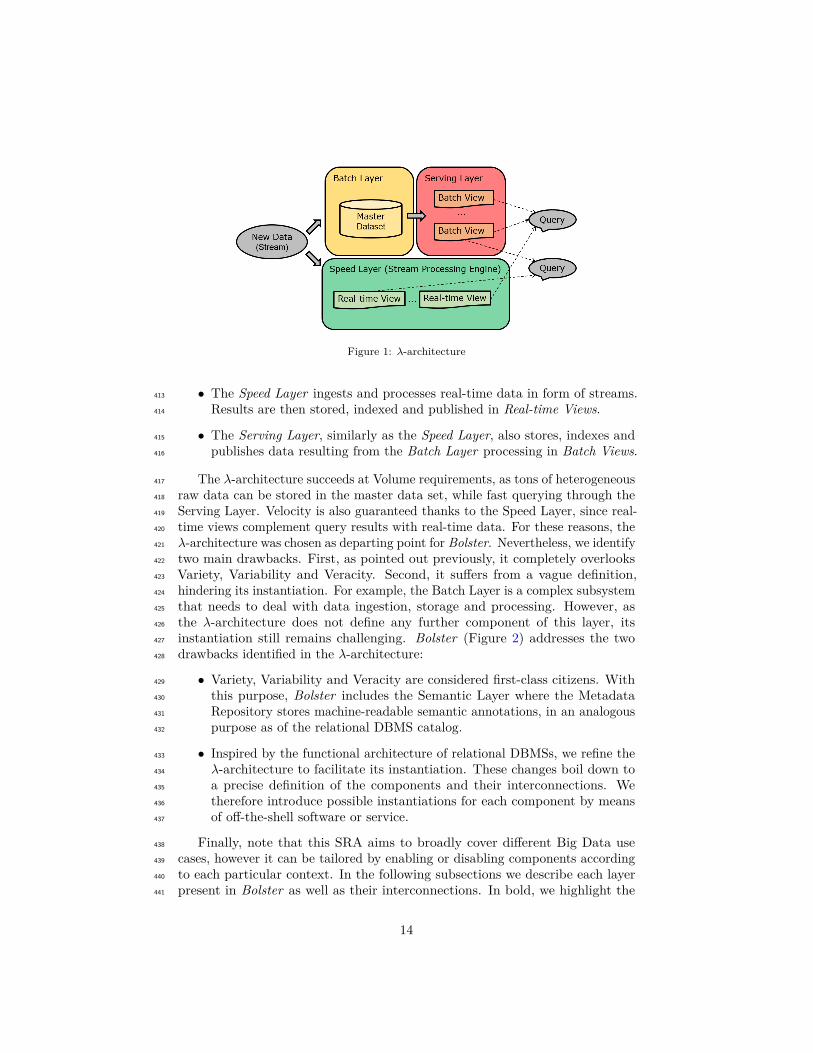
Figure 1: λ-architecture
• The Speed Layer ingests and processes real-time data in form of streams.413
Results are then stored, indexed and published in Real-time Views.414
• The Serving Layer, similarly as the Speed Layer, also stores, indexes and415
publishes data resulting from the Batch Layer processing in Batch Views.416
The λ-architecture succeeds at Volume requirements, as tons of heterogeneous417
raw data can be stored in the master data set, while fast querying through the418
Serving Layer. Velocity is also guaranteed thanks to the Speed Layer, since real-419
time views complement query results with real-time data. For these reasons, the420
λ-architecture was chosen as departing point for Bolster. Nevertheless, we identify421
two main drawbacks. First, as pointed out previously, it completely overlooks422
Variety, Variability and Veracity. Second, it suffers from a vague definition,423
hindering its instantiation. For example, the Batch Layer is a complex subsystem424
that needs to deal with data ingestion, storage and processing. However, as425
the λ-architecture does not define any further component of this layer, its426
instantiation still remains challenging. Bolster (Figure 2) addresses the two427
drawbacks identified in the λ-architecture:428
• Variety, Variability and Veracity are considered first-class citizens. With429
this purpose, Bolster includes the Semantic Layer where the Metadata430
Repository stores machine-readable semantic annotations, in an analogous431
purpose as of the relational DBMS catalog.432
• Inspired by the functional architecture of relational DBMSs, we refine the433
λ-architecture to facilitate its instantiation. These changes boil down to434
a precise definition of the components and their interconnections. We435
therefore introduce possible instantiations for each component by means436
of off-the-shell software or service.437
Finally, note that this SRA aims to broadly cover different Big Data use438
cases, however it can be tailored by enabling or disabling components according439
to each particular context. In the following subsections we describe each layer440
present in Bolster as well as their interconnections. In bold, we highlight the441
14
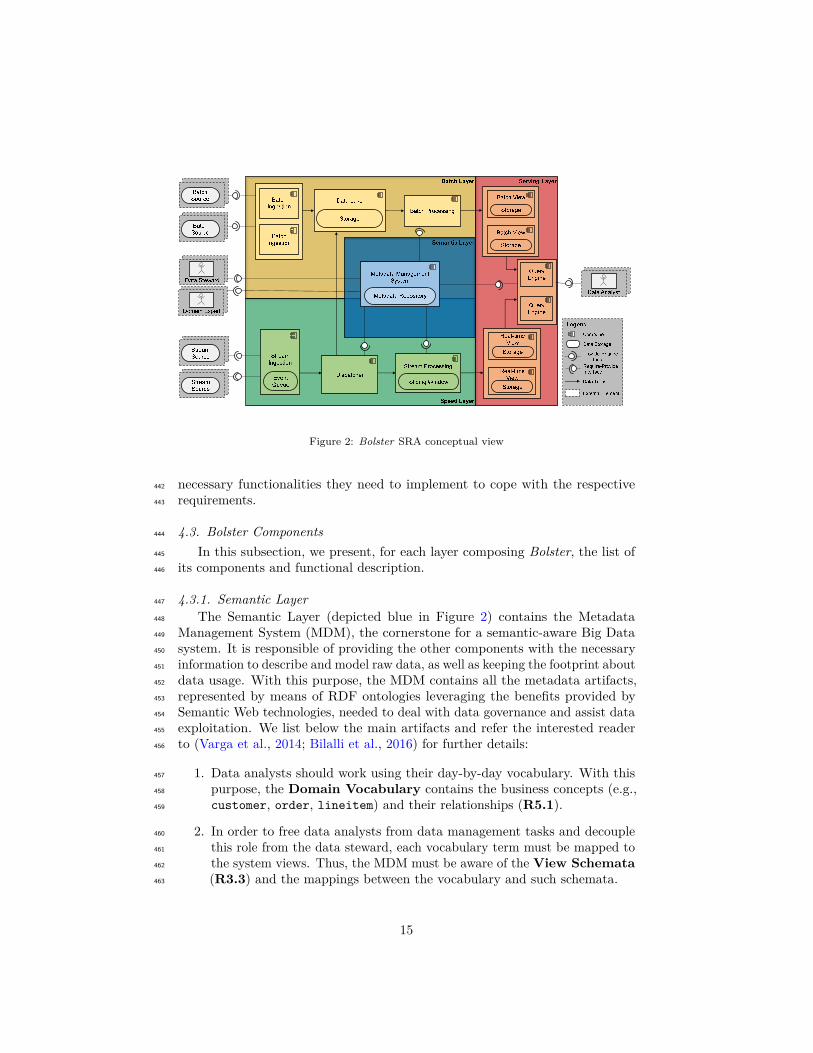
Figure 2: Bolster SRA conceptual view
necessary functionalities they need to implement to cope with the respective442
requirements.443
4.3. Bolster Components444
In this subsection, we present, for each layer composing Bolster, the list of445
its components and functional description.446
4.3.1. Semantic Layer447
The Semantic Layer (depicted blue in Figure 2) contains the Metadata448
Management System (MDM), the cornerstone for a semantic-aware Big Data449
system. It is responsible of providing the other components with the necessary450
information to describe and model raw data, as well as keeping the footprint about451
data usage. With this purpose, the MDM contains all the metadata artifacts,452
represented by means of RDF ontologies leveraging the benefits provided by453
Semantic Web technologies, needed to deal with data governance and assist data454
exploitation. We list below the main artifacts and refer the interested reader455
to (Varga et al., 2014; Bilalli et al., 2016) for further details:456
1. Data analysts should work using their day-by-day vocabulary. With this457
purpose, the Domain Vocabulary contains the business concepts (e.g.,458
customer, order, lineitem) and their relationships (R5.1).459
2. In order to free data analysts from data management tasks and decouple460
this role from the data steward, each vocabulary term must be mapped to461
the system views. Thus, the MDM must be aware of the View Schemata462
(R3.3) and the mappings between the vocabulary and such schemata.463
15
3. Data analysts tend to repeat the same data preparation steps prior to464
conducting their analysis. To enable reusability and a collaborative exploita-465
tion of the data, on the one hand, the MDM must store Pre-processing466
Domain Knowledge about data preparation rules (e.g., data cleaning,467
discretization, etc.) related to a certain domain (R5.4), and on the other468
hand descriptive statistics to assess data evolution (R4.2).469
4. To deal with automatic inclusion of new data sources (R4.3), each ingested470
element must be annotated with its schema information (R4.1). To this471
end, the Data Source Register tracks all input data sources together472
with the required information to parse them, the physical schema, and each473
schema element has to be linked to the attributes it populates, the logical474
schema (R3.3). Furthermore, for data provenance (R5.1), the Data475
Transformations Log has to keep track of the performed transformation476
steps to produce the views, the last processing step within the Big Data477
system.478
Populating these artifacts is a challenge. Some of them can be automatically479
populated and some others must be manually annotated. Nonetheless, all of480
these artifacts are essential to enable a centralized master metadata management481
and hence, fulfil the requirements related to Variety, Variability and Veracity.482
Analogously to database systems, data stewards are responsible of populating483
and maintaining such artifacts. That is why we claim for the need that the MDM484
provides a user friendly interface to aid such processes. Finally, note that most485
of the present architectural components must be able to interact with the MDM,486
hence it is essential that it provides language-agnostic interfaces. Moreover, such487
interfaces cannot pose performance bottlenecks, as doing so would highly impact488
in the overall performance of the system.489
4.3.2. Batch Layer490
This layer (depicted yellow in Figure 2) is in charge of storing and processing491
massive volumes of data. In short, we first encounter Batch Ingestion, responsible492
for periodically ingesting data from the batch sources, then the Data Lake,493
capable of managing large amounts of data. The last step is the Batch Processing494
component, which prepares, transforms and runs iterative algorithms over the495
data stored in the Data Lake to shape them accordingly to the analytical needs496
of the use-case at hand.497
Batch Ingestion. Batch sources are commonly big static raw data sets that498
require periodic synchronizations (R3.1). Examples of batch sources can be499
relational databases, structured files, etc. For this reason, we advocate for a500
multiple component instantiation, as required by the number of sources and type.501
These components need to know which data have already been moved to the Data502
Lake by means of Incremental Bulks Scheduling and Orchestration. The503
MDM then comes into play as it traces this information. Interaction between the504
ingestion components and the MDM occurs in a two-phase manner. First, they505
16
learn which data are already stored in the Data Lake, to identify the according506
incremental bulk can be identified. Second, the MDM is enriched with specific507
information regarding the recently brought data (R5.3). Since Big Data systems508
are multi-source by nature, the ingestion components must be built to guarantee509
its adaptability in the presence of new sources (R4.3).510
Data Lake. This component is composed of a Massive Storage system (R1.1).511
Distributed file systems are naturally good candidates as they were born to512
hold large volumes of data in their source format (R3.2). One of their main513
drawbacks is that its read capabilities are only sequential and no complex514
querying is therefore feasible. Paradoxically, this turns out to be beneficial for515
the Batch Processing, as it exploits the power of cloud computing.516
Different file formats pursuing high performance capabilities are available,517
focusing on different types of workload (Munir et al., 2016). They are commonly518
classified as horizontal, vertical and hybrid, in an analogous fashion as row-519
oriented and column-oriented databases, respectively.520
Batch Processing. This component models and transforms the Data Lake’s files521
into Batch Views ready for the analytical use-cases. It is responsible to schedule522
and execute Batch Iterative Algorithms, such as sorting, searching, indexing523
(R1.2) or more complex algorithms such as PageRank, Bayesian classification524
or genetic algorithms (R1.3). The processing components, must be designed to525
maximize reusability by creating building blocks (from the domain-knowledge526
metadata artifacts) that can be reused in several views. Consequently, in order527
to track Batch Data Provenance, all performed transformations must be528
communicated to the MDM (R5.1).529
Batch processing is mostly represented by the MapReduce programming530
model. Its drawbacks appear twofold. On one hand, when processing huge531
amounts of batch data, several jobs may usually need to be chained so that532
more complex processing can be executed as a single one. On the other hand,533
intermediate results from Map to Reduce phases are physically stored in hard534
disk, completely detracting the Velocity (in terms of response time).535
Massive efforts are currently put on designing new solutions to overcome536
the issues posed by MapReduce. For instance, by natively including other more537
atomic relational algebra operations, connected by means of a directed acyclic538
graph; or by keeping intermediate results in main memory.539
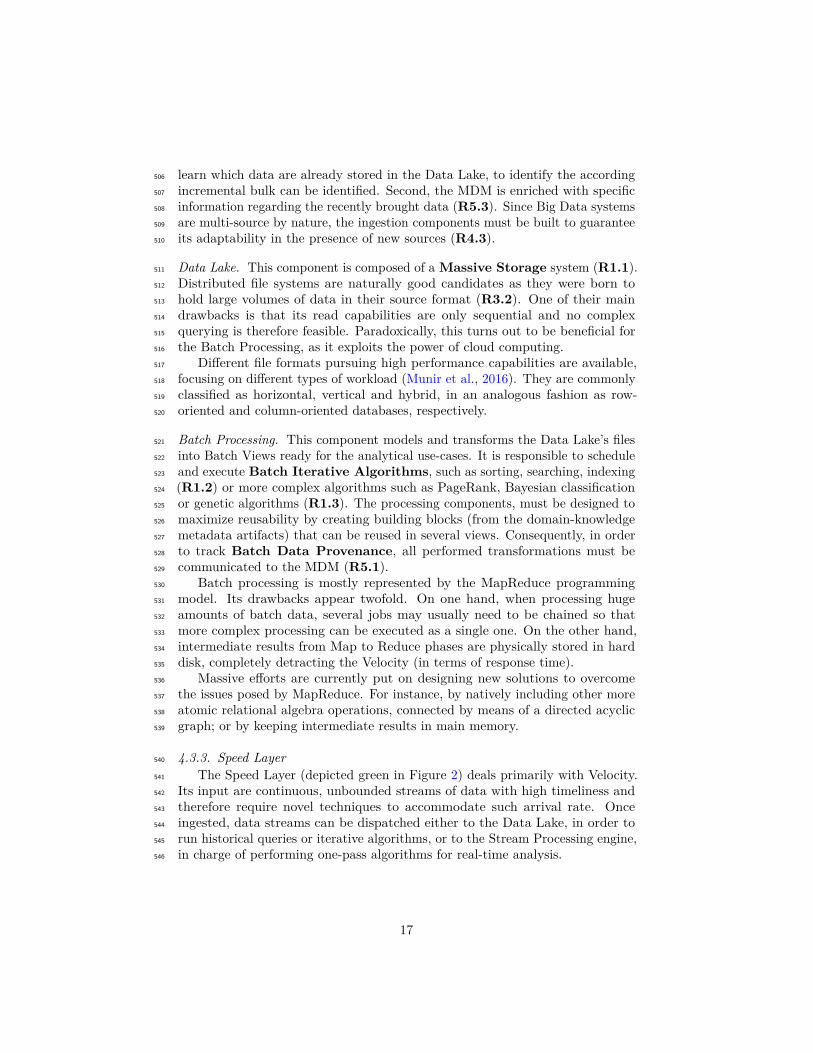
4.3.3. Speed Layer540
The Speed Layer (depicted green in Figure 2) deals primarily with Velocity.541
Its input are continuous, unbounded streams of data with high timeliness and542
therefore require novel techniques to accommodate such arrival rate. Once543
ingested, data streams can be dispatched either to the Data Lake, in order to544
run historical queries or iterative algorithms, or to the Stream Processing engine,545
in charge of performing one-pass algorithms for real-time analysis.546
17
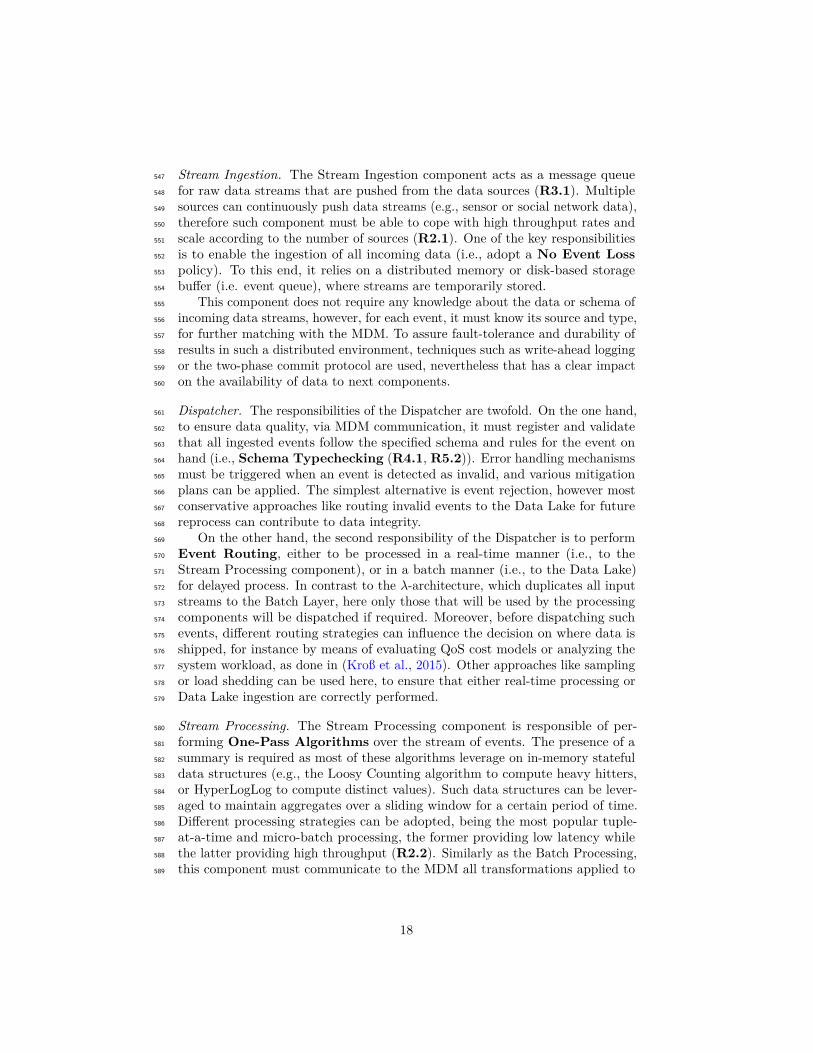
Stream Ingestion. The Stream Ingestion component acts as a message queue547
for raw data streams that are pushed from the data sources (R3.1). Multiple548
sources can continuously push data streams (e.g., sensor or social network data),549
therefore such component must be able to cope with high throughput rates and550
scale according to the number of sources (R2.1). One of the key responsibilities551
is to enable the ingestion of all incoming data (i.e., adopt a No Event Loss552
policy). To this end, it relies on a distributed memory or disk-based storage553
buffer (i.e. event queue), where streams are temporarily stored.554
This component does not require any knowledge about the data or schema of555
incoming data streams, however, for each event, it must know its source and type,556
for further matching with the MDM. To assure fault-tolerance and durability of557
results in such a distributed environment, techniques such as write-ahead logging558
or the two-phase commit protocol are used, nevertheless that has a clear impact559
on the availability of data to next components.560
Dispatcher. The responsibilities of the Dispatcher are twofold. On the one hand,561
to ensure data quality, via MDM communication, it must register and validate562
that all ingested events follow the specified schema and rules for the event on563
hand (i.e., Schema Typechecking (R4.1, R5.2)). Error handling mechanisms564
must be triggered when an event is detected as invalid, and various mitigation565
plans can be applied. The simplest alternative is event rejection, however most566
conservative approaches like routing invalid events to the Data Lake for future567
reprocess can contribute to data integrity.568
On the other hand, the second responsibility of the Dispatcher is to perform569
Event Routing, either to be processed in a real-time manner (i.e., to the570
Stream Processing component), or in a batch manner (i.e., to the Data Lake)571
for delayed process. In contrast to the λ-architecture, which duplicates all input572
streams to the Batch Layer, here only those that will be used by the processing573
components will be dispatched if required. Moreover, before dispatching such574
events, different routing strategies can influence the decision on where data is575
shipped, for instance by means of evaluating QoS cost models or analyzing the576
system workload, as done in (Kroß et al., 2015). Other approaches like sampling577
or load shedding can be used here, to ensure that either real-time processing or578
Data Lake ingestion are correctly performed.579
Stream Processing. The Stream Processing component is responsible of per-580
forming One-Pass Algorithms over the stream of events. The presence of a581
summary is required as most of these algorithms leverage on in-memory stateful582
data structures (e.g., the Loosy Counting algorithm to compute heavy hitters,583
or HyperLogLog to compute distinct values). Such data structures can be lever-584
aged to maintain aggregates over a sliding window for a certain period of time.585
Different processing strategies can be adopted, being the most popular tuple-586
at-a-time and micro-batch processing, the former providing low latency while587
the latter providing high throughput (R2.2). Similarly as the Batch Processing,588
this component must communicate to the MDM all transformations applied to589
18
populate Real-time Views in order to guarantee Stream Data Provenance590
(R5.1).591
4.3.4. Serving Layer592
The Serving Layer (depicted red in Figure 2) holds transformed data ready593
to be delivered to end-users (i.e. it acts as a set of database engines). Precisely,594
it is composed by Batch and Real-time Views repositories. Different alternatives595
exist when selecting each view engine, however as they impose a data model (e.g.,596
relational or key-value), it is key to perform a goal-driven selection according to597
end-user analytical requirements (Herrero et al., 2016). It is worth noting that598
views can also be considered new sources, in case it is required to perform trans-599
formations among multiple data models, resembling a feedback loop. Further,600
the repository of Query Engines is the entry point for data analysts to achieve601
their analytical task, querying the views and the Semantic Layer.602
Batch Views. As in the λ-architecture, we seek Scalable and Fault-Tolerant603
Databases capable to provide Random Reads, achieved by indexing, and604
the execution of Aggregations and UDFs (user defined functions) over large605
stable data sets (R1.1). The λ-architecture advocates for recomputing Batch606
Views every time a new version is available, however we claim incremental607
approaches should be adopted to avoid unnecessary writes and reduce processing608
latency. A common example of Batch View is a DW, commonly implemented609
in relational or columnar engines. However databases implementing other data610
models such as graph, key-value or documents also can serve the purpose of611
Batch Views. Each view must provide a high-level query language, serving as612
interface with the Query Engine (e.g., SQL), or a specific wrapper on top of it613
providing such funcionalities.614
Real-time Views. As opposite to Batch Views, Real-time Views need to provide615
Low Latency Querying over dynamic and continuously changing data sets616
(R2.1). In order to achieve so, in-memory databases are currently the most617
suitable option, as they dismiss the high cost it entails to retrieve data from disk.618
Additionally, Real-Time views should support low cost of updating in order to619
maintain Sketches and Sliding Windows. Finally, similarly to Batch Views,620
Real-time Views must provide mechanisms to be queried, considering as well621
Continuous Query Languages.622
Query Engines. Query Engines, play a crucial role to enable efficiently querying623
the views in a friendly manner for the analytical task on hand. Data analysts624
query the system using the vocabulary terms and apply domain-knowledge rules625
on them (R1.2, R1.3). Thanks to the MDM artifacts, the system must internally626
perform the translation from Business Requirements to Database Queries627
over Batch and Real-time Views (R3.3), hence making data management tasks628
transparent to the end-user. Furthermore, the Query Engine must provide to629
the user the ability for Metadata Query and Exploration on what is stored630
in the MDM (R5.1, R5.2, R5.3).631
19
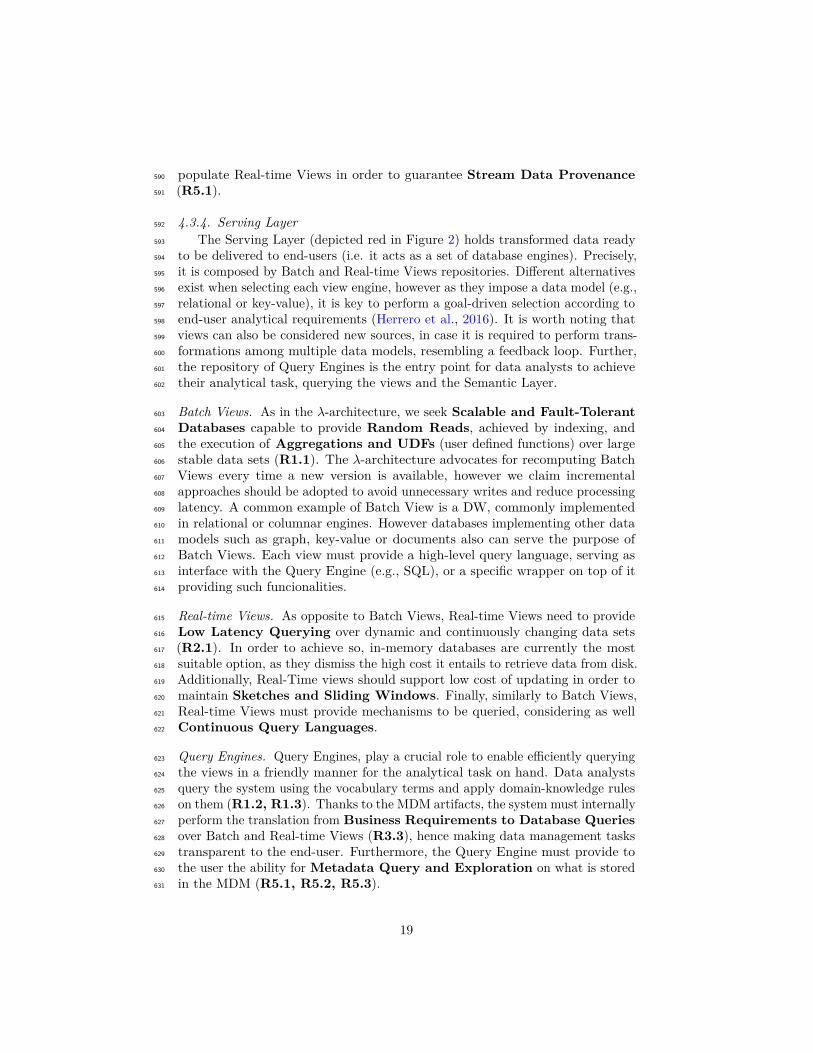
4.3.5. Summary632
Table 3 summarizes for each component the fulfilled requirements discussed633
in Section 2.634
Component Volume Velocity Variety Variability VeracityR1.1 R1.2 R1.3 R2.1 R2.2 R3.1 R3.2 R3.3 R4.1 R4.2 R4.3 R5.1 R5.2 R5.3 R5.4
Metadata Management System 3 3 3 3 3 3
Batch Ingestion 3 3 3
Data Lake 3 3
Batch Processing 3 3 3
Stream Ingestion 3 3
Dispatcher 3 3
Stream Processing 3 3
Batch Views 3
Real-time Views 3
Query Engines 3 3 3 3 3 3
Table 3: Bolster components and requirements fulfilled
5. Exemplar Use Case635
The goal of this section is to provide an exemplar use case to illustrate how636
Bolster would accommodate a Big Data management and analytics scenario.637
Precisely, we consider the online social network benchmark described in (Zhang638
et al., 2015). Such benchmark aims to provide insights on the stream of data639
provided by Twitter’s Streaming API, and is characterized by workloads in640
media, text, graph, activity and user analytics.641
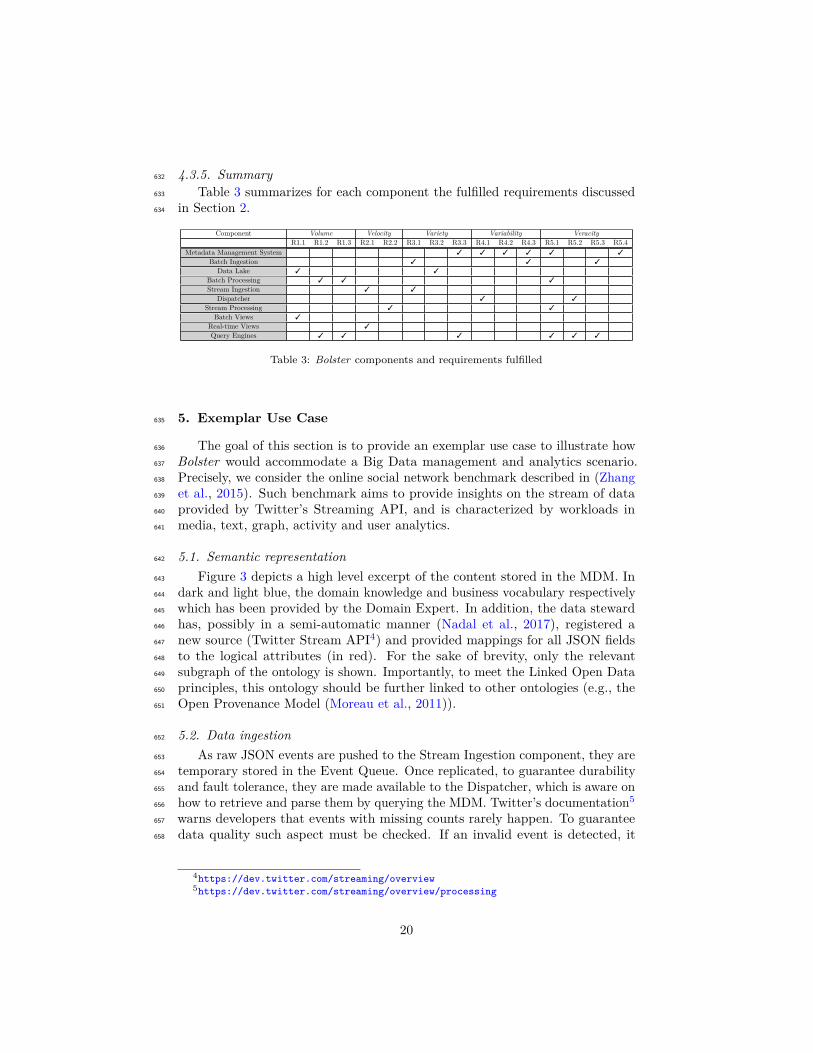
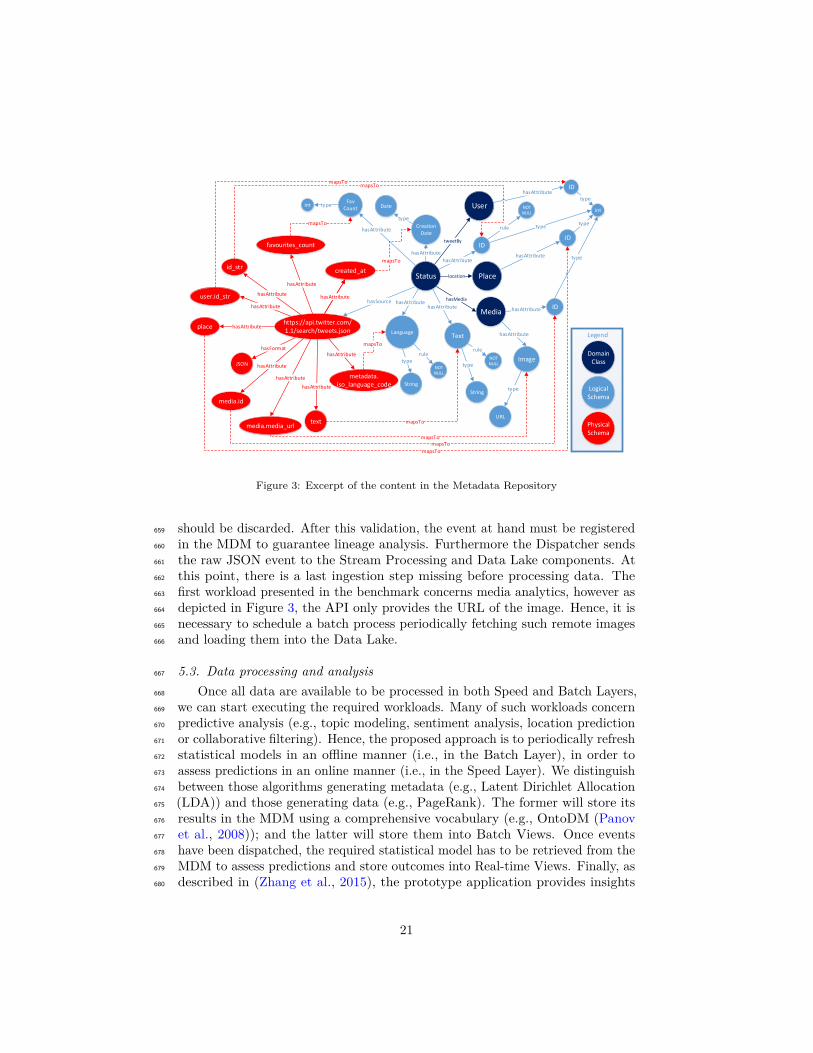
5.1. Semantic representation642
Figure 3 depicts a high level excerpt of the content stored in the MDM. In643
dark and light blue, the domain knowledge and business vocabulary respectively644
which has been provided by the Domain Expert. In addition, the data steward645
has, possibly in a semi-automatic manner (Nadal et al., 2017), registered a646
new source (Twitter Stream API4) and provided mappings for all JSON fields647
to the logical attributes (in red). For the sake of brevity, only the relevant648
subgraph of the ontology is shown. Importantly, to meet the Linked Open Data649
principles, this ontology should be further linked to other ontologies (e.g., the650
Open Provenance Model (Moreau et al., 2011)).651
5.2. Data ingestion652
As raw JSON events are pushed to the Stream Ingestion component, they are653
temporary stored in the Event Queue. Once replicated, to guarantee durability654
and fault tolerance, they are made available to the Dispatcher, which is aware on655
how to retrieve and parse them by querying the MDM. Twitter’s documentation5656
warns developers that events with missing counts rarely happen. To guarantee657
data quality such aspect must be checked. If an invalid event is detected, it658
4https://dev.twitter.com/streaming/overview5https://dev.twitter.com/streaming/overview/processing
20
Legend
Status
ID
Creation Date
Fav Count
Language
hasAttribute
hasAttribute
hasAttribute
hasAttribute
User
tweetBy
IDhasAttribute
Place
Text
hasAttribute
location
type
ID
hasAttribute
typetype
String
type
String
type
Date
type
int type
hasSource
JSON
hasFormat
id_str
https://api.twitter.com/1.1/search/tweets.json
created_at
metadata.iso_language_code
mapsTo
hasAttributehasAttributehasAttribute
favourites_count
hasAttribute
text
mapsTo
mapsTo
hasAttribute
mapsTo
mapsTo
hasAttribute
user.id_str
place
media.media_url
mapsTo
hasAttribute
hasAttribute
hasAttribute
mapsTo
NOTNULL
rule
NOTNULL
ruleNOTNULL
ruleDomain
Class
Logical Schema
Physical Schema
Legend
int
Media
hasMedia
IDhasAttribute
type
Image
hasAttribute
media.id
hasAttribute
mapsTo
mapsTo
URL
type
Figure 3: Excerpt of the content in the Metadata Repository
should be discarded. After this validation, the event at hand must be registered659
in the MDM to guarantee lineage analysis. Furthermore the Dispatcher sends660
the raw JSON event to the Stream Processing and Data Lake components. At661
this point, there is a last ingestion step missing before processing data. The662
first workload presented in the benchmark concerns media analytics, however as663
depicted in Figure 3, the API only provides the URL of the image. Hence, it is664
necessary to schedule a batch process periodically fetching such remote images665
and loading them into the Data Lake.666
5.3. Data processing and analysis667
Once all data are available to be processed in both Speed and Batch Layers,668
we can start executing the required workloads. Many of such workloads concern669
predictive analysis (e.g., topic modeling, sentiment analysis, location prediction670
or collaborative filtering). Hence, the proposed approach is to periodically refresh671
statistical models in an offline manner (i.e., in the Batch Layer), in order to672
assess predictions in an online manner (i.e., in the Speed Layer). We distinguish673
between those algorithms generating metadata (e.g., Latent Dirichlet Allocation674
(LDA)) and those generating data (e.g., PageRank). The former will store its675
results in the MDM using a comprehensive vocabulary (e.g., OntoDM (Panov676
et al., 2008)); and the latter will store them into Batch Views. Once events677
have been dispatched, the required statistical model has to be retrieved from the678
MDM to assess predictions and store outcomes into Real-time Views. Finally, as679
described in (Zhang et al., 2015), the prototype application provides insights680
21
based on tweets related to companies in the S&P 100 index. Leveraging on the681
MDM, the Query Engine is capable of generating queries to Batch and Real-time682
Views.683
6. Bolster Instantiation684
In this section we list a set of candidate tools, with special focus on the Apache685
Hadoop and Amazon Web Services ecosystems, to instantiate each component686
in Bolster. In the case when few tools from such ecosystems were available,687
we propose commercial tools which were considered in the industrial projects688
where Bolster was instantiated. Further, we present a method to instantiate689
the reference architecture. We propose a systematic scoring process driven by690
quality characteristics, yielding, for each component, the most suitable tool.691
6.1. Available tools692
6.1.1. Semantic Layer693
Metadata Management System. Two different off-the-shelf open source products694
can instantiate this layer, namely Apache Stanbol6 and Apache Atlas7. Never-695
theless, the features of the former fall short for the proposed requirements of the696
MDM. Not surprisingly, this is due to the novel nature of Bolster ’s Semantic697
Layer. Apache Atlas satisfies the required functionalities more naturally and it698
might appear as a better choice, however it is currently under heavy development699
as an Apache Incubator project. Commercial tools such as Cloudera Navigator8700
or Palantir9 are also candidate tools.701
Metadata Storage. We advocate for the adoption of Semantic Web storage702
technologies (i.e. triplestores), to store all the metadata artifacts. Even though703
such tools allow storing and reasoning over large and complex ontologies, that704
is not the pursued purpose here, as our aim is to allow a simple and flexible705
representation of machine-readable schemas. That is why triplestores serve706
better the purpose of such storage. Virtuoso10 is at the moment the most mature707
triplestore platform, however other options are available such as 4store11 or708
GraphDB12. Nonetheless, given the graph nature of triples, any graph database709
can as well serve the purpose of metadata storage (e.g., AllegroGraph13 or710
Neo4j14).711
6https://stanbol.apache.org7http://atlas.incubator.apache.org8https://www.cloudera.com/products/cloudera-navigator.html9https://www.palantir.com
10http://virtuoso.openlinksw.com11http://4store.org12http://graphdb.ontotext.com/graphdb13http://allegrograph.com14http://neo4j.com
22
6.1.2. Batch Layer712
Batch Ingestion. This components highly depends on the format of the data713
sources, hence it is complex to derive a universal driver due to technological714
heterogeneity. Instantiating this component usually means developing ad-hoc715
scripting solutions adapting to the data sources as well as enabling communication716
with the MDM. Massive data transfer protocols such as FTP or Hadoop’s717
copyFromLocal15 will complement such scripts. However, some drivers for specific718
protocols exist such as Apache Sqoop16, the most widespread solution to load719
data from/to relational sources through JDBC drivers.720
Data Lake. Hadoop Distributed File System and Amazon S3 17 perfectly fit in this721
category, as they are essentially file systems storing plain files. Regarding data722
file formats, some current popular options are Apache Avro18, Yahoo Zebra19 or723
Apache Parquet20 for horizontal, vertical and hybrid fragmentation respectively.724
Batch Processing. Apache MapReduce21 and Amazon Elastic MapReduce22 are725
nowadays the most popular solutions. Alternatively, Apache Spark23 and Apache726
Flink24 are gaining great popularity as next generation replacement for the727
MapReduce model. However, to the best of our knowledge, only Quarry (Jo-728
vanovic et al., 2015) is capable to interact with the MDM and, based on the729
information there stored, automatically produce batch processes based on user-730
defined information requirements.731
6.1.3. Speed Layer732
Stream Ingestion. All tools in the family of “message queues” are candidates733
to serve as component for Stream Ingestion. Originated with the purpose of734
serving as middleware to support enterprise messaging across heterogeneous735
systems, they have been enhanced with scalability mechanisms to handle high736
ingestion rates preserving durability of data. Some examples of such systems737
are Apache ActiveMQ25 or RabbitMQ26. However, some other tools were born738
following similar principles but aiming Big Data systems since its inception,739
being Apache Kafka27 and AWS Kinesis Firehose28 the most popular options.740
15https://hadoop.apache.org/docs/r2.7.1/hadoop-project-dist/hadoop-common/FileSystemShell.html#copyFromLocal
16http://sqoop.apache.org17https://aws.amazon.com/s318https://avro.apache.org19http://pig.apache.org/docs/r0.9.1/zebra_overview.html20https://parquet.apache.org21https://hadoop.apache.org22https://aws.amazon.com/elasticmapreduce23http://spark.apache.org24https://flink.apache.org25http://activemq.apache.org26https://www.rabbitmq.com27http://kafka.apache.org28https://aws.amazon.com/kinesis/firehose
23
Dispatcher. Here we look for tools that allow developers to define data pipelines741
routing data streams to multiple and heterogeneous destinations. It should also742
allow the developer to programmatically communicate with the MDM for quality743
checks. Apache Flume29 and Amazon Kinesis Streams30 are nowadays the most744
prevalent solutions.745
Stream Processing. In contrast to Batch Processing, it is unfeasible to adopt746
classical MapReduce solutions considering the performance impact they yield.747
Thus, in-memory distributed stream processing solutions like Apache Spark748
Streaming31, Apache Flink Streaming32 and Amazon Kinesis Analytics33 are the749
most common alternatives.750
6.1.4. Serving Layer751
Batch Views. A vast range of solutions are available to hold specialized views. We752
distinguish among three families of databases: (distributed) relational, NOSQL753
and NewSQL. The former is mostly represented by major vendors who evolved754
their traditional centralized databases into distributed ones seeking to improve755
its storage and performance capabilities. Some common solutions are Oracle34,756
Postgres-XL35 or MySQL Cluster36. Secondly, in the NOSQL category we757
might drill-down to the specific data model implemented: Apache HBase37758
or Apache Cassandra38 for column-family key-value; Amazon DynamoDB39 or759
Voldemort40 for key-value; Amazon Redshift41 or Apache Kudu42 for column760
oriented; Neo4j43 or OrientDB44 for graph; and MongoDB45 or RethinkDB46761
for document. Finally, NewSQL are high-availability main memory databases762
which usually are deployed in specialized hardware, where we encounter SAP763
Hana47, NuoDB48 or VoltDB49.764
29https://flume.apache.org30https://aws.amazon.com/kinesis/streams31http://spark.apache.org/streaming32https://flink.apache.org33https://aws.amazon.com/kinesis/analytics34https://www.oracle.com/database35http://www.postgres-xl.org36https://www.mysql.com/products/cluster37https://hbase.apache.org38http://cassandra.apache.org39https://aws.amazon.com/dynamodb40http://www.project-voldemort.com/voldemort41https://aws.amazon.com/redshift42http://getkudu.io43http://neo4j.com44http://orientdb.com/orientdb45https://www.mongodb.org46https://www.rethinkdb.com47https://hana.sap.com48http://www.nuodb.com49https://voltdb.com
24
Real-time Views. In-memory databases are currently the most popular op-765
tions, for instance Redis50, Elastic51, Amazon ElastiCache52. Alternatively,766
PipelineDB53 offers mechanism to query a data stream via continuous query767
languages.768
Query Engine. There is a vast variety of tools available for query engines. OLAP769
engines such as Apache Kylin54 provide multidimensional analysis capabilities,770
on the other hand solutions like Kibana55 or Tableau56 enable the user to easily771
define complex charts over the data views.772
6.2. Component selection773
Selecting components to instantiate Bolster is a typical (C)OTS (commercial774
off-the-shelf) selection problem (Kontio, 1996). Considering a big part of the775
landscape of available Big Data tools is open source or well-documented, we776
follow a quality model approach for their selection, as done in (Behkamal et al.,777
2009). To this end, we adopt the ISO/IEC 25000 SQuaRE standard (Software778
Product Quality Requirements and Evaluation) (ISO, 2011) as reference quality779
model. Such model is divided into characteristics and subcharacteristics, where780
the latter allows the definition of metrics (see ISO 25020). In the context of781
(C)OTS, the two former map to the hierarchical criteria set, while the latter782
to evaluation attributes. Nevertheless, the aim of this paper is not to provide783
exhaustive guidelines on its usage whatsoever, but to supply a blueprint to be784
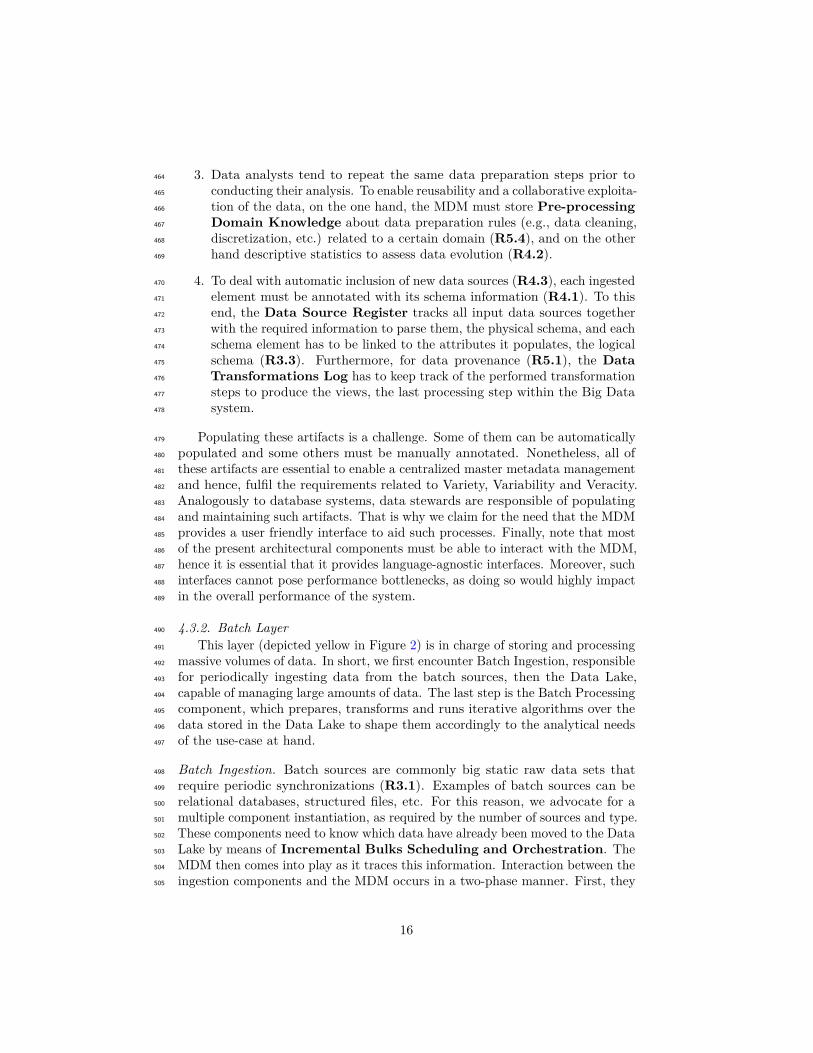
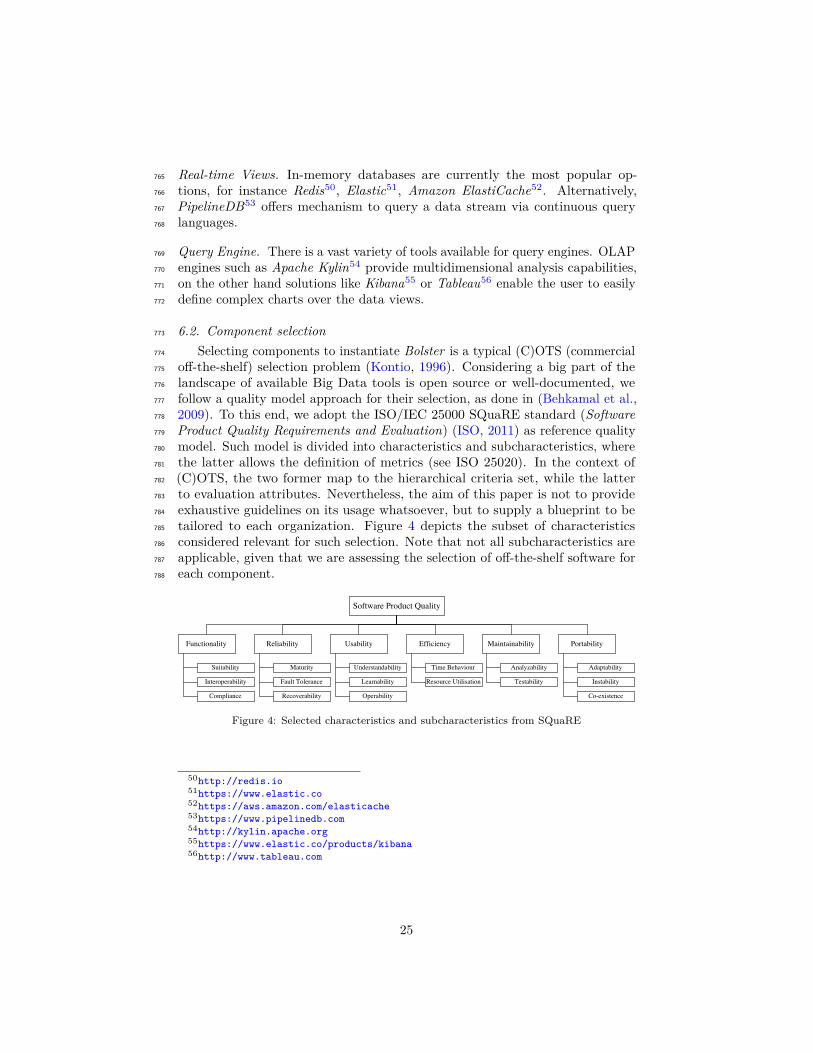
tailored to each organization. Figure 4 depicts the subset of characteristics785
considered relevant for such selection. Note that not all subcharacteristics are786
applicable, given that we are assessing the selection of off-the-shelf software for787
each component.788
Figure 4: Selected characteristics and subcharacteristics from SQuaRE
50http://redis.io51https://www.elastic.co52https://aws.amazon.com/elasticache53https://www.pipelinedb.com54http://kylin.apache.org55https://www.elastic.co/products/kibana56http://www.tableau.com
25
6.2.1. Evaluation attributes789
Previously, we discussed that ISO 25020 proposes candidate metrics for790
each present subcharacteristic. However, we believe that they do not cover the791
singularities required for selecting open source Big Data tools. Thus, in the792
following subsections we present a candidate set of evaluation attributes which793
were used in the use case applications described in Section 7. Each has associated794
a set of ordered values from worst to better and its semantics.795
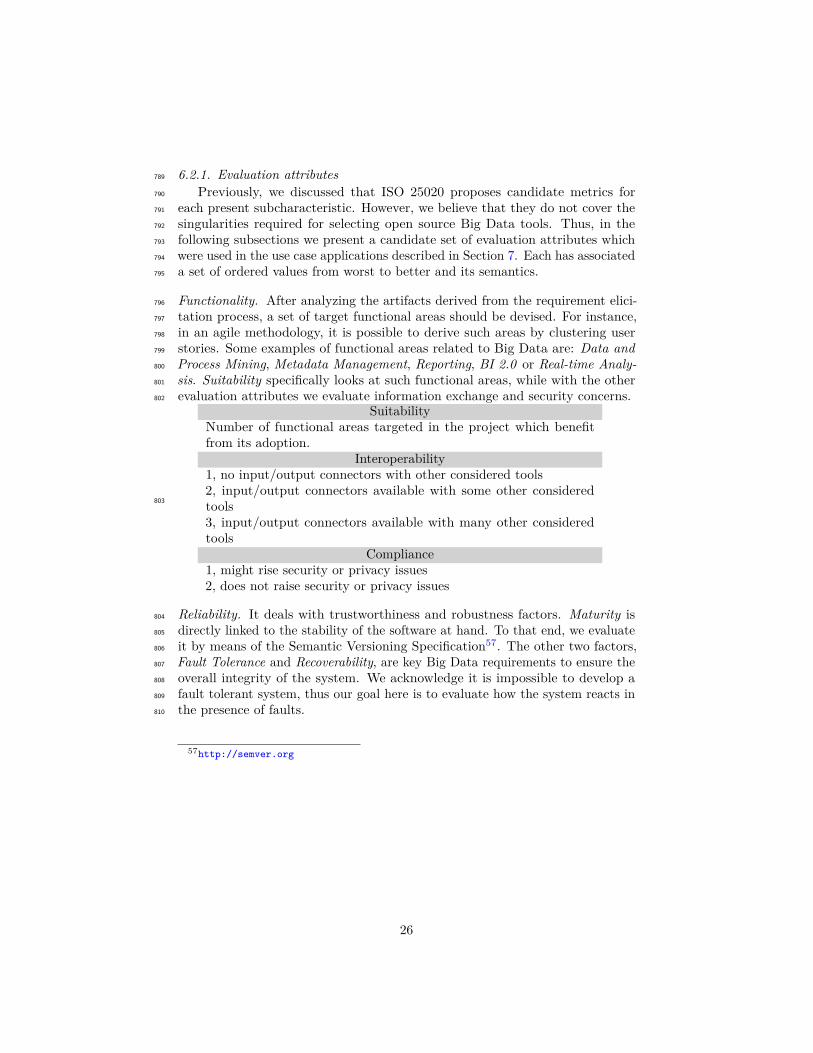
Functionality. After analyzing the artifacts derived from the requirement elici-796
tation process, a set of target functional areas should be devised. For instance,797
in an agile methodology, it is possible to derive such areas by clustering user798
stories. Some examples of functional areas related to Big Data are: Data and799
Process Mining, Metadata Management, Reporting, BI 2.0 or Real-time Analy-800
sis. Suitability specifically looks at such functional areas, while with the other801
evaluation attributes we evaluate information exchange and security concerns.802
SuitabilityNumber of functional areas targeted in the project which benefitfrom its adoption.
Interoperability1, no input/output connectors with other considered tools2, input/output connectors available with some other consideredtools3, input/output connectors available with many other consideredtools
Compliance1, might rise security or privacy issues2, does not raise security or privacy issues
803
Reliability. It deals with trustworthiness and robustness factors. Maturity is804
directly linked to the stability of the software at hand. To that end, we evaluate805
it by means of the Semantic Versioning Specification57. The other two factors,806
Fault Tolerance and Recoverability, are key Big Data requirements to ensure the807
overall integrity of the system. We acknowledge it is impossible to develop a808
fault tolerant system, thus our goal here is to evaluate how the system reacts in809
the presence of faults.810
57http://semver.org
26
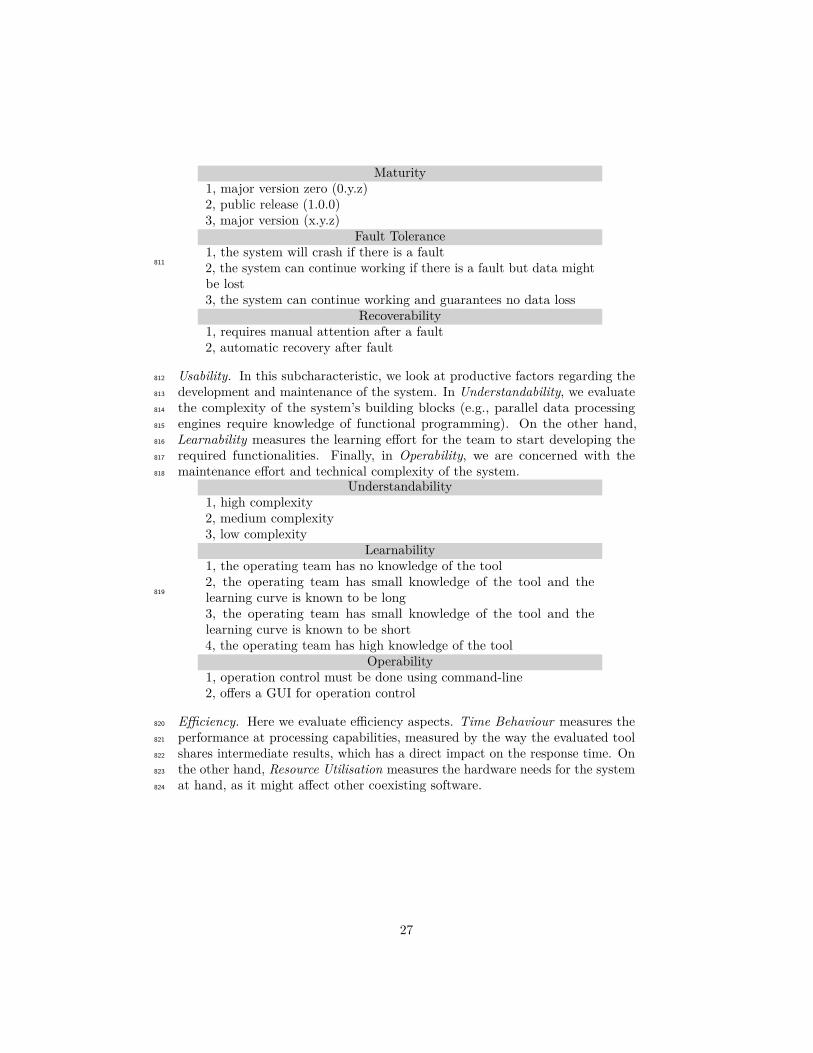
Maturity1, major version zero (0.y.z)2, public release (1.0.0)3, major version (x.y.z)
Fault Tolerance1, the system will crash if there is a fault2, the system can continue working if there is a fault but data mightbe lost3, the system can continue working and guarantees no data loss
Recoverability1, requires manual attention after a fault2, automatic recovery after fault
811
Usability. In this subcharacteristic, we look at productive factors regarding the812
development and maintenance of the system. In Understandability, we evaluate813
the complexity of the system’s building blocks (e.g., parallel data processing814
engines require knowledge of functional programming). On the other hand,815
Learnability measures the learning effort for the team to start developing the816
required functionalities. Finally, in Operability, we are concerned with the817
maintenance effort and technical complexity of the system.818
Understandability1, high complexity2, medium complexity3, low complexity
Learnability1, the operating team has no knowledge of the tool2, the operating team has small knowledge of the tool and thelearning curve is known to be long3, the operating team has small knowledge of the tool and thelearning curve is known to be short4, the operating team has high knowledge of the tool
Operability1, operation control must be done using command-line2, offers a GUI for operation control
819
Efficiency. Here we evaluate efficiency aspects. Time Behaviour measures the820
performance at processing capabilities, measured by the way the evaluated tool821
shares intermediate results, which has a direct impact on the response time. On822
the other hand, Resource Utilisation measures the hardware needs for the system823
at hand, as it might affect other coexisting software.824
27
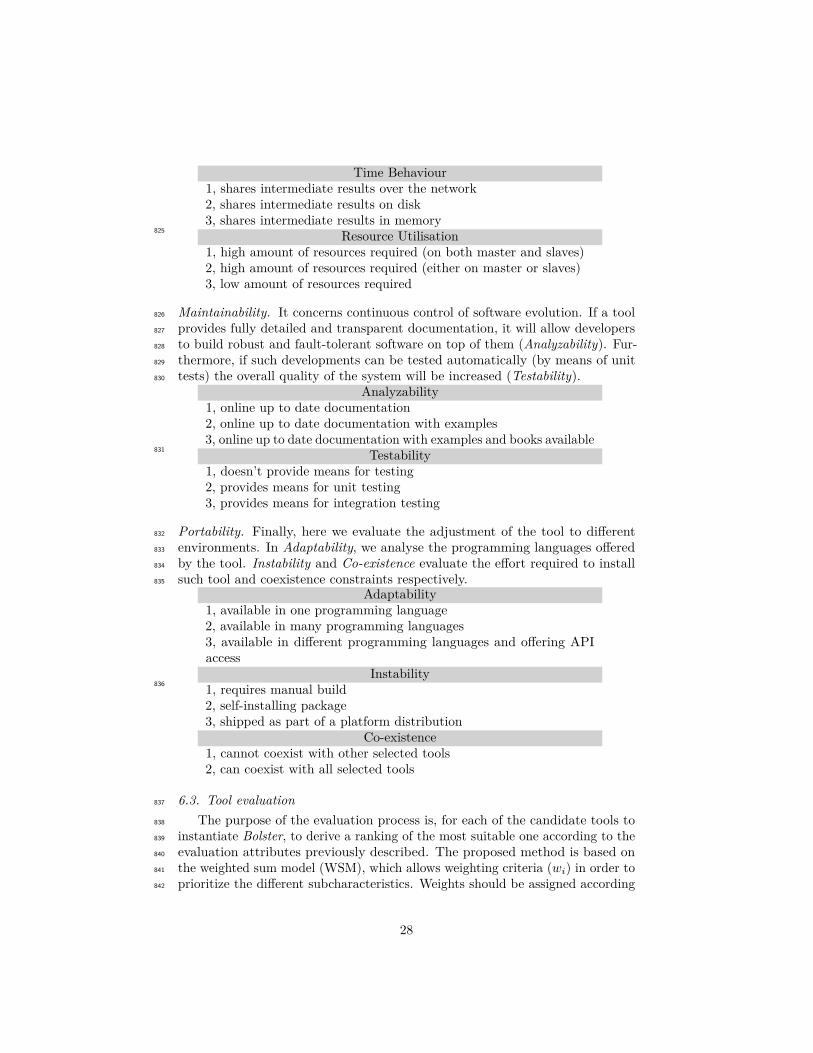
Time Behaviour1, shares intermediate results over the network2, shares intermediate results on disk3, shares intermediate results in memory
Resource Utilisation1, high amount of resources required (on both master and slaves)2, high amount of resources required (either on master or slaves)3, low amount of resources required
825
Maintainability. It concerns continuous control of software evolution. If a tool826
provides fully detailed and transparent documentation, it will allow developers827
to build robust and fault-tolerant software on top of them (Analyzability). Fur-828
thermore, if such developments can be tested automatically (by means of unit829
tests) the overall quality of the system will be increased (Testability).830
Analyzability1, online up to date documentation2, online up to date documentation with examples3, online up to date documentation with examples and books available
Testability1, doesn’t provide means for testing2, provides means for unit testing3, provides means for integration testing
831
Portability. Finally, here we evaluate the adjustment of the tool to different832
environments. In Adaptability, we analyse the programming languages offered833
by the tool. Instability and Co-existence evaluate the effort required to install834
such tool and coexistence constraints respectively.835
Adaptability1, available in one programming language2, available in many programming languages3, available in different programming languages and offering APIaccess
Instability1, requires manual build2, self-installing package3, shipped as part of a platform distribution
Co-existence1, cannot coexist with other selected tools2, can coexist with all selected tools
836
6.3. Tool evaluation837
The purpose of the evaluation process is, for each of the candidate tools to838
instantiate Bolster, to derive a ranking of the most suitable one according to the839
evaluation attributes previously described. The proposed method is based on840
the weighted sum model (WSM), which allows weighting criteria (wi) in order to841
prioritize the different subcharacteristics. Weights should be assigned according842
28
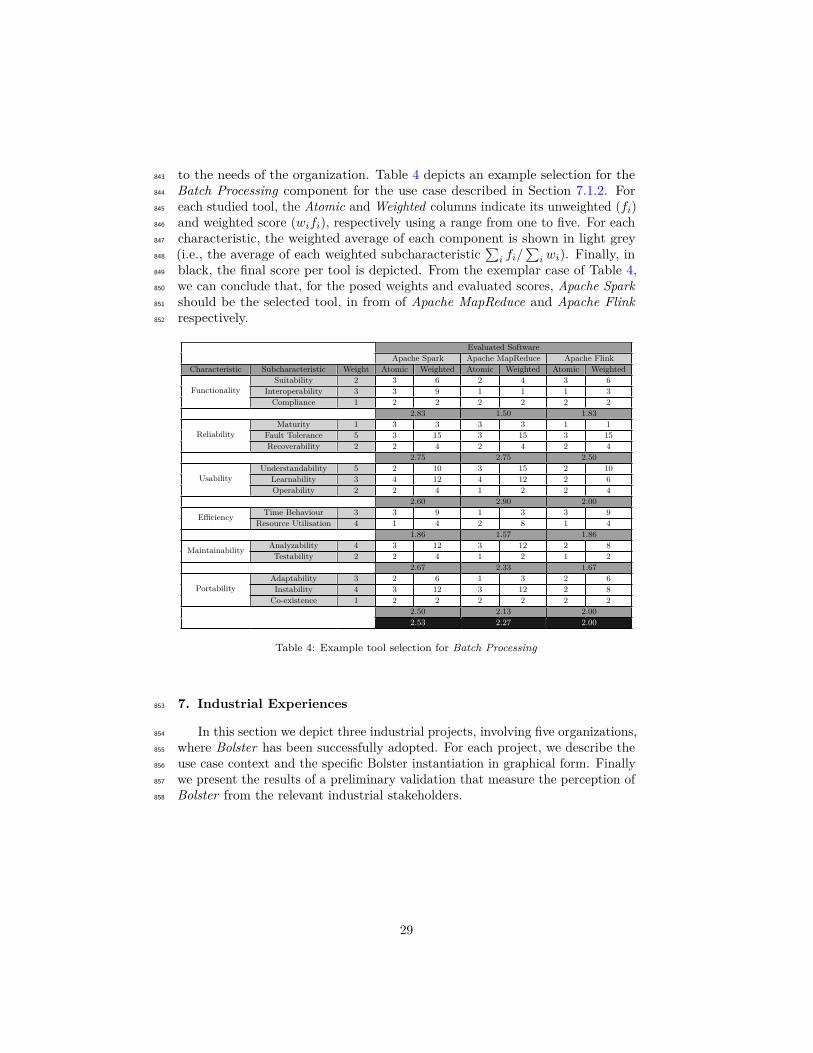
to the needs of the organization. Table 4 depicts an example selection for the843
Batch Processing component for the use case described in Section 7.1.2. For844
each studied tool, the Atomic and Weighted columns indicate its unweighted (fi)845
and weighted score (wifi), respectively using a range from one to five. For each846
characteristic, the weighted average of each component is shown in light grey847
(i.e., the average of each weighted subcharacteristic∑
i fi/∑
i wi). Finally, in848
black, the final score per tool is depicted. From the exemplar case of Table 4,849
we can conclude that, for the posed weights and evaluated scores, Apache Spark850
should be the selected tool, in from of Apache MapReduce and Apache Flink851
respectively.852
Evaluated SoftwareApache Spark Apache MapReduce Apache Flink
Characteristic Subcharacteristic Weight Atomic Weighted Atomic Weighted Atomic Weighted
FunctionalitySuitability 2 3 6 2 4 3 6
Interoperability 3 3 9 1 1 1 3Compliance 1 2 2 2 2 2 2
2.83 1.50 1.83
ReliabilityMaturity 1 3 3 3 3 1 1
Fault Tolerance 5 3 15 3 15 3 15Recoverability 2 2 4 2 4 2 4
2.75 2.75 2.50
UsabilityUnderstandability 5 2 10 3 15 2 10
Learnability 3 4 12 4 12 2 6Operability 2 2 4 1 2 2 4
2.60 2.90 2.00
Efficiency Time Behaviour 3 3 9 1 3 3 9Resource Utilisation 4 1 4 2 8 1 4
1.86 1.57 1.86
Maintainability Analyzability 4 3 12 3 12 2 8Testability 2 2 4 1 2 1 2
2.67 2.33 1.67
PortabilityAdaptability 3 2 6 1 3 2 6Instability 4 3 12 3 12 2 8
Co-existence 1 2 2 2 2 2 22.50 2.13 2.002.53 2.27 2.00
Table 4: Example tool selection for Batch Processing
7. Industrial Experiences853
In this section we depict three industrial projects, involving five organizations,854
where Bolster has been successfully adopted. For each project, we describe the855
use case context and the specific Bolster instantiation in graphical form. Finally856
we present the results of a preliminary validation that measure the perception of857
Bolster from the relevant industrial stakeholders.858
29
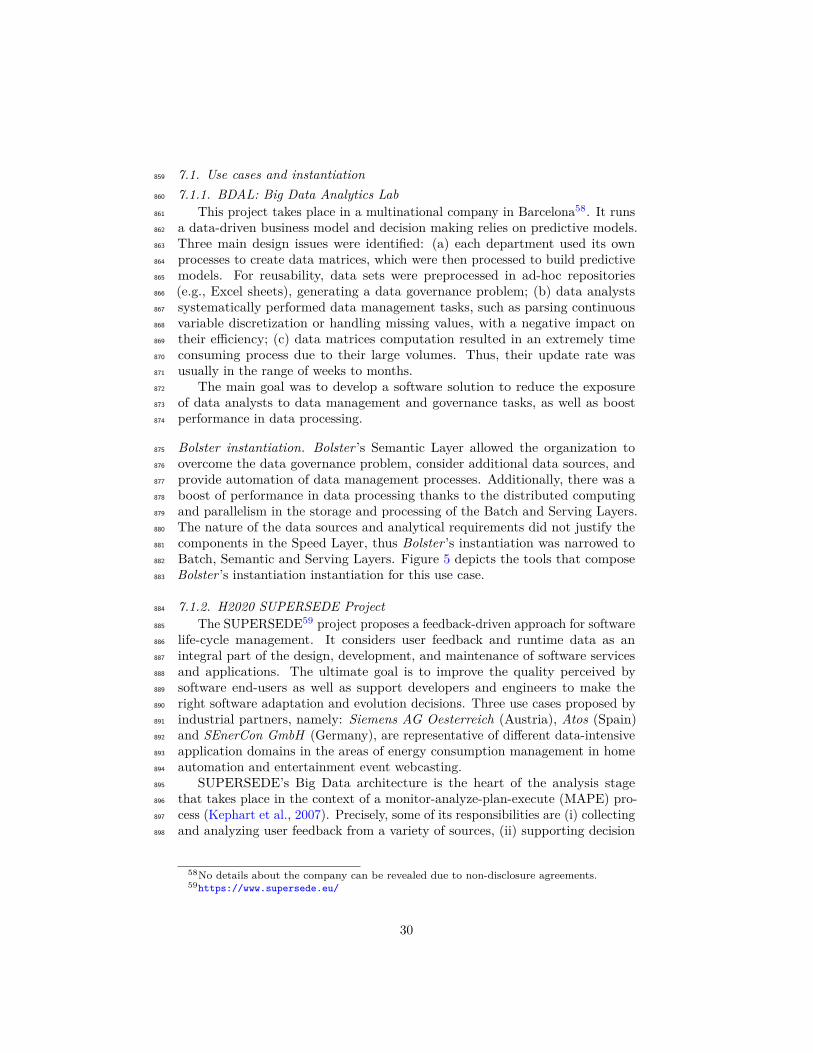
7.1. Use cases and instantiation859
7.1.1. BDAL: Big Data Analytics Lab860
This project takes place in a multinational company in Barcelona58. It runs861
a data-driven business model and decision making relies on predictive models.862
Three main design issues were identified: (a) each department used its own863
processes to create data matrices, which were then processed to build predictive864
models. For reusability, data sets were preprocessed in ad-hoc repositories865
(e.g., Excel sheets), generating a data governance problem; (b) data analysts866
systematically performed data management tasks, such as parsing continuous867
variable discretization or handling missing values, with a negative impact on868
their efficiency; (c) data matrices computation resulted in an extremely time869
consuming process due to their large volumes. Thus, their update rate was870
usually in the range of weeks to months.871
The main goal was to develop a software solution to reduce the exposure872
of data analysts to data management and governance tasks, as well as boost873
performance in data processing.874
Bolster instantiation. Bolster ’s Semantic Layer allowed the organization to875
overcome the data governance problem, consider additional data sources, and876
provide automation of data management processes. Additionally, there was a877
boost of performance in data processing thanks to the distributed computing878
and parallelism in the storage and processing of the Batch and Serving Layers.879
The nature of the data sources and analytical requirements did not justify the880
components in the Speed Layer, thus Bolster ’s instantiation was narrowed to881
Batch, Semantic and Serving Layers. Figure 5 depicts the tools that compose882
Bolster ’s instantiation instantiation for this use case.883
7.1.2. H2020 SUPERSEDE Project884
The SUPERSEDE59 project proposes a feedback-driven approach for software885
life-cycle management. It considers user feedback and runtime data as an886
integral part of the design, development, and maintenance of software services887
and applications. The ultimate goal is to improve the quality perceived by888
software end-users as well as support developers and engineers to make the889
right software adaptation and evolution decisions. Three use cases proposed by890
industrial partners, namely: Siemens AG Oesterreich (Austria), Atos (Spain)891
and SEnerCon GmbH (Germany), are representative of different data-intensive892
application domains in the areas of energy consumption management in home893
automation and entertainment event webcasting.894
SUPERSEDE’s Big Data architecture is the heart of the analysis stage895
that takes place in the context of a monitor-analyze-plan-execute (MAPE) pro-896
cess (Kephart et al., 2007). Precisely, some of its responsibilities are (i) collecting897
and analyzing user feedback from a variety of sources, (ii) supporting decision898
58No details about the company can be revealed due to non-disclosure agreements.59https://www.supersede.eu/
30
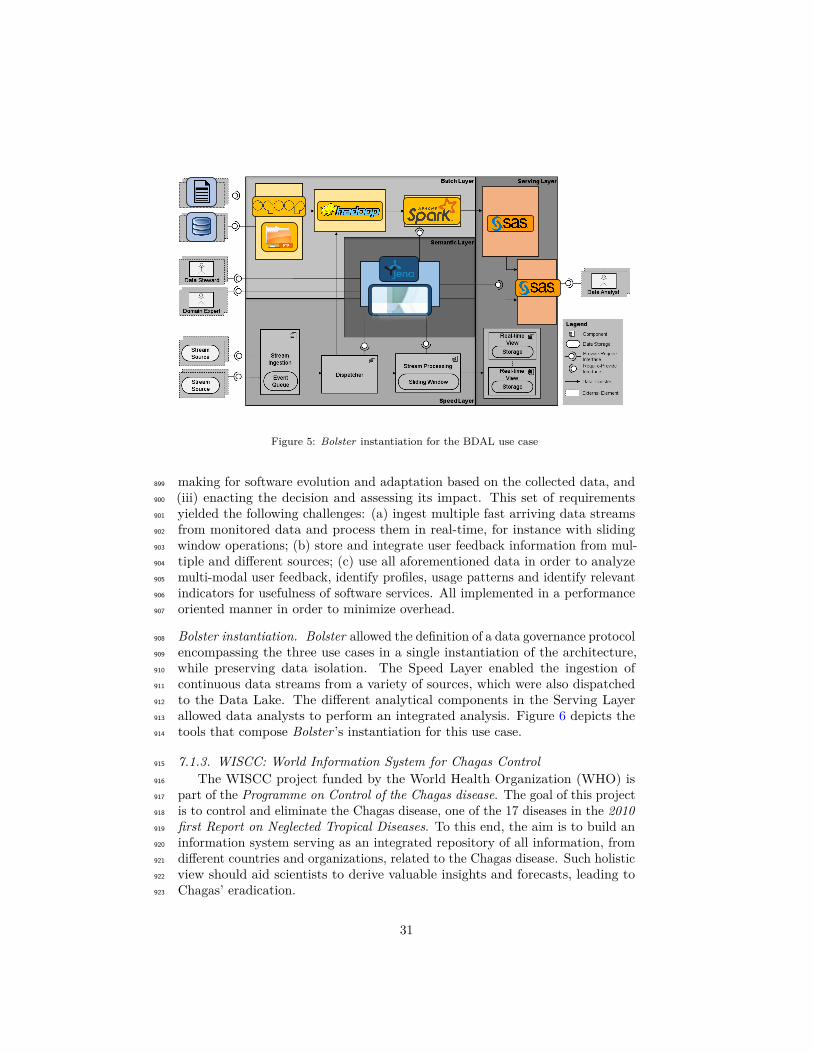
Figure 5: Bolster instantiation for the BDAL use case
making for software evolution and adaptation based on the collected data, and899
(iii) enacting the decision and assessing its impact. This set of requirements900
yielded the following challenges: (a) ingest multiple fast arriving data streams901
from monitored data and process them in real-time, for instance with sliding902
window operations; (b) store and integrate user feedback information from mul-903
tiple and different sources; (c) use all aforementioned data in order to analyze904
multi-modal user feedback, identify profiles, usage patterns and identify relevant905
indicators for usefulness of software services. All implemented in a performance906
oriented manner in order to minimize overhead.907
Bolster instantiation. Bolster allowed the definition of a data governance protocol908
encompassing the three use cases in a single instantiation of the architecture,909
while preserving data isolation. The Speed Layer enabled the ingestion of910
continuous data streams from a variety of sources, which were also dispatched911
to the Data Lake. The different analytical components in the Serving Layer912
allowed data analysts to perform an integrated analysis. Figure 6 depicts the913
tools that compose Bolster ’s instantiation for this use case.914
7.1.3. WISCC: World Information System for Chagas Control915
The WISCC project funded by the World Health Organization (WHO) is916
part of the Programme on Control of the Chagas disease. The goal of this project917
is to control and eliminate the Chagas disease, one of the 17 diseases in the 2010918
first Report on Neglected Tropical Diseases. To this end, the aim is to build an919
information system serving as an integrated repository of all information, from920
different countries and organizations, related to the Chagas disease. Such holistic921
view should aid scientists to derive valuable insights and forecasts, leading to922
Chagas’ eradication.923
31
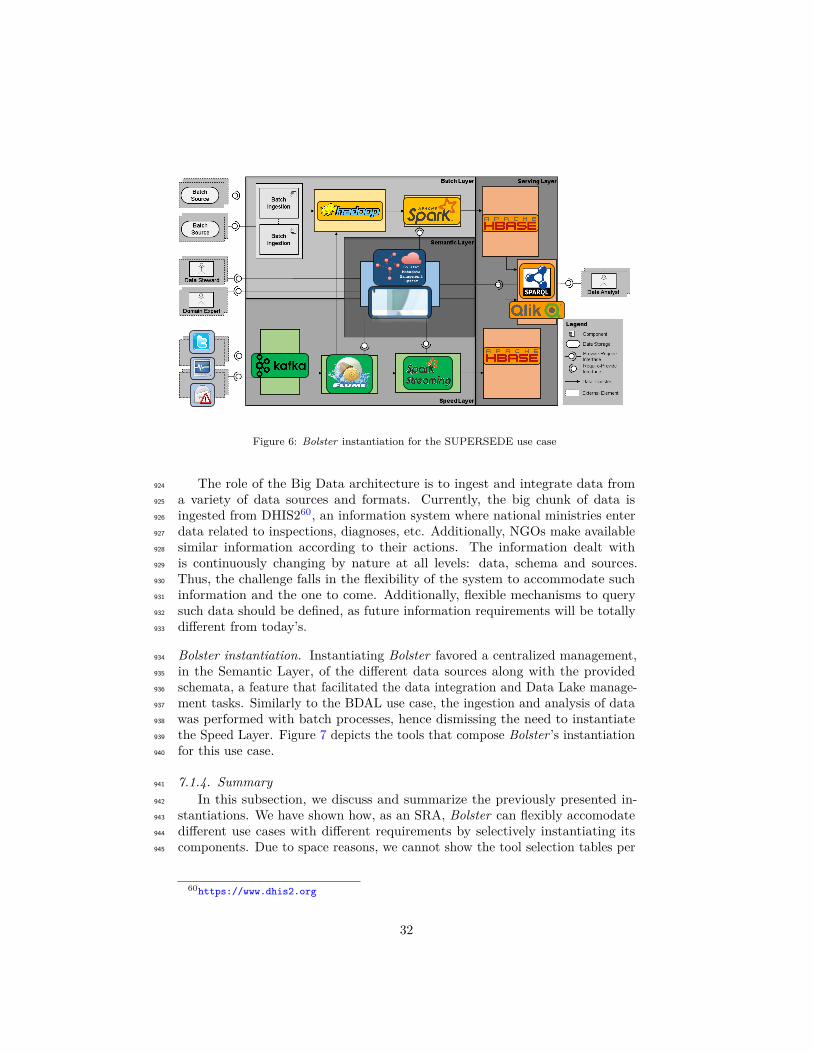
Figure 6: Bolster instantiation for the SUPERSEDE use case
The role of the Big Data architecture is to ingest and integrate data from924
a variety of data sources and formats. Currently, the big chunk of data is925
ingested from DHIS260, an information system where national ministries enter926
data related to inspections, diagnoses, etc. Additionally, NGOs make available927
similar information according to their actions. The information dealt with928
is continuously changing by nature at all levels: data, schema and sources.929
Thus, the challenge falls in the flexibility of the system to accommodate such930
information and the one to come. Additionally, flexible mechanisms to query931
such data should be defined, as future information requirements will be totally932
different from today’s.933
Bolster instantiation. Instantiating Bolster favored a centralized management,934
in the Semantic Layer, of the different data sources along with the provided935
schemata, a feature that facilitated the data integration and Data Lake manage-936
ment tasks. Similarly to the BDAL use case, the ingestion and analysis of data937
was performed with batch processes, hence dismissing the need to instantiate938
the Speed Layer. Figure 7 depicts the tools that compose Bolster ’s instantiation939
for this use case.940
7.1.4. Summary941
In this subsection, we discuss and summarize the previously presented in-942
stantiations. We have shown how, as an SRA, Bolster can flexibly accomodate943
different use cases with different requirements by selectively instantiating its944
components. Due to space reasons, we cannot show the tool selection tables per945
60https://www.dhis2.org
32
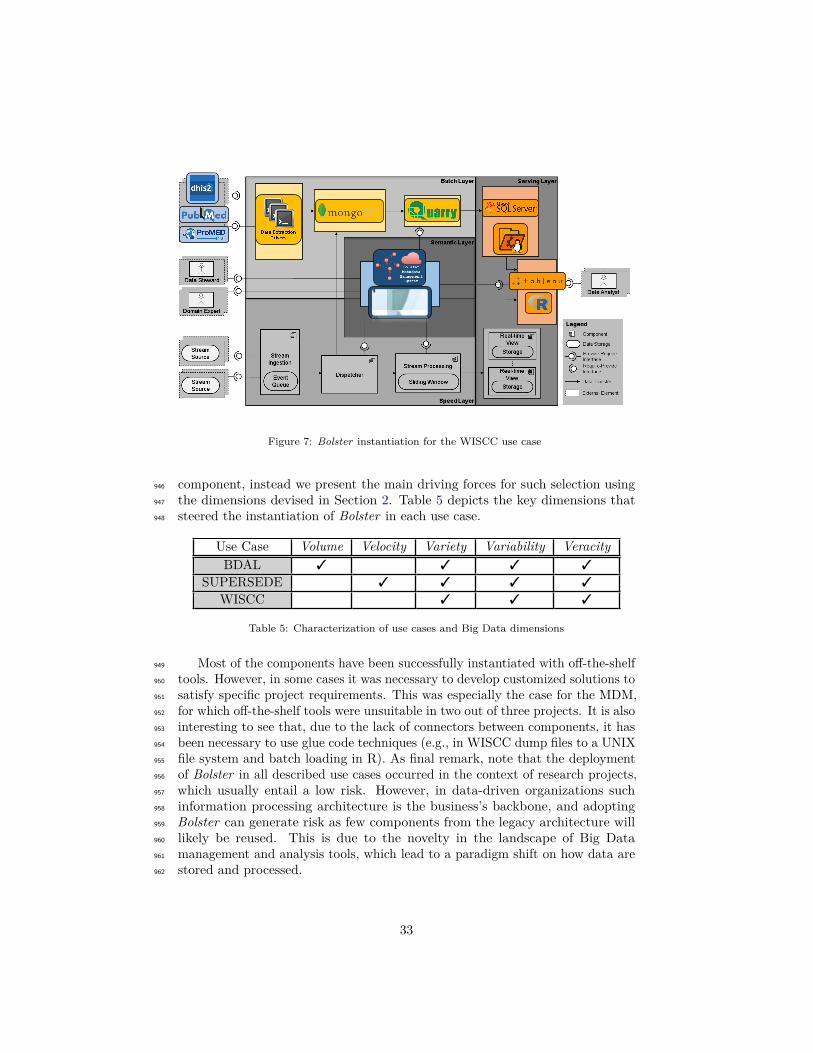
Figure 7: Bolster instantiation for the WISCC use case
component, instead we present the main driving forces for such selection using946
the dimensions devised in Section 2. Table 5 depicts the key dimensions that947
steered the instantiation of Bolster in each use case.948
Use Case Volume Velocity Variety Variability VeracityBDAL 3 3 3 3
SUPERSEDE 3 3 3 3
WISCC 3 3 3
Table 5: Characterization of use cases and Big Data dimensions
Most of the components have been successfully instantiated with off-the-shelf949
tools. However, in some cases it was necessary to develop customized solutions to950
satisfy specific project requirements. This was especially the case for the MDM,951
for which off-the-shelf tools were unsuitable in two out of three projects. It is also952
interesting to see that, due to the lack of connectors between components, it has953
been necessary to use glue code techniques (e.g., in WISCC dump files to a UNIX954
file system and batch loading in R). As final remark, note that the deployment955
of Bolster in all described use cases occurred in the context of research projects,956
which usually entail a low risk. However, in data-driven organizations such957
information processing architecture is the business’s backbone, and adopting958
Bolster can generate risk as few components from the legacy architecture will959
likely be reused. This is due to the novelty in the landscape of Big Data960
management and analysis tools, which lead to a paradigm shift on how data are961
stored and processed.962
33
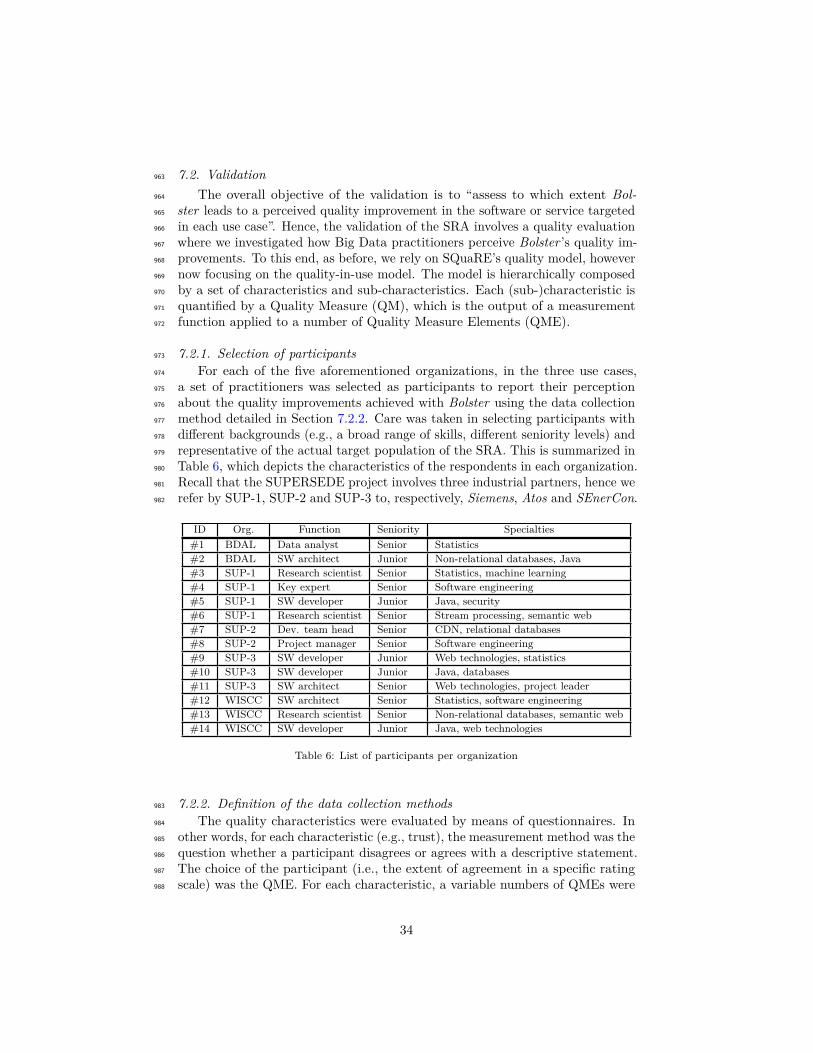
7.2. Validation963
The overall objective of the validation is to “assess to which extent Bol-964
ster leads to a perceived quality improvement in the software or service targeted965
in each use case”. Hence, the validation of the SRA involves a quality evaluation966
where we investigated how Big Data practitioners perceive Bolster ’s quality im-967
provements. To this end, as before, we rely on SQuaRE’s quality model, however968
now focusing on the quality-in-use model. The model is hierarchically composed969
by a set of characteristics and sub-characteristics. Each (sub-)characteristic is970
quantified by a Quality Measure (QM), which is the output of a measurement971
function applied to a number of Quality Measure Elements (QME).972
7.2.1. Selection of participants973
For each of the five aforementioned organizations, in the three use cases,974
a set of practitioners was selected as participants to report their perception975
about the quality improvements achieved with Bolster using the data collection976
method detailed in Section 7.2.2. Care was taken in selecting participants with977
different backgrounds (e.g., a broad range of skills, different seniority levels) and978
representative of the actual target population of the SRA. This is summarized in979
Table 6, which depicts the characteristics of the respondents in each organization.980
Recall that the SUPERSEDE project involves three industrial partners, hence we981
refer by SUP-1, SUP-2 and SUP-3 to, respectively, Siemens, Atos and SEnerCon.982
ID Org. Function Seniority Specialties#1 BDAL Data analyst Senior Statistics#2 BDAL SW architect Junior Non-relational databases, Java#3 SUP-1 Research scientist Senior Statistics, machine learning#4 SUP-1 Key expert Senior Software engineering#5 SUP-1 SW developer Junior Java, security#6 SUP-1 Research scientist Senior Stream processing, semantic web#7 SUP-2 Dev. team head Senior CDN, relational databases#8 SUP-2 Project manager Senior Software engineering#9 SUP-3 SW developer Junior Web technologies, statistics#10 SUP-3 SW developer Junior Java, databases#11 SUP-3 SW architect Senior Web technologies, project leader#12 WISCC SW architect Senior Statistics, software engineering#13 WISCC Research scientist Senior Non-relational databases, semantic web#14 WISCC SW developer Junior Java, web technologies
Table 6: List of participants per organization
7.2.2. Definition of the data collection methods983
The quality characteristics were evaluated by means of questionnaires. In984
other words, for each characteristic (e.g., trust), the measurement method was the985
question whether a participant disagrees or agrees with a descriptive statement.986
The choice of the participant (i.e., the extent of agreement in a specific rating987
scale) was the QME. For each characteristic, a variable numbers of QMEs were988
34
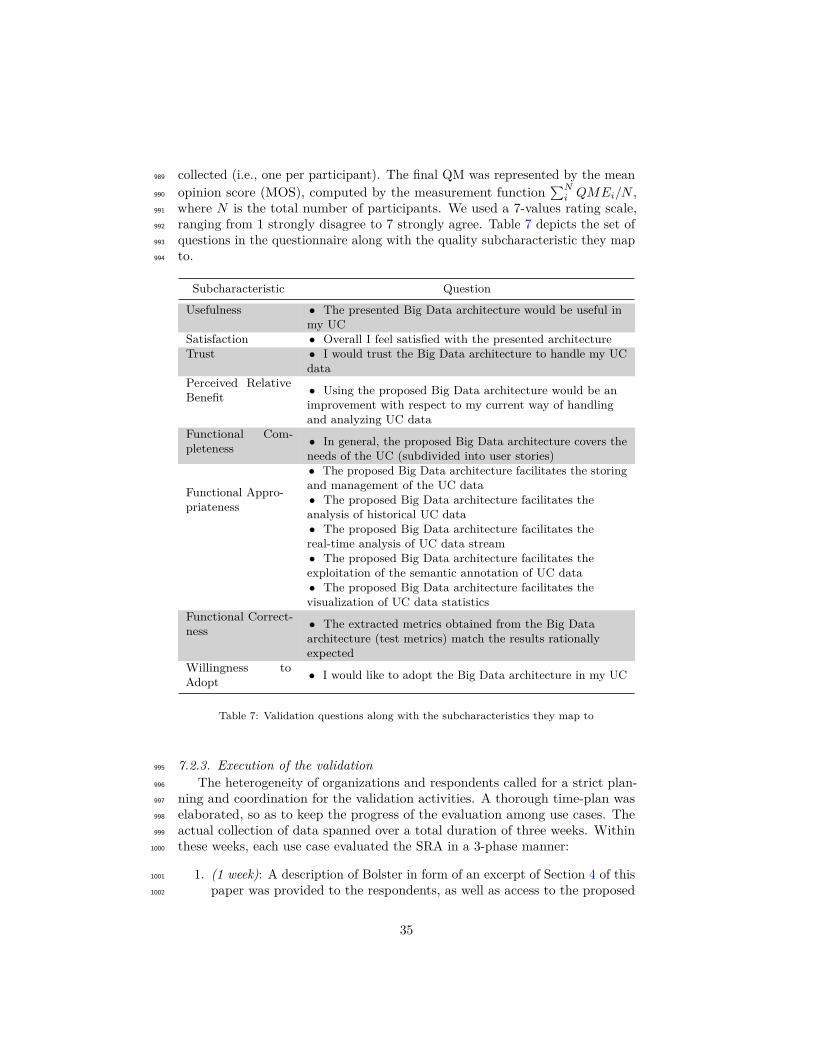
collected (i.e., one per participant). The final QM was represented by the mean989
opinion score (MOS), computed by the measurement function∑N
i QMEi/N ,990
where N is the total number of participants. We used a 7-values rating scale,991
ranging from 1 strongly disagree to 7 strongly agree. Table 7 depicts the set of992
questions in the questionnaire along with the quality subcharacteristic they map993
to.994
Subcharacteristic Question
Usefulness • The presented Big Data architecture would be useful inmy UC
Satisfaction • Overall I feel satisfied with the presented architectureTrust • I would trust the Big Data architecture to handle my UC
dataPerceived RelativeBenefit • Using the proposed Big Data architecture would be an
improvement with respect to my current way of handlingand analyzing UC data
Functional Com-pleteness • In general, the proposed Big Data architecture covers the
needs of the UC (subdivided into user stories)
Functional Appro-priateness
• The proposed Big Data architecture facilitates the storingand management of the UC data• The proposed Big Data architecture facilitates theanalysis of historical UC data• The proposed Big Data architecture facilitates thereal-time analysis of UC data stream• The proposed Big Data architecture facilitates theexploitation of the semantic annotation of UC data• The proposed Big Data architecture facilitates thevisualization of UC data statistics
Functional Correct-ness • The extracted metrics obtained from the Big Data
architecture (test metrics) match the results rationallyexpected
Willingness toAdopt • I would like to adopt the Big Data architecture in my UC
Table 7: Validation questions along with the subcharacteristics they map to
7.2.3. Execution of the validation995
The heterogeneity of organizations and respondents called for a strict plan-996
ning and coordination for the validation activities. A thorough time-plan was997
elaborated, so as to keep the progress of the evaluation among use cases. The998
actual collection of data spanned over a total duration of three weeks. Within999
these weeks, each use case evaluated the SRA in a 3-phase manner:1000
1. (1 week): A description of Bolster in form of an excerpt of Section 4 of this1001
paper was provided to the respondents, as well as access to the proposed1002
35
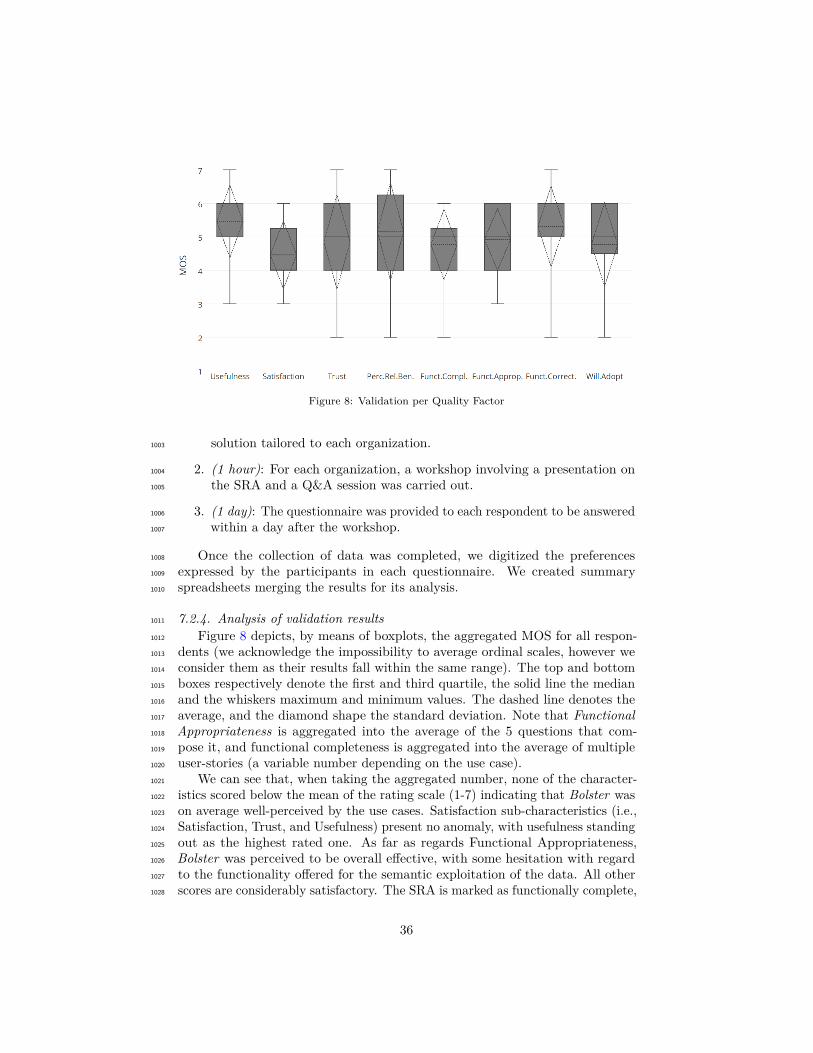
Figure 8: Validation per Quality Factor
solution tailored to each organization.1003
2. (1 hour): For each organization, a workshop involving a presentation on1004
the SRA and a Q&A session was carried out.1005
3. (1 day): The questionnaire was provided to each respondent to be answered1006
within a day after the workshop.1007
Once the collection of data was completed, we digitized the preferences1008
expressed by the participants in each questionnaire. We created summary1009
spreadsheets merging the results for its analysis.1010
7.2.4. Analysis of validation results1011
Figure 8 depicts, by means of boxplots, the aggregated MOS for all respon-1012
dents (we acknowledge the impossibility to average ordinal scales, however we1013
consider them as their results fall within the same range). The top and bottom1014
boxes respectively denote the first and third quartile, the solid line the median1015
and the whiskers maximum and minimum values. The dashed line denotes the1016
average, and the diamond shape the standard deviation. Note that Functional1017
Appropriateness is aggregated into the average of the 5 questions that com-1018
pose it, and functional completeness is aggregated into the average of multiple1019
user-stories (a variable number depending on the use case).1020
We can see that, when taking the aggregated number, none of the character-1021
istics scored below the mean of the rating scale (1-7) indicating that Bolster was1022
on average well-perceived by the use cases. Satisfaction sub-characteristics (i.e.,1023
Satisfaction, Trust, and Usefulness) present no anomaly, with usefulness standing1024
out as the highest rated one. As far as regards Functional Appropriateness,1025
Bolster was perceived to be overall effective, with some hesitation with regard1026
to the functionality offered for the semantic exploitation of the data. All other1027
scores are considerably satisfactory. The SRA is marked as functionally complete,1028
36
and correct, and expected to bring benefits in comparison to current techniques1029
used in the use cases. Ultimately this leads to a large intention to use.1030
Discussion. We can conclude that generally user’s perception is positive, being1031
most answers in the range from Neutral to Strongly Agree. The preliminary1032
assessment shows that the potential of the Bolster SRA is recognized also in the1033
industry domain and its application is perceived to be beneficial in improving1034
the quality-in-use of software products. It is worth noting, however, that some1035
respondents showed reluctancy regarding the Semantic Layer in Bolster. We1036
believe this aligns with the fact that Semantic Web technologies have not yet1037
been widely adopted in industry. Thus, lack of known successful industrial use1038
cases may raise caution among potential adopters.1039
8. Conclusions1040
Despite their current popularity, Big Data systems engineering is still in its1041
inception. As any other disruptive software-related technology, the consolidation1042
of emerging results is not easy and requires the effective application of solid1043
software engineering concepts. In this paper, we have focused on an architecture-1044
centric perspective and have defined an SRA, Bolster, to harmonize the different1045
components that lie in the core of such kind of systems. The approach uses the1046
semantic-aware strategy as main principle to define the different components1047
and their relationships. The benefits of Bolster are twofold. On the one hand, as1048
any SRA, it facilitates the technological work of Big Data adopters by providing1049
a unified framework which can be tailored to a specific context instead of a set1050
of independent components that are glued together in an ad-hoc manner. On1051
the other hand, as a semantic-aware solution, it supports non-expert Big Data1052
adopters in the definition and exploitation of the data stored in the system by1053
facilitating the decoupling of the data steward and analyst profiles. However,1054
we anticipate that in the long run, with the maturity of such technologies, the1055
role of software architect will be replaced in favor of the database administrator.1056
In this initial deployment, Bolster includes components for data management1057
and analysis as a first step towards the systematic development of the core1058
elements of Big Data systems. Thus, Bolster currently maps to the role played1059
by a relational DBMS in traditional BI systems. As future work, we foresee the1060
need to design a generic tool providing full-fledged functionalities for Metadata1061
Management System.1062
Acknowledgements1063
We thank Gerhard Engelbrecht for his assistance in setting up the validation1064
process, and Silverio Martínez for his comments and insights that helped to1065
improve this paper. This work was partly supported by the H2020 SUPERSEDE1066
project, funded by the EU Information and Communication Technologies Pro-1067
gramme under grant agreement no 644018, and the GENESIS project, funded by1068
the Spanish Ministerio de Ciencia e Innovación under project TIN2016-79269-R.1069
37
9. References1070
Agrawal, D., Das, S., El Abbadi, A., 2011. Big Data and Cloud Computing:1071
Current State and Future Opportunities. In: EDBT 2011.1072
Alsubaiee, S., Altowim, Y., Altwaijry, H., Behm, A., Borkar, V. R., Bu, Y.,1073
Carey, M. J., Cetindil, I., Cheelangi, M., Faraaz, K., Gabrielova, E., Grover,1074
R., Heilbron, Z., Kim, Y., Li, C., Li, G., Ok, J. M., Onose, N., Pirzadeh,1075
P., Tsotras, V. J., Vernica, R., Wen, J., Westmann, T., 2014. AsterixDB: A1076
Scalable, Open Source BDMS. PVLDB 7 (14), 1905–1916.1077
Angelov, S., Grefen, P. W. P. J., Greefhorst, D., 2012. A Framework for Analysis1078
and Design of Software Reference Architectures. Information & Software1079
Technology 54 (4), 417–431.1080
Aufaure, M., 2013. What’s Up in Business Intelligence? A Contextual and1081
Knowledge-Based Perspective. In: ER 2013.1082
Babcock, B., Babu, S., Datar, M., Motwani, R., Widom, J., 2002. Models and1083
Issues in Data Stream Systems. In: PODS 2002.1084
Batini, C., Rula, A., Scannapieco, M., Viscusi, G., 2015. From Data Quality to1085
Big Data Quality. J. Database Manag. 26 (1), 60–82.1086
Behkamal, B., Kahani, M., Akbari, M. K., 2009. Customizing ISO 9126 Quality1087
Model for Evaluation of B2B Applications. Information & Software Technology1088
51 (3), 599–609.1089
Bilalli, B., Abelló, A., Aluja-Banet, T., Wrembel, R., 2016. Towards Intelligent1090
Data Analysis: The Metadata Challenge. In: IoTBD 2016. pp. 331–338.1091
Brewer, E. A., 2000. Towards Robust Distributed Systems (abstract). In: PODC1092
2000.1093
Chen, C. L. P., Zhang, C., 2014. Data-intensive Applications, Challenges, Tech-1094
niques and Technologies: A Survey on Big Data. Inf. Sci. 275, 314–347.1095
e Sá, J. O., Martins, C., Simões, P., 2015. Big Data in Cloud: A Data Architecture.1096
In: WorldCIST 2015.1097
Esteban, D., 2016. Interoperability and Standards in the European Data Economy1098
- Report on EC Workshop. European Commission.1099
Fernandez, R. C., Pietzuch, P., Kreps, J., Narkhede, N., Rao, J., Koshy, J., Lin,1100
D., Riccomini, C., Wang, G., 2015. Liquid: Unifying Nearline and Offline Big1101
Data Integration. In: CIDR 2015.1102
Fox, G., Chang, W., 2015. NIST Big Data Interoperability Framework: Volume1103
3, Use Case and General Requirements. NIST Special Publication (1500-3).1104
38
Galster, M., Avgeriou, P., 2011. Empirically-grounded Reference Architectures:1105
A Proposal. In: QoSA+ISARCS 2011. pp. 153–158.1106
Gani, A., Siddiqa, A., Shamshirband, S., Hanum, F., 2016. A Survey on Indexing1107
Techniques for Big Data: Taxonomy and Performance Evaluation. Knowl. Inf.1108
Syst. 46 (2), 241–284.1109
Garcia-Molina, H., Ullman, J. D., Widom, J., 2009. Database Systems - The1110
Complete Book (2. ed.). Pearson Education.1111
García, S., Romero, O., Raventós, R., 2016. DSS from an RE Perspective: A1112
Systematic Mapping. Journal of Systems and Software 117, 488 – 507.1113
Geerdink, B., 2015. A Reference Architecture for Big Data Solutions - Introducing1114
a Model to Perform Predictive Analytics Using Big Data Technology. IJBDI1115
2015 2 (4), 236–249.1116
Giacometti, A., Marcel, P., Negre, E., 2008. A Framework for Recommending1117
OLAP Queries. In: DOLAP 2008.1118
Gorton, I., Klein, J., 2015. Distribution, Data, Deployment: Software Architec-1119
ture Convergence in Big Data Systems. IEEE Software 32 (3), 78–85.1120
Grady, N. W., Underwood, M., Roy, A., Chang, W. L., 2014. Big Data: Chal-1121
lenges, Practices and Technologies: NIST Big Data Public Working Group1122
Workshop at IEEE Big Data 2014. In: IEEE Big Data 2014.1123
Gray, J., Liu, D. T., Nieto-Santisteban, M. A., Szalay, A. S., DeWitt, D. J.,1124
Heber, G., 2005. Scientific Data Management in the Coming Decade. SIGMOD1125
Record 34 (4), 34–41.1126
Grosskurth, A., Godfrey, M. W., 2005. A reference architecture for web browsers.1127
In: ICSM 2005. pp. 661–664.1128
Guo, K., Pan, W., Lu, M., Zhou, X., Ma, J., 2015. An Effective and Economical1129
Architecture for Semantic-based Heterogeneous Multimedia Big Data Retrieval.1130
Journal of Systems and Software 102, 207–216.1131
Harry, M. J., Schroeder, R. R., 2005. Six Sigma: The Breakthrough Management1132
Strategy Revolutionizing the World’s Top Corporations. Broadway Business.1133
Herrero, V., Abelló, A., Romero, O., 2016. NOSQL Design for Analytical1134
Workloads: Variability Matters. In: ER 2016. pp. 50–64.1135
Interlandi, M., Shah, K., Tetali, S. D., Gulzar, M., Yoo, S., Kim, M., Millstein,1136
T. D., Condie, T., 2015. Titian: Data Provenance Support in Spark. PVLDB1137
9 (3), 216–227.1138
Ionescu, B., Ionescu, D., Gadea, C., Solomon, B., Trifan, M., 2014. An Architec-1139
ture and Methods for Big Data Analysis. In: SOFA 2014.1140
39
ISO, 2011. IEC25010: 2011 Systems and software engineering–Systems and1141
software Quality Requirements and Evaluation (SQuaRE)–System and software1142
quality models.1143
Jagadish, H. V., Gehrke, J., Labrinidis, A., Papakonstantinou, Y., Patel, J. M.,1144
Ramakrishnan, R., Shahabi, C., 2014. Big Data and its Technical Challenges.1145
Commun. ACM 57 (7), 86–94.1146
Jovanovic, P., Romero, O., Simitsis, A., Abelló, A., Candón, H., Nadal, S., 2015.1147
Quarry: Digging Up the Gems of Your Data Treasury. In: EDBT 2015.1148
Kephart, J., Chess, D., Boutilier, C., Das, R., Kephart, J. O., Walsh, W. E.,1149
2007. An Architectural Blueprint for Autonomic Computing.1150
Khatri, V., Brown, C. V., 2010. Designing Data Governance. Commun. ACM1151
53 (1), 148–152.1152
Kitchenham, B., Charters, S., 2007. Guidelines for Performing Systematic Liter-1153
ature Reviews in Software Engineering.1154
Kontio, J., 1996. A Case Study in Applying a Systematic Method for COTS1155
Selection. In: ICSE 1996. pp. 201–209.1156
Kroß, J., Brunnert, A., Prehofer, C., Runkler, T. A., Krcmar, H., 2015. Stream1157
Processing on Demand for Lambda Architectures. In: EPEW 2015.1158
Liu, F., Tong, J., Mao, J., Bohn, R., Messina, J., Badger, L., Leaf, D., 2012.1159
NIST Cloud Computing Reference Architecture: Recommendations of the1160
National Institute of Standards and Technology.1161
Madhavji, N. H., Miranskyy, A. V., Kontogiannis, K., 2015. Big Picture of Big1162
Data Software Engineering: With Example Research Challenges. In: BIGDSE1163
2015.1164
Martínez-Fernández, S., Ayala, C. P., Franch, X., Nakagawa, E. Y., 2015. A1165
Survey on the Benefits and Drawbacks of AUTOSAR. In: WASA 2015.1166
Martínez-Prieto, M. A., Cuesta, C. E., Arias, M., Fernández, J. D., 2015. The1167
Solid Architecture for Real-time Management of Big Semantic Data. Future1168
Generation Comp. Syst. 47, 62–79.1169
Marz, N., Warren, J., 2015. Big Data: Principles and Best Practices of Scalable1170
Realtime Data Systems. Manning Publications Co.1171
Meijer, E., Bierman, G. M., 2011. A Co-relational Model of Data for Large1172
Shared Data Banks. Commun. ACM 54 (4), 49–58.1173
Moreau, L., Clifford, B., Freire, J., Futrelle, J., Gil, Y., Groth, P. T., Kwas-1174
nikowska, N., Miles, S., Missier, P., Myers, J., Plale, B., Simmhan, Y., Stephan,1175
E. G., den Bussche, J. V., 2011. The Open Provenance Model core specification1176
(v1.1). Future Generation Comp. Syst. 27 (6), 743–756.1177
40
Munir, R. F., Romero, O., Abelló, A., Bilalli, B., Thiele, M., Lehner, W., 2016.1178
ResilientStore: A Heuristic-Based Data Format Selector for Intermediate1179
Results. In: MEDI 2016. pp. 42–56.1180
Nadal, S., Herrero, V., Romero, O., Abelló, A., Franch, X., Vansummeren, S.,1181
2016. Details on Bolster - State of the Art.1182
URL www.essi.upc.edu/~snadal/Bolster_SLR.html1183
Nadal, S., Romero, O., Abelló, A., Vassiliadis, P., Vansummeren, S., 2017. An1184
Integration-Oriented Ontology to Govern Evolution in Big Data Ecosystems.1185
In: DOLAP 2017.1186
Ordonez, C., 2010. Statistical Model Computation with UDFs. IEEE Trans.1187
Knowl. Data Eng. 22 (12), 1752–1765.1188
Özsu, M. T., Valduriez, P., 2011. Principles of Distributed Database Systems,1189
Third Edition. Springer.1190
Pääkkönen, P., Pakkala, D., 2015. Reference Architecture and Classification of1191
Technologies, Products and Services for Big Data Systems. Big Data Research1192
2 (4), 166–186.1193
Panov, P., Dzeroski, S., Soldatova, L. N., 2008. OntoDM: An Ontology of Data1194
Mining. In: ICDM 2008.1195
Phuoc, D. L., Nguyen-Mau, H. Q., Parreira, J. X., Hauswirth, M., 2012. A1196
Middleware Framework for Scalable Management of Linked Streams. J. Web1197
Sem. 16, 42–51.1198
Qanbari, S., Zadeh, S. M., Vedaei, S., Dustdar, S., 2014. CloudMan: A Platform1199
for Portable Cloud Manufacturing Services. In: IEEE Big Data 2014.1200
Russom, P., 2011. Big Data Analytics. TDWI Best Practices Report, Fourth1201
Quarter, 6.1202
Sharda, R., Asamoah, D. A., Ponna, N., 2013. Business Analytics: Research and1203
Teaching Perspectives. In: ITI 2013.1204
Song, J., Guo, C., Wang, Z., Zhang, Y., Yu, G., Pierson, J., 2015. HaoLap: A1205
Hadoop Based OLAP System for Big Data. Journal of Systems and Software1206
102, 167–181.1207
Stonebraker, M., 2012. What Does ‘Big Data’ Mean. [email protected]
Stonebraker, M., 2014. Why the ’Data Lake’ is Really a ’Data Swamp’.1209
Terrizzano, I., Schwarz, P. M., Roth, M., Colino, J. E., 2015. Data Wrangling:1211
The Challenging Journey from the Wild to the Lake. In: CIDR 2015.1212
41
Tsai, C.-W., Lai, C.-F., Chao, H.-C., Vasilakos, A. V., 2015. Big Data Analytics:1213
a Survey. Journal of Big Data 2 (1), 1–32.1214
Twardowski, B., Ryzko, D., 2014. Multi-agent Architecture for Real-Time Big1215
Data Processing. In: IEEE/WIC/ACM 2014.1216
Vanhove, T., van Seghbroeck, G., Wauters, T., Turck, F. D., Vermeulen, B.,1217
Demeester, P., 2015. Tengu: An Experimentation Platform for Big Data1218
Applications. In: ICDCS 2015.1219
Varga, J., Romero, O., Pedersen, T. B., Thomsen, C., 2014. Towards Next1220
Generation BI Systems: The Analytical Metadata Challenge. In: DaWaK1221
2014.1222
Villari, M., Celesti, A., Fazio, M., Puliafito, A., 2014. AllJoyn Lambda: An Archi-1223
tecture for the Management of Smart Environments in IoT. In: SMARTCOMP1224
2014.1225
Wang, Y., Kung, L., Ting, C., Byrd, T. A., 2015. Beyond a Technical Perspective:1226
Understanding Big Data Capabilities in Health Care. In: HICSS 2015.1227
Weyrich, M., Ebert, C., 2016. Reference architectures for the internet of things.1228
IEEE Software 33 (1), 112–116.1229
Xie, Z., Chen, Y., Speer, J., Walters, T., Tarazaga, P. A., Kasarda, M., 2015.1230
Towards Use And Reuse Driven Big Data Management. In: ACM/IEEE-CE1231
2015.1232
Yang, F., Merlino, G., Léauté, X., 2015. The RADStack: Open Source Lambda1233
Architecture for Interactive Analytics.1234
Zeng, K., Yang, J., Wang, H., Shao, B., Wang, Z., 2013. A Distributed Graph1235
Engine for Web Scale RDF Data. PVLDB 6 (4), 265–276.1236
Zhang, R., Manotas, I., Li, M., Hildebrand, D., 2015. Towards a Big Data1237
Benchmarking and Demonstration Suite for the Online Social Network Era1238
with Realistic Workloads and Live Data. In: BPOE 2015.1239
Zhuang, Y., Wang, Y., Shao, J., Chen, L., Lu, W., Sun, J., Wei, B., Wu, J.,1240
2016. D-Ocean: An Unstructured Data Management System for Data Ocean1241
Environment. Frontiers of Computer Science 10 (2), 353–369.1242
42
Related Documents


![Semantic Web in a Pervasive Context-Aware Architecture...The Semantic Web, described by Tim Berners-Leeet. al.[4], is an extension of the current web in which information is given](https://static.cupdf.com/doc/110x72/609aa2dda933ab2c6453c959/semantic-web-in-a-pervasive-context-aware-architecture-the-semantic-web-described.jpg)


