HAL Id: hal-01454937 https://hal.archives-ouvertes.fr/hal-01454937 Submitted on 3 Feb 2017 HAL is a multi-disciplinary open access archive for the deposit and dissemination of sci- entific research documents, whether they are pub- lished or not. The documents may come from teaching and research institutions in France or abroad, or from public or private research centers. L’archive ouverte pluridisciplinaire HAL, est destinée au dépôt et à la diffusion de documents scientifiques de niveau recherche, publiés ou non, émanant des établissements d’enseignement et de recherche français ou étrangers, des laboratoires publics ou privés. A Social Network Analysis of Face Tracking in News Video Benjamin Renoust, Thanh Duc Ngo, Duy-Dinh Le, Shin’Ichi Satoh To cite this version: Benjamin Renoust, Thanh Duc Ngo, Duy-Dinh Le, Shin’Ichi Satoh. A Social Network Analysis of Face Tracking in News Video. International Conference on Signal Image Technology and Internet Based Systems, 2015, Bangkok, Thailand. pp.474 - 481, 10.1109/SITIS.2015.30. hal-01454937

Welcome message from author
This document is posted to help you gain knowledge. Please leave a comment to let me know what you think about it! Share it to your friends and learn new things together.
Transcript
HAL Id: hal-01454937https://hal.archives-ouvertes.fr/hal-01454937
Submitted on 3 Feb 2017
HAL is a multi-disciplinary open accessarchive for the deposit and dissemination of sci-entific research documents, whether they are pub-lished or not. The documents may come fromteaching and research institutions in France orabroad, or from public or private research centers.
L’archive ouverte pluridisciplinaire HAL, estdestinée au dépôt et à la diffusion de documentsscientifiques de niveau recherche, publiés ou non,émanant des établissements d’enseignement et derecherche français ou étrangers, des laboratoirespublics ou privés.
A Social Network Analysis of Face Tracking in NewsVideo
Benjamin Renoust, Thanh Duc Ngo, Duy-Dinh Le, Shin’Ichi Satoh
To cite this version:Benjamin Renoust, Thanh Duc Ngo, Duy-Dinh Le, Shin’Ichi Satoh. A Social Network Analysis ofFace Tracking in News Video. International Conference on Signal Image Technology and InternetBased Systems, 2015, Bangkok, Thailand. pp.474 - 481, �10.1109/SITIS.2015.30�. �hal-01454937�

A Social Network Analysis of Face Tracking inNews Videos
Benjamin RenoustNational Institute of Informatics
and JFLI CNRS UMI 3527Tokyo, Japan
Email: [email protected]
Thanh Duc NgoUniversity of Information Technology
Vietnam National UniversityHo Chi Minh City, VietnamEmail: [email protected]
Duy Dinh Leand Shin’Ichi Satoh
National Institute of InformaticsTokyo, Japan
Email:{ledduy, satoh}@nii.ac.jp
Abstract—In the age of data processing, news videos are richmines of information. After all, the news are essentially createdto convey information to the public. But can we go beyond whatis directly presented to us and see a wider picture? Many worksalready focus on what we can discover and understand fromthe analysis of years of news broadcasting. These analysis bringmonitoring and understanding of the activity of public figures,political strategies, explanation and even prediction of criticalmedia events. Such tools can help public figures in managingtheir public image, as well as support the work of journalists,social scientists and other media experts. News analysis can bealso seen from the lens of complex systems, gathering many typesof entities, attributes and interactions over time. As many publicfigures intervene in different news stories, a first interesting task isto observe the social interactions between these actors. Towardsthis goal, we propose to use video analysis to automatise theprocess of constructing social networks directly from news videoarchives. In this paper we are introducing a system derivingmultiple social networks from face detections in news video.We present preliminary results obtained from analysis of thesenetworks monitoring of the activity of more than a hundredpublic figures over a decade of the NHK news archives.
Keywords—news analysis; social networks; face detection andtracking; multiplex; dynamic; politics; japan
I. INTRODUCTION
In the recent years, the publication of news informationhas migrated from the traditional means of newspapers, radio,and television to the wider audience offered by the Internet.With the rise of the data-intensive science [1] the analysisand monitoring of news information has given birth to thediscipline called topic detection and tracking [2] which aimsat segmenting, identifying, and following information, mainlyfrom raw textual information. News analysis is now goingbeyond and image information is also investigated across allvarieties of media [3].
The analysis of news information is key to a wide variety oftasks, from sociology and journalism to politics and economy[4]. It could help the comprehension of users behaviors suchas what information a category of users can be exposed to[5]. It could also bring new quantitative tools to overcomethe limitations of technocratic measures in the investigationof freedom of information [6]. Even if we know that mediacompetition can lead to a lower quality of information [4], wecan hope that public broadcasting services tend to convey anofficial character, and be a reliable baseline for social analysis.
Social networks analysis directly delivered from video
content analysis is the contribution of this paper. The socialnetworks are constructed from face detection and tracking ofvideo content from the NHK News 7 broadcast, and enrichedwith segmentation and domain knowledge. After discussing therelated works in the next section, we will present our data inSection III, with characteristics and preprocessing. Section IVwill then present the networks we have extracted, with insightsin Section V. Because this paper presents preliminary results,we will discuss our observations and future works in SectionVI before concluding.
II. RELATED WORKS
Our system focuses on faces detected in news video,and new deep learning approaches are very promising: [7]even reaches better-than-human levels of precision in facerecognition. We use a simpler approach inherited from [8] butprovide face tracking in return.
Many interesting works approache news analysis in a dataintensive way, from text analysis. One of the most impressiveapproach on exploiting news data comes from [9] in whichthe authors combine news topic threads and demoscopic infor-mation to retrieve videos and generate a new summary videoto explain prime ministers’ resignations. An NLP frameworkis designed in [10] to characterize news providers, programs,and newsmakers over many channels. The work from [11] isa notable effort in creating networks from news data. Theygenerate actor-action-object networks over years of news, withgreat potential for building narrations and understanding of anews landscape.
The relevancy of network modeling for social and politicalstudies does not need to be proven anymore [12], and beyondclassical metrics [13], networks have been shown efficient fortopics and concept analysis [14] and multiplex networks havebeen explored to analyse news data [15]. Particularly characternetworks have been broadly analyzed from literature [16], fromTV dramas [17], and even a website is dedicated to the socialanalysis of Game of Thrones [18].
News data has been one main target for visual analyticsapplications. Although we do not yet address visualization inthis paper, the following examples are all inspiring model toorient our analysis. It is brought to help exploring large trans-media news as in [3] and [19] from which not only text but alsovisual information is used. Faces are also used in the case of[20], which fuses many criteria and modalities to support user’sexploration of stories in the corpus, and introduces a network

(a) duration per video (b) #topics per day (c) topic coverage (d) gap duration
Fig. 1. (a) - Most of the programs dure 30 minutes, but some of them may be longer or shorter due to some events like commemorative dates. (b) - Weaverage around 13 topics per day. (c) - Topic segmentation is statistically determined, but most of the news are well covered; only a few topics show large gapsbetween segmentation (d) so we can expect a good overlap with face tracking.
of topics, similarly to [21]. Analysis derived from large scaledata [22] also includes political figures co-occurrence analysis,represented as networks.
III. FACE DETECTION AND TRACKING
To understand well the interpretation we can make of thedata, we need to draw an accurate picture of what we arelooking at. This section details all preprocessing that is donebefore computing any social network. After describing thedata, we introduce the segmentation of news, the face detectionand tracking, a some domain knowledge.
A. Description of the data
Our video dataset consists in the daily-collected NII-TVRECS archive from [23]. The capture covers a periodbetween March 17, 2001 and February 27, 2013; of the 4,366-day long period, 4,259 news programs have been collectedcumulating about 2,102 hours (6.7TB of video) from the NHKchannel’s daily News 7 broadcast. The few missing capturesconcerning mostly the beginning of the time period are dueto system setup. Most of the programs usually dure 30mnand only a few of them fall below or beyond this format(news programs may be shorter on Sundays, or longer duringcommemorative events, see Figure 1(a)).
B. News segmentation
News are specific programs that can be segmented indifferent news topics. We thank the authors of [24] for lendingus data in which news topics are derived from textual infor-mation (captions) synchronized with the news. To summarizethe process, a topic boundary corresponds to a point betweensentences where the keyword distribution is distinct betweenpreceding and following windows of sentences.
As a result, we have a segmentation of the news by topic,based on semantics analysis (segments in red in Fig. 2-1).Although we do not have the semantic information of thesetopics (yet), this gives us time boundaries which will turnuseful for analyzing people’s apparition on screen. Overall,taking into account the differences of lengths among programs,this summarizes in a distribution of an average 13.7 topicsper day (σ = 4.3) as illustrated in Fig. 1(b). However,this segmentation implies that topics are not consecutivelysegmented, and gaps may occur between two topic detections.So topic detections cover in average 72.6% of the shows(σ = 0.10), because the beginning (head news summary) andend of the news (weather reports) are ignored by the topic
segmentation (Fig. 1(c)). In addition gaps between news topicaverage 5.1 seconds (σ = 2.4) and can stretch up to 20,7seconds (see Fig. 1(d)), in which faces may still be detected.Additionally, a standard shot segmentation derived from colorhistograms thresholds is provided to help the face-trackingprocess (segments in blue in Fig. 2-1). This is a contiguoussegmentation, without gap in-between corresponding to videocut editing.
C. Face-track extraction
Now we can extract faces from the video shots as in[25], roughly decomposed in the following steps (illustratedin Figure 2, steps 2 to 5):
Detection. We first apply a detection of faces in all images,using off-the-shelves techniques such as the Viola-Jones facedetector [8] (available from openCV [26]). This incidentallyresults in a feature space describing each detected face. Toreduce the number of false positive results (detected faces thatare not actually faces) we set the minimum size of a face at60× 60 pixels.
Tracking. We now need to group together the detectedfaces of a same individual into one single face-track. This isdone with by generating tracking points within detected faces– a tracking point is a same point identified across differentframes, we generated them using the KLT point tracker [27]).Tracking points can belong to one detected face, or to (atleast) two faces, or to the background. Based on a confidencegrouping measure, these points are differentiated and matchedfrom a starting image with the following image given theirtemporal order. The process has also been made robust againstdistortions such as flash lights and occlusions [25]. This resultsin multiple face instances regrouped in face-tracks. There canbe multiple face-tracks across a same video.
Sampling the face-tracks. For each face-track, we createa mean face that is a representative face in the image featurespace, based on the k-Faces method [25]. To do so, the face-track is divided in k sub-tracks of equal size. For each the(temporal) middle face is taken, altogether forming a set ofk-Faces. The mean face is then a mean point in the featurespace described by the k-Faces. Hence, k influences sampling,with a larger k for better representativeness (i.e. the averagedistance between a mean face representing a face-track and allfaces in the track). To ensure a best quality of the output, weuse k = 20.
Matching the face-tracks. Face-tracks can finally bematched based on their mean face euclidian distance in the
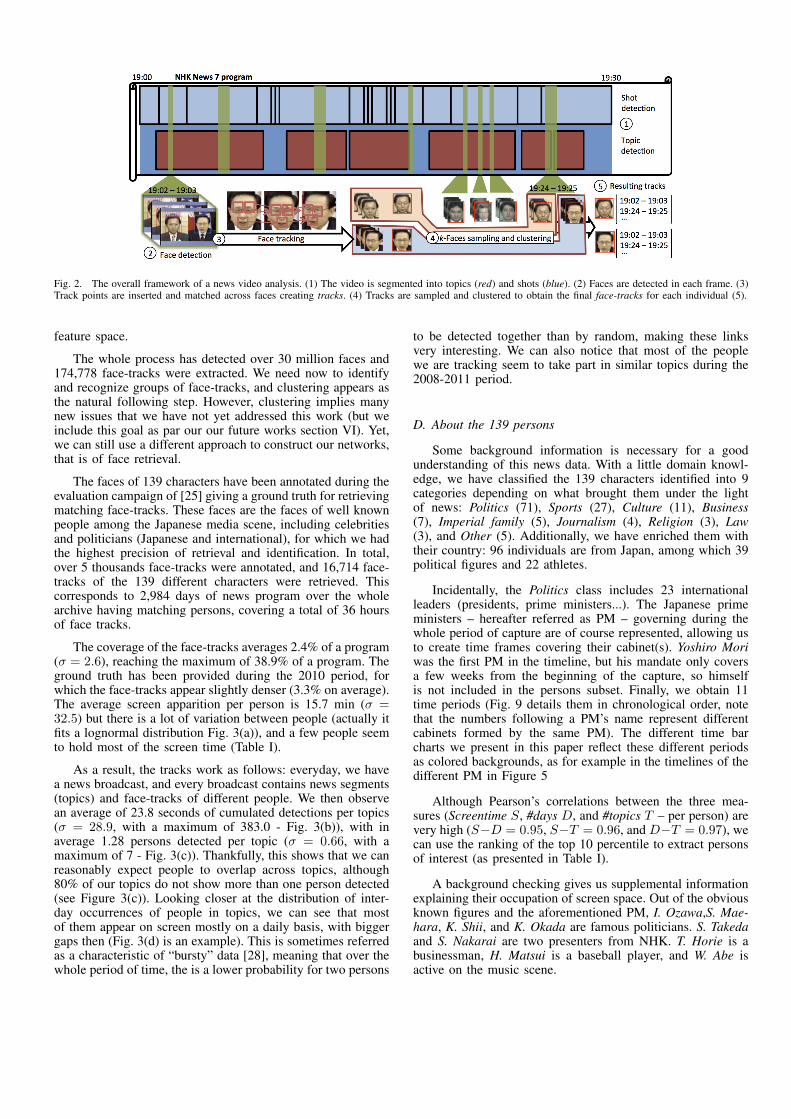
Fig. 2. The overall framework of a news video analysis. (1) The video is segmented into topics (red) and shots (blue). (2) Faces are detected in each frame. (3)Track points are inserted and matched across faces creating tracks. (4) Tracks are sampled and clustered to obtain the final face-tracks for each individual (5).
feature space.
The whole process has detected over 30 million faces and174,778 face-tracks were extracted. We need now to identifyand recognize groups of face-tracks, and clustering appears asthe natural following step. However, clustering implies manynew issues that we have not yet addressed this work (but weinclude this goal as par our our future works section VI). Yet,we can still use a different approach to construct our networks,that is of face retrieval.
The faces of 139 characters have been annotated during theevaluation campaign of [25] giving a ground truth for retrievingmatching face-tracks. These faces are the faces of well knownpeople among the Japanese media scene, including celebritiesand politicians (Japanese and international), for which we hadthe highest precision of retrieval and identification. In total,over 5 thousands face-tracks were annotated, and 16,714 face-tracks of the 139 different characters were retrieved. Thiscorresponds to 2,984 days of news program over the wholearchive having matching persons, covering a total of 36 hoursof face tracks.
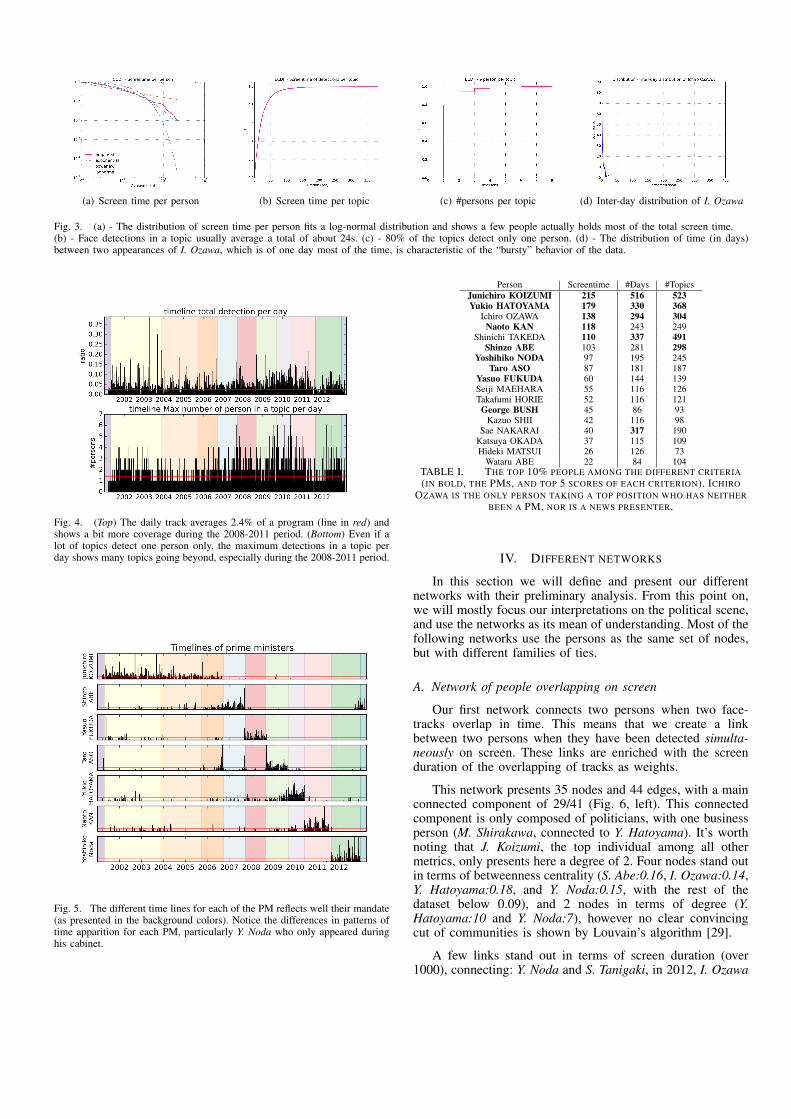
The coverage of the face-tracks averages 2.4% of a program(σ = 2.6), reaching the maximum of 38.9% of a program. Theground truth has been provided during the 2010 period, forwhich the face-tracks appear slightly denser (3.3% on average).The average screen apparition per person is 15.7 min (σ =32.5) but there is a lot of variation between people (actually itfits a lognormal distribution Fig. 3(a)), and a few people seemto hold most of the screen time (Table I).
As a result, the tracks work as follows: everyday, we havea news broadcast, and every broadcast contains news segments(topics) and face-tracks of different people. We then observean average of 23.8 seconds of cumulated detections per topics(σ = 28.9, with a maximum of 383.0 - Fig. 3(b)), with inaverage 1.28 persons detected per topic (σ = 0.66, with amaximum of 7 - Fig. 3(c)). Thankfully, this shows that we canreasonably expect people to overlap across topics, although80% of our topics do not show more than one person detected(see Figure 3(c)). Looking closer at the distribution of inter-day occurrences of people in topics, we can see that mostof them appear on screen mostly on a daily basis, with biggergaps then (Fig. 3(d) is an example). This is sometimes referredas a characteristic of “bursty” data [28], meaning that over thewhole period of time, the is a lower probability for two persons
to be detected together than by random, making these linksvery interesting. We can also notice that most of the peoplewe are tracking seem to take part in similar topics during the2008-2011 period.
D. About the 139 persons
Some background information is necessary for a goodunderstanding of this news data. With a little domain knowl-edge, we have classified the 139 characters identified into 9categories depending on what brought them under the lightof news: Politics (71), Sports (27), Culture (11), Business(7), Imperial family (5), Journalism (4), Religion (3), Law(3), and Other (5). Additionally, we have enriched them withtheir country: 96 individuals are from Japan, among which 39political figures and 22 athletes.
Incidentally, the Politics class includes 23 internationalleaders (presidents, prime ministers...). The Japanese primeministers – hereafter referred as PM – governing during thewhole period of capture are of course represented, allowing usto create time frames covering their cabinet(s). Yoshiro Moriwas the first PM in the timeline, but his mandate only coversa few weeks from the beginning of the capture, so himselfis not included in the persons subset. Finally, we obtain 11time periods (Fig. 9 details them in chronological order, notethat the numbers following a PM’s name represent differentcabinets formed by the same PM). The different time barcharts we present in this paper reflect these different periodsas colored backgrounds, as for example in the timelines of thedifferent PM in Figure 5
Although Pearson’s correlations between the three mea-sures (Screentime S, #days D, and #topics T – per person) arevery high (S−D = 0.95, S−T = 0.96, and D−T = 0.97), wecan use the ranking of the top 10 percentile to extract personsof interest (as presented in Table I).
A background checking gives us supplemental informationexplaining their occupation of screen space. Out of the obviousknown figures and the aforementioned PM, I. Ozawa,S. Mae-hara, K. Shii, and K. Okada are famous politicians. S. Takedaand S. Nakarai are two presenters from NHK. T. Horie is abusinessman, H. Matsui is a baseball player, and W. Abe isactive on the music scene.
(a) Screen time per person (b) Screen time per topic (c) #persons per topic (d) Inter-day distribution of I. Ozawa
Fig. 3. (a) - The distribution of screen time per person fits a log-normal distribution and shows a few people actually holds most of the total screen time.(b) - Face detections in a topic usually average a total of about 24s. (c) - 80% of the topics detect only one person. (d) - The distribution of time (in days)between two appearances of I. Ozawa, which is of one day most of the time, is characteristic of the “bursty” behavior of the data.
Fig. 4. (Top) The daily track averages 2.4% of a program (line in red) andshows a bit more coverage during the 2008-2011 period. (Bottom) Even if alot of topics detect one person only, the maximum detections in a topic perday shows many topics going beyond, especially during the 2008-2011 period.
Fig. 5. The different time lines for each of the PM reflects well their mandate(as presented in the background colors). Notice the differences in patterns oftime apparition for each PM, particularly Y. Noda who only appeared duringhis cabinet.
Person Screentime #Days #TopicsJunichiro KOIZUMI 215 516 523Yukio HATOYAMA 179 330 368
Ichiro OZAWA 138 294 304Naoto KAN 118 243 249
Shinichi TAKEDA 110 337 491Shinzo ABE 103 281 298
Yoshihiko NODA 97 195 245Taro ASO 87 181 187
Yasuo FUKUDA 60 144 139Seiji MAEHARA 55 116 126Takafumi HORIE 52 116 121
George BUSH 45 86 93Kazuo SHII 42 116 98
Sae NAKARAI 40 317 190Katsuya OKADA 37 115 109Hideki MATSUI 26 126 73
Wataru ABE 22 84 104TABLE I. THE TOP 10% PEOPLE AMONG THE DIFFERENT CRITERIA(IN BOLD, THE PMS, AND TOP 5 SCORES OF EACH CRITERION). ICHIRO
OZAWA IS THE ONLY PERSON TAKING A TOP POSITION WHO HAS NEITHERBEEN A PM, NOR IS A NEWS PRESENTER.
IV. DIFFERENT NETWORKS
In this section we will define and present our differentnetworks with their preliminary analysis. From this point on,we will mostly focus our interpretations on the political scene,and use the networks as its mean of understanding. Most of thefollowing networks use the persons as the same set of nodes,but with different families of ties.
A. Network of people overlapping on screen
Our first network connects two persons when two face-tracks overlap in time. This means that we create a linkbetween two persons when they have been detected simulta-neously on screen. These links are enriched with the screenduration of the overlapping of tracks as weights.
This network presents 35 nodes and 44 edges, with a mainconnected component of 29/41 (Fig. 6, left). This connectedcomponent is only composed of politicians, with one businessperson (M. Shirakawa, connected to Y. Hatoyama). It’s worthnoting that J. Koizumi, the top individual among all othermetrics, only presents here a degree of 2. Four nodes stand outin terms of betweenness centrality (S. Abe:0.16, I. Ozawa:0.14,Y. Hatoyama:0.18, and Y. Noda:0.15, with the rest of thedataset below 0.09), and 2 nodes in terms of degree (Y.Hatoyama:10 and Y. Noda:7), however no clear convincingcut of communities is shown by Louvain’s algorithm [29].
A few links stand out in terms of screen duration (over1000), connecting: Y. Noda and S. Tanigaki, in 2012, I. Ozawa
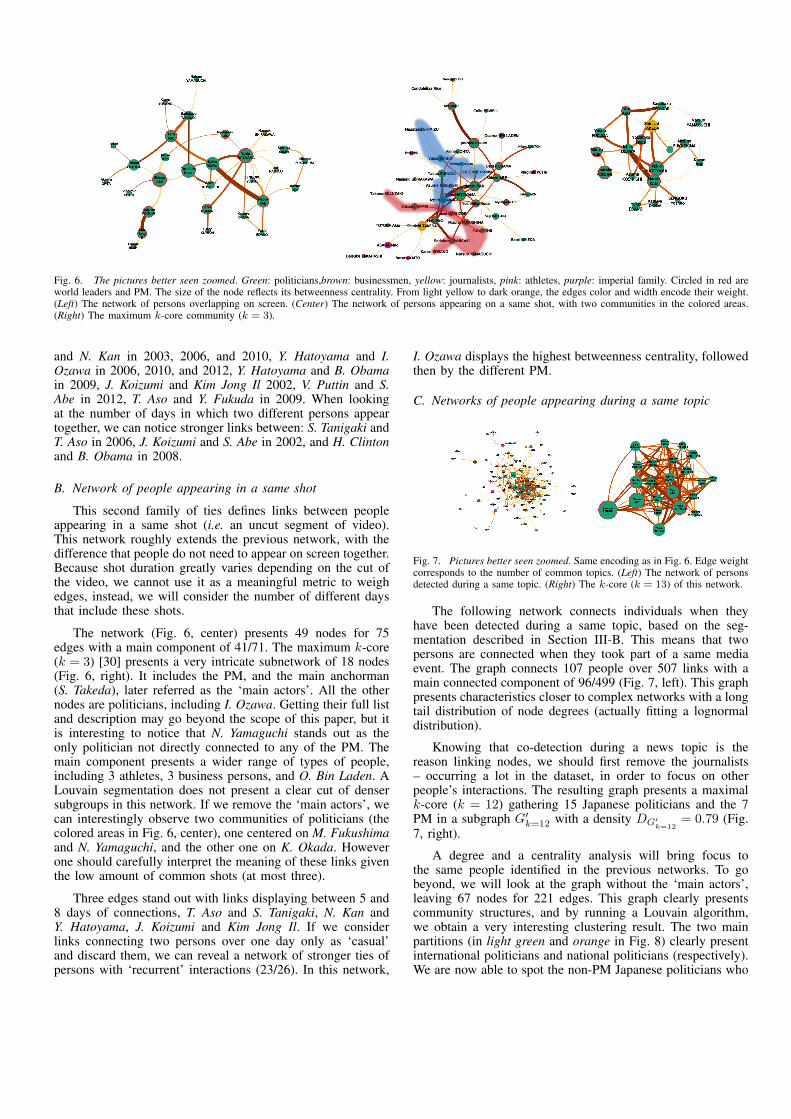
Fig. 6. The pictures better seen zoomed. Green: politicians,brown: businessmen, yellow: journalists, pink: athletes, purple: imperial family. Circled in red areworld leaders and PM. The size of the node reflects its betweenness centrality. From light yellow to dark orange, the edges color and width encode their weight.(Left) The network of persons overlapping on screen. (Center) The network of persons appearing on a same shot, with two communities in the colored areas.(Right) The maximum k-core community (k = 3).
and N. Kan in 2003, 2006, and 2010, Y. Hatoyama and I.Ozawa in 2006, 2010, and 2012, Y. Hatoyama and B. Obamain 2009, J. Koizumi and Kim Jong Il 2002, V. Puttin and S.Abe in 2012, T. Aso and Y. Fukuda in 2009. When lookingat the number of days in which two different persons appeartogether, we can notice stronger links between: S. Tanigaki andT. Aso in 2006, J. Koizumi and S. Abe in 2002, and H. Clintonand B. Obama in 2008.
B. Network of people appearing in a same shot
This second family of ties defines links between peopleappearing in a same shot (i.e. an uncut segment of video).This network roughly extends the previous network, with thedifference that people do not need to appear on screen together.Because shot duration greatly varies depending on the cut ofthe video, we cannot use it as a meaningful metric to weighedges, instead, we will consider the number of different daysthat include these shots.
The network (Fig. 6, center) presents 49 nodes for 75edges with a main component of 41/71. The maximum k-core(k = 3) [30] presents a very intricate subnetwork of 18 nodes(Fig. 6, right). It includes the PM, and the main anchorman(S. Takeda), later referred as the ‘main actors’. All the othernodes are politicians, including I. Ozawa. Getting their full listand description may go beyond the scope of this paper, but itis interesting to notice that N. Yamaguchi stands out as theonly politician not directly connected to any of the PM. Themain component presents a wider range of types of people,including 3 athletes, 3 business persons, and O. Bin Laden. ALouvain segmentation does not present a clear cut of densersubgroups in this network. If we remove the ‘main actors’, wecan interestingly observe two communities of politicians (thecolored areas in Fig. 6, center), one centered on M. Fukushimaand N. Yamaguchi, and the other one on K. Okada. Howeverone should carefully interpret the meaning of these links giventhe low amount of common shots (at most three).
Three edges stand out with links displaying between 5 and8 days of connections, T. Aso and S. Tanigaki, N. Kan andY. Hatoyama, J. Koizumi and Kim Jong Il. If we considerlinks connecting two persons over one day only as ‘casual’and discard them, we can reveal a network of stronger ties ofpersons with ‘recurrent’ interactions (23/26). In this network,
I. Ozawa displays the highest betweenness centrality, followedthen by the different PM.
C. Networks of people appearing during a same topic
Fig. 7. Pictures better seen zoomed. Same encoding as in Fig. 6. Edge weightcorresponds to the number of common topics. (Left) The network of personsdetected during a same topic. (Right) The k-core (k = 13) of this network.
The following network connects individuals when theyhave been detected during a same topic, based on the seg-mentation described in Section III-B. This means that twopersons are connected when they took part of a same mediaevent. The graph connects 107 people over 507 links with amain connected component of 96/499 (Fig. 7, left). This graphpresents characteristics closer to complex networks with a longtail distribution of node degrees (actually fitting a lognormaldistribution).
Knowing that co-detection during a news topic is thereason linking nodes, we should first remove the journalists– occurring a lot in the dataset, in order to focus on otherpeople’s interactions. The resulting graph presents a maximalk-core (k = 12) gathering 15 Japanese politicians and the 7PM in a subgraph G′
k=12 with a density DG′k=12
= 0.79 (Fig.7, right).
A degree and a centrality analysis will bring focus tothe same people identified in the previous networks. To gobeyond, we will look at the graph without the ‘main actors’,leaving 67 nodes for 221 edges. This graph clearly presentscommunity structures, and by running a Louvain algorithm,we obtain a very interesting clustering result. The two mainpartitions (in light green and orange in Fig. 8) clearly presentinternational politicians and national politicians (respectively).We are now able to spot the non-PM Japanese politicians who
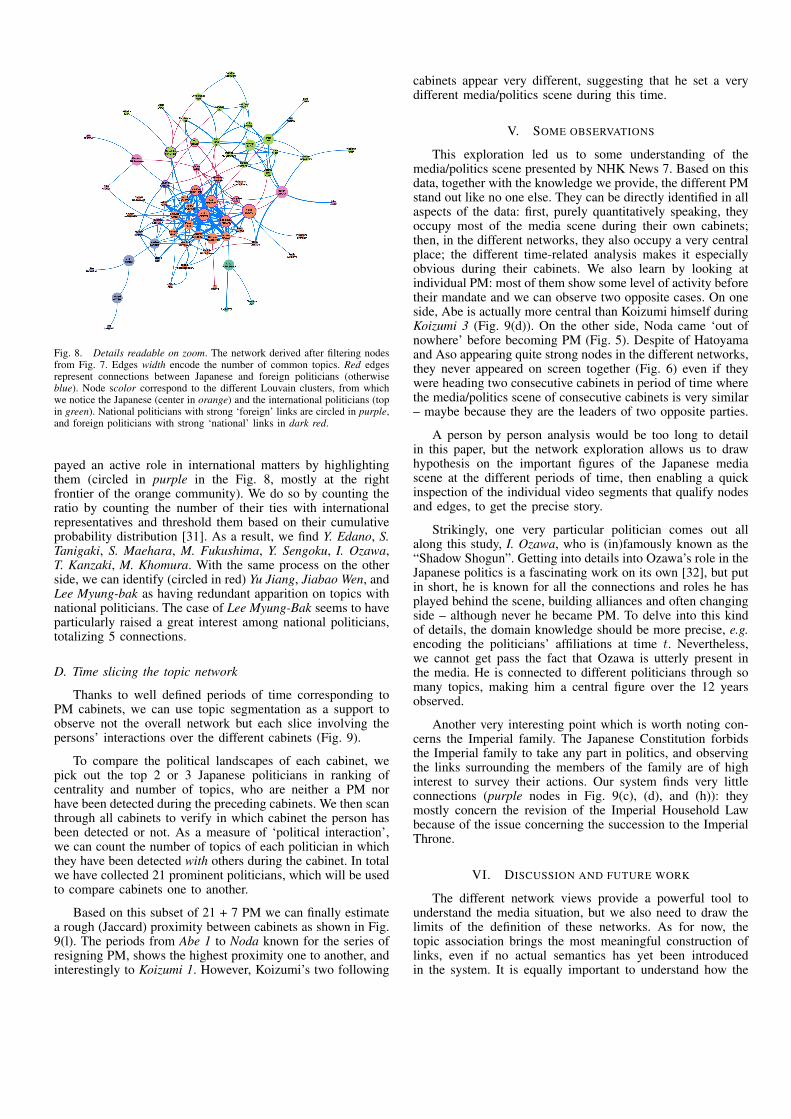
Fig. 8. Details readable on zoom. The network derived after filtering nodesfrom Fig. 7. Edges width encode the number of common topics. Red edgesrepresent connections between Japanese and foreign politicians (otherwiseblue). Node scolor correspond to the different Louvain clusters, from whichwe notice the Japanese (center in orange) and the international politicians (topin green). National politicians with strong ‘foreign’ links are circled in purple,and foreign politicians with strong ‘national’ links in dark red.
payed an active role in international matters by highlightingthem (circled in purple in the Fig. 8, mostly at the rightfrontier of the orange community). We do so by counting theratio by counting the number of their ties with internationalrepresentatives and threshold them based on their cumulativeprobability distribution [31]. As a result, we find Y. Edano, S.Tanigaki, S. Maehara, M. Fukushima, Y. Sengoku, I. Ozawa,T. Kanzaki, M. Khomura. With the same process on the otherside, we can identify (circled in red) Yu Jiang, Jiabao Wen, andLee Myung-bak as having redundant apparition on topics withnational politicians. The case of Lee Myung-Bak seems to haveparticularly raised a great interest among national politicians,totalizing 5 connections.
D. Time slicing the topic network
Thanks to well defined periods of time corresponding toPM cabinets, we can use topic segmentation as a support toobserve not the overall network but each slice involving thepersons’ interactions over the different cabinets (Fig. 9).
To compare the political landscapes of each cabinet, wepick out the top 2 or 3 Japanese politicians in ranking ofcentrality and number of topics, who are neither a PM norhave been detected during the preceding cabinets. We then scanthrough all cabinets to verify in which cabinet the person hasbeen detected or not. As a measure of ‘political interaction’,we can count the number of topics of each politician in whichthey have been detected with others during the cabinet. In totalwe have collected 21 prominent politicians, which will be usedto compare cabinets one to another.
Based on this subset of 21 + 7 PM we can finally estimatea rough (Jaccard) proximity between cabinets as shown in Fig.9(l). The periods from Abe 1 to Noda known for the series ofresigning PM, shows the highest proximity one to another, andinterestingly to Koizumi 1. However, Koizumi’s two following
cabinets appear very different, suggesting that he set a verydifferent media/politics scene during this time.
V. SOME OBSERVATIONS
This exploration led us to some understanding of themedia/politics scene presented by NHK News 7. Based on thisdata, together with the knowledge we provide, the different PMstand out like no one else. They can be directly identified in allaspects of the data: first, purely quantitatively speaking, theyoccupy most of the media scene during their own cabinets;then, in the different networks, they also occupy a very centralplace; the different time-related analysis makes it especiallyobvious during their cabinets. We also learn by looking atindividual PM: most of them show some level of activity beforetheir mandate and we can observe two opposite cases. On oneside, Abe is actually more central than Koizumi himself duringKoizumi 3 (Fig. 9(d)). On the other side, Noda came ‘out ofnowhere’ before becoming PM (Fig. 5). Despite of Hatoyamaand Aso appearing quite strong nodes in the different networks,they never appeared on screen together (Fig. 6) even if theywere heading two consecutive cabinets in period of time wherethe media/politics scene of consecutive cabinets is very similar– maybe because they are the leaders of two opposite parties.
A person by person analysis would be too long to detailin this paper, but the network exploration allows us to drawhypothesis on the important figures of the Japanese mediascene at the different periods of time, then enabling a quickinspection of the individual video segments that qualify nodesand edges, to get the precise story.
Strikingly, one very particular politician comes out allalong this study, I. Ozawa, who is (in)famously known as the“Shadow Shogun”. Getting into details into Ozawa’s role in theJapanese politics is a fascinating work on its own [32], but putin short, he is known for all the connections and roles he hasplayed behind the scene, building alliances and often changingside – although never he became PM. To delve into this kindof details, the domain knowledge should be more precise, e.g.encoding the politicians’ affiliations at time t. Nevertheless,we cannot get pass the fact that Ozawa is utterly present inthe media. He is connected to different politicians through somany topics, making him a central figure over the 12 yearsobserved.
Another very interesting point which is worth noting con-cerns the Imperial family. The Japanese Constitution forbidsthe Imperial family to take any part in politics, and observingthe links surrounding the members of the family are of highinterest to survey their actions. Our system finds very littleconnections (purple nodes in Fig. 9(c), (d), and (h)): theymostly concern the revision of the Imperial Household Lawbecause of the issue concerning the succession to the ImperialThrone.
VI. DISCUSSION AND FUTURE WORK
The different network views provide a powerful tool tounderstand the media situation, but we also need to draw thelimits of the definition of these networks. As for now, thetopic association brings the most meaningful construction oflinks, even if no actual semantics has yet been introducedin the system. It is equally important to understand how the
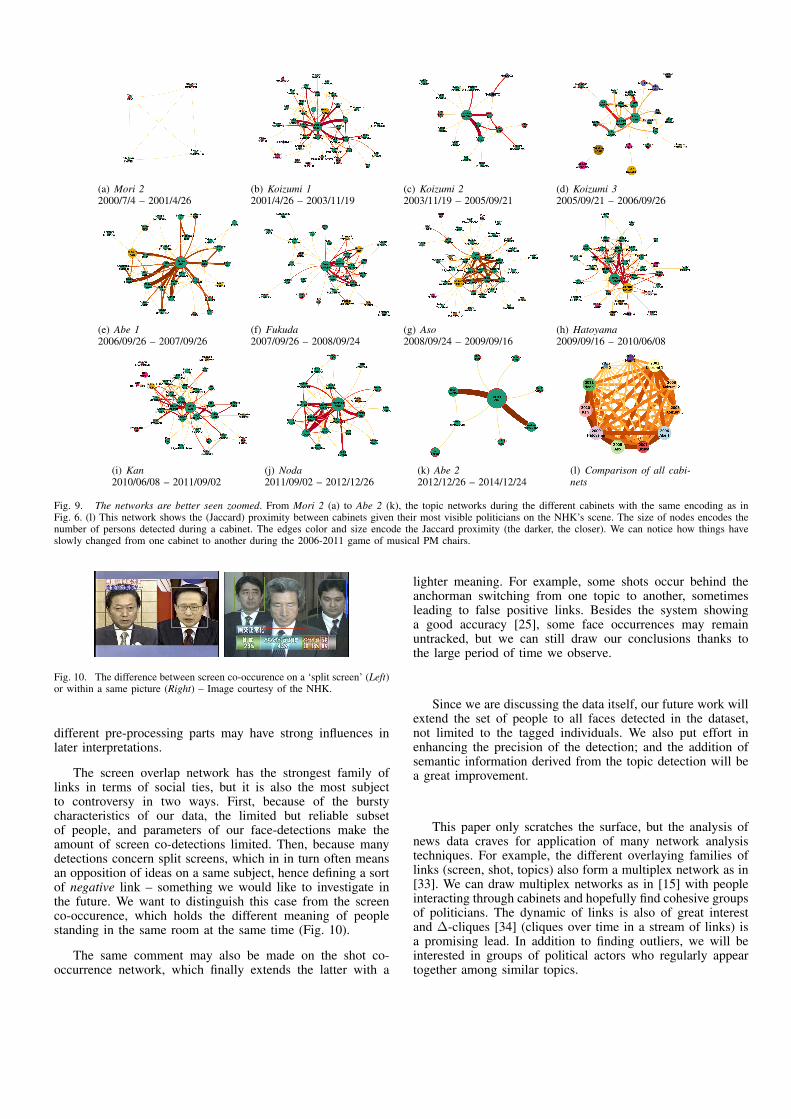
(a) Mori 22000/7/4 – 2001/4/26
(b) Koizumi 12001/4/26 – 2003/11/19
(c) Koizumi 22003/11/19 – 2005/09/21
(d) Koizumi 32005/09/21 – 2006/09/26
(e) Abe 12006/09/26 – 2007/09/26
(f) Fukuda2007/09/26 – 2008/09/24
(g) Aso2008/09/24 – 2009/09/16
(h) Hatoyama2009/09/16 – 2010/06/08
(i) Kan2010/06/08 – 2011/09/02
(j) Noda2011/09/02 – 2012/12/26
(k) Abe 22012/12/26 – 2014/12/24
(l) Comparison of all cabi-nets
Fig. 9. The networks are better seen zoomed. From Mori 2 (a) to Abe 2 (k), the topic networks during the different cabinets with the same encoding as inFig. 6. (l) This network shows the (Jaccard) proximity between cabinets given their most visible politicians on the NHK’s scene. The size of nodes encodes thenumber of persons detected during a cabinet. The edges color and size encode the Jaccard proximity (the darker, the closer). We can notice how things haveslowly changed from one cabinet to another during the 2006-2011 game of musical PM chairs.
Fig. 10. The difference between screen co-occurence on a ‘split screen’ (Left)or within a same picture (Right) – Image courtesy of the NHK.
different pre-processing parts may have strong influences inlater interpretations.
The screen overlap network has the strongest family oflinks in terms of social ties, but it is also the most subjectto controversy in two ways. First, because of the burstycharacteristics of our data, the limited but reliable subsetof people, and parameters of our face-detections make theamount of screen co-detections limited. Then, because manydetections concern split screens, which in in turn often meansan opposition of ideas on a same subject, hence defining a sortof negative link – something we would like to investigate inthe future. We want to distinguish this case from the screenco-occurence, which holds the different meaning of peoplestanding in the same room at the same time (Fig. 10).
The same comment may also be made on the shot co-occurrence network, which finally extends the latter with a
lighter meaning. For example, some shots occur behind theanchorman switching from one topic to another, sometimesleading to false positive links. Besides the system showinga good accuracy [25], some face occurrences may remainuntracked, but we can still draw our conclusions thanks tothe large period of time we observe.
Since we are discussing the data itself, our future work willextend the set of people to all faces detected in the dataset,not limited to the tagged individuals. We also put effort inenhancing the precision of the detection; and the addition ofsemantic information derived from the topic detection will bea great improvement.
This paper only scratches the surface, but the analysis ofnews data craves for application of many network analysistechniques. For example, the different overlaying families oflinks (screen, shot, topics) also form a multiplex network as in[33]. We can draw multiplex networks as in [15] with peopleinteracting through cabinets and hopefully find cohesive groupsof politicians. The dynamic of links is also of great interestand ∆-cliques [34] (cliques over time in a stream of links) isa promising lead. In addition to finding outliers, we will beinterested in groups of political actors who regularly appeartogether among similar topics.
VII. CONCLUSION
This work has introduced the production and analysisof face detection and tracking data over twelve years ofnews broadcast. We have detailed the data’s characteristicsand brought a few outliers. Together with the use of topicsegmentation and some limited domain knowledge, we havederived many networks, each presenting a different point ofview on the data. The combined views of these networksshows interesting insights on the story behind the data, anarguably clear picture of the media/politics landscape duringthe different cabinets, also isolating key players at differentlevels.
Rather different to the classical topic detection and trackingapproaches of news data, this work brings up if not confirmsthe relevance of network analysis derived from news data.By itself, this is also an interesting framework for manypotential contributions to the current challenges of socialnetwork analysis – including, but not limited to, multiplex andmulti-attributed network analysis, dynamic networks, and theircombination.
Finally, this work has given us useful directions that willhelp us design visualization tools, which we wish to put asquickly as possible in the hands of domain experts, sociologistsand journalists, for an in-depth analysis of over 12 years ofnews.
REFERENCES
[1] A. J. Hey, S. Tansley, K. M. Tolle et al., The fourth paradigm: data-intensive scientific discovery. Microsoft Research Redmond, WA, 2009.
[2] J. Allan, Topic detection and tracking: event-based information orga-nization. Springer Science & Business Media, 2002, vol. 12.
[3] N. Herve, M.-L. Viaud, J. Thievre, A. Saulnier, J. Champ, P. Letessier,O. Buisson, and A. Joly, “Otmedia: the french transmedia news obser-vatory,” in Proceedings of the 21st ACM international conference onMultimedia. ACM, 2013, pp. 441–442.
[4] J. Cage, “Media competition, information provision and political par-ticipation,” Unpublished manuscript, Harvard University, 2014.
[5] P. Resnick, R. K. Garrett, T. Kriplean, S. A. Munson, and N. J.Stroud, “Bursting your (filter) bubble: Strategies for promoting diverseexposure,” in Proceedings of the ACM 2013 Conference on ComputerSupported Cooperative Work Companion, 2013, pp. 95–100.
[6] R. Hazell and B. Worthy, “Assessing the performance of freedom ofinformation,” Government Information Quarterly, vol. 27, no. 4, pp.352–359, 2010.
[7] F. Schroff, D. Kalenichenko, and J. Philbin, “Facenet: A uni-fied embedding for face recognition and clustering,” arXiv preprintarXiv:1503.03832, 2015.
[8] P. Viola and M. J. Jones, “Robust real-time face detection,” Internationaljournal of computer vision, vol. 57, no. 2, pp. 137–154, 2004.
[9] I. Ide and F. Nack, “Explain this to me!” ITE Transactions on MediaTechnology and Applications, vol. 1, no. 2, pp. 101–117, 2013.
[10] C. Castillo, G. De Francisci Morales, M. Mendoza, and N. Khan, “Sayswho?: automatic text-based content analysis of television news,” inProceedings of the 2013 international workshop on Mining unstructuredbig data using natural language processing. ACM, 2013, pp. 53–60.
[11] S. Sudhahar, R. Franzosi, and N. Cristianini, “Automating quantitativenarrative analysis of news data.” in WAPA, 2011, pp. 63–71.
[12] D. Lazer, “Networks in political science: Back to the future,” PS:Political Science & Politics, vol. 44, no. 01, pp. 61–68, 2011.
[13] L. A. Adamic and N. Glance, “The political blogosphere and the 2004us election: divided they blog,” in Proceedings of the 3rd internationalworkshop on Link discovery. ACM, 2005, pp. 36–43.
[14] M. K. Martin, J. Pfeffer, and K. M. Carley, “Network text analysisof conceptual overlap in interviews, newspaper articles and keywords,”Social Network Analysis and Mining, vol. 3, no. 4, pp. 1165–1177,2013.
[15] B. Renoust, G. Melancon, and M.-L. Viaud, “Entanglement in multiplexnetworks: understanding group cohesion in homophily networks,” in So-cial Network Analysis-Community Detection and Evolution. Springer,2014, pp. 89–117.
[16] M. C. Waumans, T. Nicodeme, and H. Bersini, “Topology analysis ofsocial networks extracted from literature,” PloS one, vol. 10, no. 6, p.e0126470, 2015.
[17] C.-J. Nan, K.-M. Kim, and B.-T. Zhang, “Social network analysis oftv drama characters via deep concept hierarchies,” in Proceedings ofASONAM 2015, 2015.
[18] B. Mish, “Game of Nodes: A Social Network Anal-ysis of Game of Thrones,” 2015. [Online]. Available:https://gameofnodes.wordpress.com/
[19] M. Itoh, M. Toyoda, C. Z. Zhu, S. Satoh, and M. Kitsuregawa, “Imageflows visualization for inter-media comparison,” in Pacific VisualizationSymposium (PacificVis), 2014 IEEE. IEEE, 2014, pp. 129–136.
[20] H. Luo, J. Fan, J. Yang, W. Ribarsky, and S. Satoh, “Analyzing large-scale news video databases to support knowledge visualization andintuitive retrieval,” in Visual Analytics Science and Technology, 2007.VAST 2007. IEEE Symposium on. IEEE, 2007, pp. 107–114.
[21] M.-L. Viaud, J. Thievre, H. Goeau, A. Saulnier, and O. Buisson,“Interactive components for visual exploration of multimedia archives,”in Proceedings of the 2008 international conference on Content-basedimage and video retrieval. ACM, 2008, pp. 609–616.
[22] C. Seifert, V. Sabol, W. Kienreich, E. Lex, and M. Granitzer, “Visualanalysis and knowledge discovery for text,” in Large-Scale Data Ana-lytics. Springer, 2014, pp. 189–218.
[23] N. Katayama, H. Mo, I. Ide, and S. Satoh, “Mining large-scale broadcastvideo archives towards inter-video structuring,” in Advances in Multime-dia Information Processing-PCM 2004. Springer, 2005, pp. 489–496.
[24] I. Ide, H. Mo, N. Katayama, and S. Satoh, “Topic threading forstructuring a large-scale news video archive,” in Image and VideoRetrieval. Springer, 2004, pp. 123–131.
[25] T. D. Ngo, H. T. Vu, L. Duy-Dinh, and S. Satoh, “Face retrieval in large-scale news video datasets,” IEICE TRANSACTIONS on Information andSystems, vol. 96, no. 8, pp. 1811–1825, 2013.
[26] G. Bradski et al., “The opencv library,” Doctor Dobbs Journal, vol. 25,no. 11, pp. 120–126, 2000.
[27] J. Shi and C. Tomasi, “Good features to track,” in Computer Visionand Pattern Recognition, 1994. Proceedings CVPR’94., 1994 IEEEComputer Society Conference on. IEEE, 1994, pp. 593–600.
[28] X. Wang, C. Zhai, X. Hu, and R. Sproat, “Mining correlated burstytopic patterns from coordinated text streams,” in Proceedings of the13th ACM SIGKDD international conference on Knowledge discoveryand data mining. ACM, 2007, pp. 784–793.
[29] V. D. Blondel, J.-L. Guillaume, R. Lambiotte, and E. Lefebvre, “Fastunfolding of communities in large networks,” Journal of StatisticalMechanics: Theory and Experiment, vol. 2008, no. 10, p. P10008, 2008.
[30] S. B. Seidman, “Network structure and minimum degree,” Socialnetworks, vol. 5, no. 3, pp. 269–287, 1983.
[31] I. Herman, M. S. Marshall, and G. Melancon, “Density functions forvisual attributes and effective partitioning in graph visualization,” inInformation Visualization, 2000. InfoVis 2000. IEEE Symposium on.IEEE, 2000, pp. 49–56.
[32] I. Meyer, “The History of Japan podcast, Episode82: The Shadow Shogun, Redux,” 2014. [Online]. Avail-able: https://historyofjapan.wordpress.com/2014/12/20/episode-82-the-shadow-shogun-redux/
[33] M. Kivela, A. Arenas, M. Barthelemy, J. P. Gleeson, Y. Moreno, andM. A. Porter, “Multilayer networks,” Journal of Complex Networks,vol. 2, no. 3, pp. 203–271, 2014.
[34] J. Viard, M. Latapy, and C. Magnien, “Computing maximal cliques inlink streams,” arXiv preprint arXiv:1502.00993, 2015.
Related Documents


