PRAMANA c Indian Academy of Sciences Vol. 72, No. 6 — journal of June 2009 physics pp. 999–1009 A-site substitution-controlled dielectric dispersion in lead-free sodium bismuth titanate M RAGHAVENDER, G S KUMAR and G PRASAD * Materials Research Laboratory, Department of Physics, Osmania University, Hyderabad 500 007, India * Corresponding author. E-mail: guduru [email protected] MS received 4 November 2008; revised 3 March 2009; accepted 26 March 2009 Abstract. Effect of doping in Na 0.5 Bi 0.5 TiO 3 (NBT) with Ce 3+ and Sm 3+ at the A-site on dielectric behaviour, impedance and conductivity is being reported. Na0.5Bi0.5-xAxTiO3 samples (A being Ce and Sm) are studied with varying val- ues of x. For Na0.5Bi0.5-xCexTiO3 samples x is 0.001, 0.005 and 0.007 and for Na0.5Bi0.5-xSmxTiO3 samples x is 0.05, 0.1 and 0.15. Dielectric constant and loss are studied in the frequency range 10 kHz to 1 MHz and in the temperature range 30–650 ◦ C. Impedance and electric modulus studies are undertaken. The relaxations observed in the samples are non-Debye and activation energies for relaxation and conduction are evaluated. Keywords. Na 0.5 Bi 0.5 TiO 3 ; lead-free ferroelectrics; dielectric dispersion; impedance; relaxation times. PACS Nos 77.80.e; 77.22; 77.22.gm; 77.80 1. Introduction Sodium bismuth titanate (Na 0.5 Bi 0.5 TiO 3 , abbreviated as NBT), is considered to be one of the excellent candidates among lead-free piezoelectric materials. The crystal structures, phase transitions and physical properties of NBT have been widely investigated since its early discovery by Smolensky et al in 1960 [1]. For instance, several of its crystal structures, including cubic, tetragonal and rhombo- hedral, have been studied by a number of researchers over different temperature ranges [2,3]. It has large remanant polarization (P r = 38 μC/cm 2 ), high Curie temperature (T C = 320 ◦ C), and shows diffuse phase transition (DPT). In addition to the DPT near 320 ◦ C, two more phase transitions were reported at 230 ◦ C and between 500–600 ◦ C. The peculiar phase transition behaviour of NBT has attracted considerable attention and a number of papers have been published that exam- ine the different dielectric anomalies and electrical state of each phase [4,5]. How- ever, there are several different explanations for the peculiarities of phase transition behaviour and electrical states observed in ferroelectric NBT. Phenomenology to 999

Welcome message from author
This document is posted to help you gain knowledge. Please leave a comment to let me know what you think about it! Share it to your friends and learn new things together.
Transcript

PRAMANA c© Indian Academy of Sciences Vol. 72, No. 6— journal of June 2009
physics pp. 999–1009
A-site substitution-controlled dielectric dispersionin lead-free sodium bismuth titanate
M RAGHAVENDER, G S KUMAR and G PRASAD∗Materials Research Laboratory, Department of Physics, Osmania University,Hyderabad 500 007, India∗Corresponding author. E-mail: guduru [email protected]
MS received 4 November 2008; revised 3 March 2009; accepted 26 March 2009
Abstract. Effect of doping in Na0.5Bi0.5TiO3 (NBT) with Ce3+ and Sm3+ atthe A-site on dielectric behaviour, impedance and conductivity is being reported.Na0.5Bi0.5−xAxTiO3 samples (A being Ce and Sm) are studied with varying val-ues of x. For Na0.5Bi0.5−xCexTiO3 samples x is 0.001, 0.005 and 0.007 and forNa0.5Bi0.5−xSmxTiO3 samples x is 0.05, 0.1 and 0.15. Dielectric constant and loss arestudied in the frequency range 10 kHz to 1 MHz and in the temperature range 30–650C.Impedance and electric modulus studies are undertaken. The relaxations observed inthe samples are non-Debye and activation energies for relaxation and conduction areevaluated.
Keywords. Na0.5Bi0.5TiO3; lead-free ferroelectrics; dielectric dispersion; impedance;relaxation times.
PACS Nos 77.80.e; 77.22; 77.22.gm; 77.80
1. Introduction
Sodium bismuth titanate (Na0.5Bi0.5TiO3, abbreviated as NBT), is considered tobe one of the excellent candidates among lead-free piezoelectric materials. Thecrystal structures, phase transitions and physical properties of NBT have beenwidely investigated since its early discovery by Smolensky et al in 1960 [1]. Forinstance, several of its crystal structures, including cubic, tetragonal and rhombo-hedral, have been studied by a number of researchers over different temperatureranges [2,3]. It has large remanant polarization (Pr = 38 µC/cm2), high Curietemperature (TC = 320C), and shows diffuse phase transition (DPT). In additionto the DPT near 320C, two more phase transitions were reported at 230C andbetween 500–600C. The peculiar phase transition behaviour of NBT has attractedconsiderable attention and a number of papers have been published that exam-ine the different dielectric anomalies and electrical state of each phase [4,5]. How-ever, there are several different explanations for the peculiarities of phase transitionbehaviour and electrical states observed in ferroelectric NBT. Phenomenology to
999

M Raghavender, G S Kumar and G Prasad
explain the behaviour of NBT is still far from clear. The behaviour of the microp-olar regions was investigated in order to provide a solution. Tu et al consideredNBT to be a relaxor ferroelectric and supported this assertion using the superpara-electric micropolar clusters [6]. They assumed that the local ordering played animportant role in the peculiar behaviour of NBT. Park and Hong have argued thatthe changes in the dynamics and the size of polar regions are the reasons for thepeculiar results [7].
Suitable doping, which results in the formation of vacancies, is one of the bestways to control polarization in a material. Rare earth doping is known to form arandom electric field resulting in relaxor behaviour in Pb(Zr,Ti)O3 [8–10]. In thistype of dopant-controlled phase transition, the relaxor ferroelectricity and electro-mechanical properties would be strongly correlated to the vacancies and their im-pact on polarization of the material. In the present work, the effect of dopingheterovalent ions, namely, Ce3+ and Sm3+, at the A-site on the dielectric behav-iour and also the phase transitions in NBT, have been studied. A critical analysisof the results indicate a correlation between the phase transitions, the relaxor fer-roelectricity and electromechanical properties, and the vacancies and their impacton micropolar regions in NBT.
2. Experimental
Polycrystalline samples of Na0.5Bi0.5−xCexTiO3 (NBCT) with x = 0.001, 0.005,0.007 (NBCT1, NBCT2, NBCT3 respectively) and Na0.5Bi0.5−xSmxTiO3 (NBST)with x = 0.05, 0.1 and 0.15 (NBST1, NBST2 and NBST3, respectively) wereprepared through a chemical route (Pechini method). The stoichiometric amountsof Na2CO3 and Ce2O3 or Sm2O3 were taken and converted to their respectivenitrates by adding nitric acid solution. Bi(NO3)3·5H2O was added along withTiO2 to the above solution. The entire mixture was slowly heated on a hot plateand citric acid was added. The pH was adjusted to 7 by adding dilute ammoniumhydroxide solution. Ethylene glycol was added and heated to 160–180C to get thegel. From the gel precursor was obtained after heating. This precursor was heatedat 800C for 2 h. The resultant powder was crushed and pressed in the form ofpellets of 13 mm diameter using polyvinyl alcohol as the binder. The pellets werefinally sintered at 1150C for 2 h. Phase confirmation was done through XRD(Philips-PW3040/60 X’pert PRO). Silver paste was used as an electrode materialon large area faces for electrical measurements. Samples were electrically poled byapplying a constant 20 kV/cm DC field at 100C and cooled to room temperature inthe presence of the field. Dielectric and impedance measurements were performedusing HP 4192A impedance analyzer.
3. Result and discussion
Figures 1a and 1b show the X-ray diffraction (XRD) patterns of NBCT and NBSTsamples. The XRD is indexed on the basis of rhombohedral structure (JCPDSFile No. 36-340). The room temperature lattice parameters are calculated and
1000 Pramana – J. Phys., Vol. 72, No. 6, June 2009

A-site substitution-controlled dielectric dispersion
Figure 1. (a) X-ray diffractogram of cerium-doped sodium bismuth titanate.(b) X-ray diffractogram of samarium-doped sodium bismuth titanate.
tabulated in table 1. This table also gives the theoretical and experimental densi-ties. With the increase of cerium concentration the lattice parameters show slightincrease. All the samples prepared have about 95% of theoretical density. It hasbeen observed that NBCT2 sample has slightly higher experimental density thanthe other two ceramic samples. The NBCT samples have higher density whencompared to the pure NBT [11]. With the increase of samarium concentrationthe lattice parameters show a tendency to decrease. All the samples prepared haveabout 90% of X-ray (theoretical) density when compared with experimental density.The lattice parameters were calculated and tabulated in table 2.
In ideal perovskite ABO3 the A–O distance RAO =√
2 times RBO distance. Inthe present study, doping of A-site with cerium and samarium alters RAO distance.Tolerance factor t = RAO/
√2RBO is unity for ideal structure.
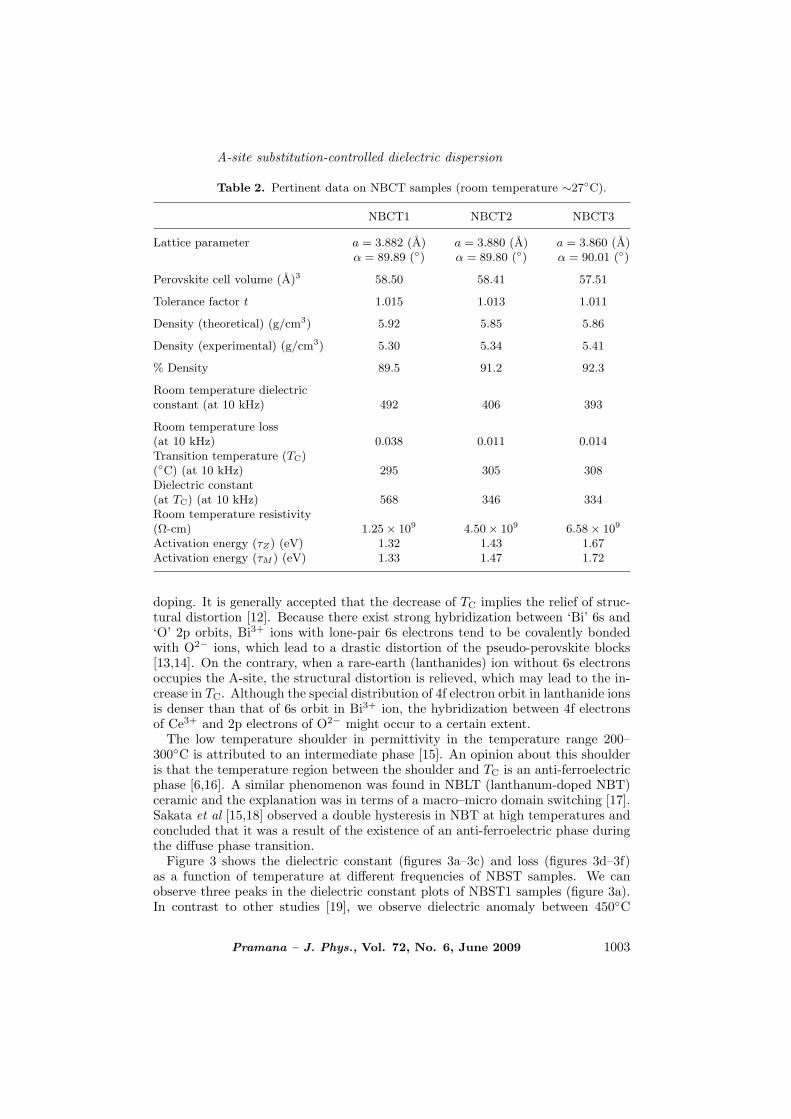
Figure 2 shows the dielectric constant as a function of temperature at differ-ent frequencies of NBCT1 (figure 2a), NBCT2 (figure 2b) and NBCT3 (figure2c) ceramic specimens. The anomalies at a temperature between about 350Cand 370C represent a transition of tetragonal ↔ cubic. This coincides with thefact that the tetragonal phase is ferroelectric. An anomaly, observed around 220–280C (the shoulder in dielectric curves) is due to rhombohedral↔ tetragonal phase
Pramana – J. Phys., Vol. 72, No. 6, June 2009 1001

M Raghavender, G S Kumar and G Prasad
Table 1. Pertinent data on NBCT samples (room temperature ∼27C).
NBCT1 NBCT2 NBCT3 NBT∗
Lattice parameter a = 3.860 (A) a = 3.884 (A) a = 3.900 (A) a = 3.985 (A)α = 90.01 () α = 89.95 () α = 90.05 () α = 90.24 ()
Perovskite cell volume (A)3 57.51 58.59 59.31 63.28
Tolerance factor t 0.855 0.855 0.855 1.016
Density (theoretical) (g/cm3) 5.89 5.77 5.70 5.55
Density (experimental) (g/cm3) 5.55 5.59 5.47 5.10
% Density 94 96 95 91
Room temperature dielectricconstant (at 10 kHz) 305 439 623
Room temperature loss(at 10 kHz) 0.09 0.04 0.03
Transition temperature (TC)(C) (at 10 kHz) 354 366 369Dielectric constant(at TC) (10 kHz) 805 1808 1804Room temperature resistivity(Ω-cm) 5.61× 10⁹ 1.028× 10¹⁰ 1.22× 10⁹
Activation energy (τZ) (eV) 1.58 1.83 1.96Activation energy (τM ) (eV) 1.84 1.69 1.89
∗After ref. [11].
transition [2–5]. It was observed that the temperature corresponding to this anom-aly increases with the increase of cerium content in the samples. Dielectric constantvalues are frequency-dependent up to this anomaly and above this the dielectricresponse is independent of frequency up to transition temperature (TC). Above450C, dielectric constant values are dispersed with frequency for all samples. Roomtemperature dielectric constant values increase with increasing doping content anddielectric loss values (≈10−2) decrease. It is observed that TC increases with dopingconcentration.
Dielectric loss values of NBCT samples (figures 2d–2f) are nearly constant uptothe temperature where the shoulder was observed in dielectric constant vs. temper-ature curves. There is a hump in the dielectric loss vs. temperature curves at lowertemperature. This is reflected in the dielectric constant plots as a shoulder nearly50C above the region where the hump is observed in dielectric loss vs. temper-ature plots. Above 300C, dielectric loss values are constant upto around 450C.For temperatures above 450C, the curves are frequency-dependent (i.e. dispersivein nature) and this dependence increases with increase in temperature.
The transition temperature (TC) of undoped NBT is reported to be 320C. TC ofthe present sample (NBCT) shifts to higher temperatures with increase in cerium
1002 Pramana – J. Phys., Vol. 72, No. 6, June 2009
A-site substitution-controlled dielectric dispersion
Table 2. Pertinent data on NBCT samples (room temperature ∼27C).
NBCT1 NBCT2 NBCT3
Lattice parameter a = 3.882 (A) a = 3.880 (A) a = 3.860 (A)α = 89.89 () α = 89.80 () α = 90.01 ()
Perovskite cell volume (A)3 58.50 58.41 57.51
Tolerance factor t 1.015 1.013 1.011
Density (theoretical) (g/cm3) 5.92 5.85 5.86
Density (experimental) (g/cm3) 5.30 5.34 5.41
% Density 89.5 91.2 92.3
Room temperature dielectricconstant (at 10 kHz) 492 406 393
Room temperature loss(at 10 kHz) 0.038 0.011 0.014Transition temperature (TC)(C) (at 10 kHz) 295 305 308Dielectric constant(at TC) (at 10 kHz) 568 346 334Room temperature resistivity(Ω-cm) 1.25× 10⁹ 4.50× 10⁹ 6.58× 10⁹
Activation energy (τZ) (eV) 1.32 1.43 1.67Activation energy (τM ) (eV) 1.33 1.47 1.72
doping. It is generally accepted that the decrease of TC implies the relief of struc-tural distortion [12]. Because there exist strong hybridization between ‘Bi’ 6s and‘O’ 2p orbits, Bi3+ ions with lone-pair 6s electrons tend to be covalently bondedwith O2− ions, which lead to a drastic distortion of the pseudo-perovskite blocks[13,14]. On the contrary, when a rare-earth (lanthanides) ion without 6s electronsoccupies the A-site, the structural distortion is relieved, which may lead to the in-crease in TC. Although the special distribution of 4f electron orbit in lanthanide ionsis denser than that of 6s orbit in Bi3+ ion, the hybridization between 4f electronsof Ce3+ and 2p electrons of O2− might occur to a certain extent.
The low temperature shoulder in permittivity in the temperature range 200–300C is attributed to an intermediate phase [15]. An opinion about this shoulderis that the temperature region between the shoulder and TC is an anti-ferroelectricphase [6,16]. A similar phenomenon was found in NBLT (lanthanum-doped NBT)ceramic and the explanation was in terms of a macro–micro domain switching [17].Sakata et al [15,18] observed a double hysteresis in NBT at high temperatures andconcluded that it was a result of the existence of an anti-ferroelectric phase duringthe diffuse phase transition.
Figure 3 shows the dielectric constant (figures 3a–3c) and loss (figures 3d–3f)as a function of temperature at different frequencies of NBST samples. We canobserve three peaks in the dielectric constant plots of NBST1 samples (figure 3a).In contrast to other studies [19], we observe dielectric anomaly between 450C
Pramana – J. Phys., Vol. 72, No. 6, June 2009 1003
M Raghavender, G S Kumar and G Prasad
Figure 2. Variation of dielectric constant (a,b,c) and loss (d,e,f) with tem-perature for NBCT1, NBCT2 and NBCT3 samples respectively.
and 550C. The peak temperatures are 130, 306 and 474C at 10 kHz frequencyfor NBST1 sample. The peak temperatures are found to be frequency-dependent.With the increase of frequency, dielectric constant values have decreased and thisdecrease is more prominent for 474C peak for NBST1. The dielectric loss also
1004 Pramana – J. Phys., Vol. 72, No. 6, June 2009

A-site substitution-controlled dielectric dispersion
Figure 3. Variation of dielectric constant (a,b,c) and loss (d,e,f) with tem-perature for NBST1, NBST2 and NBST3 samples respectively.
followed similar behaviour as that of dielectric constant in general. However, atlow frequencies and for temperatures above 400C, the dielectric loss was foundto increase with the increase of temperature. The low temperature dielectric lossvalues are relatively small (∼10−2) and vary little with temperature. Increase ofsamarium concentration has resulted in a decrease of dielectric constant and lossvalues in general.
Pramana – J. Phys., Vol. 72, No. 6, June 2009 1005

M Raghavender, G S Kumar and G Prasad
Figure 4. Variation of M ′′ and Z′′ with frequency at different temperaturesfor (a) NBST1, (b) NBST2 and (c) NBST3 samples (closed symbols are forM ′′).
The peak at 130C observed for NBST1 sample could not be recorded clearlyfor NBST2 and NBST3 samples. However, the peak at 306C of NBST1 sample isfound to be less pronounced in NBST2 and NBST3 samples and the peak at 474Chas been observed at high temperatures, i.e. 546 and 501C for NBST2 and NBST3respectively. For NBST3 sample, for high frequency, there is a shoulder in the hightemperature region of the dielectric loss curves. Curie–Weiss law could not be fitto the high temperature peak of the samples. However, these peaks follow modifiedCurie–Weiss law of diffuse phase transition (DPT). Similar behaviour was reportedfor pure NBT samples earlier [6].
Figures 4a–c show the variation of imaginary part of impedance (Z ′′) and electricmodulus (M ′′) between 525C and 600C as a function of frequency for NBST1,NBST2 and NBST3 samples respectively. With the increase of frequency, Z ′′ andM ′′ values initially increase then reach a maximum value. Further increase of fre-quency decreases this value and the M ′′ values increase again. At higher frequencyside all curves merge. With increasing temperature the peak value shifts to higherfrequency side and the peak becomes broader. The peak frequency for M ′′ curveslie between 3 × 10⁴ and 4 × 10⁵ Hz. The M ′′ and Z ′′ peaks are not coincidentand there is no evidence of any additional peaks at higher frequency side in the Z ′′
spectrum.
1006 Pramana – J. Phys., Vol. 72, No. 6, June 2009

A-site substitution-controlled dielectric dispersion
Figure 5. (a) Variation of relaxation times for NBCT samples (open symbolsare for M ′′. (b) Variation of relaxation times for NBST samples (open symbolsare for M ′′.
Between 525C and 600C the peak width at half maxima of Z ′′ and M ′′ curvesis more than a decade indicating non-Debye relaxation behaviour [19]. Distributionof relaxation may be present in the sample due to the existence of the multiple polarphases in the sample. The peak frequency difference is found to decrease with theincrease of samarium concentration.
If a ceramic is well sintered, typically 95% of X-ray (theoretical) density, andthe bulk component is electrically homogeneous, then a single M ′′ Debye peakwidth at half maxima approaching the theoretical value of 1.14 decades on a logfrequency scale should be observed. It is worth noting that M ′′ spectra should onlybe employed to determine bulk dielectric characteristics if the response is Debye-like, i.e., the peak width at half maxima of M ′′ is ≈1.14 decades on a log frequencyscale. When analysing samples that show non-Debye-like responses, i.e., presenceof significant M ′′ peak broadening due to electrical inhomogeneities or the presenceof a grain boundary component, then electric modulus complex plane plots shouldbe employed. The peak width at half maxima of Z ′′ vs. frequency plots of thepresent system of samples varies from 1.2 to 1.5.
Figures 5a and 5b show the variation of relaxation time (τ) as a function ofinverse of temperature (1000/T ). The relaxation times are of the order of 10−5 s at
Pramana – J. Phys., Vol. 72, No. 6, June 2009 1007

M Raghavender, G S Kumar and G Prasad
600C. The activation energies are evaluated from these curves and given in tables1 and 2. It is observed that incorporation of cerium or samarium in the place ofbismuth in sodium bismuth titanate increases the activation energy for relaxation.
In the present measurements, grain relaxation time (τg) is evaluated from Cole–Cole plots and when this resistance is plotted as a function of reciprocal temperaturethe curves are straight lines. The experimental data are described by the expressionof Arrhenius type.
τg = τ0 exp(
Ea
kT
).
The grain relaxation time decreases with increase of temperature. Also the grainrelaxation time (τg) is changed with the dopant concentration. The activationenergy for grain relaxation is calculated to be about 1.9 eV for these samples.
The grain conductivity follows Arrhenius law, given by the following equation forNBCT1, NBCT2 and NBCT3 ceramic samples respectively:
σg = 3.07 exp(−1.56
kT
)
σg = 4.70 exp(−1.72
kT
)
σg = 3.94 exp(−1.61
kT
).
It can be seen that the activation energy for grain conduction for NBCT2 sampleis maximum.
The relaxation times are obtained from both impedance and modulus data. Thecalculated activation energy for relaxation lies between 1.3 eV and 1.6 eV for allthe samples. Increase in samarium content increases the activation energy forrelaxation.
Deviation of tolerance factor t from unity implies competition between A–O sub-lattice and B–O sub-lattice, which results in the distortion of perovskite structure.Observation of t factor less than unity in cerium-doped samples indicates distortionof the lattice resulting in an increase in the cell volume, decrease in density andincrease in dielectric constant.
In samarium-doped samples, the cell volume, density and dielectric constantshow small variation with doping concentration, and a tendency to decrease withincrease in samarium content. This variation in the properties of samarium-dopedsamples may be attributed to the distortion of the lattice as a result of samariumincorporation. The t factor in samarium-doped samples is observed to be >1 incomparison with cerium-doped samples (where t > 1).
4. Conclusions
The Na0.5Bi0.5−xCexTiO3 samples showed interesting dielectric and impedancecharacteristics. These properties are understood in terms of the formation ofmicropolar regions. Dielectric properties of NBCT samples show diffused phase
1008 Pramana – J. Phys., Vol. 72, No. 6, June 2009
A-site substitution-controlled dielectric dispersion
transition. The grain conduction and relaxation of the present system of samplesis evaluated from Cole–Cole plots. NBCT2 samples showed more values of grainconduction and grain relaxations. The present results indicate that there is ananomaly in dielectric properties of samarium-doped NBT in the temperature range450–550C. This peak corresponds to a broad shoulder in dielectric loss curves ofNBST3 samples. The impedance data indicate that the relaxations in the samplesare due to the presence of polarizing species. The polarizing charges give non-Debye relaxations and contribute to grain boundary capacitance and conductance.The increase of samarium content results in the disappearance of 130C peak ofdielectric properties and brings out high temperature polarization peak clearly.
References
[1] G A Smolensky, V A Isupov, A I Agranovskaya and N N Krainik, Fiz. Tverd. Tela(Leningrad) 2, 2982 (1960)Ibid., Sov. Phys. Solid State 2, 2651 (1961)
[2] J Suchanicz, Ferroelectrics 190, 77 (1997)[3] G O Jones and P A Thomas, Acta Crystallogr. Sect. B: Struc. Sci. B56, 426 (2002)[4] J Suchanicz, K Poleder, A Kania and J Handerek, Ferroelectrics 77, 107 (1988)[5] T V Kruzina, V V Gene, V A Isupov and E V Sinyakov, Sov. Phys. Crystallogr. 26,
482 (1981)[6] C-S Tu, I G Siny and V H Schmidt, Phys. Rev. B49, 11550 (1994)[7] S E Park and K S Hong, J. Mater. Res. 12, 2152 (1997)[8] X H Dai, Z Xu, J F Li and D Viehland, J. Mater. Res. 11, 618 (1996)[9] F Chu, N Setter and A K Tagantsev, J. Appl. Phys. 74, 5129 (1993)
[10] T Y Kim and H M Jang, Appl. Phys. Lett. 77, 3824 (2000)[11] M Aparna, T Bhimasankaram, G S Kumar and G Prasad, Mod. Phys. Lett. B16,
1007 (2002)M Aparna, Electromechanical and electrical characterization of doped perovskite fer-roelectrics through impedance spectroscopy, Ph.D. thesis (Materials Research Labora-tory, Department of Physics, Osmania University, Hyderabad, India, 2003)
[12] Y Shimakawa, Y Kubo, Y Nakagawa, S Goto, T Kamiyama, H Asano and F Izumi,Phys. Rev. B61, 6559 (2000)
[13] Y Noguchi, M Miyayama and T Kudo, J. Appl. Phys. 88, 2146 (2000)[14] Y Noguchi, M Miyayama and T Kudo, Phys. Rev. B63, 214102 (2001)[15] K Sakata, T Takanaka and Y Naitou, Ferroelectrics 131, 219 (1992)[16] Jae Yan Yi, Jung-Kun Lee and Kug Sun Hong, Ferroelectrics 270, 203 (2002)[17] Jung-Kun Lee et al, J. Appl. Phys. 96, 1174 (2004)[18] K Sakata and Y Masuda, Ferroelectrics 7, 347 (1974)[19] J T S Irvine, D C Sinclair and A R West, Adv. Mater. 2, 132 (1990)
Pramana – J. Phys., Vol. 72, No. 6, June 2009 1009
Related Documents