A simulation of integrated photovoltaic conversion into electric grid L. Fialho a,b , R. Melı ´cio a,b,⇑ , V.M.F. Mendes a,c,⇑ , S. Viana d , C. Rodrigues d , A. Estanqueiro d a Department of Physics, Universidade de E ´ vora, R. Roma ˜o Ramalho 59, 7002-554 E ´ vora, Portugal b IDMEC/LAETA, Instituto Superior Te ´cnico, Universidade de Lisboa, Avenida Rovisco Pais, 1049-001 Lisbon, Portugal c Department of Electrical Engineering and Automation, Instituto Superior de Engenharia de Lisboa, R. Conselheiro Emı ´dio Navarro, 1950-062 Lisbon, Portugal d National Laboratory of Energy and Geology, Estrada do Pac ¸o do Lumiar, 1649-038 Lisbon, Portugal Received 8 July 2014; received in revised form 22 September 2014; accepted 27 September 2014 Communicated by: Associate Editor Nicola Romeo Abstract This paper presents a systemic modeling for a PV system integrated into an electric grid. The modeling includes models for a DC–DC boost converter and a DC–AC two-level inverter. Classical or fuzzy PI controllers with pulse width modulation by space vector mod- ulation associated with sliding mode control is used for controlling the PV system and power factor control is introduced at the output of the system. Comprehensive performance simulation studies are carried out with the modeling of the DC–DC boost converter followed by a two-level power inverter in order to compare the performance with the experimental results obtained during in situ operation with three commercial inverters. Also, studies are carried out to assess the quality of the energy injected into the electric grid in terms of harmonic distortion. Finally, conclusions regarding the integration of the PV system into the electric grid are presented. Ó 2014 Elsevier Ltd. All rights reserved. Keywords: Modeling; Power converters; Photovoltaic power generation; Power quality; Harmonic content 1. Introduction Electricity market restructuring brought a different run- ning set to the energy power system business, not only at the level of energy conversion, but also at the level of energy use (Cucchiella and D’Adamo, 2013). Since restruc- turing and the environmental concern on anthropogenic emission has arrived at this business, developments in dis- tributed power generation systems (PGSs) allowed for the integration of renewable energy conversion, allowing a never seen before incentive to profit from renewable energy and an increment of mixed conversion into energy power systems (Pec ¸as Lopes et al., 2007; Liu et al., 2014). Nowa- days, distributed PGSs are a reality on, for instances: solar energy exploitation by photovoltaic, concentrator solar and integrated solar combined cycle systems; wind energy exploitation by onshore and offshore wind turbines. A report on hardware and on control, including grid synchro- nization for distributed PGSs are given in Blaabjerg et al. (2004) and in Blaabjerg et al. (2006), respectively. The increasing integration of distributed PGSs will change considerably the dynamic behavior of the energy power system in comparison with the forerunner one (Erlich et al., 2007). Actions have to be envisaged against http://dx.doi.org/10.1016/j.solener.2014.09.041 0038-092X/Ó 2014 Elsevier Ltd. All rights reserved. ⇑ Corresponding authors at: Department of Physics, Universidade de E ´ vora, R. Roma ˜o Ramalho 59, 7002-554 E ´ vora, Portugal. Tel.: +351 266 745372; fax: +351 266 745394. E-mail addresses: [email protected] (R. Melı ´cio), vfmendes@deea. isel.pt (V.M.F. Mendes). www.elsevier.com/locate/solener Available online at www.sciencedirect.com ScienceDirect Solar Energy 110 (2014) 578–594

Welcome message from author
This document is posted to help you gain knowledge. Please leave a comment to let me know what you think about it! Share it to your friends and learn new things together.
Transcript

Available online at www.sciencedirect.com
www.elsevier.com/locate/solener
ScienceDirect
Solar Energy 110 (2014) 578–594
A simulation of integrated photovoltaic conversion into electric grid
L. Fialho a,b, R. Melıcio a,b,⇑, V.M.F. Mendes a,c,⇑, S. Viana d, C. Rodrigues d,A. Estanqueiro d
a Department of Physics, Universidade de Evora, R. Romao Ramalho 59, 7002-554 Evora, Portugalb IDMEC/LAETA, Instituto Superior Tecnico, Universidade de Lisboa, Avenida Rovisco Pais, 1049-001 Lisbon, Portugal
c Department of Electrical Engineering and Automation, Instituto Superior de Engenharia de Lisboa, R. Conselheiro Emıdio Navarro, 1950-062
Lisbon, Portugald National Laboratory of Energy and Geology, Estrada do Paco do Lumiar, 1649-038 Lisbon, Portugal
Received 8 July 2014; received in revised form 22 September 2014; accepted 27 September 2014
Communicated by: Associate Editor Nicola Romeo
Abstract
This paper presents a systemic modeling for a PV system integrated into an electric grid. The modeling includes models for a DC–DCboost converter and a DC–AC two-level inverter. Classical or fuzzy PI controllers with pulse width modulation by space vector mod-ulation associated with sliding mode control is used for controlling the PV system and power factor control is introduced at the output ofthe system. Comprehensive performance simulation studies are carried out with the modeling of the DC–DC boost converter followed bya two-level power inverter in order to compare the performance with the experimental results obtained during in situ operation with threecommercial inverters. Also, studies are carried out to assess the quality of the energy injected into the electric grid in terms of harmonicdistortion. Finally, conclusions regarding the integration of the PV system into the electric grid are presented.� 2014 Elsevier Ltd. All rights reserved.
Keywords: Modeling; Power converters; Photovoltaic power generation; Power quality; Harmonic content
1. Introduction
Electricity market restructuring brought a different run-ning set to the energy power system business, not only atthe level of energy conversion, but also at the level ofenergy use (Cucchiella and D’Adamo, 2013). Since restruc-turing and the environmental concern on anthropogenicemission has arrived at this business, developments in dis-tributed power generation systems (PGSs) allowed for the
http://dx.doi.org/10.1016/j.solener.2014.09.041
0038-092X/� 2014 Elsevier Ltd. All rights reserved.
⇑ Corresponding authors at: Department of Physics, Universidade deEvora, R. Romao Ramalho 59, 7002-554 Evora, Portugal. Tel.: +351 266745372; fax: +351 266 745394.
E-mail addresses: [email protected] (R. Melıcio), [email protected] (V.M.F. Mendes).
integration of renewable energy conversion, allowing anever seen before incentive to profit from renewable energyand an increment of mixed conversion into energy powersystems (Pecas Lopes et al., 2007; Liu et al., 2014). Nowa-days, distributed PGSs are a reality on, for instances: solarenergy exploitation by photovoltaic, concentrator solarand integrated solar combined cycle systems; wind energyexploitation by onshore and offshore wind turbines. Areport on hardware and on control, including grid synchro-nization for distributed PGSs are given in Blaabjerg et al.(2004) and in Blaabjerg et al. (2006), respectively.
The increasing integration of distributed PGSs willchange considerably the dynamic behavior of the energypower system in comparison with the forerunner one(Erlich et al., 2007). Actions have to be envisaged against

Nomenclature
G solar irradianceT common cell p-n junction temperatureh PV module tilt angleasc short-circuit current temperature coefficientboc open circuit voltage temperature coefficientD diode of the equivalent circuit for the PV moduleRp module equivalent shunt resistanceRS module equivalent series resistanceIj output current of the PV moduleVj output voltage of the PV moduleIs photo generated electric currentiDj current through diode D
m diode ideality factorVT thermal voltageVoc open circuit voltageIsc short-circuit currentVmx voltage at MPPImx current at MPPj operation conditions index (j = oc open circuit,
j = sc short circuit, j = mx MPP)I0 diode reverse bias saturation currentk IGBT switching variables at DC–DC boost con-
verter�k diode D0 switching variables at DC–DC boost
converterI PV array currentvA voltage at the PV array terminalsvD0 diode D0 forward voltage at direct current at
DC–DC boost convertervdc capacitor voltage at DC–DC boost converteriI current injected into the invertervL voltage at the inductance terminals
vdc voltage at the capacity bank C, i.e. continuousinverter input voltage
C DC–DC boost capacity bankShy unidirectional commanded IGBTs at DC–AC
convertery index to identify the converter legs with
y e {a,b,c}h index to identify the IGBT with h e {a,b}cy IGBT switching variables of each leg y at
DC–AC converteriy phase current at the output of the converterusy converter voltagex(n) output inverter signalX(k) complex, amplitude and phase of the different
sinusoidal components of x(n)XH root mean square (RMS) value of the harmonic
H
XF RMS value of the fundamental componentify phase currents injected into the electric gridufy filter voltageLf inductance of the filterRf resistance of the filterCf capacity of the filterLn inductance of the electric gridRn resistance of the electric griduy electric grid voltageS(eab, t) sliding surface on sliding mode controleab error on the stator electric current in the ab
planee error allowed for the sliding surface S(eab, t)rab voltage output of hysteresis comparators in the
ab plane
L. Fialho et al. / Solar Energy 110 (2014) 578–594 579
this change to eventually circumvent the reduction ofpower system frequency regulation capabilities (Almeidaand Pecas Lopes, 2007) and to ensure that consumer powerquality is not compromised (Salas et al., 2007). The har-monic problem, as one of the power quality issues, requiresthat the harmonic distortion is kept as low as possible onthe energy following through the grid. Some standardshave been established, for instance, IEEE Standards 519and 1547 impose limits on voltage harmonics, on currentharmonics and on total harmonic distortion (THD) ofthe energy injected into electric grids (Edwin et al., 2012;Spertino et al., 2012). The harmonic problem at the levelof design is an example that different PGSs need differentdesign considerations, namely: wind turbines and PV sys-tems (Hasanzadeh et al., 2012; Tsang and Chan, 2014).Hence, new technical challenges emerge due to theincreased renewable energy penetration and one challengeis on the research for more realistic models (Spertinoet al., 2014).
The environmental concern is a relevant one for theenergy power system business due to fact that the set ofrules on anthropogenic emission is turning out to be moredemanding and the acknowledgment on the environmentalimpact of this emission spreads, for instance, the green-house effect is said to be able of being slowed down onlywith a drastically reduction on CO2 emissions (Derschet al., 2004; Morales-Acevedo, 2006; Razkov et al., 2011).The European Commission has put forward a set of direc-tives to create a new Energy Policy for Europe, forinstance, imposing the reduction on CO2 emissions by atleast 20% by 2020 and 50% until 2050, increasing the shareof renewable energy in the overall mixed conversion ofenergy power systems (Tyukhov, 2010). Hence, one shouldexpect that distributed PGSs will turn out to be an impor-tant part of the future European Energy Policy. Among thedistributed PGSs, the use of photovoltaic energy conver-sion in recent years is a reality not to be discarded, forinstance, in locations where the connection with the electric

580 L. Fialho et al. / Solar Energy 110 (2014) 578–594
grid is not economically feasible. Moreover, photovoltaicenergy conversion is foreseen as eventually in parity withthe conventional fossil-fueled thermal one in the futuredue to the foreseen technological developments in the solidstate physics and due to the importance in what regards theenvironmental concern (Ismail et al., 2013; Kazem andKhatib, 2013; Ding et al., 2014). Also, the EuropeanCommission considers that the smart grid concept is adevelopment on the path towards a higher consumerempowerment, higher integration of renewable energy con-version into the grid and higher energy use efficiency, con-tributing to the reduction of the anthropogenic emissionand to the job creation and technological development inthe European Union.
Photovoltaic energy conversion directly converts thesolar energy into electric energy by the use of a solar cell.This is basically a p-n semiconductor junction with increas-ing in power output with the increase on solar irradiationand declining as temperature increases (Alami, 2014). Solarcells may be grouped to form modules. A PV array is a setof modules connected in series or parallel to form large PVsystems with or without tracking systems in order toachieve higher values of energy conversion during sunnydays due to the adjustment of the collecting plane so thatit remains perpendicular to sunbeam throughout the day.But, even with tracking systems a correct considerationof the space for the operational neighborhood has to beassessed to avoid mutual shading (Fartaria and Pereira,2013). Hence, the performance of a PV array depends onthe operating conditions, i.e., depends not only on solarirradiation and temperature, but also on the array configu-ration and shading effects. The shading effects, forinstances, due to a passing cloud or neighboring buildingscause not only power losses, but also further non-lineareffects on the I–V characteristics (Fialho et al., 2014a;Dıaz-Dorado et al., 2014). A solar cell is manufacturedfrom several types of semiconductors and by several indus-trial processes (Sedra and Smith, 2006). The ideal photo-voltaic cell equivalent circuit, a constant current source,with the electric current proportional to the irradiancelevel, in shunt with an ideal Shockley diode, which resultsfrom the theory of solid state physics is not enough suitableto represent the behavior of photovoltaic conversion.Observation on photovoltaic conversion data under differ-ent test conditions led to the inclusion of even more diodesand resistances, for instance, a very useful equivalent cir-cuit (Rauschenbach, 1980) is the constant current sourcein shunt with a single-diode, with the ideality factoradjusted to the real characteristic data, and a parallel resis-tance followed by a series resistance (Khan et al., 2013).This inclusion is the one followed in this paper and allowsa better practical representation, having five parameters tobe identified in order to have a voltage and current charac-teristic resembling the behavior of the I–V characteristic ofphotovoltaic conversion (Rauschenbach, 1980; Duffie andBeckman, 2006). Data from Standard Test Conditions(STC) supply performance parameters for PV systems
under the standard solar spectral distribution AM1.5 withan irradiance level of 1000 W/m2 and p-n junction
temperature of 25 �C (IEC 60904-3, 2008; Marion, 2002;Rus-Casas et al., 2014). Additionally to STC parameters,performance parameters under nominal operating cell tem-perature (NOCT) are also provided by manufacturers.NOCT is the cell p-n junction temperature under ambienttemperature of 20 �C, solar spectral distribution AM1.5with an irradiance level of 800 W/m2 and wind speed of1 m/s (IEC 60904-3, 2008). But all of these parameters,open circuit voltage, the short circuit current, the currentand voltage at maximum power, the temperature coeffi-cients at open circuit voltage and short circuit current,and the NOCT, provide not enough data for the identifica-tion of the five parameters equivalent circuit. Hence, partic-ularly in the studies during the design phase there is a needto determine further experimental data, if experimentationis possible, or to introduce a method to evaluate a possiblesolution appropriated for the identification of the fiveparameters. The method used in this paper (Fialho et al.,2014b) postulates provision in order to circumvent theabsence of enough data given by the producer of the PVmodule.
Power electronic converters have been developed forintegrating renewable energy sources with the electric grid.The use of power electronic converters, namely invertersare particular indispensable in PV systems, allowing furtherfor variable irradiance operation and enhanced powerextraction, i.e., the inverter is indispensable for two accom-plishments: the accomplishment of adjusting the low DCvoltage of the PV module to the voltage level of the electricgrid using a two power converter topologies, a DC–DCtopology and a DC–AC topology; the accomplishment ofthe Maximum Power Point (MPP) tracking due to the factof the power delivered by the modules being very sensitiveto the point of operation in the I–V curve, the inverter isable to comply with functionality to circumvent this fact(Kjaer et al., 2002; Moradi et al., 2013). Historically, lowpower photovoltaic systems use single-phase inverters,but in three-phase grid connection, the use of only one sin-gle-phase inverters produce an imbalance between thephases due the injection of energy into only one phase ofthe grid. As reported in Rampinelli et al. (2014) a maxi-mum power of 4.6 kW, with 10% of tolerance, is possibleto connect to only one phase of the three-phase grid. Forpower greater than 5 kW three single-phase inverters areneeded to ensure a balanced energy distribution betweenthe three phases. The inverters used in grid connected pho-tovoltaic systems use several circuits and there are a severaloptions of transformer configurations. There are commer-cial inverters with high or low frequency transformersand even transformerless inverters. Each topology has itsown characteristics and advantages and disadvantages(Kjaer et al., 2005; Patrao et al., 2011; Khatib et al.,2013; Rampinelli et al., 2014). The inverters used ingrid-connected applications implant maximum powerpoint tracker, anti-islanding operation, high conversion
L. Fialho et al. / Solar Energy 110 (2014) 578–594 581
efficiency, automatic synchronization with the grid andhave low level of harmonics distortion and power factorclose to unity (Velasco et al., 2010; Patrao et al., 2011;Khatib et al., 2013; Rampinelli et al., 2014). The perfor-mance of the inverters connected to the grid dependslargely on the control strategy applied (Zeng et al., 2013;Hassaine et al., 2014; Rampinelli et al., 2014). TheDC–DC boost converter topology is a power converterwith an output voltage greater than the input voltage. Itis a class of switched-mode power supply (SMPS) contain-ing at least two semiconductor switches (a diode and atransistor) and at least one energy storage element, a capac-itor, inductor, or the two in combination. Filters made ofcapacitors or in combination with inductors are normallyadded to the output of the converter to reduce output volt-age ripple (Kjaer et al., 2002). A two-level converter is anAC–DC–AC converter well suited for medium andhigh-power applications. Two-level converter generatesan output voltage with two levels with respect to theground terminal of the capacitor. Also, filters are normallyadded to the output of this converter to reduce output volt-age ripple (Kjaer et al., 2002; Du et al., 2013).
This paper presents a study of mathematical models fora systemic modeling of a PV system including a DC–DCboost converter and a DC–AC two-level inverter. Thepaper is organized as follows. Section 2 presents the mainexpressions for the modeling of the solar cell, the PV sys-tem with DC–DC boost and two-level power invertertopologies. Section 3 presents the control strategies basedon the use of classical PI controllers or fuzzy PI controllers,pulse width modulation (PWM) by space vector modula-tion (SVM) associated with sliding mode for controllingthe converters, and we introduce power factor control atthe output of the converters. Section 4 presents the casestudies with a comparison between simulation of a PV sys-tem model with classical or fuzzy PI controllers and exper-imental results obtained from three commercial invertersmeasured during their normal operation. Finally, conclud-ing remarks are given in Section 5.
S0
D0
C+
-
I
LS
vD0
iI
Vλ
T
G
_λ
vdc
iCvL
PV module
DRp
Rs
Ij
IS
IDj Ip
θ
Boost Converter Two
PWM1
G TMPPT
λ
vdc*
Vj
ij
0
1
PI
Saa
Sba
yγ
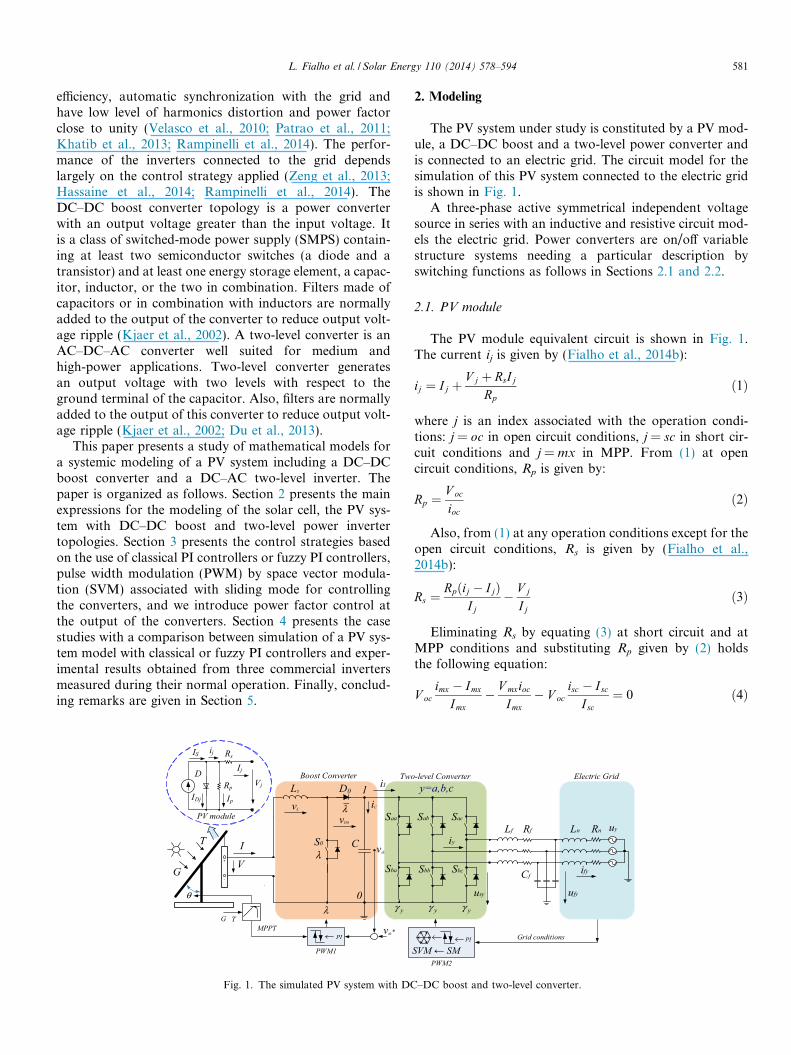
Fig. 1. The simulated PV system with DC
2. Modeling
The PV system under study is constituted by a PV mod-ule, a DC–DC boost and a two-level power converter andis connected to an electric grid. The circuit model for thesimulation of this PV system connected to the electric gridis shown in Fig. 1.
A three-phase active symmetrical independent voltagesource in series with an inductive and resistive circuit mod-els the electric grid. Power converters are on/off variablestructure systems needing a particular description byswitching functions as follows in Sections 2.1 and 2.2.
2.1. PV module
The PV module equivalent circuit is shown in Fig. 1.The current ij is given by (Fialho et al., 2014b):
ij ¼ Ij þV j þ RsIj
Rpð1Þ
where j is an index associated with the operation condi-tions: j = oc in open circuit conditions, j = sc in short cir-cuit conditions and j = mx in MPP. From (1) at opencircuit conditions, Rp is given by:
Rp ¼V oc
iocð2Þ
Also, from (1) at any operation conditions except for theopen circuit conditions, Rs is given by (Fialho et al.,2014b):
Rs ¼Rpðij � IjÞ
Ij� V j
Ijð3Þ
Eliminating Rs by equating (3) at short circuit and atMPP conditions and substituting Rp given by (2) holdsthe following equation:
V ocimx � Imx
Imx� V mxioc
Imx� V oc
isc � I sc
Isc¼ 0 ð4Þ
Lf Ln RnRf
Cf
-level Converter
PWM2
Grid conditions
Electric Grid
SVM ← SMPI
y=a,b,c
Sab Sac
Sbb Sbc
yγ yγusy ufy
ify
iy
uy
–DC boost and two-level converter.

582 L. Fialho et al. / Solar Energy 110 (2014) 578–594
The diode current, iDj, is given by:
iDj ¼ I0ej ð5Þ
where ej is defined by (Fialho et al., 2014b):
lnðej þ 1Þ ¼ cðV j þ RsIjÞ ð6Þ
where c is a parameter of the equivalent circuit defined by:
c ¼ 1
mV Tð7Þ
Hence, the current ij is given by:
ij ¼ I s � I0ej ð8Þ
From (8), in open circuit conditions, in short circuit andin MPP holds the relations respectively given by:
Is � I0eoc �V oc
Rp¼ 0 ð9Þ
Is � I0esc ¼ isc ð10ÞIs � I0emx ¼ imx ð11Þ
The system of Eqs. (9)–(11) can be solved in order to Is,I0, ioc, holding the solutions (12)–(14) given by:
Is ¼iscemx � imxesc
emxsc
ð12Þ
I0 ¼iscmx
emxsc
ð13Þ
ioc ¼imxeoc
sc � isceocmx
emxsc
¼ V co
Rpð14Þ
where ej0
j and ij0
j are respectively defined by:
ej0
j ¼ ej0 � ej ð15Þ
ij0
j ¼ ij0 � ij
From (2), (9), (10), (11), holds the relations given by:
RsIsc < V mx þ RsImx < V oc ¼ Rpioc ð16Þ
esc < emx < eoc
ioc < imx < isc
Taking the derivative of the current ij given by (1) and(8) in order to the output voltage and equating both deriv-atives, holds the relation given by (Fialho et al., 2014b):
�cRpI0 1þ RsdIj
dV j
� �ec V jþRsIjð Þ ¼ 1þ ðRp þ RsÞ
dIj
dV jð17Þ
If the derivative in (17) has null or positive values, thenthe relation does not hold. Hence as expected fromexperimental data, the derivative has to be a non-positivefunction, i.e., the PV module equivalent circuit is anon-ideal source of current. Also, in order to the relation(17) to be true hold the relations given by (Fialho et al.,2014b):
Rs < min � dVdI
: 0 � V � V oc
� �¼ �dV
dI
����oc
; Rp þ Rs
> max � dVdI
: 0 � V � V oc
� �¼ � dV
dI
����sc
Hence hold the relations given by:
Rs < �dVdI
����oc
; Rp >dVdI
����oc
� dVdI
����sc
ð18Þ
The MPP of a PV system depends on G and T
(Dzimano, 2008), at the MPP conditions the conversionis attained at the highest efficiency (Dzimano, 2008;Beltran et al., 2008), implying the satisfaction of the rela-tion given by:
� dIdV
����mx
¼ Imx
V mxð19Þ
Replacing the derivative of the current given by (19) into(17) at MPP, holds the relation given by:
cRpiscmxðV mx�RsImxÞðemxþ1ÞþV mx� ImxðRsþRpÞemx
sc ¼ 0
ð20ÞFrom (20), replacing Rp given by (2), Rs Imx given by (3)
at MPP conditions, holds the relation given by (Fialhoet al., 2014b):
cV ociscmxðImx � dÞðemx þ 1Þ � diocemx
sc ¼ 0 ð21Þ
where d is defined by:
d ¼ imx � 2V mx
V ocioc ð22Þ
From (21), d is given by (Fialho et al., 2014b):
d ¼ cV ociscmxðemx þ 1Þ
cV ociscmxðemx þ 1Þ þ iocemx
sc
Imx ð23Þ
Hence, considering the last two inequalities of (16), (21)and (23), d has to satisfy the relation given by:
0 < d < Imx ð24Þ
From (1), ij has to satisfy the relation given by:
ij � Ij ð25Þ
Relation (25) allows to justify the initialization of thevalues for the unknowns imx and isc as near but not equalto the values Imx and Isc. Also, due to the relations (18),considering the relations and (2), (22), (24) the boundsfor Rp and Rs are assumed to be respectively given by:
Rs � �dVdI
����mx
and Rp � �dVdI
����mx
ð26Þ
The ideality factor, m, for a cell is assumed to bebetween 2/3 and 2. Hence from (7) the boundaries for care given by (Fialho et al., 2014b):
1
2V T� c � 3
2V Tð27Þ

L. Fialho et al. / Solar Energy 110 (2014) 578–594 583
The I–V characteristic for the PV module shown in Fig. 1 isgiven by:
I ¼ IS � I0ðecðVþIRS Þ � 1Þ � ðV þ IRSÞ=Rp ð28Þ
The five parameters associated with this I–V character-istic are identified by the solution of an optimization proce-dure. The General Algebraic Modeling System (GAMS) isused to code the mathematical programming problem(Fialho et al., 2014b) developed for the optimization proce-dure. The mathematical programming problem for photo-voltaic module parameter identification is modeled by theEqs. (1), (4), (6), (14) and (20) and the inequalities (16),(25), (26), (27). The optimization process computes theparameters Rp, Rs, c, IS and I0.
2.2. DC–DC boost converter
The configuration of DC–DC boost converter in thesimulated PV system is shown in Fig. 1. The DC–DC boostconverter has one unidirectional commanded IGBT S0.The switching function of the DC/DC boost converter isdescribed by the switching variables k, �k used to identifythe state of the IGBT S0 and to identify the state of thediode D0 of the boost converter, respectively. The con-straints on the switching variable of the DC/DC boost con-verter (Silva and Pinto, 2007) are given by:
k ¼ 1 and �k ¼ 0 ðS0 ¼ 1 and D0 ¼ 0Þk ¼ 0 and �k ¼ 1 ðS0 ¼ 0 and D0 ¼ 1Þ
(ð29Þ
The array current I is modeled by the state equationgiven by:
dIdt¼ 1
LsmA � �kðmD0 þ mdcÞ� �
ð30Þ
The capacitor voltage vdc is modeled by the state equa-tion given by:
dmdc
dt¼ 1
Cð�kI � iIÞ ð31Þ
At steady state the mean value of the voltage at theinductance terminals vL is null, given by:
mL ¼1
T
Z kT
0
mAdt þZ T
kTðmA � mdcÞdt
¼ 0 ð32Þ
For an ideal boost converter the relationship between vdc
and vA is given by:
mdc
mA¼ 1
ð1� kðtÞÞ ð33Þ
Hence, the DC–DC boost converter can be modeled by(29)–(33).
2.3. Two-level inverter
The two-level inverter is a DC–AC converter, with sixunidirectional commanded IGBTs, Shy, as shown in
Fig. 1. The inverter is connected between a capacitor bankand a second order filter, which in turn is connected to anelectric grid. The groups of two IGBTs linked to the samephase constitute a leg y of the converter. The two-level con-verter modeling assumes that: (1) the IGBTs are ideal andunidirectional and are never subject to reverse voltages,this is assured by the connection of an anti-parallel diodeto each IGBT; (2) the diodes are ideal, i.e., in conductionstate the voltage between their terminals is null, and inblockade the current that passes through diodes is null;(3) the voltage at the output of the boost converter isvdc > 0; (4) each leg y of the converter always has one IGBTon a conduction state. The switching function of eachIGBT is described by the switching variable cy, identifyingthe state of the IGBT h in the leg y of the converter. Theindex h with h e {a,b} identifies the IGBT. The index y withy e {a,b,c} identifies a leg of the inverter. The two condi-tions (Melıcio and Mendes, 2007) for the switching variableof each leg y are given by:
cy ¼1; ðSay ¼ 1 and Sby ¼ 0Þ0; ðSay ¼ 0 and Sby ¼ 1Þ
�y 2 fa; b; cg ð34Þ
The topological restriction for the leg y is given by:
Xb
h¼a
Shy ¼ 1 y 2 fa; b; cg ð35Þ
Hence, each switching variable depends on the conduc-tion and blockade states of the IGBTs. The current injectedinto the inverter iI is given by:
iI ¼Xc
y¼a
cy iy ð36Þ
Hence, the two-level converter is modeled by (34)–(36).The measure of the voltage and the current harmoniccontent at the output of the inverter is carried out bythe discrete Fourier transform (DFT). The DTF is givenby:
X ðkÞ ¼XN�1
n¼0
e�j2pkn=N xðnÞ for k ¼ 0; . . . ;N � 1 ð37Þ
The total harmonic distortion (THD) is given by:
THD ð%Þ ¼ 100
ffiffiffiffiffiffiffiffiffiffiffiffiffiffiffiffiffiffiffiP50H¼2X 2
H
qX F
ð38Þ
2.4. Electric grid
The phase currents injected into the electric grid ify, con-sidering the grid as an equivalent circuit given by a three-phase active symmetrical circuit as shown in Fig. 1, is givenby:
dify
dt¼ 1
Lnðufy � Rnify � uyÞ y 2 fa; b; cg ð39Þ
Hence, the electric grid is modeled by (39).
584 L. Fialho et al. / Solar Energy 110 (2014) 578–594
3. Control strategy
A maximum power point tracking (MPPT) is used toextract the maximum power from a PV system which isunder varying weather conditions. The DC–DC boost con-verter is used to implement maximum power operation ofthe PV system, controlling the voltage at the array termi-nals. The calculation of PV array output power requiressolar irradiance and ambient temperature records, andtherefore, records of these variables have been obtainedfor the adopted site (Kazem and Khatib, 2013; Raj andJeyakumar, 2014). The control of the boost converterincludes the MPPT, using the oP/oV algorithm to imple-ment MPPT on the P–V curve of the array for each pair(G,T) and classical PI controllers or fuzzy PI controllers,as in Viveiros et al. (2014) and Viveiros et al. (2015).
PWM by SVM associated with sliding mode control isused for controlling the converters. The sliding modecontrol strategy presents attractive features such as robust-ness to parametric uncertainties of the PV array as well asto electric grid disturbances (Jiang et al., 2005). Slidingmode control is particularly interesting in systems withvariable structure, such as power converters, guaranteeingthe choice of the most appropriate space vectors. Theaim of the sliding mode control is to let the system slidealong a predefined sliding surface by changing the systemstructure. The control strategy of the PV system withDC–DC boost and two-level power converter topologiesusing classical or fuzzy PI controllers has the diagram inbox PWM1 and in box PWM2 shown in Fig. 1. Theconvenient vector selection to ensure stability for the con-verters, after being processed by the hysteresis comparatorin the block of SM control and SVM are given in Seixaset al. (2014). The SM control is a lower level of controlas is normally implemented with the classical or fuzzy PIcontroller, for triggering the converters transistors is usedpulse width modulation (PWM) by SVM supplementedwith SM.
Power semiconductors have physical limitations to beconsidered during design phase and during simulation. Par-ticularly, the switch frequency has to be a finite value, forinstances, switching frequency of 2 kHz, 5 kHz or 10 kHzare normally reported. The switch frequency finite valueimplying that an error eab has to be tolerated on the electriccurrent, i.e., an error between the reference value and thecontrol value of the current. The error trajectory in orderto guarantee that the system follows the sliding surfaceS(eab, t), based on the Concordia transformation (a � b),has to be in a convenient neighboring of this sliding surface,implying the satisfaction of stability conditions (Silva andPinto, 2007; Melıcio and Mendes, 2007) given by:
Sðeab; tÞdSðeab; tÞ
dt< 0 ð40Þ
The sliding surface in current practice is chosen in wayto allow a small error e > 0 for S(eab, t). But, for the
simulation studies, an implementation of the switchingstrategy considered may be implemented by hysteresis com-parators performing accordingly to the condition given by:
�e < Sðeab; tÞ < þe ð41ÞThe outputs of the hysteresis comparators are the inte-
ger variables rab = (ra,rb) for the two-level converter takethe values (Silva and Pinto, 2007) given by:
rab with ra; rb 2 �1; 0; 1f g ð42ÞThe integer variables values indicate whether the error is
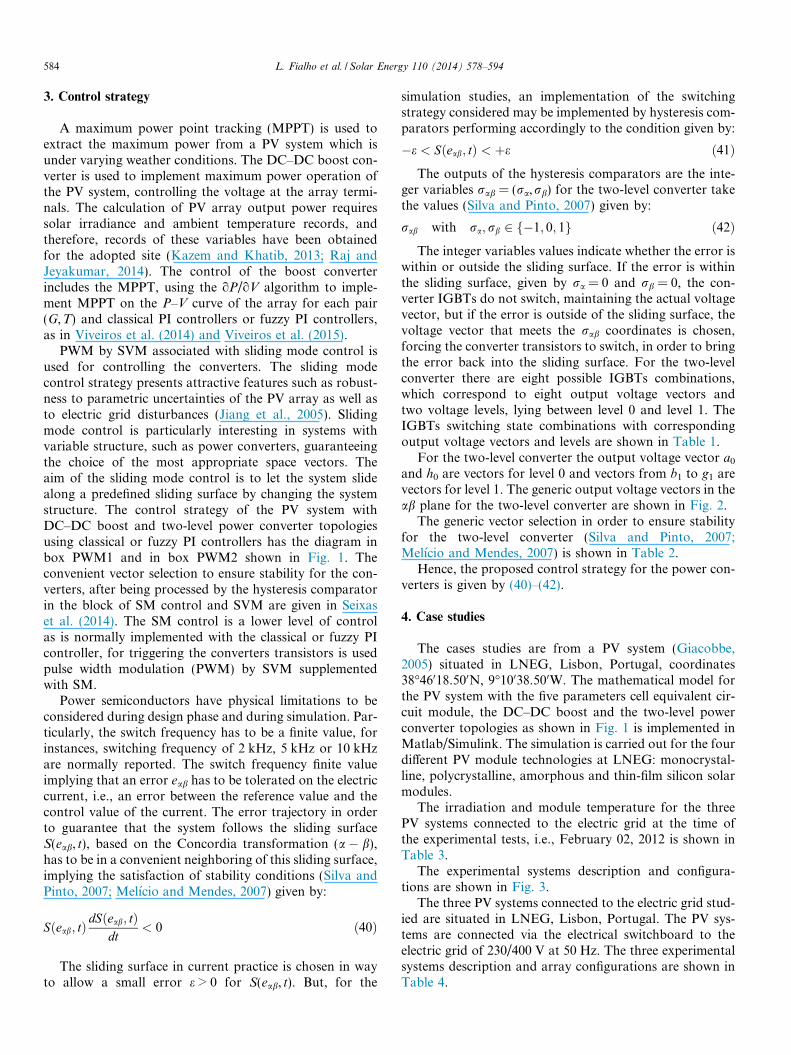
within or outside the sliding surface. If the error is withinthe sliding surface, given by ra = 0 and rb = 0, the con-verter IGBTs do not switch, maintaining the actual voltagevector, but if the error is outside of the sliding surface, thevoltage vector that meets the rab coordinates is chosen,forcing the converter transistors to switch, in order to bringthe error back into the sliding surface. For the two-levelconverter there are eight possible IGBTs combinations,which correspond to eight output voltage vectors andtwo voltage levels, lying between level 0 and level 1. TheIGBTs switching state combinations with correspondingoutput voltage vectors and levels are shown in Table 1.
For the two-level converter the output voltage vector a0
and h0 are vectors for level 0 and vectors from b1 to g1 arevectors for level 1. The generic output voltage vectors in theab plane for the two-level converter are shown in Fig. 2.
The generic vector selection in order to ensure stabilityfor the two-level converter (Silva and Pinto, 2007;Melıcio and Mendes, 2007) is shown in Table 2.
Hence, the proposed control strategy for the power con-verters is given by (40)–(42).
4. Case studies
The cases studies are from a PV system (Giacobbe,2005) situated in LNEG, Lisbon, Portugal, coordinates38�46018.500N, 9�10038.500W. The mathematical model forthe PV system with the five parameters cell equivalent cir-cuit module, the DC–DC boost and the two-level powerconverter topologies as shown in Fig. 1 is implemented inMatlab/Simulink. The simulation is carried out for the fourdifferent PV module technologies at LNEG: monocrystal-line, polycrystalline, amorphous and thin-film silicon solarmodules.
The irradiation and module temperature for the threePV systems connected to the electric grid at the time ofthe experimental tests, i.e., February 02, 2012 is shown inTable 3.
The experimental systems description and configura-tions are shown in Fig. 3.
The three PV systems connected to the electric grid stud-ied are situated in LNEG, Lisbon, Portugal. The PV sys-tems are connected via the electrical switchboard to theelectric grid of 230/400 V at 50 Hz. The three experimentalsystems description and array configurations are shown inTable 4.
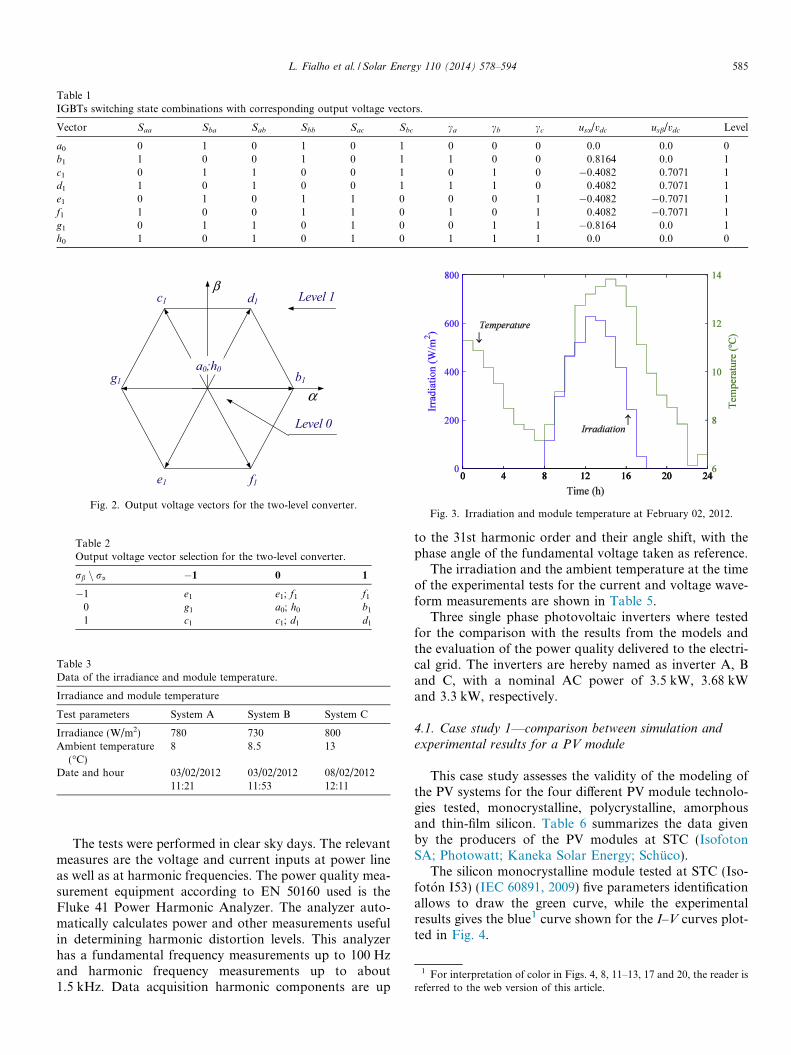
Table 1IGBTs switching state combinations with corresponding output voltage vectors.
Vector Saa Sba Sab Sbb Sac Sbc ca cb cc usa/vdc usb/vdc Level
a0 0 1 0 1 0 1 0 0 0 0.0 0.0 0b1 1 0 0 1 0 1 1 0 0 0.8164 0.0 1c1 0 1 1 0 0 1 0 1 0 �0.4082 0.7071 1d1 1 0 1 0 0 1 1 1 0 0.4082 0.7071 1e1 0 1 0 1 1 0 0 0 1 �0.4082 �0.7071 1f1 1 0 0 1 1 0 1 0 1 0.4082 �0.7071 1g1 0 1 1 0 1 0 0 1 1 �0.8164 0.0 1h0 1 0 1 0 1 0 1 1 1 0.0 0.0 0
β
α
d1c1
g1 b1
f1e1
a0;h0
Level 0
Level 1
Fig. 2. Output voltage vectors for the two-level converter.
Table 2Output voltage vector selection for the two-level converter.
rb n ra �1 0 1
�1 e1 e1; f1 f1
0 g1 a0; h0 b1
1 c1 c1; d1 d1
Table 3Data of the irradiance and module temperature.
Irradiance and module temperature
Test parameters System A System B System C
Irradiance (W/m2) 780 730 800Ambient temperature
(�C)8 8.5 13
Date and hour 03/02/201211:21
03/02/201211:53
08/02/201212:11
Fig. 3. Irradiation and module temperature at February 02, 2012.
1 For interpretation of color in Figs. 4, 8, 11–13, 17 and 20, the reader isreferred to the web version of this article.
L. Fialho et al. / Solar Energy 110 (2014) 578–594 585
The tests were performed in clear sky days. The relevantmeasures are the voltage and current inputs at power lineas well as at harmonic frequencies. The power quality mea-surement equipment according to EN 50160 used is theFluke 41 Power Harmonic Analyzer. The analyzer auto-matically calculates power and other measurements usefulin determining harmonic distortion levels. This analyzerhas a fundamental frequency measurements up to 100 Hzand harmonic frequency measurements up to about1.5 kHz. Data acquisition harmonic components are up
to the 31st harmonic order and their angle shift, with thephase angle of the fundamental voltage taken as reference.
The irradiation and the ambient temperature at the timeof the experimental tests for the current and voltage wave-form measurements are shown in Table 5.
Three single phase photovoltaic inverters where testedfor the comparison with the results from the models andthe evaluation of the power quality delivered to the electri-cal grid. The inverters are hereby named as inverter A, Band C, with a nominal AC power of 3.5 kW, 3.68 kWand 3.3 kW, respectively.
4.1. Case study 1—comparison between simulation and
experimental results for a PV module
This case study assesses the validity of the modeling ofthe PV systems for the four different PV module technolo-gies tested, monocrystalline, polycrystalline, amorphousand thin-film silicon. Table 6 summarizes the data givenby the producers of the PV modules at STC (IsofotonSA; Photowatt; Kaneka Solar Energy; Schuco).
The silicon monocrystalline module tested at STC (Iso-foton I53) (IEC 60891, 2009) five parameters identificationallows to draw the green curve, while the experimentalresults gives the blue1 curve shown for the I–V curves plot-ted in Fig. 4.
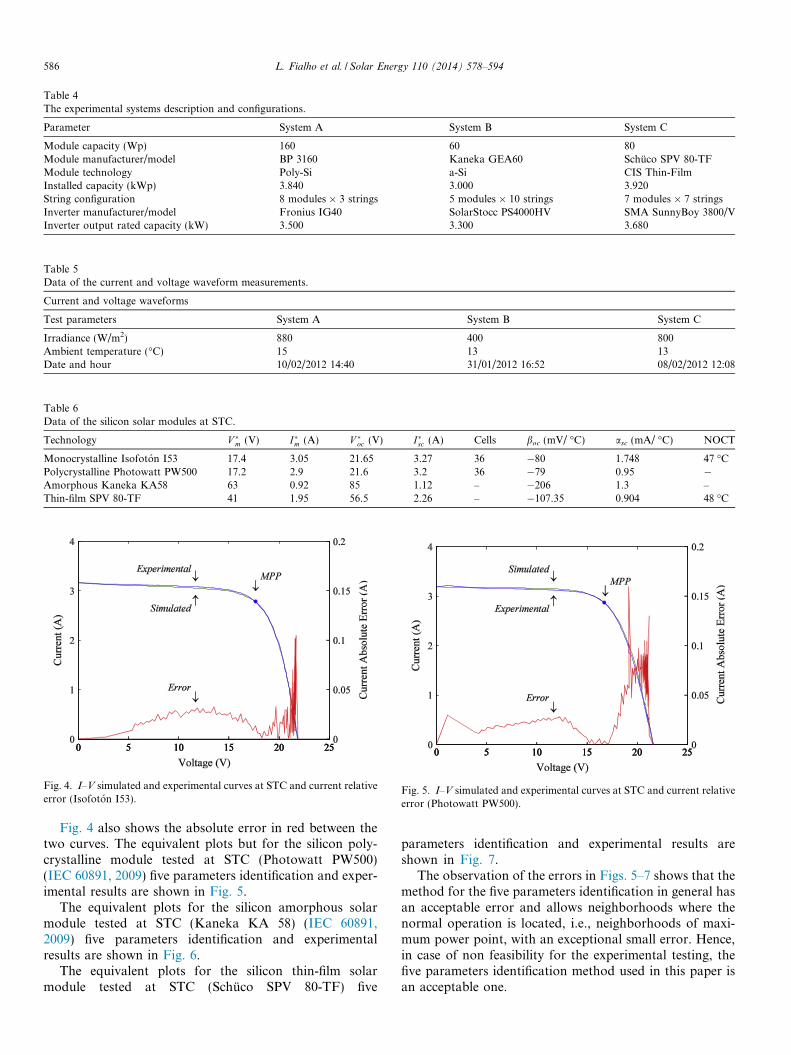
Table 4The experimental systems description and configurations.
Parameter System A System B System C
Module capacity (Wp) 160 60 80Module manufacturer/model BP 3160 Kaneka GEA60 Schuco SPV 80-TFModule technology Poly-Si a-Si CIS Thin-FilmInstalled capacity (kWp) 3.840 3.000 3.920String configuration 8 modules � 3 strings 5 modules � 10 strings 7 modules � 7 stringsInverter manufacturer/model Fronius IG40 SolarStocc PS4000HV SMA SunnyBoy 3800/VInverter output rated capacity (kW) 3.500 3.300 3.680
Table 5Data of the current and voltage waveform measurements.
Current and voltage waveforms
Test parameters System A System B System C
Irradiance (W/m2) 880 400 800Ambient temperature (�C) 15 13 13Date and hour 10/02/2012 14:40 31/01/2012 16:52 08/02/2012 12:08
Table 6Data of the silicon solar modules at STC.
Technology V �m (V) I�m (A) V �oc (V) I�sc (A) Cells boc (mV/ �C) asc (mA/ �C) NOCT
Monocrystalline Isofoton I53 17.4 3.05 21.65 3.27 36 �80 1.748 47 �CPolycrystalline Photowatt PW500 17.2 2.9 21.6 3.2 36 �79 0.95 �Amorphous Kaneka KA58 63 0.92 85 1.12 – �206 1.3 –Thin-film SPV 80-TF 41 1.95 56.5 2.26 – �107.35 0.904 48 �C
Fig. 4. I–V simulated and experimental curves at STC and current relativeerror (Isofoton I53).
Fig. 5. I–V simulated and experimental curves at STC and current relativeerror (Photowatt PW500).
586 L. Fialho et al. / Solar Energy 110 (2014) 578–594
Fig. 4 also shows the absolute error in red between thetwo curves. The equivalent plots but for the silicon poly-crystalline module tested at STC (Photowatt PW500)(IEC 60891, 2009) five parameters identification and exper-imental results are shown in Fig. 5.
The equivalent plots for the silicon amorphous solarmodule tested at STC (Kaneka KA 58) (IEC 60891,2009) five parameters identification and experimentalresults are shown in Fig. 6.
The equivalent plots for the silicon thin-film solarmodule tested at STC (Schuco SPV 80-TF) five
parameters identification and experimental results areshown in Fig. 7.
The observation of the errors in Figs. 5–7 shows that themethod for the five parameters identification in general hasan acceptable error and allows neighborhoods where thenormal operation is located, i.e., neighborhoods of maxi-mum power point, with an exceptional small error. Hence,in case of non feasibility for the experimental testing, thefive parameters identification method used in this paper isan acceptable one.

Fig. 6. I–V simulated and experimental curves at STC and current relativeerror (Kaneka KA 58).
Fig. 7. I–V simulated and experimental curves at STC and current relativeerror (SPV 80-TF).
Fig. 8. Current injected into the electric grid simulated (ideal) andexperimental for the inverter A.
Fig. 9. Current injected into the electric grid simulated (ideal) andexperimental for the inverter B.
Fig. 10. Current injected into the electric grid simulated (ideal) andexperimental for the inverter C.
L. Fialho et al. / Solar Energy 110 (2014) 578–594 587
4.2. Case study 2—ideal sinusoidal grid voltage waveform
This case study assesses the simulation results for the PVsystem with the electric grid of the 230 V at 50 Hz. The cur-rent injected into the electric grid, simulated with classicalPI controller in green and experimental in blue implement-ing the inverter A are shown in Fig. 8.
Fig. 8 also shows in red the absolute error between thetwo currents. The correspondent figure for the currentinjected into the electric grid, simulated with classical PIcontroller and experimental results, implementing theinverter B are shown in Fig. 9.
The correspondent figure for the current injected intothe electric grid, simulated with classical PI controllerand experimental results, implementing the inverter C isshown in Fig. 10.
The observation of the errors in Figs. 8–10 is in favor ofconcluding that the PV system model has an acceptablebehavior.
The harmonic behavior given by the DFT for the cur-rent injected into the electric grid, simulated with classical
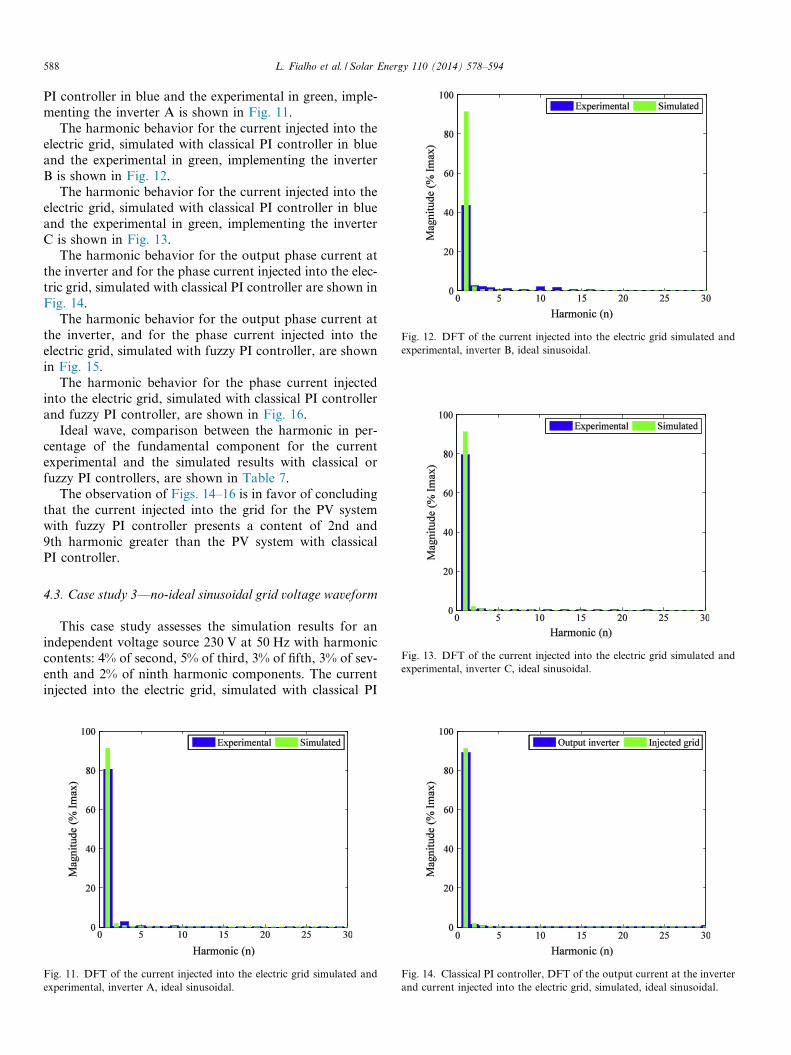
Fig. 12. DFT of the current injected into the electric grid simulated andexperimental, inverter B, ideal sinusoidal.
588 L. Fialho et al. / Solar Energy 110 (2014) 578–594
PI controller in blue and the experimental in green, imple-menting the inverter A is shown in Fig. 11.
The harmonic behavior for the current injected into theelectric grid, simulated with classical PI controller in blueand the experimental in green, implementing the inverterB is shown in Fig. 12.
The harmonic behavior for the current injected into theelectric grid, simulated with classical PI controller in blueand the experimental in green, implementing the inverterC is shown in Fig. 13.
The harmonic behavior for the output phase current atthe inverter and for the phase current injected into the elec-tric grid, simulated with classical PI controller are shown inFig. 14.
The harmonic behavior for the output phase current atthe inverter, and for the phase current injected into theelectric grid, simulated with fuzzy PI controller, are shownin Fig. 15.
The harmonic behavior for the phase current injectedinto the electric grid, simulated with classical PI controllerand fuzzy PI controller, are shown in Fig. 16.
Ideal wave, comparison between the harmonic in per-centage of the fundamental component for the currentexperimental and the simulated results with classical orfuzzy PI controllers, are shown in Table 7.
The observation of Figs. 14–16 is in favor of concludingthat the current injected into the grid for the PV systemwith fuzzy PI controller presents a content of 2nd and9th harmonic greater than the PV system with classicalPI controller.
Fig. 13. DFT of the current injected into the electric grid simulated andexperimental, inverter C, ideal sinusoidal.
4.3. Case study 3—no-ideal sinusoidal grid voltage waveform
This case study assesses the simulation results for anindependent voltage source 230 V at 50 Hz with harmoniccontents: 4% of second, 5% of third, 3% of fifth, 3% of sev-enth and 2% of ninth harmonic components. The currentinjected into the electric grid, simulated with classical PI
Fig. 11. DFT of the current injected into the electric grid simulated andexperimental, inverter A, ideal sinusoidal.
Fig. 14. Classical PI controller, DFT of the output current at the inverterand current injected into the electric grid, simulated, ideal sinusoidal.
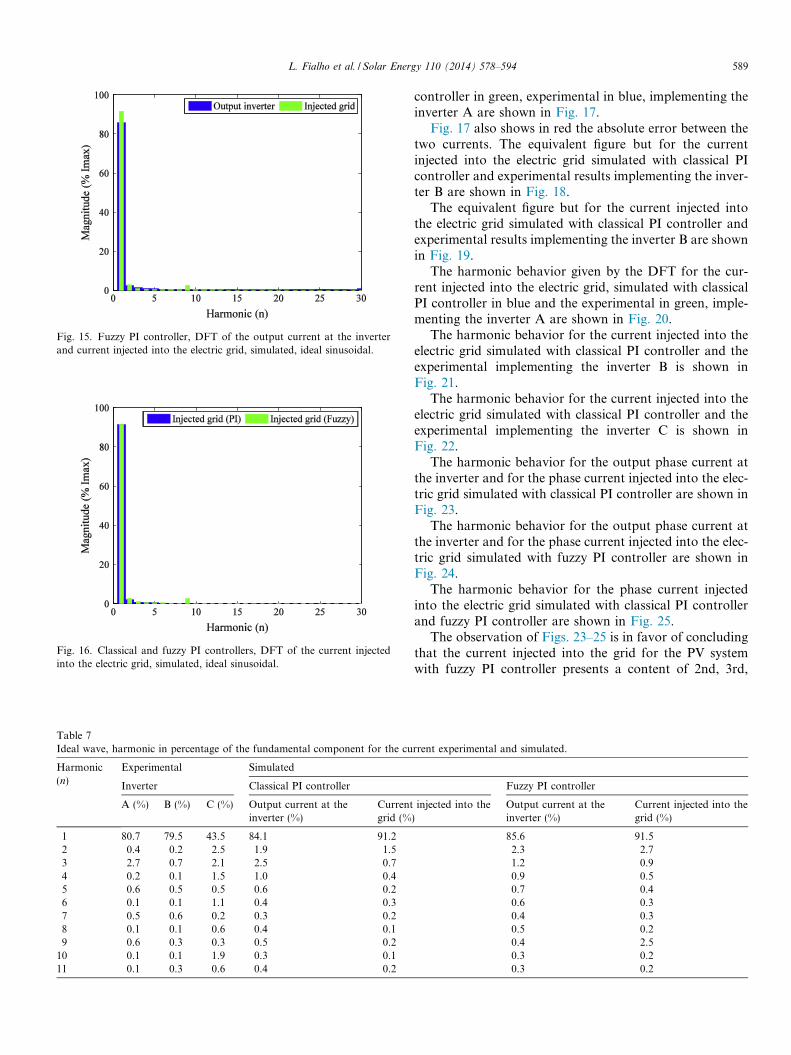
Fig. 15. Fuzzy PI controller, DFT of the output current at the inverterand current injected into the electric grid, simulated, ideal sinusoidal.
Fig. 16. Classical and fuzzy PI controllers, DFT of the current injectedinto the electric grid, simulated, ideal sinusoidal.
Table 7Ideal wave, harmonic in percentage of the fundamental component for the cu
Harmonic(n)
Experimental Simulated
Inverter Classical PI controller
A (%) B (%) C (%) Output current at theinverter (%)
Currentgrid (%
1 80.7 79.5 43.5 84.1 91.22 0.4 0.2 2.5 1.9 1.53 2.7 0.7 2.1 2.5 0.74 0.2 0.1 1.5 1.0 0.45 0.6 0.5 0.5 0.6 0.26 0.1 0.1 1.1 0.4 0.37 0.5 0.6 0.2 0.3 0.28 0.1 0.1 0.6 0.4 0.19 0.6 0.3 0.3 0.5 0.2
10 0.1 0.1 1.9 0.3 0.111 0.1 0.3 0.6 0.4 0.2
L. Fialho et al. / Solar Energy 110 (2014) 578–594 589
controller in green, experimental in blue, implementing theinverter A are shown in Fig. 17.
Fig. 17 also shows in red the absolute error between thetwo currents. The equivalent figure but for the currentinjected into the electric grid simulated with classical PIcontroller and experimental results implementing the inver-ter B are shown in Fig. 18.
The equivalent figure but for the current injected intothe electric grid simulated with classical PI controller andexperimental results implementing the inverter B are shownin Fig. 19.
The harmonic behavior given by the DFT for the cur-rent injected into the electric grid, simulated with classicalPI controller in blue and the experimental in green, imple-menting the inverter A are shown in Fig. 20.
The harmonic behavior for the current injected into theelectric grid simulated with classical PI controller and theexperimental implementing the inverter B is shown inFig. 21.
The harmonic behavior for the current injected into theelectric grid simulated with classical PI controller and theexperimental implementing the inverter C is shown inFig. 22.
The harmonic behavior for the output phase current atthe inverter and for the phase current injected into the elec-tric grid simulated with classical PI controller are shown inFig. 23.
The harmonic behavior for the output phase current atthe inverter and for the phase current injected into the elec-tric grid simulated with fuzzy PI controller are shown inFig. 24.
The harmonic behavior for the phase current injectedinto the electric grid simulated with classical PI controllerand fuzzy PI controller are shown in Fig. 25.
The observation of Figs. 23–25 is in favor of concludingthat the current injected into the grid for the PV systemwith fuzzy PI controller presents a content of 2nd, 3rd,
rrent experimental and simulated.
Fuzzy PI controller
injected into the)
Output current at theinverter (%)
Current injected into thegrid (%)
85.6 91.52.3 2.71.2 0.90.9 0.50.7 0.40.6 0.30.4 0.30.5 0.20.4 2.50.3 0.20.3 0.2
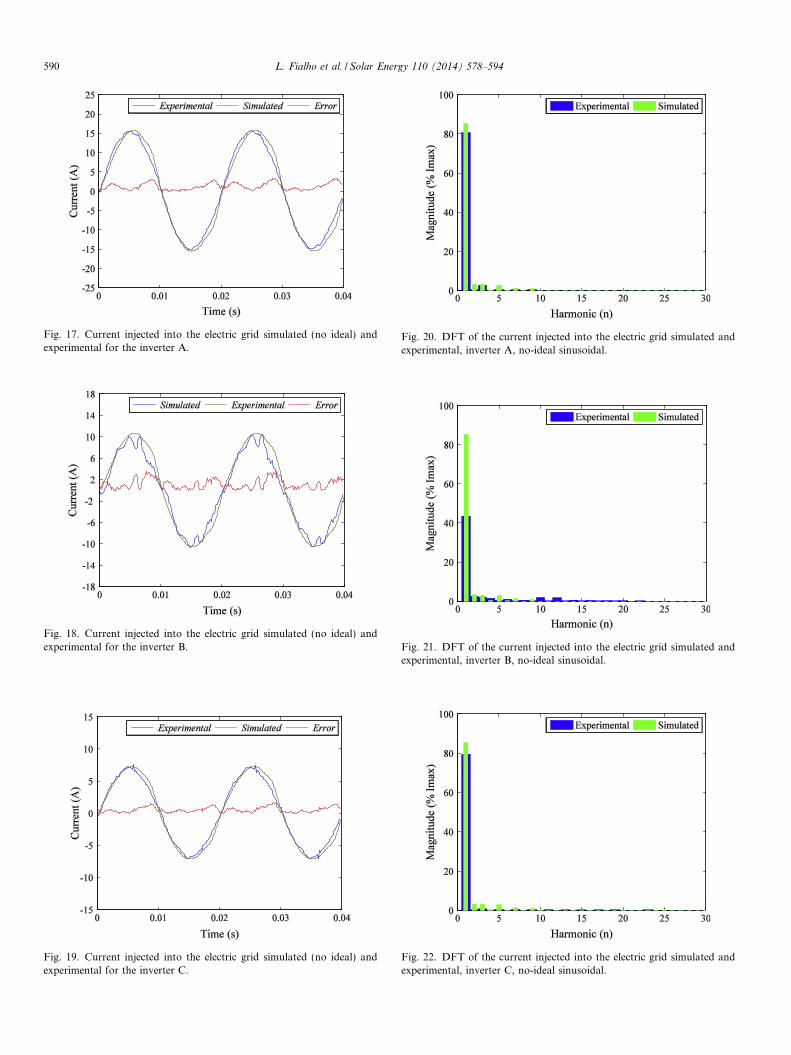
Fig. 17. Current injected into the electric grid simulated (no ideal) andexperimental for the inverter A.
Fig. 18. Current injected into the electric grid simulated (no ideal) andexperimental for the inverter B.
Fig. 19. Current injected into the electric grid simulated (no ideal) andexperimental for the inverter C.
Fig. 20. DFT of the current injected into the electric grid simulated andexperimental, inverter A, no-ideal sinusoidal.
Fig. 21. DFT of the current injected into the electric grid simulated andexperimental, inverter B, no-ideal sinusoidal.
Fig. 22. DFT of the current injected into the electric grid simulated andexperimental, inverter C, no-ideal sinusoidal.
590 L. Fialho et al. / Solar Energy 110 (2014) 578–594

Fig. 23. Classical PI controller, DFT of the output current at the inverterand current injected into the electric grid, simulated, no-ideal sinusoidal.
Fig. 24. Fuzzy PI controller, DFT of the output current at the inverterand current injected into the electric grid, simulated, no-ideal sinusoidal.
Fig. 25. Classical and fuzzy PI controllers, DFT of the current injectedinto the electric grid, simulated, no-ideal sinusoidal.
able 8o-ideal wave, harmonic in percentage of the fundamental component for
he current experimental and simulated.
armonicn)
Experimental Simulated
Inverter Classical PIcontroller
Fuzzy PI controller
A(%)
B(%)
C(%)
Outputcurrent attheinverter(%)
Currentinjectedinto thegrid (%)
Outputcurrent attheinverter(%)
Currentinjectedinto thegrid (%)
1 80.7 79.5 43.5 81.7 85.2 82.3 85.82 0.4 0.2 2.5 1.54 3.25 2.52 3.123 2.7 0.7 2.1 0.69 3.09 1.3 2.934 0.2 0.1 1.5 0.41 0.36 0.9 0.465 0.6 0.5 0.5 0.21 2.75 0.7 2.796 0.1 0.1 1.1 0.17 0.27 0.5 0.327 0.5 0.6 0.2 0.19 1.35 0.5 1.38 0.1 0.1 0.6 0.25 0.12 0.5 0.179 0.6 0.3 0.3 0.18 0.89 0.5 0.930 0.1 0.1 1.9 0.04 0.09 0.4 0.151 0.1 0.3 0.6 0.22 0.09 0.3 0.5
L. Fialho et al. / Solar Energy 110 (2014) 578–594 591
TNt
H(
11
5th, 7th and 9th harmonic similar than the PV system withclassical PI controller.
No-ideal voltage wave comparison between the har-monic in percentage of the fundamental component ofthe current the experimental and of the simulated resultswith classical or fuzzy PI controllers is shown in Table 8.
The harmonic content given by the DFT for the currentinjected into the grid with the ideal sinusoidal voltage gridwaveform shows that the dominant harmonics are the 2ndand 3rd order ones. The harmonics of higher orders, basi-cally odd ones, were also recorded but their magnitudes arenegligible. While, for the non-ideal sinusoidal voltage gridwaveform the dominant harmonics are the 2nd, 3rd, 4th,5th, 7th and 9th order. The harmonics of higher orders,basically odd ones, are also negligible.
The harmonic content for the current injected into thegrid for the inverter A and the inverter B the dominantharmonics are the 3rd, 5th, 7th, 9th and 11th order. Theharmonics of higher orders, basically odd ones, are alsorecorded but their magnitude is negligible, which doesnot occur for the inverter C where the dominating harmon-ics are even and odd harmonics. The largest part relevanteven harmonics are the 2nd, 4th, 6th, 8th and 10th. Theharmonic for the current injected into the grid forthe inverter A, B, C with the proposed PV system, havingthe DC–DC boost and the two-level inverter is due thePWM control strategy. The connection of the PV systemin the electric grid causes in the current injected into theelectric grid the presence of the 2nd, 3rd and 5th order har-monics. The current injected into the grid for the inverter Aand B show good grid performance regarding the THD,i.e., the THD is lower than the 5% limit imposed by stan-dards IEEE 519 and IEEE 1547, while the inverter C hasa THD out of these standards. The high order harmonicsof the output current are filtered out by the second orderfilter. A comparison between the THD with ideal and
Table 9The THD for the current injected into the grid experimental and simulated.
Experimental Simulated
Inverter Classical PI controller Fuzzy PI controller
A B C Ideal wave Non-ideal wave Ideal wave Non-ideal wave
THD (%) 3.73 4.17 10.24 5.005 7.29 4.94 7.03
Table 10The THD for the grid voltage experimental and simulated.
Experimental Simulated
Inverter Classical PI controller Fuzzy PI controller
A B C Ideal wave Non-ideal wave Ideal wave Non-ideal wave
THD (%) 0.83 0.88 0.90 0.24 7.39 0.281 6.81
Table 11Simulations root mean square error (RMSE), current injected into the grid.
Method Inverter A Inverter B Inverter C
Simulated ideal wave RMSE (A) 1.099 1.263 0.665Simulated non-ideal wave RMSE (A) 1.549 1.489 0.678RMSE variation (%) 140.92 117.91 101.98
592 L. Fialho et al. / Solar Energy 110 (2014) 578–594
no-ideal wave for the current injected into the electric gridexperimental and the simulated with classical or fuzzy PIcontrollers is shown in Table 9.
A comparison between the THD with ideal and no-idealwave for the electric grid voltage experimental and the sim-ulated with classical or fuzzy PI controllers is shown inTable 10. The simulated results for the controllers withideal wave and no-ideal wave, Tables 7–10, shown thatthe fuzzy PI controller presents a slightly better similarbehavior to the classical PI controller.
The root mean square error (RMSE) with the classicalPI controller of the current injected into the electric gridis shown in Table 11.
The voltage THD profile of the electric grid is not signif-icantly affected by the PV system. The voltage THD for theinverters and the proposed PV system is lower than thelimit imposed by standards IEEE 519, IEEE 1547 andEN50160. The harmonics are related to the power-electronic conversion system and the control.
5. Conclusions
The increased PV system penetration leads to new tech-nical challenges implying research for more realistic physi-cal models of distributed power generation systems. Thepaper presents an integrated model for PV systems allow-ing a more accurate dynamic of the PV system. The modelincludes a maximum power point tracking and converterstopologies for the power-electronic: the DC–DC boost fol-lowed by the two-level converts. The control strategy isbased on the use of classical PI controllers or fuzzy PI
controllers, PWM by SVM associated with sliding modecontrol and power factor control is introduced at the out-put of the inverter. Although more complex, this integratedmodel is justified for more realistic results. The fuzzy PIcontroller presents a slightly better behavior in comparisonwith the classical PI controller in the case study.
A comparison between simulation of a PV system inte-grated model and experimental results obtained from threecommercial inverters measured during their in situoperation is in favor of this contribution as an integratedrelevant modeling. The harmonic content computed bythe DFT for the current injected into the grid for the threecommercial inverters have an acceptable agreement withthe experimental results. Also, in what regards the configu-ration of the PV system, THD is lower than the limitimposed by standards IEEE 519, IEEE 1547 andEN50160. Hence, the performance of the PV system config-uration is revealed as a feasible practical implementation.
Acknowledgments
This work was partially supported by Fundacao Cienciae Tecnologia, through IDMEC/LAETA, Instituto Supe-rior Tecnico, Universidade de Lisboa and by Universidadede Evora, Catedra BES – Energias Renovaveis. Theauthors would like to acknowledge partial support underthe FCOMP-01-0124-FEDER-016080 project and wouldalso like to extend their appreciation to Eng. Maria JoaoMartins from LNEG for the contribution in the inverterdata acquisition that led to the data used in the casestudies.

L. Fialho et al. / Solar Energy 110 (2014) 578–594 593
References
Alami, A.H., 2014. Effects of evaporative cooling on efficiency ofphotovoltaic modules. Energy Convers. Manage. 77, 668–679.
Almeida, R.G., Pecas Lopes, J.A., 2007. Participation of doubly fedinduction wind generators in system frequency regulation. IEEETrans. Power Syst. 22 (3), 944–950.
Beltran, B., Ahmed-Ali, T., Benbouzid, M.E.H., 2008. Sliding modepower control of variable-speed wind energy conversion systems. IEEETrans. Energy Convers. 23 (2), 551–558.
Blaabjerg, F., Chen, Z., Kjaer, S.B., 2004. Power electronics as efficientinterface in dispersed power generation systems. IEEE Trans. Ind.Electron. 19 (5), 1184–1194.
Blaabjerg, F., Teodoresco, R., Liserre, M., Timbus, A.V., 2006. Overviewof control and grid synchronization for distributed power generationsystems. IEEE Trans. Ind. Electron. 53 (5), 1398–1409.
Cucchiella, F., D’Adamo, I., 2013. Issue on supply chain of renewableenergy. Energy Convers. Manage. 76, 774–780.
Dersch, J., Geyer, M., Herrmann, U., Jones, S.A., Kelly, B., Kistner,R., Ortmanns, W., Pitz-Paal, R., Price, H., 2004. Troughintegration into power plants—a study on the performance andeconomy of integrated solar combined cycle systems. Energy 29,947–959.
Dıaz-Dorado, E., Cidras, J., Carrillo, C., 2014. Discrete I–V model forpartially shaded PV-arrays. Sol. Energy 103, 96–107.
Ding, K., Zhang, J., Bian, X., Xu, J., 2014. A simplified model forphotovoltaic modules based on improved translation equations. Sol.Energy 101, 40–52.
Du, Y., Lu, D.D.-C., James, G., Cornforth, D.J., 2013. Modelling andanalysis of current harmonic distortion from grid connected PV invertersunder different operating conditions. Sol. Energy 94, 182–194.
Duffie, J., Beckman, W., 2006. Solar Engineering of Thermal Processes,third ed. John Wiley & Sons.
Dzimano, B.S.G., 2008. Modeling of Photovoltaic Systems. MasterThesis, Ohio State University, USA.
Edwin, F., Xiao, W., Khadkikar, V., 2012. Topology review of singlephase grid-connected module integrated converters for PV applica-tions. In: Proc. 38th IEEE Industrial Electronics Society Conf. –IECON 2012, Montreal, Canada, pp. 821–827.
Erlich, I., Kretschmann, J., Fortmann, J., Mueller-Engelhardt, S., Wrede,H., 2007. Modelling of wind turbines based on doubly-fed inductiongenerators for power system stability studies. IEEE Trans. Power Syst.22 (3), 909–919.
Fartaria, T.O., Pereira, M.C., 2013. Simulation and computation ofshadow losses of direct normal, diffuse solar radiation and albedo in aphotovoltaic field with multiple 2-axis trackers using ray tracingmethods. Sol. Energy 91, 93–101.
Fialho, L., Melıcio, R., Mendes, V.M.F., Figueiredo, J., Collares-Pereira,M., 2014a. Amorphous solar modules simulation and experimentalresults: effect of shading. In: Camarinha-Matos, L.M., Barrento, N.S.,Mendonca, R. (Eds.), Technological Innovation for Collective Aware-ness Systems. Springer, Heidelberg, pp. 315–323.
Fialho, L., Melıcio, R., Mendes, V.M.F., 2014b. PV system modeling byfive parameters and in situ test. In: Proc. 22th International Sympo-sium on Power Electronics, Electrical Drives, Automation and Motion– Speedam 2014, Ischia, Italy, pp. 1–6.
Giacobbe, L., 2005. Validacao de modelos matematicos de componentesde sistemas fotovoltaicos, Master Thesis, Instituto Superior Tecnico/DEEC, Portugal.
Hasanzadeh, A., Edrington, C.S., Bevis, T., 2012. Comprehensive studyof power quality criteria generated by PV converters and theirimpacts on distribution transformers. In: Proc. 37th IEEE IndustrialElectronics Society Conf. – IECON 2012, Montreal, Canada, pp.5820–5826.
Hassaine, L., Olias, E., Quintero, J., Salas, V., 2014. Overview of powerinverter topologies and control structures for grid connected photo-voltaic systems. Renew. Sustain. Energy Rev. 30, 796–807.
IEC 60891, 2009. Procedures for Temperature and Irradiance Correctionsto Measured I–V Characteristics of Crystalline Silicon PhotovoltaicDevices.
IEC 60904-3, 2008. Photovoltaic Devices – Part 3: Measurement Princi-ples for Terrestrial Photovoltaic (PV) Solar Devices with ReferenceSpectral Irradiance Data.
Ismail, M.S., Moghavvemi, M., Mahlia, T.M.I., 2013. Design of anoptimized photovoltaic and microturbine hybrid power system for aremote small community: case study of Palestine. Energy Convers.Manage. 75, 271–281.
Isofoton SA. <http://www.isofoton.com>.Jiang, J.A., Huang, T.L., Hsiao, Y.T., Chen, C.H., 2005. Maximum power
tracking for photovoltaic power systems. Tamkang J. Sci. Eng. 8 (2),147–153.
Kaneka Solar Energy. <http://www.kaneka-solar.com>.Kazem, H.A., Khatib, T., 2013. Techno-economical assessment of grid
connected photovoltaic power systems productivity in Sohar, Oman.Sustain. Energy Technol. Assess. 3, 61–65.
Khan, F., Baek, S.-Ho., Park, Y., Kim, J.H., 2013. Extraction of diodeparameters of silicon solar cells under high illumination conditions.Energy Convers. Manage. 76, 421–429.
Khatib, T., Mohamed, A., Sopian, K., 2013. A review of photovoltaicsystems size optimization techniques. Renew. Sustain. Energy Rev. 22,454–465.
Kjaer, S.B., Pedersen, J.K., Blaabjerg, F., 2002. Power inverter topologiesfor photovoltaic modules – a review. In: Proc. 37th IEEE IndustryApplications Conf., Pittsburgh, USA, pp. 782–788.
Kjaer, S.B., Pedersen, J.K., Blaabjerg, F., 2005. A review of single-phasegrid-connected inverters for photovoltaic modules. IEEE Trans. Ind.Appl. 41, 1292–1306.
Liu, Y.-H., Chen, J.-H., Huang, J.-W., 2014. Global maximum powerpoint tracking algorithm for PV systems operating under partiallyshaded conditions using the segmentation search method. Sol. Energy103, 350–363.
Marion, B., 2002. A method for modeling the current–voltage curve of aPV module for outdoor conditions. Prog. Photovoltaics Res. Appl. 10(3), 205–214.
Melıcio, R., Mendes, V.M.F., 2007. Simulation of power converters forwind energy systems. Inform. Tecnol. 18, 25–34.
Moradi, M.H., Tousi, S.M.R., Nemati, M., Basir, N.S., Shalavi, N., 2013.A robust hybrid method for maximum power point tracking inphotovoltaic systems. Sol. Energy 94, 266–276.
Morales-Acevedo, A., 2006. Solar renewable energy news internationalconference (SREN-2005). Sol. Energy 80, 627–628.
Patrao, I., Figueres, E., Gonzalez-Espın, F., Garcera, G., 2011. Trans-formerless topologies for grid-connected single-phase photovoltaicinverters. Renew. Sustain. Energy Rev. 15, 3423–3431.
Pecas Lopes, J., Hatziargyriou, N., Mutale, J., Djapic, P., Jenkins, N.,2007. Integrating distributed generation into electric power systems: areview of drivers, challenges and opportunities. Electric Power Syst.Res. 77, 1189–1203.
Photowatt. <http://www.photowatt.com>.Raj, J.S.C.M., Jeyakumar, A.E., 2014. A two stage successive estimation
based maximum power point tracking technique for photovoltaicmodules. Sol. Energy 103, 43–61.
Rampinelli, G.A., Krenzinger, A., Chenlo Romero, F., 2014. Mathemat-ical models for efficiency of inverters used in grid connected photo-voltaic systems. Renew. Sustain. Energy Rev. 34, 578–587.
Rauschenbach, H.S., 1980. The Principles and Technology of Photovol-taic Energy Conversion, Solar Cell Array Design Handbook. Springer.
Razkov, T.M., Ferekides, C.S., Morel, D., Stefanakos, E., Ullal, H.S.,Upadhyaya, H.M., 2011. Solar photovoltaic electricity: current statusand future prospects. Sol. Energy 85, 1580–1608.
Rus-Casas, C., Aguilar, J.D., Rodrigo, P., Almonacid, F., Perez-Higueras,P.J., 2014. Classification of methods for annual energy harvestingcalculations of photovoltaic generators. Energy Convers. Manage. 78,527–536.
594 L. Fialho et al. / Solar Energy 110 (2014) 578–594
Salas, V., Alonso-Abella, M., Olıas, E., Chenlo, F., Barrado, A., 2007. DCcurrent injection into the network from PV inverters of <5 kW for low-voltage small grid-connected PV systems. Sol. Energy Mater. Sol. Cells91, 801–806.
Schuco. <http://www.schueco.com>.Sedra, A.S., Smith, K.C., 2006. Microelectronic Circuits. Oxford Univ.
Press, London, UK.Seixas, M., Melıcio, R., Victor, V.M.F., 2014. Fifth harmonic and sag
impact on PMSG wind turbines with a balancing new strategy forcapacitor voltages. Energy Convers. Manage. 74, 721–730.
Silva, J., Pinto, S., 2007. Control methods for switching power converters.In: Rashid, M.H. (Ed.), Handbook of Power Electronics. AcademicPress, New York, pp. 935–998.
Spertino, F., Leo, P.D., Corona, F., Papandrea, F., 2012. Inverters forgrid connection of photovoltaic systems and power quality: casestudies. In: Proc. 3rd IEEE International Symposium on PowerElectronics for Distributed Generation Systems (PEDG), pp. 564–569.
Spertino, F., Leo, P.D., Cocina, V., 2014. Which are the constraints to thephotovoltaic grid-parity in the main European markets? Sol. Energy105, 390–400.
Tsang, K.M., Chan, W.L., 2014. Rapid islanding detection using multi-level inverter for grid-interactive PV system. Energy Convers. Manage.77, 278–286.
Tyukhov, I., 2010. Advanced solar energy and educational technology.Glob. J. Technol. Optimiz. 1, 2–9.
Velasco, D., Trujillo, C.L., Garcera, G., Figueres, E., 2010. Review ofanti-islanding techniques in distributed generators. Renew. Sustain.Energy Rev. 14, 1608–1614.
Viveiros, C., Melıcio, R., Mendes, V.M.F., 2014. Fuzzy, integer andfractional order control: application on a wind turbine benchmarkmodel. In: Proc. 19th International Conference on Methods andModels in Automation and Robotics – Mmar 2014, Mi’dzyzdroje,Poland, pp. 252–257.
Viveiros, C., Melıcio, R., Mendes, V.M.F., 2015. On wind turbine modelpredictive pitch control: an event-based simulation approach. In:Moreira, A.P., Matos, A., Veiga, G. (Eds.), Lecture Notes in ElectricalEngineering. Springer, Switzerland, pp. 91–100.
Zeng, Z., Yang, H., Zao, R., Cheng, C., 2013. Topologies and controlstrategies of multi-functional grid-connected inverters for powerquality enhancement: a comprehensive review. Renew. Sustain. EnergyRev. 24, 223–270.
Related Documents


![Design of Grid-Connected Photovoltaic System · weight of photovoltaic system [7]. The grid[6] -connected photovoltaic systems also need the inverters for power conversion, grid interconnection](https://static.cupdf.com/doc/110x72/5fba0adb999fbb3bbe303c6e/design-of-grid-connected-photovoltaic-system-weight-of-photovoltaic-system-7.jpg)