A SIMPLE SEISMIC PERFORMANCE ASSESSMENT TECHNIQUE FOR UNREINFORCED BRICK MASONRY STRUCTURES A THESIS SUBMITTED TO THE GRADUATE SCHOOL OF NATURAL AND APPLIED SCIENCES OF MIDDLE EAST TECHNICAL UNIVERSITY BY ALPER ALDEMIR IN PARTIAL FULFILLMENT OF THE REQUIREMENTS FOR THE DEGREE OF MASTER OF SCIENCE IN CIVIL ENGINEERING SEPTEMBER 2010

Welcome message from author
This document is posted to help you gain knowledge. Please leave a comment to let me know what you think about it! Share it to your friends and learn new things together.
Transcript

A SIMPLE SEISMIC PERFORMANCE ASSESSMENT TECHNIQUE FOR
UNREINFORCED BRICK MASONRY STRUCTURES
A THESIS SUBMITTED TO
THE GRADUATE SCHOOL OF NATURAL AND APPLIED SCIENCES
OF
MIDDLE EAST TECHNICAL UNIVERSITY
BY
ALPER ALDEMIR
IN PARTIAL FULFILLMENT OF THE REQUIREMENTS
FOR
THE DEGREE OF MASTER OF SCIENCE
IN
CIVIL ENGINEERING
SEPTEMBER 2010
Approval of the thesis:
A SIMPLE SEISMIC PERFORMANCE ASSESSMENT TECHNIQUE FOR
UNREINFORCED BRICK MASONRY STRUCTURES
Submitted by ALPER ALDEMIR in partial fulfillment of the requirements for the
degree of Master of Science in Civil Engineering Department, Middle East
Technical University by,
Prof. Dr. Canan Özgen ____________________
Dean, Graduate School of Natural and Applied Sciences
Prof. Dr. Güney Özcebe ____________________
Head of Department, Civil Engineering
Assoc. Prof. Dr. Murat Altuğ Erberik ____________________
Supervisor, Civil Engineering Dept., METU
Examining Committee Members:
Prof. Dr. Haluk Sucuoğlu _____________________
Civil Engineering Dept., METU
Assoc. Prof. Dr. Murat Altuğ Erberik _____________________
Civil Engineering Dept., METU
Assoc. Prof. Dr. Barış Binici _____________________
Civil Engineering Dept., METU
Assoc. Prof. Dr. Ahmet Türer _____________________
Civil Engineering Dept., METU
Assoc. Prof. Dr. Hasan Hüsnü Korkmaz _____________________
Civil Engineering Dept., Selçuk University
Date: Sep 16, 2010

iii
I hereby declare that all information in this document has been obtained and
presented in accordance with academic rules and ethical conduct. I also declare
that, as required by these rules and conduct, I have fully cited and referenced
all material and results that are not original to this work.
Name, Last name: Alper ALDEMIR
Signature

iv
ABSTRACT
A SIMPLE SEISMIC PERFORMANCE ASSESSMENT TECHNIQUE FOR
UNREINFORCED BRICK MASONRY STRUCTURES
Aldemir, Alper
M.Sc., Department of Civil Engineering
Supervisor: Assoc. Prof. Dr. Murat Altuğ Erberik
September 2010, 142 pages
There are many advantages of masonry construction like widespread geographic
availability in many forms, colors and textures, comparative cheapness, fire
resistance, thermal and sound insulation, durability, etc. For such reasons, it is still a
commonly used type of residential construction in rural and even in urban regions.
Unfortunately, its behavior especially under the effect of earthquake ground motions
has not been identified clearly because of its complex material nature. Hence, the
masonry buildings with structural deficiencies belong to the most vulnerable class of
structures which have experienced heavy damage or even total collapse in previous
earthquakes, especially in developing countries like Turkey. This necessitates new
contemporary methods for designing safer masonry structures or assessing their
performance. Considering all these facts, this study aims at the generation of a new
performance-based technique for unreinforced brick masonry structures. First,
simplified formulations are recommended to estimate idealized capacity curve
parameters of masonry components (piers) by using the finite element analysis

v
results of ANSYS and regression analysis through SPSS software. Local limit states
for individual masonry piers are also obtained. Then, by combining the component
behavior, lateral capacity curve of the masonry building is constructed together with
the global limit states. The final step is to define seismic demand of the design
earthquake from the building through TEC2007 method. By using this simple
technique, a large population of masonry buildings can be examined in a relatively
short period of time noting that the performance estimations are quite reliable since
they are based on sophisticated finite element analysis results.
Keywords: Unreinforced Masonry Buildings, Masonry Pier, Seismic Performance,
Capacity Curve, In-plane Behavior
vi
ÖZ
TUĞLA YIĞMA YAPILAR ĠÇĠN BASĠT BĠR DEPREM PERFORMANSI
DEĞERLENDĠRME YÖNTEMĠ
Aldemir, Alper
Yüksek Lisans, Ġnşaat Mühendisliği Bölümü
Tez Yöneticisi: Doç.Dr. Murat Altuğ Erberik
Eylül 2010, 142 sayfa
Yığma yapıların, ısı ve ses izolasyonuna sahip olması, göreceli olarak ekonomik
olması, yangına karşı dayanıklılığı, her türlü form, şekil ve renkte üretilebilmesi gibi
pek çok avantajı bulunmaktadır. Bundan dolayı bu yapılar hem kırsal hem de kentsel
alanlarda hala çokça tercih edilmektedirler. Maalesef bu tip yapıların deprem yer
hareketi etkisi altındaki davranışları karmaşık malzeme özelliklerinden dolayı tam
olarak açıklanamamıştır. Bundan ötürü yapısal olarak eksiklikleri bulunan yığma
yapılar, depremler sonrası en çok hasar gören yapı tipleridir. Yatay yükler altında
zayıf davranış gösteren bu yapıların daha iyi tasarlanması ya da daha önceden
belirlenmiş yük etkilerinin altında nasıl davranacağının değerlendirilmesi için güncel
metotların geliştirilmesi gerekmektedir. Tüm bu yukarıdaki eksiklikleri göz önüne
alarak bu araştırmada tuğla yığma yapıların değerlendirilmesine olanak sağlayan
performansa dayalı yeni bir metot geliştirilmesi hedef olarak seçilmiştir. Öncelikle
ANSYS’te yapılan sonlu eleman analizlerini ve elde edilen sonuçların SPSS’teki
regresyon analizlerini kullanarak yığma yapılarda bulunan dikey elemanların

vii
kapasite eğrilerini belirlemek için basitleştirilmiş bir yöntem geliştirilmiştir. Aynı
zamanda herbir dikey elemanın performans limitleri de elde edilmiştir. Tüm
elemanların etkileri birleştirilerek binanın performans noktaları ve kapasite eğrisi
oluşturulmuştur. Son aşamada ise binanın olası bir deprem altındaki performansı
TEC2007’deki metotlar kullanılarak belirlenmiştir. Bu basit metotla amaçlanan
birçok yığma yapının çok kısa bir zaman içinde incelenebilmesidir. Ayrıca bu
değerlendirme komplike sonlu eleman analiz sonuçlarına dayandığı için oldukça
güvenilirdir.
Anahtar Kelimeler: Yığma Yapılar, Yığma Duvar, Sismik Performans, Kapasite
Eğrisi, Düzlemsel Davranış

viii
To My Family

ix
ACKNOWLEDGMENT
The author wishes to express his deepest gratitude to his supervisor Assoc.Prof.Dr.
Murat Altuğ Erberik for his guidance, careful supervision, criticisms, patience and
insight throughout the research.
The author would also like to thank Prof.Dr. Haluk Sucuoğlu for his willingness to help,
and comments.
The assistance of Ġlker Kazaz when solving the problems related to the finite element
program utilized throughout this study is gratefully acknowledged.
My special thanks go to Taylan Solmaz, Ġsmail Ozan Demirel, Andaç Lüleç, Emre
Özkök, Efe Gökçe Kurt, Emrah Erşan Erdoğan and Uğur Akpınar. I will always
remember with pleasure the inspiring discussions and activities we had.
My deepest gratitude goes to my family for their constant support and
encouragement. This dissertation would not have been possible without them.
The author wishes to thank in particular all those people whose friendly assistance and
wise guidance supported him throughout the duration of this research.
x
TABLE OF CONTENTS
ABSTRACT .............................................................................................................. IV
ÖZ .............................................................................................................................. VI
ACKNOWLEDGMENT ......................................................................................... IX
LIST OF TABLES ................................................................................................. XII
LIST OF FIGURES .............................................................................................. XIV
LIST OF SYMBOLS / ABBREVATIONS ......................................................... XIX
CHAPTERS
1. INTRODUCTION .................................................................................................. 1
1.1. Non-engineered Construction in general .......................................................... 1
1.2. Performance-based Design and Assessment Techniques in general .............. 2
1.3. Objective and Scope ............................................................................................ 4
2. CODES AND STANDARDS FOR DESIGN OF MASONRY STRUCTURES 7
2.1. Introduction ......................................................................................................... 7
2.2. International Codes and Standards ................................................................... 8
2.3. National Codes and Standards ........................................................................... 9
2.4. Comparison of Codes and Standards for Design of Masonry Structures ... 10 2.4.1. Number of Stories ......................................................................................... 10
2.4.2. Storey Height ................................................................................................ 12
2.4.3. Strength Requirements for Masonry Units ................................................... 13
2.4.4. Minimum Thickness of Load-Bearing Walls ................................................ 17
2.4.5. Minimum Required Length of Load-Bearing Walls ..................................... 18
2.4.6. Openings and Maximum Unsupported Length of Load Bearing Walls ....... 20
2.5. Critique about the State of Masonry Design in Turkey ................................ 23
3. NEW CONCEPTS FOR DESIGN AND ANALYSIS OF MASONRY
STRUCTURES ......................................................................................................... 26
3.1. Introduction ....................................................................................................... 26
3.2. Force-based vs. Displacement-based Design Procedures .............................. 26 3.2.1. Force-based Design ..................................................................................... 26
3.2.2. Displacement-based Design ......................................................................... 30
3.2.2.1. Nonlinear Static Procedure (NSP) ........................................................ 30
3.2.2.2. Nonlinear Dynamic Procedure (NDP) .................................................. 32
3.2.2.3. Incremental Dynamic Analysis (IDA) .................................................. 34
3.3. In-plane Behavior of Masonry Walls in General ........................................... 36 3.3.1. Sliding Mechanism ....................................................................................... 37
3.3.2. Diagonal Tension Mechanism ..................................................................... 38
3.3.3. Rocking Mechanism ..................................................................................... 39
3.4. Attainment of Performance Limit States for Masonry Walls ....................... 41
3.5. Different Modeling Strategies .......................................................................... 47 3.5.1. Lumped Plasticity ......................................................................................... 48
xi
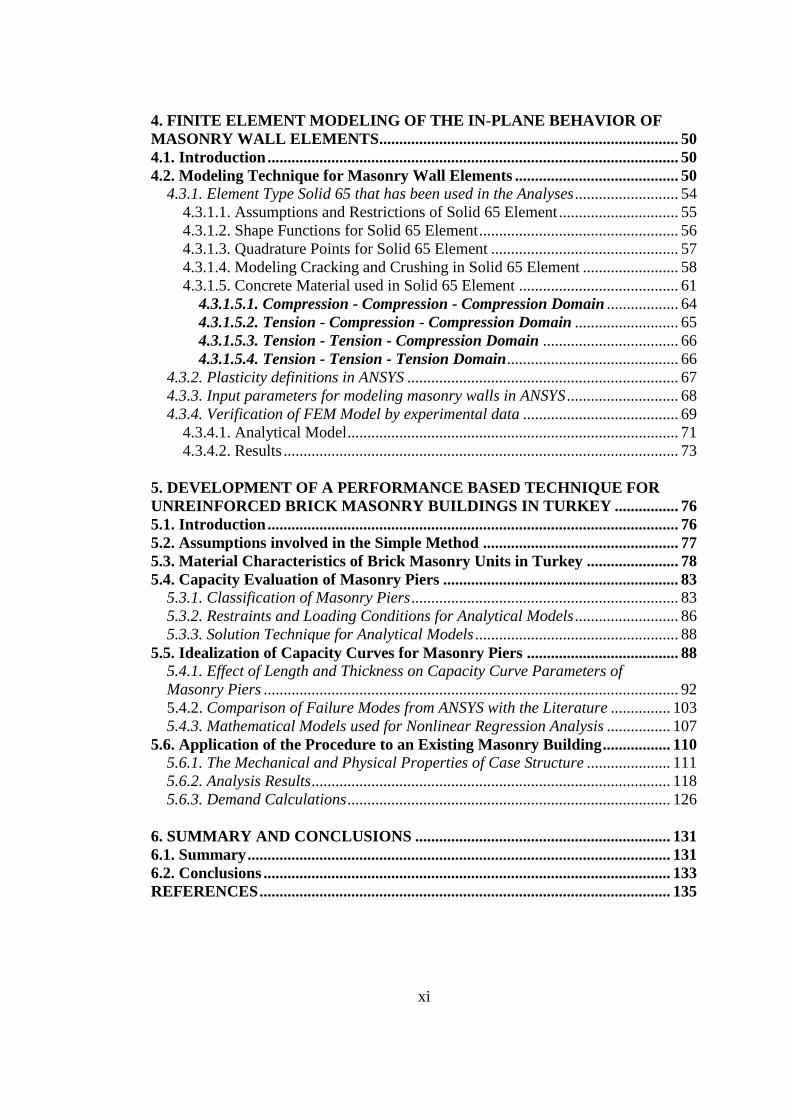
4. FINITE ELEMENT MODELING OF THE IN-PLANE BEHAVIOR OF
MASONRY WALL ELEMENTS ........................................................................... 50
4.1. Introduction ....................................................................................................... 50
4.2. Modeling Technique for Masonry Wall Elements ......................................... 50 4.3.1. Element Type Solid 65 that has been used in the Analyses .......................... 54
4.3.1.1. Assumptions and Restrictions of Solid 65 Element .............................. 55
4.3.1.2. Shape Functions for Solid 65 Element .................................................. 56
4.3.1.3. Quadrature Points for Solid 65 Element ............................................... 57
4.3.1.4. Modeling Cracking and Crushing in Solid 65 Element ........................ 58
4.3.1.5. Concrete Material used in Solid 65 Element ........................................ 61
4.3.1.5.1. Compression - Compression - Compression Domain .................. 64
4.3.1.5.2. Tension - Compression - Compression Domain .......................... 65
4.3.1.5.3. Tension - Tension - Compression Domain .................................. 66
4.3.1.5.4. Tension - Tension - Tension Domain ........................................... 66
4.3.2. Plasticity definitions in ANSYS .................................................................... 67
4.3.3. Input parameters for modeling masonry walls in ANSYS ............................ 68
4.3.4. Verification of FEM Model by experimental data ....................................... 69
4.3.4.1. Analytical Model ................................................................................... 71
4.3.4.2. Results ................................................................................................... 73
5. DEVELOPMENT OF A PERFORMANCE BASED TECHNIQUE FOR
UNREINFORCED BRICK MASONRY BUILDINGS IN TURKEY ................ 76
5.1. Introduction ....................................................................................................... 76
5.2. Assumptions involved in the Simple Method ................................................. 77
5.3. Material Characteristics of Brick Masonry Units in Turkey ....................... 78
5.4. Capacity Evaluation of Masonry Piers ........................................................... 83 5.3.1. Classification of Masonry Piers ................................................................... 83
5.3.2. Restraints and Loading Conditions for Analytical Models .......................... 86
5.3.3. Solution Technique for Analytical Models ................................................... 88
5.5. Idealization of Capacity Curves for Masonry Piers ...................................... 88 5.4.1. Effect of Length and Thickness on Capacity Curve Parameters of
Masonry Piers ........................................................................................................ 92
5.4.2. Comparison of Failure Modes from ANSYS with the Literature ............... 103
5.4.3. Mathematical Models used for Nonlinear Regression Analysis ................ 107
5.6. Application of the Procedure to an Existing Masonry Building ................. 110 5.6.1. The Mechanical and Physical Properties of Case Structure ..................... 111
5.6.2. Analysis Results .......................................................................................... 118
5.6.3. Demand Calculations ................................................................................. 126
6. SUMMARY AND CONCLUSIONS ................................................................ 131
6.1. Summary .......................................................................................................... 131
6.2. Conclusions ...................................................................................................... 133
REFERENCES ....................................................................................................... 135
xii
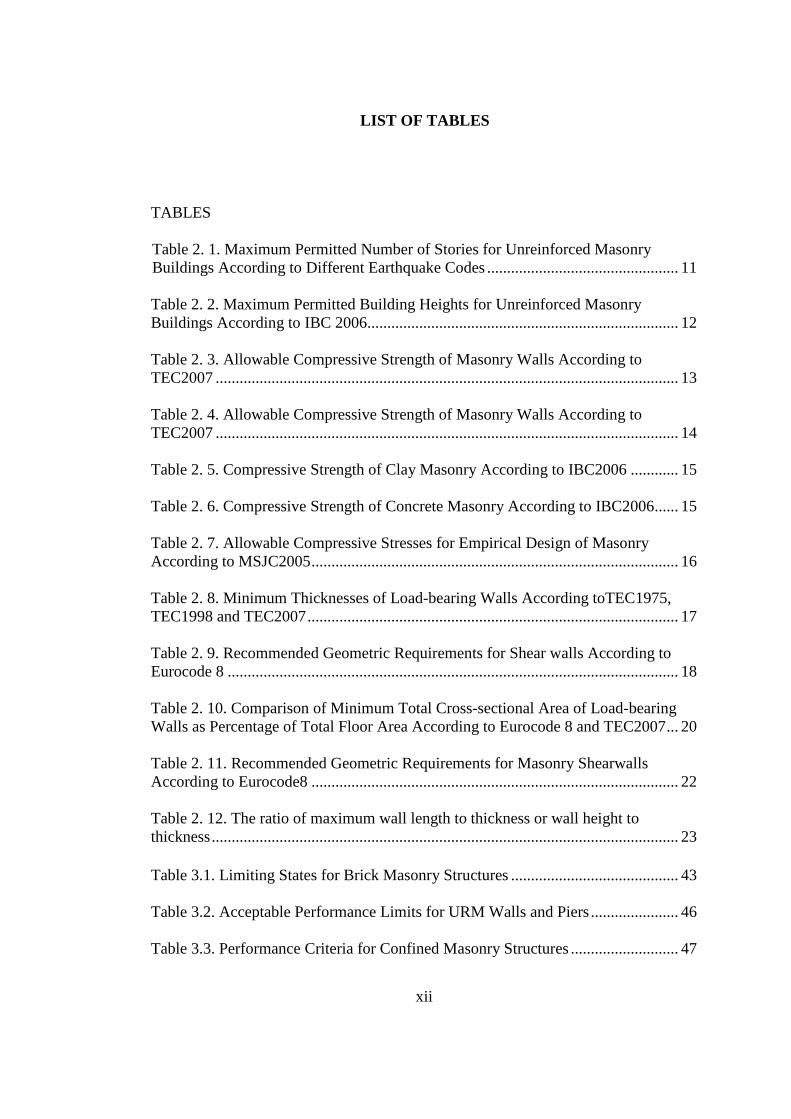
LIST OF TABLES
TABLES
Table 2. 1. Maximum Permitted Number of Stories for Unreinforced Masonry
Buildings According to Different Earthquake Codes ................................................ 11
Table 2. 2. Maximum Permitted Building Heights for Unreinforced Masonry
Buildings According to IBC 2006.............................................................................. 12
Table 2. 3. Allowable Compressive Strength of Masonry Walls According to
TEC2007 .................................................................................................................... 13
Table 2. 4. Allowable Compressive Strength of Masonry Walls According to
TEC2007 .................................................................................................................... 14
Table 2. 5. Compressive Strength of Clay Masonry According to IBC2006 ............ 15
Table 2. 6. Compressive Strength of Concrete Masonry According to IBC2006...... 15
Table 2. 7. Allowable Compressive Stresses for Empirical Design of Masonry
According to MSJC2005 ............................................................................................ 16
Table 2. 8. Minimum Thicknesses of Load-bearing Walls According toTEC1975,
TEC1998 and TEC2007 ............................................................................................. 17
Table 2. 9. Recommended Geometric Requirements for Shear walls According to
Eurocode 8 ................................................................................................................. 18
Table 2. 10. Comparison of Minimum Total Cross-sectional Area of Load-bearing
Walls as Percentage of Total Floor Area According to Eurocode 8 and TEC2007 ... 20
Table 2. 11. Recommended Geometric Requirements for Masonry Shearwalls
According to Eurocode8 ............................................................................................ 22
Table 2. 12. The ratio of maximum wall length to thickness or wall height to
thickness ..................................................................................................................... 23 Table 3.1. Limiting States for Brick Masonry Structures .......................................... 43
Table 3.2. Acceptable Performance Limits for URM Walls and Piers ...................... 46
Table 3.3. Performance Criteria for Confined Masonry Structures ........................... 47
xiii
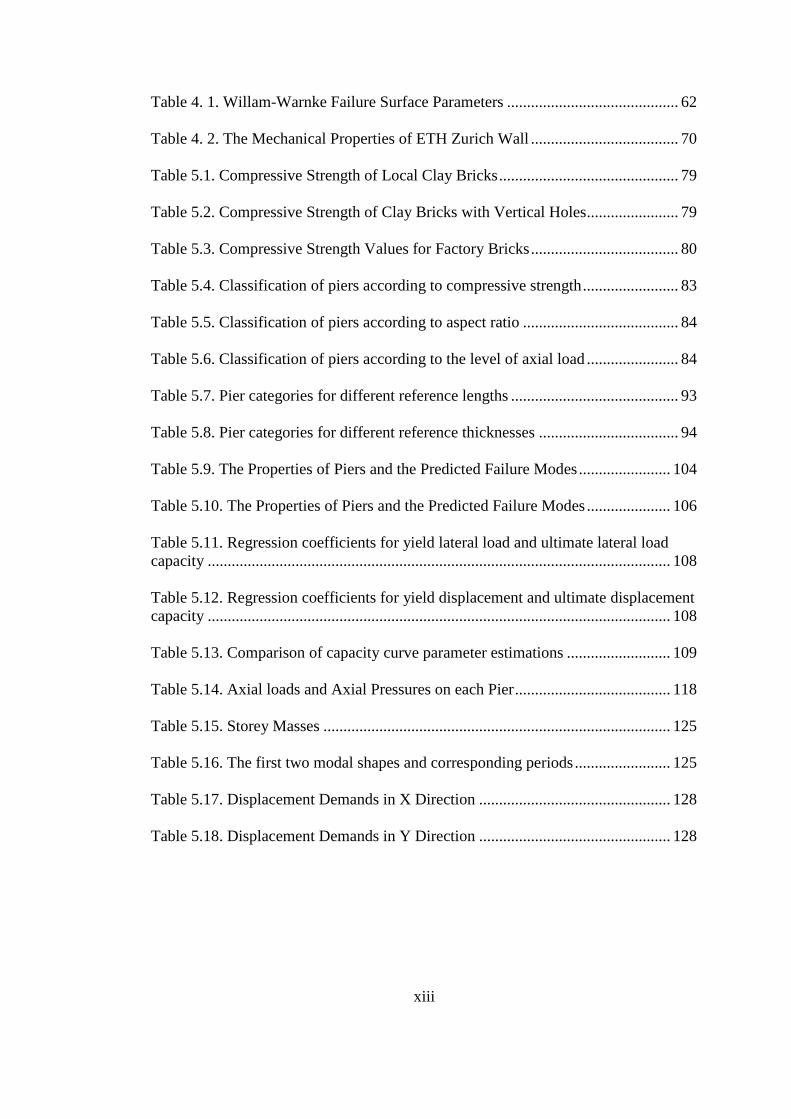
Table 4. 1. Willam-Warnke Failure Surface Parameters ........................................... 62
Table 4. 2. The Mechanical Properties of ETH Zurich Wall ..................................... 70
Table 5.1. Compressive Strength of Local Clay Bricks ............................................. 79
Table 5.2. Compressive Strength of Clay Bricks with Vertical Holes....................... 79
Table 5.3. Compressive Strength Values for Factory Bricks ..................................... 80
Table 5.4. Classification of piers according to compressive strength ........................ 83
Table 5.5. Classification of piers according to aspect ratio ....................................... 84
Table 5.6. Classification of piers according to the level of axial load ....................... 84
Table 5.7. Pier categories for different reference lengths .......................................... 93
Table 5.8. Pier categories for different reference thicknesses ................................... 94
Table 5.9. The Properties of Piers and the Predicted Failure Modes ....................... 104
Table 5.10. The Properties of Piers and the Predicted Failure Modes ..................... 106
Table 5.11. Regression coefficients for yield lateral load and ultimate lateral load
capacity .................................................................................................................... 108
Table 5.12. Regression coefficients for yield displacement and ultimate displacement
capacity .................................................................................................................... 108
Table 5.13. Comparison of capacity curve parameter estimations .......................... 109
Table 5.14. Axial loads and Axial Pressures on each Pier ....................................... 118
Table 5.15. Storey Masses ....................................................................................... 125
Table 5.16. The first two modal shapes and corresponding periods ........................ 125
Table 5.17. Displacement Demands in X Direction ................................................ 128
Table 5.18. Displacement Demands in Y Direction ................................................ 128

xiv
LIST OF FIGURES
FIGURES
Figure 2.1. Minimum Total Length of Load Bearing Walls ...................................... 19
Figure 2.2. The Wall and Void Length Rules According to TEC2007...................... 21
Figure 3.1. Equivalent Lateral Loading ..................................................................... 27
Figure 3.2. Force-Displacement Response of Elastic and Inelastic Systems ............. 28
Figure 3.3. Lateral Loading Pattern in Pushover and the Formation of First Hinge . 31
Figure 3.4. Failure Mechanisms ................................................................................. 32
Figure 3.5. Overturning moment time history under Duzce 1999 Earthquake .......... 33
Figure 3.6. Roof Displacement time history under Duzce 1999 Earthquake ............ 33
Figure 3.7. IDA curve for linear system .................................................................... 35
Figure 3.8. IDA curve for nonlinear system .............................................................. 35
Figure 3. 9. Different Failure Modes for Walls ......................................................... 40
Figure 3.10. Assumed deformed shapes for a masonry building ............................... 43
Figure 3.11. Idealization of Resistance Curve and Definition of Limit States .......... 44
Figure 3.12. Drift Ratio and Damage State Relations found from Experiments ....... 45
Figure 3.13. Idealized force-deflection curve for walls and piers.............................. 46
Figure 3.14. One Hinge Plasticity Frame Model ....................................................... 48
Figure 3.15. Three Hinge Frame Model Details ........................................................ 49
Figure 4.1. Modeling techniques for masonry structures ........................................... 51
Figure 4.2. A typical wall modeled by simplified micro-model ................................ 52
Figure 4.3. Sketch of Macro-modeling Technique .................................................... 53

xv
Figure 4.4. The Compressive Behavior of Masonry Prism, Mortar and Brick .......... 53
Figure 4.5. Solid 65 Element ..................................................................................... 54
Figure 4.6. Local and Global Coordinates of 8 - node Brick Element....................... 56
Figure 4.7. Quadrature Points used in the Solid 65 Element Solution ....................... 58
Figure 4.8. Concept of Stress Relaxation after Cracking ........................................... 59
Figure 4.9. 3D Failure Surface in Principal Stress Space .......................................... 63
Figure 4.10. Failure Surface in Principal Stress Space with nearly Biaxial Stress .... 63
Figure 4.11. A Profile of the Failure Surface ............................................................. 65
Figure 4.12. Proportional Limit and Yield Point ....................................................... 67
Figure 4.13. Sketch of Plasticity Combination done in ANSYS 11 .......................... 68
Figure 4.14. Multilinear Isotropic Plasticity Model used in Analytical Model ......... 69
Figure 4.15. The Sizes of Wall tested in ETH Zurich ................................................ 70
Figure 4.16. The Failure of Wall tested in ETH Zurich ............................................. 71
Figure 4.17. The Support Conditions and Vertical Load used in the Model ............. 72
Figure 4.18. The Different Materials used in the Model............................................ 72
Figure 4.19. The Top Displacement Application ....................................................... 73
Figure 4.20. The Capacity Curves from Analysis and Experiment ........................... 74
Figure 4.21. The Crack Pattern from the Analytical Model ...................................... 75
Figure 5.1. Stress-strain characteristics for subclasses according to compressive
strength values ............................................................................................................ 85
Figure 5.2. Typical Stress-Strain Hysteresis Curves for an Unreinforced Masonry
Wall under Pseudo-Dynamic Biaxial Compression ................................................... 86
Figure 5.3. The analytical models for a reference length=1 m and thickness=0.2 m
for different aspect ratios ........................................................................................... 87
Figure 5.4. Serviceability and Ultimate Performance Limits .................................... 90
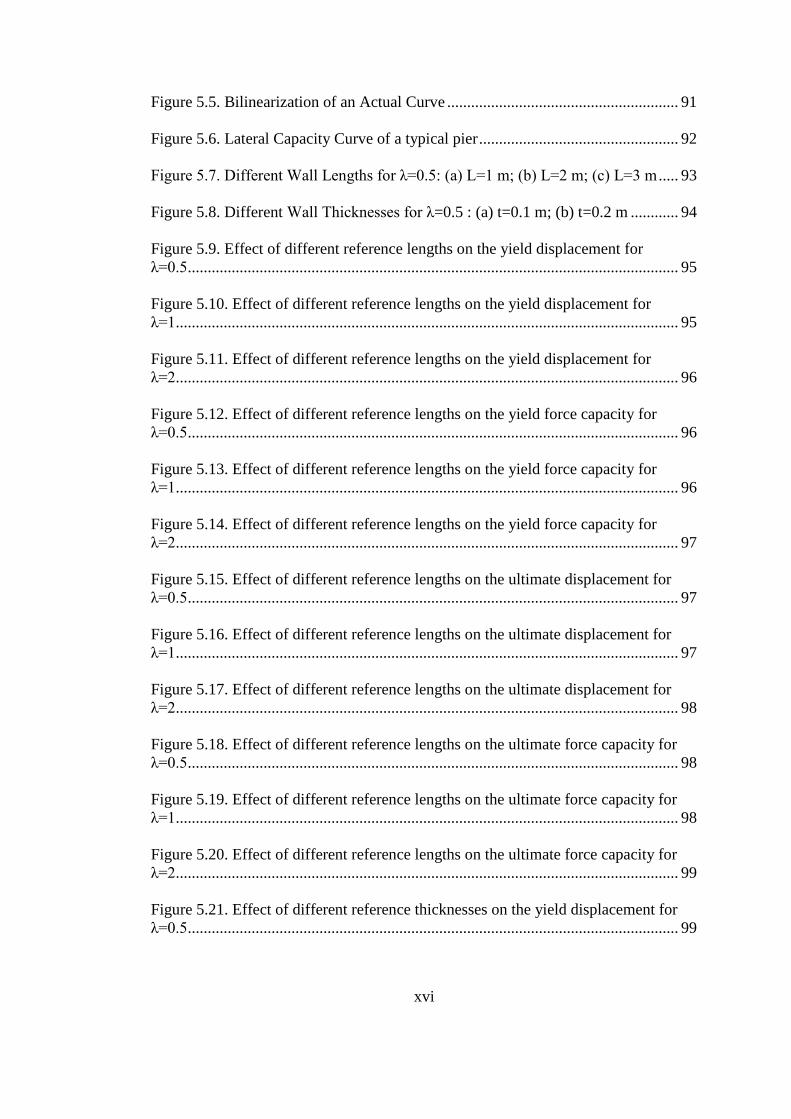
xvi
Figure 5.5. Bilinearization of an Actual Curve .......................................................... 91
Figure 5.6. Lateral Capacity Curve of a typical pier .................................................. 92
Figure 5.7. Different Wall Lengths for λ=0.5: (a) L=1 m; (b) L=2 m; (c) L=3 m ..... 93
Figure 5.8. Different Wall Thicknesses for λ=0.5 : (a) t=0.1 m; (b) t=0.2 m ............ 94
Figure 5.9. Effect of different reference lengths on the yield displacement for
λ=0.5........................................................................................................................... 95
Figure 5.10. Effect of different reference lengths on the yield displacement for
λ=1.............................................................................................................................. 95
Figure 5.11. Effect of different reference lengths on the yield displacement for
λ=2.............................................................................................................................. 96
Figure 5.12. Effect of different reference lengths on the yield force capacity for
λ=0.5........................................................................................................................... 96
Figure 5.13. Effect of different reference lengths on the yield force capacity for
λ=1.............................................................................................................................. 96
Figure 5.14. Effect of different reference lengths on the yield force capacity for
λ=2.............................................................................................................................. 97
Figure 5.15. Effect of different reference lengths on the ultimate displacement for
λ=0.5........................................................................................................................... 97
Figure 5.16. Effect of different reference lengths on the ultimate displacement for
λ=1.............................................................................................................................. 97
Figure 5.17. Effect of different reference lengths on the ultimate displacement for
λ=2.............................................................................................................................. 98
Figure 5.18. Effect of different reference lengths on the ultimate force capacity for
λ=0.5........................................................................................................................... 98
Figure 5.19. Effect of different reference lengths on the ultimate force capacity for
λ=1.............................................................................................................................. 98
Figure 5.20. Effect of different reference lengths on the ultimate force capacity for
λ=2.............................................................................................................................. 99
Figure 5.21. Effect of different reference thicknesses on the yield displacement for
λ=0.5........................................................................................................................... 99

xvii
Figure 5.22. Effect of different reference thicknesses on the yield displacement for
λ=1.............................................................................................................................. 99
Figure 5.23. Effect of different reference thicknesses on the yield displacement for
λ=2............................................................................................................................ 100
Figure 5.24. Effect of different reference thicknesses on the yield force capacity for
λ=0.5......................................................................................................................... 100
Figure 5.25. Effect of different reference thicknesses on the yield force capacity for
λ=1............................................................................................................................ 100
Figure 5.26. Effect of different reference thicknesses on the yield force capacity for
λ=2............................................................................................................................ 101
Figure 5.27. Effect of different reference thicknesses on the ultimate displacement
for λ=0.5 ................................................................................................................... 101
Figure 5.28. Effect of different reference thicknesses on the ultimate displacement
for λ=1 ...................................................................................................................... 101
Figure 5.29. Effect of different reference thicknesses on the ultimate displacement
for λ=2 ...................................................................................................................... 102
Figure 5.30. Effect of different reference thicknesses on the ultimate force capacity
for λ=0.5 ................................................................................................................... 102
Figure 5.31. Effect of different reference thicknesses on the ultimate force capacity
for λ=1 ...................................................................................................................... 102
Figure 5.32. Effect of different reference thicknesses on the ultimate force capacity
for λ=2 ...................................................................................................................... 103
Figure 5.33. The Crack Patterns ............................................................................... 105
Figure 5.34. The Total Principal Strain Vector Plots ............................................... 106
Figure 5.35. Effective Height Determination ........................................................... 110
Figure 5.36. Effective Height of a Pier and Flexurally Rigid Parts ......................... 111
Figure 5.37. Picture of the masonry building used as a case study .......................... 111
Figure 5.38. Plan View of Building ......................................................................... 113
Figure 5.39. Walls in X Direction ............................................................................ 114
xviii
Figure 5.40. Walls in Y Direction ............................................................................ 115
Figure 5.41. Effective Heights in X1 for First Storey .............................................. 116
Figure 5.42. Effective Heights in X1 for Second and Third Stories ........................ 116
Figure 5.43. Effective Heights in X2 for All Stories ............................................... 116
Figure 5.44. Effective Heights in X3 for All Stories ............................................... 117
Figure 5.45. Effective Heights in Y1, Y3 and Y5 for All Stories ............................ 117
Figure 5.46. Effective Heights in Y2 and Y4 for All Stories ................................... 117
Figure 5.47. The Comparison of Capacity Curves from ANSYS and Simple Method
for Piers working along Y direction (First Storey) .................................................. 119
Figure 5.48. The Comparison of Capacity Curves from ANSYS and Simple Method
for Piers working along X direction (First Storey) .................................................. 120
Figure 5.49. Pier Labels along X Direction ............................................................. 121
Figure 5.50. The Pier Labels along Y Direction ...................................................... 122
Figure 5.51. Diaphragm Constraints in X Direction ................................................ 122
Figure 5.52. Diaphragm Constraints in Y Direction ................................................ 123
Figure 5.53. Rigid End Zones in X direction ........................................................... 123
Figure 5.54. Rigid End Zones in Y direction ........................................................... 124
Figure 5.55. Shear Hinges in X direction ................................................................. 124
Figure 5.56. Shear Hinges in Y direction ................................................................. 125
Figure 5.57. Lateral Capacity Curves for X direction .............................................. 126
Figure 5.58. Lateral Capacity Curve for Y direction ............................................... 126
Figure 5.59. Design Spectrum for 1st Earthquake region and Z3 Class of Soil ...... 127
Figure 5.60. Lateral Capacity Curve and Roof Displacement Demand ................... 129
xix
LIST OF SYMBOLS / ABBREVATIONS
a Length of Compression Block
A Gross Floor Area
AAC Autoclave Aerated Concrete
ACI American Concrete Institute
ag Design Ground Acceleration
ai Undetermined Coefficients
ASCE American Society of Civil Engineers
Aw Cross-sectional Area of a Wall
b Shear Stress Distribution Factor
bi Undetermined Coefficients
CEN European Committee for Standardization
Ci Undetermined Coefficients in the Regression Analysis
E Young's Modulus
Em Young's Modulus of Masonry Wall
F A Function of the Principal Stress States (ζxp, ζyp, ζzp)
f’dt Lower Bound of Masonry Diagonal Tension Strength
f’m Lower Bound of Masonry Compressive Strength
f1 Compressive Strength for a State of Biaxial
Compression superimposed on Hydrostatic Stress State
f2 Compressive Strength for a State of Uniaxial
Compression superimposed on hydrostatic stress state
fa Lower Bound of Vertical Axial Compressive Stress
fb Compressive Strength of a Brick Element
fc Uniaxial Crushing Strength of a Material
fcb Biaxial Compressive Strength of a Material
Fe Elastic Force Demand
FL Loads acting on a Cross-section
fm Compressive Strength of a Masonry Wall

xx
fmt Tensile Strength of a Masonry Wall
FR Resistance or Capacity of a Cross-section
FR1 Reduced Inelastic Force Demand
ft Uniaxial Tensile Strength of a Material
Fu Ultimate Lateral Load Capacity of a Masonry Wall
Fy Yield Lateral Load Capacity of a Masonry Wall
g Gravitational Acceleration
G Shear Modulus
h Height of a Wall
heff Effective Height of a Wall
Ho Height to the Inflection Point
I Building Importance Factor
IBC International Building Code
ICC International Code Council
IDA Incremental Dynamic Analysis
L Length of a Member
L' Effective Uncracked Section Length
lb Void Length
Ld Minimum Total Length of Load-bearing Walls in any
orthogonal Direction
LDP Linear Dynamic Procedure
ln Unsupported Wall Length
LS Limit State
LSP Linear Static Procedure
lw Length of a Wall
MSJC Masonry Standards Joint Committee
Mu Flexural Strength of a Section
NDP Nonlinear Dynamic Procedure
NSP Nonlinear Static Procedure
Ntotali Total Force on a Pier at the ith Storey
p Axial Pressure on a Cross-section
P Axial Force on a Cross-section
xxi
Plb Lower Bound of Vertical Compressive Stress
Q4 Four-node Plane Element
Q6 Six-node Plane Element
R1 Reduction Factor
R2 Coefficient of Determination
Rdt Lateral Capacity of a Masonry Wall due to Diagonal
Tension Failure
Rf Lateral Capacity of a Masonry Wall due to Flexural
Failure
Rss Lateral Capacity of a Masonry Wall due to Sliding
Shear Failure
S Failure Surface expressed in terms of Principal Stresses
t Thickness of a Wall
T First Natural Vibration Period of a Structure
TA The short Characteristic Period of a Spectrum
teff Effective Thickness of a Wall
TMS The Masonry Society
uu Ultimate Displacement Capacity of a Masonry Wall
uy Yield Displacement Capacity of a Masonry Wall
URM Unreinforced Masonry
Vbo Shear Bond Strength at zero Compression
Vdt Lateral Strength limited by Diagonal Tension Stress
Vfl Ultimate Shear Capacity of a Section
Vtc Lateral Strength limited by Toe Compressive Stress
Vy Yield Lateral Force
Dependent Variable in Regression Analysis
α Effective Height Determination Factor
βc Shear Transfer Coefficient for closed Crack
βt Shear Transfer Coefficient for open Crack
η Angle of Similarity
λ Aspect Ratio of a Wall
μ Coefficient of Friction

xxii
ν Poisson's Ratio
ζh Hydrostatic Stress State
ζxp Principal Stresses in the direction x
ζy Axial Pressure
ζyp Principal Stresses in the direction y
ζzp Principal Stresses in the direction z
1
CHAPTER 1
INTRODUCTION
1.1. Non-engineered Construction in general
The non-engineered construction includes informally constructed buildings erected
by using traditional methods without involvement of engineers or architects in the
design and construction process. Any structural material, i.e. masonry, wood,
reinforced concrete, etc. could be utilized in the non-engineered buildings.
As the main subject of this study is non-engineered masonry construction, the rest of
this chapter deals with the more detailed information on masonry construction
practice.
Traditionally, masonry structures are constructed by using both lime and cement as
binding material and locally available constructional materials are tried to be selected
for economical purposes. For instance, in rocky regions, there exists hegemony of
stone buildings whereas lots of earthen buildings (adobe) are raised in districts
lacking of underground wealth.
Sometimes, reinforced concrete elements may also be seen in non-engineered
buildings. These include reinforced concrete slabs, lintels, bond beams, and tie
columns. However, these members are constructed in a traditional manner. In other
words, the lateral stabilization of these structures is not taken into consideration.
Besides, the detailing of them does not depend on any theoretical rules.
2
Most of the building stock all over the world, especially in developing countries, is
constituted by masonry structures. As it has been stated by The Masonry Society,
masonry makes up approximately 70% of the existing building inventory in the
United States. Although this percentage may have been slightly changed now, there
is no doubt that the share of masonry structures in total building stock of the United
States is still huge. Masonry construction is also very common in Mediterranean and
Central European countries with numerous historical stone and brick masonry
buildings. (Erberik et al., 2008) Most importantly, a high proportion of this masonry
stock is built without intervention by qualified technical people in design. (Arya et
al., 1986)
The importance of these non-engineered structures is also summarized by Arya et al.
(1986) :
“The safety of the non-engineered buildings from the fury of earthquakes is a subject
of highest priority in view of the fact that in the moderate to severe seismic zones of
the world more than 90% of the population is still living and working in such
buildings and that most losses of lives during earthquakes have occurred due to their
collapse. The risk to life is further increasing due to rising population particularly in
the developing countries, poverty of the people, scarcity of modern building
materials, viz. cement and steel, lack of awareness and necessary skills.”
Therefore, it is very vital to improve the traditional design concepts of these
buildings and some condition evaluation techniques to assess the readily available
individual structures or a stock of structures ought to be developed.
1.2. Performance-based Design and Assessment Techniques in general
Performance-based techniques generally aim at designing structures for the intended
level of damage or at evaluating the existing structures' performance under the effect
of anticipated loading conditions. Therefore, they all have three common stages.
1) Formation of limit state
3
2) Capacity estimation
3) Demand calculation
The first stage is to identify the design limits. Both the design engineer and the client
take part in this step. In other words, the tolerable damage level is stated by the
employer and the design engineer could come up with a structure just satisfying the
needs.
As the above steps summarize, the capacity and the demand should be determined
next. Therefore, the codes and standards recommend some methods for both the
analysis and the capacity calculations by collecting the experience gained after some
devastating earthquakes, lots of laboratory tests and traditional methods (common
practices).
Performance-based techniques are becoming more popular among the civil
engineers. This is because; unlike force-based techniques, it gives the opportunity to
design a structure for different damage states after the extreme events like
earthquakes. In other words, the most powerful aspect of this aproach is that it gives
the possibility to predict the damages. To do this, a physical parameter like
displacements, drift ratios, plastic rotations, etc. is, firstly, selected to determine the
damage levels of any members. Of course, the parameter should possess two
features.
1) It should have the largest confidence from the analysis, i.e. the parameter has
to be estimated with an acceptable error.
2) It ought to describe the damage level well.
Today, some provisions select the plastic rotations for the damage parameter but the
studies show that the commonly used analysis technique (nonlinear static analysis) is
not good at determining the plastic rotations. Thus, Chopra and Goel (2002) state that
it is preferable to use the drift ratios for the damage parameter since they are better
estimated by pushover analysis and are good indicators of damage.
4
Therefore, the weaknesses in the methods for analysis and demand calculations are
investigated and have been tried to be improved recently.
1.3. Objective and Scope
Performance-based approaches have become very popular in earthquake engineering
in both design and evaluation stages. Since performance-based approaches depend on
quantification of damage, and in turn, quantification of damage is realistically
achieved after obtaining the displacement demand of a structure, these techniques
have been successfully employed for reinforced concrete and steel frame structures.
However, masonry structures are different in the sense that they are relatively more
rigid with rather limited displacement capacity and can be regarded as non-ductile
structures, which cannot undergo significant inelastic deformations. In addition to
this, and as mentioned before, masonry structures are generally constructed without
engineering touch, so it becomes very difficult to predict the actual seismic behavior
of these structures since they involve many uncertainties. Hence implementation of
performance-based techniques to masonry structures is not straightforward as in the
case of frame structures.
Considering the above discussion, this study is an attempt to develop a performance-
based technique for unreinforced brick masonry structures. If properly adopted, it can
also be used as a design approach in the future. The technique involves the capacity
evaluation of masonry piers based on the assumption that the piers are weaker than
spandrels and the damage is accumulated in piers. In-plane behavior is obtained by
detailed finite element analysis of individual piers with different compressive
strength values, aspect ratios and vertical stress levels. Then, the in-plane capacity
curves are idealized in a bilinear fashion with four structural parameters in terms of
force and displacement. Local limit states of individual piers are also attained. The
next step is to obtain simple empirical relationships for the structural parameters in
terms of easily obtainable geometrical (length, thickness and aspect ratio) and
mechanical (compressive strength and vertical stress level) properties through
regression analyses. As the final step, the capacity curve of the building is
5
constructed by the contribution of in-plane capacity curves of individual piers
together with global limit states. Hence, it becomes possible to estimate the capacity
of a population of masonry buildings without performing detailed and time
consuming finite element analysis but by implicitly using the results of such an
elaborate method of analysis.
The proposed method is applied to an actual unreinforced brick masonry building in
Istanbul and the obtained results from both complicated ANSYS analysis and the
simplified method are in an acceptable range although the method contains major
assumptions for the sake of simplicity.
This study is mainly focused on the capacity evaluation of brick masonry buildings
and quantification of seismic demand is treated in another on-going study, but for the
sake of completeness of performance-based evaluation, at the end of the case study
section, there is a short discussion about how to handle seismic demand and capacity
together and what the output is.
The study is composed of six chapters. First chapter gives a general overview about
non-engineered construction, and in particular unreinforced masonry construction
and a brief background for performance-based design and assessment techniques.
Chapter 2 deals with codes and standards for design of masonry structures, mainly
focusing on the comparison of masonry-related documentation of the current Turkish
Earthquake Code with the international codes. At the end of the chapter, there exists
a critique about the state of masonry design in Turkey. This chapter is important to
visualize what is currently being done in Turkey for the design and evaluation of
unreinforced masonry buildings, since these two concepts cannot be clearly separated
from each other in the case of masonry buildings as they both use similar force-based
calculation procedures.
New concepts for design and analysis of masonry structures is discussed in Chapter
3, introducing displacement-based design as opposed to force-based design, which is

6
currently being used for masonry structures. All analysis tools (linear static
procedure, linear dynamic procedure, nonlinear static procedure, nonlinear dynamic
procedure and incremental dynamic analysis) used in these design approaches are
briefly explained. Then, in-plane behavior and failure modes of masonry piers are
presented together with the studies carried out for the attainment of performance
limit states of masonry piers. The final part of this chapter is devoted to modeling
strategies used for masonry structures.
Chapter 4 presents finite element modeling of in-plane behavior of masonry wall
elements. This chapter begins with a discussion about the finite element modeling
techniques for masonry wall elements. Then, the element type (Solid 65) used in the
finite element program (ANSYS) is described with all its features and limitations.
The final part of this chapter includes the verification of the finite element model
used in this study through experimental data.
Chapter 5 explains the development of the performance-based technique for
unreinforced brick masonry buildings in Turkey. The first part of this chapter
contains information about material characteristics of brick masonry units in Turkey.
Then, the capacity curve generation of masonry piers with different geometrical and
mechanical properties is conducted using finite element analysis. The next step is to
idealize analytically obtained capacity curves by using four parameters and obtain
simple empirical relationships for these structural parameters through regression
analysis. The remaining part of this chapter is devoted to the implementation of the
procedure to an existing masonry building in Istanbul.
Chapter 6 contains a brief summary of the research work and conclusions obtained
from this study.
7
CHAPTER 2
CODES AND STANDARDS FOR DESIGN OF MASONRY STRUCTURES
2.1. Introduction
Codes, standards and specifications are documents that represent “state-of-the-art”
and translate the accumulated professional and technical knowledge, and complex
research developments into simple procedures suitable for routine design process.
Hence, codes and standards are authoritative sources of information for designers
and they represent a unifying order of engineering practice. (Taly, 2000)
Design and construction of masonry requires consideration of properties and
parameters that affect the structural behavior. Increasing awareness of the seismic
risk, new geological and seismological evidences, as well as technological
developments in materials results in a design assisted by building material properties,
dynamic characteristics of the building and load deflection characteristics of building
components. Consequently, some requirements about number of stories, story
heights, strength of masonry units, minimum thickness of load-bearing walls,
minimum total length of load-bearing walls, openings in load-bearing walls etc. are
embedded into the codes empirically or analytically. (Erberik et al., 2008)
This part of the study provides a comparison of the codes and standards for
unreinforced masonry design. Since, earthquake resistant masonry design practice in
Turkey is still characterized by a rather high level of empirical requirements only for
unreinforced masonry; this part of the study is devoted to compare some basic
geometrical and mechanical requirements on masonry structures by utilizing various
codes and standards. (Erberik et al., 2008)
8
At the beginning of this chapter, the definition of simple buildings is introduced in
order to clarify the building types that will be considered in the rest of the chapter.
Afterwards, widely used codes and standards for masonry design are presented
briefly in two parts as international codes and standards and national codes and
standards.
Next, comparative information is given about various design requirements for
masonry structures present in different standards that are listed as follows: Turkish
Earthquake Code 1975 (TEC1975), 1998 (TEC1998) and 2007 (TEC2007), Masonry
Standards Joint Committee 2005 (MSJC2005), International Code Council 2006
(IBC2006) and European Committee for Standardization 2003a (Eurocode 6) and
2003b (Eurocode 8).
Final part of this chapter is devoted to a brief criticism about the state of masonry
design in Turkey.
2.2. International Codes and Standards
One of the most recognized design provisions in the United States is the International
Building Code (IBC) that has been developed by the International Code Council
(ICC). It references consensus design provisions and specifications. The first edition
of IBC was published in 2000 whereas the version investigated in this study has been
published in 2006. One chapter of IBC is devoted to masonry structures with the
requirements and definitions in terms of materials, construction, quality assurance,
seismic design, working stress design, strength design, empirical design, and non-
structural masonry.
Another important code that is widely used in the United States is the “Building
Code Requirements for Masonry Structures” that has been developed by Masonry
Standards Joint Committee (MSJC). This committee has been established by three
sponsoring societies: American Concrete Institute (ACI), American Society of Civil
9
Engineers (ASCE) and The Masonry Society (TMS). The studied version of the
MSJC code (2005) covers general building code requirements and specifications of
masonry structures, including allowable stress design, strength design, empirical
design and prestressed design of masonry. In addition to this, one chapter is devoted
to veneer and glass unit masonry. (Erberik et al., 2008)
The design of masonry structures in Mediterranean and Central European countries is
covered by the Eurocode, which is an assembly of standards for structural design
developed by the European Committee for Standardization (CEN). Eurocode 6
specially deals with masonry structures in three parts. First part consists of common
rules for reinforced and unreinforced masonry structures, whereas the second part
consists of design, selection of materials and execution of masonry. Final part
contains simplified calculation methods for unreinforced masonry structures
(European Committee for Standardization 2003a). Besides Eurocode 6, in Eurocode
8, there is a chapter that states specific rules for masonry buildings, including
materials and bonding patterns, types of construction and behavior factors, structural
analysis, design criteria and construction rules, safety verification, rules for simple
masonry buildings (European Committee for Standardization 2003b). (Erberik et al.,
2008)
2.3. National Codes and Standards
In Turkey, the first earthquake design code was published in 1940, after the
devastating Erzincan Earthquake in 1939. Although there had been some efforts to
update this immature code in 1942, 1947, 1953, 1961 and 1968, these were not
adequate to ensure the seismic safety of building structures until the release of “The
Specifications for Structures to be Built in Disaster Areas” (TEC1975) by the
Turkish Ministry of Public Works and Settlement in 1975. However, economical and
physical losses continued to increase with the occurrence of each earthquake even
afterwards. Hence, the next seismic design code (TEC1998) was published in 1998.
This code included major revisions when compared to the previous specifications
and it was more compatible with the well-recognized international codes.
10
Nevertheless, earthquake codes should be periodically updated according to the
needs of the construction industry and lessons learned during the use of the code.
Consequently, TEC1998 has also been replaced by the current code (TEC2007) in
2007. The new version of the code also includes chapters related with repair and
strengthening of existing buildings damaged by earthquakes or prone to be affected
by disasters. (Erberik et al., 2008)
In TEC1975, there was a section about the design of masonry structures with very
general terms including the number of stories, materials to be used in masonry walls,
required wall thickness, stability of walls and openings in walls. In TEC1998, the
section was edited and put into a more readable format with clear figures and there
were some additions like the calculation of minimum total length of load-bearing
walls in the direction of earthquake, recommendations for the values of the
parameters to be used in the calculation of the equivalent elastic seismic load that is
assumed to be acting on the structure and design of vertical bond beams. Finally, in
TEC2007, the most significant improvement related to the design of masonry
structures is the addition of simple procedures for the calculation of vertical and
shear stresses in masonry walls. Furthermore, the existing clauses are refined
according to the current state of practice. (Erberik et al., 2008)
2.4. Comparison of Codes and Standards for Design of Masonry Structures
This section includes a comparison of international and national codes and standards
about design of masonry structures. The comparison is based on some basic design
parameters for masonry structures: number of stories, storey height, strength
requirements for masonry units, minimum thickness of load bearing walls, minimum
required length of load-bearing walls, openings and maximum unsupported length of
load bearing walls.
2.4.1. Number of Stories
It has been observed that one of the important structural parameters that is related to
seismic damage of masonry buildings is the number of stories, in accordance with

11
the observations from previous major earthquakes in Turkey. The buildings with
three or more stories suffered severe damage whereas the buildings with one or two
stories generally exhibited adequate resistance under seismic action. In the Turkish
Earthquake Code, maximum number of stories permitted for masonry buildings
(excluding a single basement) depends on the seismic zone (Table 2.1). The
requirements for the maximum number of stories did not change from version to
version as far as Turkish Earthquake Code is concerned. In addition, the code allows
a penthouse with gross area not exceeding 25% of the building area at foundation
level. Adobe buildings are allowed with a single story excluding the basement in all
seismic zones.
Table 2.1. Maximum Permitted Number of Stories for Unreinforced Masonry
Buildings According to Different Earthquake Codes. (Seismic zones are defined
according to TEC2007 and NL means there is no limitation.) Seismic zones in terms of design ground acceleration (ag)
Zone 1
(ag ≥ 0.4g)
Zone 2
(0.3g ≤ ag < 0.4g)
Zone 3
(0.2g ≤ ag < 0.3g)
Zone 4
(0.1g ≤ ag < 0.2g)
TEC1975 2 3 3 4
TEC1998 2 3 3 4
TEC2007 2 3 3 4
Eurocode 6 2 2 NL NL
Eurocode 8 1 1 2 3
According to Tomazevic (1999), in European state-of-practice, limitations regarding
number of stories have been relaxed based on the results of recent experimental and
theoretical investigations and on improvements in technology and methods of design.
Except for unreinforced masonry located in seismic zones with design ground
acceleration (ag) equal to or greater than 0.3g (g is the gravitational acceleration),
which is not allowed for earthquake resistant walls in buildings higher than two
storeys, no limitations regarding height of masonry buildings are specified in
Eurocode 6. However, in Eurocode 8, some limitations for maximum number of
stories are given for a special class of masonry structures called as “simple
buildings”. (Table 2.1) By definition, simple buildings are structures with an
approximately regular plan and elevation, where the ratio between the length of the
long and short side is not more than 4, and the projections or recesses from the
rectangular shape are not greater than 15% of the length of side parallel to the
12
direction of projection. Simple buildings comply with the provisions regarding the
quality of masonry materials and construction rules specified in Eurocode and for
these buildings, explicit and detailed safety verifications are not mandatory. At this
point, it is important to note that simple buildings are very much alike the masonry
buildings designed according to the empirical rules of TEC2007. All comparisons are
for unreinforced masonry buildings since reinforced masonry design is not explicitly
reflected in Turkish earthquake code and also reinforced masonry construction is not
very applicable in Turkey.
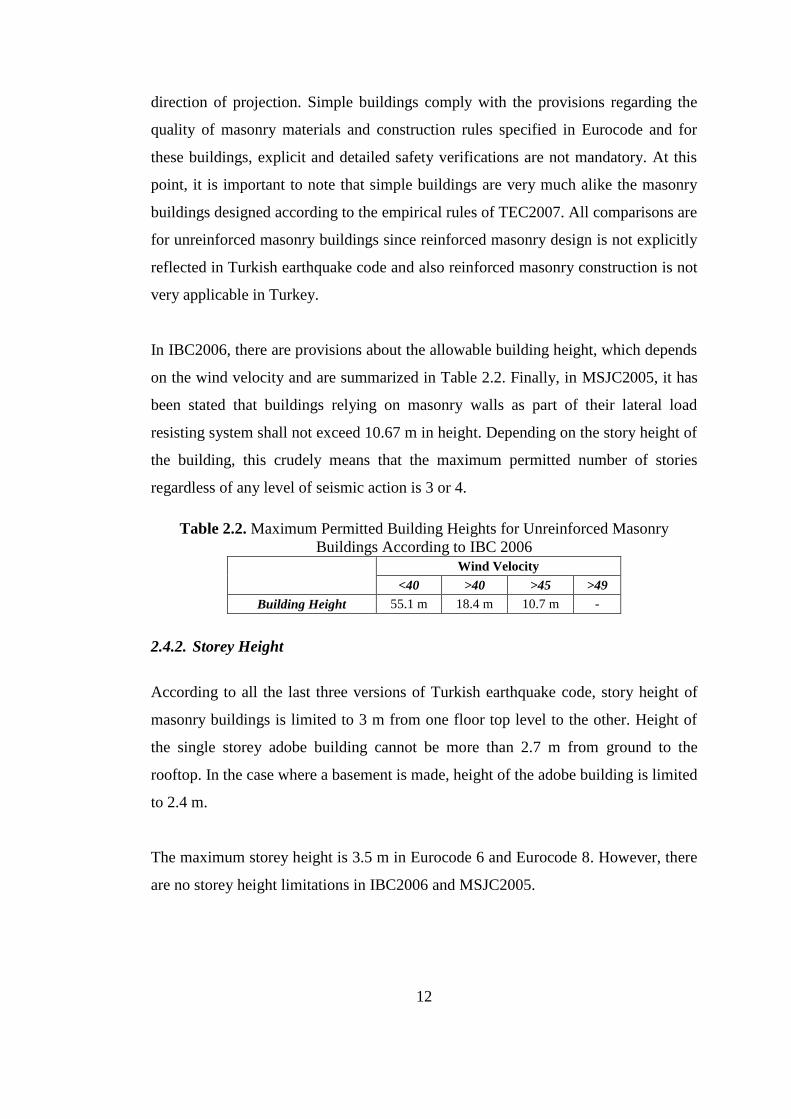
In IBC2006, there are provisions about the allowable building height, which depends
on the wind velocity and are summarized in Table 2.2. Finally, in MSJC2005, it has
been stated that buildings relying on masonry walls as part of their lateral load
resisting system shall not exceed 10.67 m in height. Depending on the story height of
the building, this crudely means that the maximum permitted number of stories
regardless of any level of seismic action is 3 or 4.
Table 2.2. Maximum Permitted Building Heights for Unreinforced Masonry
Buildings According to IBC 2006
Wind Velocity
<40 >40 >45 >49
Building Height 55.1 m 18.4 m 10.7 m -
2.4.2. Storey Height
According to all the last three versions of Turkish earthquake code, story height of
masonry buildings is limited to 3 m from one floor top level to the other. Height of
the single storey adobe building cannot be more than 2.7 m from ground to the
rooftop. In the case where a basement is made, height of the adobe building is limited
to 2.4 m.
The maximum storey height is 3.5 m in Eurocode 6 and Eurocode 8. However, there
are no storey height limitations in IBC2006 and MSJC2005.
13
2.4.3. Strength Requirements for Masonry Units
There are similar considerations about the strength requirements for masonry units in
the last three versions of Turkish earthquake code. In TEC1975, the minimum
compressive strength of structural masonry materials was limited to 5 MPa for
artificial blocks and 35 MPa for natural stones. Compressive strength of natural
stones to be used in basements was limited to 10 MPa. It was not allowed to use a
compressive strength value less than 7.5 MPa for artificial masonry materials that are
used in basements. According to TEC1998, masonry materials to be used in the
construction of load-bearing walls were natural stone, solid brick, bricks with
vertical holes satisfying the maximum void ratios defined in the relevant Turkish
standards (TS2510 and TS705), solid concrete blocks and other similar blocks. The
minimum compressive strength of structural masonry materials was limited to 5 MPa
on the basis gross compression area parallel to the direction of holes. Similarly,
compressive strength of natural stones to be used in basements was limited to 10
MPa. Finally, in TEC2007, masonry materials to be used in the construction of load-
bearing walls are defined in the same manner as it was in TEC1998 with one
exception: Turkish standard TS705 has been replaced by TS EN 771-1. The same
values have been considered for the minimum compressive strength of structural
masonry materials and compressive strength of natural stones to be used in
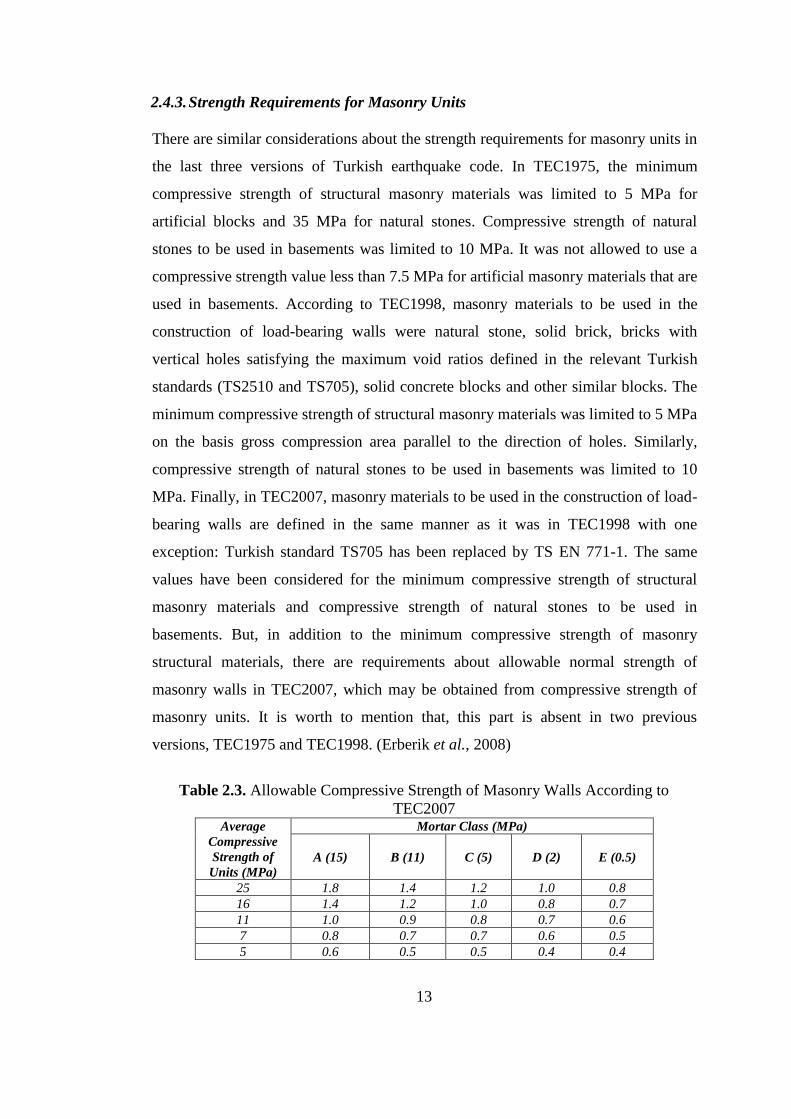
basements. But, in addition to the minimum compressive strength of masonry
structural materials, there are requirements about allowable normal strength of
masonry walls in TEC2007, which may be obtained from compressive strength of
masonry units. It is worth to mention that, this part is absent in two previous
versions, TEC1975 and TEC1998. (Erberik et al., 2008)
Table 2.3. Allowable Compressive Strength of Masonry Walls According to
TEC2007 Average
Compressive
Strength of
Units (MPa)
Mortar Class (MPa)
A (15) B (11) C (5) D (2) E (0.5)
25 1.8 1.4 1.2 1.0 0.8
16 1.4 1.2 1.0 0.8 0.7
11 1.0 0.9 0.8 0.7 0.6
7 0.8 0.7 0.7 0.6 0.5
5 0.6 0.5 0.5 0.4 0.4
14
The allowable compressive strength values can be calculated by three methods :
Walls that are constructed by using the same units and same mortar as the
designed ones are tested (Wallette Test) and the quarter of their average
strength is the allowable compressive strength of masonry wall.
If prism tests are available for the intended units and mortar, the allowable
compressive strength is the average value of prism tests divided by 8.
If neither wallette tests nor prism tests are available, the allowable compressive
strength can be taken from Table 5.2 of TEC2007. (See Table 2.3)
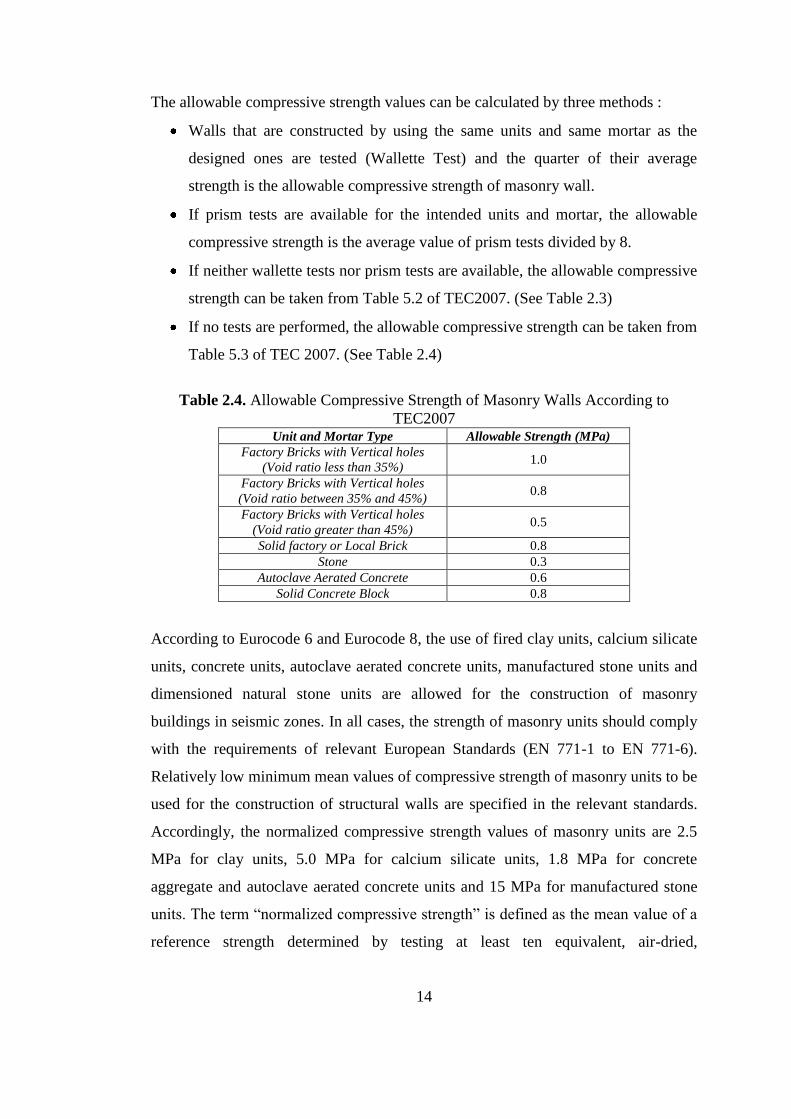
If no tests are performed, the allowable compressive strength can be taken from
Table 5.3 of TEC 2007. (See Table 2.4)
Table 2.4. Allowable Compressive Strength of Masonry Walls According to
TEC2007 Unit and Mortar Type Allowable Strength (MPa)
Factory Bricks with Vertical holes
(Void ratio less than 35%) 1.0
Factory Bricks with Vertical holes
(Void ratio between 35% and 45%) 0.8
Factory Bricks with Vertical holes
(Void ratio greater than 45%) 0.5
Solid factory or Local Brick 0.8
Stone 0.3
Autoclave Aerated Concrete 0.6
Solid Concrete Block 0.8
According to Eurocode 6 and Eurocode 8, the use of fired clay units, calcium silicate
units, concrete units, autoclave aerated concrete units, manufactured stone units and
dimensioned natural stone units are allowed for the construction of masonry
buildings in seismic zones. In all cases, the strength of masonry units should comply
with the requirements of relevant European Standards (EN 771-1 to EN 771-6).
Relatively low minimum mean values of compressive strength of masonry units to be
used for the construction of structural walls are specified in the relevant standards.
Accordingly, the normalized compressive strength values of masonry units are 2.5
MPa for clay units, 5.0 MPa for calcium silicate units, 1.8 MPa for concrete
aggregate and autoclave aerated concrete units and 15 MPa for manufactured stone
units. The term “normalized compressive strength” is defined as the mean value of a
reference strength determined by testing at least ten equivalent, air-dried,

15
100mm 100mm specimens cut from the related unit. Shape factors are also
introduced in Eurocode 6 in order to convert normalized compressive strength to the
compressive strength of a unit with actual dimensions.
Table 2.5. Compressive Strength of Clay Masonry According to IBC2006 NET AREA COMPRESSIVE STRENGTH
OF CLAY MASONRY UNITS (psi) [MPa]
NET AREA COMPRESSIVE
STRENGTH OF MASONRY (psi)
[MPa] Type M or S mortar Type N mortar
1,700 [11.71] 2,100 [14.47] 1,000 [6.89]
3,350 [23.08] 4,150 [28.59] 1,500 [10.34]
4,950 [34.11] 6,200 [42.72] 2,000 [13.78]
6,600 [45.47] 8,250 [56.84] 2,500 [17.23]
8,250 [56.84] 10,300 [70.97] 3,000 [20.67]
9,900 [68.21] - 3,500 [24.12]
13,200 [90.95] - 4,000 [27.56]
In IBC2006, the strength requirements of masonry units are determined by making
references to related specifications of the American Standards (ASTM C 62, ASTM
C 216 or ASTM C 652). However, the masonry wall strengths can be determined by
using tables in IBC 2006, which are based on the strength of masonry units and the
type of mortar. (See Table 2.5 and Table 2.6) In MSJC2005, for the strength design
of masonry, it is required that, except for architectural components of masonry, the
specified compressive strength of masonry should be equal to or more than 10.3
MPa.
Table 2.6. Compressive Strength of Concrete Masonry According to IBC2006 NET AREA COMPRESSIVE STRENGTH OF
CONCRETE MASONRY UNITS (psi) [MPa]
NET AREA
COMPRESSIVE
STRENGTH OF
MASONRY (psi) [MPa] Type M or S mortar Type N mortar
1,250 [8.62] 1,300 [8.96] 1,000 [6.89]
1,900 [13.1] 2,150 [14.8] 1,500 [10.34]
2,800 [19.3] 3,050 [21] 2,000 [13.78]
3,750 [25.9] 4,050 [27.9] 2,500 [17.23]
4,800 [33.1] 5,250 [36.2] 3,000 [20.67]
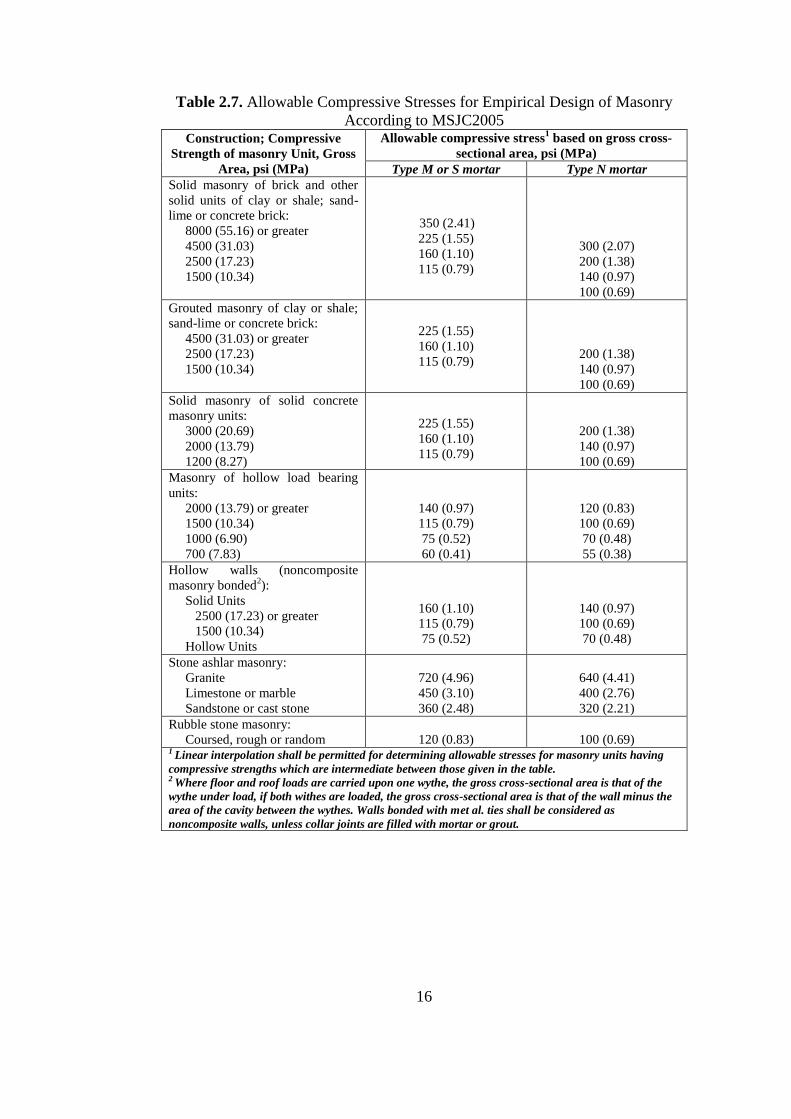
Moreover, for the empirical design of masonry walls, the masonry wall strength can
be determined as a function of the compressive strength of the masonry unit and the
type of mortar, as in the case of IBC2006. (Table 2.7)
16
Table 2.7. Allowable Compressive Stresses for Empirical Design of Masonry
According to MSJC2005 Construction; Compressive
Strength of masonry Unit, Gross
Area, psi (MPa)
Allowable compressive stress1 based on gross cross-
sectional area, psi (MPa)
Type M or S mortar Type N mortar
Solid masonry of brick and other
solid units of clay or shale; sand-
lime or concrete brick:
8000 (55.16) or greater
4500 (31.03)
2500 (17.23)
1500 (10.34)
350 (2.41)
225 (1.55)
160 (1.10)
115 (0.79)
300 (2.07)
200 (1.38)
140 (0.97)
100 (0.69)
Grouted masonry of clay or shale;
sand-lime or concrete brick:
4500 (31.03) or greater
2500 (17.23)
1500 (10.34)
225 (1.55)
160 (1.10)
115 (0.79)
200 (1.38)
140 (0.97)
100 (0.69)
Solid masonry of solid concrete
masonry units:
3000 (20.69)
2000 (13.79)
1200 (8.27)
225 (1.55)
160 (1.10)
115 (0.79)
200 (1.38)
140 (0.97)
100 (0.69)
Masonry of hollow load bearing
units:
2000 (13.79) or greater
1500 (10.34)
1000 (6.90)
700 (7.83)
140 (0.97)
115 (0.79)
75 (0.52)
60 (0.41)
120 (0.83)
100 (0.69)
70 (0.48)
55 (0.38)
Hollow walls (noncomposite
masonry bonded2):
Solid Units
2500 (17.23) or greater
1500 (10.34)
Hollow Units
160 (1.10)
115 (0.79)
75 (0.52)
140 (0.97)
100 (0.69)
70 (0.48)
Stone ashlar masonry:
Granite
Limestone or marble
Sandstone or cast stone
720 (4.96)
450 (3.10)
360 (2.48)
640 (4.41)
400 (2.76)
320 (2.21)
Rubble stone masonry:
Coursed, rough or random
120 (0.83)
100 (0.69) 1 Linear interpolation shall be permitted for determining allowable stresses for masonry units having
compressive strengths which are intermediate between those given in the table. 2 Where floor and roof loads are carried upon one wythe, the gross cross-sectional area is that of the
wythe under load, if both withes are loaded, the gross cross-sectional area is that of the wall minus the
area of the cavity between the wythes. Walls bonded with met al. ties shall be considered as
noncomposite walls, unless collar joints are filled with mortar or grout.
17
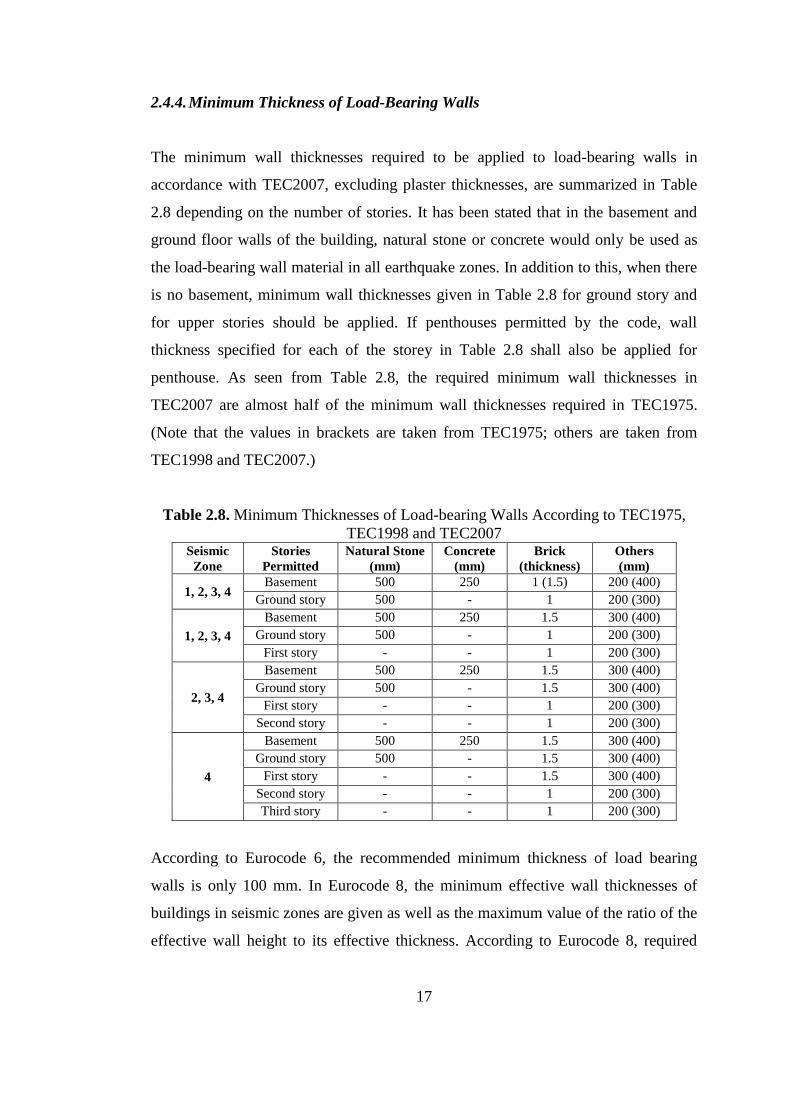
2.4.4. Minimum Thickness of Load-Bearing Walls
The minimum wall thicknesses required to be applied to load-bearing walls in
accordance with TEC2007, excluding plaster thicknesses, are summarized in Table
2.8 depending on the number of stories. It has been stated that in the basement and
ground floor walls of the building, natural stone or concrete would only be used as
the load-bearing wall material in all earthquake zones. In addition to this, when there
is no basement, minimum wall thicknesses given in Table 2.8 for ground story and
for upper stories should be applied. If penthouses permitted by the code, wall
thickness specified for each of the storey in Table 2.8 shall also be applied for
penthouse. As seen from Table 2.8, the required minimum wall thicknesses in
TEC2007 are almost half of the minimum wall thicknesses required in TEC1975.
(Note that the values in brackets are taken from TEC1975; others are taken from
TEC1998 and TEC2007.)
Table 2.8. Minimum Thicknesses of Load-bearing Walls According to TEC1975,
TEC1998 and TEC2007 Seismic
Zone
Stories
Permitted
Natural Stone
(mm)
Concrete
(mm)
Brick
(thickness)
Others
(mm)
1, 2, 3, 4 Basement 500 250 1 (1.5) 200 (400)
Ground story 500 - 1 200 (300)
1, 2, 3, 4
Basement 500 250 1.5 300 (400)
Ground story 500 - 1 200 (300)
First story - - 1 200 (300)
2, 3, 4
Basement 500 250 1.5 300 (400)
Ground story 500 - 1.5 300 (400)
First story - - 1 200 (300)
Second story - - 1 200 (300)
4
Basement 500 250 1.5 300 (400)
Ground story 500 - 1.5 300 (400)
First story - - 1.5 300 (400)
Second story - - 1 200 (300)
Third story - - 1 200 (300)
According to Eurocode 6, the recommended minimum thickness of load bearing
walls is only 100 mm. In Eurocode 8, the minimum effective wall thicknesses of
buildings in seismic zones are given as well as the maximum value of the ratio of the
effective wall height to its effective thickness. According to Eurocode 8, required
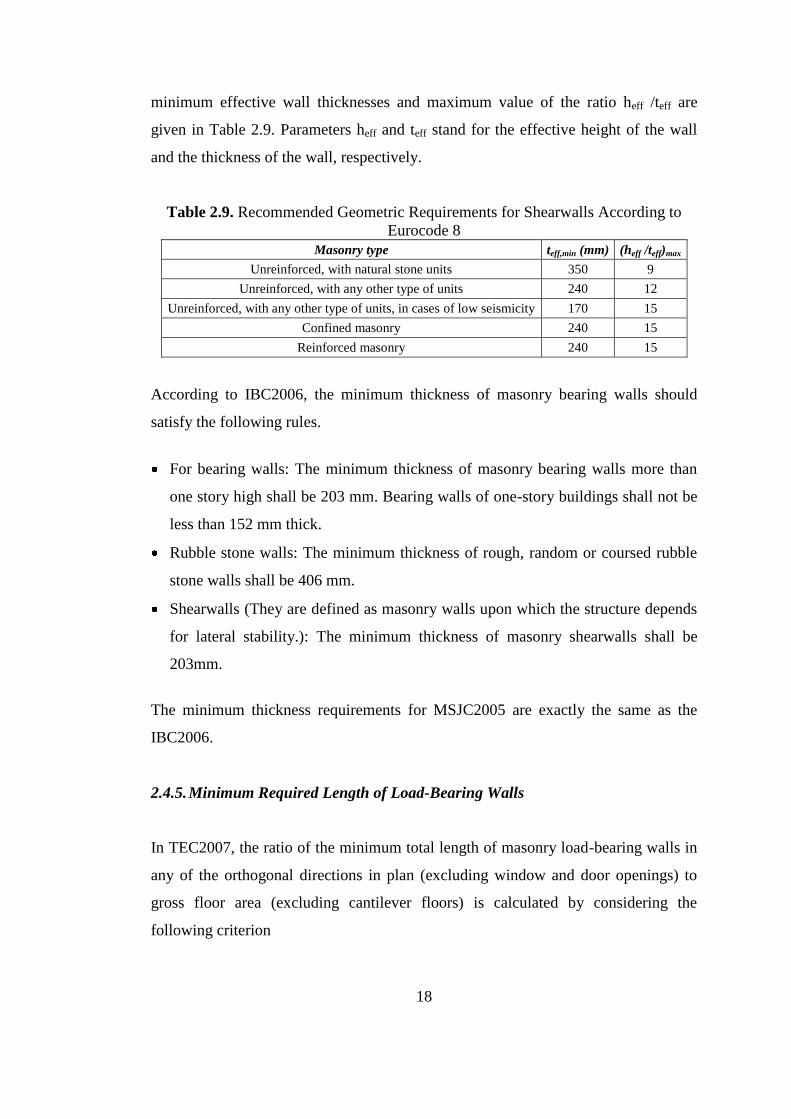
18
minimum effective wall thicknesses and maximum value of the ratio heff /teff are
given in Table 2.9. Parameters heff and teff stand for the effective height of the wall
and the thickness of the wall, respectively.
Table 2.9. Recommended Geometric Requirements for Shearwalls According to
Eurocode 8
Masonry type teff,min (mm) (heff /teff)max
Unreinforced, with natural stone units 350 9
Unreinforced, with any other type of units 240 12
Unreinforced, with any other type of units, in cases of low seismicity 170 15
Confined masonry 240 15
Reinforced masonry 240 15
According to IBC2006, the minimum thickness of masonry bearing walls should
satisfy the following rules.
For bearing walls: The minimum thickness of masonry bearing walls more than
one story high shall be 203 mm. Bearing walls of one-story buildings shall not be
less than 152 mm thick.
Rubble stone walls: The minimum thickness of rough, random or coursed rubble
stone walls shall be 406 mm.
Shearwalls (They are defined as masonry walls upon which the structure depends
for lateral stability.): The minimum thickness of masonry shearwalls shall be
203mm.
The minimum thickness requirements for MSJC2005 are exactly the same as the
IBC2006.
2.4.5. Minimum Required Length of Load-Bearing Walls
In TEC2007, the ratio of the minimum total length of masonry load-bearing walls in
any of the orthogonal directions in plan (excluding window and door openings) to
gross floor area (excluding cantilever floors) is calculated by considering the
following criterion
19
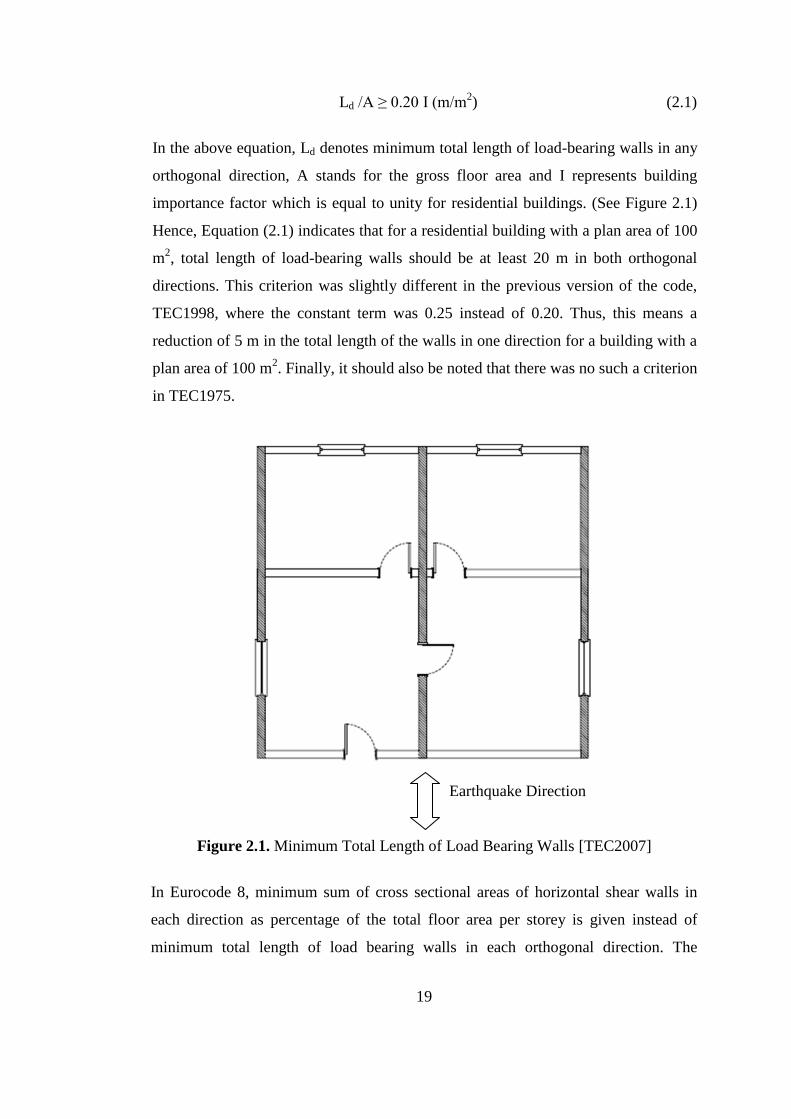
Ld /A ≥ 0.20 I (m/m2) (2.1)
In the above equation, Ld denotes minimum total length of load-bearing walls in any
orthogonal direction, A stands for the gross floor area and I represents building
importance factor which is equal to unity for residential buildings. (See Figure 2.1)
Hence, Equation (2.1) indicates that for a residential building with a plan area of 100
m2, total length of load-bearing walls should be at least 20 m in both orthogonal
directions. This criterion was slightly different in the previous version of the code,
TEC1998, where the constant term was 0.25 instead of 0.20. Thus, this means a
reduction of 5 m in the total length of the walls in one direction for a building with a
plan area of 100 m2. Finally, it should also be noted that there was no such a criterion
in TEC1975.
Figure 2.1. Minimum Total Length of Load Bearing Walls [TEC2007]
In Eurocode 8, minimum sum of cross sectional areas of horizontal shear walls in
each direction as percentage of the total floor area per storey is given instead of
minimum total length of load bearing walls in each orthogonal direction. The
Earthquake Direction

20
requirements for unreinforced masonry buildings are given in Table 2.10. In this
table, the parameter S is the soil factor that depends on the site class and ranges
between 1.0-1.8. The parameter k is a correction factor that is used in cases where at
least 70% of the shear walls under consideration are longer than 2 m, otherwise equal
to unity. For the sake of comparison, the last two rows of Table 2.10 are devoted to
typical values obtained by Equation (2.1) taken from Turkish codes, assuming
constant thicknesses of 200 mm and 300 mm for all load-bearing walls in a typical
story and I=1 (residential building). As it is observed in Table 2.10, TEC2007 yields
safer values than Eurocode 8 in most of the cases.
Table 2.10. Comparison of Minimum Total Cross-sectional Area of Load-bearing
Walls as Percentage of Total Floor Area According to Eurocode 8 and TEC2007.
(The abbreviation N/A means “not acceptable”.) Acceleration at site agS (in g) ≤ 0.07k ≤ 0.10k ≤ 0.15k ≤ 0.20k
Earthquake Code No. of
stories
Minimum total cross-sectional area of load-bearing
walls as percentage of total floor area
Eurocode 8
1 2.0 % 2.0 % 3.5 % N/A
2 2.0 % 2.5 % 5.0 % N/A
3 3.0 % 5.0 % N/A N/A
4 5.0 % N/A N/A N/A
TEC2007 (t=200mm) 4.0 %
TEC2007 (t=300mm) 6.0 %
In IBC2006, the minimum cumulative length of masonry shear walls provided in
each orthogonal direction should be 0.4 times the long dimension of the building.
Cumulative length of shear walls is calculated without including the openings.
According to MSJC2005, the minimum cumulative length requirement is similar to
the requirement in IBC2006.
2.4.6. Openings and Maximum Unsupported Length of Load Bearing Walls
According to TEC2007, unsupported length of a load-bearing wall between the
connecting wall axes in the perpendicular direction shall not exceed 5.5 m in the first
seismic zone and 7.5 m in other seismic zones. (See Figure 2.2) In contrast, the
unsupported length should be less than 5.5 m in the first seismic zone and less than 7
m in all other seismic zones according to TEC1975 and TEC1998. In adobe
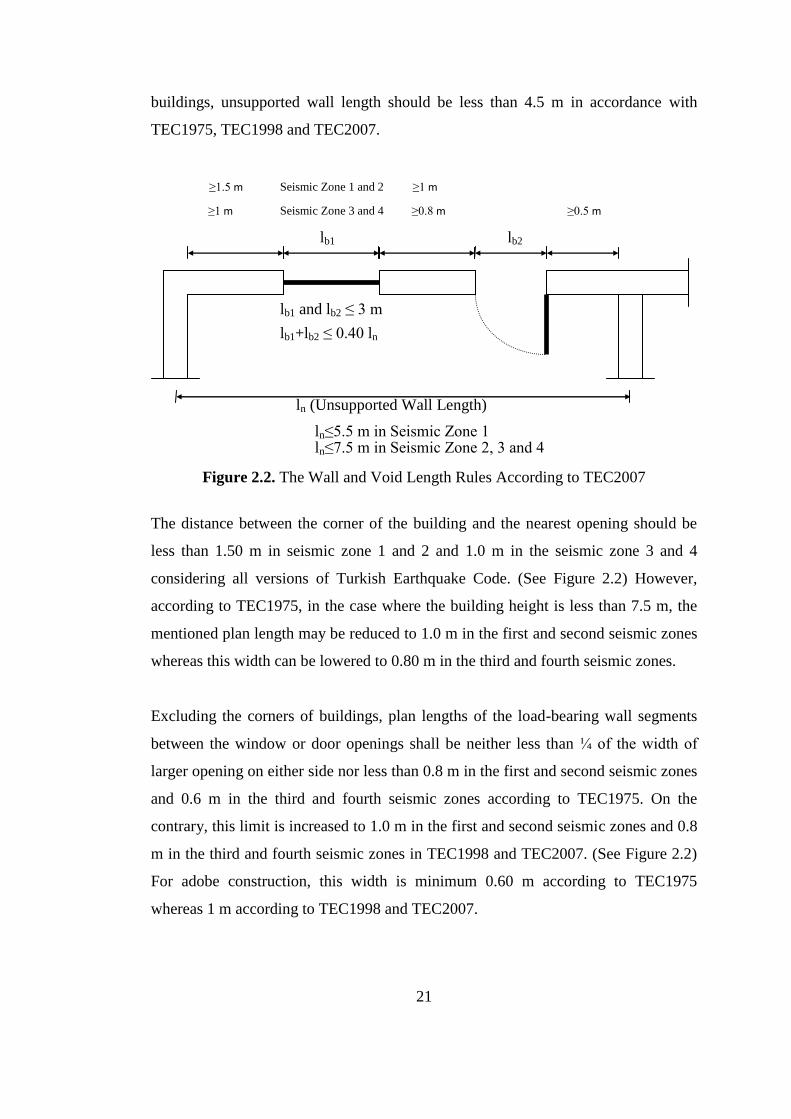
21
buildings, unsupported wall length should be less than 4.5 m in accordance with
TEC1975, TEC1998 and TEC2007.
Figure 2.2. The Wall and Void Length Rules According to TEC2007
The distance between the corner of the building and the nearest opening should be
less than 1.50 m in seismic zone 1 and 2 and 1.0 m in the seismic zone 3 and 4
considering all versions of Turkish Earthquake Code. (See Figure 2.2) However,
according to TEC1975, in the case where the building height is less than 7.5 m, the
mentioned plan length may be reduced to 1.0 m in the first and second seismic zones
whereas this width can be lowered to 0.80 m in the third and fourth seismic zones.
Excluding the corners of buildings, plan lengths of the load-bearing wall segments
between the window or door openings shall be neither less than ¼ of the width of
larger opening on either side nor less than 0.8 m in the first and second seismic zones
and 0.6 m in the third and fourth seismic zones according to TEC1975. On the
contrary, this limit is increased to 1.0 m in the first and second seismic zones and 0.8
m in the third and fourth seismic zones in TEC1998 and TEC2007. (See Figure 2.2)
For adobe construction, this width is minimum 0.60 m according to TEC1975
whereas 1 m according to TEC1998 and TEC2007.
≥1.5 m Seismic Zone 1 and 2 ≥1 m
≥1 m Seismic Zone 3 and 4 ≥0.8 m ≥0.5 m
lb2 lb1
ln (Unsupported Wall Length)
lb1 and lb2 ≤ 3 m
lb1+lb2 ≤ 0.40 ln
ln≤5.5 m in Seismic Zone 1 ln≤7.5 m in Seismic Zone 2, 3 and 4
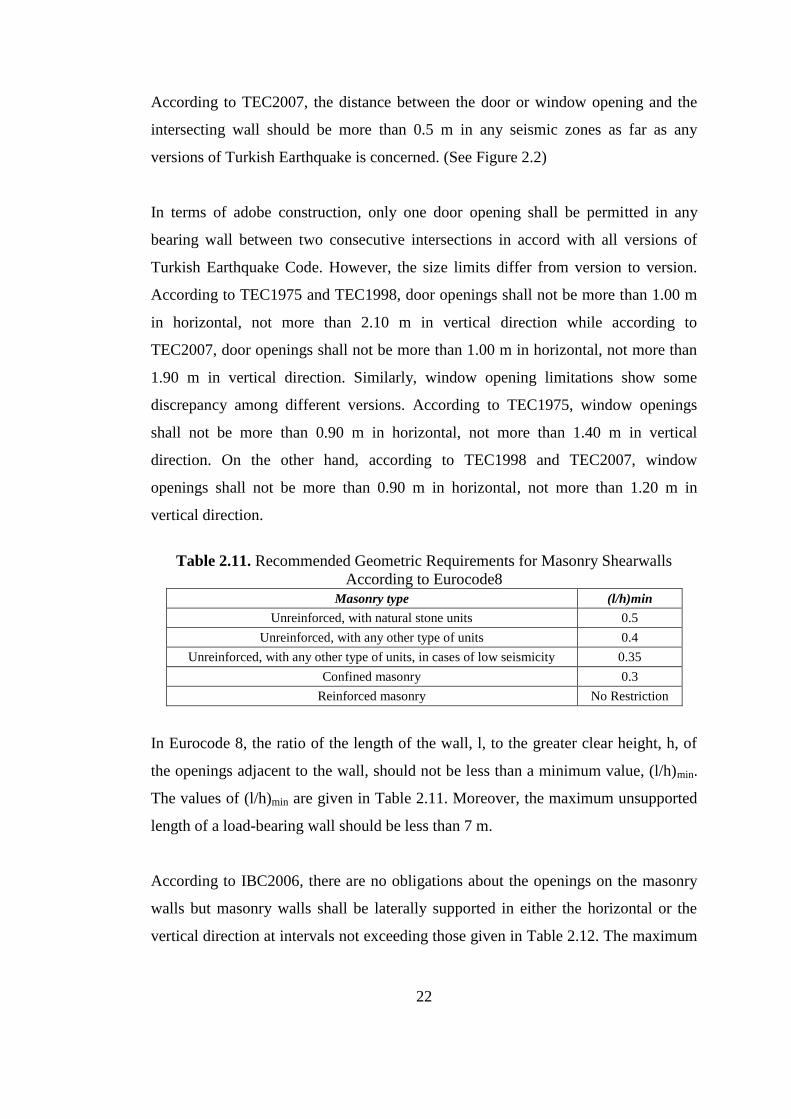
22
According to TEC2007, the distance between the door or window opening and the
intersecting wall should be more than 0.5 m in any seismic zones as far as any
versions of Turkish Earthquake is concerned. (See Figure 2.2)
In terms of adobe construction, only one door opening shall be permitted in any
bearing wall between two consecutive intersections in accord with all versions of
Turkish Earthquake Code. However, the size limits differ from version to version.
According to TEC1975 and TEC1998, door openings shall not be more than 1.00 m
in horizontal, not more than 2.10 m in vertical direction while according to
TEC2007, door openings shall not be more than 1.00 m in horizontal, not more than
1.90 m in vertical direction. Similarly, window opening limitations show some
discrepancy among different versions. According to TEC1975, window openings
shall not be more than 0.90 m in horizontal, not more than 1.40 m in vertical
direction. On the other hand, according to TEC1998 and TEC2007, window
openings shall not be more than 0.90 m in horizontal, not more than 1.20 m in
vertical direction.
Table 2.11. Recommended Geometric Requirements for Masonry Shearwalls
According to Eurocode8
Masonry type (l/h)min
Unreinforced, with natural stone units 0.5
Unreinforced, with any other type of units 0.4
Unreinforced, with any other type of units, in cases of low seismicity 0.35
Confined masonry 0.3
Reinforced masonry No Restriction
In Eurocode 8, the ratio of the length of the wall, l, to the greater clear height, h, of
the openings adjacent to the wall, should not be less than a minimum value, (l/h)min.
The values of (l/h)min are given in Table 2.11. Moreover, the maximum unsupported
length of a load-bearing wall should be less than 7 m.
According to IBC2006, there are no obligations about the openings on the masonry
walls but masonry walls shall be laterally supported in either the horizontal or the
vertical direction at intervals not exceeding those given in Table 2.12. The maximum
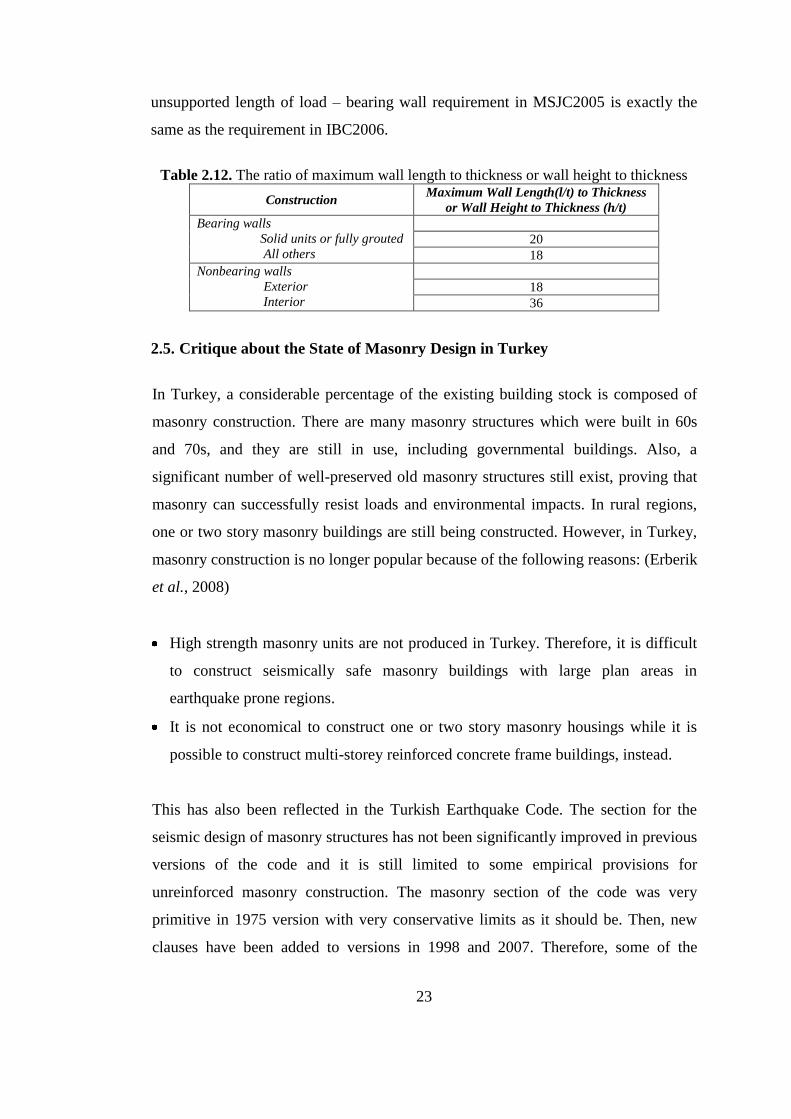
23
unsupported length of load – bearing wall requirement in MSJC2005 is exactly the
same as the requirement in IBC2006.
Table 2.12. The ratio of maximum wall length to thickness or wall height to thickness
Construction Maximum Wall Length(l/t) to Thickness
or Wall Height to Thickness (h/t)
Bearing walls
Solid units or fully grouted
All others
20
18
Nonbearing walls
Exterior
Interior
18
36
2.5. Critique about the State of Masonry Design in Turkey
In Turkey, a considerable percentage of the existing building stock is composed of
masonry construction. There are many masonry structures which were built in 60s
and 70s, and they are still in use, including governmental buildings. Also, a
significant number of well-preserved old masonry structures still exist, proving that
masonry can successfully resist loads and environmental impacts. In rural regions,
one or two story masonry buildings are still being constructed. However, in Turkey,
masonry construction is no longer popular because of the following reasons: (Erberik
et al., 2008)
High strength masonry units are not produced in Turkey. Therefore, it is difficult
to construct seismically safe masonry buildings with large plan areas in
earthquake prone regions.
It is not economical to construct one or two story masonry housings while it is
possible to construct multi-storey reinforced concrete frame buildings, instead.
This has also been reflected in the Turkish Earthquake Code. The section for the
seismic design of masonry structures has not been significantly improved in previous
versions of the code and it is still limited to some empirical provisions for
unreinforced masonry construction. The masonry section of the code was very
primitive in 1975 version with very conservative limits as it should be. Then, new
clauses have been added to versions in 1998 and 2007. Therefore, some of the

24
limitations have been relaxed due to the introduction of new rules. However, as it is
observed in the above sections, the design rules are still strict and conservative when
compared to other international codes. This is not surprising, though, since the
masonry part of the code relies on empirical design provisions only.
There are no recommendations for reinforced, confined or prestressed masonry
construction, in other words, these types of construction are not encouraged in
Turkish state of practice. However, just the opposite is true for international codes.
These codes have detailed design provisions including different approaches
(allowable stress design, strength design and empirical design) and different
construction types of masonry (unreinforced, reinforced, confined and prestressed
masonry). Then, it becomes possible to construct robust masonry buildings with
more than 5 stories as it is encountered in many cities of Europe and the United
States. (Erberik et al., 2008)
In Turkey, current unreinforced masonry construction is limited to low-rise small
dwellings in rural parts or in suburbs of large cities. However, it is also possible to
encounter confined masonry buildings, especially in outskirts of Istanbul, a city
under high seismic risk. Confined masonry is a construction system where masonry
structural walls are confined on all four sides with reinforced concrete vertical and
horizontal confining elements, which are not intended to carry either vertical or
horizontal loads, and are eventually not designed to behave like moment resisting
frames. There are clauses in the current Turkish code for the placement of horizontal
and vertical confining members around masonry walls but these are empirical rules
that do not rely on any engineering background and they are not sufficient to ensure
the seismic safety of this type of construction in regions of high seismic hazard.
Therefore, such structures are very vulnerable to seismic damage, and in turn to
physical losses after an earthquake, as many examples of this have been observed
during the major earthquakes in Turkey in the last two decades.
25
In the light of above discussions, the following points should be addressed:
The masonry design part of Turkish Earthquake Code depends on empirical rules
for unreinforced masonry only. Therefore, the design rules are eventually more
conservative and strict than the ones in international codes.
According to the empirical design philosophy, the engineer is constrained since
he/she cannot violate the strict rules regarding the structural system like number
of stories, geometry in plan, arrangement of walls, or in dimensioning of masonry
members with standard sizes of masonry units. However, since international codes
encourage the construction of other masonry systems like reinforced, confined
and prestressed masonry, they are more flexible and allow different approaches to
be used in the design stage of masonry construction.
Due to the encouragement of design of different masonry construction systems
like reinforced or confined in the earthquake code, it would have been possible to
design and construct earthquake resistant low-rise and mid-rise residential
dwellings which may be an alternative for comparatively vulnerable reinforced
concrete moment resisting frame systems. (Erberik et al., 2008)
26
CHAPTER 3
NEW CONCEPTS FOR DESIGN AND ANALYSIS OF MASONRY
STRUCTURES
3.1. Introduction
In first part of this chapter, various design concepts used in civil engineering are
introduced together with their major drawbacks. Since the focus of this study is
mainly on the performance-based procedures, the most common analysis types that
are essential to determine the displacement demands are discussed.
Finally, the concept of performance based design for masonry structures is presented.
This part deals principally with the commonly used and the recently developed
techniques for determining the performance of masonry structures.
3.2. Force-based vs. Displacement-based Design Procedures
The design tools for any structural types are divided into two main categories;
namely force-based design and displacement-based design. Every method has its
own subcategories and its specific analysis methods. However, more detailed
explanations of analysis methods belonging to displacement-based design are
discussed in the rest of this chapter as the main scope of this study is performance-
based design of masonry structures.
3.2.1. Force-based Design
According to the traditional force-based design concept, the main concern for
designing structures or their components is the comparison of the loads acting on the
cross-section (FL) with the resistance or capacity (FR) of that cross-section. If the
capacity is larger than the load effects, the design is said to be proper. (See Equation
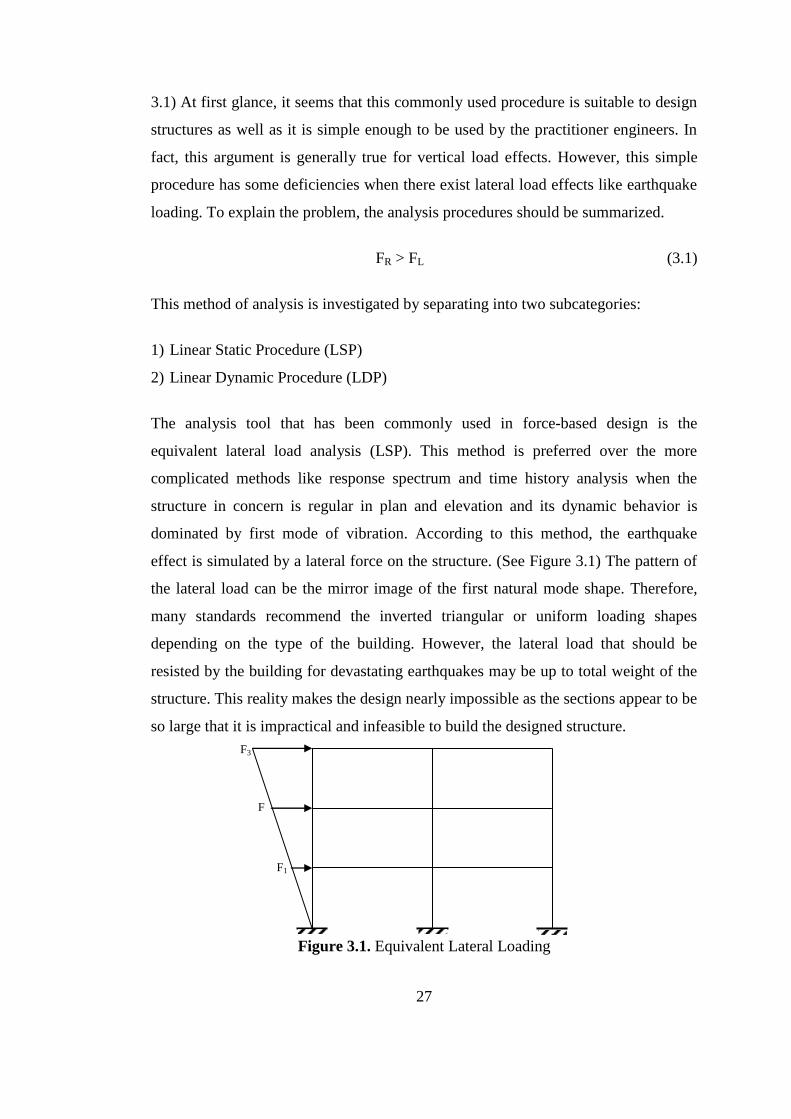
27
F3
F
2
F1
3.1) At first glance, it seems that this commonly used procedure is suitable to design
structures as well as it is simple enough to be used by the practitioner engineers. In
fact, this argument is generally true for vertical load effects. However, this simple
procedure has some deficiencies when there exist lateral load effects like earthquake
loading. To explain the problem, the analysis procedures should be summarized.
FR > FL (3.1)
This method of analysis is investigated by separating into two subcategories:
1) Linear Static Procedure (LSP)
2) Linear Dynamic Procedure (LDP)
The analysis tool that has been commonly used in force-based design is the
equivalent lateral load analysis (LSP). This method is preferred over the more
complicated methods like response spectrum and time history analysis when the
structure in concern is regular in plan and elevation and its dynamic behavior is
dominated by first mode of vibration. According to this method, the earthquake
effect is simulated by a lateral force on the structure. (See Figure 3.1) The pattern of
the lateral load can be the mirror image of the first natural mode shape. Therefore,
many standards recommend the inverted triangular or uniform loading shapes
depending on the type of the building. However, the lateral load that should be
resisted by the building for devastating earthquakes may be up to total weight of the
structure. This reality makes the design nearly impossible as the sections appear to be
so large that it is impractical and infeasible to build the designed structure.
Figure 3.1. Equivalent Lateral Loading
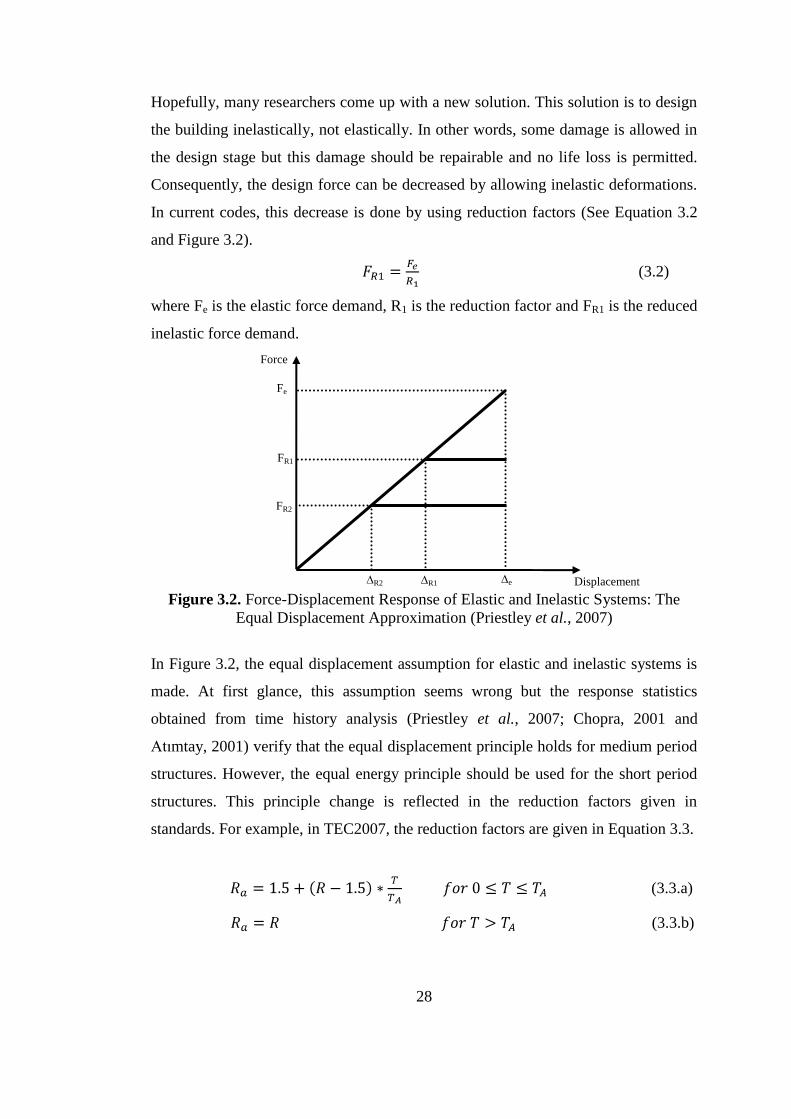
28
FR2
FR1
Fe
∆R2 ∆R1 ∆e Displacement
Force
Hopefully, many researchers come up with a new solution. This solution is to design
the building inelastically, not elastically. In other words, some damage is allowed in
the design stage but this damage should be repairable and no life loss is permitted.
Consequently, the design force can be decreased by allowing inelastic deformations.
In current codes, this decrease is done by using reduction factors (See Equation 3.2
and Figure 3.2).
(3.2)
where Fe is the elastic force demand, R1 is the reduction factor and FR1 is the reduced
inelastic force demand.
Figure 3.2. Force-Displacement Response of Elastic and Inelastic Systems: The
Equal Displacement Approximation (Priestley et al., 2007)
In Figure 3.2, the equal displacement assumption for elastic and inelastic systems is
made. At first glance, this assumption seems wrong but the response statistics
obtained from time history analysis (Priestley et al., 2007; Chopra, 2001 and
Atımtay, 2001) verify that the equal displacement principle holds for medium period
structures. However, the equal energy principle should be used for the short period
structures. This principle change is reflected in the reduction factors given in
standards. For example, in TEC2007, the reduction factors are given in Equation 3.3.
(3.3.a)
(3.3.b)
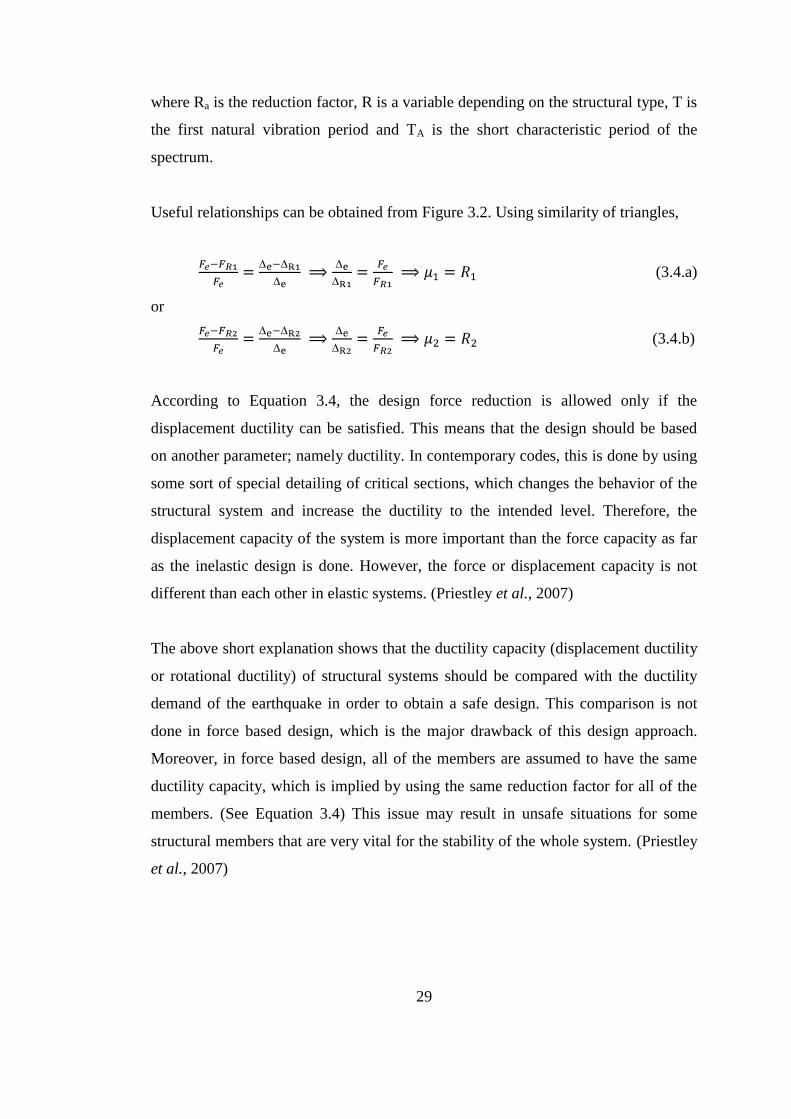
29
where Ra is the reduction factor, R is a variable depending on the structural type, T is
the first natural vibration period and TA is the short characteristic period of the
spectrum.
Useful relationships can be obtained from Figure 3.2. Using similarity of triangles,
(3.4.a)
or
(3.4.b)
According to Equation 3.4, the design force reduction is allowed only if the
displacement ductility can be satisfied. This means that the design should be based
on another parameter; namely ductility. In contemporary codes, this is done by using
some sort of special detailing of critical sections, which changes the behavior of the
structural system and increase the ductility to the intended level. Therefore, the
displacement capacity of the system is more important than the force capacity as far
as the inelastic design is done. However, the force or displacement capacity is not
different than each other in elastic systems. (Priestley et al., 2007)
The above short explanation shows that the ductility capacity (displacement ductility
or rotational ductility) of structural systems should be compared with the ductility
demand of the earthquake in order to obtain a safe design. This comparison is not
done in force based design, which is the major drawback of this design approach.
Moreover, in force based design, all of the members are assumed to have the same
ductility capacity, which is implied by using the same reduction factor for all of the
members. (See Equation 3.4) This issue may result in unsafe situations for some
structural members that are very vital for the stability of the whole system. (Priestley
et al., 2007)

30
3.2.2. Displacement-based Design
The need for determination of the displacement capacity of structures brings about
new analysis methods. Of course, the technological innovations in the computer
industry make these new methods feasible. For instance, Nonlinear Static Procedure
(NSP), Nonlinear Dynamic Procedure (NDP) and Incremental Dynamic Analysis
(IDA) have recently been used for this purpose.
3.2.2.1. Nonlinear Static Procedure (NSP)
This analysis tool known as pushover analysis is employed to determine the force
displacement characteristics of structures. First of all, pushover analysis disregards
the higher mode effects. In other words, it assumes that the structural behavior is
dominated by the first natural vibration mode. Therefore, this method is only
meaningful for first mode dominant structures. For example, according to TEC2007,
this method is usable for structures that have at least 70% participating mass in the
first mode of vibration. Hopefully, many of the frame structures obey this law and
pushover analysis is one of the most popular analysis methods for displacement
based design.
Pushover analysis is called as nonlinear because the system behaves nonlinear after
the elastic capacity of any members is reached. Besides, it is a static analysis since
the structure is analyzed in a stepwise manner, statically. More explicitly, there is no
inertia effect or damping in pushover analysis. The structure is pushed laterally until
any of its members enters their plastic region, till which the same stiffness matrix is
used to obtain the displacements and forces.
The plasticity of the structure is defined by plastic hinges attained at both ends of
each frame elements, i.e. beams, columns and shearwalls. These plastic hinges
determine the behavior of the whole structural system. In other words, the hinge
properties are reflected to the pushover curve of the structure.
31
F3
F
2
F1
Shortly, the outline of pushover analysis is given below.
1) The building is modeled as 2D or 3D.
2) Every member is attained two plastic hinges at its both ends. The hinge
characteristics may be calculated by drawing interaction diagrams of members or
the code-suggested hinges are used. In this stage, the plastic hinge length should
be chosen. According to FEMA356, it may be chosen as half of height for beams
and columns and as half of length but less than one storey height for shearwalls.
Figure 3.3. Lateral Loading Pattern in Pushover and the Formation of First Hinge
3) After the application of dead and live loads, the structure is analyzed under only
these vertical loads.
4) Then, the structure is loaded laterally similar to its first mode shape until any of
the members yield. (See Figure 3.3)
5) The stiffness matrix is updated following the yield of any members. The lateral
load is increased a little bit till another yield occurs.
6) The structure is pushed until a mechanism occurs. (See Figure 3.4) Then, the base
shear versus roof displacement is drawn, which is known as the capacity or
pushover curve.
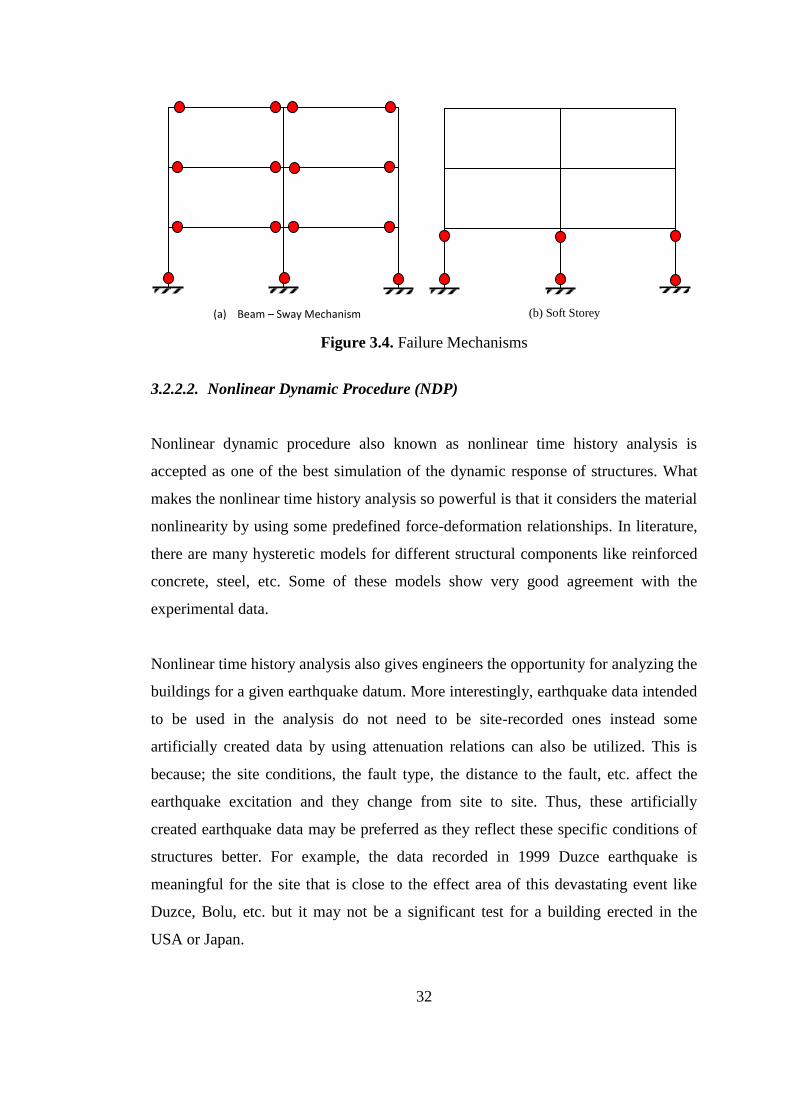
32
(a) Beam – Sway Mechanism (b) Soft Storey
Figure 3.4. Failure Mechanisms
3.2.2.2. Nonlinear Dynamic Procedure (NDP)
Nonlinear dynamic procedure also known as nonlinear time history analysis is
accepted as one of the best simulation of the dynamic response of structures. What
makes the nonlinear time history analysis so powerful is that it considers the material
nonlinearity by using some predefined force-deformation relationships. In literature,
there are many hysteretic models for different structural components like reinforced
concrete, steel, etc. Some of these models show very good agreement with the
experimental data.
Nonlinear time history analysis also gives engineers the opportunity for analyzing the
buildings for a given earthquake datum. More interestingly, earthquake data intended
to be used in the analysis do not need to be site-recorded ones instead some
artificially created data by using attenuation relations can also be utilized. This is
because; the site conditions, the fault type, the distance to the fault, etc. affect the
earthquake excitation and they change from site to site. Thus, these artificially
created earthquake data may be preferred as they reflect these specific conditions of
structures better. For example, the data recorded in 1999 Duzce earthquake is
meaningful for the site that is close to the effect area of this devastating event like
Duzce, Bolu, etc. but it may not be a significant test for a building erected in the
USA or Japan.
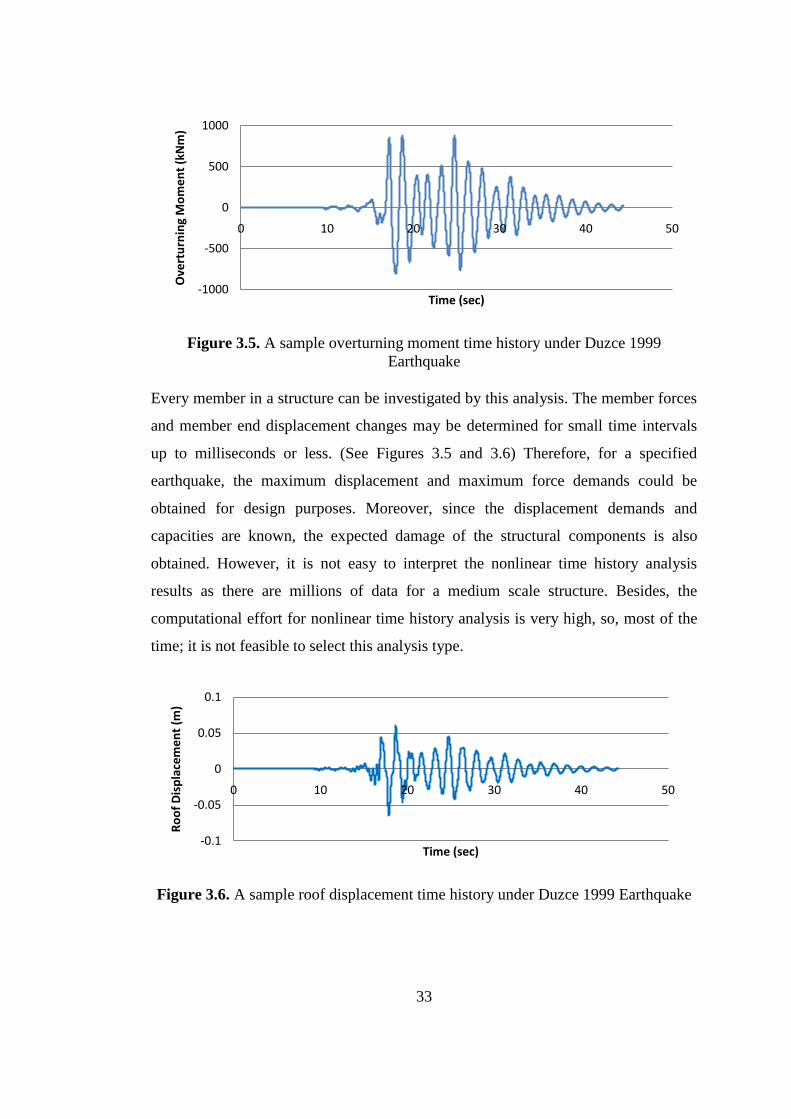
33
Figure 3.5. A sample overturning moment time history under Duzce 1999
Earthquake
Every member in a structure can be investigated by this analysis. The member forces
and member end displacement changes may be determined for small time intervals
up to milliseconds or less. (See Figures 3.5 and 3.6) Therefore, for a specified
earthquake, the maximum displacement and maximum force demands could be
obtained for design purposes. Moreover, since the displacement demands and
capacities are known, the expected damage of the structural components is also
obtained. However, it is not easy to interpret the nonlinear time history analysis
results as there are millions of data for a medium scale structure. Besides, the
computational effort for nonlinear time history analysis is very high, so, most of the
time; it is not feasible to select this analysis type.
Figure 3.6. A sample roof displacement time history under Duzce 1999 Earthquake
-1000
-500
0
500
1000
0 10 20 30 40 50
Ove
rtu
rnin
g M
om
en
t (k
Nm
)
Time (sec)
-0.1
-0.05
0
0.05
0.1
0 10 20 30 40 50
Ro
of
Dis
pla
cem
en
t (m
)
Time (sec)

34
3.2.2.3. Incremental Dynamic Analysis (IDA)
Most of the civil engineers suppose that the incremental dynamic analysis is one of
the newest modeling techniques, becoming famous more and more nowadays.
However, this technique appeared in 1977 by Bertero (1977). The starting point of
this concept is summarized by Vamvatsikos (2002) as follows: “By analogy with
passing from a single static analysis to the incremental static pushover, one arrives at
the extension of a single time-history analysis into an incremental one, where the
seismic 'loading' is scaled."
It can be said that this method is a contemporary time history analysis developed to
determine the whole capacity curve of the structure not the capacity curve points for
several different earthquakes. In other words, the time history analysis helps finding
whether a specified earthquake exceeds the structural capacity or not. However, the
incremental dynamic analysis shows the complete capacity curve. This is
accomplished by using an incremental time history analysis. The term incremental
states explicitly that the ground motion is scaled up in every step of analysis, which
brings about the capacity curve formation.
The incremental dynamic analysis can be made linear or nonlinear. If the material
properties of structural components are defined as linear elastic, the analysis is linear
incremental dynamic analysis. As its name implies, the main property of linear
analysis is that the IDA curve is also linear. (See Figure 3.7) Figure 3.7 is a sample
IDA curve formed for a sample structure whose first period of vibration is 0.63 sec.
In this sample analysis, Duzce (1999), Loma Prieta (1989) and Mexico City (1995)
ground motions taken from Peer NGA Database are analyzed by using Nonlin v7.0.
From Figure 3.7, it is apparent that IDA curves are dependent on the ground motions,
meaning for the same acceleration the displacement demands show dispersion.
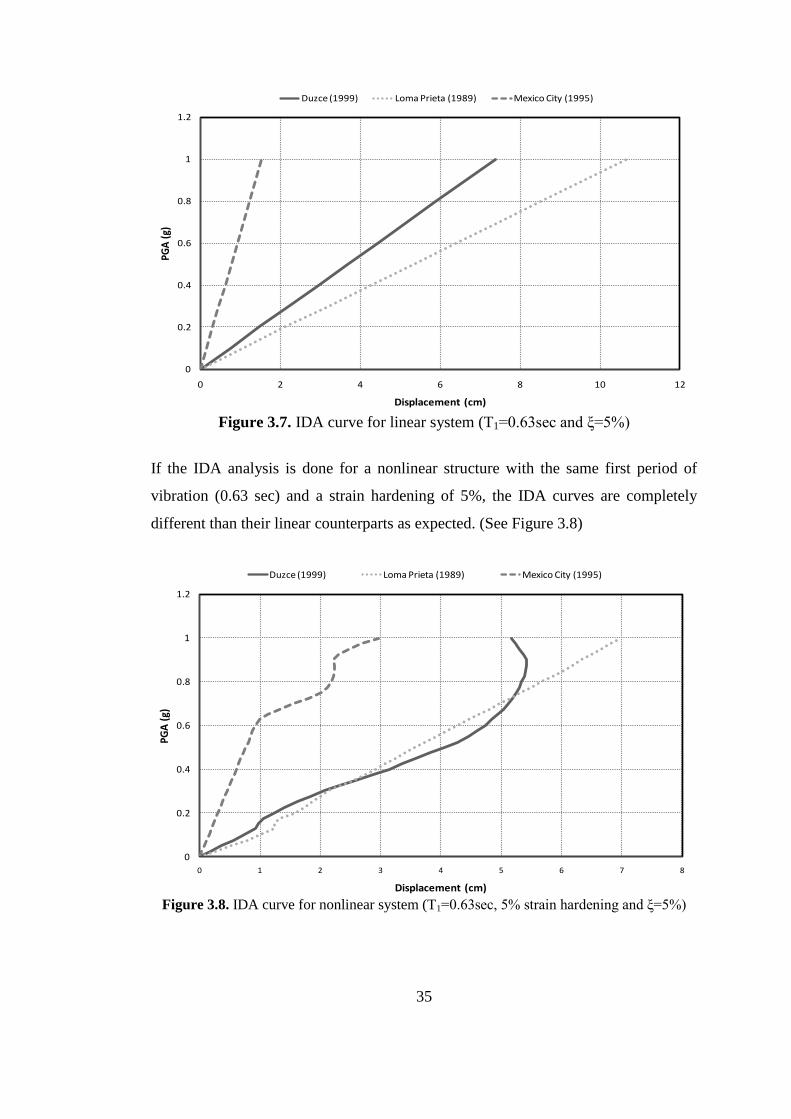
35
Figure 3.7. IDA curve for linear system (T1=0.63sec and ξ=5%)
If the IDA analysis is done for a nonlinear structure with the same first period of
vibration (0.63 sec) and a strain hardening of 5%, the IDA curves are completely
different than their linear counterparts as expected. (See Figure 3.8)
Figure 3.8. IDA curve for nonlinear system (T1=0.63sec, 5% strain hardening and ξ=5%)
0
0.2
0.4
0.6
0.8
1
1.2
0 2 4 6 8 10 12
PGA
(g)
Displacement (cm)
Duzce (1999) Loma Prieta (1989) Mexico City (1995)
0
0.2
0.4
0.6
0.8
1
1.2
0 1 2 3 4 5 6 7 8
PGA
(g)
Displacement (cm)
Duzce (1999) Loma Prieta (1989) Mexico City (1995)

36
From Figures 3.7 and 3.8, it can easily inferred that the demands of Loma Prieta
(1989) earthquake is the most in linear analysis but Duzce (1999) earthquake
demands the most in some parts of the nonlinear IDA curves. This shows that it is
very difficult to guess the IDA curve shapes as only the material property difference
causes thoroughly discrepant results.
The outline of the incremental dynamic analysis is given below.
1) The analytical model of building is created.
2) A suitable ground motion data for the building environment is selected.
3) With the selected ground motion, a nonlinear or linear time history analysis of
analytical model is done. In this model, a damage measure like maximum
interstory drift, maximum displacement, etc. is selected and that value is held in
memory in order to use it in creating the incremental dynamic analysis curve.
4) After that, ground motion intensity measure like PGA, first mode spectral
acceleration, etc. is determined and the selected ground motion is scaled up with
respected to this intensity measure (IM). Then, another time history analysis is
done with this scaled earthquake data.
5) Step 4 is repeated until a useful incremental dynamic analysis curve is decided to
be reached.
6) Lastly, the selected intensity measure (IM) versus the selected damage measure
(DM) is plotted, which is known as the incremental dynamic analysis curve.
3.3. In-plane Behavior of Masonry Walls in General
For displacement-based design, the nonlinear behavior of masonry components
should be completely understood. The displacement-based performance limits are
related to the behavior of masonry components under vertical and lateral forces.
These load-bearing masonry components are named as piers, which are formed as
masonry walls pierced by window and door openings. There are three different
mechanisms of lateral force resistance for masonry components, which depend
primarily on geometry, boundary conditions, magnitude of vertical loads and the
37
characteristics of the brick unit, mortar and the interface between them. However, it
should also be mentioned that, in practical cases, it is more possible to encounter
mixed type of failure rather than observing only one mode of failure occurring in a
masonry component.
3.3.1. Sliding Mechanism
This failure mode generally occurs in the cases that low levels of axial load and poor
quality of mortar exist. As its name implies, the upper part of wall slides over the
lower one. (See Figure 3.9.a) This action is generally due to the formation of
horizontal tensile crack paths in the bed joints when the wall is subjected to reversed
seismic action (Magenes and Calvi, 1997). This failure mode is brittle with a limited
displacement capacity. However, if sliding mechanism occurs in the presence of high
vertical compressive stresses or together with rocking failure mode, then it can be
regarded as a desirable mechanism with a significant amount of nonlinear
deformation and energy dissipation capacity (Abrams, 2001). In order to predict the
shear strength associated with sliding, Mohr-Coulomb formulation is employed.
Sliding shear resistance is directly related to shear strength of masonry (fv)
(3.5)
where
(3.6)
In the above equations, Rss is the capacity due to sliding shear failure, L is the wall
length, t is the wall thickness, Vbo is the shear bond strength at zero compression (in
MPa), μ is the coefficient of friction, ζy is the vertical stress (in MPa). Obviously,
Equations 3.5 and 3.6 are based on the assumption that mean values of shear strength
and vertical stress are used in the horizontal section of the wall where the actual
stress distribution is non-uniform. In spite of being approximate, Equations 3.5 and
3.6 have been largely adopted in design and assessment of masonry structures,
including the current Turkish Earthquake Code (2007).
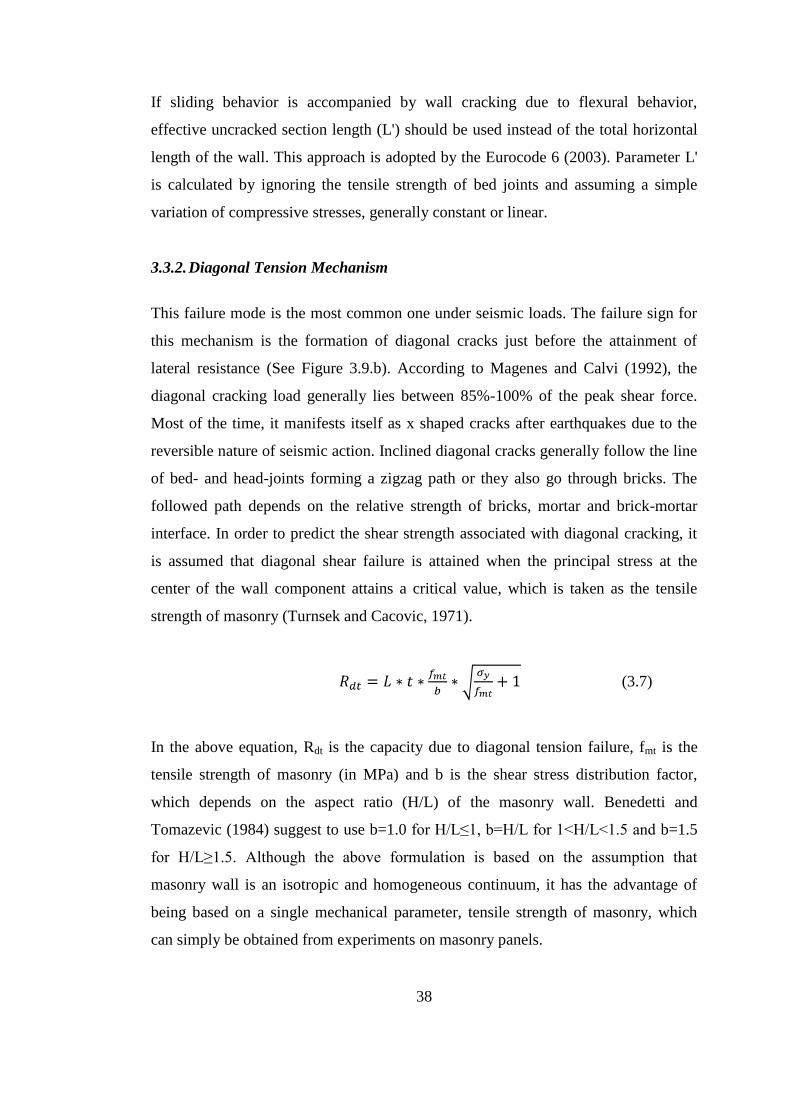
38
If sliding behavior is accompanied by wall cracking due to flexural behavior,
effective uncracked section length (L') should be used instead of the total horizontal
length of the wall. This approach is adopted by the Eurocode 6 (2003). Parameter L'
is calculated by ignoring the tensile strength of bed joints and assuming a simple
variation of compressive stresses, generally constant or linear.
3.3.2. Diagonal Tension Mechanism
This failure mode is the most common one under seismic loads. The failure sign for
this mechanism is the formation of diagonal cracks just before the attainment of
lateral resistance (See Figure 3.9.b). According to Magenes and Calvi (1992), the
diagonal cracking load generally lies between 85%-100% of the peak shear force.
Most of the time, it manifests itself as x shaped cracks after earthquakes due to the
reversible nature of seismic action. Inclined diagonal cracks generally follow the line
of bed- and head-joints forming a zigzag path or they also go through bricks. The
followed path depends on the relative strength of bricks, mortar and brick-mortar
interface. In order to predict the shear strength associated with diagonal cracking, it
is assumed that diagonal shear failure is attained when the principal stress at the
center of the wall component attains a critical value, which is taken as the tensile
strength of masonry (Turnsek and Cacovic, 1971).
(3.7)
In the above equation, Rdt is the capacity due to diagonal tension failure, fmt is the
tensile strength of masonry (in MPa) and b is the shear stress distribution factor,
which depends on the aspect ratio (H/L) of the masonry wall. Benedetti and
Tomazevic (1984) suggest to use b=1.0 for H/L≤1, b=H/L for 1<H/L<1.5 and b=1.5
for H/L≥1.5. Although the above formulation is based on the assumption that
masonry wall is an isotropic and homogeneous continuum, it has the advantage of
being based on a single mechanical parameter, tensile strength of masonry, which
can simply be obtained from experiments on masonry panels.

39
3.3.3. Rocking Mechanism
Rocking takes place when the aspect ratio of a wall is large enough to give rise to a
high moment to shear ratio. Final failure is because of the overturning of the wall and
simultaneous crushing of the compressed corner. (See Figure 3.9.c) Therefore,
rocking is a flexural failure, which is a more ductile and so more desired mechanism.
In the case of rocking mechanism, large displacements can be observed without a
significant strength degradation, especially in the case where mean axial load is low
in comparison with the compressive strength of masonry. The displacement capacity
can be as high as 10% of the total wall height (Magenes and Calvi, 1997). Tests of
unreinforced masonry pier components that experienced rocking mechanism were
observed to exhibit nonlinear deformations more than ten times the apparent yield
displacement (Erbay and Abrams, 2001). However, this limit is unusable since it
does not govern the ultimate deformation capacity of the masonry component when
compared to other brittle modes of failure, which generally take place before. In
addition to this, behavior in rocking mechanism is largely nonlinear elastic, thus the
energy dissipation capacity in a unit cycle is not high (Abrams, 2001).
The flexural resistance of a masonry wall depends on the crushing of the
compressive part. Therefore, compressive strength of masonry is necessary for the
quantification of the lateral strength in rocking mechanism. Considering the fact that
behavior of masonry components under uniaxial compression is analogous to that of
concrete, an equivalent rectangular compressive stress block can be employed in the
calculation of flexural resistance of masonry wall section as
(3.8)
where MRu is the flexural capacity of the wall section and fm is the compressive
strength of masonry (in MPa). Hence, the maximum lateral strength can be computed
from the following formulation
(3.9)
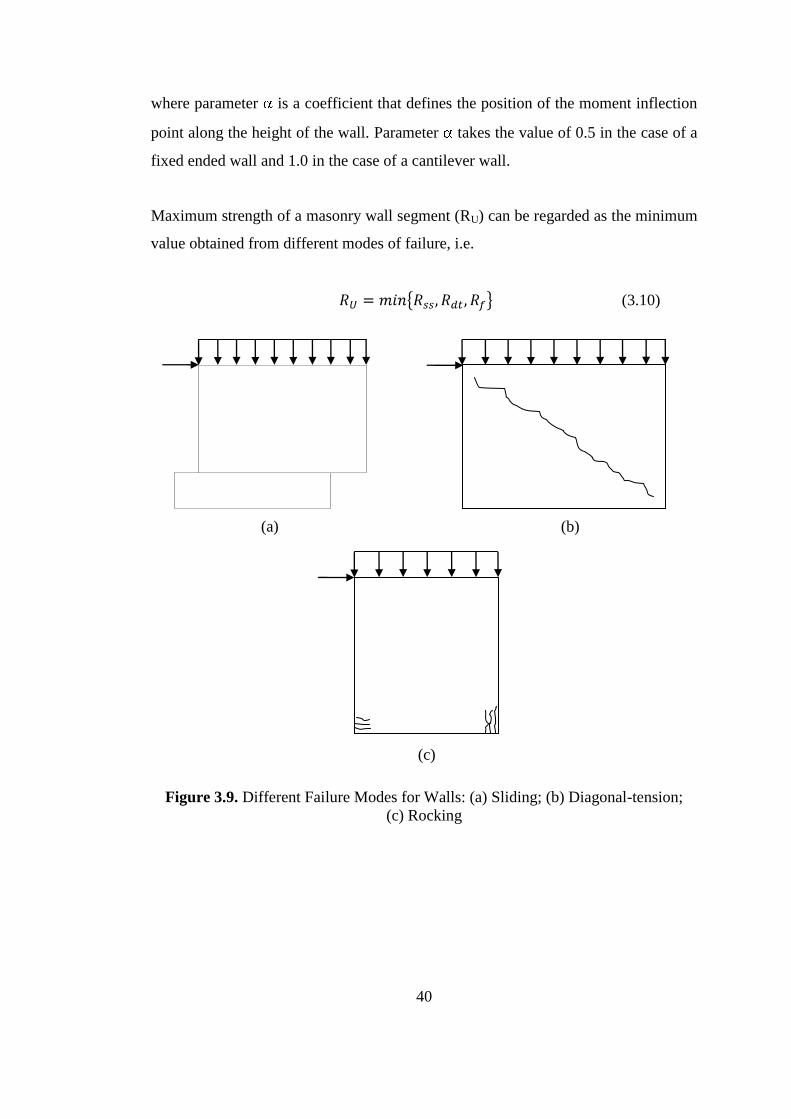
40
where parameter is a coefficient that defines the position of the moment inflection
point along the height of the wall. Parameter takes the value of 0.5 in the case of a
fixed ended wall and 1.0 in the case of a cantilever wall.
Maximum strength of a masonry wall segment (RU) can be regarded as the minimum
value obtained from different modes of failure, i.e.
(3.10)
Figure 3.9. Different Failure Modes for Walls: (a) Sliding; (b) Diagonal-tension;
(c) Rocking
(a)
(c)
(b)
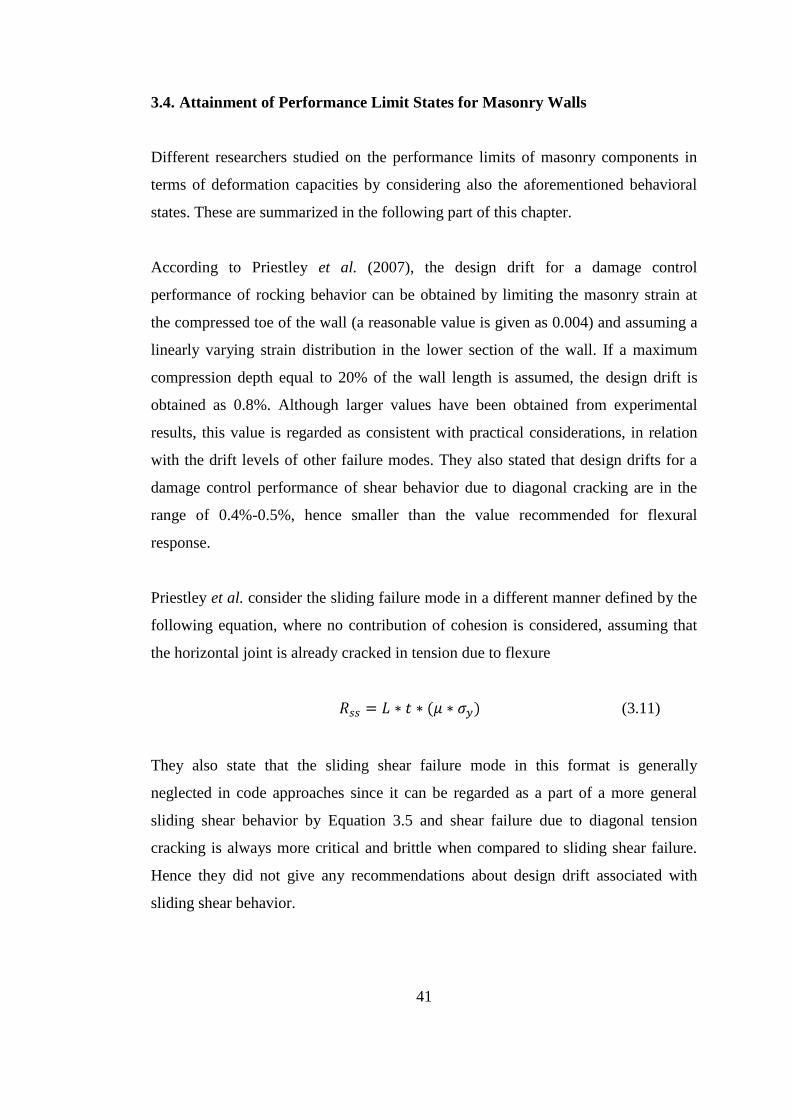
41
3.4. Attainment of Performance Limit States for Masonry Walls
Different researchers studied on the performance limits of masonry components in
terms of deformation capacities by considering also the aforementioned behavioral
states. These are summarized in the following part of this chapter.
According to Priestley et al. (2007), the design drift for a damage control
performance of rocking behavior can be obtained by limiting the masonry strain at
the compressed toe of the wall (a reasonable value is given as 0.004) and assuming a
linearly varying strain distribution in the lower section of the wall. If a maximum
compression depth equal to 20% of the wall length is assumed, the design drift is
obtained as 0.8%. Although larger values have been obtained from experimental
results, this value is regarded as consistent with practical considerations, in relation
with the drift levels of other failure modes. They also stated that design drifts for a
damage control performance of shear behavior due to diagonal cracking are in the
range of 0.4%-0.5%, hence smaller than the value recommended for flexural
response.
Priestley et al. consider the sliding failure mode in a different manner defined by the
following equation, where no contribution of cohesion is considered, assuming that
the horizontal joint is already cracked in tension due to flexure
(3.11)
They also state that the sliding shear failure mode in this format is generally
neglected in code approaches since it can be regarded as a part of a more general
sliding shear behavior by Equation 3.5 and shear failure due to diagonal tension
cracking is always more critical and brittle when compared to sliding shear failure.
Hence they did not give any recommendations about design drift associated with
sliding shear behavior.

42
Calvi (1999) presented a method that should be used for a global loss estimation of
buildings and not for assessing the response of single building. Moreover, in this
method, it is assumed that all masonry buildings are constructed by using traditional
techniques and no seismic design provisions are utilized in the design process.
The average displacement and dissipation capacity of clay brick buildings and sub-
assemblages are based on experimental and numerical data given in Magenes and
Calvi (1997). Furthermore, only in-plane failure is taken into account, i.e. out-of-
plane failure modes are ignored (The wall-to-slab connections are assumed to be
proper).
In this method, the performance states, or limit states, for masonry structures are
divided into three groups namely LS1, LS2 and LS3. The definitions given by Calvi
are summarized below:
LS1: It is associated with the minor structural damage and moderate non-
structural damage. The building can immediately be in service after the
earthquake without any need for significant strengthening and repair.
LS2: In this limit state, significant structural damage and extensive non-
structural damage exist. The building cannot be utilized after the earthquake
without significant repair. Still, repair and strengthening are feasible.
LS3: This performance level is related to the collapse. The repairing is neither
possible nor economically reasonable. The structure will have to be
demolished after the earthquake. Beyond this limiting state, global collapse
with danger for human life has to be expected.
As this method is designed to investigate population of buildings, the limit states are
not obtained through rigorous analyses and investigations. The following values (See
Table 3.1) for each performance level that are valid for every structure are suggested
by Calvi
43
Table 3.1. Limiting States for Brick Masonry Structures
Limiting State Drift Ratio (%)
LS1 0.1
LS2 0.3
LS3 0.5
Calvi also states that a linear deformed shape should be assumed for masonry
structures up to the performance level LS1 as no damage concentration occurs. In
contrast, the soft storey mechanism in the first storey occurs in the performance
levels LS2 and LS3 due to high levels of damage concentrations (Figure 3.10).
Therefore, the comparison of drift ratio demands with the limiting values should be
done for roof level in LS1 and for the first storey in LS2 and LS3.
Figure 3.10. Assumed deformed shapes for a masonry building, considering limit
states LS1 (left) and LS2 (right) (Calvi, 1999)
According to Tomazevic (2007), the resistance curves of unreinforced and confined
masonry structures are adequately represented by the relation between the resistance
(R) of the critical storey (most of the time, it is first storey) and the storey drift (d) of
the same storey (Figure 3.11).
On the resistance curve, four limit states that determine the usability of buildings are
defined as follows:
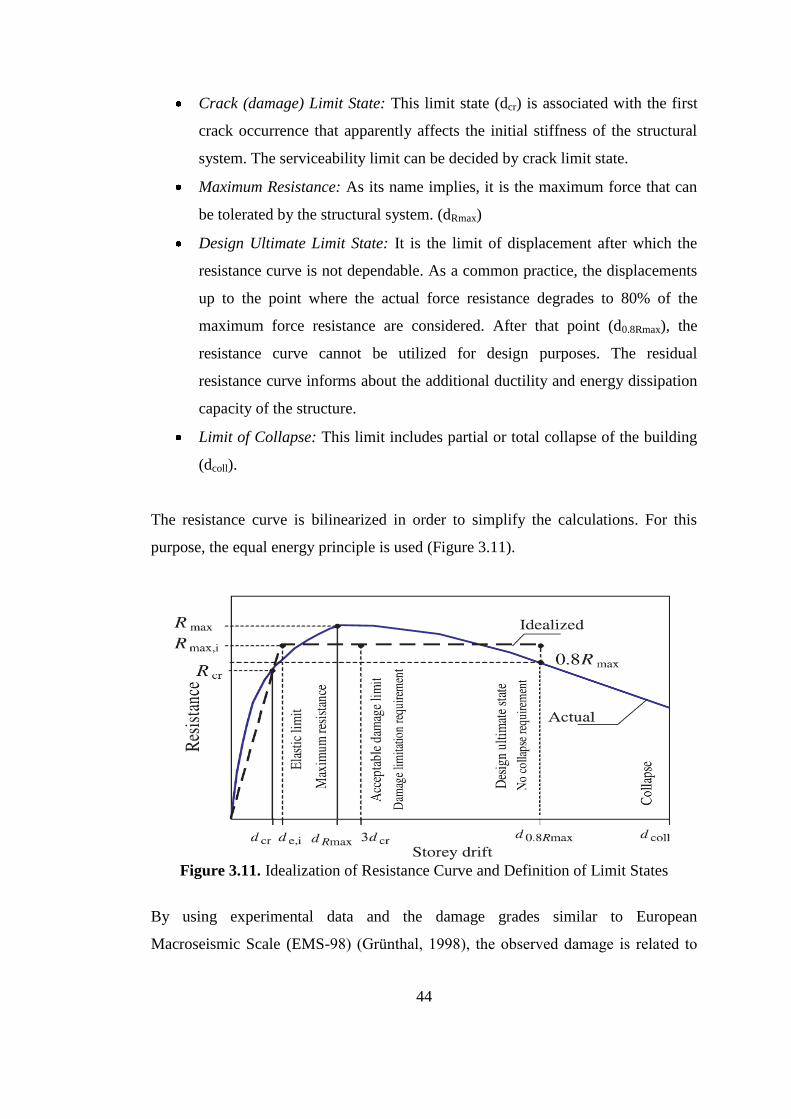
44
Crack (damage) Limit State: This limit state (dcr) is associated with the first
crack occurrence that apparently affects the initial stiffness of the structural
system. The serviceability limit can be decided by crack limit state.
Maximum Resistance: As its name implies, it is the maximum force that can
be tolerated by the structural system. (dRmax)
Design Ultimate Limit State: It is the limit of displacement after which the
resistance curve is not dependable. As a common practice, the displacements
up to the point where the actual force resistance degrades to 80% of the
maximum force resistance are considered. After that point (d0.8Rmax), the
resistance curve cannot be utilized for design purposes. The residual
resistance curve informs about the additional ductility and energy dissipation
capacity of the structure.
Limit of Collapse: This limit includes partial or total collapse of the building
(dcoll).
The resistance curve is bilinearized in order to simplify the calculations. For this
purpose, the equal energy principle is used (Figure 3.11).
Figure 3.11. Idealization of Resistance Curve and Definition of Limit States
By using experimental data and the damage grades similar to European
Macroseismic Scale (EMS-98) (Grünthal, 1998), the observed damage is related to
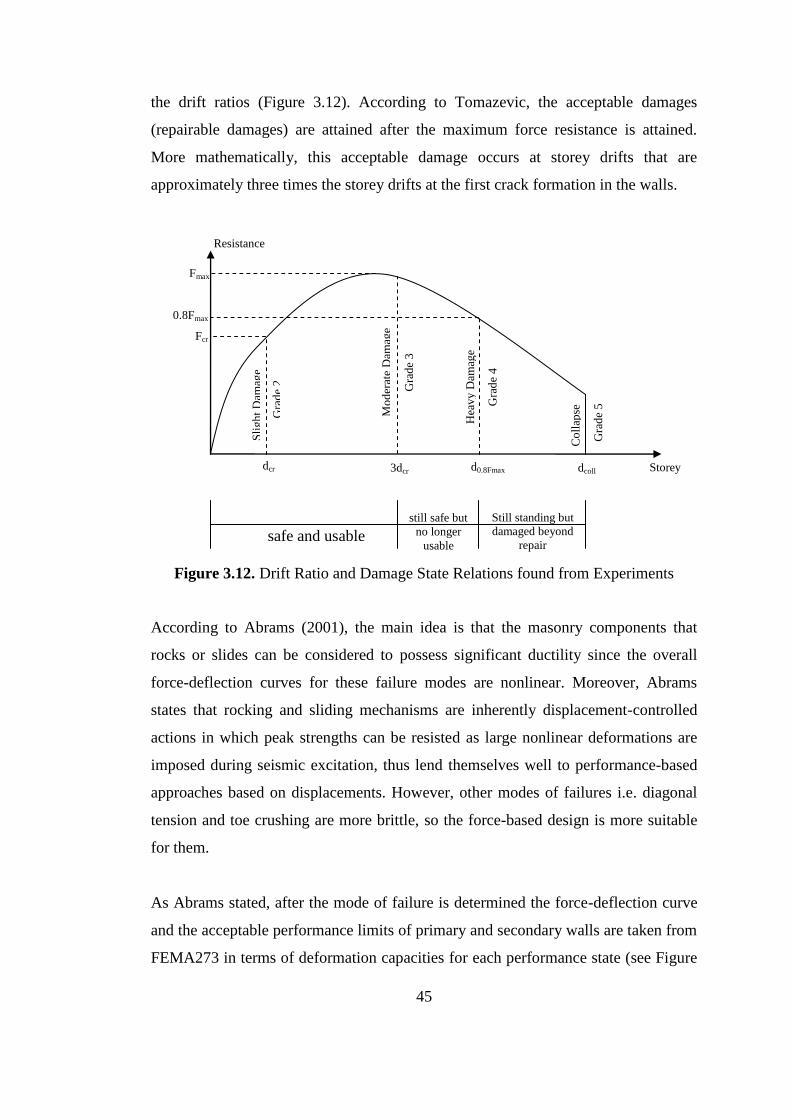
45
the drift ratios (Figure 3.12). According to Tomazevic, the acceptable damages
(repairable damages) are attained after the maximum force resistance is attained.
More mathematically, this acceptable damage occurs at storey drifts that are
approximately three times the storey drifts at the first crack formation in the walls.
Figure 3.12. Drift Ratio and Damage State Relations found from Experiments
According to Abrams (2001), the main idea is that the masonry components that
rocks or slides can be considered to possess significant ductility since the overall
force-deflection curves for these failure modes are nonlinear. Moreover, Abrams
states that rocking and sliding mechanisms are inherently displacement-controlled
actions in which peak strengths can be resisted as large nonlinear deformations are
imposed during seismic excitation, thus lend themselves well to performance-based
approaches based on displacements. However, other modes of failures i.e. diagonal
tension and toe crushing are more brittle, so the force-based design is more suitable
for them.
As Abrams stated, after the mode of failure is determined the force-deflection curve
and the acceptable performance limits of primary and secondary walls are taken from
FEMA273 in terms of deformation capacities for each performance state (see Figure
0.8Fmax
Storey
Drift
still safe but
no longer
usable
Still standing but
damaged beyond
repair
safe and usable
dcoll 3dcr d0.8Fmax
Fcr
Fmax
Resistance
dcr
Gra
de
5
Co
llap
se G
rad
e 4
Hea
vy
Dam
age
Gra
de
3
Mo
der
ate
Dam
age
Gra
de
2
Sli
gh
t D
amag
e
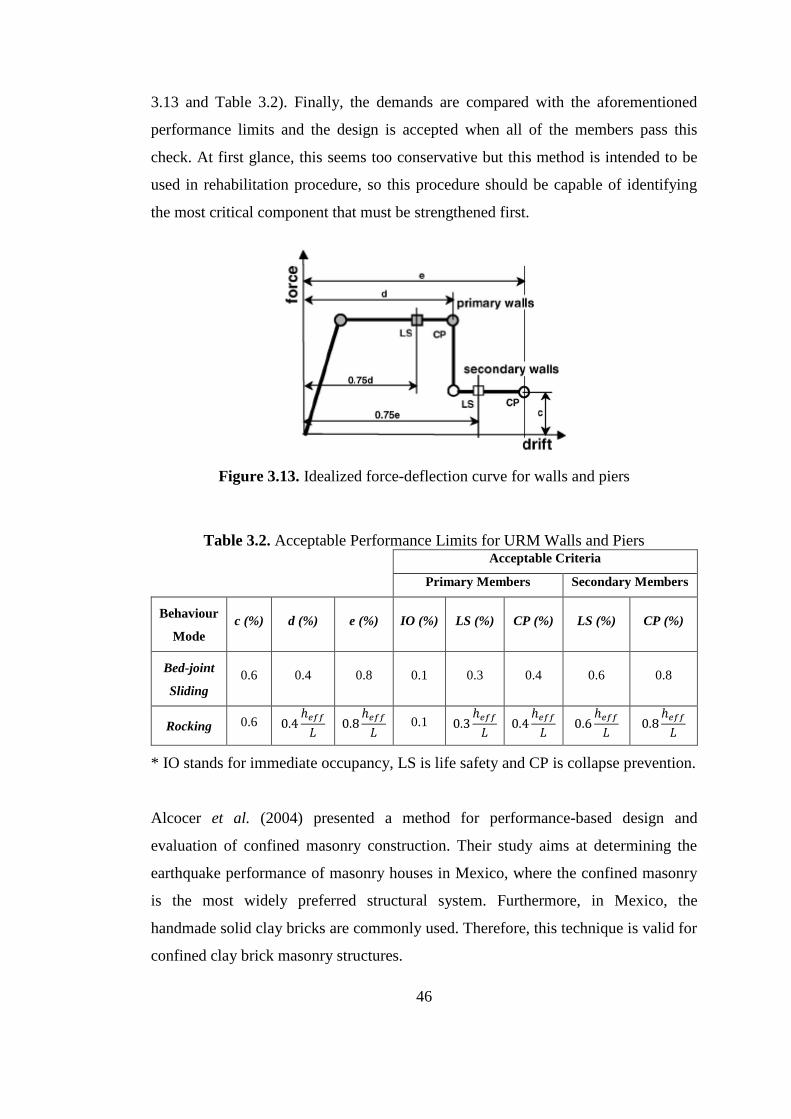
46
3.13 and Table 3.2). Finally, the demands are compared with the aforementioned
performance limits and the design is accepted when all of the members pass this
check. At first glance, this seems too conservative but this method is intended to be
used in rehabilitation procedure, so this procedure should be capable of identifying
the most critical component that must be strengthened first.
Figure 3.13. Idealized force-deflection curve for walls and piers
Table 3.2. Acceptable Performance Limits for URM Walls and Piers
Acceptable Criteria
Primary Members Secondary Members
Behaviour
Mode
c (%) d (%) e (%) IO (%) LS (%) CP (%) LS (%) CP (%)
Bed-joint
Sliding
0.6 0.4 0.8 0.1 0.3 0.4 0.6 0.8
Rocking 0.6 0.1
* IO stands for immediate occupancy, LS is life safety and CP is collapse prevention.
Alcocer et al. (2004) presented a method for performance-based design and
evaluation of confined masonry construction. Their study aims at determining the
earthquake performance of masonry houses in Mexico, where the confined masonry
is the most widely preferred structural system. Furthermore, in Mexico, the
handmade solid clay bricks are commonly used. Therefore, this technique is valid for
confined clay brick masonry structures.
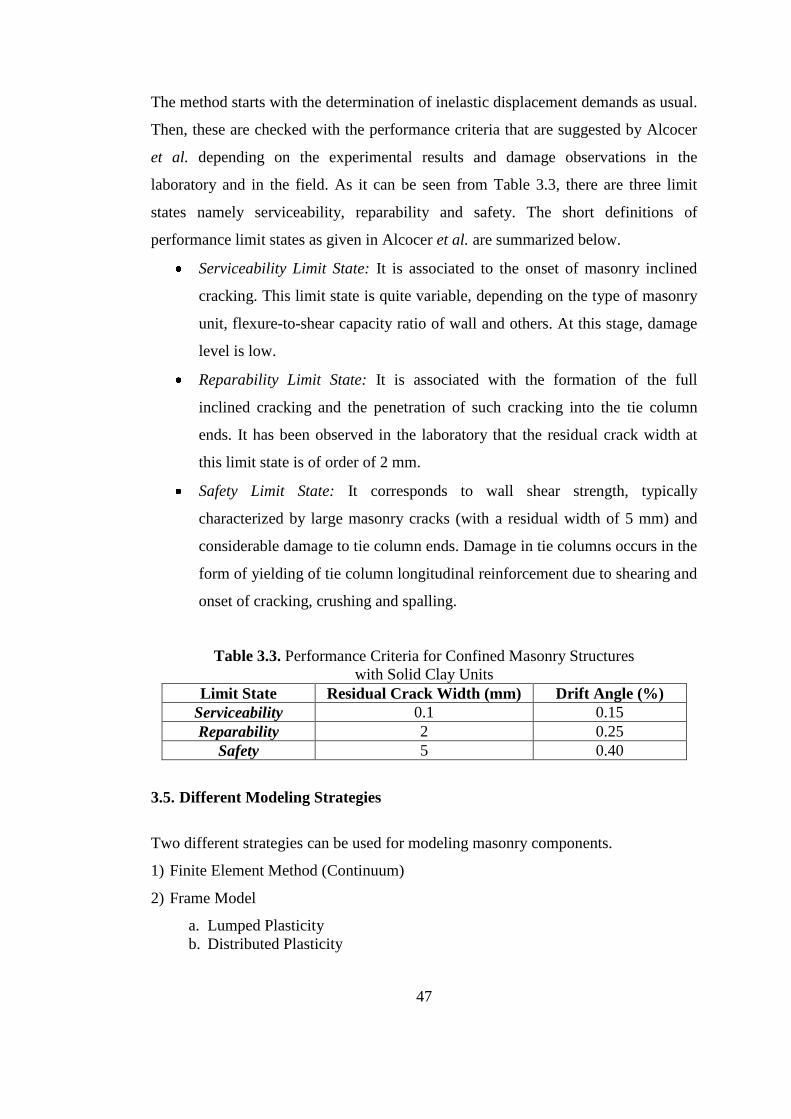
47
The method starts with the determination of inelastic displacement demands as usual.
Then, these are checked with the performance criteria that are suggested by Alcocer
et al. depending on the experimental results and damage observations in the
laboratory and in the field. As it can be seen from Table 3.3, there are three limit
states namely serviceability, reparability and safety. The short definitions of
performance limit states as given in Alcocer et al. are summarized below.
Serviceability Limit State: It is associated to the onset of masonry inclined
cracking. This limit state is quite variable, depending on the type of masonry
unit, flexure-to-shear capacity ratio of wall and others. At this stage, damage
level is low.
Reparability Limit State: It is associated with the formation of the full
inclined cracking and the penetration of such cracking into the tie column
ends. It has been observed in the laboratory that the residual crack width at
this limit state is of order of 2 mm.
Safety Limit State: It corresponds to wall shear strength, typically
characterized by large masonry cracks (with a residual width of 5 mm) and
considerable damage to tie column ends. Damage in tie columns occurs in the
form of yielding of tie column longitudinal reinforcement due to shearing and
onset of cracking, crushing and spalling.
Table 3.3. Performance Criteria for Confined Masonry Structures
with Solid Clay Units
Limit State Residual Crack Width (mm) Drift Angle (%)
Serviceability 0.1 0.15
Reparability 2 0.25
Safety 5 0.40
3.5. Different Modeling Strategies
Two different strategies can be used for modeling masonry components.
1) Finite Element Method (Continuum)
2) Frame Model
a. Lumped Plasticity
b. Distributed Plasticity
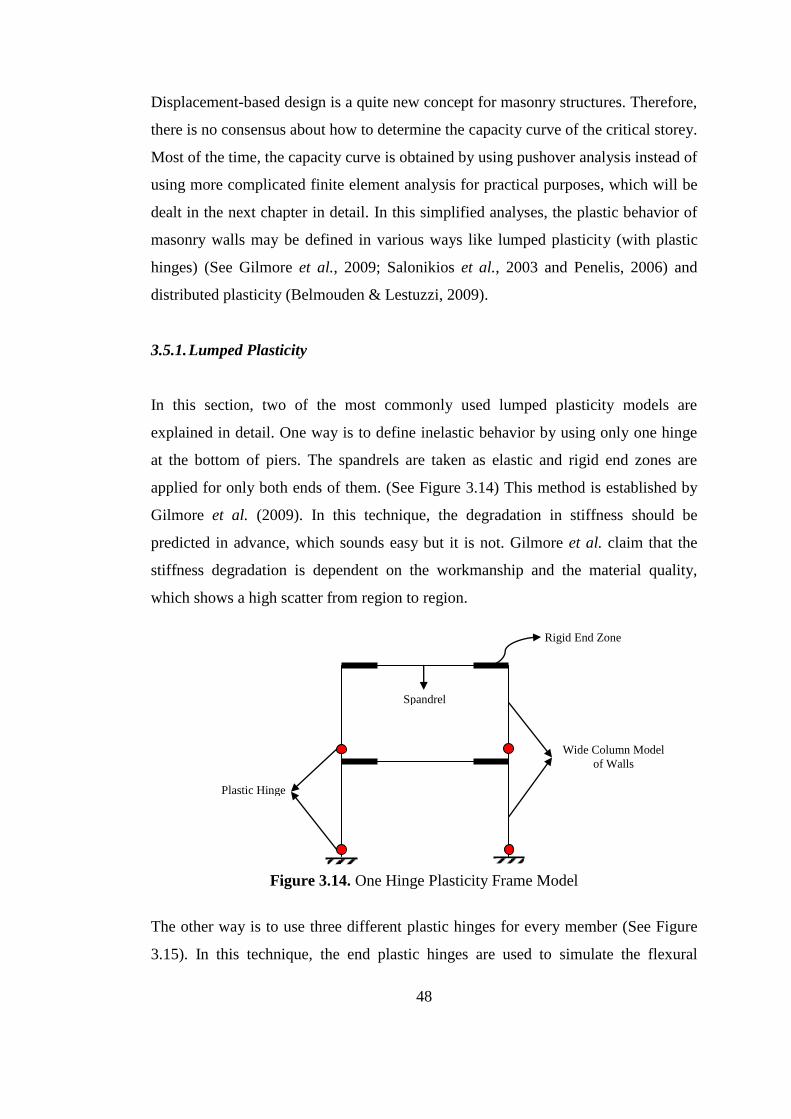
48
Displacement-based design is a quite new concept for masonry structures. Therefore,
there is no consensus about how to determine the capacity curve of the critical storey.
Most of the time, the capacity curve is obtained by using pushover analysis instead of
using more complicated finite element analysis for practical purposes, which will be
dealt in the next chapter in detail. In this simplified analyses, the plastic behavior of
masonry walls may be defined in various ways like lumped plasticity (with plastic
hinges) (See Gilmore et al., 2009; Salonikios et al., 2003 and Penelis, 2006) and
distributed plasticity (Belmouden & Lestuzzi, 2009).
3.5.1. Lumped Plasticity
In this section, two of the most commonly used lumped plasticity models are
explained in detail. One way is to define inelastic behavior by using only one hinge
at the bottom of piers. The spandrels are taken as elastic and rigid end zones are
applied for only both ends of them. (See Figure 3.14) This method is established by
Gilmore et al. (2009). In this technique, the degradation in stiffness should be
predicted in advance, which sounds easy but it is not. Gilmore et al. claim that the
stiffness degradation is dependent on the workmanship and the material quality,
which shows a high scatter from region to region.
Figure 3.14. One Hinge Plasticity Frame Model
The other way is to use three different plastic hinges for every member (See Figure
3.15). In this technique, the end plastic hinges are used to simulate the flexural
Spandrel
Rigid End Zone
Wide Column Model
of Walls
Plastic Hinge

49
behavior. Therefore, these hinges are defined as moment versus rotation (M-θ). The
moment capacities are found in a similar fashion to reinforced concrete case, i.e. the
rectangular block concept is used. The maximum rotation capacity for flexural
hinges is defined by experimental data as 1% according to Penelis (2006) or the
region specific value can also be used. The other plastic hinge is placed in the middle
and utilized to describe the shear behavior (V-∆). More detailed explanation of this
method can be found in Salonikios et al. (2003).
Figure 3.15. Three Hinge Frame Model Details (Salonikios et al., 2003)
After the analysis method is selected, the limit states for the critical storey should be
determined and these limits ought to be compared with the displacement demands. In
literature, there are many displacement limits given in different studies, five of which
are summarized in this dissertation.
Flexural Plastic Hinge
Rigid End Zone
Flexural Plastic Hinge
Shear Plastic Hinge
Rigid End Zone
Rig
id E
nd
Zo
ne
Shear Plastic Hinge
Flexural Plastic Hinge
Rig
id E
nd
Zo
ne
(a) Pier Frame Model (b) Spandrel Frame Model

50
CHAPTER 4
FINITE ELEMENT MODELING OF THE IN-PLANE BEHAVIOR OF
MASONRY WALL ELEMENTS
4.1. Introduction
In the first part of this chapter, a distinct finite element model for simulating the in-
plane behavior of masonry walls is introduced after short definitions of in-plane
modeling techniques common for masonry. Then, the assumptions and restrictions of
this new model along with the material properties, i.e. plasticity, are summarized.
Finally, the sufficiency of this model is tested by comparing its estimations with the
experimental result of a wall tested in ETH Zurich.
4.2. Modeling Technique for Masonry Wall Elements
There is a need to estimate the behavior of masonry structures analytically because
the design process demands the internal forces whereas the assessment process
requires the simulation of the behavior of an existing structure in order to evaluate
the expected performance under some external effects like earthquake, wind,
explosion, etc. These analytical models can also be used to evaluate the code criteria
and give researchers the chance to improve them.
Unfortunately, no analytical modeling technique has been able to simulate the
behavior of the masonry structures exactly. This is because; the masonry structures
have very complex non-homogeneous and anisotropic material properties as they are
composed of mortar and masonry units.
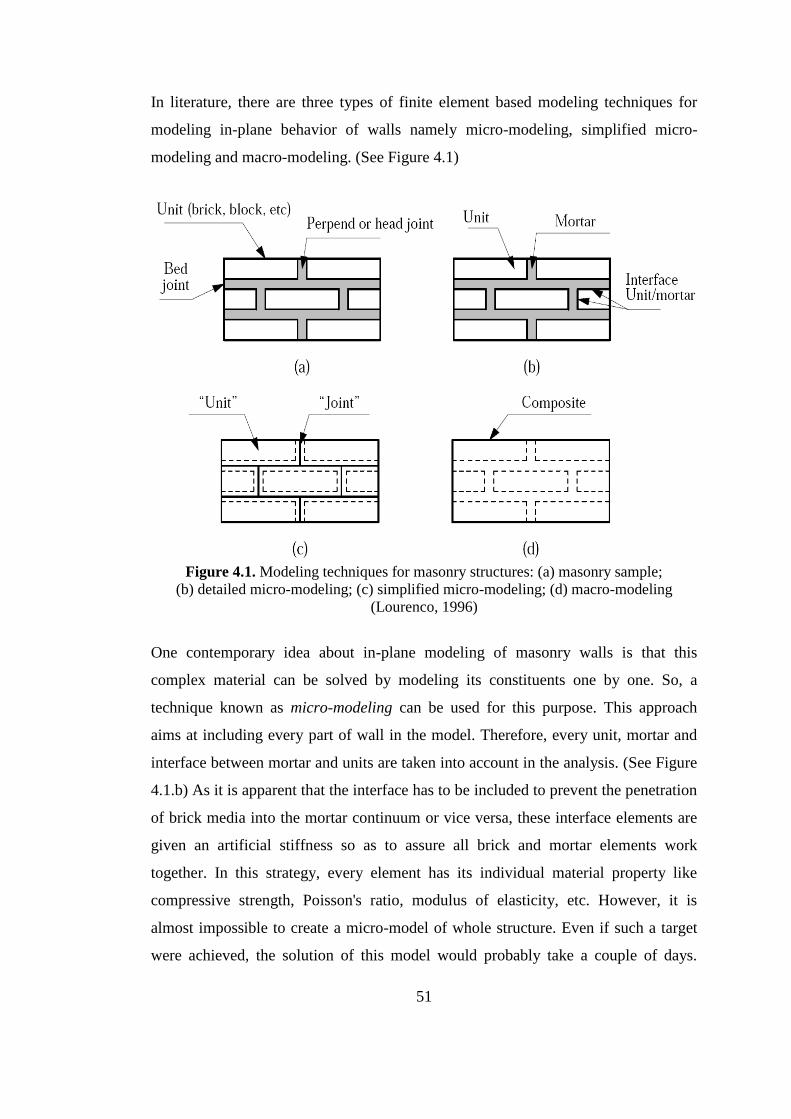
51
In literature, there are three types of finite element based modeling techniques for
modeling in-plane behavior of walls namely micro-modeling, simplified micro-
modeling and macro-modeling. (See Figure 4.1)
Figure 4.1. Modeling techniques for masonry structures: (a) masonry sample;
(b) detailed micro-modeling; (c) simplified micro-modeling; (d) macro-modeling
(Lourenco, 1996)
One contemporary idea about in-plane modeling of masonry walls is that this
complex material can be solved by modeling its constituents one by one. So, a
technique known as micro-modeling can be used for this purpose. This approach
aims at including every part of wall in the model. Therefore, every unit, mortar and
interface between mortar and units are taken into account in the analysis. (See Figure
4.1.b) As it is apparent that the interface has to be included to prevent the penetration
of brick media into the mortar continuum or vice versa, these interface elements are
given an artificial stiffness so as to assure all brick and mortar elements work
together. In this strategy, every element has its individual material property like
compressive strength, Poisson's ratio, modulus of elasticity, etc. However, it is
almost impossible to create a micro-model of whole structure. Even if such a target
were achieved, the solution of this model would probably take a couple of days.
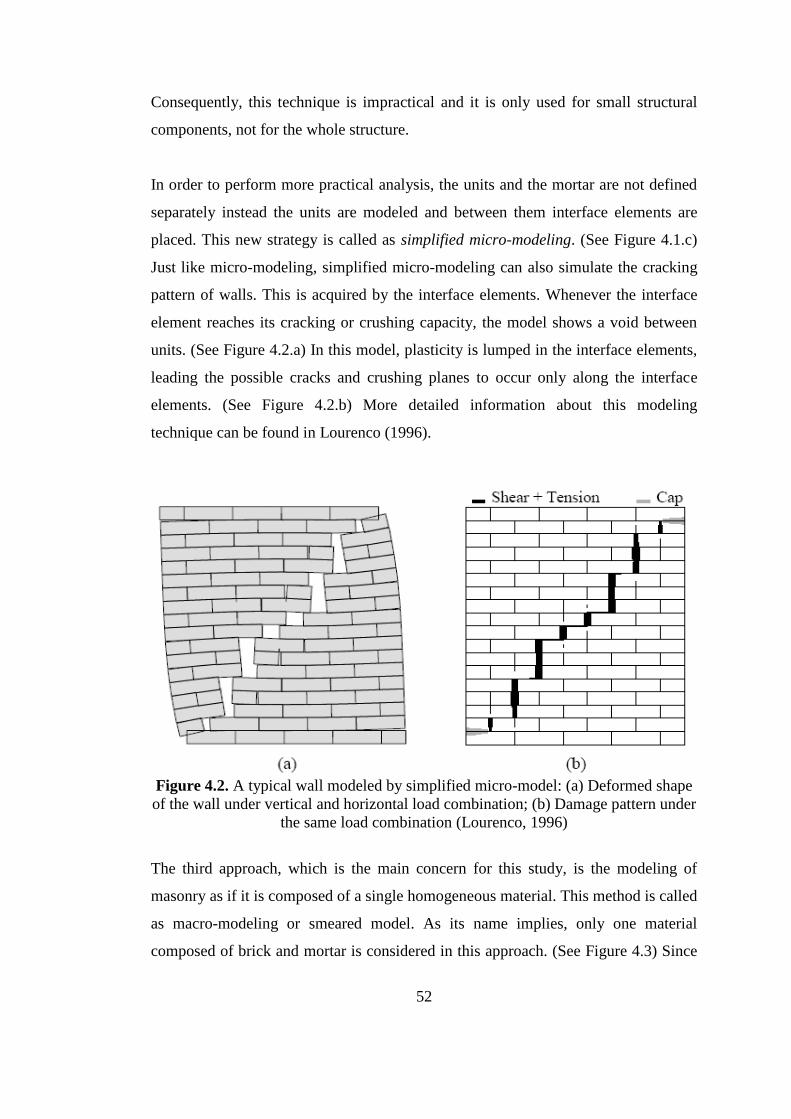
52
Consequently, this technique is impractical and it is only used for small structural
components, not for the whole structure.
In order to perform more practical analysis, the units and the mortar are not defined
separately instead the units are modeled and between them interface elements are
placed. This new strategy is called as simplified micro-modeling. (See Figure 4.1.c)
Just like micro-modeling, simplified micro-modeling can also simulate the cracking
pattern of walls. This is acquired by the interface elements. Whenever the interface
element reaches its cracking or crushing capacity, the model shows a void between
units. (See Figure 4.2.a) In this model, plasticity is lumped in the interface elements,
leading the possible cracks and crushing planes to occur only along the interface
elements. (See Figure 4.2.b) More detailed information about this modeling
technique can be found in Lourenco (1996).
Figure 4.2. A typical wall modeled by simplified micro-model: (a) Deformed shape
of the wall under vertical and horizontal load combination; (b) Damage pattern under
the same load combination (Lourenco, 1996)
The third approach, which is the main concern for this study, is the modeling of
masonry as if it is composed of a single homogeneous material. This method is called
as macro-modeling or smeared model. As its name implies, only one material
composed of brick and mortar is considered in this approach. (See Figure 4.3) Since
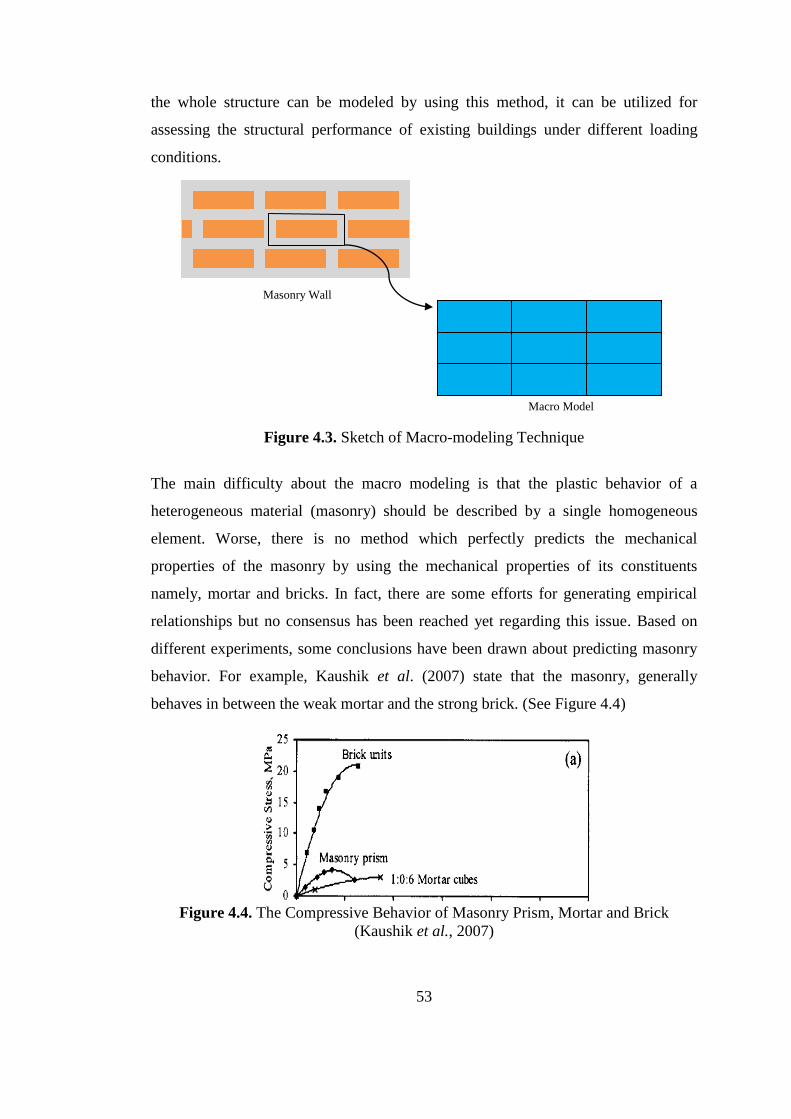
53
the whole structure can be modeled by using this method, it can be utilized for
assessing the structural performance of existing buildings under different loading
conditions.
Figure 4.3. Sketch of Macro-modeling Technique
The main difficulty about the macro modeling is that the plastic behavior of a
heterogeneous material (masonry) should be described by a single homogeneous
element. Worse, there is no method which perfectly predicts the mechanical
properties of the masonry by using the mechanical properties of its constituents
namely, mortar and bricks. In fact, there are some efforts for generating empirical
relationships but no consensus has been reached yet regarding this issue. Based on
different experiments, some conclusions have been drawn about predicting masonry
behavior. For example, Kaushik et al. (2007) state that the masonry, generally
behaves in between the weak mortar and the strong brick. (See Figure 4.4)
Figure 4.4. The Compressive Behavior of Masonry Prism, Mortar and Brick
(Kaushik et al., 2007)
Macro Model
Masonry Wall
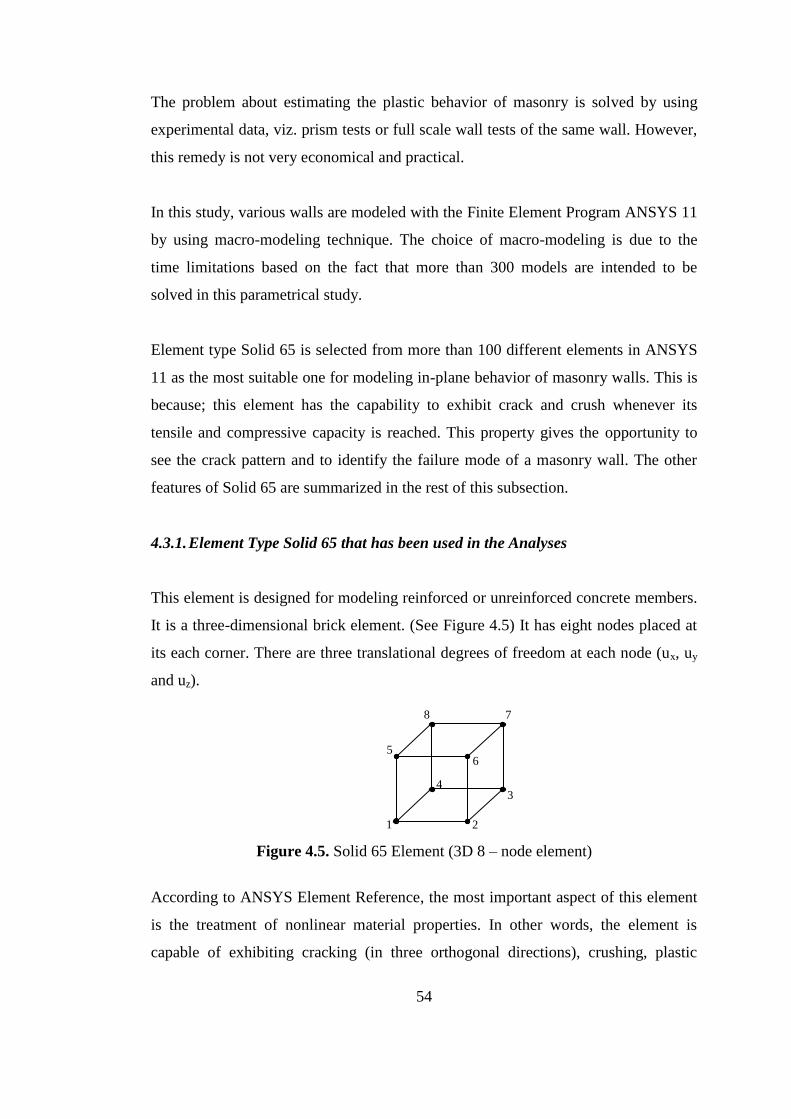
54
The problem about estimating the plastic behavior of masonry is solved by using
experimental data, viz. prism tests or full scale wall tests of the same wall. However,
this remedy is not very economical and practical.
In this study, various walls are modeled with the Finite Element Program ANSYS 11
by using macro-modeling technique. The choice of macro-modeling is due to the
time limitations based on the fact that more than 300 models are intended to be
solved in this parametrical study.
Element type Solid 65 is selected from more than 100 different elements in ANSYS
11 as the most suitable one for modeling in-plane behavior of masonry walls. This is
because; this element has the capability to exhibit crack and crush whenever its
tensile and compressive capacity is reached. This property gives the opportunity to
see the crack pattern and to identify the failure mode of a masonry wall. The other
features of Solid 65 are summarized in the rest of this subsection.
4.3.1. Element Type Solid 65 that has been used in the Analyses
This element is designed for modeling reinforced or unreinforced concrete members.
It is a three-dimensional brick element. (See Figure 4.5) It has eight nodes placed at
its each corner. There are three translational degrees of freedom at each node (ux, uy
and uz).
Figure 4.5. Solid 65 Element (3D 8 – node element)
According to ANSYS Element Reference, the most important aspect of this element
is the treatment of nonlinear material properties. In other words, the element is
capable of exhibiting cracking (in three orthogonal directions), crushing, plastic
5
4
6
7 8
1 2
3
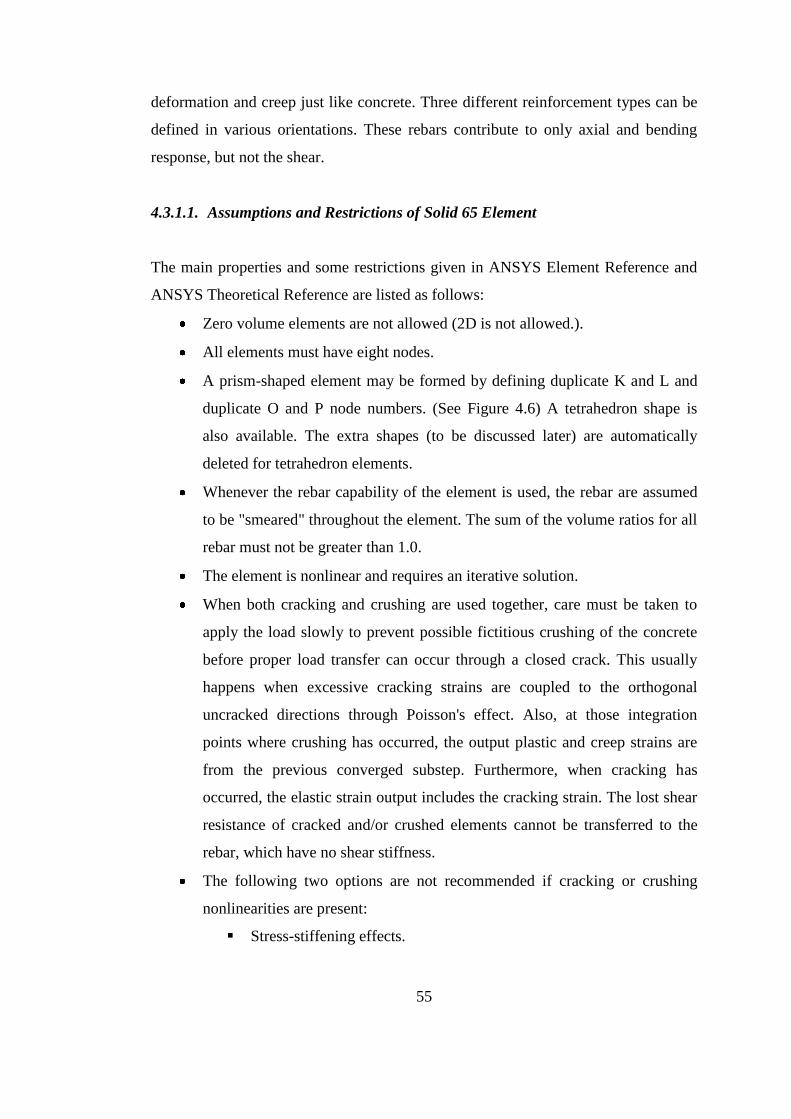
55
deformation and creep just like concrete. Three different reinforcement types can be
defined in various orientations. These rebars contribute to only axial and bending
response, but not the shear.
4.3.1.1. Assumptions and Restrictions of Solid 65 Element
The main properties and some restrictions given in ANSYS Element Reference and
ANSYS Theoretical Reference are listed as follows:
Zero volume elements are not allowed (2D is not allowed.).
All elements must have eight nodes.
A prism-shaped element may be formed by defining duplicate K and L and
duplicate O and P node numbers. (See Figure 4.6) A tetrahedron shape is
also available. The extra shapes (to be discussed later) are automatically
deleted for tetrahedron elements.
Whenever the rebar capability of the element is used, the rebar are assumed
to be "smeared" throughout the element. The sum of the volume ratios for all
rebar must not be greater than 1.0.
The element is nonlinear and requires an iterative solution.
When both cracking and crushing are used together, care must be taken to
apply the load slowly to prevent possible fictitious crushing of the concrete
before proper load transfer can occur through a closed crack. This usually
happens when excessive cracking strains are coupled to the orthogonal
uncracked directions through Poisson's effect. Also, at those integration
points where crushing has occurred, the output plastic and creep strains are
from the previous converged substep. Furthermore, when cracking has
occurred, the elastic strain output includes the cracking strain. The lost shear
resistance of cracked and/or crushed elements cannot be transferred to the
rebar, which have no shear stiffness.
The following two options are not recommended if cracking or crushing
nonlinearities are present:
Stress-stiffening effects.
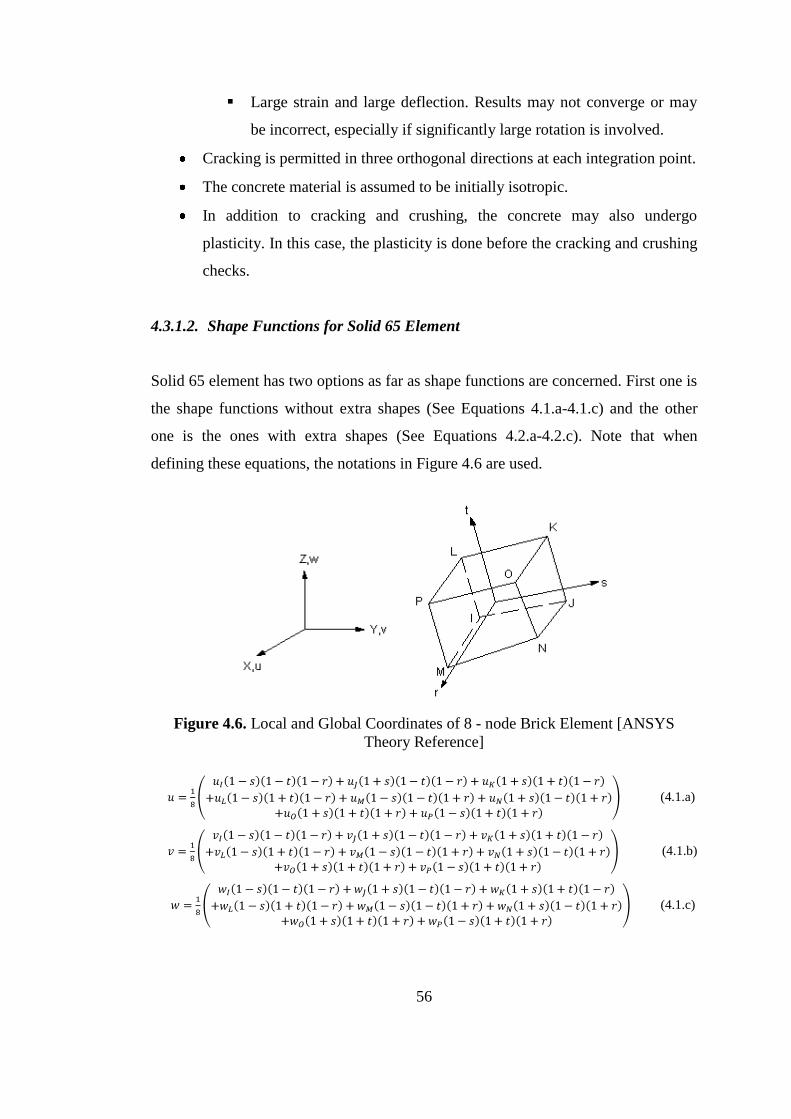
56
Large strain and large deflection. Results may not converge or may
be incorrect, especially if significantly large rotation is involved.
Cracking is permitted in three orthogonal directions at each integration point.
The concrete material is assumed to be initially isotropic.
In addition to cracking and crushing, the concrete may also undergo
plasticity. In this case, the plasticity is done before the cracking and crushing
checks.
4.3.1.2. Shape Functions for Solid 65 Element
Solid 65 element has two options as far as shape functions are concerned. First one is
the shape functions without extra shapes (See Equations 4.1.a-4.1.c) and the other
one is the ones with extra shapes (See Equations 4.2.a-4.2.c). Note that when
defining these equations, the notations in Figure 4.6 are used.
Figure 4.6. Local and Global Coordinates of 8 - node Brick Element [ANSYS
Theory Reference]
(4.1.a)
(4.1.b)
(4.1.c)

57
As it can easily be inferred from Equations 4.1-4.2, there are three extra terms in
every displacement shapes. (See last three terms in Equations 4.2.a-4.2.c) These
additional variables are used to define the bending shape better. In other words, these
extra polynomial terms prevent the parasitic shear occurring in the element known as
shear locking. This remedy is also applied to the four-node plane elements (Q4) and
Q4 element is turned to Q6 elements. However, this solution leads to the
incompatible modes when more than one element is used to model a member, which
is most of the time the case. (See Cook et al., 2002 for details)
(4.2.a)
(4.2.b)
(4.2.c)
4.3.1.3. Quadrature Points for Solid 65 Element
In ANSYS, element and global stiffness matrices are formed and then their values
are calculated by using the numerical methods (not the analytical ones) for the sake
of less computer power and time consumption. The Gauss-Quadrature is employed in
ANSYS as this numerical approach is one of the best methods for integrating the
polynomials. Specifically, 2x2x2 point Gauss-Quadrature is used for Solid 65
formulation, which calculates the exact integral of polynomials up to third degree.
(See Figure 4.7) Therefore, the exact stiffness matrix of Solid 65 is used in the
analysis as the displacement shape polynomial has utmost second degree. (See
Equations 4.1 and 4.2)
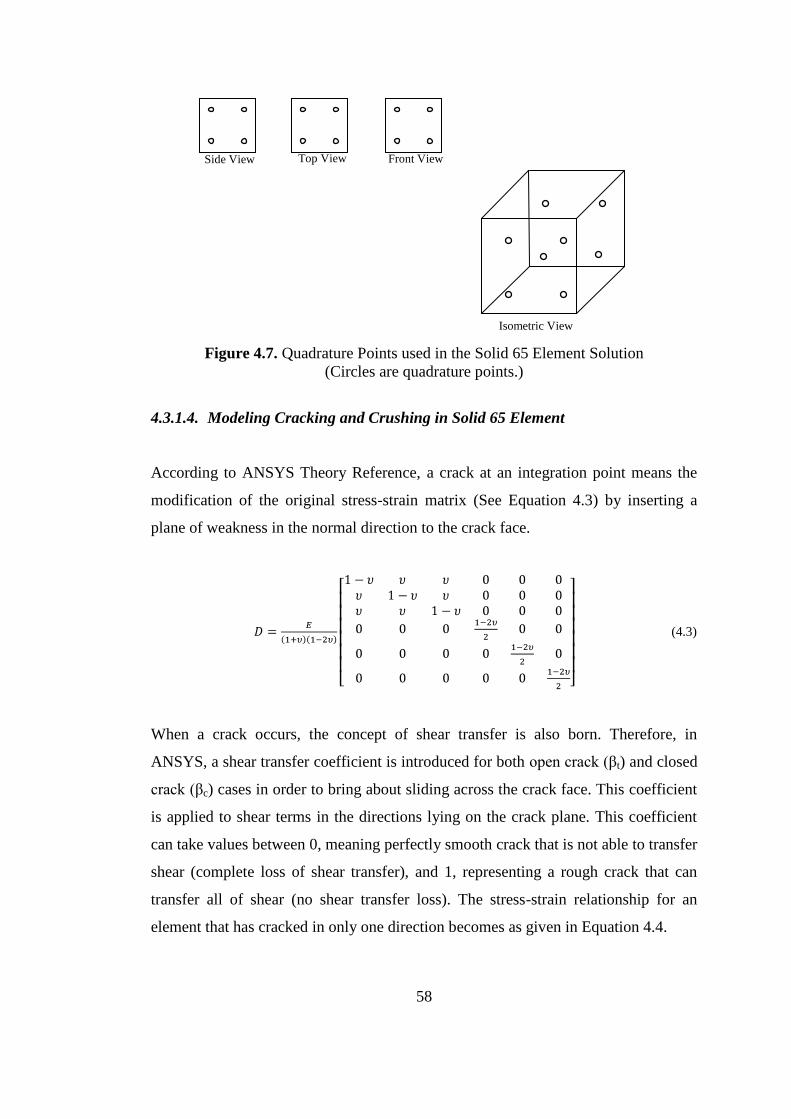
58
Figure 4.7. Quadrature Points used in the Solid 65 Element Solution
(Circles are quadrature points.)
4.3.1.4. Modeling Cracking and Crushing in Solid 65 Element
According to ANSYS Theory Reference, a crack at an integration point means the
modification of the original stress-strain matrix (See Equation 4.3) by inserting a
plane of weakness in the normal direction to the crack face.
(4.3)
When a crack occurs, the concept of shear transfer is also born. Therefore, in
ANSYS, a shear transfer coefficient is introduced for both open crack (βt) and closed
crack (βc) cases in order to bring about sliding across the crack face. This coefficient
is applied to shear terms in the directions lying on the crack plane. This coefficient
can take values between 0, meaning perfectly smooth crack that is not able to transfer
shear (complete loss of shear transfer), and 1, representing a rough crack that can
transfer all of shear (no shear transfer loss). The stress-strain relationship for an
element that has cracked in only one direction becomes as given in Equation 4.4.
Side View Top View Front View
Isometric View
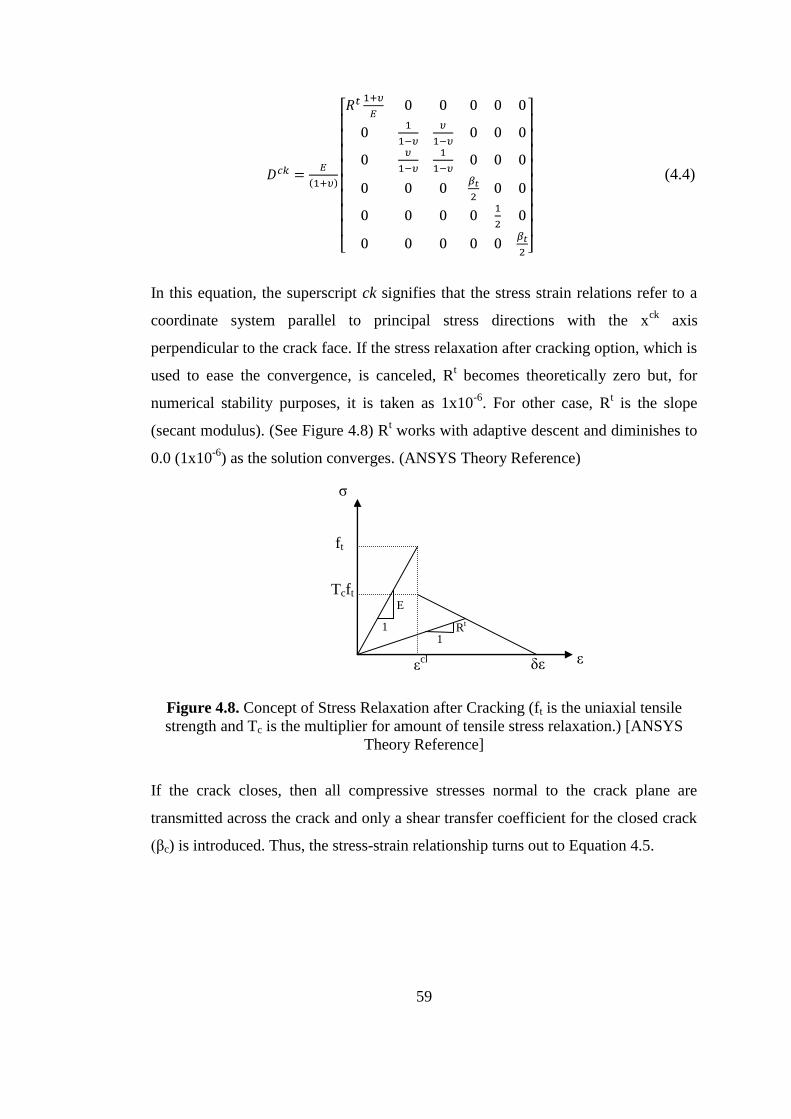
59
(4.4)
In this equation, the superscript ck signifies that the stress strain relations refer to a
coordinate system parallel to principal stress directions with the xck
axis
perpendicular to the crack face. If the stress relaxation after cracking option, which is
used to ease the convergence, is canceled, Rt becomes theoretically zero but, for
numerical stability purposes, it is taken as 1x10⁻⁶
. For other case, Rt is the slope
(secant modulus). (See Figure 4.8) Rt works with adaptive descent and diminishes to
0.0 (1x10⁻⁶
) as the solution converges. (ANSYS Theory Reference)
Figure 4.8. Concept of Stress Relaxation after Cracking (ft is the uniaxial tensile
strength and Tc is the multiplier for amount of tensile stress relaxation.) [ANSYS
Theory Reference]
If the crack closes, then all compressive stresses normal to the crack plane are
transmitted across the crack and only a shear transfer coefficient for the closed crack
(βc) is introduced. Thus, the stress-strain relationship turns out to Equation 4.5.
δε εck
Tcft
ft
Rt
E
1 1
ε
ζ

60
(4.5)
In summary, if a crack closes then all of the axial terms in the constitutive relation
returns to their original values but the shear terms have a coefficient related to the
shear transfer capability of the crack. (See Equations 4.3 and 4.5)
In ANSYS, the cracked direction is treated as if it is not closed in the following first
iteration and checks whether it is closed or not by controlling the strains. By using
this algorithm, the constitutive relations are changed to catch the real behavior.
As the element can crack in all three principal directions at any integration point, it is
beneficial to show the stress-strain relations of two directional and three directional
cracks. (See Equations 4.6 and 4.7)
(4.6)
(4.7)
If the cracks in all directions close, the relations for both two directional and three
directional cases turn out to be Equation 4.8.
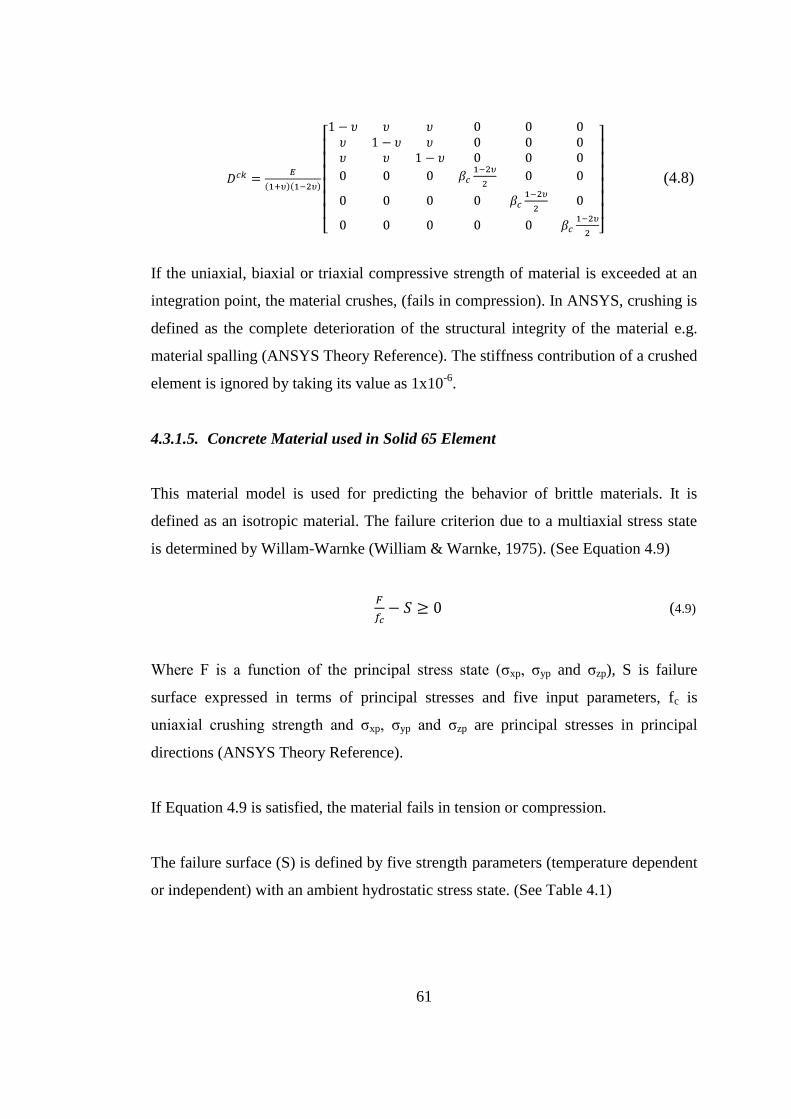
61
(4.8)
If the uniaxial, biaxial or triaxial compressive strength of material is exceeded at an
integration point, the material crushes, (fails in compression). In ANSYS, crushing is
defined as the complete deterioration of the structural integrity of the material e.g.
material spalling (ANSYS Theory Reference). The stiffness contribution of a crushed
element is ignored by taking its value as 1x10⁻⁶
.
4.3.1.5. Concrete Material used in Solid 65 Element
This material model is used for predicting the behavior of brittle materials. It is
defined as an isotropic material. The failure criterion due to a multiaxial stress state
is determined by Willam-Warnke (William & Warnke, 1975). (See Equation 4.9)
(4.9)
Where F is a function of the principal stress state (ζxp, ζyp and ζzp), S is failure
surface expressed in terms of principal stresses and five input parameters, fc is
uniaxial crushing strength and ζxp, ζyp and ζzp are principal stresses in principal
directions (ANSYS Theory Reference).
If Equation 4.9 is satisfied, the material fails in tension or compression.
The failure surface (S) is defined by five strength parameters (temperature dependent
or independent) with an ambient hydrostatic stress state. (See Table 4.1)

62
Table 4.1. Willam-Warnke Failure Surface Parameters [ANSYS Theory Reference]
Parameter Definition
ft Ultimate uniaxial tensile strength
fc Ultimate uniaxial compressive strength
fcb Ultimate biaxial compressive strength
f1 Ultimate compressive strength for a state of biaxial
compression superimposed on hydrostatic stress state (ζh)
f2 Ultimate compressive strength for a state of uniaxial
compression superimposed on hydrostatic stress state (ζh)
If the parameters fcb, f1 and f2 are not known, then the default values given by
Willam-Warnke can also be used as far as the hydrostatic stress state is less than or
equal to . (See Equation 4.10)
(4.10.a)
(4.10.b)
(4.10.c)
valid if Equation 4.11 holds.
(4.11)
After sorting the principal stresses from maximum to minimum (See Equation 4.12),
the failure domains of concrete reduce to four.
(4.12.a)
(4.12.b)
I. II.
III. IV.
In every domain, different functions for principal stress state (F) and failure
surface(S) exist. These four functions for F and S will be called with subscripts
i=1,2,3 and 4. Before these functions are investigated in detail, some properties of
failure surface(S) are mentioned. The functions Si have the properties that the surface
they describe is continuous while the surface gradients are not continuous when any
one of the principal stresses changes sign (ANSYS Theory Reference). (See Figures
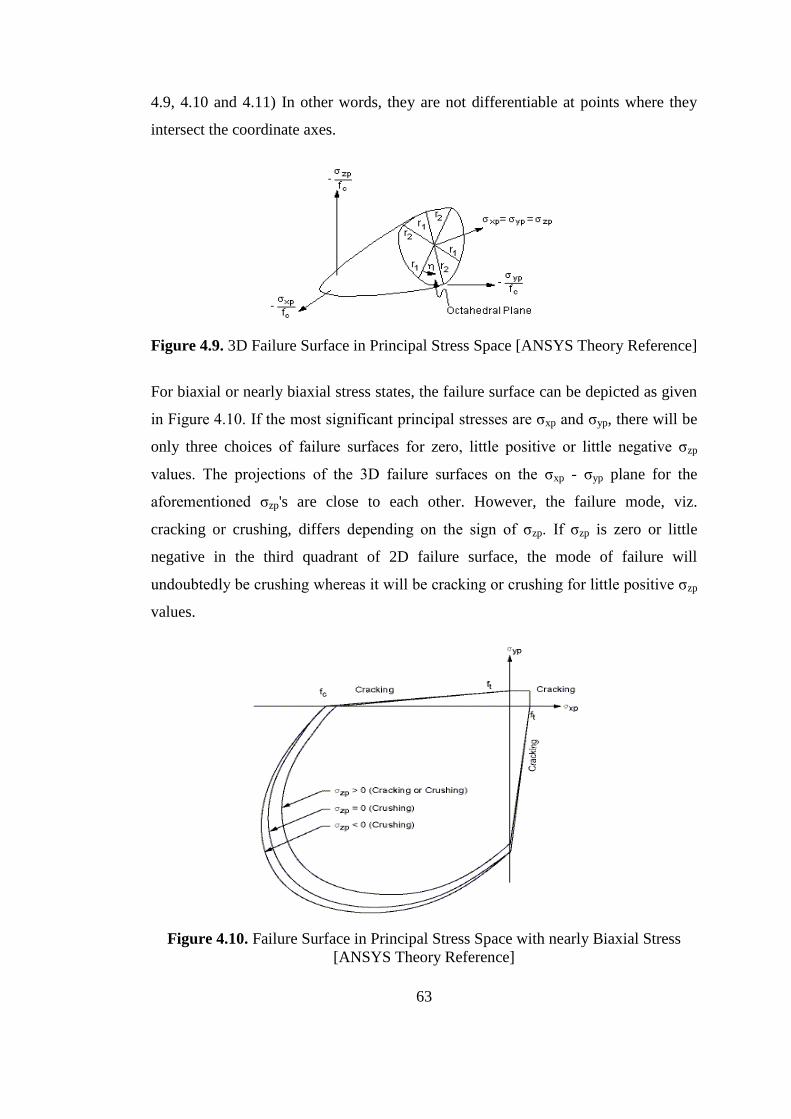
63
4.9, 4.10 and 4.11) In other words, they are not differentiable at points where they
intersect the coordinate axes.
Figure 4.9. 3D Failure Surface in Principal Stress Space [ANSYS Theory Reference]
For biaxial or nearly biaxial stress states, the failure surface can be depicted as given
in Figure 4.10. If the most significant principal stresses are ζxp and ζyp, there will be
only three choices of failure surfaces for zero, little positive or little negative ζzp
values. The projections of the 3D failure surfaces on the ζxp - ζyp plane for the
aforementioned ζzp's are close to each other. However, the failure mode, viz.
cracking or crushing, differs depending on the sign of ζzp. If ζzp is zero or little
negative in the third quadrant of 2D failure surface, the mode of failure will
undoubtedly be crushing whereas it will be cracking or crushing for little positive ζzp
values.
Figure 4.10. Failure Surface in Principal Stress Space with nearly Biaxial Stress
[ANSYS Theory Reference]
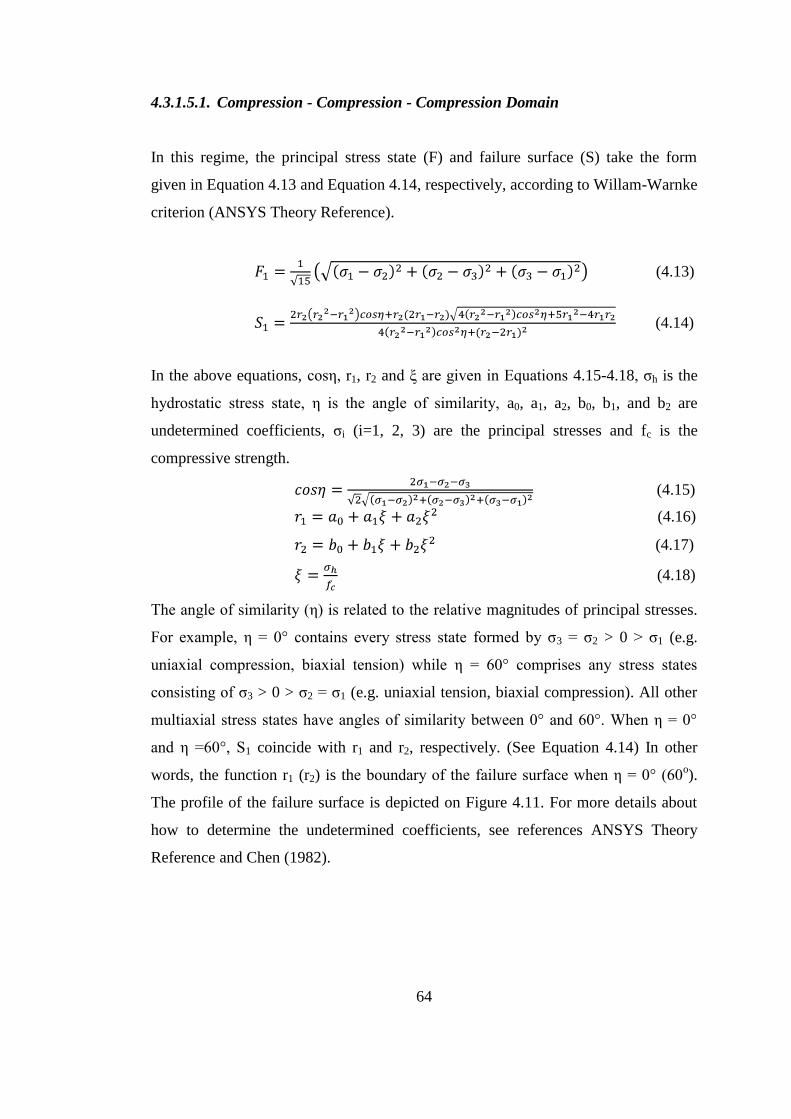
64
4.3.1.5.1. Compression - Compression - Compression Domain
In this regime, the principal stress state (F) and failure surface (S) take the form
given in Equation 4.13 and Equation 4.14, respectively, according to Willam-Warnke
criterion (ANSYS Theory Reference).
(4.13)
(4.14)
In the above equations, cosη, r1, r2 and ξ are given in Equations 4.15-4.18, ζh is the
hydrostatic stress state, η is the angle of similarity, a0, a1, a2, b0, b1, and b2 are
undetermined coefficients, ζi (i=1, 2, 3) are the principal stresses and fc is the
compressive strength.
(4.15)
(4.16)
(4.17)
(4.18)
The angle of similarity (η) is related to the relative magnitudes of principal stresses.
For example, η = 0° contains every stress state formed by ζ3 = ζ2 > 0 > ζ1 (e.g.
uniaxial compression, biaxial tension) while η = 60° comprises any stress states
consisting of ζ3 > 0 > ζ2 = ζ1 (e.g. uniaxial tension, biaxial compression). All other
multiaxial stress states have angles of similarity between 0° and 60°. When η = 0°
and η =60°, S1 coincide with r1 and r2, respectively. (See Equation 4.14) In other
words, the function r1 (r2) is the boundary of the failure surface when η = 0° (60o).
The profile of the failure surface is depicted on Figure 4.11. For more details about
how to determine the undetermined coefficients, see references ANSYS Theory
Reference and Chen (1982).
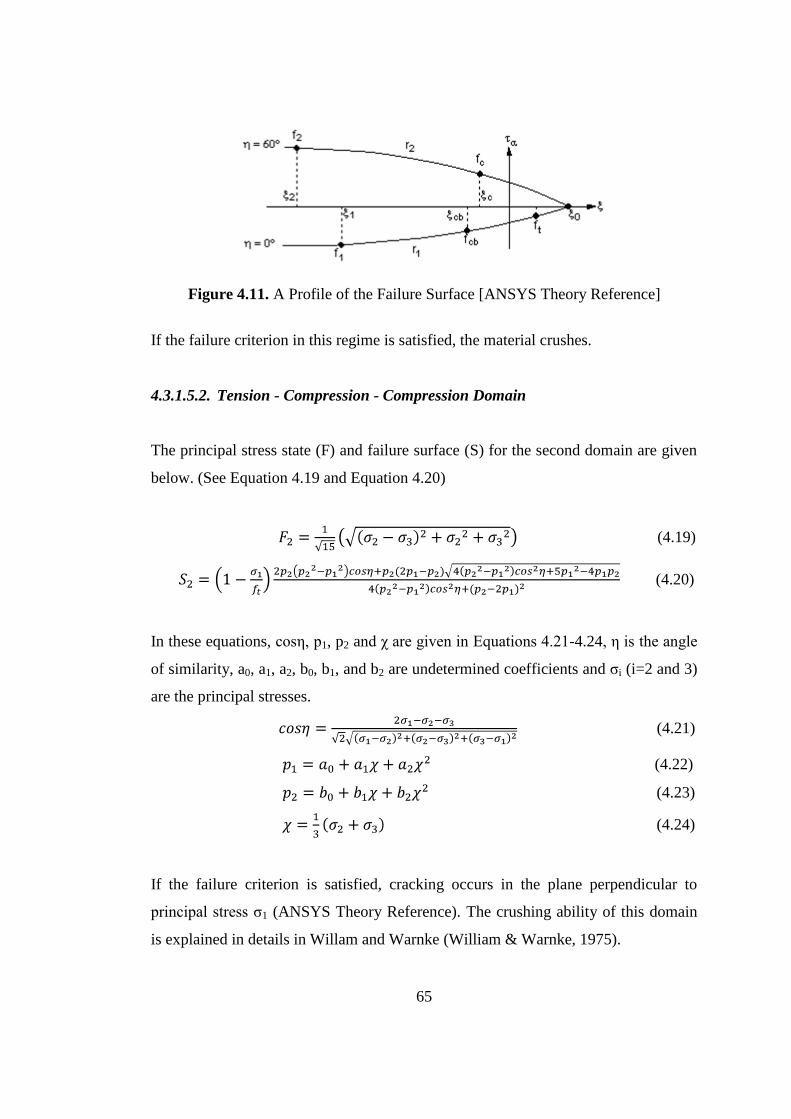
65
Figure 4.11. A Profile of the Failure Surface [ANSYS Theory Reference]
If the failure criterion in this regime is satisfied, the material crushes.
4.3.1.5.2. Tension - Compression - Compression Domain
The principal stress state (F) and failure surface (S) for the second domain are given
below. (See Equation 4.19 and Equation 4.20)
(4.19)
(4.20)
In these equations, cosη, p1, p2 and χ are given in Equations 4.21-4.24, η is the angle
of similarity, a0, a1, a2, b0, b1, and b2 are undetermined coefficients and ζi (i=2 and 3)
are the principal stresses.
(4.21)
(4.22)
(4.23)
(4.24)
If the failure criterion is satisfied, cracking occurs in the plane perpendicular to
principal stress ζ1 (ANSYS Theory Reference). The crushing ability of this domain
is explained in details in Willam and Warnke (William & Warnke, 1975).
66
4.3.1.5.3. Tension - Tension - Compression Domain
The principal stress state (F) and failure surface (S) for this regime can be found by
using the Equations 4.25 and 4.26.
(4.25)
(4.26)
In the above equations, ζi (i=1, 2 and 3) are the principal stresses, fc is the uniaxial
compressive strength and ft is the uniaxial tensile strength.
In this criterion, a crack plane perpendicular to the principal direction 1 occurs if the
failure criterion is satisfied for ζ1 and two crack planes perpendicular to principal
directions 1 and 2 exist if both ζ1 and ζ2 satisfy it. The crushing is also applicable to
this domain as it is explained by Willam-Warnke (William & Warnke, 1975).
4.3.1.5.4. Tension - Tension - Tension Domain
The principal stress state (F) and failure surface (S) for the last domain is determined
by the Equations 4.27 and 4.28.
(4.27)
(4.28)
In these equations, ζi (i=1, 2 and 3) are the principal stresses, fc is the uniaxial
compressive strength and ft is the uniaxial tensile strength.
There are no crushing possibilities in this regime as no compressive principal stresses
exist. However, up to three crack planes could appear at an instant if the criterion is
satisfied. The crack sequence always starts with the first principal direction as, in the
beginning, the principal stresses are sorted from largest to smallest.
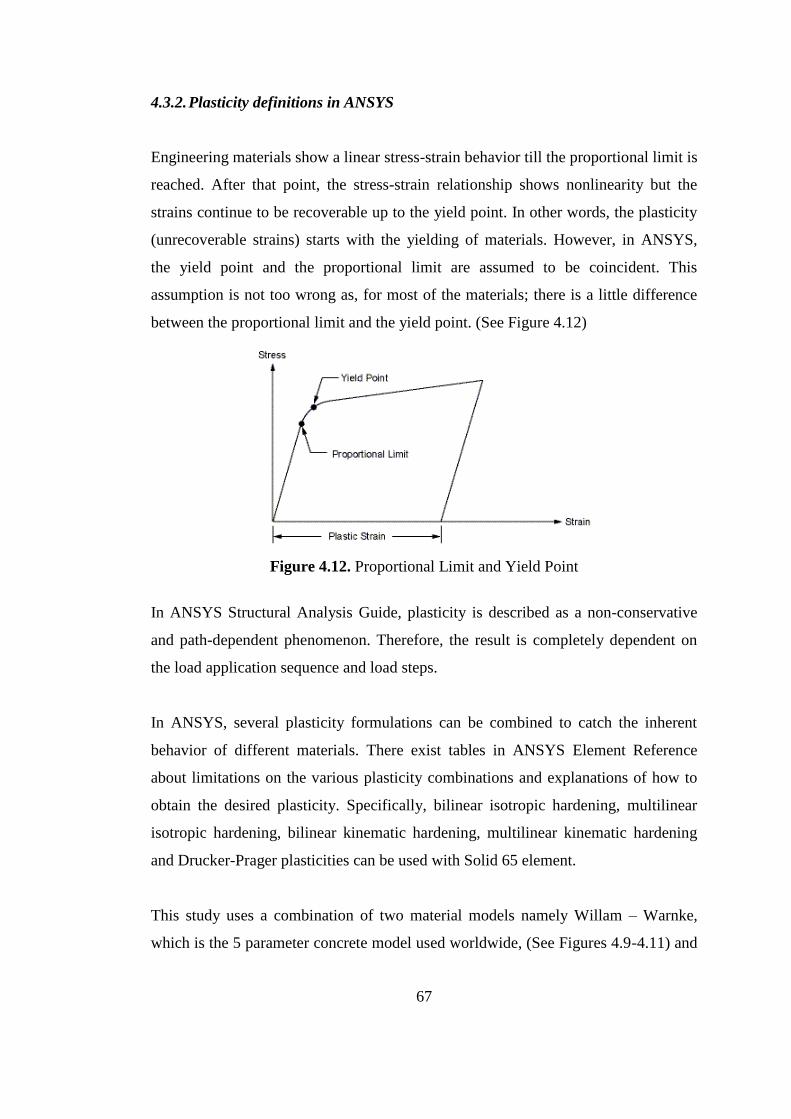
67
4.3.2. Plasticity definitions in ANSYS
Engineering materials show a linear stress-strain behavior till the proportional limit is
reached. After that point, the stress-strain relationship shows nonlinearity but the
strains continue to be recoverable up to the yield point. In other words, the plasticity
(unrecoverable strains) starts with the yielding of materials. However, in ANSYS,
the yield point and the proportional limit are assumed to be coincident. This
assumption is not too wrong as, for most of the materials; there is a little difference
between the proportional limit and the yield point. (See Figure 4.12)
Figure 4.12. Proportional Limit and Yield Point
In ANSYS Structural Analysis Guide, plasticity is described as a non-conservative
and path-dependent phenomenon. Therefore, the result is completely dependent on
the load application sequence and load steps.
In ANSYS, several plasticity formulations can be combined to catch the inherent
behavior of different materials. There exist tables in ANSYS Element Reference
about limitations on the various plasticity combinations and explanations of how to
obtain the desired plasticity. Specifically, bilinear isotropic hardening, multilinear
isotropic hardening, bilinear kinematic hardening, multilinear kinematic hardening
and Drucker-Prager plasticities can be used with Solid 65 element.
This study uses a combination of two material models namely Willam – Warnke,
which is the 5 parameter concrete model used worldwide, (See Figures 4.9-4.11) and
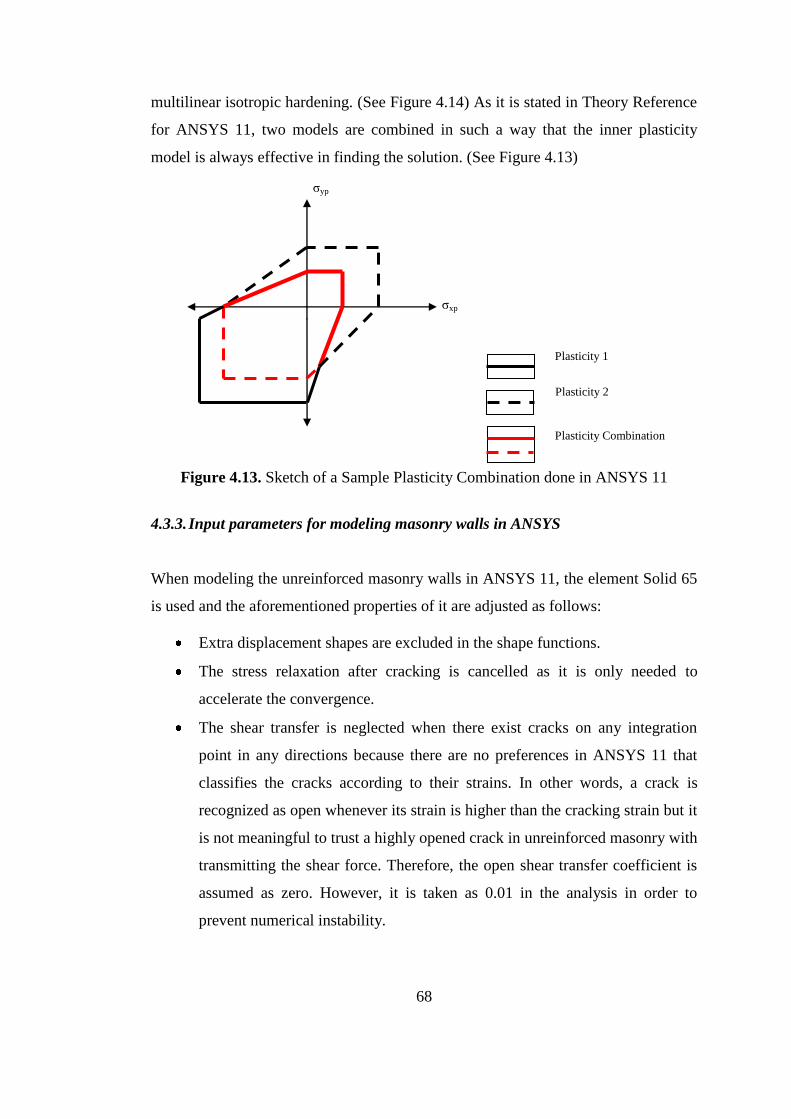
68
multilinear isotropic hardening. (See Figure 4.14) As it is stated in Theory Reference
for ANSYS 11, two models are combined in such a way that the inner plasticity
model is always effective in finding the solution. (See Figure 4.13)
Figure 4.13. Sketch of a Sample Plasticity Combination done in ANSYS 11
4.3.3. Input parameters for modeling masonry walls in ANSYS
When modeling the unreinforced masonry walls in ANSYS 11, the element Solid 65
is used and the aforementioned properties of it are adjusted as follows:
Extra displacement shapes are excluded in the shape functions.
The stress relaxation after cracking is cancelled as it is only needed to
accelerate the convergence.
The shear transfer is neglected when there exist cracks on any integration
point in any directions because there are no preferences in ANSYS 11 that
classifies the cracks according to their strains. In other words, a crack is
recognized as open whenever its strain is higher than the cracking strain but it
is not meaningful to trust a highly opened crack in unreinforced masonry with
transmitting the shear force. Therefore, the open shear transfer coefficient is
assumed as zero. However, it is taken as 0.01 in the analysis in order to
prevent numerical instability.
Plasticity 1
Plasticity 2
Plasticity Combination
ζyp
ζxp
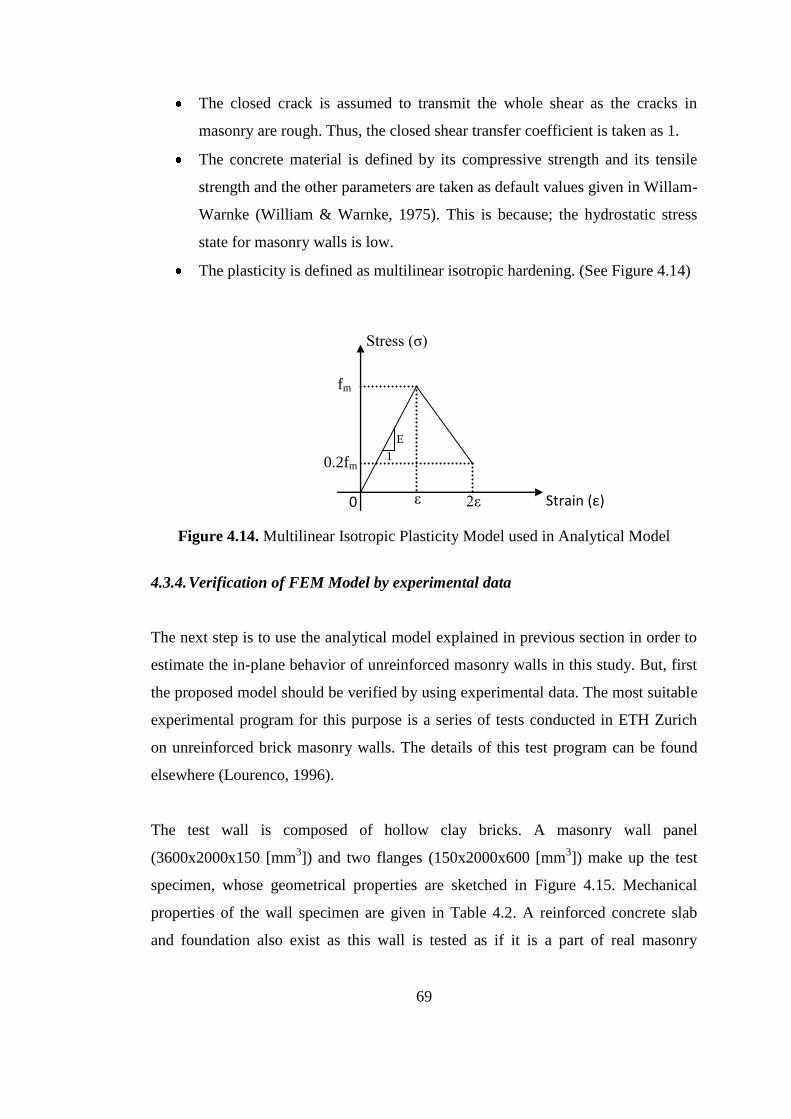
69
The closed crack is assumed to transmit the whole shear as the cracks in
masonry are rough. Thus, the closed shear transfer coefficient is taken as 1.
The concrete material is defined by its compressive strength and its tensile
strength and the other parameters are taken as default values given in Willam-
Warnke (William & Warnke, 1975). This is because; the hydrostatic stress
state for masonry walls is low.
The plasticity is defined as multilinear isotropic hardening. (See Figure 4.14)
Figure 4.14. Multilinear Isotropic Plasticity Model used in Analytical Model
4.3.4. Verification of FEM Model by experimental data
The next step is to use the analytical model explained in previous section in order to
estimate the in-plane behavior of unreinforced masonry walls in this study. But, first
the proposed model should be verified by using experimental data. The most suitable
experimental program for this purpose is a series of tests conducted in ETH Zurich
on unreinforced brick masonry walls. The details of this test program can be found
elsewhere (Lourenco, 1996).
The test wall is composed of hollow clay bricks. A masonry wall panel
(3600x2000x150 [mm3]) and two flanges (150x2000x600 [mm
3]) make up the test
specimen, whose geometrical properties are sketched in Figure 4.15. Mechanical
properties of the wall specimen are given in Table 4.2. A reinforced concrete slab
and foundation also exist as this wall is tested as if it is a part of real masonry
ε 0
fm
m
Stress (ζ)
Strain (ε)
0.2fm
E
1
2ε
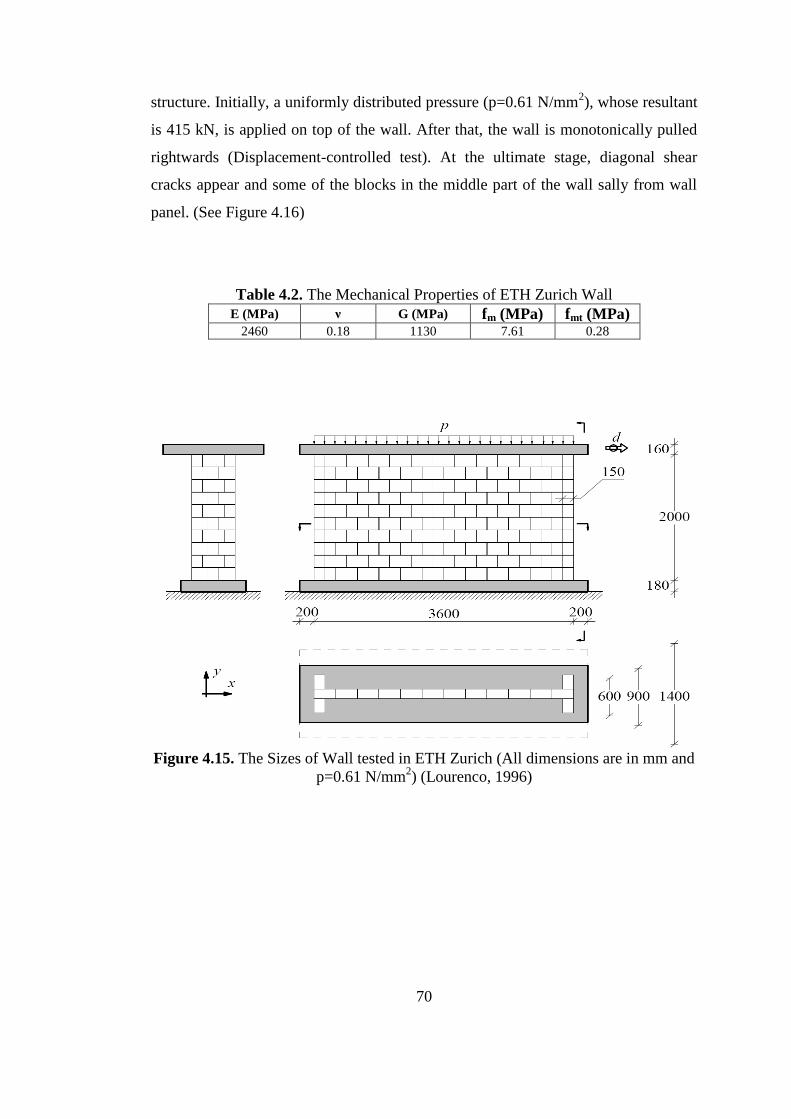
70
structure. Initially, a uniformly distributed pressure (p=0.61 N/mm2), whose resultant
is 415 kN, is applied on top of the wall. After that, the wall is monotonically pulled
rightwards (Displacement-controlled test). At the ultimate stage, diagonal shear
cracks appear and some of the blocks in the middle part of the wall sally from wall
panel. (See Figure 4.16)
Table 4.2. The Mechanical Properties of ETH Zurich Wall
E (MPa) ν G (MPa) fm (MPa) fmt (MPa) 2460 0.18 1130 7.61 0.28
Figure 4.15. The Sizes of Wall tested in ETH Zurich (All dimensions are in mm and
p=0.61 N/mm2) (Lourenco, 1996)
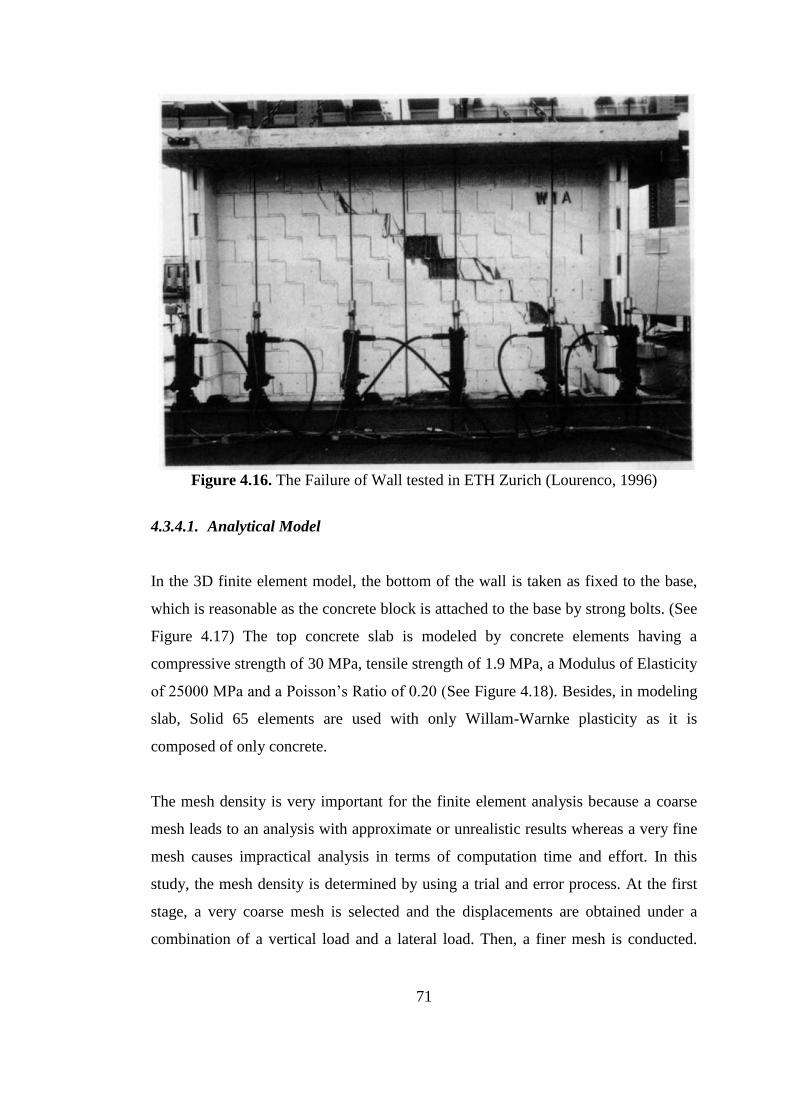
71
Figure 4.16. The Failure of Wall tested in ETH Zurich (Lourenco, 1996)
4.3.4.1. Analytical Model
In the 3D finite element model, the bottom of the wall is taken as fixed to the base,
which is reasonable as the concrete block is attached to the base by strong bolts. (See
Figure 4.17) The top concrete slab is modeled by concrete elements having a
compressive strength of 30 MPa, tensile strength of 1.9 MPa, a Modulus of Elasticity
of 25000 MPa and a Poisson’s Ratio of 0.20 (See Figure 4.18). Besides, in modeling
slab, Solid 65 elements are used with only Willam-Warnke plasticity as it is
composed of only concrete.
The mesh density is very important for the finite element analysis because a coarse
mesh leads to an analysis with approximate or unrealistic results whereas a very fine
mesh causes impractical analysis in terms of computation time and effort. In this
study, the mesh density is determined by using a trial and error process. At the first
stage, a very coarse mesh is selected and the displacements are obtained under a
combination of a vertical load and a lateral load. Then, a finer mesh is conducted.
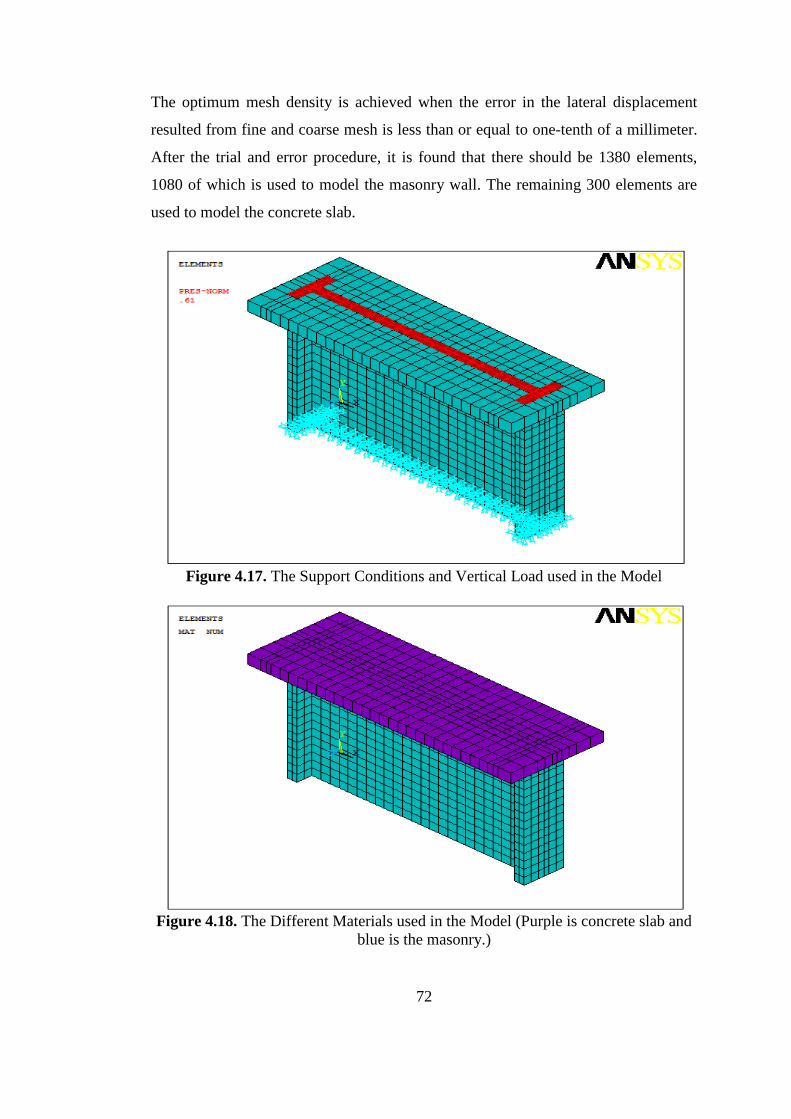
72
The optimum mesh density is achieved when the error in the lateral displacement
resulted from fine and coarse mesh is less than or equal to one-tenth of a millimeter.
After the trial and error procedure, it is found that there should be 1380 elements,
1080 of which is used to model the masonry wall. The remaining 300 elements are
used to model the concrete slab.
Figure 4.17. The Support Conditions and Vertical Load used in the Model
Figure 4.18. The Different Materials used in the Model (Purple is concrete slab and
blue is the masonry.)
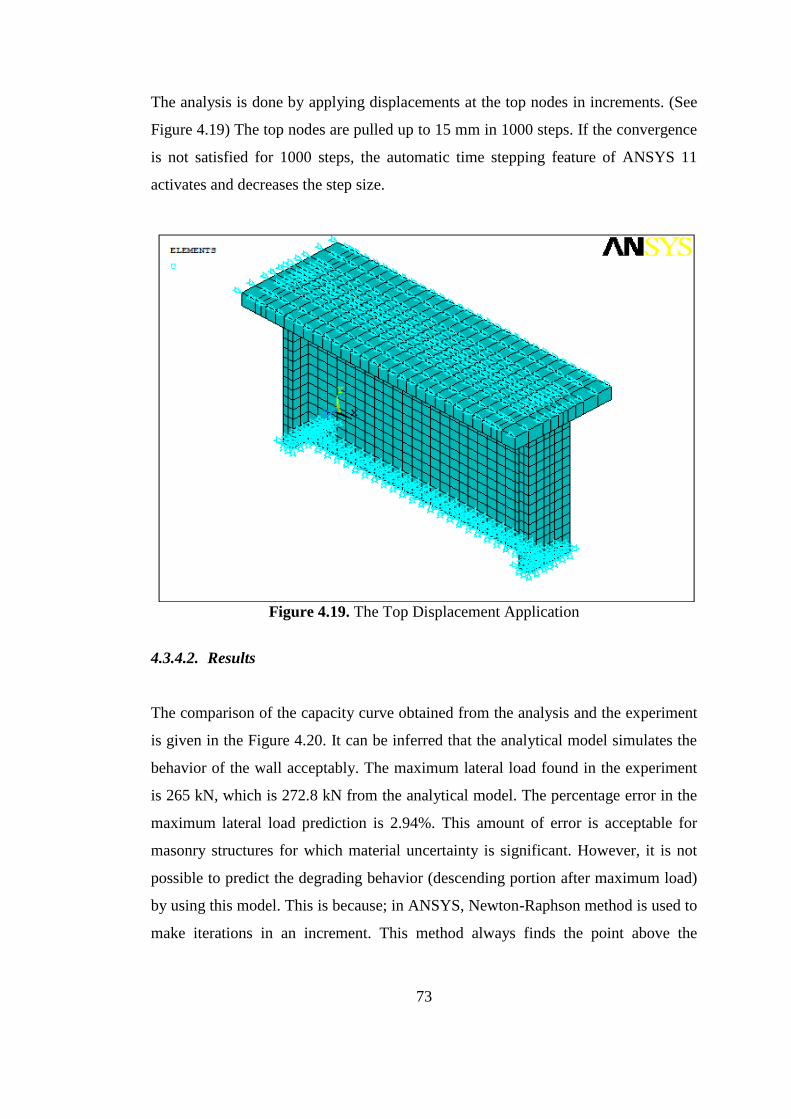
73
The analysis is done by applying displacements at the top nodes in increments. (See
Figure 4.19) The top nodes are pulled up to 15 mm in 1000 steps. If the convergence
is not satisfied for 1000 steps, the automatic time stepping feature of ANSYS 11
activates and decreases the step size.
Figure 4.19. The Top Displacement Application
4.3.4.2. Results
The comparison of the capacity curve obtained from the analysis and the experiment
is given in the Figure 4.20. It can be inferred that the analytical model simulates the
behavior of the wall acceptably. The maximum lateral load found in the experiment
is 265 kN, which is 272.8 kN from the analytical model. The percentage error in the
maximum lateral load prediction is 2.94%. This amount of error is acceptable for
masonry structures for which material uncertainty is significant. However, it is not
possible to predict the degrading behavior (descending portion after maximum load)
by using this model. This is because; in ANSYS, Newton-Raphson method is used to
make iterations in an increment. This method always finds the point above the
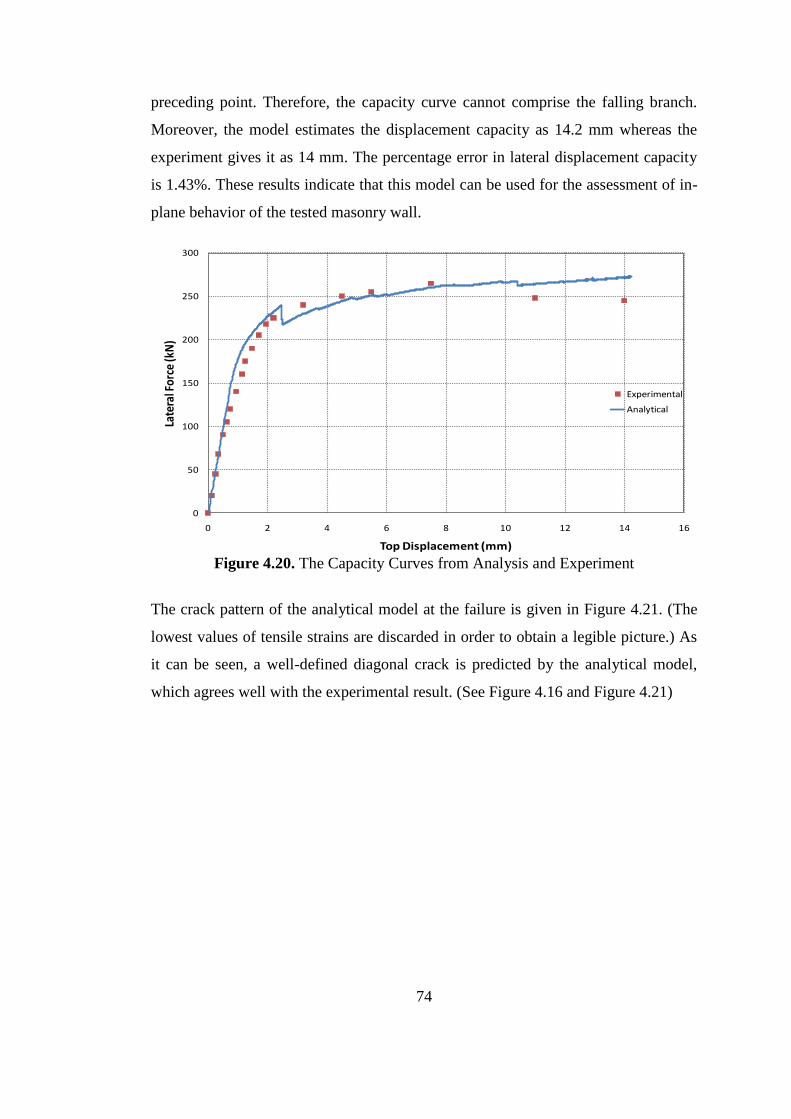
74
preceding point. Therefore, the capacity curve cannot comprise the falling branch.
Moreover, the model estimates the displacement capacity as 14.2 mm whereas the
experiment gives it as 14 mm. The percentage error in lateral displacement capacity
is 1.43%. These results indicate that this model can be used for the assessment of in-
plane behavior of the tested masonry wall.
Figure 4.20. The Capacity Curves from Analysis and Experiment
The crack pattern of the analytical model at the failure is given in Figure 4.21. (The
lowest values of tensile strains are discarded in order to obtain a legible picture.) As
it can be seen, a well-defined diagonal crack is predicted by the analytical model,
which agrees well with the experimental result. (See Figure 4.16 and Figure 4.21)
0
50
100
150
200
250
300
0 2 4 6 8 10 12 14 16
Late
ral F
orce
(kN
)
Top Displacement (mm)
Experimental
Analytical
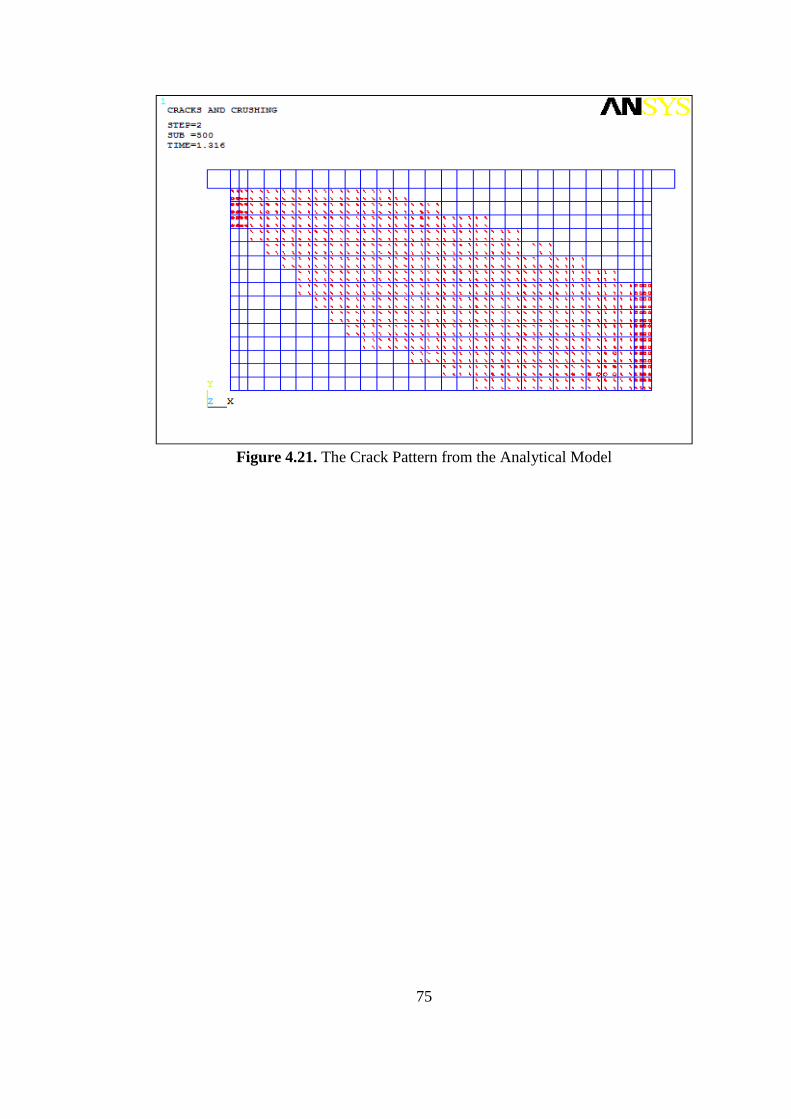
75
Figure 4.21. The Crack Pattern from the Analytical Model
76
CHAPTER 5
DEVELOPMENT OF A PERFORMANCE BASED TECHNIQUE FOR
UNREINFORCED BRICK MASONRY BUILDINGS IN TURKEY
5.1. Introduction
This chapter begins with a brief discussion about the material characteristics of brick
masonry units in Turkey. Then, referring to this information, mechanical properties
of masonry walls required for analytical modeling are obtained. The rest of this
chapter is mainly devoted to the development of a displacement-based procedure for
the seismic evaluation of existing unreinforced brick masonry buildings. If properly
adopted, the procedure can also be used for design purposes. The main feature of this
procedure is that it enables determination of the capacity and performance of an
unreinforced masonry building based on detailed modeling of the in-plane behavior
of its piers and walls. Although detailed finite element based analysis are performed
on piers, these are implicit in the method and their results are employed in the
proposed procedure by using approximate and simple formulations.
The proposed procedure also constitutes the outline of this chapter, which is
explained as follows:
1) Capacity curves of different piers (with different aspect ratios, compressive
strength and loading conditions) are obtained by utilizing the previously
mentioned analysis technique in ANSYS (for details refer to Chapter 4).
2) These curves are then bilinearized according to FEMA356.
3) The analytical database obtained is utilized to create a simplified version of
capacity curve generation as the analysis done in ANSYS takes too much
time to be utilized in practice. In this simplified method, empirical
formulations for yield lateral load (Fy), yield displacement (uy), ultimate
77
lateral load (Fu) and ultimate displacement (uu) are developed by performing
nonlinear regression analyses.
4) Local limit states are defined for each pier based on the obtained values of the
yield displacement (uy) and the ultimate displacement (uu) such that the yield
displacement represents serviceability limit state whereas the ultimate
displacement stands for ultimate limit state.
5) The capacity curve is constructed by gathering the contribution from each
pier in a specific direction. It also becomes possible to decide on the global
limit state of the building by considering local limit states of individual piers.
6) If a performance assessment is required, then the capacity curve is converted
to ADRS format and compared with demand (in terms of acceleration
spectrum). The point where the capacity and the demand for that specific
building intersects is regarded as the “performance point” and it is used in
order to assess the seismic performance of the building.
Last part of this chapter is devoted to the implementation of this technique to an
existing unreinforced masonry building located in Istanbul.
5.2. Assumptions involved in the Simple Method
The proposed approach depends on several simplifications as stated below:
This method is valid for only unreinforced brick masonry structures.
The masonry material is assumed to be isotropic.
It is assumed that out-of-plane failure of the masonry walls has been
prevented by proper measures (rigid floor diaphragm, proper wall-to-wall
connections, proper wall-to-floor connections, presence of horizontal RC
bond beams).
It is assumed that the plastic deformation or damage accumulates on piers.
This is a reasonable assumption since it has been observed that generally
piers are weaker than spandrels in traditional unreinforced masonry
construction (Tomazevic, 1999).

78
In determining the effective pier heights, the offset method proposed by
Dolce (1989) is employed.
It is assumed that a reinforced concrete slab or a slab type capable of
providing rigid diaphragm action exist in the masonry structures.
The mass is assumed to be lumped at the storey levels when performing the
modal analysis.
In demand calculations, the viscous damping is taken as 10% of the critical if
the damage is occured. Otherwise, it is 5%.
5.3. Material Characteristics of Brick Masonry Units in Turkey
In Turkish masonry construction practice, there are two types of clay bricks: local
and factory bricks. The former type is manufactured in local furnaces and was very
popular during 1970's but they are rarely produced nowadays. Therefore, such type
of bricks is usually encountered in old masonry structures. These bricks are burned at
low temperatures (maximum 900Co) due to lack of technology. As it is a known fact
that the compressive strength of bricks depends on the temperature during
production, it is lower than the factory bricks'. However, the fracture of local bricks
is less brittle and they can experience considerable plastic deformation prior to
failure (Sucuoğlu & Erberik, 1997).
The second type of bricks is divided into many subcategories such as solid bricks,
bricks with vertical holes, bricks with horizontal holes, etc. As the name implies, this
type of bricks is being produced in factories and burnt up to 1200 Co, which makes it
stronger but more brittle when compared to local bricks.
In TS EN 771 (Turkish Standards Institution, 2004), the recommended compressive
strength values for different types of clay brick have been tabulated for national use.
Only the values for two types are given in this document (Tables 5.1 and 5.2) as the
other types (clay bricks with horizontal holes) are not permitted in the load bearing
wall construction. Moreover, it is a common practice to use the high density clay
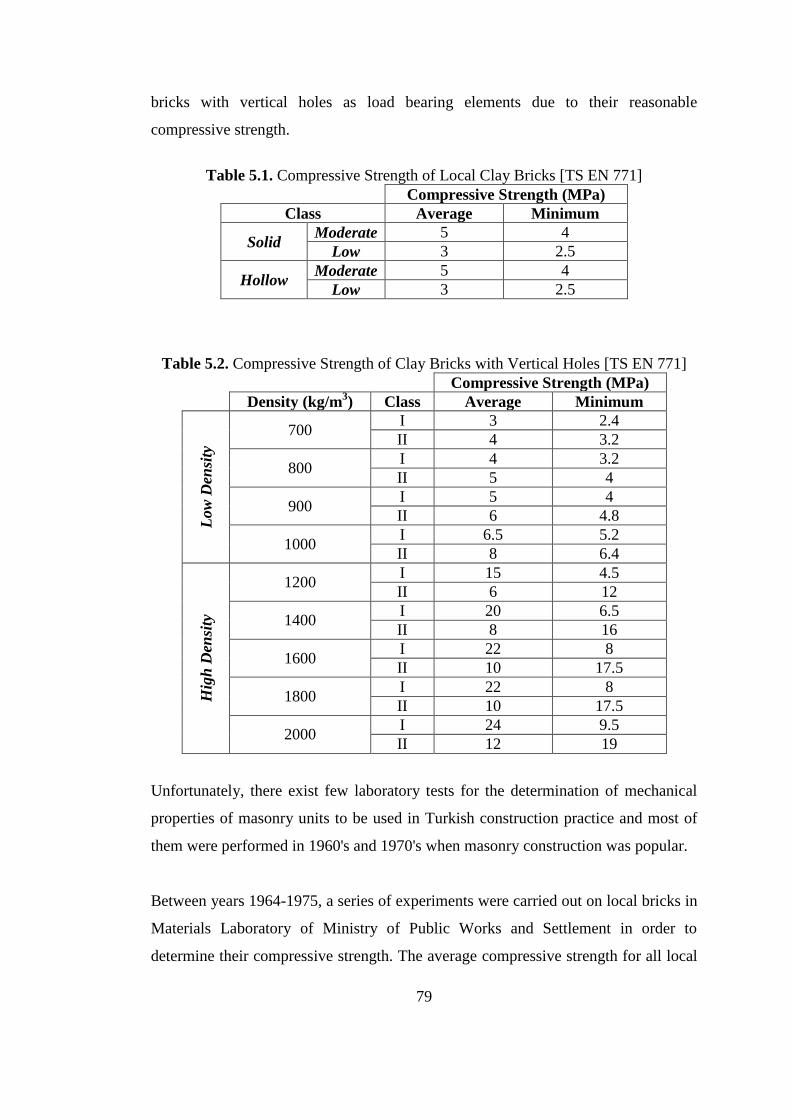
79
bricks with vertical holes as load bearing elements due to their reasonable
compressive strength.
Table 5.1. Compressive Strength of Local Clay Bricks [TS EN 771]
Compressive Strength (MPa)
Class Average Minimum
Solid Moderate 5 4
Low 3 2.5
Hollow Moderate 5 4
Low 3 2.5
Table 5.2. Compressive Strength of Clay Bricks with Vertical Holes [TS EN 771]
Compressive Strength (MPa)
Density (kg/m3) Class Average Minimum
Low
Den
sity
700 I 3 2.4
II 4 3.2
800 I 4 3.2
II 5 4
900 I 5 4
II 6 4.8
1000 I 6.5 5.2
II 8 6.4
Hig
h D
ensi
ty
1200 I 15 4.5
II 6 12
1400 I 20 6.5
II 8 16
1600 I 22 8
II 10 17.5
1800 I 22 8
II 10 17.5
2000 I 24 9.5
II 12 19
Unfortunately, there exist few laboratory tests for the determination of mechanical
properties of masonry units to be used in Turkish construction practice and most of
them were performed in 1960's and 1970's when masonry construction was popular.
Between years 1964-1975, a series of experiments were carried out on local bricks in
Materials Laboratory of Ministry of Public Works and Settlement in order to
determine their compressive strength. The average compressive strength for all local
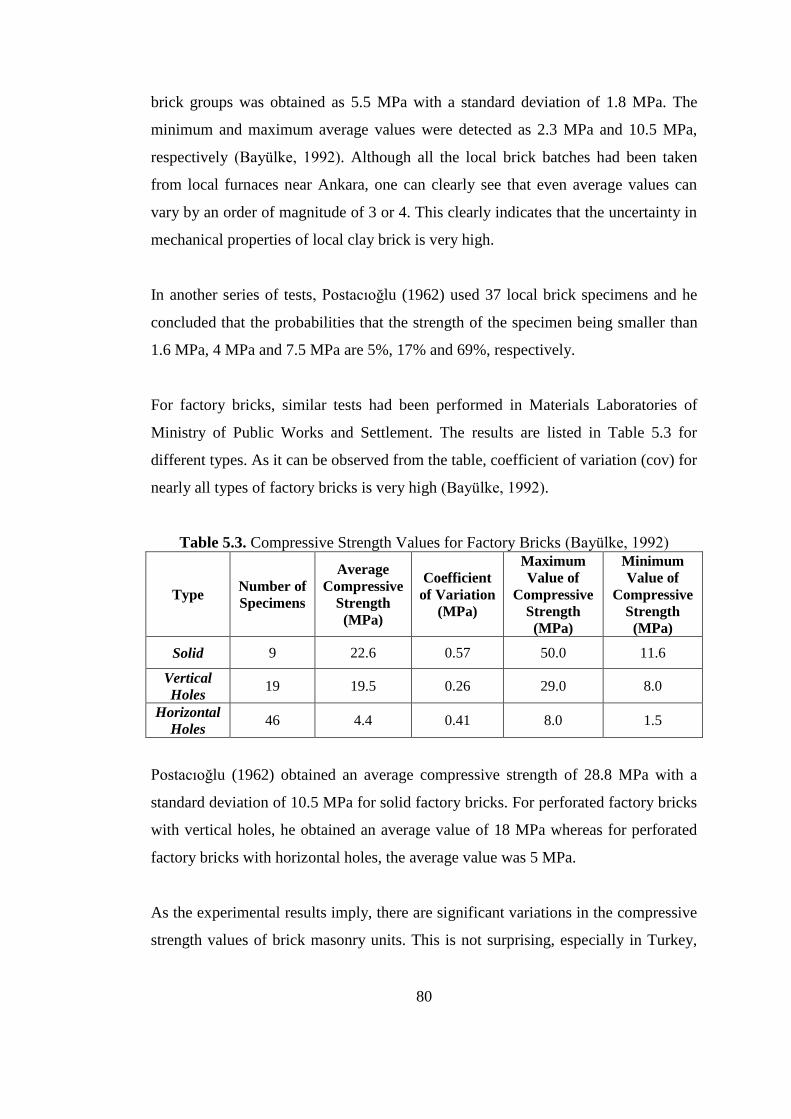
80
brick groups was obtained as 5.5 MPa with a standard deviation of 1.8 MPa. The
minimum and maximum average values were detected as 2.3 MPa and 10.5 MPa,
respectively (Bayülke, 1992). Although all the local brick batches had been taken
from local furnaces near Ankara, one can clearly see that even average values can
vary by an order of magnitude of 3 or 4. This clearly indicates that the uncertainty in
mechanical properties of local clay brick is very high.
In another series of tests, Postacıoğlu (1962) used 37 local brick specimens and he
concluded that the probabilities that the strength of the specimen being smaller than
1.6 MPa, 4 MPa and 7.5 MPa are 5%, 17% and 69%, respectively.
For factory bricks, similar tests had been performed in Materials Laboratories of
Ministry of Public Works and Settlement. The results are listed in Table 5.3 for
different types. As it can be observed from the table, coefficient of variation (cov) for
nearly all types of factory bricks is very high (Bayülke, 1992).
Table 5.3. Compressive Strength Values for Factory Bricks (Bayülke, 1992)
Type Number of
Specimens
Average
Compressive
Strength
(MPa)
Coefficient
of Variation
(MPa)
Maximum
Value of
Compressive
Strength
(MPa)
Minimum
Value of
Compressive
Strength
(MPa)
Solid 9 22.6 0.57 50.0 11.6
Vertical
Holes 19 19.5 0.26 29.0 8.0
Horizontal
Holes 46 4.4 0.41 8.0 1.5
Postacıoğlu (1962) obtained an average compressive strength of 28.8 MPa with a
standard deviation of 10.5 MPa for solid factory bricks. For perforated factory bricks
with vertical holes, he obtained an average value of 18 MPa whereas for perforated
factory bricks with horizontal holes, the average value was 5 MPa.
As the experimental results imply, there are significant variations in the compressive
strength values of brick masonry units. This is not surprising, especially in Turkey,
81
where there exist limited standardization and control over the construction material
technologies. Such a high material uncertainty is inherent for this type of
construction materials and perhaps this is their major weakness when compared to
other types of construction materials.
There have also been some attempts in Turkey to estimate the compressive strength
of masonry walls from the corresponding strength values of units and mortar. For
instance, Tolunay (1966) obtained the following empirical formulations for factory
bricks with 1:3 lime mortar (Equation 5.1.a) and for factory bricks with 1:2:8 mortar
(Equation 5.1.b).
(5.1.a)
(5.1.b)
In the above equations, fm is the compressive strength of wall and fb is the
compressive strength of brick.
Bayülke (1992) recommended a simple formulation for the estimation of the wall
compressive strength, which is valid for solid and hollow factory bricks.
(5.2)
In this study, brick masonry units constructed in Turkey are classified in three groups
according to their compressive strengths namely Low, Medium and High by using
the limited data available from the aforementioned studies. The mean compressive
strength values assigned to these groups are 2 MPa (for local bricks), 5 MPa (for
local bricks and low quality factory bricks) and 8 MPa (for high quality factory
bricks).
According to Costa (2007), the tensile strength of masonry walls of any type may be
taken as 3%-9% of its compressive strength. Unfortunately, there exists no reliable
documentation regarding this mechanical property of masonry in Turkey. Therefore,

82
it is assumed that the range of values stated by Costa holds also for the Turkish
masonry construction.
There is also no consensus about how to calculate the Modulus of Elasticity of
masonry walls from its components' mechanical properties. Some previous studies
proposed relations depending on the compressive strength of masonry wall but the
coefficients are so different from each other that, for the same wall, the estimated
modulus of elasticity may be three times the others. For example, Plowman (1965)
and Sahlin (1971) recommend coefficients in the range 400-1000 for the compressive
strength (Equation 5.3) whereas the formulations proposed by Schubert (1982) and
Sinha and Pedreschi (1983) are given in Equations 5.4 and 5.5, respectively.
(5.3)
(5.4)
(5.5)
In these formulations, Em is the Modulus of Elasticity of masonry wall and fm is the
compressive strength of the wall (in MPa in Equations 5.3-5.5).
There are also some code-based formulations similar to the above formulas like the
one in TEC2007 (Equation 5.6) and the one in Eurocode 6 (Equation 5.7).
(5.6)
(5.7)
In this study, the Modulus of Elasticity for the previously mentioned masonry brick
unit classes is assumed to be between 400 MPa and 8000 MPa by considering the
above formulations. The dispersion in estimated values is huge so an average value
for every class is decided to be used. Consequently, the Modulus of Elasticity is
taken as 2000 MPa in this study.

83
5.4. Capacity Evaluation of Masonry Piers
First step in the procedure is to obtain the capacity curves of brick masonry piers by
taking into consideration different structural parameters such as compressive
strength, aspect ratio and vertical stress. The analysis tool used is ANSYS as
explained in the previous chapter. Material properties of the finite element models
are determined in accordance with the typical construction practice for unreinforced
masonry buildings in Turkey as discussed in the previous section.
5.3.1. Classification of Masonry Piers
Masonry piers are classified according to the aforementioned structural parameters.
The first classification for piers is according to compressive strength: low, moderate
and high. The physical quantification of these classes in terms of the mean values is
2 MPa, 5 MPa and 8 MPa as stated before (See Table 5.4).
Table 5.4. Classification of piers according to compressive strength
Pier Category Compressive Strength (MPa)
Low Strength 2
Medium Strength 5
High Strength 8
The second classification is according to aspect ratio. By definition, it is the ratio of
the wall height to wall length in horizontal direction. In this category, masonry piers
with 8 different aspect ratios ranging from 0.25 to 2.0 are considered (See Table 5.5).
The reason for this broad range of classification is that the mode of failure highly
depends on the aspect ratio and that many different aspect ratios can be encountered
in practice. It is impossible to define an analytical model by using a predefined
aspect ratio, i.e. length or height along with the thickness should also be known.
Thus, a reference length of 1 m and a reference thickness of 0.2 m are assumed. Pier
categories are named as Squat, Ordinary and Slender in terms of aspect ratio as
shown in the table.
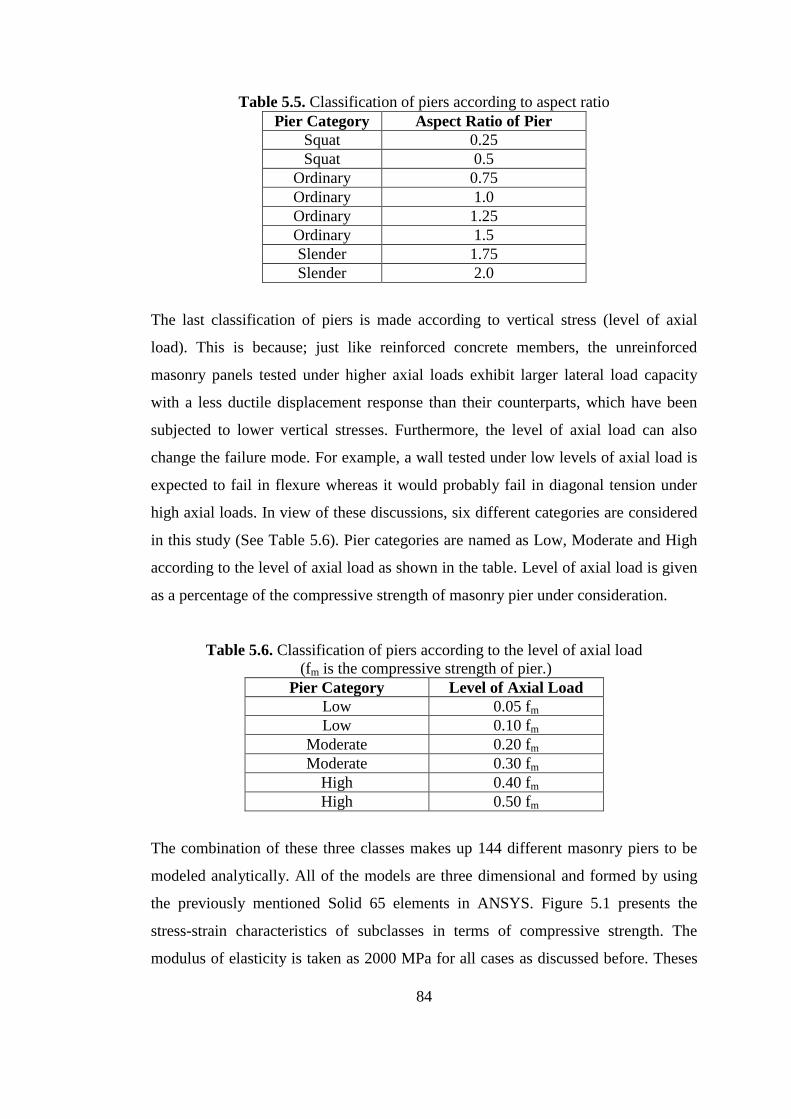
84
Table 5.5. Classification of piers according to aspect ratio
Pier Category Aspect Ratio of Pier
Squat 0.25
Squat 0.5
Ordinary 0.75
Ordinary 1.0
Ordinary 1.25
Ordinary 1.5
Slender 1.75
Slender 2.0
The last classification of piers is made according to vertical stress (level of axial
load). This is because; just like reinforced concrete members, the unreinforced
masonry panels tested under higher axial loads exhibit larger lateral load capacity
with a less ductile displacement response than their counterparts, which have been
subjected to lower vertical stresses. Furthermore, the level of axial load can also
change the failure mode. For example, a wall tested under low levels of axial load is
expected to fail in flexure whereas it would probably fail in diagonal tension under
high axial loads. In view of these discussions, six different categories are considered
in this study (See Table 5.6). Pier categories are named as Low, Moderate and High
according to the level of axial load as shown in the table. Level of axial load is given
as a percentage of the compressive strength of masonry pier under consideration.
Table 5.6. Classification of piers according to the level of axial load
(fm is the compressive strength of pier.)
Pier Category Level of Axial Load
Low 0.05 fm
Low 0.10 fm
Moderate 0.20 fm
Moderate 0.30 fm
High 0.40 fm
High 0.50 fm
The combination of these three classes makes up 144 different masonry piers to be
modeled analytically. All of the models are three dimensional and formed by using
the previously mentioned Solid 65 elements in ANSYS. Figure 5.1 presents the
stress-strain characteristics of subclasses in terms of compressive strength. The
modulus of elasticity is taken as 2000 MPa for all cases as discussed before. Theses
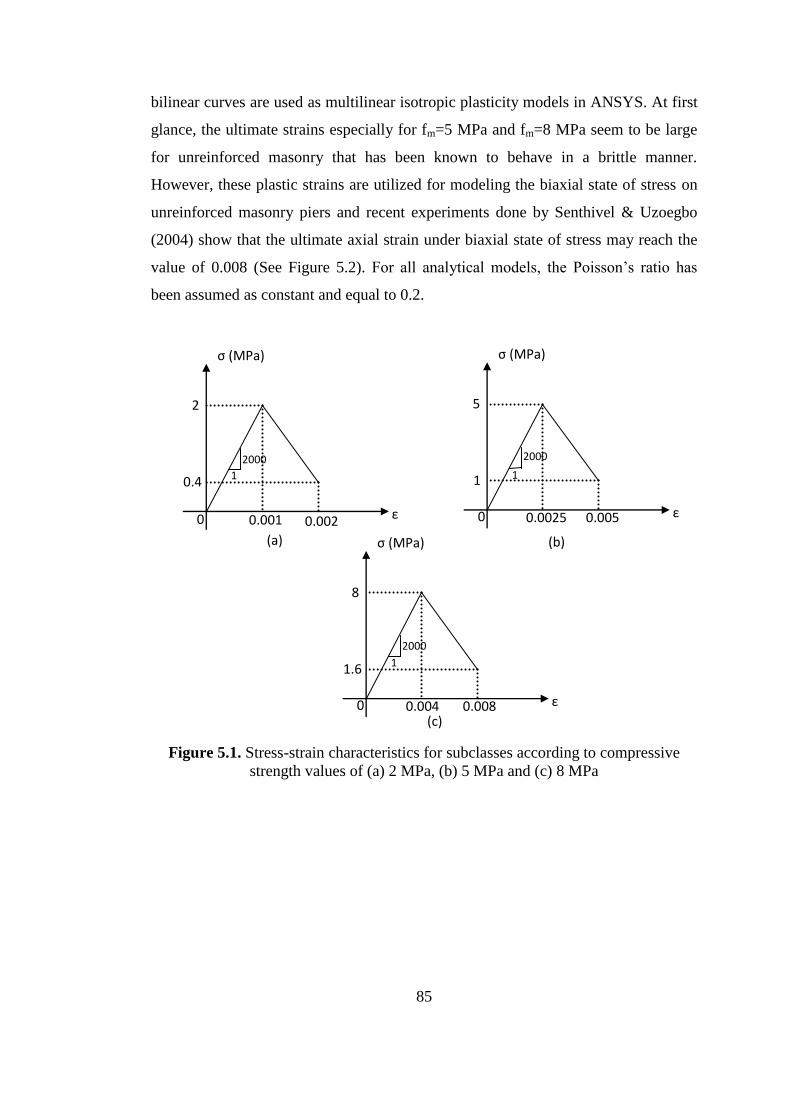
85
bilinear curves are used as multilinear isotropic plasticity models in ANSYS. At first
glance, the ultimate strains especially for fm=5 MPa and fm=8 MPa seem to be large
for unreinforced masonry that has been known to behave in a brittle manner.
However, these plastic strains are utilized for modeling the biaxial state of stress on
unreinforced masonry piers and recent experiments done by Senthivel & Uzoegbo
(2004) show that the ultimate axial strain under biaxial state of stress may reach the
value of 0.008 (See Figure 5.2). For all analytical models, the Poisson’s ratio has
been assumed as constant and equal to 0.2.
Figure 5.1. Stress-strain characteristics for subclasses according to compressive
strength values of (a) 2 MPa, (b) 5 MPa and (c) 8 MPa
0.001 0.002
(c)
8
0.004 0.008
σ (MPa)
ε
1.6
0
2000
1
0
(a)
2
σ (MPa)
ε
0.4
2000
1
ε
(b)
5
0.0025 0.005
σ (MPa)
1
0
2000
1
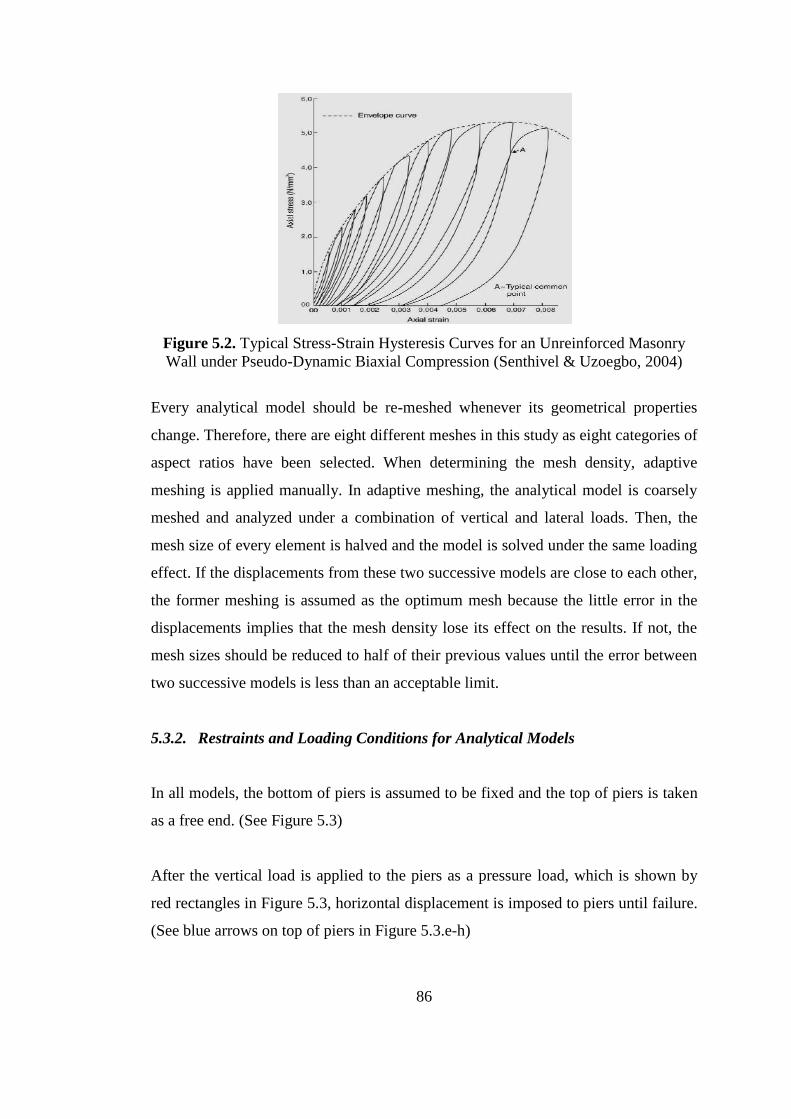
86
Figure 5.2. Typical Stress-Strain Hysteresis Curves for an Unreinforced Masonry
Wall under Pseudo-Dynamic Biaxial Compression (Senthivel & Uzoegbo, 2004)
Every analytical model should be re-meshed whenever its geometrical properties
change. Therefore, there are eight different meshes in this study as eight categories of
aspect ratios have been selected. When determining the mesh density, adaptive
meshing is applied manually. In adaptive meshing, the analytical model is coarsely
meshed and analyzed under a combination of vertical and lateral loads. Then, the
mesh size of every element is halved and the model is solved under the same loading
effect. If the displacements from these two successive models are close to each other,
the former meshing is assumed as the optimum mesh because the little error in the
displacements implies that the mesh density lose its effect on the results. If not, the
mesh sizes should be reduced to half of their previous values until the error between
two successive models is less than an acceptable limit.
5.3.2. Restraints and Loading Conditions for Analytical Models
In all models, the bottom of piers is assumed to be fixed and the top of piers is taken
as a free end. (See Figure 5.3)
After the vertical load is applied to the piers as a pressure load, which is shown by
red rectangles in Figure 5.3, horizontal displacement is imposed to piers until failure.
(See blue arrows on top of piers in Figure 5.3.e-h)
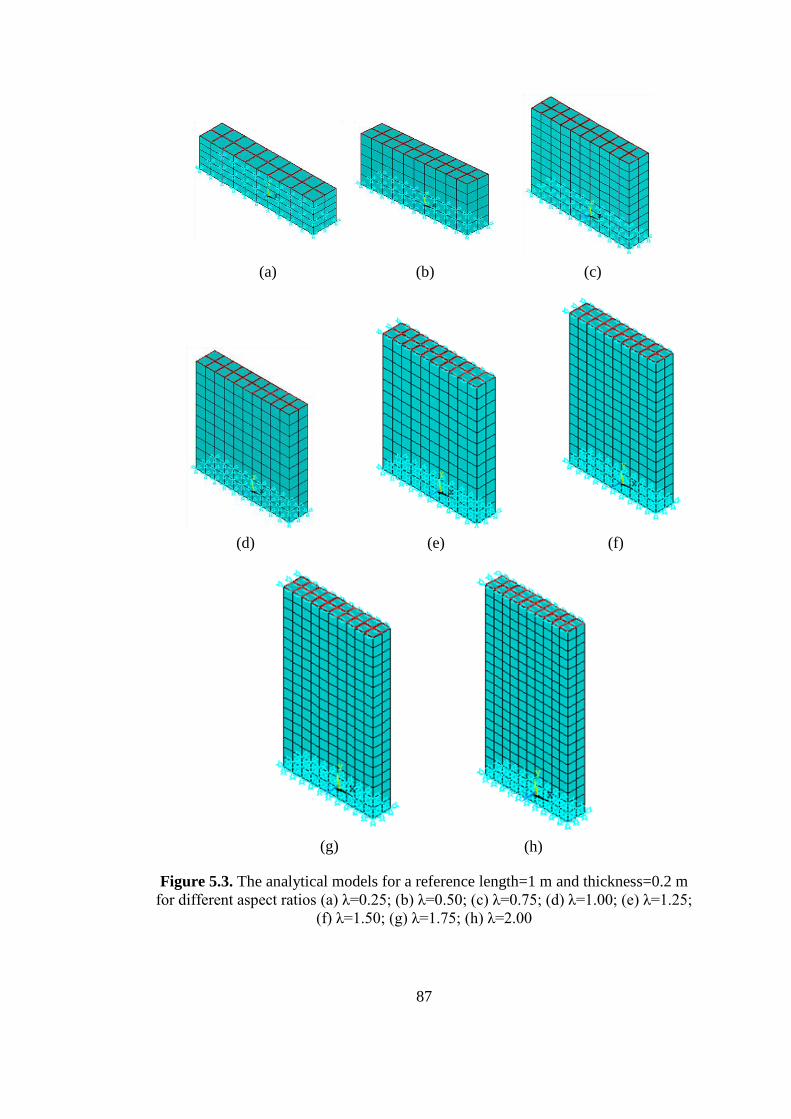
87
Figure 5.3. The analytical models for a reference length=1 m and thickness=0.2 m
for different aspect ratios (a) λ=0.25; (b) λ=0.50; (c) λ=0.75; (d) λ=1.00; (e) λ=1.25;
(f) λ=1.50; (g) λ=1.75; (h) λ=2.00
(a) (b) (c)
(d) (e) (f)
(g) (h)
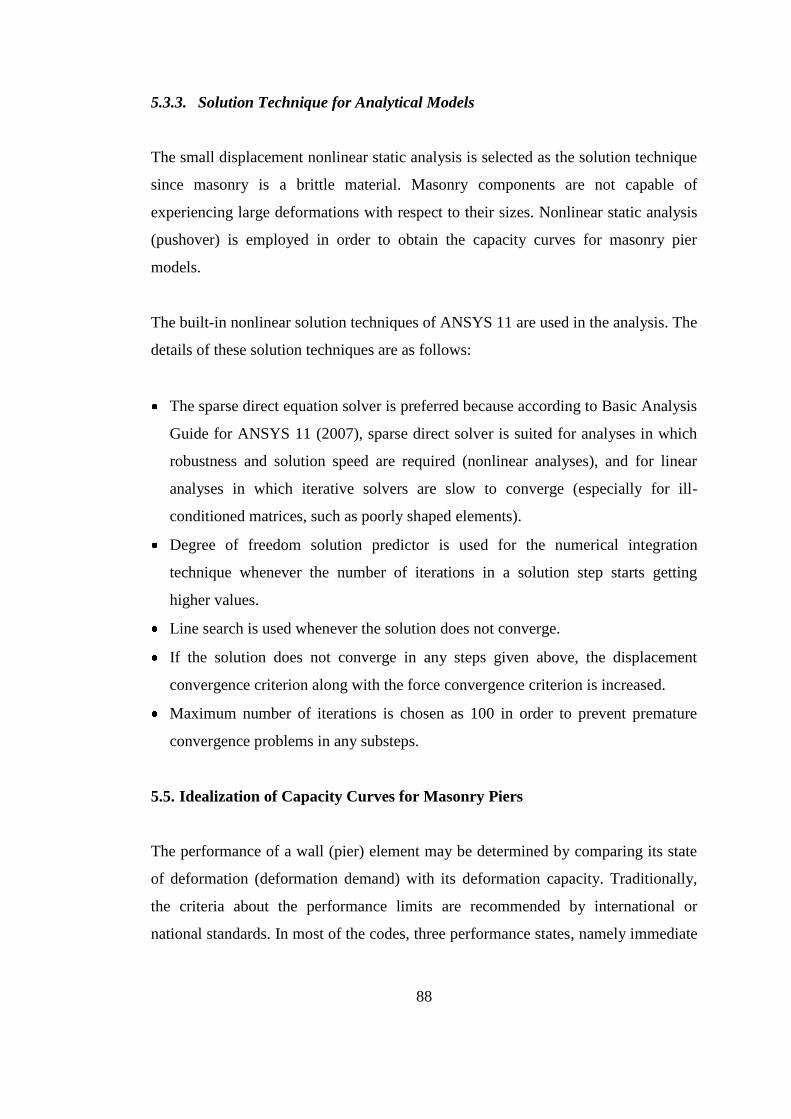
88
5.3.3. Solution Technique for Analytical Models
The small displacement nonlinear static analysis is selected as the solution technique
since masonry is a brittle material. Masonry components are not capable of
experiencing large deformations with respect to their sizes. Nonlinear static analysis
(pushover) is employed in order to obtain the capacity curves for masonry pier
models.
The built-in nonlinear solution techniques of ANSYS 11 are used in the analysis. The
details of these solution techniques are as follows:
The sparse direct equation solver is preferred because according to Basic Analysis
Guide for ANSYS 11 (2007), sparse direct solver is suited for analyses in which
robustness and solution speed are required (nonlinear analyses), and for linear
analyses in which iterative solvers are slow to converge (especially for ill-
conditioned matrices, such as poorly shaped elements).
Degree of freedom solution predictor is used for the numerical integration
technique whenever the number of iterations in a solution step starts getting
higher values.
Line search is used whenever the solution does not converge.
If the solution does not converge in any steps given above, the displacement
convergence criterion along with the force convergence criterion is increased.
Maximum number of iterations is chosen as 100 in order to prevent premature
convergence problems in any substeps.
5.5. Idealization of Capacity Curves for Masonry Piers
The performance of a wall (pier) element may be determined by comparing its state
of deformation (deformation demand) with its deformation capacity. Traditionally,
the criteria about the performance limits are recommended by international or
national standards. In most of the codes, three performance states, namely immediate
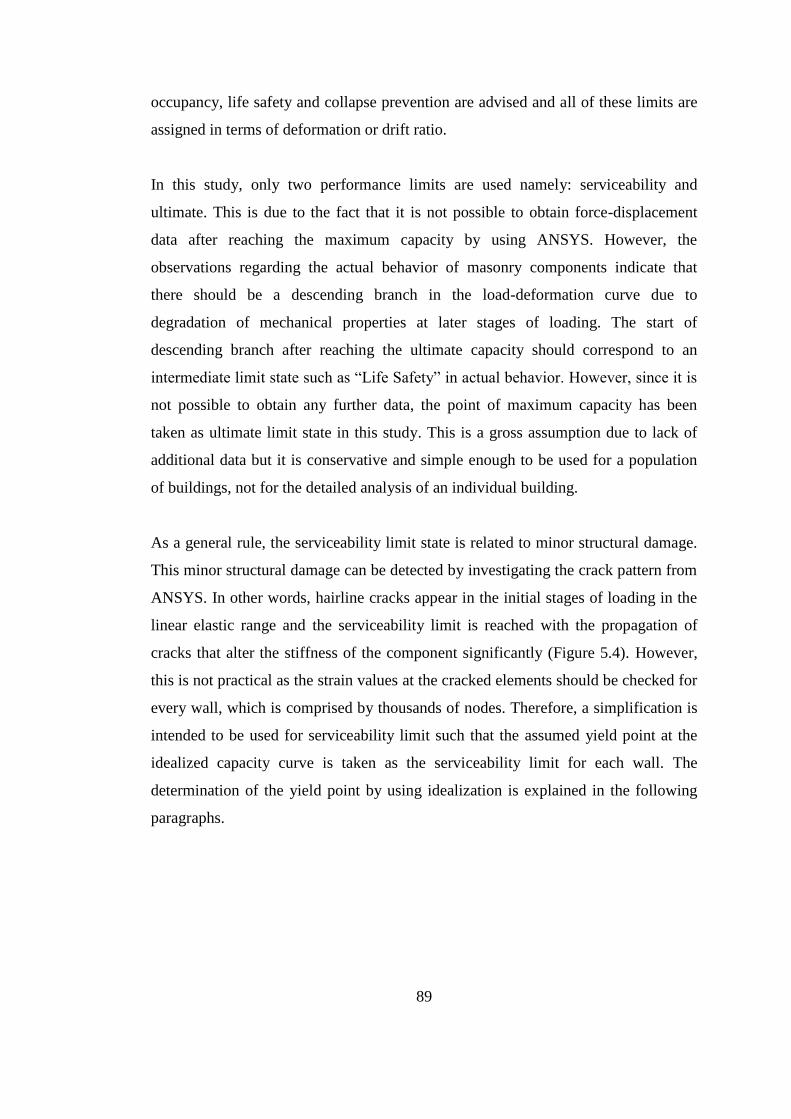
89
occupancy, life safety and collapse prevention are advised and all of these limits are
assigned in terms of deformation or drift ratio.
In this study, only two performance limits are used namely: serviceability and
ultimate. This is due to the fact that it is not possible to obtain force-displacement
data after reaching the maximum capacity by using ANSYS. However, the
observations regarding the actual behavior of masonry components indicate that
there should be a descending branch in the load-deformation curve due to
degradation of mechanical properties at later stages of loading. The start of
descending branch after reaching the ultimate capacity should correspond to an
intermediate limit state such as “Life Safety” in actual behavior. However, since it is
not possible to obtain any further data, the point of maximum capacity has been
taken as ultimate limit state in this study. This is a gross assumption due to lack of
additional data but it is conservative and simple enough to be used for a population
of buildings, not for the detailed analysis of an individual building.
As a general rule, the serviceability limit state is related to minor structural damage.
This minor structural damage can be detected by investigating the crack pattern from
ANSYS. In other words, hairline cracks appear in the initial stages of loading in the
linear elastic range and the serviceability limit is reached with the propagation of
cracks that alter the stiffness of the component significantly (Figure 5.4). However,
this is not practical as the strain values at the cracked elements should be checked for
every wall, which is comprised by thousands of nodes. Therefore, a simplification is
intended to be used for serviceability limit such that the assumed yield point at the
idealized capacity curve is taken as the serviceability limit for each wall. The
determination of the yield point by using idealization is explained in the following
paragraphs.
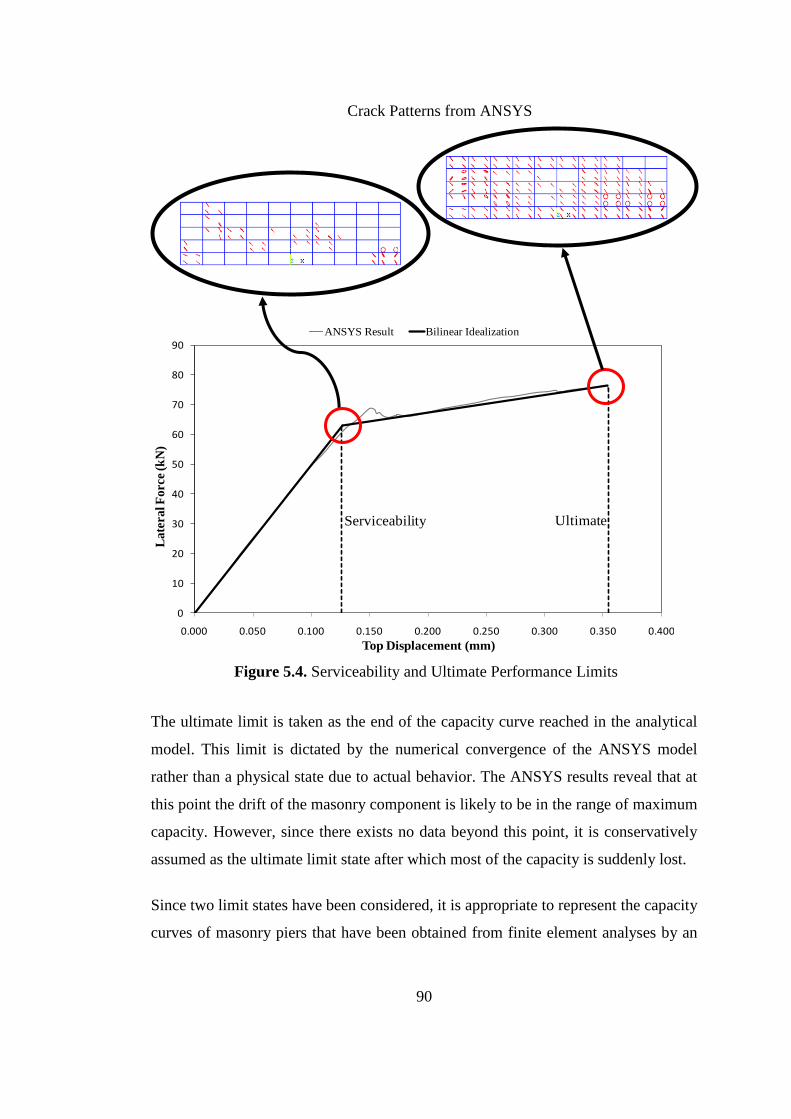
90
Figure 5.4. Serviceability and Ultimate Performance Limits
The ultimate limit is taken as the end of the capacity curve reached in the analytical
model. This limit is dictated by the numerical convergence of the ANSYS model
rather than a physical state due to actual behavior. The ANSYS results reveal that at
this point the drift of the masonry component is likely to be in the range of maximum
capacity. However, since there exists no data beyond this point, it is conservatively
assumed as the ultimate limit state after which most of the capacity is suddenly lost.
Since two limit states have been considered, it is appropriate to represent the capacity
curves of masonry piers that have been obtained from finite element analyses by an
0
10
20
30
40
50
60
70
80
90
0.000 0.050 0.100 0.150 0.200 0.250 0.300 0.350 0.400
Late
ral F
orc
e (k
N)
Top Displacement (mm)
ANSYS Result Bilinear Idealization
Serviceability Ultimate
Crack Patterns from ANSYS
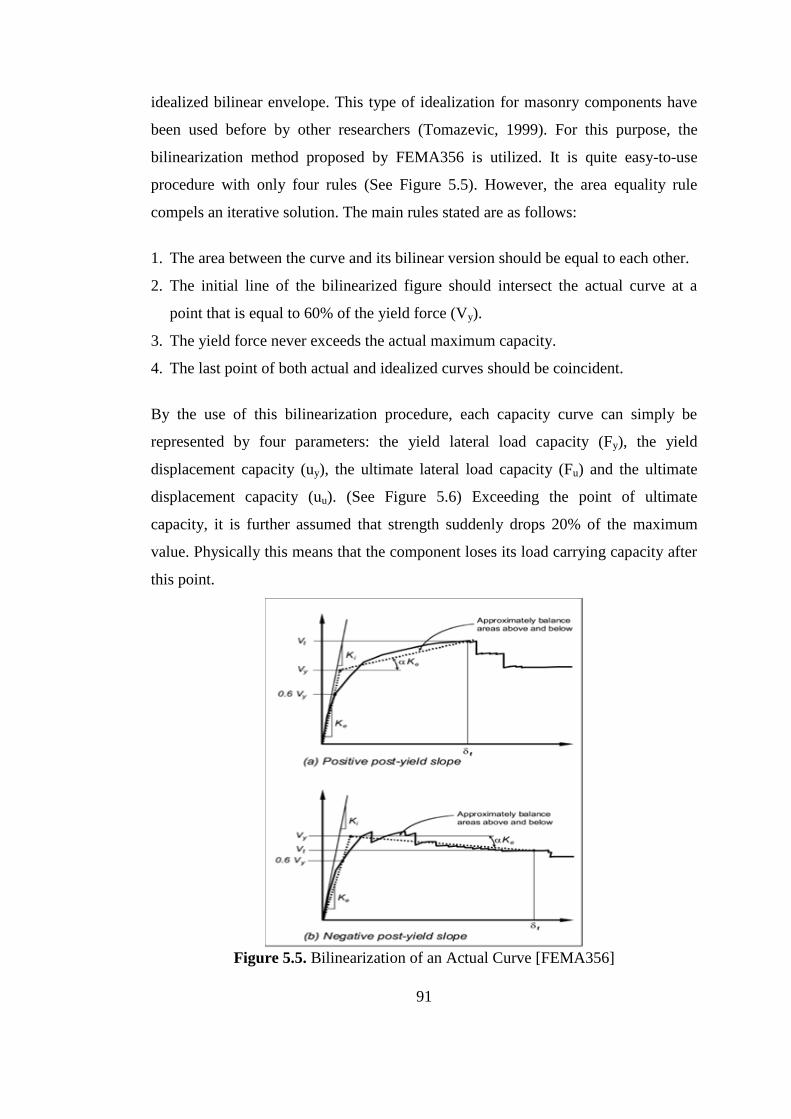
91
idealized bilinear envelope. This type of idealization for masonry components have
been used before by other researchers (Tomazevic, 1999). For this purpose, the
bilinearization method proposed by FEMA356 is utilized. It is quite easy-to-use
procedure with only four rules (See Figure 5.5). However, the area equality rule
compels an iterative solution. The main rules stated are as follows:
1. The area between the curve and its bilinear version should be equal to each other.
2. The initial line of the bilinearized figure should intersect the actual curve at a
point that is equal to 60% of the yield force (Vy).
3. The yield force never exceeds the actual maximum capacity.
4. The last point of both actual and idealized curves should be coincident.
By the use of this bilinearization procedure, each capacity curve can simply be
represented by four parameters: the yield lateral load capacity (Fy), the yield
displacement capacity (uy), the ultimate lateral load capacity (Fu) and the ultimate
displacement capacity (uu). (See Figure 5.6) Exceeding the point of ultimate
capacity, it is further assumed that strength suddenly drops 20% of the maximum
value. Physically this means that the component loses its load carrying capacity after
this point.
Figure 5.5. Bilinearization of an Actual Curve [FEMA356]

92
Figure 5.6. Lateral Capacity Curve of a typical pier with fm=5 MPa, λ=1 and
p=0.5 MPa
Hence, the previously obtained analytical results can be used as a database for
generating simple relationships between the yield lateral load capacity, the yield
displacement capacity, the ultimate lateral load capacity and the ultimate
displacement capacity, and different geometrical and mechanical properties of piers.
(See Equation 5.8)
(5.8.a)
(5.8.b)
(5.8.c)
(5.8.d)
In above equations, L is the length, t is the thickness, λ is the aspect ratio, fm is the
compressive strength of pier and p is the axial pressure on the pier.
5.4.1. Effect of Length and Thickness on Capacity Curve Parameters of Masonry
Piers
As mentioned previously, the database comprises capacity curves of piers that have a
reference length of 1 m and a reference thickness of 0.2 m. However, these
0.000
10.000
20.000
30.000
40.000
50.000
0.000 0.500 1.000 1.500 2.000 2.500 3.000 3.500 4.000 4.500 5.000
Late
ral F
orc
e (k
N)
Top Displacement (mm)
Lateral Capacity Curve
ANSYS Result Bilinear Idealization
Fy
uy
Fu
uu
0.20Fu
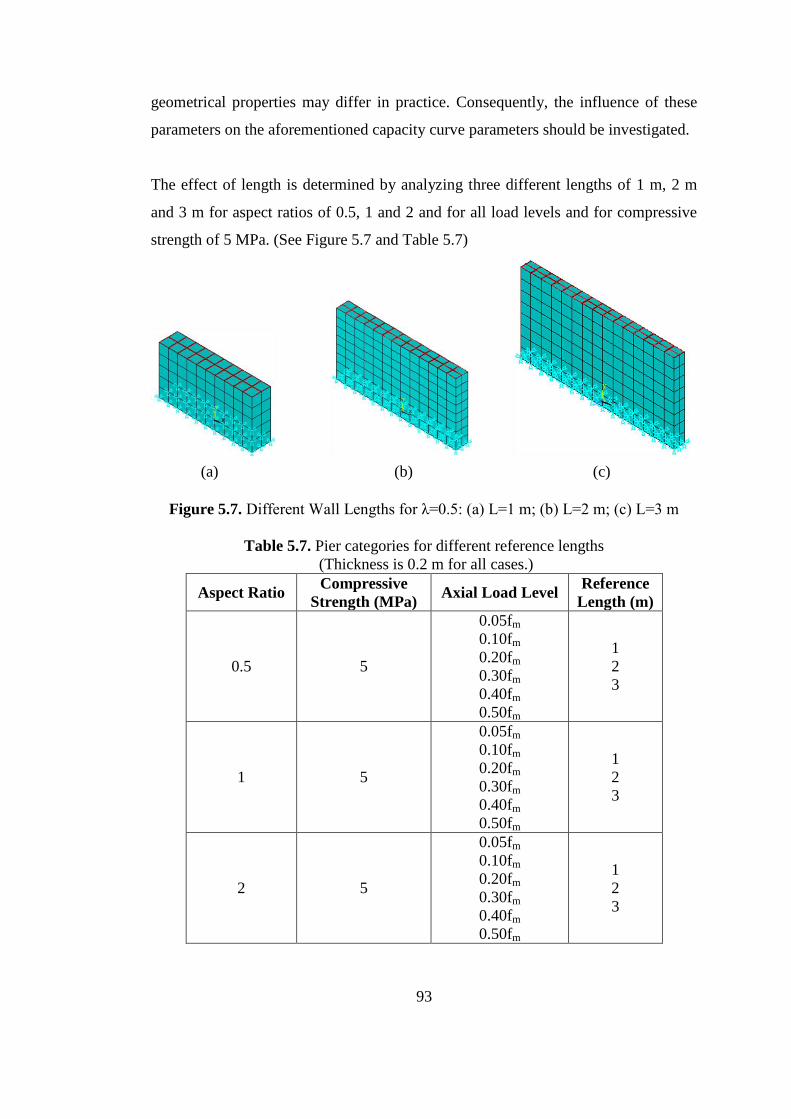
93
geometrical properties may differ in practice. Consequently, the influence of these
parameters on the aforementioned capacity curve parameters should be investigated.
The effect of length is determined by analyzing three different lengths of 1 m, 2 m
and 3 m for aspect ratios of 0.5, 1 and 2 and for all load levels and for compressive
strength of 5 MPa. (See Figure 5.7 and Table 5.7)
Figure 5.7. Different Wall Lengths for λ=0.5: (a) L=1 m; (b) L=2 m; (c) L=3 m
Table 5.7. Pier categories for different reference lengths
(Thickness is 0.2 m for all cases.)
Aspect Ratio Compressive
Strength (MPa) Axial Load Level
Reference
Length (m)
0.5 5
0.05fm
0.10fm
0.20fm
0.30fm
0.40fm
0.50fm
1
2
3
1 5
0.05fm
0.10fm
0.20fm
0.30fm
0.40fm
0.50fm
1
2
3
2 5
0.05fm
0.10fm
0.20fm
0.30fm
0.40fm
0.50fm
1
2
3
(a) (b) (c)
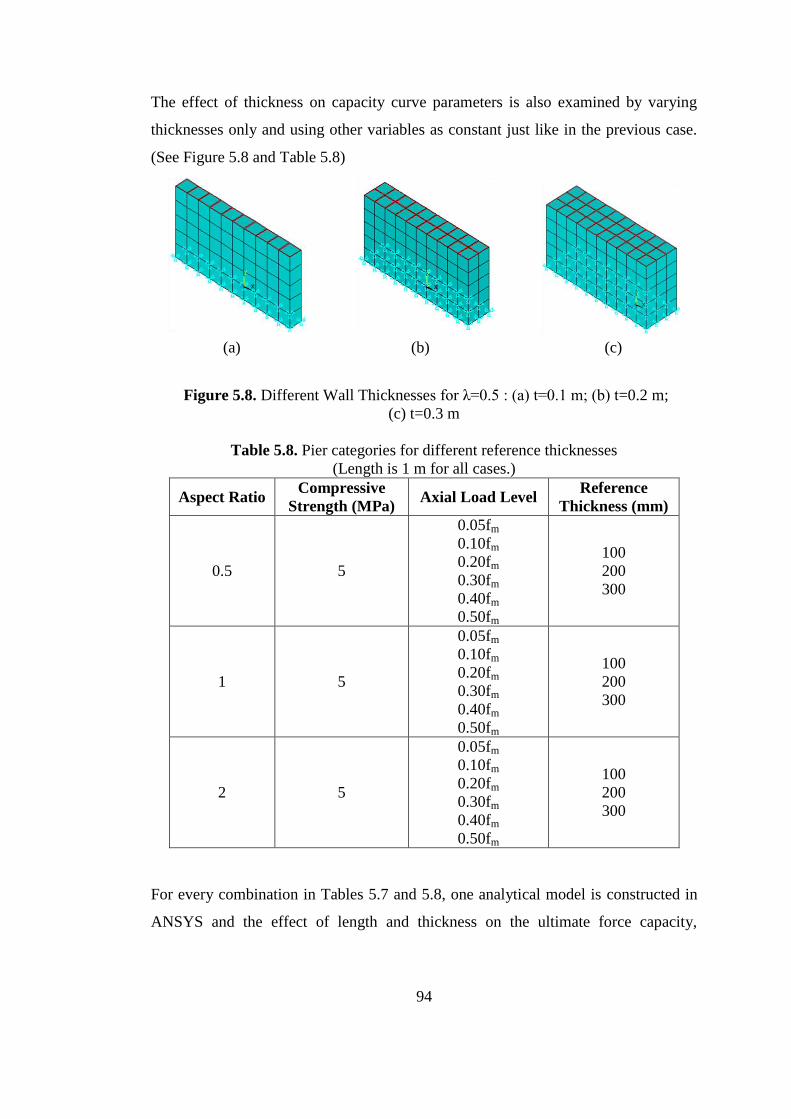
94
The effect of thickness on capacity curve parameters is also examined by varying
thicknesses only and using other variables as constant just like in the previous case.
(See Figure 5.8 and Table 5.8)
Figure 5.8. Different Wall Thicknesses for λ=0.5 : (a) t=0.1 m; (b) t=0.2 m;
(c) t=0.3 m
Table 5.8. Pier categories for different reference thicknesses
(Length is 1 m for all cases.)
Aspect Ratio Compressive
Strength (MPa) Axial Load Level
Reference
Thickness (mm)
0.5 5
0.05fm
0.10fm
0.20fm
0.30fm
0.40fm
0.50fm
100
200
300
1 5
0.05fm
0.10fm
0.20fm
0.30fm
0.40fm
0.50fm
100
200
300
2 5
0.05fm
0.10fm
0.20fm
0.30fm
0.40fm
0.50fm
100
200
300
For every combination in Tables 5.7 and 5.8, one analytical model is constructed in
ANSYS and the effect of length and thickness on the ultimate force capacity,
(a) (b) (c)
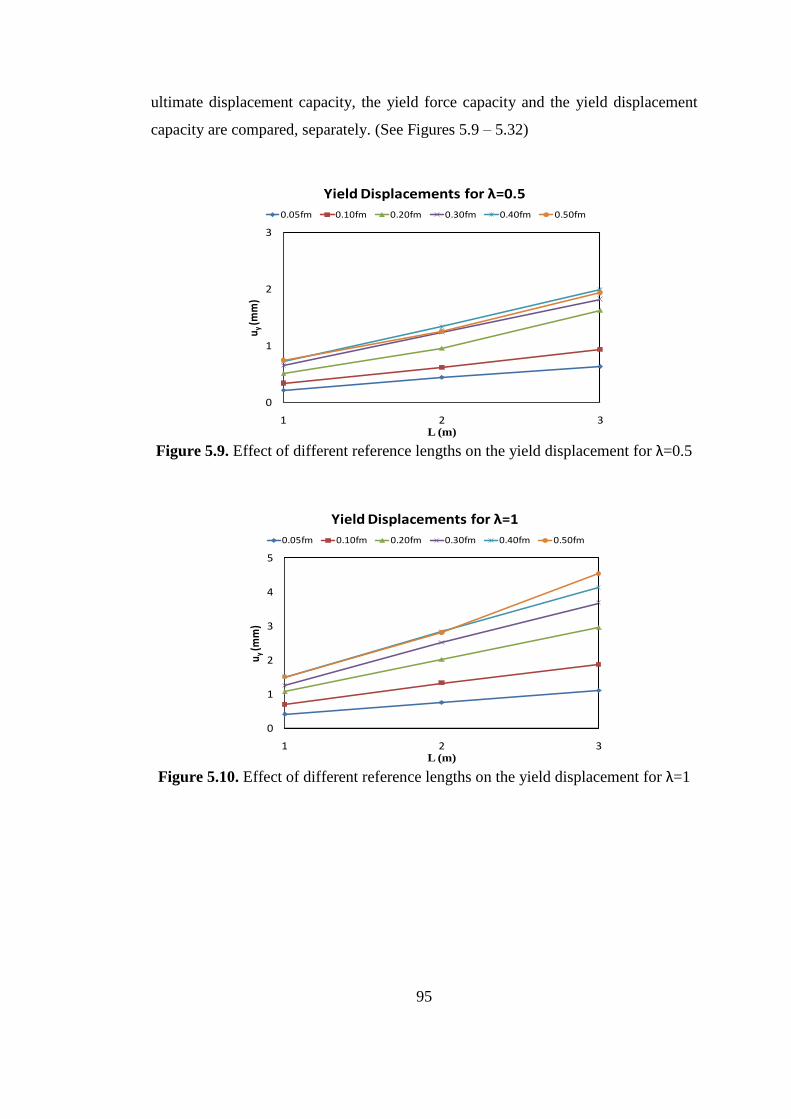
95
ultimate displacement capacity, the yield force capacity and the yield displacement
capacity are compared, separately. (See Figures 5.9 – 5.32)
Figure 5.9. Effect of different reference lengths on the yield displacement for λ=0.5
Figure 5.10. Effect of different reference lengths on the yield displacement for λ=1
0
1
2
3
1 2 3
u y (m
m)
L (m)
Yield Displacements for λ=0.5
0.05fm 0.10fm 0.20fm 0.30fm 0.40fm 0.50fm
0
1
2
3
4
5
1 2 3
u y (m
m)
L (m)
Yield Displacements for λ=1
0.05fm 0.10fm 0.20fm 0.30fm 0.40fm 0.50fm
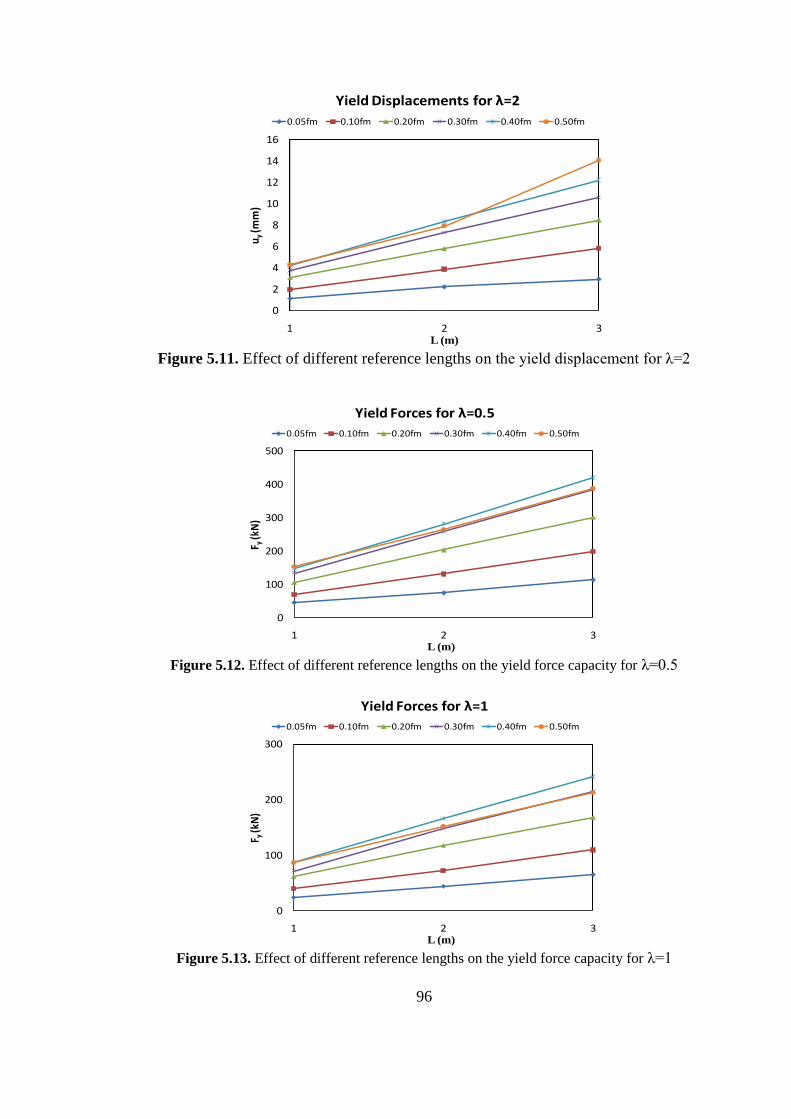
96
Figure 5.11. Effect of different reference lengths on the yield displacement for λ=2
Figure 5.12. Effect of different reference lengths on the yield force capacity for λ=0.5
Figure 5.13. Effect of different reference lengths on the yield force capacity for λ=1
0
2
4
6
8
10
12
14
16
1 2 3
uy
(mm
)
L (m)
Yield Displacements for λ=2
0.05fm 0.10fm 0.20fm 0.30fm 0.40fm 0.50fm
0
100
200
300
400
500
1 2 3
F y (k
N)
L (m)
Yield Forces for λ=0.5
0.05fm 0.10fm 0.20fm 0.30fm 0.40fm 0.50fm
0
100
200
300
1 2 3
F y (k
N)
L (m)
Yield Forces for λ=1
0.05fm 0.10fm 0.20fm 0.30fm 0.40fm 0.50fm
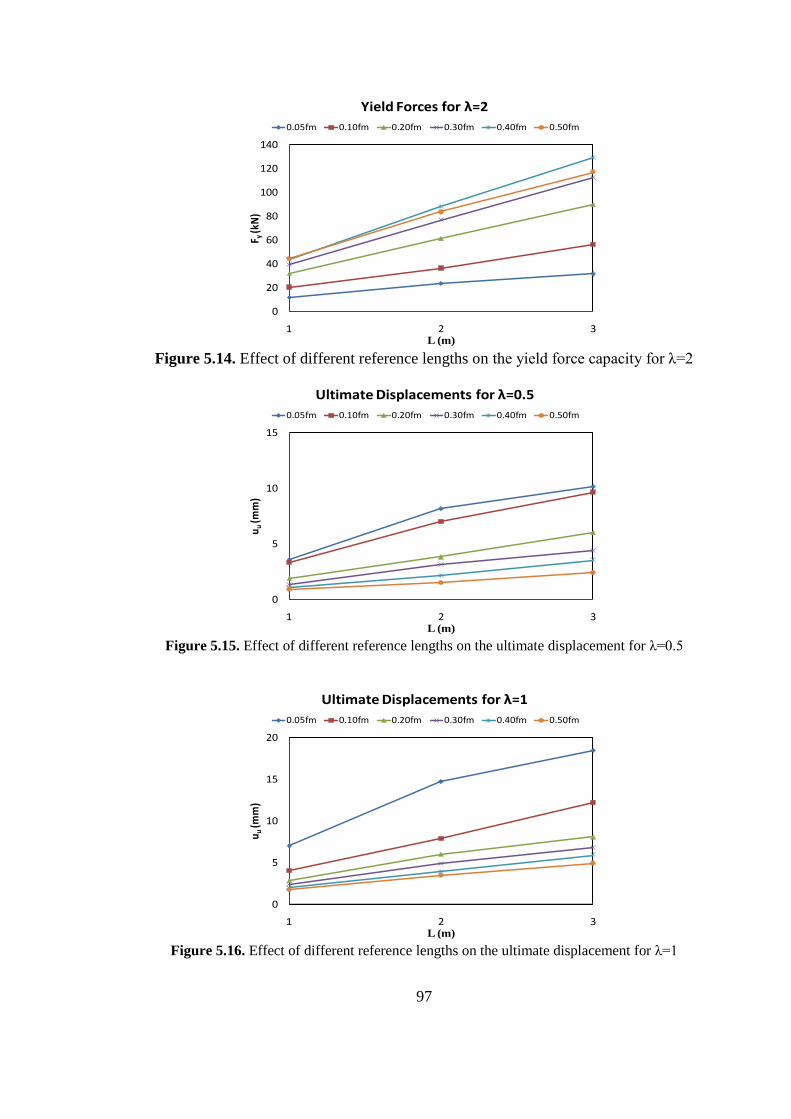
97
Figure 5.14. Effect of different reference lengths on the yield force capacity for λ=2
Figure 5.15. Effect of different reference lengths on the ultimate displacement for λ=0.5
Figure 5.16. Effect of different reference lengths on the ultimate displacement for λ=1
0
20
40
60
80
100
120
140
1 2 3
F y (k
N)
L (m)
Yield Forces for λ=2
0.05fm 0.10fm 0.20fm 0.30fm 0.40fm 0.50fm
0
5
10
15
1 2 3
u u (m
m)
L (m)
Ultimate Displacements for λ=0.5
0.05fm 0.10fm 0.20fm 0.30fm 0.40fm 0.50fm
0
5
10
15
20
1 2 3
u u (m
m)
L (m)
Ultimate Displacements for λ=1
0.05fm 0.10fm 0.20fm 0.30fm 0.40fm 0.50fm
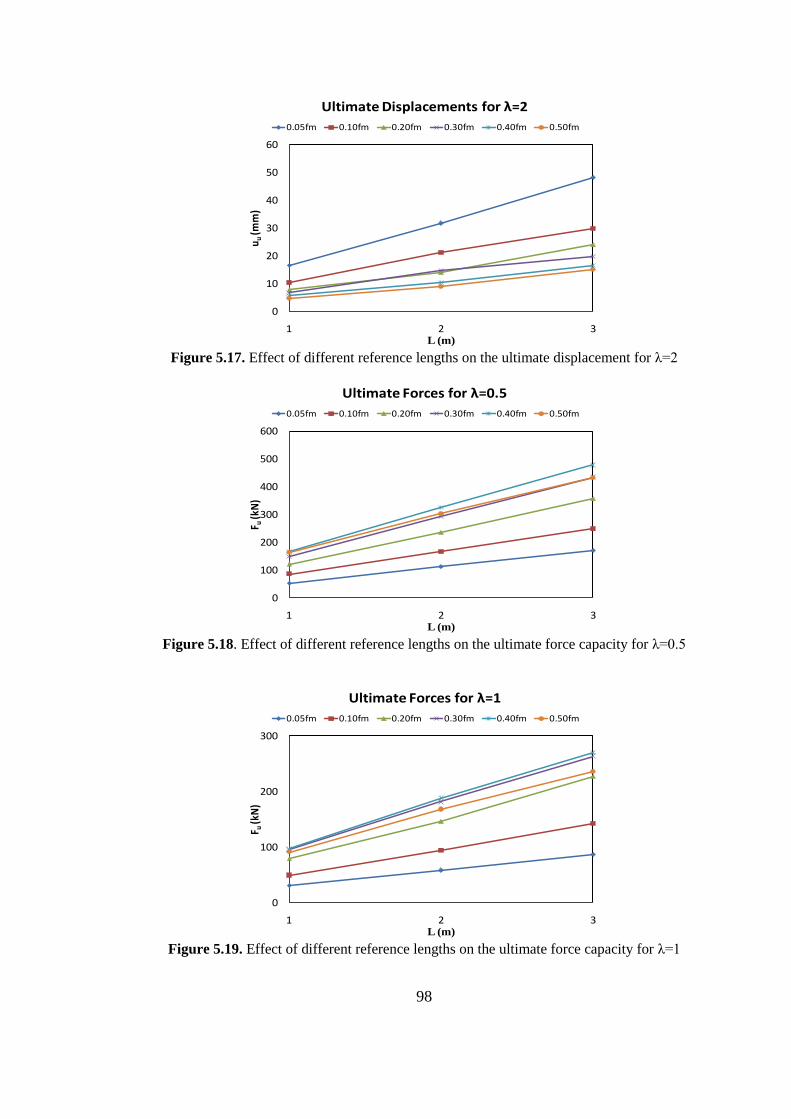
98
Figure 5.17. Effect of different reference lengths on the ultimate displacement for λ=2
Figure 5.18. Effect of different reference lengths on the ultimate force capacity for λ=0.5
Figure 5.19. Effect of different reference lengths on the ultimate force capacity for λ=1
0
10
20
30
40
50
60
1 2 3
u u (m
m)
L (m)
Ultimate Displacements for λ=2
0.05fm 0.10fm 0.20fm 0.30fm 0.40fm 0.50fm
0
100
200
300
400
500
600
1 2 3
F u (k
N)
L (m)
Ultimate Forces for λ=0.5
0.05fm 0.10fm 0.20fm 0.30fm 0.40fm 0.50fm
0
100
200
300
1 2 3
F u (k
N)
L (m)
Ultimate Forces for λ=1
0.05fm 0.10fm 0.20fm 0.30fm 0.40fm 0.50fm

99
Figure 5.20. Effect of different reference lengths on the ultimate force capacity for λ=2
Figure 5.21. Effect of different reference thicknesses on the yield displacement for λ=0.5
Figure 5.22. Effect of different reference thicknesses on the yield displacement for λ=1
0
20
40
60
80
100
120
140
160
1 2 3
F u (k
N)
L (m)
Ultimate Forces for λ=2
0.05fm 0.10fm 0.20fm 0.30fm 0.40fm 0.50fm
0
0.5
1
0.1 0.2 0.3
u y (m
m)
t (m)
Yield Displacements for λ=0.5
0.05fm 0.10fm 0.20fm 0.30fm 0.40fm 0.50fm
0
1
2
0.1 0.2 0.3
u y (m
m)
t (m)
Yield Displacements for λ=1
0.05fm 0.10fm 0.20fm 0.30fm 0.40fm 0.50fm
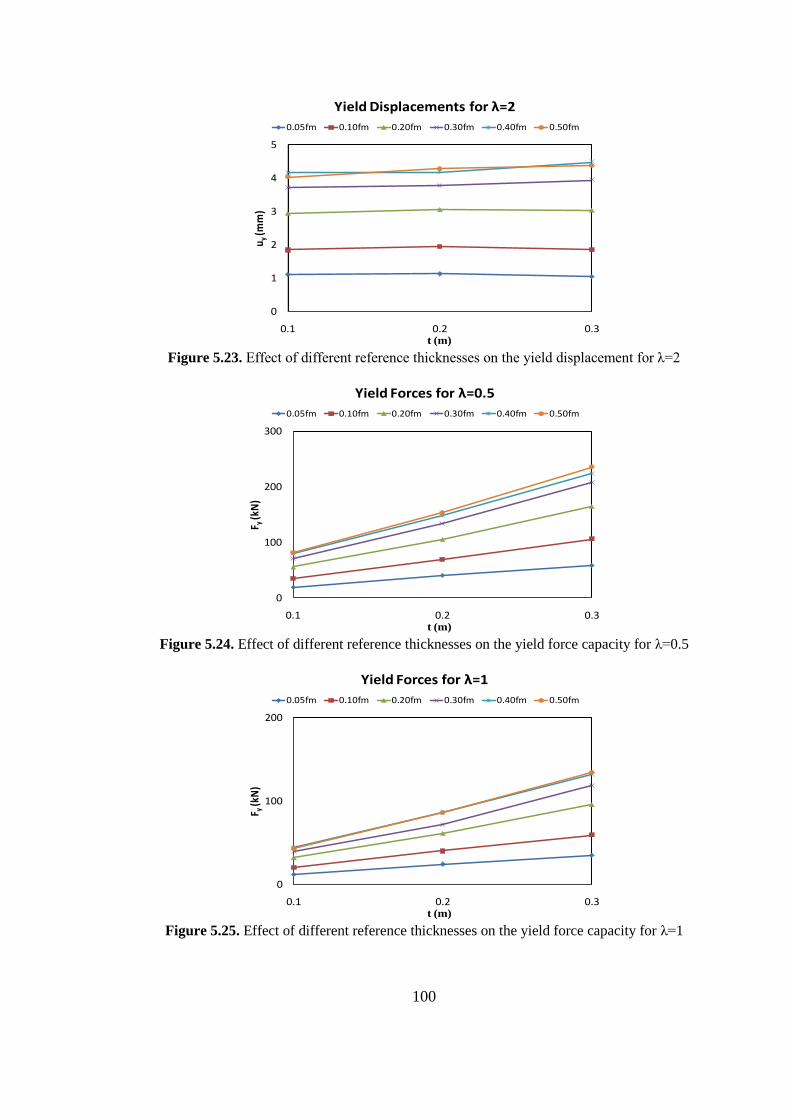
100
Figure 5.23. Effect of different reference thicknesses on the yield displacement for λ=2
Figure 5.24. Effect of different reference thicknesses on the yield force capacity for λ=0.5
Figure 5.25. Effect of different reference thicknesses on the yield force capacity for λ=1
0
1
2
3
4
5
0.1 0.2 0.3
u y (m
m)
t (m)
Yield Displacements for λ=2
0.05fm 0.10fm 0.20fm 0.30fm 0.40fm 0.50fm
0
100
200
300
0.1 0.2 0.3
F y (k
N)
t (m)
Yield Forces for λ=0.5
0.05fm 0.10fm 0.20fm 0.30fm 0.40fm 0.50fm
0
100
200
0.1 0.2 0.3
F y (k
N)
t (m)
Yield Forces for λ=1
0.05fm 0.10fm 0.20fm 0.30fm 0.40fm 0.50fm
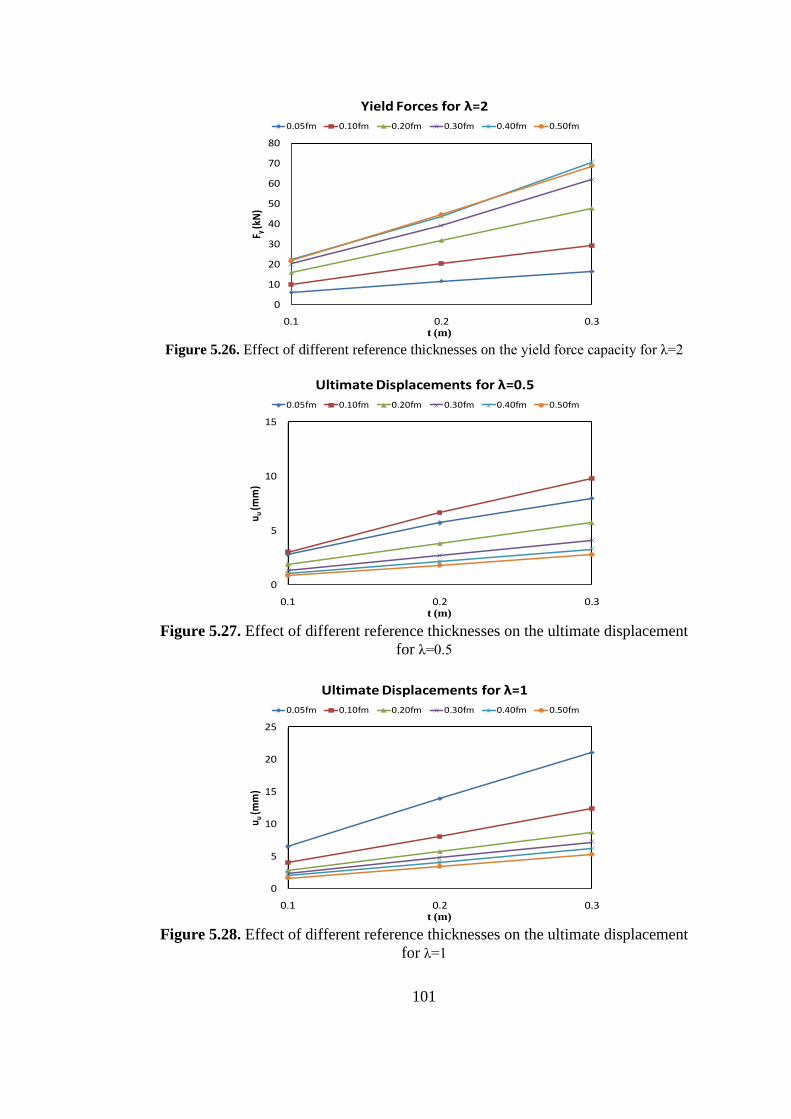
101
Figure 5.26. Effect of different reference thicknesses on the yield force capacity for λ=2
Figure 5.27. Effect of different reference thicknesses on the ultimate displacement
for λ=0.5
Figure 5.28. Effect of different reference thicknesses on the ultimate displacement
for λ=1
0
10
20
30
40
50
60
70
80
0.1 0.2 0.3
F y (k
N)
t (m)
Yield Forces for λ=2
0.05fm 0.10fm 0.20fm 0.30fm 0.40fm 0.50fm
0
5
10
15
0.1 0.2 0.3
u u (m
m)
t (m)
Ultimate Displacements for λ=0.5
0.05fm 0.10fm 0.20fm 0.30fm 0.40fm 0.50fm
0
5
10
15
20
25
0.1 0.2 0.3
u u (m
m)
t (m)
Ultimate Displacements for λ=1
0.05fm 0.10fm 0.20fm 0.30fm 0.40fm 0.50fm
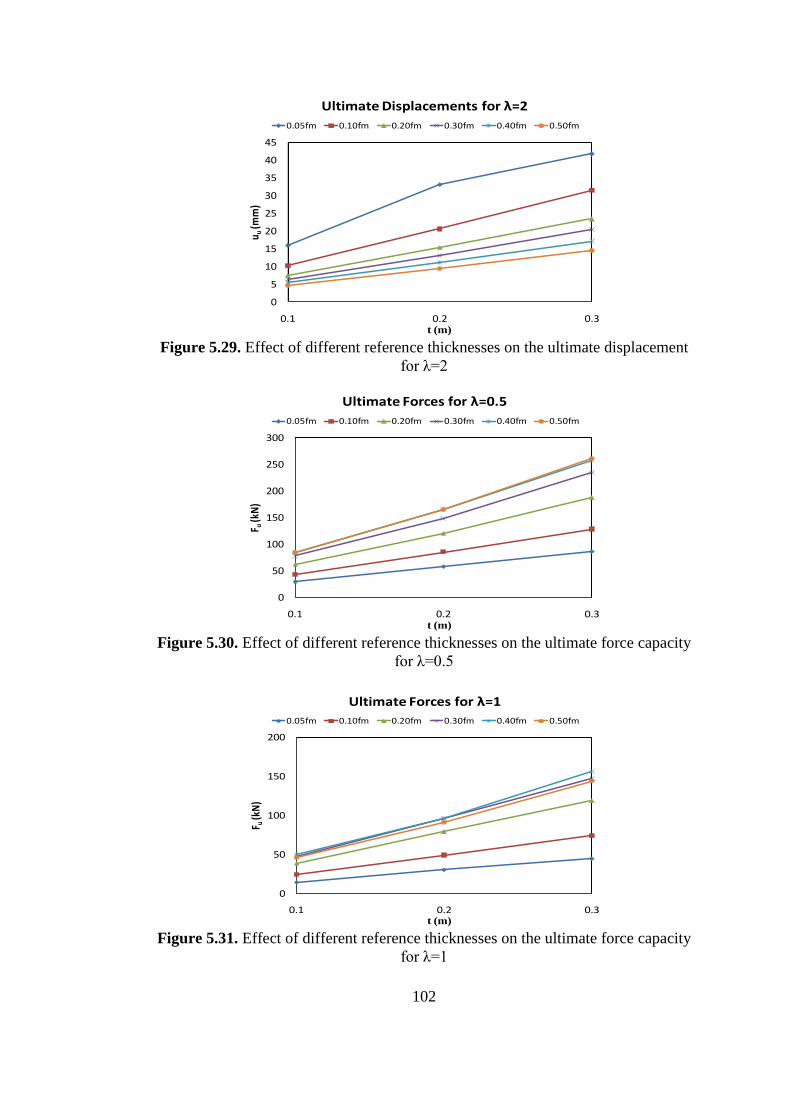
102
Figure 5.29. Effect of different reference thicknesses on the ultimate displacement
for λ=2
Figure 5.30. Effect of different reference thicknesses on the ultimate force capacity
for λ=0.5
Figure 5.31. Effect of different reference thicknesses on the ultimate force capacity
for λ=1
0
5
10
15
20
25
30
35
40
45
0.1 0.2 0.3
u u (m
m)
t (m)
Ultimate Displacements for λ=2
0.05fm 0.10fm 0.20fm 0.30fm 0.40fm 0.50fm
0
50
100
150
200
250
300
0.1 0.2 0.3
F u (k
N)
t (m)
Ultimate Forces for λ=0.5
0.05fm 0.10fm 0.20fm 0.30fm 0.40fm 0.50fm
0
50
100
150
200
0.1 0.2 0.3
F u (k
N)
t (m)
Ultimate Forces for λ=1
0.05fm 0.10fm 0.20fm 0.30fm 0.40fm 0.50fm
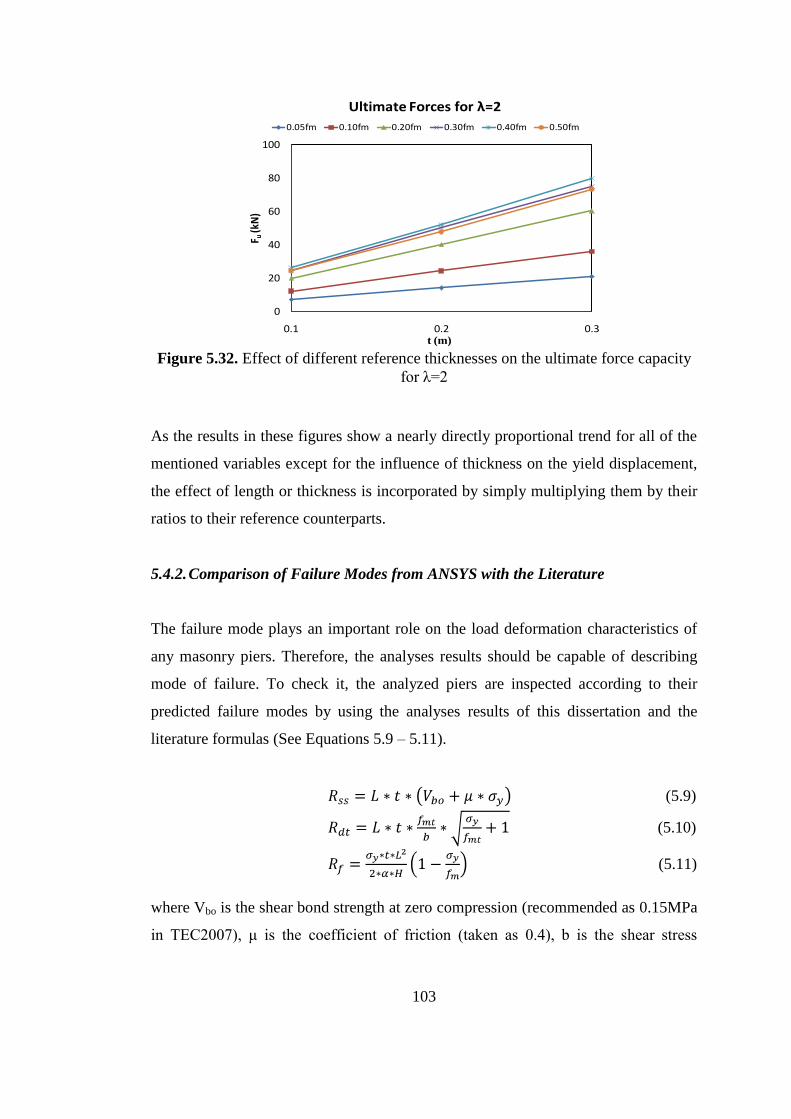
103
Figure 5.32. Effect of different reference thicknesses on the ultimate force capacity
for λ=2
As the results in these figures show a nearly directly proportional trend for all of the
mentioned variables except for the influence of thickness on the yield displacement,
the effect of length or thickness is incorporated by simply multiplying them by their
ratios to their reference counterparts.
5.4.2. Comparison of Failure Modes from ANSYS with the Literature
The failure mode plays an important role on the load deformation characteristics of
any masonry piers. Therefore, the analyses results should be capable of describing
mode of failure. To check it, the analyzed piers are inspected according to their
predicted failure modes by using the analyses results of this dissertation and the
literature formulas (See Equations 5.9 – 5.11).
(5.9)
(5.10)
(5.11)
where Vbo is the shear bond strength at zero compression (recommended as 0.15MPa
in TEC2007), μ is the coefficient of friction (taken as 0.4), b is the shear stress
0
20
40
60
80
100
0.1 0.2 0.3
F u (k
N)
t (m)
Ultimate Forces for λ=2
0.05fm 0.10fm 0.20fm 0.30fm 0.40fm 0.50fm
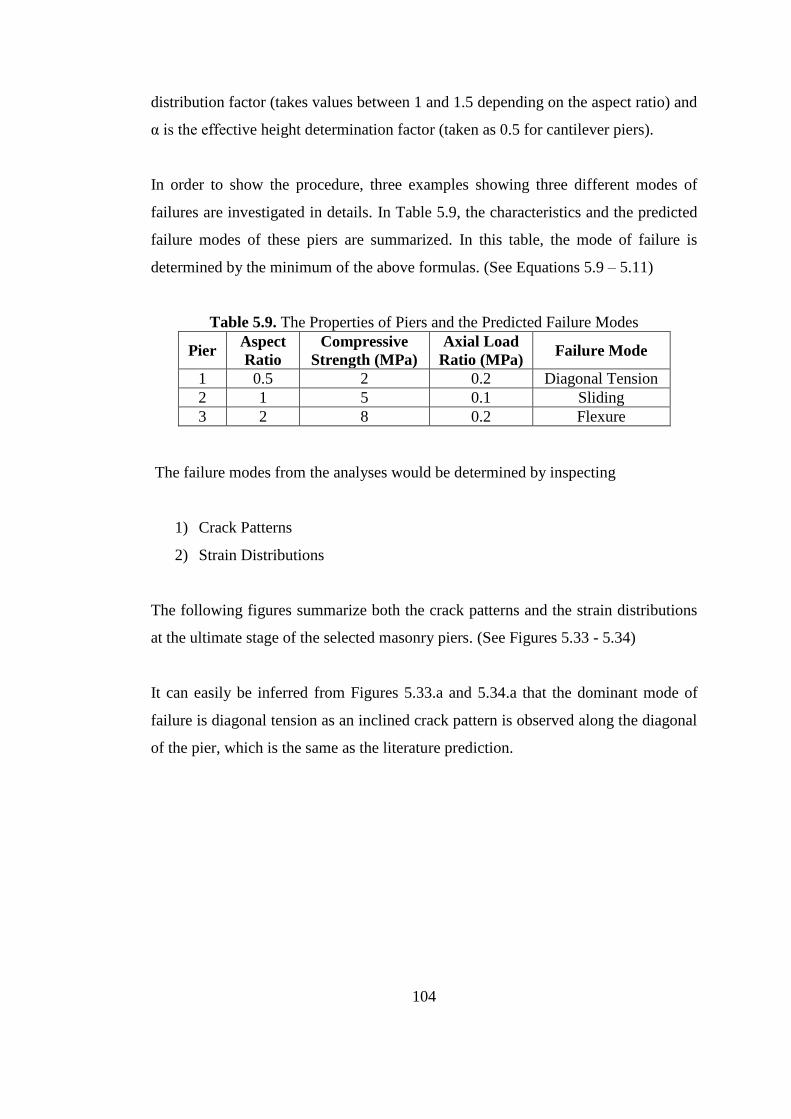
104
distribution factor (takes values between 1 and 1.5 depending on the aspect ratio) and
α is the effective height determination factor (taken as 0.5 for cantilever piers).
In order to show the procedure, three examples showing three different modes of
failures are investigated in details. In Table 5.9, the characteristics and the predicted
failure modes of these piers are summarized. In this table, the mode of failure is
determined by the minimum of the above formulas. (See Equations 5.9 – 5.11)
Table 5.9. The Properties of Piers and the Predicted Failure Modes
Pier Aspect
Ratio
Compressive
Strength (MPa)
Axial Load
Ratio (MPa) Failure Mode
1 0.5 2 0.2 Diagonal Tension
2 1 5 0.1 Sliding
3 2 8 0.2 Flexure
The failure modes from the analyses would be determined by inspecting
1) Crack Patterns
2) Strain Distributions
The following figures summarize both the crack patterns and the strain distributions
at the ultimate stage of the selected masonry piers. (See Figures 5.33 - 5.34)
It can easily be inferred from Figures 5.33.a and 5.34.a that the dominant mode of
failure is diagonal tension as an inclined crack pattern is observed along the diagonal
of the pier, which is the same as the literature prediction.
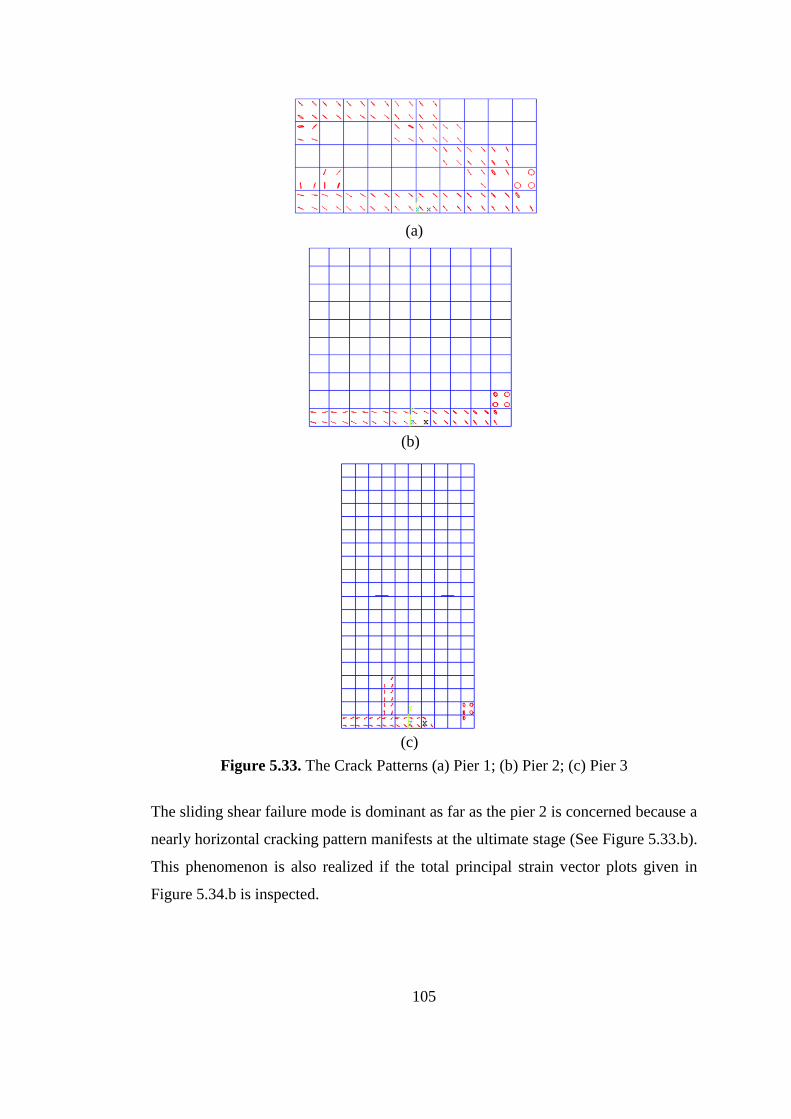
105
Figure 5.33. The Crack Patterns (a) Pier 1; (b) Pier 2; (c) Pier 3
The sliding shear failure mode is dominant as far as the pier 2 is concerned because a
nearly horizontal cracking pattern manifests at the ultimate stage (See Figure 5.33.b).
This phenomenon is also realized if the total principal strain vector plots given in
Figure 5.34.b is inspected.
(c)
(b)
(a)

106
The third failure mode, flexure, is observed in Pier 3 although it is not apparent from
the crack pattern (See Figure 5.33.c). However, the flexural failure is prominent as
high axial elongation (marked by two- headed arrows) occurs on side of the pier
whereas axial contraction (marked by blue arrows) is seen on the other side (See
Figure 5.34.c).
Figure 5.34. The Total Principal Strain Vector Plots (a) Pier 1; (b) Pier 2; (c) Pier 3
The finite element analyses and the literature formulas come up with pretty different
lateral load capacity estimations. (See Table 5.10) This is because; the literature
formulas are purely dependent on constants like Vbo, μ, b, etc. whose true values for
the selected pier set are not known.
Table 5.10. The Properties of Piers and the Predicted Failure Modes
Pier Fu,literature (kN) Fu,FEM (kN) Percentage Error (%)
1 70.000 41.934 -35.299
2 54.991 45.291 -23.743
3 128.000 56.821 -55.608
(b)
(a)
(c)
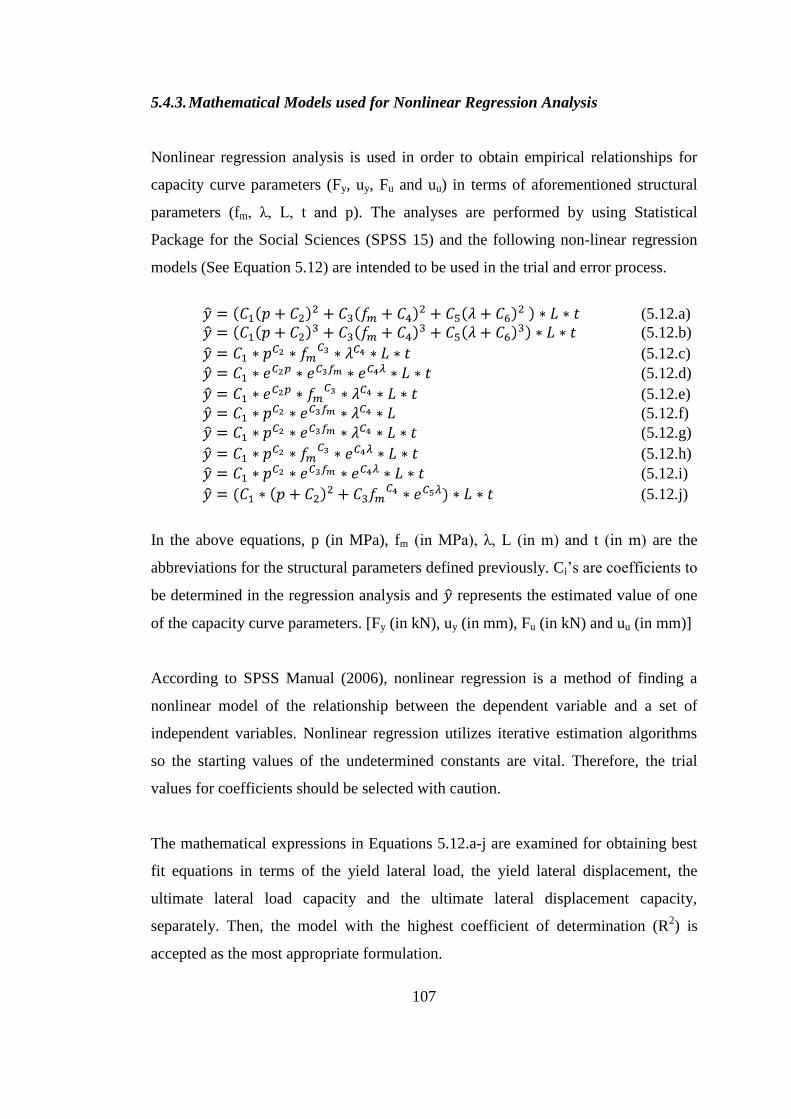
107
5.4.3. Mathematical Models used for Nonlinear Regression Analysis
Nonlinear regression analysis is used in order to obtain empirical relationships for
capacity curve parameters (Fy, uy, Fu and uu) in terms of aforementioned structural
parameters (fm, λ, L, t and p). The analyses are performed by using Statistical
Package for the Social Sciences (SPSS 15) and the following non-linear regression
models (See Equation 5.12) are intended to be used in the trial and error process.
(5.12.a)
(5.12.b)
(5.12.c)
(5.12.d)
(5.12.e)
(5.12.f)
(5.12.g)
(5.12.h)
(5.12.i)
(5.12.j)
In the above equations, p (in MPa), fm (in MPa), λ, L (in m) and t (in m) are the
abbreviations for the structural parameters defined previously. Ci’s are coefficients to
be determined in the regression analysis and represents the estimated value of one
of the capacity curve parameters. [Fy (in kN), uy (in mm), Fu (in kN) and uu (in mm)]
According to SPSS Manual (2006), nonlinear regression is a method of finding a
nonlinear model of the relationship between the dependent variable and a set of
independent variables. Nonlinear regression utilizes iterative estimation algorithms
so the starting values of the undetermined constants are vital. Therefore, the trial
values for coefficients should be selected with caution.
The mathematical expressions in Equations 5.12.a-j are examined for obtaining best
fit equations in terms of the yield lateral load, the yield lateral displacement, the
ultimate lateral load capacity and the ultimate lateral displacement capacity,
separately. Then, the model with the highest coefficient of determination (R2) is
accepted as the most appropriate formulation.
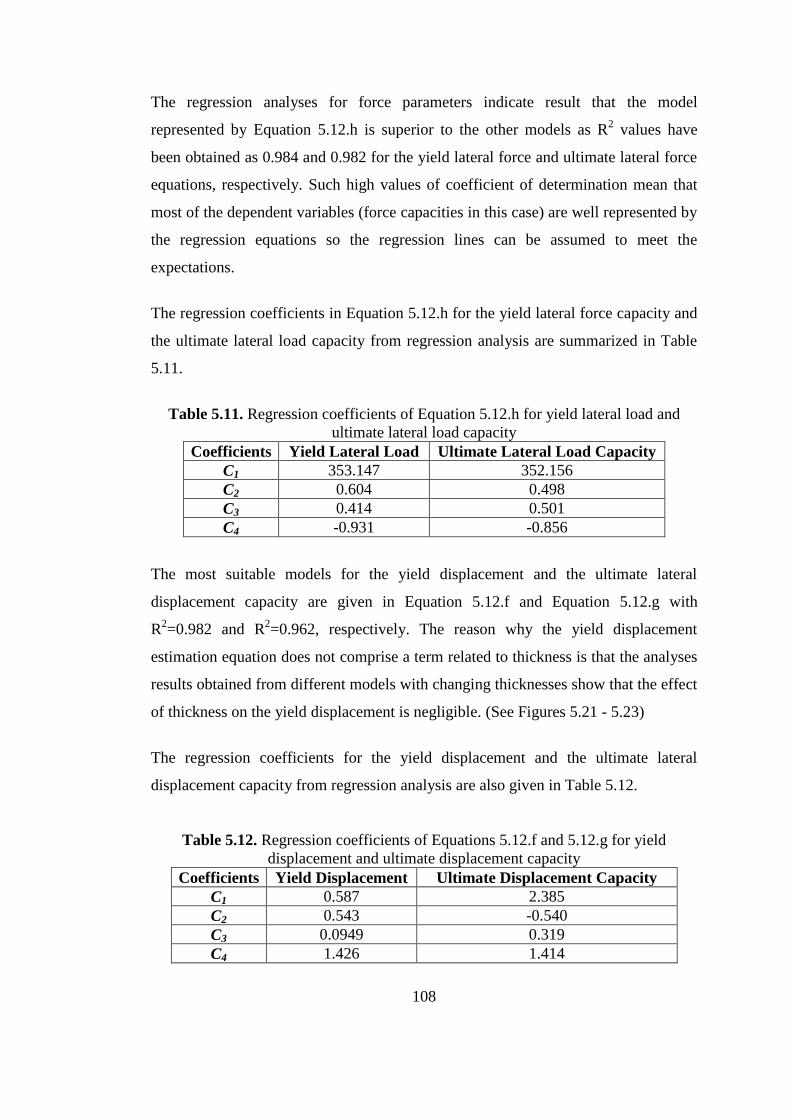
108
The regression analyses for force parameters indicate result that the model
represented by Equation 5.12.h is superior to the other models as R2 values have
been obtained as 0.984 and 0.982 for the yield lateral force and ultimate lateral force
equations, respectively. Such high values of coefficient of determination mean that
most of the dependent variables (force capacities in this case) are well represented by
the regression equations so the regression lines can be assumed to meet the
expectations.
The regression coefficients in Equation 5.12.h for the yield lateral force capacity and
the ultimate lateral load capacity from regression analysis are summarized in Table
5.11.
Table 5.11. Regression coefficients of Equation 5.12.h for yield lateral load and
ultimate lateral load capacity
Coefficients Yield Lateral Load Ultimate Lateral Load Capacity
C1 353.147 352.156
C2 0.604 0.498
C3 0.414 0.501
C4 -0.931 -0.856
The most suitable models for the yield displacement and the ultimate lateral
displacement capacity are given in Equation 5.12.f and Equation 5.12.g with
R2=0.982 and R
2=0.962, respectively. The reason why the yield displacement
estimation equation does not comprise a term related to thickness is that the analyses
results obtained from different models with changing thicknesses show that the effect
of thickness on the yield displacement is negligible. (See Figures 5.21 - 5.23)
The regression coefficients for the yield displacement and the ultimate lateral
displacement capacity from regression analysis are also given in Table 5.12.
Table 5.12. Regression coefficients of Equations 5.12.f and 5.12.g for yield
displacement and ultimate displacement capacity
Coefficients Yield Displacement Ultimate Displacement Capacity
C1 0.587 2.385
C2 0.543 -0.540
C3 0.0949 0.319
C4 1.426 1.414

109
Hence, these simple formulations can replace detailed finite element analyses in
order to estimate idealized capacity curve parameters of masonry piers of any
geometry. For instance, the comparison of results obtained from both above simple
equations and ANSYS for a pier of λ=1, fm=5 MPa and p=0.5 MPa yields a
conclusion that the errors of these estimations are acceptable. (See Table 5.13)
Table 5.13. Comparison of capacity curve parameter estimations
Simple Equations ANSYS Error (%)
Yield Displacement (mm) 0.622 0.648 4.204
Yield Force (kN) 33.821 35.710 5.585
Ultimate Displacement (mm) 3.985 3.424 14.058
Ultimate Force (kN) 45.291 47.456 4.780
Then, the lateral load capacity of the critical storey of an unreinforced masonry
building in one direction can be obtained by combining the contributions coming
from each pier of different geometry after obtaining the simple and idealized
capacity curves of these piers as explained above. It is also possible to determine the
performance limits of the critical storey since limit states for all piers have already
been defined. Finally, this information can be used to attain the global limit states of
the building under construction.
After determining the seismic demand on the building, the performance state can be
obtained by using any of the proposed methods in literature (single-degree-of-
freedom idealization, capacity spectrum method, displacement coefficient method,
etc. ). Since the proposed method is simple (with bilinear capacity curves as function
of simple structural parameters) and approximate (including many assumptions at
different stages), it is very suitable to assess the seismic safety of a population of
buildings. For individual buildings which require detailed evaluation, this method
may yield misleading results (generally on the conservative side).
The application of the method will be presented by considering an actual
unreinforced masonry building in Istanbul, which was investigated during Istanbul
Masterplan Project.
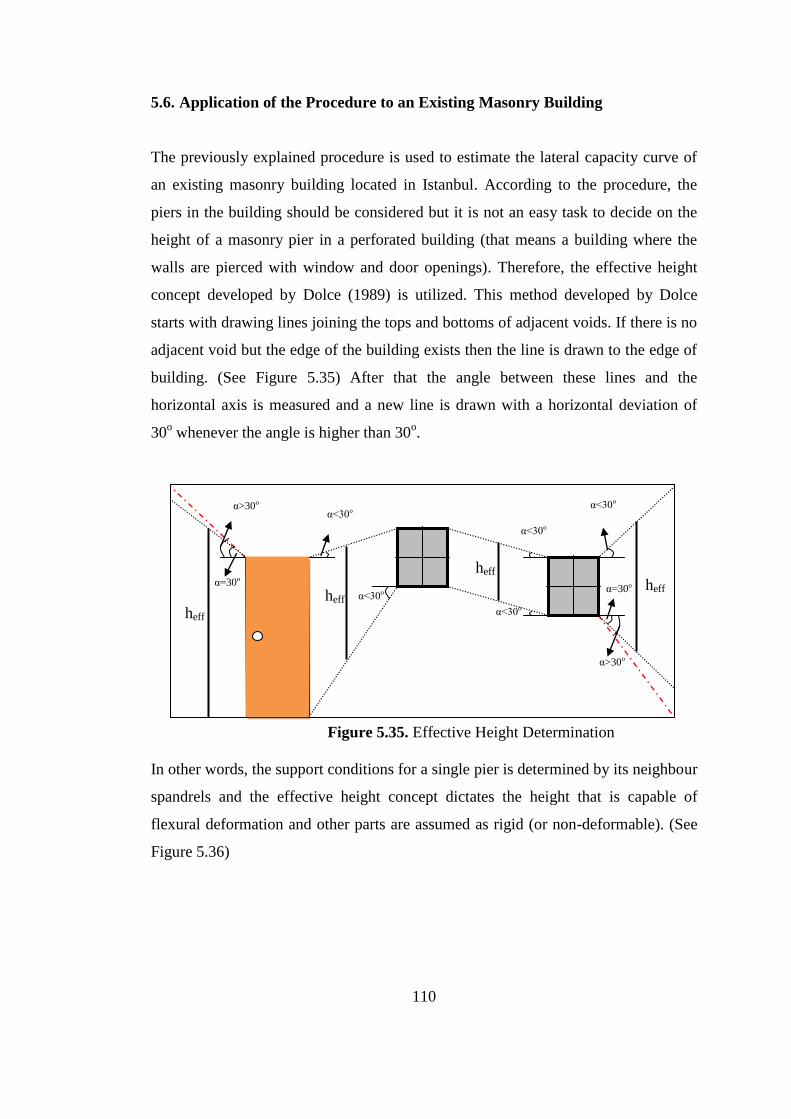
110
5.6. Application of the Procedure to an Existing Masonry Building
The previously explained procedure is used to estimate the lateral capacity curve of
an existing masonry building located in Istanbul. According to the procedure, the
piers in the building should be considered but it is not an easy task to decide on the
height of a masonry pier in a perforated building (that means a building where the
walls are pierced with window and door openings). Therefore, the effective height
concept developed by Dolce (1989) is utilized. This method developed by Dolce
starts with drawing lines joining the tops and bottoms of adjacent voids. If there is no
adjacent void but the edge of the building exists then the line is drawn to the edge of
building. (See Figure 5.35) After that the angle between these lines and the
horizontal axis is measured and a new line is drawn with a horizontal deviation of
30o whenever the angle is higher than 30
o.
Figure 5.35. Effective Height Determination
In other words, the support conditions for a single pier is determined by its neighbour
spandrels and the effective height concept dictates the height that is capable of
flexural deformation and other parts are assumed as rigid (or non-deformable). (See
Figure 5.36)
heff heff
heff
α>30o
α=30o
α<30o
α<30o
α<30o
α=30o
α>30o
α<30o
α<30o
heff
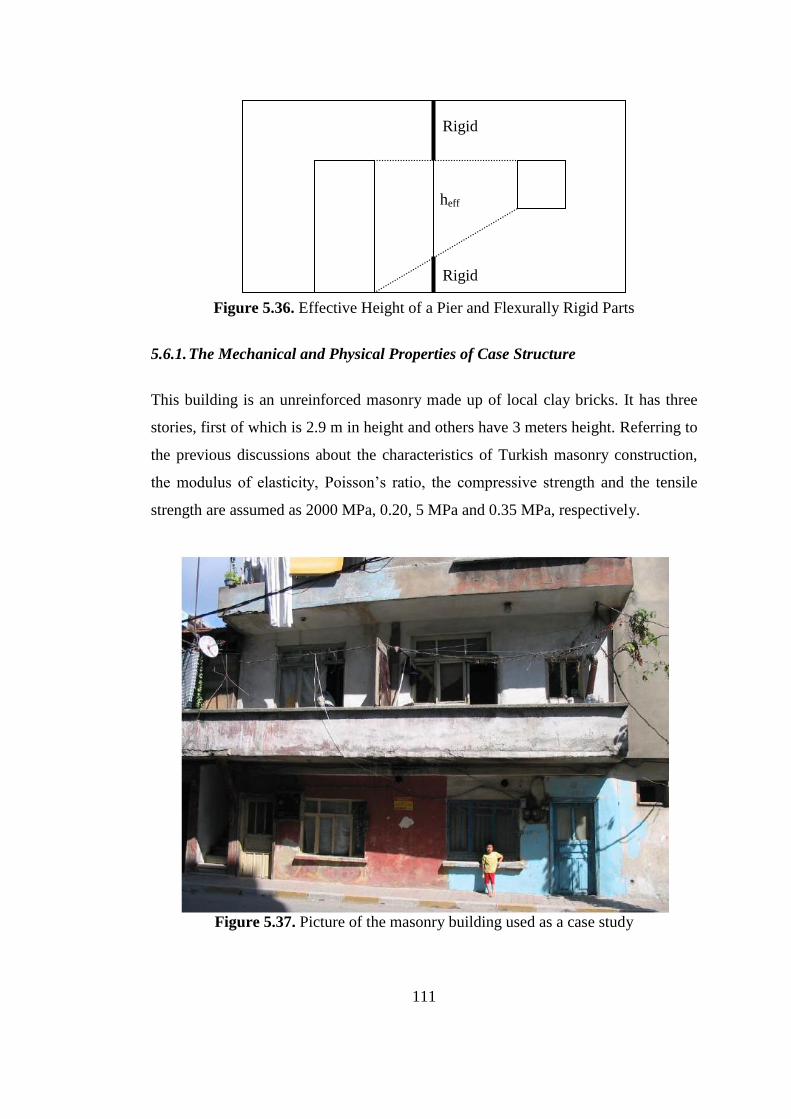
111
Figure 5.36. Effective Height of a Pier and Flexurally Rigid Parts
5.6.1. The Mechanical and Physical Properties of Case Structure
This building is an unreinforced masonry made up of local clay bricks. It has three
stories, first of which is 2.9 m in height and others have 3 meters height. Referring to
the previous discussions about the characteristics of Turkish masonry construction,
the modulus of elasticity, Poisson’s ratio, the compressive strength and the tensile
strength are assumed as 2000 MPa, 0.20, 5 MPa and 0.35 MPa, respectively.
Figure 5.37. Picture of the masonry building used as a case study
Rigid
Rigid
heff

112
A frontal photo of the masonry building under concern and its plan view are shown
in Figures 5.37 and 5.38, respectively.
The piers are labeled according to orthogonal directions. Figures 5.39 and 5.40 show
the walls in X and Y directions as dashed lines, respectively. (The labeling of frames
in x and y directions starts from bottom left, respectively. i.e. X1 is the leftmost
frame in X direction.) The effective heights of piers determined by the Dolce Method
are also shown in Figures 5.41-5.46.
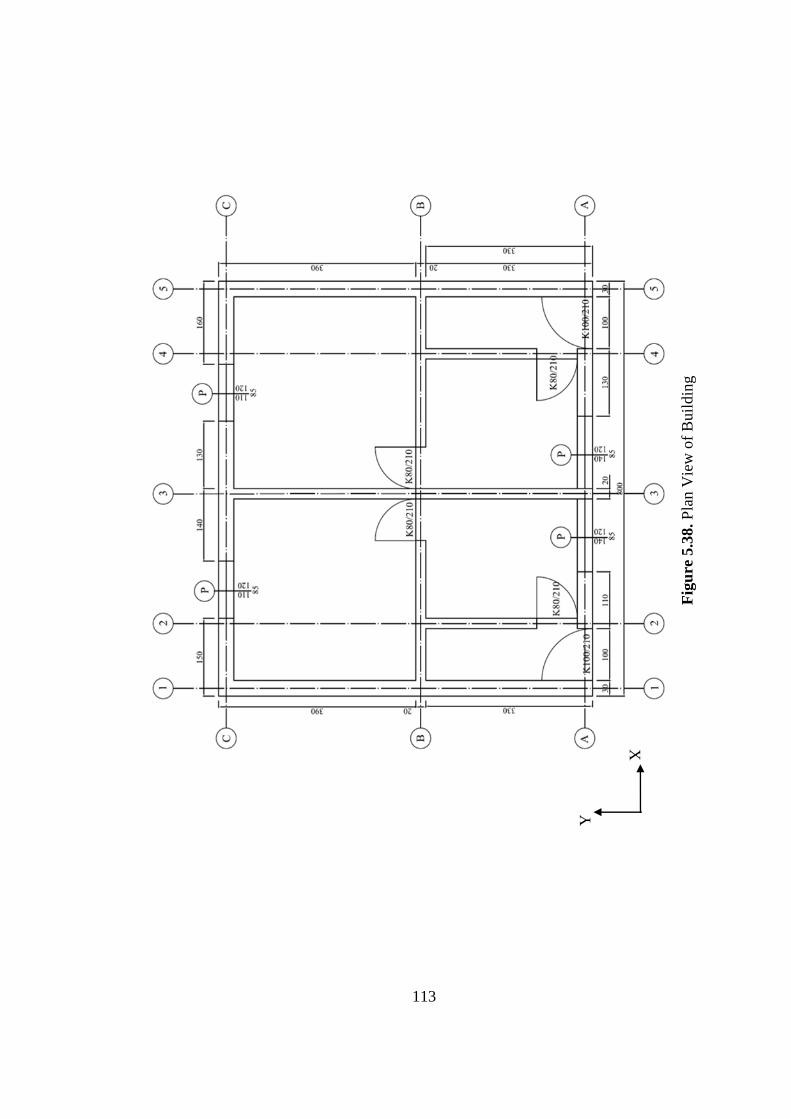
113
Figure 5.38. Plan View of Building
Fig
ure
5.3
8. P
lan V
iew
of
Buil
din
g
Y
X
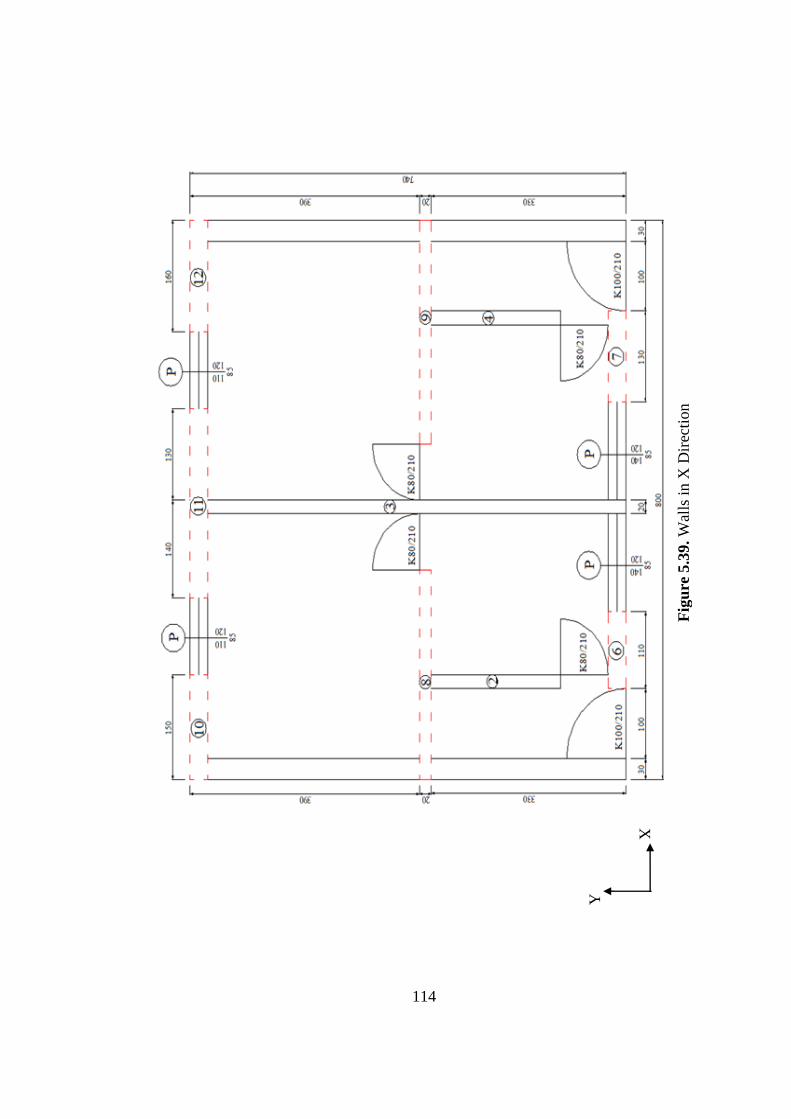
114
Figure 5.39. Walls in X Direction
Fig
ure
5.3
9. W
alls
in X
Dir
ecti
on
Y
X
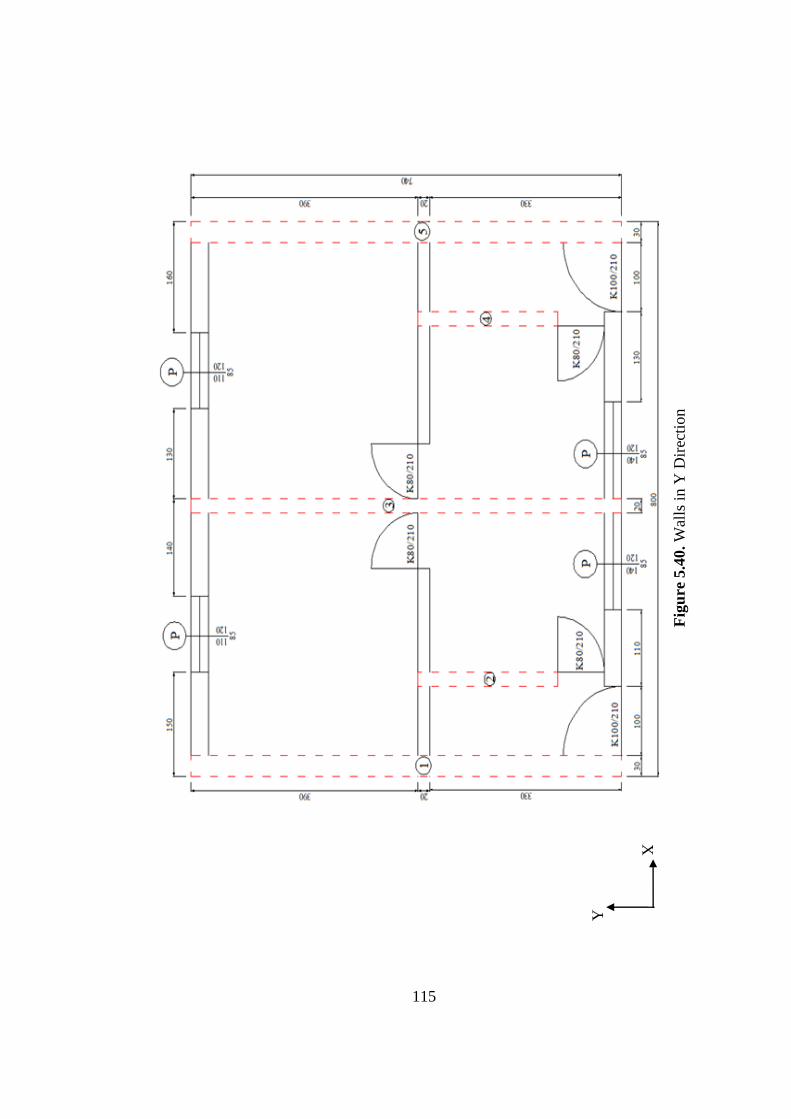
115
Figure 5.40. Walls in Y Direction
Fig
ure
5.4
0. W
alls
in Y
Dir
ecti
on
Y
X
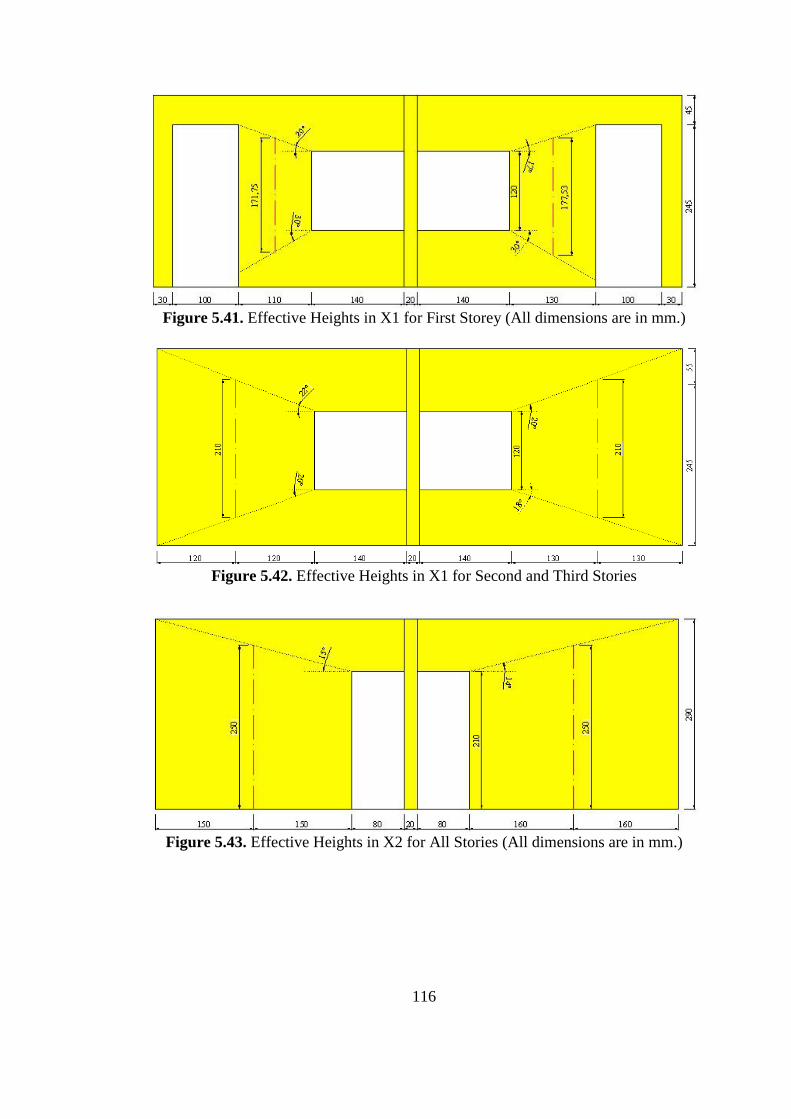
116
Figure 5.41. Effective Heights in X1 for First Storey (All dimensions are in mm.)
Figure 5.42. Effective Heights in X1 for Second and Third Stories
Figure 5.43. Effective Heights in X2 for All Stories (All dimensions are in mm.)

117
Figure 5.44. Effective Heights in X3 for All Stories (All dimensions are in mm.)
Figure 5.45. Effective Heights in Y1, Y3 and Y5 for All Stories
(All dimensions are in mm.)
Figure 5.46. Effective Heights in Y2 and Y4 for All Stories
(All dimensions are in mm.)
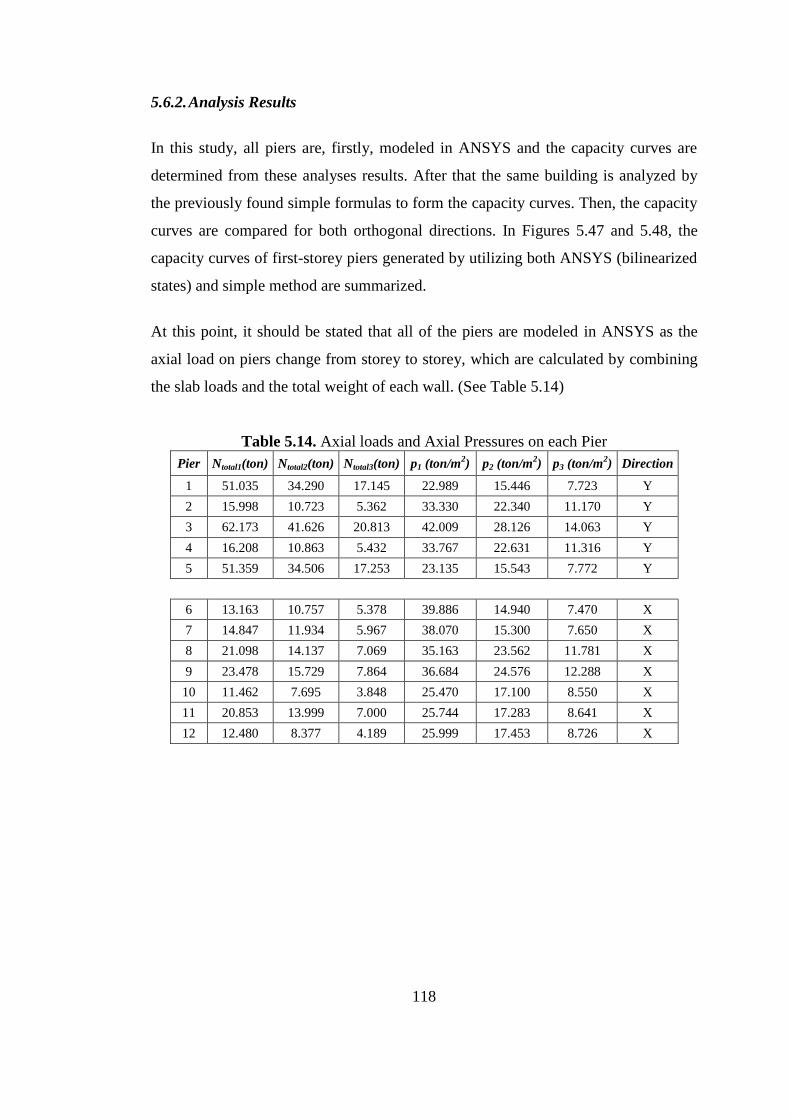
118
5.6.2. Analysis Results
In this study, all piers are, firstly, modeled in ANSYS and the capacity curves are
determined from these analyses results. After that the same building is analyzed by
the previously found simple formulas to form the capacity curves. Then, the capacity
curves are compared for both orthogonal directions. In Figures 5.47 and 5.48, the
capacity curves of first-storey piers generated by utilizing both ANSYS (bilinearized
states) and simple method are summarized.
At this point, it should be stated that all of the piers are modeled in ANSYS as the
axial load on piers change from storey to storey, which are calculated by combining
the slab loads and the total weight of each wall. (See Table 5.14)
Table 5.14. Axial loads and Axial Pressures on each Pier
Pier Ntotal1(ton) Ntotal2(ton) Ntotal3(ton) p1 (ton/m2) p2 (ton/m
2) p3 (ton/m
2) Direction
1 51.035 34.290 17.145 22.989 15.446 7.723 Y
2 15.998 10.723 5.362 33.330 22.340 11.170 Y
3 62.173 41.626 20.813 42.009 28.126 14.063 Y
4 16.208 10.863 5.432 33.767 22.631 11.316 Y
5 51.359 34.506 17.253 23.135 15.543 7.772 Y
6 13.163 10.757 5.378 39.886 14.940 7.470 X
7 14.847 11.934 5.967 38.070 15.300 7.650 X
8 21.098 14.137 7.069 35.163 23.562 11.781 X
9 23.478 15.729 7.864 36.684 24.576 12.288 X
10 11.462 7.695 3.848 25.470 17.100 8.550 X
11 20.853 13.999 7.000 25.744 17.283 8.641 X
12 12.480 8.377 4.189 25.999 17.453 8.726 X
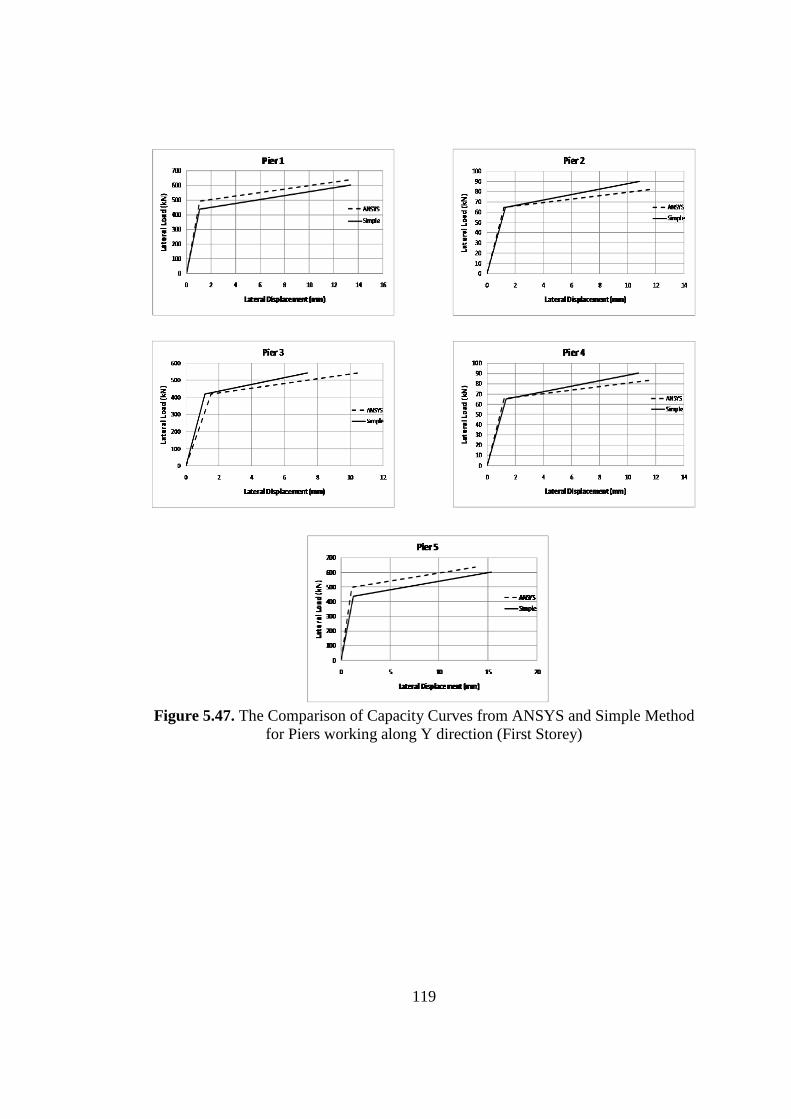
119
Figure 5.47. The Comparison of Capacity Curves from ANSYS and Simple Method
for Piers working along Y direction (First Storey)
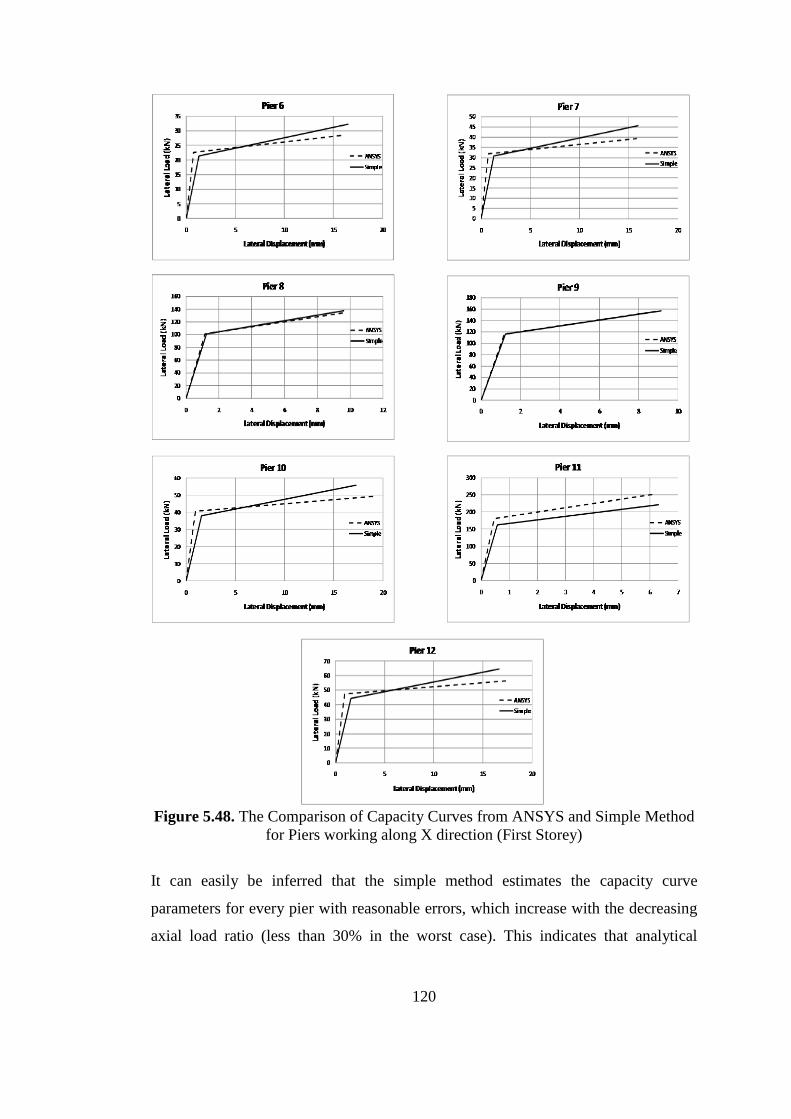
120
Figure 5.48. The Comparison of Capacity Curves from ANSYS and Simple Method
for Piers working along X direction (First Storey)
It can easily be inferred that the simple method estimates the capacity curve
parameters for every pier with reasonable errors, which increase with the decreasing
axial load ratio (less than 30% in the worst case). This indicates that analytical
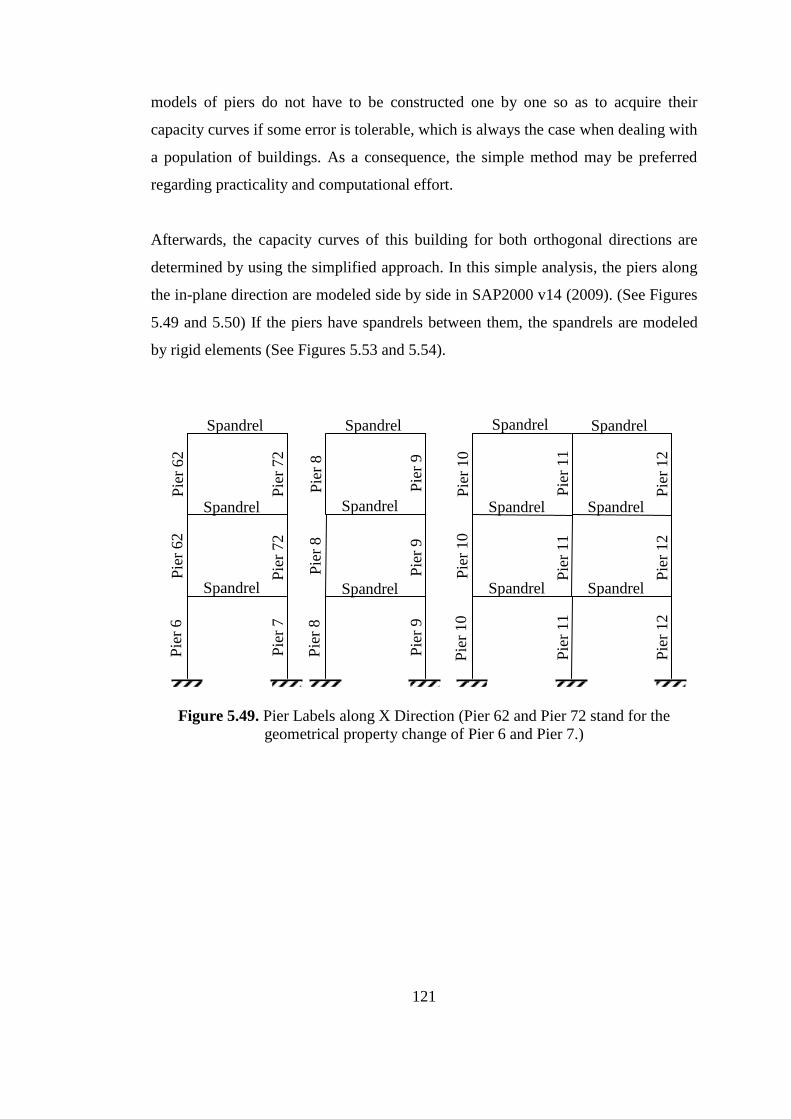
121
models of piers do not have to be constructed one by one so as to acquire their
capacity curves if some error is tolerable, which is always the case when dealing with
a population of buildings. As a consequence, the simple method may be preferred
regarding practicality and computational effort.
Afterwards, the capacity curves of this building for both orthogonal directions are
determined by using the simplified approach. In this simple analysis, the piers along
the in-plane direction are modeled side by side in SAP2000 v14 (2009). (See Figures
5.49 and 5.50) If the piers have spandrels between them, the spandrels are modeled
by rigid elements (See Figures 5.53 and 5.54).
Figure 5.49. Pier Labels along X Direction (Pier 62 and Pier 72 stand for the
geometrical property change of Pier 6 and Pier 7.)
Pie
r 7
P
ier
72
P
ier
72
Spandrel
Spandrel
Spandrel
Pie
r 6
2
Pie
r 6
2
Pie
r 6
Pie
r 9
P
ier
9
Pie
r 9
Spandrel
Spandrel
Spandrel
Pie
r 8
P
ier
8
Pie
r 8
Pie
r 11
P
ier
11
P
ier
11
Spandrel
Spandrel
Spandrel
Pie
r 10
P
ier
10
P
ier
10
Pie
r 12
P
ier
12
P
ier
12
Spandrel
Spandrel
Spandrel

122
Figure 5.50. The Pier Labels along Y Direction
The lateral connection between different frames is satisfied by using diaphragm
constraint as the building has a reinforced concrete slab (See Figures 5.51 and 5.52).
Figure 5.51. Diaphragm Constraints in X Direction
First Storey Diaphragm Constraint Second Storey Diaphragm Constraint
Third Storey Diaphragm Constraint
Pie
r 2
P
ier
2
Pie
r 2
Pie
r 1
P
ier
1
Pie
r 1
Pie
r 4
P
ier
4
Pie
r 4
Pie
r 3
P
ier
3
Pie
r 3
Pie
r 5
P
ier
5
Pie
r 5
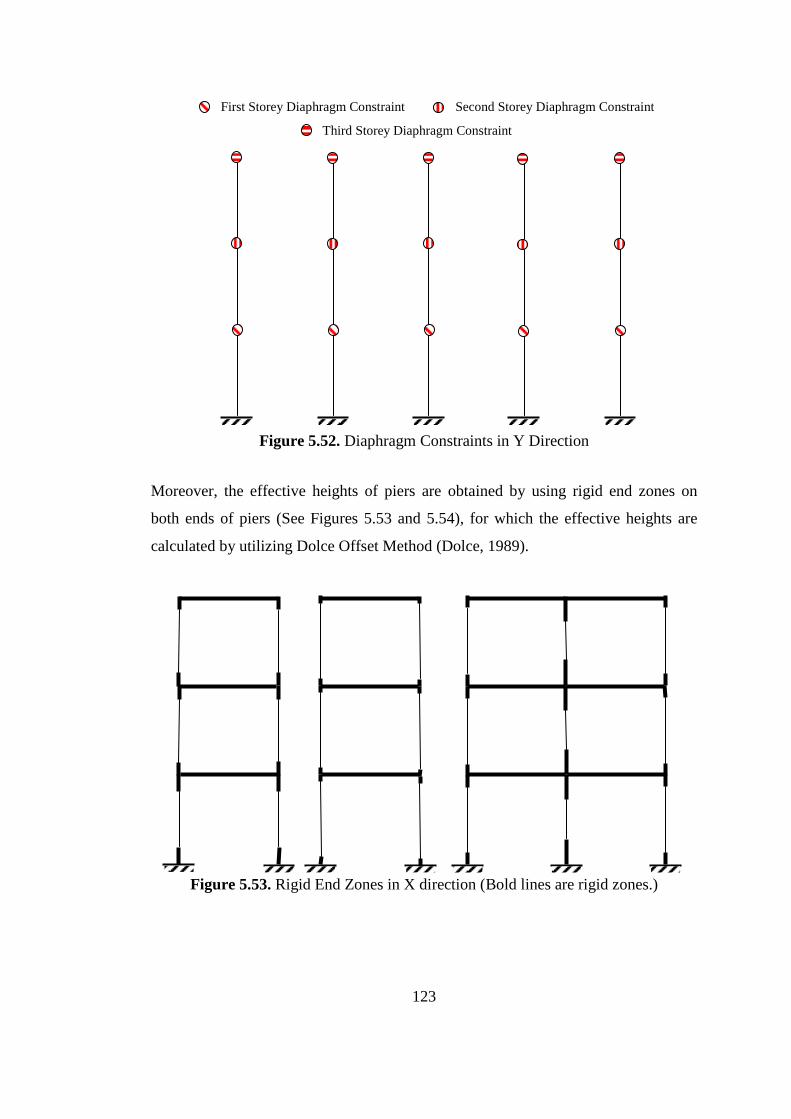
123
Figure 5.52. Diaphragm Constraints in Y Direction
Moreover, the effective heights of piers are obtained by using rigid end zones on
both ends of piers (See Figures 5.53 and 5.54), for which the effective heights are
calculated by utilizing Dolce Offset Method (Dolce, 1989).
Figure 5.53. Rigid End Zones in X direction (Bold lines are rigid zones.)
First Storey Diaphragm Constraint Second Storey Diaphragm Constraint
Third Storey Diaphragm Constraint
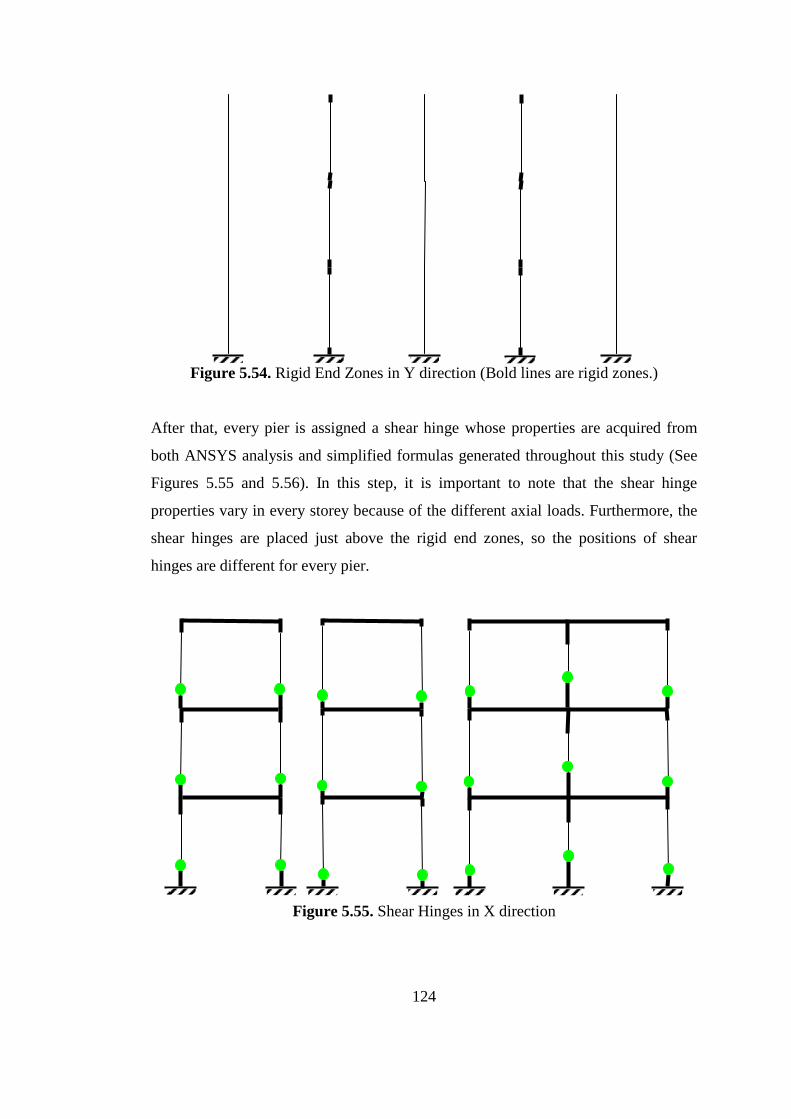
124
Figure 5.54. Rigid End Zones in Y direction (Bold lines are rigid zones.)
After that, every pier is assigned a shear hinge whose properties are acquired from
both ANSYS analysis and simplified formulas generated throughout this study (See
Figures 5.55 and 5.56). In this step, it is important to note that the shear hinge
properties vary in every storey because of the different axial loads. Furthermore, the
shear hinges are placed just above the rigid end zones, so the positions of shear
hinges are different for every pier.
Figure 5.55. Shear Hinges in X direction
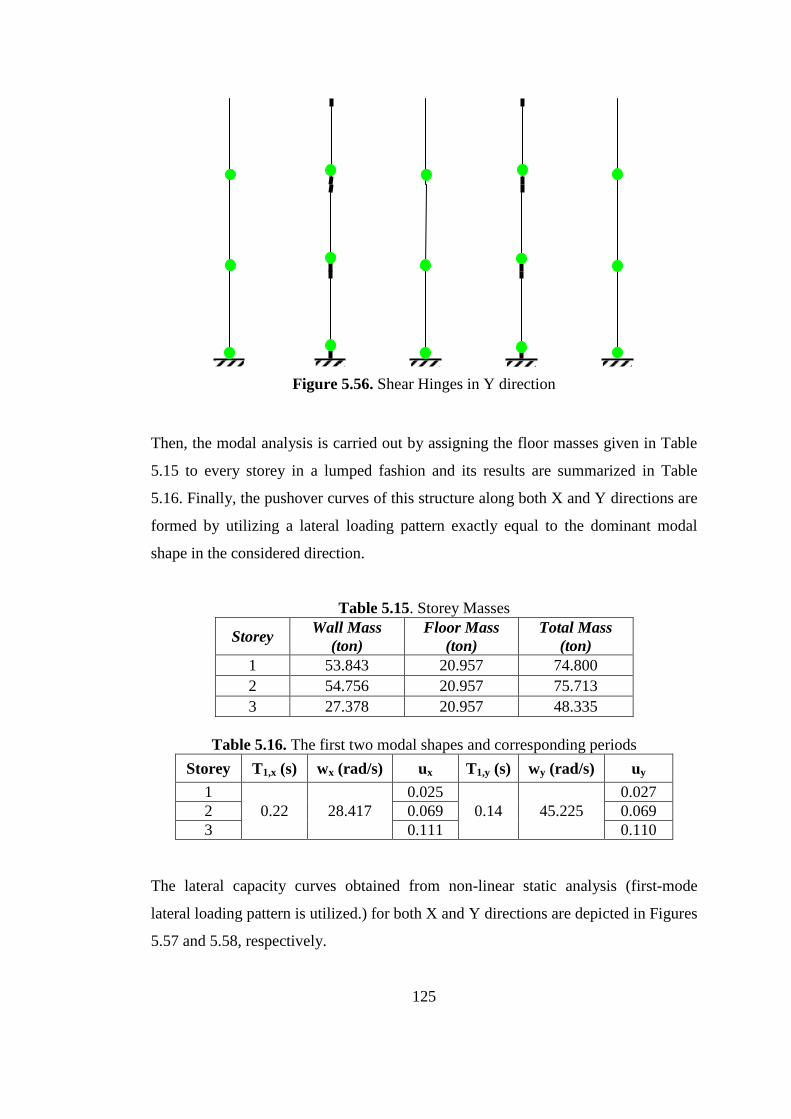
125
Figure 5.56. Shear Hinges in Y direction
Then, the modal analysis is carried out by assigning the floor masses given in Table
5.15 to every storey in a lumped fashion and its results are summarized in Table
5.16. Finally, the pushover curves of this structure along both X and Y directions are
formed by utilizing a lateral loading pattern exactly equal to the dominant modal
shape in the considered direction.
Table 5.15. Storey Masses
Storey Wall Mass
(ton)
Floor Mass
(ton)
Total Mass
(ton)
1 53.843 20.957 74.800
2 54.756 20.957 75.713
3 27.378 20.957 48.335
Table 5.16. The first two modal shapes and corresponding periods
Storey T1,x (s) wx (rad/s) ux T1,y (s) wy (rad/s) uy
1
0.22 28.417
0.025
0.14 45.225
0.027
2 0.069 0.069
3 0.111 0.110
The lateral capacity curves obtained from non-linear static analysis (first-mode
lateral loading pattern is utilized.) for both X and Y directions are depicted in Figures
5.57 and 5.58, respectively.
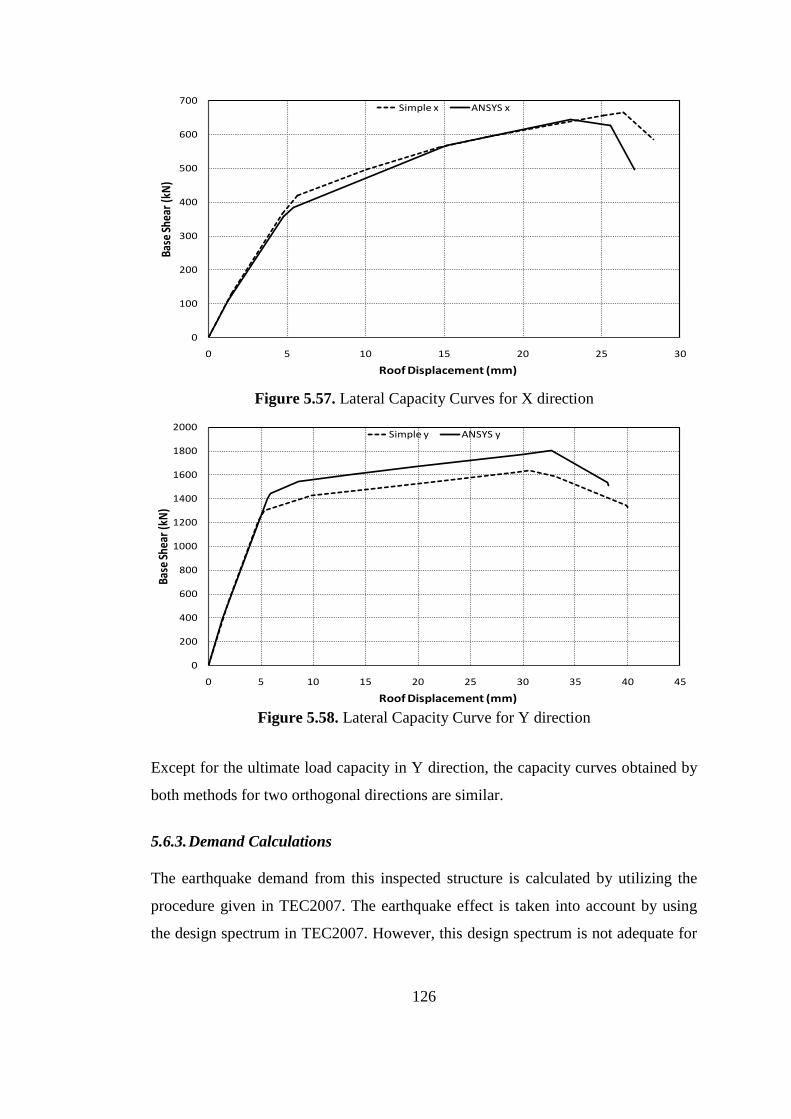
126
Figure 5.57. Lateral Capacity Curves for X direction
Figure 5.58. Lateral Capacity Curve for Y direction
Except for the ultimate load capacity in Y direction, the capacity curves obtained by
both methods for two orthogonal directions are similar.
5.6.3. Demand Calculations
The earthquake demand from this inspected structure is calculated by utilizing the
procedure given in TEC2007. The earthquake effect is taken into account by using
the design spectrum in TEC2007. However, this design spectrum is not adequate for
0
100
200
300
400
500
600
700
0 5 10 15 20 25 30
Base
She
ar (k
N)
Roof Displacement (mm)
Pushover Curve
Simple x ANSYS x
0
200
400
600
800
1000
1200
1400
1600
1800
2000
0 5 10 15 20 25 30 35 40 45
Base
She
ar (k
N)
Roof Displacement (mm)
Pushover Curve
Simple y ANSYS y
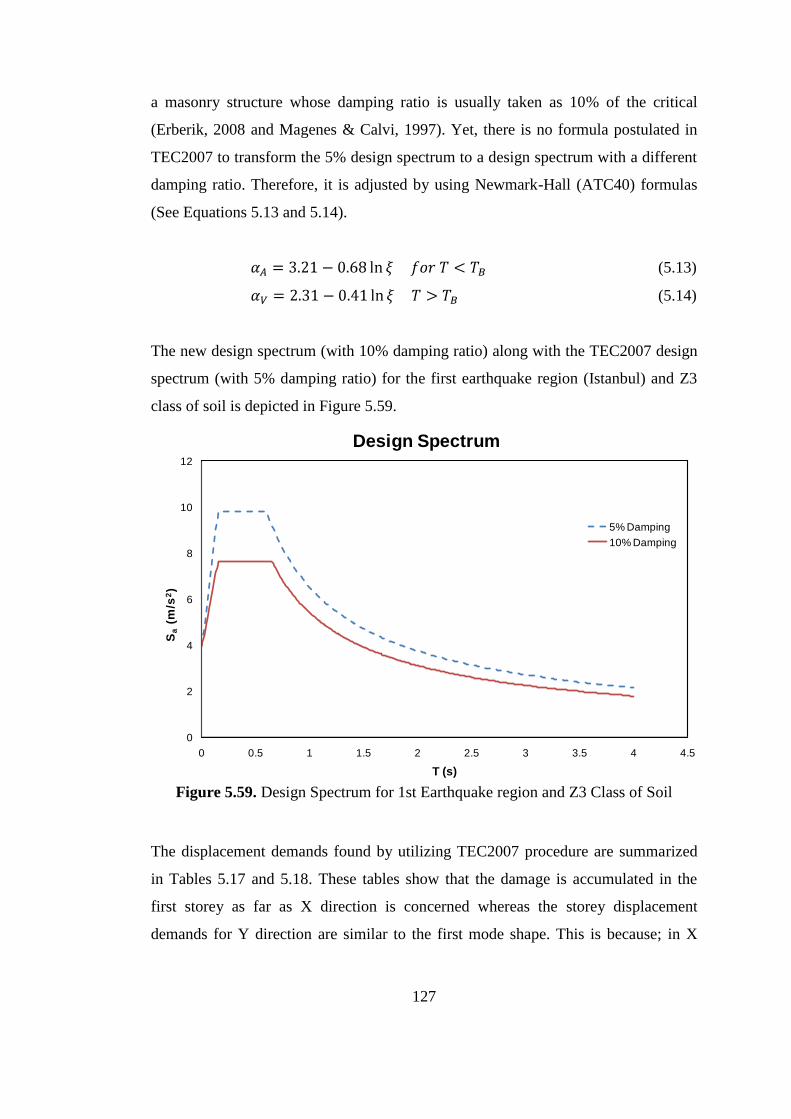
127
a masonry structure whose damping ratio is usually taken as 10% of the critical
(Erberik, 2008 and Magenes & Calvi, 1997). Yet, there is no formula postulated in
TEC2007 to transform the 5% design spectrum to a design spectrum with a different
damping ratio. Therefore, it is adjusted by using Newmark-Hall (ATC40) formulas
(See Equations 5.13 and 5.14).
(5.13)
(5.14)
The new design spectrum (with 10% damping ratio) along with the TEC2007 design
spectrum (with 5% damping ratio) for the first earthquake region (Istanbul) and Z3
class of soil is depicted in Figure 5.59.
Figure 5.59. Design Spectrum for 1st Earthquake region and Z3 Class of Soil
The displacement demands found by utilizing TEC2007 procedure are summarized
in Tables 5.17 and 5.18. These tables show that the damage is accumulated in the
first storey as far as X direction is concerned whereas the storey displacement
demands for Y direction are similar to the first mode shape. This is because; in X
0
2
4
6
8
10
12
0 0.5 1 1.5 2 2.5 3 3.5 4 4.5
Sa
(m/s
2)
T (s)
Design Spectrum
5% Damping
10% Damping

128
direction, the structure goes beyond its elastic limit, after which the modal analysis
loses its validity. However, it stays nearly elastic in Y direction (See Figure 5.60).
Table 5.17. Displacement Demands in X Direction
Displacement / Interstorey Drift Demands in X Direction
(ANSYS)
Displacement / Interstorey Drift Demands in X Direction
(Simple)
First Storey 9.95 mm / 0.343 % 10.13 mm / 0.349 %
Second Storey 18.07 mm / 0.271 % 19.2 mm / 0.302 %
Third Storey 27.548 mm / 0.316 % 28.355 mm / 0.305 %
Table 5.18. Displacement Demands in Y Direction
Displacement / Interstorey Drift Demands in Y Direction
(ANSYS)
Displacement / Interstorey Drift Demands in Y Direction
(Simple)
First Storey 1.38 mm / 0.048 % 1.36 mm / 0.047 %
Second Storey 3.58 mm / 0.073 % 3.85 mm / 0.083 %
Third Storey 5.876 mm / 0.077 % 6.36 mm / 0.084 %
In addition, the roof demands are also marked on the capacity curves (See Figure
5.60) in order to evaluate the performance of the structure.

129
Figure 5.60. Lateral Capacity Curve and Roof Displacement Demand:
(a) for X direction; (b) for Y direction
It is apparent from Figure 5.60 that the capacity curves from both ANSYS and
regression formulas are consistent with each other except the direction Y. This is
because; in that direction, the building depends on mainly three huge walls without
openings over a length of 7.4 m (See Figure 5.40). Therefore, the capacity curve is
underestimated because one of these walls' ultimate displacement is predicted less
than its ANSYS counterpart. However, this situation is not a common one as there
are, most of the time, window or door openings on all walls unlike this tested
structure. As a result, this simple method is still dependable as it predicts the X
direction very well, which has more realistic wall distribution (See Figure 5.39).
Besides, it can easily be inferred that the structure does not meet the earthquake
(a)
(b)

130
demand in the X direction whereas it has very little damage in the Y direction due to
its large piers along this direction (See Figure 5.60).
131
CHAPTER 6
SUMMARY AND CONCLUSIONS
6.1. Summary
In the first part of this study, recommendations about unreinforced masonry design
from different national and international codes or standards are investigated in detail.
For this purpose, three versions of Turkish Earthquake Code (TEC1975, TEC1998
and TEC2007), Masonry Standards Joint Committee 2005 (MSJC2005),
International Code Council 2006 (IBC2006) and European Committee for
Standardization 2003a (Eurocode 6) and 2003b (Eurocode 8) are utilized. Although
the design approaches from different standards show similarities, their
recommendations are dissimilar in various cases, i.e. they interchangeably prefer
suggesting more conservative designs for different situations. It should be stated that
since the section regarding the design of masonry buildings in Turkish Earthquake
Code is based on empirical rules (i.e. based on geometrical restrictions like
maximum height, length, thickness, slenderness ratio, layout of walls, etc.), it is
much more conservative when compared to other international codes under
consideration.
After the comparison of various code criteria about unreinforced masonry structures,
different design approaches namely force-based design and displacement-based
design for any structural types along with the several analysis techniques utilized in
these design techniques are mentioned.
Since this study is interested in the determination of seismic performance of
unreinforced masonry structures, a brief review of recently developed performance
state definitions advised by different researchers is introduced. Nearly all of these

132
researchers suggest using three performance states and determine the performance
state of any masonry structure in terms of the drift ratios in the critical storey.
In the last part of this study, it is intended to develop a simple method for
determining the performance of unreinforced brick masonry walls or piers in an
existing building. The method is more suitable for a population of buildings rather
than a single building. In the first phase, the load-deformation curves of masonry
walls are obtained. To achieve this; analytical models of masonry walls are created in
ANSYS 11.
The choice of ANSYS 11 is due to several reasons:
It has lots of different element types, some of which are capable of simulating
damage under specific types of loading.
Several material models can be combined in order to generate more enhanced
failure criteria.
It has improved numerical methods like line search and degree of freedom
predictor (DOF predictor) to accelerate the convergence, which is really a big
problem for, especially, nonlinear finite element solutions.
Unlike its counterparts, it has force and displacement controls at the solution
step, which makes more reliable results.
All of these models are generated by using 3D macro-modeling (Finite Element
Analysis). Therefore, a plasticity capable of simulating the real behavior of
unreinforced masonry walls is generated as there are no common fracture models for
masonry. This is accomplished by combining two well-known material models:
William-Warnke and Bilinear Plasticity. This new failure criteria is tested by
comparing the results obtained with the actual test results that were done in ETH
Zurich (Lourenco, 1996). The comparison reveals that lateral capacity curves are
close to each other with a good match. Although the crack patterns have not been
estimated with the same accuracy, they are sufficiently good to be used.
133
After that, this analytical model is utilized to form the lateral capacity curves of
masonry piers and to identify the effect of some geometrical and mechanical
properties, like the compressive strength of masonry, applied vertical load and the
aspect ratio, on the lateral load and displacement capacities. At this step, three
categories for compressive strength of masonry, six categories for level of axial load
and eight categories for aspect ratio are developed. 252 analytical models are formed
from the combinations of the above categories and their lateral load capacity curves
are obtained from the previously defined finite element models. These curves are,
then, simplified to generate a database by finding their bilinear counterparts. This
bilinearization procedure is done by using equal energy principle given in
FEMA356.
Then, the database of the bilinearized force-deformation relationships of previously
developed analytical models are utilized to obtain simple formulas for yield
displacement, yield lateral load, ultimate lateral load and ultimate displacement
capacities from nonlinear regression analyses. A single formula is recommended for
each of these parameters after trying numerous regression models.
In the final stage, the proposed procedure is employed to an existing unreinforced
masonry building in Istanbul. The results obtained by using detailed Finite Element
Modeling are compared with the results obtained from simplified method. Seismic
capacity and demand of the building is obtained and the seismic performance of the
building is assessed.
6.2. Conclusions
This study is based on the simplified assessment of the seismic performance of
unreinforced masonry buildings in Turkey. There exist many assumptions and
simplifications in different stages of this study. Considering this fact, the following
conclusions are drawn:
134
Comparison of code based rules regarding unreinforced masonry design in Turkey
and other earthquake-prone countries reveal that the Turkish code is too simple and
empirical. This means that it is based on many simplifications and assumptions;
therefore, it is more conservative than the other codes. On the other hand, it is not
flexible since it enforces some geometrical and architectural restrictions. Perhaps, the
most important drawback of the masonry section of the Turkish Earthquake Code is
that it does not encourage enhanced types of masonry construction, like reinforced
masonry.
It is possible to model lateral capacity curves of masonry components by using finite
element approach in ANSYS. However, the current database of ANSYS does not
contain suitable analytical tools to model brick masonry walls. Therefore, different
failure criteria were used together for a better simulation of the actual behavior. This
was achieved to a certain extent in terms of force and displacement capacities, crack
patterns and failure modes. But still, it was not possible to obtain the descending
portion of the lateral capacity curves due to limitations of the program.
The novel contribution of this study is that it proposes an approach that enables quick
and simple estimation of lateral capacity curves of masonry components in terms of
basic structural parameters like compressive strength, axial load ratio and aspect
ratio. By using this simplified approach, the capacity curves of masonry buildings
can be constructed in a short period of time without the need to perform finite
element analysis. The method has proven to be satisfactory after comparisons with
actual finite element analysis of masonry components. However, it is best to use this
approach to assess the seismic performance of a population of buildings rather than a
single building since it involves some simplifications and approximations.
The simplified approach has been tested on an existing building in Istanbul and it has
proven to be satisfactory for use in the case of a population of buildings which has to
be assessed in a short period of time.
135
REFERENCES
1 Abrams, D.P. (2001), "Performance-based engineering concepts for
unreinforced masonry building structures", Structural Engineering and
Materials; 3: 48-56.
2 Alcocer, S.M., J.C. Arias and L.E. Flores (2004), "Some developments in
performance-based design of confined masonry structures", Report PEER
2004/05, Pacific Earthquake Engineering Research Center
3 ANSYS Inc. (2007), “Basic Analysis Guide for ANSYS 11", SAS IP Inc.
4 ANSYS Inc. (2007), “Element Reference for ANSYS 11", SAS IP Inc.
5 ANSYS Inc. (2007), “Structural Analysis Guide for ANSYS 11", SAS IP Inc.
6 ANSYS Inc. (2007), “Theory Reference for ANSYS 11", SAS IP Inc.
7 Arya A.S., T. Boen, Y. Ishiyama, A.I. Martemianov, R. Meli, C. Scawthorn,
V.Julio and Y. Yaoxian (1986), “Guidelines for Earthquake Resistant Non-
Engineered Construction”, The International Association for Earthquake
Engineering, Tokyo, Japan.
8 Atımtay, E. (2001), "Betonarme Sistemlerin Tasarımı: Temel Kavramlar ve
Hesap Yöntemleri", 2nd Edition, Bizim Büro Basımevi, Ankara, Turkey (in
Turkish).
136
9 Bayülke, N. (1992), "Yığma Yapılar", 2nd Edition, Bayındırlık ve Ġskan
Bakanlığı, Afet Ġşleri Genel Müdürlüğü, Deprem Araştırma Dairesi, Ankara (in
Turkish).
10 Belmouden, Y. and P. Lestuzzi (2009), "An equivalent frame model for
seismic analysis of masonry and reinforced concrete buildings", Construction
and Building Materials; 23: 40–53.
11 Benedetti, D. and Tomazevic, M. (1984), “Sulla verifica sismica di costruzioni
in muratura”, Ingegneria Sismica; 1(0): 9-16 (in Italian).
12 Bertero, V.V. (1977), "Strength and Deformation Capacities of Buildings under
Extreme Environments", Structural Engineering and Structural Mechanics, K.
S. Pister, ed., Prentice Hall, Englewood Cliffs, NJ, 211–215.
13 Calvi, G.M. (1999), "A displacement-based approach for vulnerability
evaluation of classes of buildings", Journal of Earthquake Engineering, Vol. 3,
No. 3, 411-438.
14 Chen, W.F. (1982), "Plasticity in Reinforced Concrete", McGraw-Hill Inc.,
New York.
15 Chopra, A.K. (2001), "Dynamics of Structures: Theory and Applications to
Earthquake Engineering", 2nd Edition, Prentice Hall, New Jersey, USA.
16 Chopra, A.K. and R.K. Goel (2002), "A Modal Pushover Analysis Procedure
for Estimating Seismic Demands for Buildings", Earthquake Engineering and
Structural Dynamics, 31:561-582.
137
17 Cook R.D., D.S. Malkus, M.E. Plesha and R.J. Witt (2002), "Concepts and
Applications of Finite Element Analysis", 4th Edition, John Wiley and Sons
Inc., New Jersey, USA.
18 Costa, A. (2007), "Experimental testing of lateral capacity of masonry piers -
An application to seismic assessment of AAC masonry buildings", MS Thesis,
Rose School, Pavia, Italy.
19 Dolce, M. (1989), “Schematizzazione e modellazione per azioni nel piano delle
pareti (Models for in-plane loading of masonry walls)”, Corso sul
consolidamento degli edifice in muratura in zona sismica, Ordine delgi
Ingegneri, Potenza, Italy (in Italian).
20 Erbay, O. and D.P. Abrams (2001). “Seismic rehabilitation of unreinforced
masonry shear walls”, Proceedings, 9th Canadian Masonry Symposium,
University of New Brunswick, Canada.
21 Erberik, M.A. (2008). "Generation of Fragility Curves for Turkish Masonry
Buildings considering in-plane Failure Modes", Earthquake Engineering and
Structural Dynamics; 37: 387-405.
22 Erberik, M.A., A. Aldemir and B.O. Ay (2008). “A Critique on the Turkish
Earthquake Code Regulations Regarding Masonry Construction”, 8th
International Seminar on Structural Masonry, Istanbul, Turkey, paper 31.
23 European Committee for Standardization (CEN) 2003a, "Eurocode 6: Design
of Masonry Structures", prEN 1996-1, Brussels, Belgium.
138
24 European Committee for Standardization (CEN) 2003b, “Eurocode 8: Design
of structures for earthquake resistance”, Part 1, prEN 1998-1, Brussels,
Belgium.
25 FEMA273, "NEHRP Guidelines for the Seismic Rehabilitation of Buildings",
Washington,DC: Federal Emergency Management Agency. 1997.
26 FEMA356. "Prestandard and Commentary for the Seismic Rehabilitation of
Buildings", Washington, DC: Federal Emergency Management Agency. 2000.
27 Gilmore, A.T., Cuevas O.Z. and Garcia J.R. (2009), “Displacement-Based
Seismic Assessment of Low-Height Confined Masonry Buildings”, Earthquake
Spectra; 25: 439-464.
28 Grünthal, G. (1998). “European Macroseismic Scale 1998”, In Cahiers du
Centre Europeen de Geodynamique et de Seismologie Vol.15. European
Seismological Commission, Luxembourg, Brussels.
29 International Code Council (2006), "International Building Code (IBC)",
Whittier, California, USA.
30 Kaushik, H.B., D.C. Rai and S.K. Jain (2007), “Stress – strain chacracterisitcs
of Clay Brick Masonry under Uniaxial Compression”, Journal of Materials in
Civil Engineering, 9(728).
31 Lourenco, P.J.B.B. (1996), “Computational Strategies for Masonry Structures”,
Thesis Delft University of Technology.

139
32 Magenes, G. and G.M. Calvi (1992). "Cyclic behavior of brick masonry walls",
Proceedings, 10th European Conference on Earthquake Engineering, Madrid,
3517-3522.
33 Magenes, G. and G.M. Calvi (1997), "In-plane seismic response of brick
masonry walls", Earthquake Engineering and Structural Dynamics Volume 26,
1091-1112.
34 Masonry Standards Joint Committee (MSJC) (2005), "Building Code
Requirements for Masonry Structures and Specification for Masonry Structures
and Commentaries", American Concrete Institute, American Society of Civil
Engineers, The Masonry Society, Boulder, Colorado.
35 Penelis, Gr.G. (2006), “An efficient approach for pushover analysis of
unreinforced masonry structures”, Journal of Earthquake Engineering; Vol. 10
No: 3, 359-379.
36 Plowman, J.M. (1965), "The Modulus of Elasticity of Brickwork", Proceedings
of Brick Ceramic Society, 4: 37-44.
37 Postacıoğlu, B. (1962), “Memleketimizde imal edilen tuğlaların özellikleri”
Tuğla Kiremit Semineri 14-16 Haziran 1962, Ġmar ve Ġskan Bakanlığı
Yayınları No:5-20 (in Turkish).
38 Priestley, M.J.N., G.M. Calvi and M.J. Kowalsky (2007), "Displacement-
Based Seismic Design of Structures", IUSS Press, Pavia, Italy.
39 Sahlin, S. (1971), "Structural Masonry", Prentice Hall, Englewood Cliffs, New
Jersey, USA.
140
40 Salonikios T., C. Karakostas, V. Lekidis and A. Anthoine (2003),
“Comparative inelastic pushover analysis of masonry frames", Engineering
Structures; 25: 1515–1523.
41 SAP2000 Ver. 14, CSI Analysis Reference Manual, Computers and Structures
Inc., Berkeley, California, 2009.
42 Schubert, P. (1982), "Modulus of Elasticity of Masonry", Proceedings of the
Fifth International Brick Masonry Conference, Washington: 139-144.
43 Senthivel, R. and H.C. Uzoegbo (2004), "Failure Criterion of Unreinforced
Masonry under Biaxial Pseudo-Dynamic Loading", Journal of the South
African Institution of Civil Engineering, 46(4) 2004, Pages 20–24, Paper 578.
44 Sinha, B.P. and R. Pedreschi (1983), "Compressive Strength and Some Elastic
Properties of Brickwork", International Journal of Masonry Construction, 3(1).
45 SPSS Manual, SPSS Inc., SPSS Ver. 15.0, Chicago, IL, 2006.
46 Sucuoğlu, H. and M.A. Erberik (1997), "Performance Evaluation of a three-
storey unreinforced masonry building during the 1992 Erzincan Earthquake",
Earthquake Engineering and Structural Dynamics, Vol. 26, 319-336.
47 Taly, N. (2000), "Design of Reinforced Masonry Structures", McGraw Hill,
New York, USA.
48 Tolunay, H. (1966), "Investigations on the characteristics of brick masonry
walls", MS Thesis, METU, Ankara, Turkey.

141
49 Tomazevic, M. (1999), "Earthquake Resistant Design of Masonry Buildings",
Series on Innovations in Structures and Construction, Vol.1, Imperial College
Press, London, UK.
50 Tomazevic, M. (2007), "Damage as a measure for earthquake-resistant design
of masonry structures: Slovenian experience", Canadian Journal of Civil
Engineering; 34: 1403-1412.
51 Turkish Ministry of Public Works and Settlement (1975), "Specification for
Structures to be Built in Disaster Areas", TEC1975, Ankara, Turkey.
52 Turkish Ministry of Public Works and Settlement (1998), "Specification for
Structures to be Built in Disaster Areas", TEC1998, Ankara, Turkey.
53 Turkish Ministry of Public Works and Settlement (2007), "Specification for
Structures to be Built in Disaster Areas", TEC2007, Ankara, Turkey.
54 Turkish Standards Institution (1977), "Design and Construction methods for
Masonry ", TS2510, Ankara, Turkey.
55 Turkish Standards Institution (1985), "Solid Bricks and Vertically Perforated
Bricks ", TS705, Ankara, Turkey.
56 Turkish Standards Institution (2004), "Specification for masonry units-Part 1:
Clay masonry units", TS EN 771, Ankara, Turkey.
57 Turnsek, V. and F. Cacovic (1971). “Some experimental results on the strength
of brick masonry walls”, Proceedings, 2nd International Brick Masonry
Conference, Stoke-on-Trent, 149-156.
142
58 Vamvatsikos, D. (2002), "Seismic Performance, Capacity, and Reliability of
Structures as Seen Through Incremental Dynamic Analysis", Ph.D.
Dissertation, Department of Civil and Environmental Engineering Stanford
University.
59 Willam, K.J., and E.D. Warnke (1975), "Constitutive Model for the Triaxial
Behavior of Concrete", Proceedings, International Association for Bridge and
Structural Engineering, Vol. 19, ISMES, Bergamo, Italy, p. 174.
Internet Source
1 Pacific Earthquake Engineering Research Center, PEER NGA Database,
http://peer.berkeley.edu/nga, last visited on 15.01.2010.
Related Documents