A simple model to help understand water use at power plants Anna Delgado and Howard J. Herzog Working Paper Massachusetts Institute of Technology Energy Initiative 77 Massachusetts Avenue Cambridge, MA 02139

Welcome message from author
This document is posted to help you gain knowledge. Please leave a comment to let me know what you think about it! Share it to your friends and learn new things together.
Transcript

A simple model to help understand water use
at power plants
Anna Delgado and Howard J. Herzog
Working Paper
Massachusetts Institute of Technology
Energy Initiative
77 Massachusetts Avenue
Cambridge, MA 02139
Table of Contents
1. OVERVIEW ...................................................................................................................................................... 1
2. BACKGROUND................................................................................................................................................ 1
3. FORMULATION OF THE MODEL .............................................................................................................. 2 3.1 PARAMETER B: HEAT DISSIPATED THROUGH OTHER MECHANISMS THAN THE COOLING SYSTEM ........... 3 3.2 PARAMETER A: COOLING SYSTEM TYPE ............................................................................................................. 5 3.3 PARAMETER C: OTHER PROCESSES WATER NEEDS IN THE POWER PLANT ................................................... 7 3.4 TYPICAL MODEL PARAMETERS VALUES BY TECHNOLOGY ................................................................................. 8
4. VALIDATION OF THE MODEL ................................................................................................................... 9
5. RESULTS AND DISCUSSION .................................................................................................................... 12 5.1 WATER USE IN PC CCS PLANTS .......................................................................................................................... 12 5.2 STRATEGIES FOR REDUCING WATER USE IN THERMAL POWER PLANTS. ...................................................... 13
6. POLICY RELEVANCE AND CONCLUSIONS........................................................................................... 14
7. REFERENCES ............................................................................................................................................... 16
8. NOMENCLATURE AND ACRONYMS ...................................................................................................... 18 8.1 NOMENCLATURE ................................................................................................................................................... 18 8.2 ACRONYMS.............................................................................................................................................................. 19
page 1
1. Overview The interdependency between water and energy, sometimes called the water-energy nexus, is growing in
importance as demand for both water and energy increases. In the US, thermal power plants make up 70%
of the existing fleet [1]. These plants require large quantities of water, primarily for cooling [2] [3], and
account for 40% of the total fresh water withdrawals every year [4]. This has an impact both on the
aquatic organisms and on the water resources of the region where the power plant is located [5] [6]. A
report from the US Department of Energy [7] identified a total of 347 coal-fired power plants (from an
analysis set of 580 plants) as vulnerable to water demand and/or water supply concerns. Therefore, it is
important to understand the water footprint of the different electricity generation technologies.
Unfortunately, the primary source of data is from direct surveys of power plant operators, which are often
unreliable and incomplete [6] [8] [9]. In order to better understand the water footprint of thermal power
plants, this paper presents a simple, generic model to predict their water usage.
2. Background Thermal power plants convert heat into power in the form of electricity. The heat is generated from a
diverse range of sources, including coal, natural gas, uranium, solar energy, and geothermal energy. The
heat rate (HR, kJ/kWh) of a power plant is the amount of heat input required (kJ/h) to produce one unit of
electricity (kW) (see Equation 1).
(1)
The power plant’s net efficiency is simply the heat content of electricity (3600 kJ/kWh) divided by the
heat rate (kJ/kWh) (see Equation 2).
(2)
The power plant’s heat rate depends on the fuel type used and the specific power plant design. All the
heat put into the plant that is not converted into electricity has to be dissipated somehow to the
environment. The majority of this heat is rejected to the environment through cooling systems, which
usually use water as the heat transfer medium. Thus, the smaller the heat rate, the smaller the amount of
heat that needs to be rejected; and therefore, less cooling water is required per kWh produced.
Since between 85% and 95% of the total water needs in a thermal power plant are for cooling purposes
[10] [11] [3], we can get a good estimate of the total water needs just by knowing the heat rate and the
HR =Heat Input of FuelNet Power Output
Efficiency = 3,600HR

page 2
type of cooling system used. This correlation between water use and heat rate can be observed in Figure
1. As observed, in both graphs, the data fall along a straight line. The variability can be attributed to the
remaining 5% - 15% water used in other processes and to variations in the power plant heat balance,
which are discussed in the next section [12].
Figure 1. Water Withdrawn w/ Wet Cooling Towers. ESKOM Field Plant Data 2006-2011 on the left and data from simulations (Sources: DOE/NETL, EPRI, Ikeda) on the right
3. Formulation of the model Water use in a power plant can be complicated, with water being recycled throughout the plant.
However, to calculate total water withdrawal and consumption, it is not necessary to delve into these
details. All one needs to do is understand water and heat flows across the battery limits of the power
plant. By taking this approach, we can develop a simple, generic model to accurately predict water use.
The form of the model is given in Equation 3, where water use (I in L/kWh) is a function of the heat rate
(HR) and 3 parameters: A (L/kJ), B (kJ/kWh), and C (L/kWh).
I = A (HR – B) + C (3)
page 3
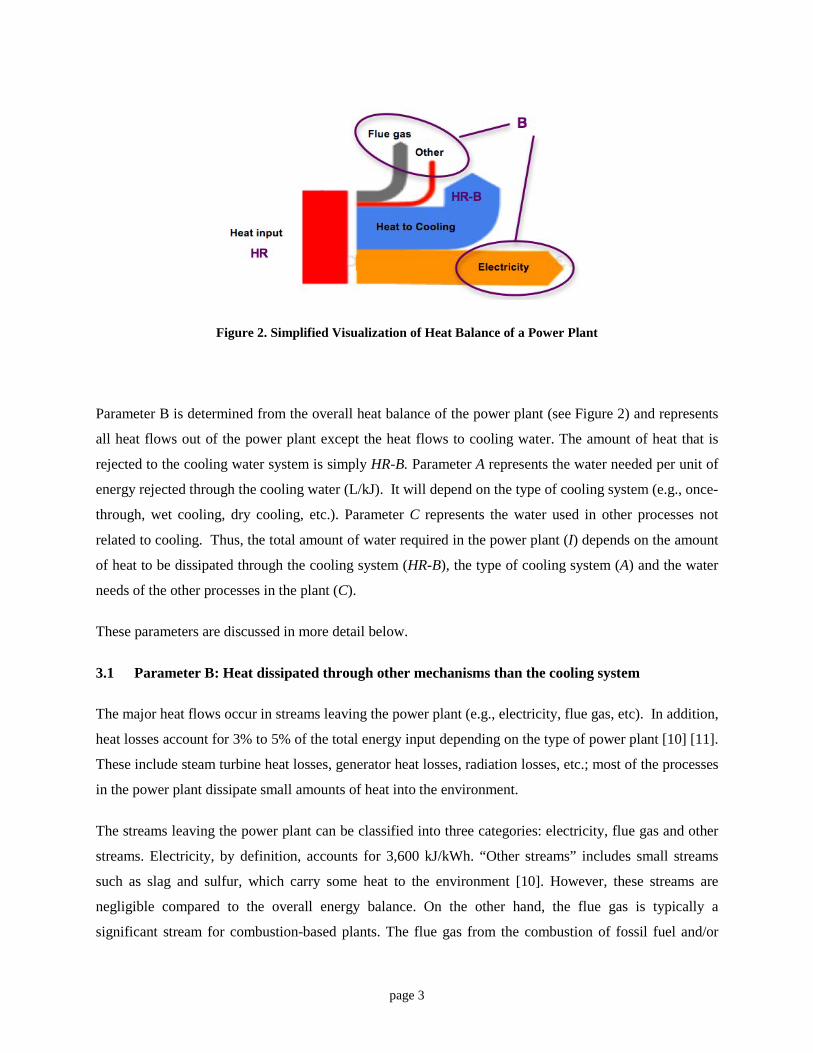
Figure 2. Simplified Visualization of Heat Balance of a Power Plant
Parameter B is determined from the overall heat balance of the power plant (see Figure 2) and represents
all heat flows out of the power plant except the heat flows to cooling water. The amount of heat that is
rejected to the cooling water system is simply HR-B. Parameter A represents the water needed per unit of
energy rejected through the cooling water (L/kJ). It will depend on the type of cooling system (e.g., once-
through, wet cooling, dry cooling, etc.). Parameter C represents the water used in other processes not
related to cooling. Thus, the total amount of water required in the power plant (I) depends on the amount
of heat to be dissipated through the cooling system (HR-B), the type of cooling system (A) and the water
needs of the other processes in the plant (C).
These parameters are discussed in more detail below.
3.1 Parameter B: Heat dissipated through other mechanisms than the cooling system
The major heat flows occur in streams leaving the power plant (e.g., electricity, flue gas, etc). In addition,
heat losses account for 3% to 5% of the total energy input depending on the type of power plant [10] [11].
These include steam turbine heat losses, generator heat losses, radiation losses, etc.; most of the processes
in the power plant dissipate small amounts of heat into the environment.
The streams leaving the power plant can be classified into three categories: electricity, flue gas and other
streams. Electricity, by definition, accounts for 3,600 kJ/kWh. “Other streams” includes small streams
such as slag and sulfur, which carry some heat to the environment [10]. However, these streams are
negligible compared to the overall energy balance. On the other hand, the flue gas is typically a
significant stream for combustion-based plants. The flue gas from the combustion of fossil fuel and/or
page 4
biomass in a power plant is ultimately released to the atmosphere, and therefore some energy is lost up
the stack. The energy content of the flue gas consists of both sensible heat (associated with the
temperature of the flue gas) and latent heat (associated with the water vapor content of the flue gas).
The sensible heat (Qsens) in kJ/kWh is a function of the flue gas mass flow rate (mFG) in kg/kWh, flue gas
temperature (T) in K, and specific heat capacity of the flue gas (CFG)) in kJ/kgK:
(4)
Thus, the higher the mass flow rate and the higher the temperature of the flue gas, the higher the heat lost
up the stack. For example, the flue gas mass flow is higher in NGCC and IGCC power plants than in
pulverized coal power plants [10] [13] [14]. Therefore, more heat is released to the environment through
the stack and less heat load is sent to the cooling system, which means that less cooling water is needed.
The latent heat is a function of the water content of the flue gas. This water comes either from the fuel as
a product of combustion or from other processes such as flue gas desulfurization (FGD), which adds
water to the flue gas [15]. Using the higher heating value (HHV) of the fuel to account for the thermal
input (this assumes water formed in combustion is in liquid state), the latent heat can be calculated as
follows:
(5)
Where mwater (kg/kWh) is the flue gas water content (mass flow rate) and hfg is the latent heat of
vaporization of water (2,300 kJ/kg). Thus, the higher the water content in the flue gas (mwater ), the higher
the heat loss.
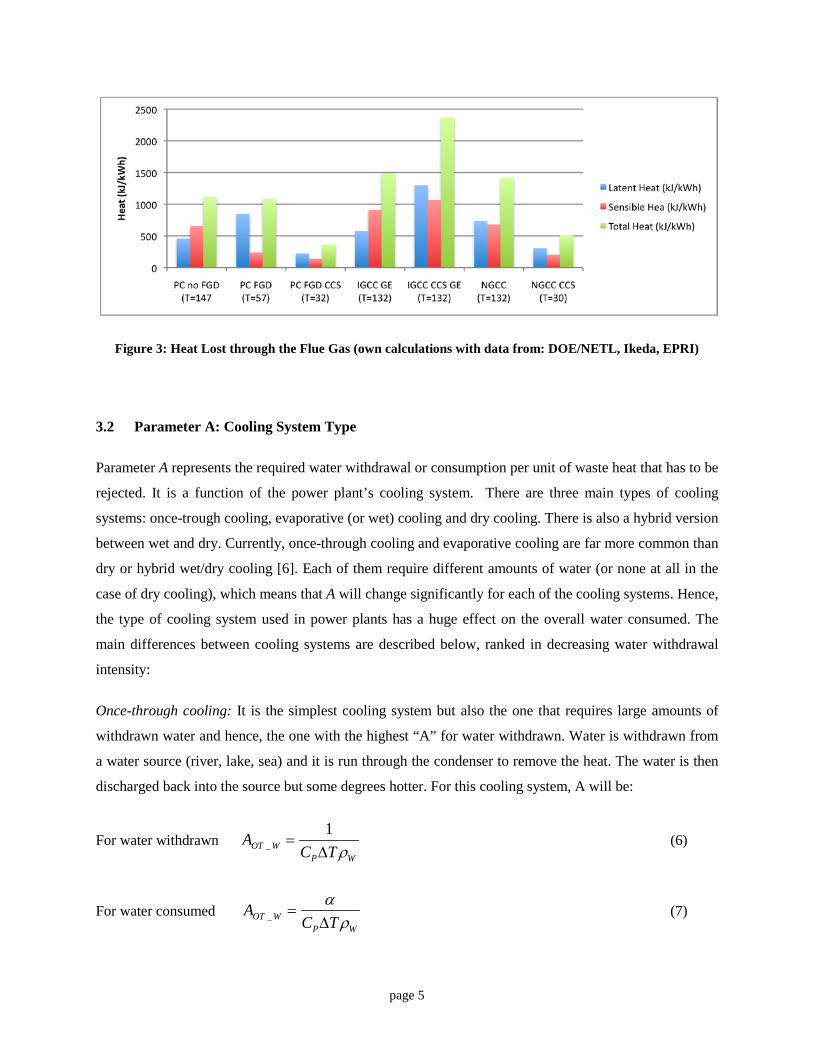
In summary, the three parameters that will define the heat losses through the flue gas are: total flow rate,
exit temperature and water content of the flue gas. These three parameters will vary depending on the
power plant type and fuel, whether the plant has an FGD system to control sulfur emissions or not,
whether it has carbon capture system or not, etc. These variations can be seen in Figure 3, which show
typical values for several types of fossil fuel-fired power plants.
Qsens = mGFGCFG∆T
Qlatent = mwaterhfg
page 5
Figure 3: Heat Lost through the Flue Gas (own calculations with data from: DOE/NETL, Ikeda, EPRI)
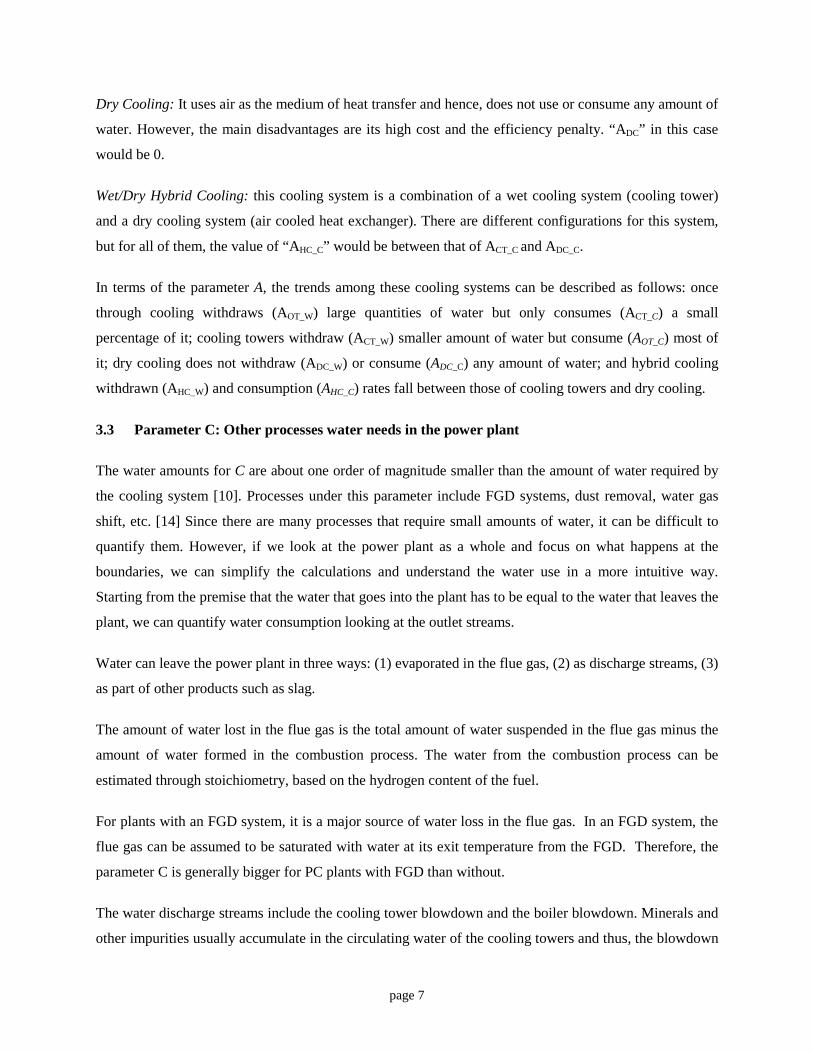
3.2 Parameter A: Cooling System Type
Parameter A represents the required water withdrawal or consumption per unit of waste heat that has to be
rejected. It is a function of the power plant’s cooling system. There are three main types of cooling
systems: once-trough cooling, evaporative (or wet) cooling and dry cooling. There is also a hybrid version
between wet and dry. Currently, once-through cooling and evaporative cooling are far more common than
dry or hybrid wet/dry cooling [6]. Each of them require different amounts of water (or none at all in the
case of dry cooling), which means that A will change significantly for each of the cooling systems. Hence,
the type of cooling system used in power plants has a huge effect on the overall water consumed. The
main differences between cooling systems are described below, ranked in decreasing water withdrawal
intensity:
Once-through cooling: It is the simplest cooling system but also the one that requires large amounts of
withdrawn water and hence, the one with the highest “A” for water withdrawn. Water is withdrawn from
a water source (river, lake, sea) and it is run through the condenser to remove the heat. The water is then
discharged back into the source but some degrees hotter. For this cooling system, A will be:
For water withdrawn (6)
For water consumed (7)
AOT _ W =1
CP∆TρW
AOT _ W =α
CP∆TρW

page 6
Where Cp is the specific heat capacity of water (cp = 4.184 [kJ/(kg*K)]), ΔT is the temperature increase of
the water (which usually by law is around 10 K)1 and ρW is the density of water (which is 1 kg/l).
Only a small part of the cooling water evaporates (i.e. is consumed) once it is returned to the source due
to the temperature increase of the water, which is captured by the coefficient α . Hence, AOT_C is much
smaller than AOT_W. α indicates the percentage of the water that is evaporated and its value is around 1%
[16]. However, it depends on ambient conditions such as the temperature of the watershed and the wind
speed [17].
Evaporative cooling: This is a closed-loop system, in which the cooling water is sent from the condenser
to the cooling tower, where the heat of the water transfers to the ambient air primarily by evaporation.
The resulting lower temperature cooling water is returned to the condenser, and the amount of water that
evaporates in the cooling tower is replenished. The total evaporated water (i.e. consumed) depends on the
design of the cooling tower and on the temperature and humidity of the incoming air. “A” will be:
For water withdrawn (8)
For water consumed (9)
Where ksens is the fraction of heat load rejected through sensible heat transfer and it depends on the design
of the cooling tower and on the temperature and humidity of the incoming air, ncc is the number cycles of
concentration (it determines the amount of water that is purged as blowdown) , ρw is the density of water
(kg/l) and hfg is the latent heat of water (2,454 kJ/kg at 20ºC) [18]. The main difference between water
withdrawn and water consumed is the parameter kbd , which is the fraction of blowdown discharged to the
watershed. However, for cooling towers, the main consumption mechanism is evaporation; hence, the
amount of water withdrawn can be every similar to the amount of water consumed in this type of cooling
system2.
1 EPA does not set a maximum AT, however, most of the states only allow a 20ºF increase. See here an example of Massachusetts: www.mass.gov/dep/water/resources/72wqa07i.doc 2 More information on the modeling of water consumption and water withdrawn by cooling towers can be found in the MIT Thesis “Modeling Water Use and Thermoelectric Power Plants”. Michael Rutberg. Mechanical Engineering. 2012
ACT _ W =1− ksens( )ρwhfg
1+1
ncc −1
ACT _ C =1− ksens( )ρwhfg
1+1− kbd
ncc −1
page 7
Dry Cooling: It uses air as the medium of heat transfer and hence, does not use or consume any amount of
water. However, the main disadvantages are its high cost and the efficiency penalty. “ADC” in this case
would be 0.
Wet/Dry Hybrid Cooling: this cooling system is a combination of a wet cooling system (cooling tower)
and a dry cooling system (air cooled heat exchanger). There are different configurations for this system,
but for all of them, the value of “AHC_C” would be between that of ACT_C and ADC_C.
In terms of the parameter A, the trends among these cooling systems can be described as follows: once
through cooling withdraws (AOT_W) large quantities of water but only consumes (ACT_C) a small
percentage of it; cooling towers withdraw (ACT_W) smaller amount of water but consume (AOT_C) most of
it; dry cooling does not withdraw (ADC_W) or consume (ADC_C) any amount of water; and hybrid cooling
withdrawn (AHC_W) and consumption (AHC_C) rates fall between those of cooling towers and dry cooling.
3.3 Parameter C: Other processes water needs in the power plant
The water amounts for C are about one order of magnitude smaller than the amount of water required by
the cooling system [10]. Processes under this parameter include FGD systems, dust removal, water gas
shift, etc. [14] Since there are many processes that require small amounts of water, it can be difficult to
quantify them. However, if we look at the power plant as a whole and focus on what happens at the
boundaries, we can simplify the calculations and understand the water use in a more intuitive way.
Starting from the premise that the water that goes into the plant has to be equal to the water that leaves the
plant, we can quantify water consumption looking at the outlet streams.
Water can leave the power plant in three ways: (1) evaporated in the flue gas, (2) as discharge streams, (3)
as part of other products such as slag.
The amount of water lost in the flue gas is the total amount of water suspended in the flue gas minus the
amount of water formed in the combustion process. The water from the combustion process can be
estimated through stoichiometry, based on the hydrogen content of the fuel.
For plants with an FGD system, it is a major source of water loss in the flue gas. In an FGD system, the
flue gas can be assumed to be saturated with water at its exit temperature from the FGD. Therefore, the
parameter C is generally bigger for PC plants with FGD than without.
The water discharge streams include the cooling tower blowdown and the boiler blowdown. Minerals and
other impurities usually accumulate in the circulating water of the cooling towers and thus, the blowdown

page 8
is necessary to maintain the quality of the water and avoid corrosion. If the quality of the water source is
good, then less water blowdown is needed. In many cases, this water is recycled [11]. Otherwise, it is sent
to the wastewater treatment system and then returned to the water body.
Impurities also accumulate in the steam-cycle water (boiler water) and therefore, water is also blow down
and replaced with clean water [19]. However, the quantity of water necessary is orders of magnitude
smaller than the cooling water and is usually taken directly from the municipal water source instead of
from the natural water source. Thus, this stream is almost negligible in terms of water consumption
accounting for up to 1% of the total [3]. However, blowdown streams can be important at the plant level
in terms of cost due to the expensive water treatment systems needed to comply with strict discharge
regulations [20].
Water containing product streams can vary depending on the power plant type and includes streams such
as the gypsum from the FGD, slag, etc. However, these water amounts are typically small and most of the
times the water gets recycled internally [10] [14].
For some types of power plants we will have to quantify also water used in other process not related to the
steam cycle, such as the water used to clean the mirrors in solar thermal plants.
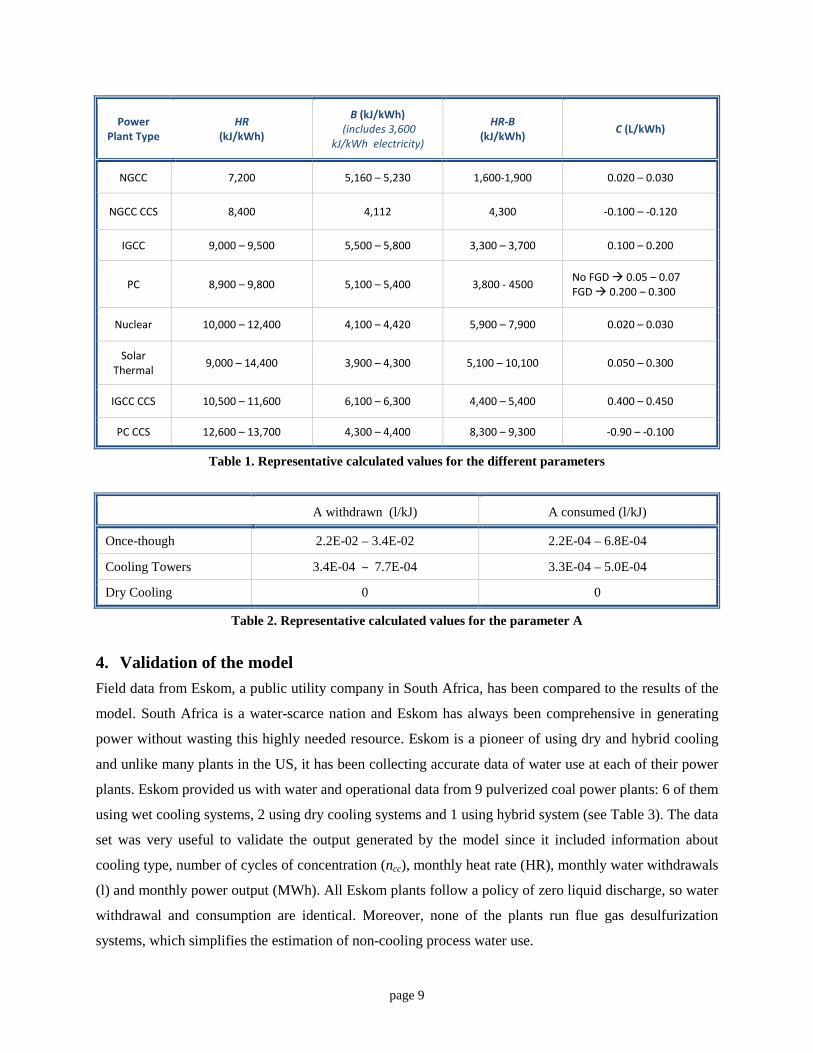
3.4 Typical model parameters values by technology
Typical values for the parameters A, B, C and HR for various types of thermal power plants are shown in
Tables 1 and 2. The values for parameters A, B and C are explained in more detail in Section 4 of the
thesis “Water Footprint of Electric Power Generation: Modeling its use and analyzing options for a water-
scarce future” [12]. The parameter HR (Heat Rate) shows typical ranges for the different technologies.
page 9
Power Plant Type
HR (kJ/kWh)
B (kJ/kWh) (includes 3,600
kJ/kWh electricity)
HR-B (kJ/kWh) C (L/kWh)
NGCC 7,200 5,160 – 5,230 1,600-1,900 0.020 – 0.030
NGCC CCS 8,400 4,112 4,300 -0.100 – -0.120
IGCC 9,000 – 9,500 5,500 – 5,800 3,300 – 3,700 0.100 – 0.200
PC 8,900 – 9,800 5,100 – 5,400 3,800 - 4500 No FGD 0.05 – 0.07 FGD 0.200 – 0.300
Nuclear 10,000 – 12,400 4,100 – 4,420 5,900 – 7,900 0.020 – 0.030
Solar Thermal 9,000 – 14,400 3,900 – 4,300 5,100 – 10,100 0.050 – 0.300
IGCC CCS 10,500 – 11,600 6,100 – 6,300 4,400 – 5,400 0.400 – 0.450
PC CCS 12,600 – 13,700 4,300 – 4,400 8,300 – 9,300 -0.90 – -0.100
Table 1. Representative calculated values for the different parameters
A withdrawn (l/kJ) A consumed (l/kJ)
Once-though 2.2E-02 – 3.4E-02 2.2E-04 – 6.8E-04
Cooling Towers 3.4E-04 – 7.7E-04 3.3E-04 – 5.0E-04
Dry Cooling 0 0
Table 2. Representative calculated values for the parameter A
4. Validation of the model Field data from Eskom, a public utility company in South Africa, has been compared to the results of the
model. South Africa is a water-scarce nation and Eskom has always been comprehensive in generating
power without wasting this highly needed resource. Eskom is a pioneer of using dry and hybrid cooling
and unlike many plants in the US, it has been collecting accurate data of water use at each of their power
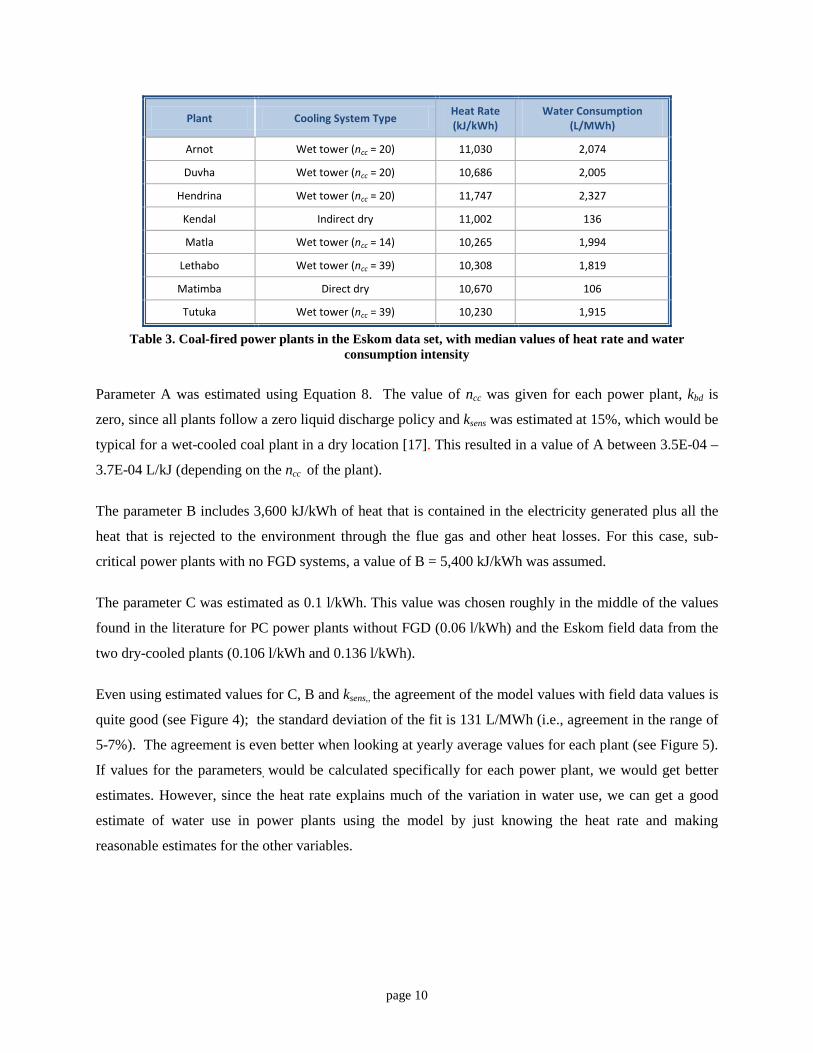
plants. Eskom provided us with water and operational data from 9 pulverized coal power plants: 6 of them
using wet cooling systems, 2 using dry cooling systems and 1 using hybrid system (see Table 3). The data
set was very useful to validate the output generated by the model since it included information about
cooling type, number of cycles of concentration (ncc), monthly heat rate (HR), monthly water withdrawals
(l) and monthly power output (MWh). All Eskom plants follow a policy of zero liquid discharge, so water
withdrawal and consumption are identical. Moreover, none of the plants run flue gas desulfurization
systems, which simplifies the estimation of non-cooling process water use.
page 10
Plant Cooling System Type Heat Rate (kJ/kWh)
Water Consumption (L/MWh)
Arnot Wet tower (ncc = 20) 11,030 2,074
Duvha Wet tower (ncc = 20) 10,686 2,005
Hendrina Wet tower (ncc = 20) 11,747 2,327
Kendal Indirect dry 11,002 136
Matla Wet tower (ncc = 14) 10,265 1,994
Lethabo Wet tower (ncc = 39) 10,308 1,819
Matimba Direct dry 10,670 106
Tutuka Wet tower (ncc = 39) 10,230 1,915
Table 3. Coal-fired power plants in the Eskom data set, with median values of heat rate and water consumption intensity
Parameter A was estimated using Equation 8. The value of ncc was given for each power plant, kbd is
zero, since all plants follow a zero liquid discharge policy and ksens was estimated at 15%, which would be
typical for a wet-cooled coal plant in a dry location [17]. This resulted in a value of A between 3.5E-04 –
3.7E-04 L/kJ (depending on the ncc of the plant).
The parameter B includes 3,600 kJ/kWh of heat that is contained in the electricity generated plus all the
heat that is rejected to the environment through the flue gas and other heat losses. For this case, sub-
critical power plants with no FGD systems, a value of B = 5,400 kJ/kWh was assumed.
The parameter C was estimated as 0.1 l/kWh. This value was chosen roughly in the middle of the values
found in the literature for PC power plants without FGD (0.06 l/kWh) and the Eskom field data from the
two dry-cooled plants (0.106 l/kWh and 0.136 l/kWh).
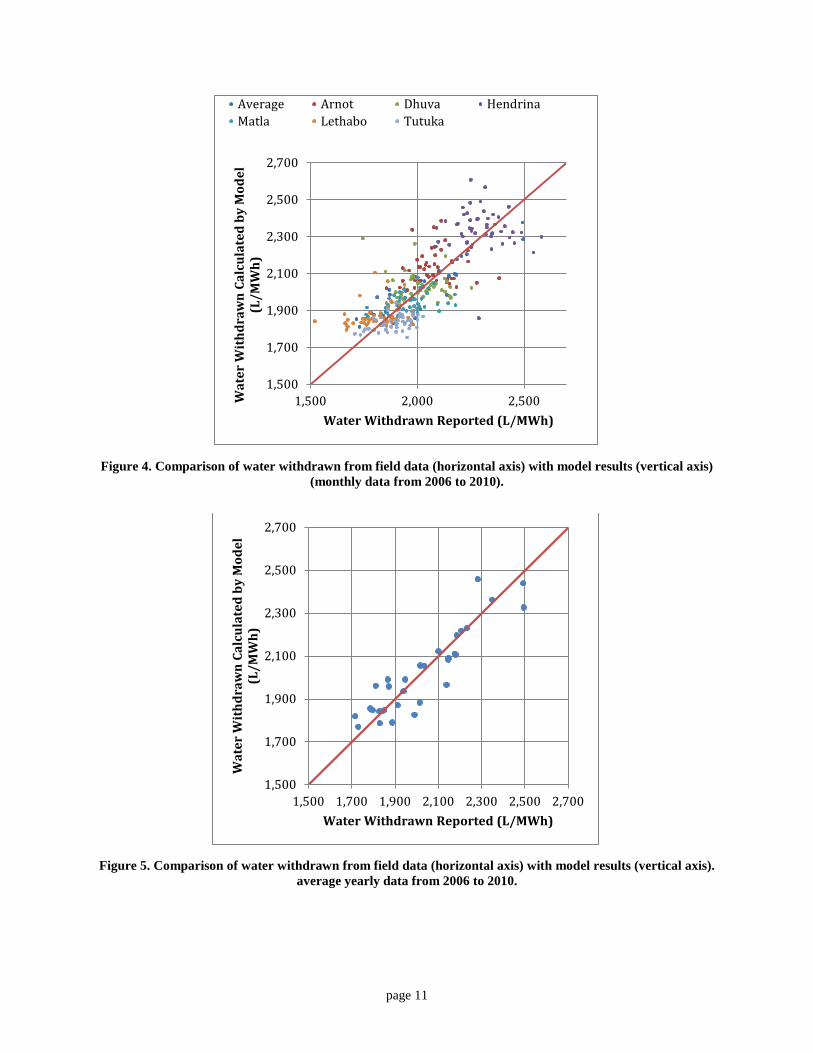
Even using estimated values for C, B and ksens,, the agreement of the model values with field data values is
quite good (see Figure 4); the standard deviation of the fit is 131 L/MWh (i.e., agreement in the range of
5-7%). The agreement is even better when looking at yearly average values for each plant (see Figure 5).
If values for the parameters, would be calculated specifically for each power plant, we would get better
estimates. However, since the heat rate explains much of the variation in water use, we can get a good
estimate of water use in power plants using the model by just knowing the heat rate and making
reasonable estimates for the other variables.
page 11
Figure 4. Comparison of water withdrawn from field data (horizontal axis) with model results (vertical axis)
(monthly data from 2006 to 2010).
Figure 5. Comparison of water withdrawn from field data (horizontal axis) with model results (vertical axis).
average yearly data from 2006 to 2010.
1,500
1,700
1,900
2,100
2,300
2,500
2,700
1,500 2,000 2,500Wat
er W
ithd
raw
n Ca
lcul
ated
by
Mod
el
(L/M
Wh)
Water Withdrawn Reported (L/MWh)
Average Arnot Dhuva HendrinaMatla Lethabo Tutuka
1,500
1,700
1,900
2,100
2,300
2,500
2,700
1,500 1,700 1,900 2,100 2,300 2,500 2,700
Wat
er W
ithd
raw
n Ca
lcul
ated
by
Mod
el
(L/M
Wh)
Water Withdrawn Reported (L/MWh)

page 12
5. Results and Discussion The simple model presented in this paper allows one to quickly estimate water use for the whole range of
thermal power plants, which is crucial due to the fact that most of the existing data on water use in power
plants is incomplete or unreliable. One of the advantages of the model is that it helps to easily identify and
understand what drives water use in a power plant (see section 5.1). The model is also very useful in
developing strategies to reduce water withdrawal and use (see section 5.2)
5.1 Water use in PC CCS plants
The model can help us understand why a pulverized coal-fired (PC) power plant with CO2 capture and
storage (CCS) uses about twice the amount of water per kWh than a PC power plant without CCS. We
will use the same type of cooling system, so there is no change in the parameter A. However, as seen in
Table 1, the quantity HR-B is about twice as large for a PC CCS plant compared to a standard PC plant.
This is the primary cause for the increases water use. This increase can be broken down into 3 categories:
• Approximately 70% can be attributed to the heat rate increase with the addition of CCS. This is
caused by the parasitic load imposed on the power plant by the CCS system.
• The change in the amount of heat exiting with the flue gas accounts for most of the rest of the
changes in heat balance. This is due to the lower temperature of the stack gas in a PC CCS plant,
reducing both the sensible and latent heat (see Figure 3). The stack gas in a PC CCS plant comes
from the top of the absorber, where it undergoes a water wash. Therefore, its temperature is
approximately the cooling water temperature.
• The PC CCS plant introduces a CO2 product stream. Since the stream is liquid, it has a “negative” heat value in the heat balance, which must be compensated by sending more heat to the cooling system. However, the magnitude of this stream on the heat balance is only a few percent.
Finally, there is a change in the parameter C, which is smaller for PC CCS than a PC with an FGD but no CCS. The flue gas enters the CCS system saturated from the FGD. However, it is cooled down and much of the water picked up in the FGD system is condensed. In some cases, C could even be negative (see Table 1).

page 13
5.2 Strategies for reducing water use in thermal power plants.
In most cases, water use in thermal power plants is dominated by cooling. As a result, for plants with
similar heat rates, the type of cooling system used in a generation plant has a greater effect on the water
consumption intensity than the type of fuel used. Ideally, the parameter A, which represents the water
needed per unit of energy rejected through the cooling system (L/kJ) should be zero or as close to zero as
possible. Thus, the use of alternative cooling systems (such as hybrid or dry cooling systems) that require
almost no water would reduce considerably water use in the power sector [21]. However, these
alternatives are more costly than the conventional counterpart [3].
Another way to minimize water use in power plants is reducing the amount of heat to be dissipated
through the cooling system (HR-B). This can be done either by 1) decreasing the heat rate (HR) i.e.
making the power plant more efficient, 2) increasing B or 3) both.
The heat rate varies depending on different characteristics of the plant such as age (usually, the older the
plant, the higher the heat rate), efficiency of the boiler, etc. and on the power plant type. Shifting from old
power plants to new and more efficient plants such as NGCC power plants would reduce water use in the
power sector. On the other hand, low-carbon thermal generation technologies such as carbon capture,
nuclear, solar thermal and geothermal plants, which are less thermally efficient than conventional fossil
plants, would require more water. Solar thermal and geothermal are at particular risk since these plants
are usually sited in arid areas. In the US, most of the solar thermal power plants have been forced to
implement dry cooling systems [22] [23], which do not require any water but have a negative effect on
efficiency and costs.
The parameter B represents all the other heat that is not rejected to the environment through the cooling
system (including the electricity stream, flue gas, process losses, etc). Thus, the bigger the B, the smaller
the waste heat that needs to be rejected through the cooling system; and therefore, less cooling water is
required per kWh produced. One way to increase B is taking some of the heat that is being dissipated
through the cooling system and re-using it. This can be achieved through combined heat and power
(CHP) plants [24] or with other plant combinations such as Combined Power and Desalination Plants [25]
[26] .
Finally, to reduce I (L/Mwh), we would also need to minimize the amount of water used in other
processes within the power plant (parameter C). For example, using dry FGD in pulverized coal power
plants [27] [28] or recovering the water evaporated in the flue gas would reduce C [29]. Usually the
parameter C is small compared to the overall water use in the power plant (approximately 10%).

page 14
However, in arid areas, where dry cooling might be implemented, the parameter C becomes the one that
drives water use; therefore, it is also important to take it into account.
Furthermore, water usage matters when the water that is being used by the power sector is freshwater,
competing with irrigation and municipal supply. Therefore, if power plants use alternative water sources
such as saline aquifers or waste water, the impact is somewhat mitigated. Government and the private
sector are already trying to identify those alternative water sources and their potential for the future [30]
[13].
6. Policy Relevance and Conclusions Water usage in power plants is and will be a critical issue for the power sector, especially in water-scarce
areas. However, despite the interdependence between water and energy, frameworks for energy policies
are often developed separated from those for water policies. There is a need to start thinking of those
sectors as two interconnected worlds, where policy decisions made in one sector can have a large impact
on the other. Energy policies focused to tackle the challenges of climate change will likely change the
existing fleet mix, which in turn could exacerbate the water energy nexus. Hence, when implementing
energy policies it is very important to also consider the impact that the policy might have on water
availability and what can be made to mitigate the problem. On the other hand, unlike the emission of
greenhouse gases, which is an intrinsically a global problem, the water energy nexus is a regional
problem. The regional variations in water resources, water demand, electricity demand, and energy mix
all combine to create ‘hot-spots’ where the water-energy nexus is more crucial than elsewhere. Therefore,
policies and regulations should also take this into account.
There are many alternatives available, but most times they are costly. Hence, regulations, not price
signals, are usually the drivers of water-related power plant decisions. In many states, water is not priced
and therefore, unless regulations force to do otherwise, it nearly always makes economic sense to use a
wet cooling tower, which results in increased electricity output compared to a dry or hybrid system.
However, US water regulations are becoming stricter, which will have an impact for the power sector.
New regulations require the power plant operator to invest in expensive alternative cooling systems,
extensive water treatment processes or other systems to be able to comply with the regulation. These
stringent regulations could potentially force an early retirement of various old power plants due to permit
denial or to compliance costs, which could have a significant impact in the power sector. R&D on
alternatives to reduce water use in power plants will be a crucial part of this puzzle.

page 15
Another aspect that has to be improved is the data collection on water use from government agencies.
Water withdrawal in the power sector accounts for around 40% of all the freshwater withdrawals, and still
the data collected is of very poor quality. This information is crucial for policy makers and regulators to
be able to make educated decisions. The EIA has already announced that they are taking steps to improve
the data collection process. Another option could be to combine EIA and EPA efforts, given that EPA
regulates water intakes and water discharges. On the other hand, existing and future air and water
pollution regulations will most likely put an extra burden for power plants operators in terms of water use.
Hence, new policies and regulations should minimize environmental impacts while also taking into
account all the possible implications for the power sector and for the American society as a whole (such
as early retirement of power plants which could lead to power shortages). The simple model developed in
this paper is very useful to obtain better water estimates and to understand what drives water
consumption, which should be useful in policy analysis and informing policy decisions.
page 16
7. References
[1] U.S. Department of Energy (DOE), "Electricity Reliability Impacts of a Mandatory Cooling Tower Rule for Existing Steam Generation Units.," 2008.
[2] U.S. Department of Energy, "Power Plant Water Usage and Loss Study," 2005. Revised May 2007.
[3] U.S. Department of Energy, "Water Requirements for Existing and Emerging Thermoelectric Plant Technologies," Pittsburgh, PA, 2009.
[4] USGS, "Estimated Use of Water in the United States in 2005," 2005.
[5] EPA, "Clean Water Act," 2004. [Online]. Available: http://water.epa.gov/lawsregs/lawsguidance/cwa/316b/basic.cfm.
[6] Union of Concerned Scienctists (UCS), "Freshwater use by U.S. power plants: Electricity’s thirst for a precious resource. A report of the Energy and Water in a Warming World initiative," Cambridge, MA, 2011.
[7] U.S. Department of Energy, "Water Vulnerabilities for Existing Coal-fired Power Plants," August 2010.
[8] A. Mittal and M. Gaffigan, "Energy-Water Nexus: Improvements to Federal Water Use Data Would Increase Understanding of Trends in Power Plant Water Use," U.S. Government Accountability Office (GAO), Washington, DC.
[9] X. Yang and B. Dziegielewski, "Water Use by Thermoelectric Power Plants in the United States," Water Resources Assoc., 2007.
[10] U.S. Department of Energy (DOE), "Cost and Performance Baseline for Fossil Energy Plants. Volume 1: Bituminous Coal and Natural Gas to Electricity," Pittsburgh, PA., 2010.
[11] EPRI, "Technical Report “Updated Cost and Performance Estimates for Fossil Fuel Power Plants with CO2 Removal".
[12] A. Delgado, "Water Footprint of Electric Power Generation: Modeling its use and analyzing options for a water-scarce future," Massachusetts Institute of Technology, 2012.
[13] EPRI, "Use of Degraded Water Sources as Cooling Water in Power Plants," 2003.
[14] IEAGHG, "Evaluation and Analysis of Water Usage of Power Plants with CO2 Capture," 2011.
[15] U.S. Department of Energy, "Electric Utility Engineer’s FGD Manual. Volume I- FGD Process Design. Final Report," 1996.
[16] EPRI, "Water & Sustainability (Volume 3): U.S. Water Consumption for Power Productio - The Next Half Century," 2002.
[17] M. Rutberg, " MIT Thesis “Modeling Water Use at Thermoelectric Power Plant”," 2012.
page 17
[18] M. Rutberg, A. Delgado, H. Herzog and A. Ghoniem, "A system-Level Generic Model of Water Use at Power Plants and its Application to Regional Water Use Estimation.," in ASME 2011 International Mechanical Engineering Congress & Exposition. November 11-17, 2011, Denver, Colorado, USA., 2011.
[19] M. El-Wakil, Power Plant Technology, Mc Graw Hill Book Company., 1984.
[20] EPA, "Steam Electric Power Generating. Point Source Category: Final Detailed Study Report," 2009.
[21] Maulbetsch, "Comparison of Alternate Cooling Technologies for U.S. Power Plants: Economic, Environmental, and Other Tradeoffs," EPRI, Palo Alto, CA., 2004.
[22] "U.S. Department of Interior. Bureau of Land Management Website," [Online]. Available: www.blm.gov.
[23] NY Times, "Alternative Energy Projects Stumble on a Need for Water," September 2009. [Online]. Available: http://www.nytimes.com/2009/09/30/business/energy-environment/30water.html?_r=2&pagewanted=2.
[24] IEA, "Combined Heat and Power. Evaluating the Benefits of Greater Global Investments," OECD/IEA, International Energy Agency (IEA), Paris, France, 2008.
[25] Kamal, I. Fluor Enterprises, Inc., "Integration of seawater desalination with power generation," Elsevier, Received 14 September 2004; accepted 4 February 2005.
[26] Peter Pechtl, Marco Dieleman, Martin Posch, Bijan Davari, Michael Erbes, Stefan Schneeberger. General Electric Energy Services, Optimization Software. PowerGen Middle East, "Integrated Thermal Power and Desalination Plant Optimization," October 2003.
[27] Sargent & Lundy, "Flue Gas Desulfurization Technology Evaluation. Dry Lime vs. Wet Limestone FGD," Chicago, 2007.
[28] Babcock & Wilcox Power Generation Group, Inc., "Spray Dry Flue Gas Desulfurization Systems," 2009. [Online]. Available: http://www.babcock.com/library/pdf/e1013178.pdf.
[29] U.S. Department of Energy, "National Energy Technology Laboratory’s Water-Energy Interface Research Program: December 2010 Update," 2010.
[30] U.S. Department of Energy, "Use of Non-Traditional Water for Power Plant Applications: An Overview of DOE/NETL R&D Efforts.," 2009.
page 18
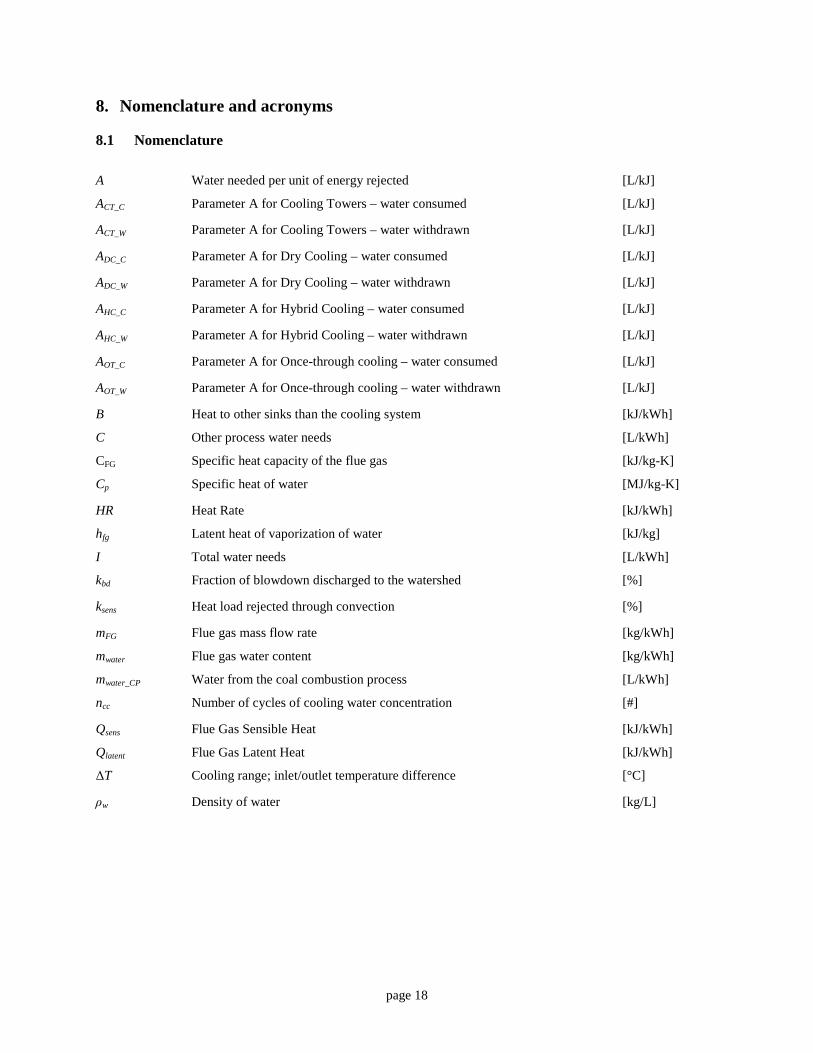
8. Nomenclature and acronyms
8.1 Nomenclature
A Water needed per unit of energy rejected [L/kJ]
ACT_C Parameter A for Cooling Towers – water consumed [L/kJ]
ACT_W Parameter A for Cooling Towers – water withdrawn [L/kJ]
ADC_C Parameter A for Dry Cooling – water consumed [L/kJ]
ADC_W Parameter A for Dry Cooling – water withdrawn [L/kJ]
AHC_C Parameter A for Hybrid Cooling – water consumed [L/kJ]
AHC_W Parameter A for Hybrid Cooling – water withdrawn [L/kJ]
AOT_C Parameter A for Once-through cooling – water consumed [L/kJ]
AOT_W Parameter A for Once-through cooling – water withdrawn [L/kJ]
B Heat to other sinks than the cooling system [kJ/kWh]
C Other process water needs [L/kWh]
CFG Specific heat capacity of the flue gas [kJ/kg-K]
Cp Specific heat of water [MJ/kg-K]
HR Heat Rate [kJ/kWh]
hfg Latent heat of vaporization of water [kJ/kg]
I Total water needs [L/kWh]
kbd Fraction of blowdown discharged to the watershed [%]
ksens Heat load rejected through convection [%]
mFG Flue gas mass flow rate [kg/kWh]
mwater Flue gas water content [kg/kWh]
mwater_CP Water from the coal combustion process [L/kWh]
ncc Number of cycles of cooling water concentration [#]
Qsens Flue Gas Sensible Heat [kJ/kWh]
Qlatent Flue Gas Latent Heat [kJ/kWh]
ΔT Cooling range; inlet/outlet temperature difference [°C]
ρw Density of water [kg/L]
page 19
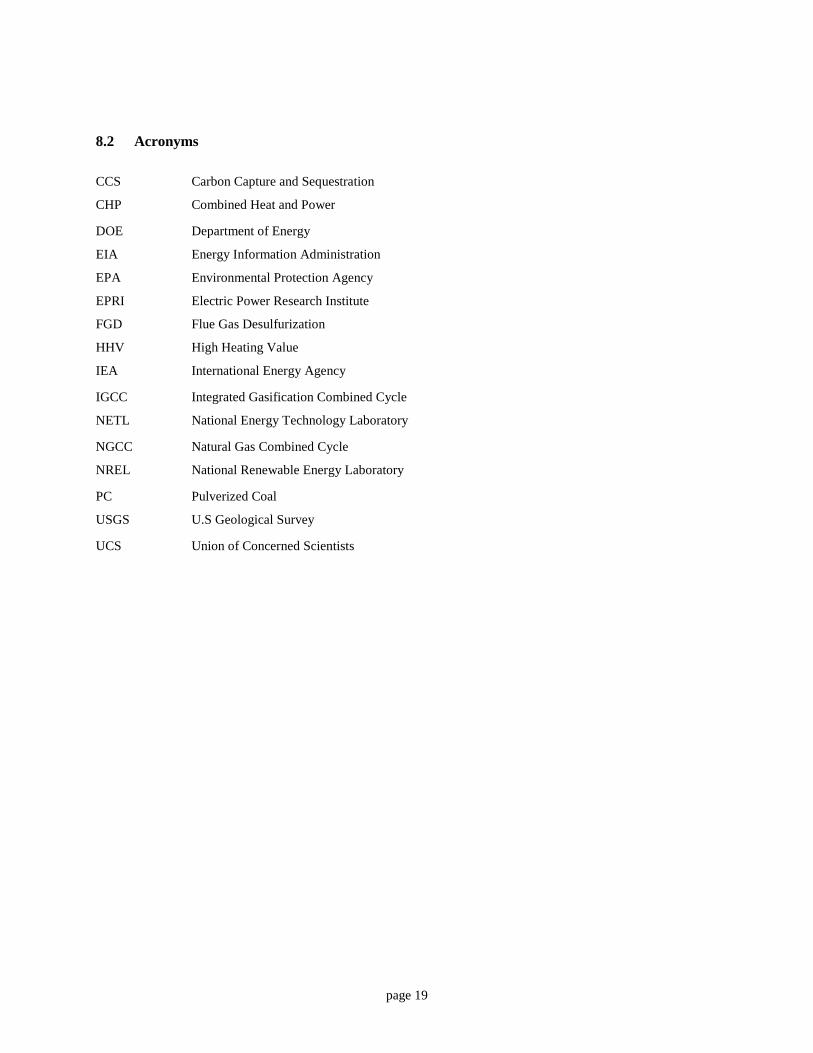
8.2 Acronyms
CCS Carbon Capture and Sequestration
CHP Combined Heat and Power
DOE Department of Energy
EIA Energy Information Administration
EPA Environmental Protection Agency
EPRI Electric Power Research Institute
FGD Flue Gas Desulfurization
HHV High Heating Value
IEA International Energy Agency
IGCC Integrated Gasification Combined Cycle
NETL National Energy Technology Laboratory
NGCC Natural Gas Combined Cycle
NREL National Renewable Energy Laboratory
PC Pulverized Coal
USGS U.S Geological Survey
UCS Union of Concerned Scientists
Related Documents