aperiodic 2018 Acta Cryst. (2019). A75, 281–296 https://doi.org/10.1107/S2053273318017114 281 A side-by-side comparison of the solidification dynamics of quasicrystalline and approximant phases in the Al–Co–Ni system Insung Han, a * Xianghui Xiao, b ‡ Haiping Sun c and Ashwin J. Shahani a * a Department of Materials Science and Engineering, University of Michigan, Ann Arbor, Michigan 48109, USA, b X-ray Science Division, Advanced Photon Source, Argonne National Laboratory, Lemont, Illinois 60439, USA, and c Michigan Center for Materials Characterization, University of Michigan, Ann Arbor, Michigan 48109, USA. *Correspondence e-mail: [email protected], [email protected] Quasicrystals and their approximants have triggered widespread interest due to the challenge of solving their complex crystal structures as well as their possibly exceptional properties. The structural motifs of approximants are similar to those of the corresponding quasicrystals, but to what extent are their crystallization pathways the same? Unfortunately, there have been very few in situ experimental investigations to answer this question. Here, by leveraging the high penetrating power of hard X-rays, synchrotron-based X-ray tomography was conducted in order to capture the nucleation and growth of a decagonal quasicrystal and its related approximant. The combination of data-driven computational analysis with new thermodynamic databases allowed the characterization, with high precision, of the constitutional and kinetic driving forces for crystallization. The experimental results prove that the growth of both crystals from a liquid is dominated by first-order kinetics. Nevertheless, and somewhat surprisingly, significant differences were observed in their rates of nucleation and growth. The reasons for such divergent behaviours are discussed in light of contemporary theories of intermetallic crystallization. 1. Introduction Soon after the discovery of icosahedral quasicrystals (Shechtman et al., 1984; Shechtman & Blech, 1985), it was discovered that quasiperiodicity is not limited to icosahedral phases. For instance, decagonal quasicrystals (d-QCs) possess quasiperiodic, 2D atomic layers that are stacked periodically in the perpendicular direction (Bendersky, 1985). At the mesoscale, d-QCs show a columnar prismatic morphology along the direction of periodic stacking (Stadnik, 2012). A consequence of this unique crystallographic anisotropy is strongly anisotropic transport properties, e.g. electrical resis- tivity and thermal stability (Shibuya et al., 1990; Edagawa et al., 1996; Stadnik, 2012). Among the discovered d-QCs, Al– Co–Ni d-QCs have been the most thoroughly investigated so far (Tsai et al., 1989; Yamamoto et al. , 1990; Ritsch, 1996; Ritsch et al., 1998; Yuhara et al., 2004). Within the Al–Co–Ni d-QC phase, a wide variety of polymorphism on the quasi- periodic planes has been reported (Hiraga et al., 2001a,b; Cervellino et al. , 2002). Closely related to the d-QC phases are a number of so-called approximant phases that have been described by many researchers (Honal et al., 1998; Hiraga et al., 2001b; Steurer, 2001; Katrych et al., 2006; Mihalkovic ˇ& Widom, 2007; Smontara et al., 2008; Dolins ˇek et al., 2009; Katrych & Steurer, 2009; Fleischer et al., 2010; Gille et al. , 2011). To be considered as an approximant phase of the d-QC, two conditions need to be met: (i) the substructures (or ISSN 2053-2733 Received 31 August 2018 Accepted 2 December 2018 Edited by A. I. Goldman, Iowa State University, USA ‡ Current address: National Synchrotron Light Source II, Brookhaven National Laboratory, Upton, New York 11973, USA. Keywords: quasicrystals; approximant phases; synchrotron radiation; nucleation and growth. Supporting information: this article has supporting information at journals.iucr.org/a

Welcome message from author
This document is posted to help you gain knowledge. Please leave a comment to let me know what you think about it! Share it to your friends and learn new things together.
Transcript

aperiodic 2018
Acta Cryst. (2019). A75, 281–296 https://doi.org/10.1107/S2053273318017114 281
A side-by-side comparison of the solidificationdynamics of quasicrystalline and approximantphases in the Al–Co–Ni system
Insung Han,a* Xianghui Xiao,b‡ Haiping Sunc and Ashwin J. Shahania*
aDepartment of Materials Science and Engineering, University of Michigan, Ann Arbor, Michigan 48109, USA, bX-ray
Science Division, Advanced Photon Source, Argonne National Laboratory, Lemont, Illinois 60439, USA, and cMichigan
Center for Materials Characterization, University of Michigan, Ann Arbor, Michigan 48109, USA. *Correspondence
e-mail: [email protected], [email protected]
Quasicrystals and their approximants have triggered widespread interest due to
the challenge of solving their complex crystal structures as well as their possibly
exceptional properties. The structural motifs of approximants are similar to
those of the corresponding quasicrystals, but to what extent are their
crystallization pathways the same? Unfortunately, there have been very few in
situ experimental investigations to answer this question. Here, by leveraging the
high penetrating power of hard X-rays, synchrotron-based X-ray tomography
was conducted in order to capture the nucleation and growth of a decagonal
quasicrystal and its related approximant. The combination of data-driven
computational analysis with new thermodynamic databases allowed the
characterization, with high precision, of the constitutional and kinetic driving
forces for crystallization. The experimental results prove that the growth of both
crystals from a liquid is dominated by first-order kinetics. Nevertheless, and
somewhat surprisingly, significant differences were observed in their rates of
nucleation and growth. The reasons for such divergent behaviours are discussed
in light of contemporary theories of intermetallic crystallization.
1. Introduction
Soon after the discovery of icosahedral quasicrystals
(Shechtman et al., 1984; Shechtman & Blech, 1985), it was
discovered that quasiperiodicity is not limited to icosahedral
phases. For instance, decagonal quasicrystals (d-QCs) possess
quasiperiodic, 2D atomic layers that are stacked periodically
in the perpendicular direction (Bendersky, 1985). At the
mesoscale, d-QCs show a columnar prismatic morphology
along the direction of periodic stacking (Stadnik, 2012). A
consequence of this unique crystallographic anisotropy is
strongly anisotropic transport properties, e.g. electrical resis-
tivity and thermal stability (Shibuya et al., 1990; Edagawa et
al., 1996; Stadnik, 2012). Among the discovered d-QCs, Al–
Co–Ni d-QCs have been the most thoroughly investigated so
far (Tsai et al., 1989; Yamamoto et al., 1990; Ritsch, 1996;
Ritsch et al., 1998; Yuhara et al., 2004). Within the Al–Co–Ni
d-QC phase, a wide variety of polymorphism on the quasi-
periodic planes has been reported (Hiraga et al., 2001a,b;
Cervellino et al., 2002). Closely related to the d-QC phases are
a number of so-called approximant phases that have been
described by many researchers (Honal et al., 1998; Hiraga et
al., 2001b; Steurer, 2001; Katrych et al., 2006; Mihalkovic &
Widom, 2007; Smontara et al., 2008; Dolinsek et al., 2009;
Katrych & Steurer, 2009; Fleischer et al., 2010; Gille et al.,
2011). To be considered as an approximant phase of the d-QC,
two conditions need to be met: (i) the substructures (or
ISSN 2053-2733
Received 31 August 2018
Accepted 2 December 2018
Edited by A. I. Goldman, Iowa State University,
USA
‡ Current address: National Synchrotron Light
Source II, Brookhaven National Laboratory,
Upton, New York 11973, USA.
Keywords: quasicrystals; approximant phases;
synchrotron radiation; nucleation and growth.
Supporting information: this article has
supporting information at journals.iucr.org/a

structural tiles) of the approximant must be similar to the
d-QC. Hence, the approximant phase should have atomic
decorations which resemble those of the aperiodic plane of
d-QCs. (ii) The approximant phase must consist of periodically
stacked atomic layers with a periodicity length almost iden-
tical to that of the d-QC (Dolinsek et al., 2009; Gille et al.,
2011). Periodic stacking of two (Zurkirch et al., 1998;
Cervellino et al., 2002; Henley et al., 2002; Mihalkovic et al.,
2002; Katrych et al., 2006; Smontara et al., 2008) or four (Gu et
al., 2006, 2007; Mihalkovic & Widom, 2007; Fleischer et al.,
2010) atomic layers is commonly observed in the d-QCs and
their approximant phases along the h00001i axis and h010i
axis, respectively. Therefore, the approximant phase of d-QCs
can be more broadly defined as a crystal structure sharing
similar motifs of d-QCs, and can include a number of
compositional variants.
1.1. Complex intermetallics in the Al–Co–Ni system
Below, we survey a few noteworthy approximant phases of
Al–Co–Ni d-QCs. One of the well-known d-QC approximant
phases is the binary Al13Co4 phase. Orthorhombic (o-) and
monoclinic (m-) Al13Co4 are stable above 750 K. Both variants
share the same elementary cluster, a pentagonal bipyramid
that is composed of alternate flat and puckered atomic layers.
The stacking of these alternate layers gives rise to a four-layer
periodicity along the b axis of the crystal (Mihalkovic &
Widom, 2007). It is known that the m- and o-Al13Co4 phases
are entropically stabilized by disorder in the puckering of Co
atoms from the atomic layer, as well as vacancy disorder, tiling
disorder and thermal vibration (Mihalkovic & Widom, 2007).
Investigators also report another related approximant phase,
o0-Al13Co4, which has a similar atomic arrangement, stacking
sequence, vacancy disorder and high-temperature stability as
the m- and o-Al13Co4 phases (Fleischer et al., 2010).
Beyond the binary approximant phases, investigators have
found ternary approximants of Al–Co–Ni d-QCs. For instance,
the ternary W phase is stable at high temperature in the range
of 1173 to 1343 K (Katrych & Steurer, 2009) and has a
monoclinic unit cell (Hiraga et al., 2001a,b). The approximate
compositions of the W phase are in the range of 0 to 11 at.% of
Ni and 68 to 74 at.% of Al (Katrych & Steurer, 2009). Through
high-resolution transmission electron microscopy (HRTEM)
and high-angle annular dark-field scanning transmission
electron microscopy (HAADF-STEM), investigators have
demonstrated that the decagonal cluster that forms the W
phase can be found in the various structural modulations of
Al–Co–Ni d-QCs (Hiraga et al., 2001b). The W phase has a
unit cell composed of four layers along the b axis and thus
pseudo-pentagonal symmetry can be obtained in the electron
diffraction pattern with the incident beam parallel to the b axis
(Hiraga et al., 2001b; Katrych & Steurer, 2009). The layer of
y ¼ 1=2 along the b axis is a mirror plane, and the layers of
y ¼ 1=4 and 3=4 have a puckered structure similar to the
aforementioned Al13Co4 polymorphs. In addition, the ternary
X phase is a high-temperature approximant phase that can
coexist with the four-layer Ni-rich decagonal phase within a
broad temperature and composition range (Katrych et al.,
2006). The composition of the ternary X phase is given by
Al9(Co,Ni)4. The Co/Ni disorder on transition metal sites
contributes to the free energy of the X phase in terms of a high
configurational entropy, giving rise to its stability at elevated
temperatures (Katrych et al., 2006). The X phase consists of
two flat atomic layers along the b axis; each layer includes
distorted pentagonal motifs (Katrych et al., 2006). Like the W
phase, the X phase has a monoclinic unit cell. It shares a
similar, columnar morphology with the d-QC (Fig. 1) that will
be elaborated upon below.
Single-grained QCs and their related approximants can be
grown via conventional approaches including Czochralski,
Bridgman, floating zone and self-flux methods, which we
briefly review here. The Czochralski method uses a small piece
of seed crystal and growth occurs atop the seed through
incongruent solidification from the molten alloy (i.e. solid and
melt have different compositions). Through careful control of
the temperature gradient, rotation speed and crystal pulling
speed (0.1–10 mm h�1), large d-Al–Co–Ni crystals of 1 cm in
diameter have been obtained (Gille et al., 2005). In the
Bridgman method, nucleation occurs spontaneously rather
than on a pre-set seed. The sample is kept at high temperature
(above the liquidus) for homogenization; then, the sample is
slowly pulled down to pass the temperature gradient zone
where crystallization proceeds. With this method, high-quality
d-Al–Co–Ni crystals have been grown (Feuerbacher et al.,
2003). The floating zone method uses a polycrystalline feed
rod with the same composition as the target crystal. A floating
zone (i.e. molten zone) is formed in the feed rod by selective
heating. As the zone moves upward, crystallization occurs
from the bottom to the top of the feed rod (see, e.g., Sato et al.,
1998). Last and simplest of all is the self-flux method, in which
crystals are grown by cooling an off-stoichiometric melt below
the liquidus temperature. Unlike the other three methods,
self-flux does not involve a temperature gradient nor selective
heating. Our approach is most similar to the self-flux method
yet does not include the final decanting step (Tsai & Cui,
2015). Further details on our approach are given in Section
2.1.
1.2. Crystallization pathways of complex intermetallics
While their structures have been extensively studied, the
growth kinetics of the complex intermetallic phases from a
liquid phase have been much less explored. To this end,
Steurer has identified in his topical reviews (Steurer, 2017,
2018) the problem of quasicrystal growth as one of the still
open questions facing the crystallographic community, as of
2018. He asks, ‘How does the 1000th atom find its site in a
giant unit cell with thousands of atoms?’ One physically
plausible explanation is that the growth (of both QCs and their
approximants) occurs not by the attachments of single atoms
but rather energetically favourable clusters of atoms that pre-
exist in the liquid phase. If this cluster-based argument is to be
believed, then one might suppose that the rate of crystal
growth slows with increasing cluster size. This is because large
282 Insung Han et al. � Quasicrystalline and approximant phases in Al–Co–Ni Acta Cryst. (2019). A75, 281–296
aperiodic 2018

clusters require more time to rotate towards the correct
orientation (Land & Yoreo, 2000; Chernov, 2012; Markov,
2016); in this way, clusters should overcome a configurational
entropy-type barrier in order to incorporate into the solid
phase.
Experimental support comes from recent in situ studies
conducted by Han et al. (2017), who tracked the growth
dynamics of a single Al–Co–Ni d-QC in the aperiodic direc-
tions. According to Han et al. (2017), the crystallization of the
d-QC occurs via first-order kinetics (i.e. the solid–liquid
interfacial normal velocity V scales linearly with the under-
cooling �T). The constant of proportionality between the two
is known as the kinetic coefficient (hereafter written as �m,
unit cm s�1 K�1). The kinetic coefficient �m for the d-QC was
found to be approximately six to nine orders of magnitude
smaller than those of periodic, elemental metallic crystals
and two to eight orders of magnitude smaller than those of
periodic, intermetallic crystals (excluding approximants) (Han
et al., 2017). Thus, the kinetic coefficient decreases as the
complexity of the growth unit or cluster increases. An alternate
viewpoint that does not rely on the cluster description is
offered by Herlach (1994). He suggests that short-range
diffusion is necessary for the atoms to sort themselves out to
find the proper sublattice position in a given intermetallic
solid. In contrast, the attachment kinetics at the solid–liquid
interface of a simple crystal (such as a pure metal) are only
collision limited (Coriell & Turnbull, 1982). Consequently, for
diffusion-limited atomic attachment driven growth of inter-
metallics, the kinetic coefficient should be orders of magnitude
smaller as compared with collision-limited growth of simple
crystals, since the relaxation frequency for atomic diffusion
(former case) is much less than the Debye frequency (latter
case).
Based on the steric argument given by Land & Yoreo (2000)
and Chernov (2012), one might possibly assume that the
kinetic coefficients of QCs and their approximants are the
same, owing to their similar structural motifs [condition (i)
above]. To test this hypothesis, we captured in real time and at
elevated temperature the solidification dynamics of the X
phase during ‘fast’ X-ray imaging and compared the results
against the d-QC reported earlier by
our team (Han et al., 2017). Our subse-
quent analysis of the time-dependent
driving force is made possible due to
recent thermodynamic assessments of
the Al–Co–Ni system (Wang et al., 2016;
Wang & Cacciamani, 2018). Somewhat
surprisingly, we find significant differ-
ences in the nucleation and growth rates
between the QC and approximant, the
reasons for which are discussed in
Section 3.2. Broadly, the d-QC possesses
a structural flexibility that is not seen in
the approximant phase, owing in large
part to the QC’s higher (phasonic)
degrees of freedom. To the best of our
knowledge, our investigation presents
the first ever side-by-side comparison of
the crystallization behaviours of a QC
and its related approximant, through
real-time experiments and corres-
ponding thermodynamic calculations.
2. Materials and methods
Despite the decades of research
devoted to the study of QCs and their
approximant phases, it remains to be
determined, through experiment, how
exactly they emerge from a liquid phase.
This is due, in part, to a lack of real-time
data with which to test the kinetic
theories introduced above. Worth
mentioning is one recent experimental
study by Nagao et al. (2015) of grain
growth in a d-QC specimen using in situ
HRTEM. The team observed that grain
aperiodic 2018
Acta Cryst. (2019). A75, 281–296 Insung Han et al. � Quasicrystalline and approximant phases in Al–Co–Ni 283
Figure 1SEM images and electron diffraction patterns of (a), (b) Al–Co–Ni d-QC and (c), (d) the X phase.The sample preparations for the approximant X phase are described in Section 2, while those for thed-QC are given in our previous work (Han et al., 2017). The arrow in (a) indicates the periodich00001i direction in the d-QC and the arrow in (c) represents the h010i direction (or b axis) of the Xphase. The diffraction pattern, reprinted from Han et al. (2017), in (b) shows tenfold symmetryalong h00001i, while that in (d) represents a monclinic crystal structure (Pearson symbol ms26)along the [201] zone axis.

boundaries migrate through an ‘error-and-repair’-type
process, wherein phason strain is introduced and subsequently
relaxed to generate ideal quasicrystalline order (Nagao et al.,
2015). However, there is no mention of the interfacial
dynamics in the periodic h00001i direction. In general, while
one can extract some information from a time-lapse of 2D
images, most growth models make predictions based on a 3D
structure. To circumvent these challenges, we have investi-
gated crystallization through 4D (i.e. 3D space and time-
resolved) synchrotron-based X-ray microtomography (XRT).
Our unique experiment provides a new vision on the inter-
facial dynamics of both QCs and their related approximants,
leveraging the benefits of high temporal and spatial resolu-
tions, as will be described in detail below.
2.1. Experimental methodology
The experimental methods follow that of Han et al. (2017).
Master alloy samples of composition Al–8at.% Co–8at.% Ni
were prepared by vacuum arc remelting (VAR) using high-
purity elemental Al (99.999%), Co (99.9%) and Ni (99.9%) at
the Materials Preparation Center (MPC) at Ames National
Laboratory in Ames, Iowa, USA. The cast Al–8at.% Co–
8at.% Ni alloy buttons were cut into cylinders of 1 mm
diameter by 5 mm height for the XRT
experiment. The cylindrical samples
were placed into a boron nitride (BN)
sample holder, which is chemically inert
at high temperatures and nearly trans-
parent to the incident X-ray beam. The
synchrotron XRT experiment was
conducted at beamline 2-BM of the
Advanced Photon Source (APS) at
Argonne National Laboratory in
Lemont, Illinois, USA. The sample was
first held in a resistive furnace for 5 min
at 1293.2 K, which is above the liquidus
temperature of Al–8at.% Co–8at.% Ni;
this was done to homogenize the melt.
Then, X-ray projection images were
collected continuously as the sample
was rotated at a constant slew velocity
of 9� s�1 and cooled from 1273.2 K to
1213.2 K at a rate of 1 K min�1. The
total data acquisition time was thus 1 h.
Throughout the 1 h scan, the electron
beam was ‘topped up’ every 5 min so
that the beam current fluctuation was
less than 0.5%. Also, the beam heating
effect on the sample should be even less
than 0.5%. The molten alloy was
contained by a thin Al2O3 layer, natu-
rally grown by thermal oxidation (i.e. no
vacuum or inert gas atmosphere was
utilized). Prior to conducting the XRT
experiment, the furnace temperature
was calibrated against other Al-based
alloys (e.g. Al–Si and Al–Ge) with
known liquidus and eutectic tempera-
tures, with beam on. The X-ray projec-
tion images were collected at a rate of
50 Hz using a polychromatic ‘pink’
beam centred at 27 keV. A PCO Edge
5.5 CMOS camera optically coupled
with a 20 mm-thick LuAg:Ce scintillator
was used for data collection. The field of
view (FOV) measured 2560 by 800
pixels along the specimen x and z
directions, respectively, with a pixel size
284 Insung Han et al. � Quasicrystalline and approximant phases in Al–Co–Ni Acta Cryst. (2019). A75, 281–296
aperiodic 2018
Figure 23D reconstructions of (a)–(e) Al–Co–Ni d-QC growth, and (f)–(j) its dissolution (in green),followed by (k)–(t) X-phase crystallization (in red) during continuous cooling (1 K min�1). The zaxis in the specimen frame points along the rotation axis of our cylinder sample. Temperatures andtimes are as follows: (a) 1259.8 K (800 s), (b) 1259.2 K (840 s), (c) 1257.2 K (960 s), (d) 1253.2 K(1200 s), (e) 1247.8 K (1520 s), (f) 1243.5 K (1780 s), (g) 1238.5 K (2080 s), (h) 1235.2 K (2280 s), (i)1233.8 K (2360 s), (j) 1233.8 to 1227.2 K (2360 to 2760 s), (k) 1227.2 K (2760 s), (l) 1226.8 K (2780 s),(m) 1226.5 K (2800 s), (n) 1226.2 K (2820 s), (o) 1225.8 K (2840 s), (p) 1224.5 K (2920 s), (q)1220.8 K (3140 s), (r) 1218. 8 K (3260 s), (s) 1217. 8 K (3320 s) and (t) 1215.5 K (3460 s). The timesgiven in parentheses are with respect to the start of the XRT experiment at 1273.2 K (0 s). A thingrey layer indicates the Al2O3 protective skin of the molten alloy sample that was grown naturallyby thermal oxidation. We observe the nucleation and growth of a single d-QC at high temperaturesand multiple X-phase crystals at lower temperatures (see Section 3.1).
of 0.652 mm2. One thousand projections were recorded for
each 180� rotation of the sample with an exposure time of
14 ms, resulting in a temporal resolution of 20 s between
successive 3D reconstructions. The synchrotron XRT projec-
tion data are stored on the Materials Data Facility (Blaiszik et
al., 2016) and available online at http://dx.doi.org/10.18126/
M2K910.
Our in situ cooling experiment reveals three distinct phase
transformations: (i) growth of the d-QC phase from 1259.8 K
to approximately 1247.8 K, (ii) complete dissolution of the
same phase from 1247.8 K to 1233.8 K, and lastly (iii) growth
of an approximant X phase from 1227.2 K to the end of the
experiment at 1213.2 K. See also Fig. 2 for 3D snapshots of the
microstructural evolution. Processes (i) and (ii) are discussed
in our earlier article (Han et al., 2017). In brief, (i) growth of
the d-QC occurs until the liquid phase is depleted enough in
Co and Ni to reach the liquidus composition (Yokoyama et al.,
1997). The Al enrichment and Co, Ni depletion during the
d-QC solidification were also noted by Guo et al. (1999) at the
growth front of a single d-QC. Subsequently, the remaining
liquid becomes Al rich – which is likely due to gravity-induced
segregation and Al rejection from regions outside the FOV –
so that the d-QC is no longer in equilibrium with the Al-rich
liquid and hence (ii) it dissolves. Our interest in the present
study is to elucidate (iii) the growth process of the approx-
imant phase and compare it with that of the d-QC phase
observed at higher temperatures (i). To our advantage, the
observed solidification of both solid phases (d-QC and X
phase) is non-congruent, giving rise to strong absorption
contrast between solid and liquid in the XRT experiment.
Further microscopy was carried out at the Michigan Center
for Materials Characterization [(MC)2], Ann Arbor, Michigan,
USA, in order to determine the identities of the above two
solid phases seen via XRT (and particularly that of the
approximant). Details of electron microscopy done on the
d-QC phase are given in Han et al. (2017). Here, we focus on
characterizations of the approximant phase. Although we
were not able to re-use the same sample investigated via XRT,
we replicated the growth conditions on another sample of
nominal composition Al–8at.% Co–8at.% Ni. This sample was
cooled in a bench-top muffle furnace from 1273.2 K to
1173.2 K at a rate of 1 K min�1, and quenched to obtain the
fully grown approximant X-phase crystals. Then, electron
micrographs were taken with a Tescan MIRA3 FEG scanning
electron microscope with an accelerating voltage of 30 kV. A
representative image is shown in Fig. 1(c). For transmission
electron microscopy (TEM), regions rich in the approximant
phase in the alloy sample were selected and ground into
powder; the powder was diluted in ethanol and transferred
onto a standard 3 mm-diameter Cu grid with carbon support
thin film for TEM observation. TEM images and electron
diffraction patterns were recorded using a JEOL 3011 high-
resolution electron microscope with a double-tilt holder and
300 kV of accelerating voltage. Electron-dispersive X-ray
spectroscopy (EDS) was also conducted using the same TEM
setup. The selected-area electron diffraction pattern [Fig. 1(d)]
and the EDS spectrum (see the supporting information) are
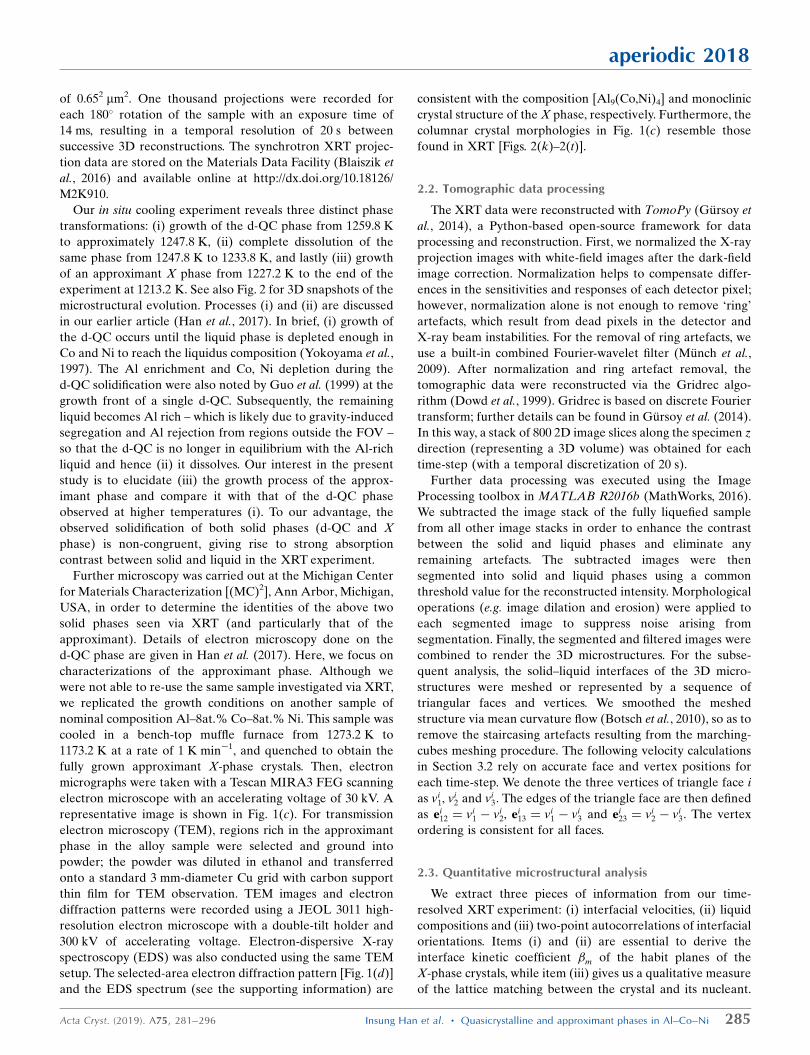
consistent with the composition [Al9(Co,Ni)4] and monoclinic
crystal structure of the X phase, respectively. Furthermore, the
columnar crystal morphologies in Fig. 1(c) resemble those
found in XRT [Figs. 2(k)–2(t)].
2.2. Tomographic data processing
The XRT data were reconstructed with TomoPy (Gursoy et
al., 2014), a Python-based open-source framework for data
processing and reconstruction. First, we normalized the X-ray
projection images with white-field images after the dark-field
image correction. Normalization helps to compensate differ-
ences in the sensitivities and responses of each detector pixel;
however, normalization alone is not enough to remove ‘ring’
artefacts, which result from dead pixels in the detector and
X-ray beam instabilities. For the removal of ring artefacts, we
use a built-in combined Fourier-wavelet filter (Munch et al.,
2009). After normalization and ring artefact removal, the
tomographic data were reconstructed via the Gridrec algo-
rithm (Dowd et al., 1999). Gridrec is based on discrete Fourier
transform; further details can be found in Gursoy et al. (2014).
In this way, a stack of 800 2D image slices along the specimen z
direction (representing a 3D volume) was obtained for each
time-step (with a temporal discretization of 20 s).
Further data processing was executed using the Image
Processing toolbox in MATLAB R2016b (MathWorks, 2016).
We subtracted the image stack of the fully liquefied sample
from all other image stacks in order to enhance the contrast
between the solid and liquid phases and eliminate any
remaining artefacts. The subtracted images were then
segmented into solid and liquid phases using a common
threshold value for the reconstructed intensity. Morphological
operations (e.g. image dilation and erosion) were applied to
each segmented image to suppress noise arising from
segmentation. Finally, the segmented and filtered images were
combined to render the 3D microstructures. For the subse-
quent analysis, the solid–liquid interfaces of the 3D micro-
structures were meshed or represented by a sequence of
triangular faces and vertices. We smoothed the meshed
structure via mean curvature flow (Botsch et al., 2010), so as to
remove the staircasing artefacts resulting from the marching-
cubes meshing procedure. The following velocity calculations
in Section 3.2 rely on accurate face and vertex positions for
each time-step. We denote the three vertices of triangle face i
as vi1, vi
2 and vi3. The edges of the triangle face are then defined
as ei12 ¼ vi
1 � vi2, ei
13 ¼ vi1 � vi
3 and ei23 ¼ vi
2 � vi3. The vertex
ordering is consistent for all faces.
2.3. Quantitative microstructural analysis
We extract three pieces of information from our time-
resolved XRT experiment: (i) interfacial velocities, (ii) liquid
compositions and (iii) two-point autocorrelations of interfacial
orientations. Items (i) and (ii) are essential to derive the
interface kinetic coefficient �m of the habit planes of the
X-phase crystals, while item (iii) gives us a qualitative measure
of the lattice matching between the crystal and its nucleant.
aperiodic 2018
Acta Cryst. (2019). A75, 281–296 Insung Han et al. � Quasicrystalline and approximant phases in Al–Co–Ni 285

Below, we describe the computations required for each
parameter in greater detail.
2.3.1. Interfacial velocity calculation. The local velocity Vi
of each face i in the mesh is calculated using a nearest-
neighbour (NN) algorithm specified by Shahani et al. (2016).
The algorithm finds the NN vertex in the mesh corresponding
to time-step t þ�t for each face centroid i at time-step t; then,
the velocity of each face at time-step t is computed by dividing
the distance between the face centroid at time-step t and NN
vertex at time-step t þ�t by the time interval �t. Note that a
given crystallographic facet has millions of such triangle faces.
The collective facet velocity Vfacet can be computed from the
local triangle face velocities Vi for those faces i on the facet
using
Vfacet ¼P
i2facet
AiVi=P
i2facet
Ai ð1Þ
where Ai indicates the area of mesh triangle i. That is,
equation (1) represents a weighted average over all triangles
on the facet, where the ‘weights’ are the triangle areas
Ai ¼ jei12 � ei
23j and j � � � j is the vector magnitude. To identify
those triangles belonging to a facet, one can cluster triangles
based on their interfacial orientation, as was done by Sena-
bulya et al. (2018); alternatively, one can manually crop out
facets in the microstructure before using equation (1), as we
have done here [see Fig. 6(b)].
2.3.2. Composition mapping. The time-dependent compo-
sition of the liquid was extracted from X-ray projection images
by analysing the variation of intensity during solidification.
Our approach is based on the premise that this intensity can be
mapped to composition one-to-one, for small changes in
atomic fraction (Husseini et al., 2008). As shown by Becker et
al. (2016), this strategy is viable for both monochromatic and
polychromatic sources, provided that the projected intensity
has been calibrated against features of known composition. In
general, the intensity I of a transmitted X-ray beam is sensitive
to a number of different factors beyond composition, such as
the sample thickness and beam hardening. Therefore, care
must be taken to select regions in the projection images with
nearly the same sample thickness, to enable accurate
comparison between such regions; furthermore, projections of
the fully liquefied sample should be subtracted from subse-
quent projection images to mitigate the effect of beam hard-
ening, as discussed in Han et al. (2017).
After these processing steps, we calibrate the region-
averaged X-ray intensities against (i) the solid d-QC and (ii)
the equilibrium liquid phase, obtained when the d-QC stops
growing at 1247.8 K. In both cases, intensities can be found
from the projection images (Han et al., 2017) and the corre-
sponding compositions from phase diagrams of the Al–Co–Ni
system (Yokoyama et al., 1997). That is, features (i) and (ii) are
used as reference points to convert the observed, region-
averaged liquid-phase intensities I into the total atomic frac-
tion of the heavy elements (Co and Ni) in the liquid, which we
denote as hcLCo;Nii. Notably, it is impossible to decouple the
individual contributions of Ni and Co within hcLCo;Nii; to do so
would require a third such calibration point (Han et al., 2017).
Yet it is not so important to make the distinction between Co
and Ni since they occupy substitutional sites in the X-phase
Al9(Co,Ni)4 lattice (Section 1.1). In practice, the X-ray
intensity of the liquid phase should be measured through a
designated region of interest (ROI) within which the incident
X-ray beam can penetrate without ever encountering the
growing crystals. During growth of the X phase, only
approximately a hundred projections out of a thousand
projections (per 180� rotation) can thus be composition
mapped. This is because the X-ray path through the liquid
phase is blocked by the X-phase crystals as the sample rotates
in XRT. Nevertheless, these data give us a wealth of infor-
mation on the time evolution of hcLCo;Nii, and hence the
supersaturation driving force of the parent liquid phase
(Section 3.2).
2.3.3. Two-point correlation analysis. In general, the two-
point correlation function is a useful tool to measure and
visualize correlations of local attributes [e.g. interfacial
curvatures and orientations, see Sun et al. (2017)] within the
3D microstructure. The theoretical basis of correlations in the
context of materials informatics is well developed (Kalidindi et
al., 2011; Gupta et al., 2015; Kalidindi, 2015); here, we want to
explore the application of this theoretical machinery to the
study of the growing X-phase crystals in our work. For
instance, to what degree are the interfacial orientations of one
crystal correlated to those of the neighbouring crystals? What
are the corresponding correlation lengths? Answers to these
questions will give us a clue about the role of heterogeneous
nucleation in defining crystal orientations. To be more specific,
we quantify autocorrelations of facet orientations u and u0
linked by a prescribed vector r using the Pearson product-
moment correlation coefficient gðu; u0jrÞ, which is valued
between g ¼ 1 and g ¼ �1 (Hinkley & Cox, 1979). From
computer vision, the local (i.e. pixel-wise) orientation u in a
2D image can be found as the direction of the image gradient
(Russ, 2016). For g ¼ 1, the two given spatial points along the
solid–liquid interface are ideally correlated to each other (i.e.
they possess the same facet orientation, in our case). On the
other hand, the two points are anti-correlated when g ¼ �1.
When g ¼ 0, the two points are uncorrelated to each other.
Once gðu; u0jrÞ is found for valid vector displacements r, the
data are collected on a 2D (or 3D) map with the displacement
between a pixel and the centre of the map indicating r, and the
value associated with the pixel being the value of g at r.
In practice, we conduct the two-point Pearson auto-
correlation analysis in MATLAB (MathWorks, 2016) using the
spatial correlation toolbox, release 3.1 (Cecen & Kalidindi,
2015). We use as input the segmented 2D images taken along
the specimen x–z plane, which is approximately perpendicular
to the b axis (h010i) of the growing X-phase crystals [Figs. S2
and S3(a) in the supporting information]. The following steps
were taken to ensure that meaningful results were obtained.
Firstly, the images were cropped so as to exclude the oxide
skin and sample holder from our analysis. Next, the images
were masked to include only the solid–liquid interfaces [that
is, a small thickness was assigned to the interfaces to make
them 3D, see Fig. S3(b)]. The orientation at each pixel value
286 Insung Han et al. � Quasicrystalline and approximant phases in Al–Co–Ni Acta Cryst. (2019). A75, 281–296
aperiodic 2018

along the interface was encoded as a continuous range of grey
levels [Fig. S3(c)]. Finally, the images were padded with zeros
on two sides, in order to avoid errors caused by the periodic
boundary assumption inherent to discrete Fourier transforms
(DFTs, used in the computation of g) (Cecen et al., 2016). The
size of the outside padding controls which of the computed
two-point statistics are accurate, i.e. the correlations are only
accurate for vector lengths jrj smaller than the padding size.
The processed images were passed through the toolbox to
output maps of the Pearson autocorrelation function gðu; u0jrÞ
over vector lengths jrj � 325 mm in the specimen x–z plane.
The computation was repeated for all time-steps over the
course of crystallization.
3. Results and discussion
3.1. Nucleation dynamics: d-QC versus X phase
3.1.1. Various statistics of nucleation. We show in Fig. 2 3D
reconstructions of one single d-QC (coloured in green) and
multiple X-phase crystals (coloured in red). The surrounding
liquid phase is rendered in white. The d-QC nucleates at
1259.8 K [Fig. 2(a)] and grows from one side of the protective
Al2O3 skin to the other, along the periodic h00001i direction
(Han et al., 2017). Only one QC nucleation was detected
within the tomographic FOV for the duration of the in situ
experiment. Nucleation of the X-phase crystals takes place
later, at 1227.2 K [Fig. 2(k)]. A total of 13 crystals of the X
phase were captured in the FOV during the tomographic scan,
see Fig. 3. By tracking their formations in 4D, we identify two
distinct nucleation mechanisms: (i) self-nucleation, wherein
intermetallics themselves act as potent nucleation sites for
new X-phase intermetallic crystals, at large distances away
from the specimen surface; (ii) surface oxide nucleation,
wherein the specimen surface (Al2O3) acts as a nucleant for
the X phase. A similar behaviour was reported by Narayanan
et al. (1994), Miller et al. (2006) and Terzi et al. (2010) who
considered the nucleation of another Al-based intermetallic,
�-Al5FeSi. We did not detect homogeneous nucleation. The
4D data were thoroughly analysed to classify every X-phase
crystal according to these two categories, see Fig. 3(a). It can
be seen that the total number of nucleation events increases
continuously during continuous cooling. This might be
because of the strongly anisotropic growth mechanism of the
X phase, which grows along sharp crystallographic directions
(Section 1). Thus, the X phase cannot grow into the super-
saturated liquid regions that are not in the path of its ‘long
axis’. Constitutional undercooling (analysed below) builds up
aperiodic 2018
Acta Cryst. (2019). A75, 281–296 Insung Han et al. � Quasicrystalline and approximant phases in Al–Co–Ni 287
Figure 3(a) Number of nucleated X-phase crystals as a function of time t following the first nucleation event at time t ¼ t0. Only those nucleation and growthevents that occurred within the tomographic FOV are recorded. Nucleation is heterogeneous and takes place on either existing crystal surfaces or theprotective Al2O3 oxide skin of the sample, with nearly equal probability. (b) Length of the ‘long axis’ (parallel to the crystallographic b direction) ofX-phase crystals versus time (red curves). Shown for comparison is the growth trajectory of the d-QC along its long axis h00001i (green curve). Alllengths were measured when the crystals were fully contained within the tomographic FOV except crystal #10; the cross mark at t � t0 = 380 s for crystal#10 indicates that it grew out of the tomographic FOV during the in situ experiment. Measurement errors for crystal (a) numbers and (b) lengths areminimal and arise from counting statistics. Superimposed 3D reconstructions of X-phase crystals that nucleated heterogeneously from (c) the existingcrystal surface and (d) the protective Al2O3 oxide skin of the sample. Both (c) and (d) contain four different time-steps with a temporal discretization of20 s, rendered with decreasing opacity (from opaque red to translucent yellow). The thick arrows in (c), (d) indicate where the nucleation first occurredand the dashed line in (d) indicates where the reconstructed data were cropped for ease of visualization. The grey region represents the Al2O3 oxide skin.

in these liquid regions until it exceeds the necessary nucleation
undercooling. At this point, nucleation events are triggered
around the existing crystals based on the above-mentioned
two mechanisms (i) and (ii). Similar arguments were made by
Salleh et al. (2017) to justify their in situ observations of
repeated nucleation events of faceted Cu6Sn5 crystals. Fig. 3(a)
indicates that, at early times, such heterogeneous nucleation
events occur on the surface oxide and the existing crystals with
near-equal probability; at long times, there is more surface
area on the exposed X-phase facets, resulting in a slight bias
towards self-nucleation. We expect that these 13 nucleation
and growth events are representative of nucleation and
growth throughout the entire sample; this is because the alloy
melt had been homogenized for around 400 s [Fig. 2(j)] before
the first X-phase crystals were observed. 3D examples of two
different growth mechanisms are illustrated in Figs. 3(c) and
3(d).
Fig. 3(b) shows the length of the ‘long axis’ for each of the
nucleated X-phase crystals as a function of time. To interpret
this plot, we must consider the interactions between the
nucleated crystals. Their growth may be physically blocked by
each other or the oxide skin (so-called ‘hard collisions’);
further elongation along the b axis may also be suspended due
to a depletion of the available solute in the melt (so-called
‘soft collisions’) (Enomoto et al., 1986, 1987; Enomoto, 1991).
The latter occurs when the crystal separation is smaller than
the solute diffusion length (see also Section 3.2.1). Due to a
combination of both hard and soft collisions, the length of the
X-phase rods tends to be shorter (on average) than that of the
single d-QC, which grows quickly and without any interrup-
tion. In contrast, only four X-phase crystals are able to extend
from one side of the oxide skin to the other. Altogether, by
combining Figs. 3(a) and 3(b), it is clear that the X-phase rods
are shorter and more numerous than the d-QC.
At first glance, the comparatively low nucleation rate
(number of nuclei per unit volume per unit time) of the d-QC
may seem incongruous with its low solid–liquid interfacial
energy �SL (Holland-Moritz et al., 1993) and higher nucleation
temperature T*. According to classical nucleation theory
(Hoyt, 2011; Kelton & Greer, 2012), both of these factors tend
to increase the nucleation rate over that of the approximant
phases. Yet this rudimentary analysis does not consider the
influence of solute, otherwise known as constitutional under-
cooling. The development of constitutional undercooling – at
the interface of the first crystals to nucleate – starts a ‘wave’ of
nucleation events throughout the bulk liquid (Easton &
StJohn, 2001). Some understanding of these constitutional
effects can be gained by considering the predicted solidifica-
tion paths of both d-QC and X phases, see Fig. 4. Both curves
were calculated with the aid of Thermo-calc software
(Andersson et al., 2002), using a recent thermodynamic
assessment of the Al–Co–Ni system as input (Wang &
Cacciamani, 2018). The growth restriction factor (GRF) is
defined as the initial rate of development of the constitutional
undercooling at the solid–liquid interface (Easton & StJohn,
2001), and can be found directly from Fig. 4 as
GRF ¼ �dT
dfs
� �fs!0
: ð2Þ
In calculating the GRF, we assume two-phase coexistence only
(e.g. liquid and X phase). Furthermore, we have considered
the exact same master alloy composition (Al–8at.% Co–8at.%
Ni) as that of our XRT experiment. The inset derivatives in
Fig. 4 indicate that the GRF of the X phase is approximately
1.5 times greater than that of the d-QC in the limit of a
vanishingly small solid fraction, fs. Consequently, a large
constitutional undercooling develops in a relatively short
growth distance (Salleh et al., 2017) for the X phase, enabling
nucleation events to occur closer together (as experimentally
observed in Fig. 3). Thus, due to the growth anisotropy of the
faceted X phase and its high GRF, it is easier for new crystals
to nucleate from the liquid than it is for a single crystal to
branch during growth (as for a metal dendrite). In spite of this
relatively high nucleation rate, only a few X-phase rods can
connect to both sides of the oxide skin, due to a high
frequency of both hard and soft collisions.
3.1.2. Correlations of interfacial orientations. Both the
crystal surface and oxide skin play a central role as templates
for the nucleating crystals. Lattice matching between crystal
and oxide (heteroepitaxy) and crystal and crystal (homo-
epitaxy) would manifest in a discrete set of allowed orienta-
tions for the nucleating crystals. To quantify the alignments in
the facet orientations u, we calculate correlation maps
gðu; u0jrÞ as a function of time within the specimen x–z plane
(see Fig. 5). Remarkably, this particular plane coincides
approximately with the crystallographic {010} plane for all
X-phase crystals, since they all have ‘long axes’ aligned in the
288 Insung Han et al. � Quasicrystalline and approximant phases in Al–Co–Ni Acta Cryst. (2019). A75, 281–296
aperiodic 2018
Figure 4Mass fractions fs of the solid d-QC (red) and X phase (blue) versusrelative temperature T � TL, where TL represents the liquidus tempera-ture of either phase. Both curves were calculated using the recentCALPHAD-based assessment of the Al–Co–Ni system from Wang &Cacciamani (2018). The first derivative dT=dfs of these two curves in thelimit of fs ! 0 represents the growth restriction factors (GRF) of thed-QC and X phase (see inset). The X phase has a higher GRF by a factorof around 1.5.

same way; stereographic projections of their long-axis direc-
tions are given in Fig. S2. Positive Pearson autocorrelations
(i.e. g> 0:5) in Fig. 5 were found along those vector directions
r parallel and perpendicular to the facet planes [see also Fig.
S3(c)]; g<� 0 can be seen for all other r. The correlation maps
reflect the crystallographic symmetry of the X phase in the
{010} plane, for reasons discussed below. Positive correlations
become more evident and extend over larger distances as the
growing X-phase crystals approach their fully faceted kinetic
Wulff shape (Villain, 1991; Sekerka, 2005), that is asymptoti-
cally bounded by the slow-growing {100} and {001} facet planes
[Fig. 5(d)].
The high Pearson correlations arise from two distinct
sources: (i) single facets and (ii) two facets of neighbouring
crystals (often separated by narrow channels of liquid). The
first is responsible for relatively short-range correlations while
the latter gives rise to longer-range correlations [Fig. S3(c)].
Detailed descriptions of the distinctions between the two are
given in Appendix A. Given the absence of any interfacial
curvature, a single facet (i) can possess the same orientation
over its length (in 2D), and thus one voxel orientation is
correlated to another along the facet itself. The latter case (ii)
is related to the epitaxy between crystal and oxide and crystal
and crystal (which ‘sets’ the orientations of the neighbouring,
nucleating crystals through lattice matching). This may explain
why we find correlations of interfacial orientations that extend
far beyond the crystal dimension. For example, the maximum
facet length [in the inset of Fig. 5(c)] is 180 mm while positive
correlations can be seen over much longer distances of 250 mm
[Figs. 5(c) and 5(d)]. Yet nucleation does not take place
everywhere on the surface oxide (Fig. 2); if it did, the crystals
would grow randomly from the oxide skin and radially inward
without any such correlations between their interfacial
orientations (see, e.g., Salleh et al., 2017). Rather, nucleation of
new crystals takes place preferentially on or in the vicinity of
existing crystals, in order to relieve the constitutional under-
cooling as discussed in Section 3.1.1. The rejected solute (Al)
from the existing crystals may actually assist the nucleation
process by lowering the interfacial energy barrier for hetero-
geneous nucleation, according to the solute segregation model
by Men & Fan (2014). For instance, the interfacial free energy
is smaller for Al (l)-Al2O3 (s) compared with that for Ni (l)-
Al2O3 (s) (Saiz et al., 1999), and in general decreases as the Al
content in the liquid increases (Ni et al., 2014). This would
aperiodic 2018
Acta Cryst. (2019). A75, 281–296 Insung Han et al. � Quasicrystalline and approximant phases in Al–Co–Ni 289
Figure 5Two-point Pearson autocorrelations of the interfacial orientations within the specimen x–z plane. The spatial dimension measures 650 mm along eachaxis. The temperatures and times are as follows: (a) 1222.8 K (3020 s), (b) 1218.2 K (3300 s) and (c) 1213.5 K (3580 s). The Pearson correlation coefficientis undefined (white regions) when the r-dependent standard deviations [Sun et al., 2017, equations (28), (29)] of interfacial orientations are zero. Moregenerally, correlations are only valid when the underlying distributions have finite second moments. White–black (i.e. solid–liquid) interfaces in thesegmented images (inset) were those used to compute the two-point Pearson correlations (see also Fig. S3). The scale bar measures 100 mm in each inset.(d) Superimposed two-point Pearson correlations along the white line in (c), see text for details. Grey curves correspond to those time-steps (correlationmaps not pictured) in between times (a), (b) and (c). The distinction between ‘short’- and ‘long’-range autocorrelations in (d) is clarified in Appendix A.

favour the heterogeneous nucleation of new crystals on Al2O3
over distances much shorter than the radius of curvature of
the oxide skin (�500 mm). Furthermore, atomic scale obser-
vations show that there are up to six layers of partially ordered
Al atoms in the liquid at the interface with a structure
resembling that of Al2O3 (Oh et al., 2005). The result of this
solute segregation and epitaxy is that the Al9(Co,Ni)4 rods
point in nearly the same h010i direction and are perfectly
aligned within the {010} plane. Further work is well underway
to directly relate the observed growth forms to the chemical
structure of the parent liquid phase as well as that of the oxide
nucleant, Al2O3.
3.2. Growth dynamics: d-QC versus X phase
Returning to Fig. 2, it can be seen that the growth of the
d-QC along the periodic h00001i direction is approximately
two orders of magnitude faster than along the aperiodic
h10000i directions (Han et al., 2017). Previously, we found that
d-QC growth is isotropic – with nearly equal growth velocities
along the circumference of the d-QC – whereas its dissolution
is markedly anisotropic, the reasons for which are discussed in
Han et al. (2017). That is, growth and dissolution do not have
time-reversal symmetry. Following the dissolution of the
d-QCs (due to segregation effects, see Section 2), we observe
the nucleation and growth of the X phase. Once nucleated, the
columnar morphology of the X-phase crystals is similar to that
of the d-QC, with long axes aligned along h010i (see also
Fig. 1). Below we discuss in more quantitative terms the
similarities and differences in the growth dynamics of both
phases.
3.2.1. Sharp interface model of attachment kinetics. Once
the constitutional undercooling has been relieved, the nucle-
ated crystals must grow to keep up with the cooling rate. To
model the growth process, we make use of transition state
theory (Wilson, 1900; Frenkel, 1932) as follows: at the solid–
liquid interface, crystal growth proceeds when the flux of
solute from liquid to crystal, JL!C, is greater than from crystal
to liquid, JC!L. On the other hand, dissolution of crystals takes
place when the flux from crystal to liquid is greater than that
from liquid to crystal. Stated mathematically, the velocity V of
a moving solidification front can be expressed as
V / JL!C � JC!L: ð3Þ
Following thermodynamic convention, V> 0 corresponds to
growth and V< 0 corresponds to dissolution. As the crystal
approaches equilibrium with the liquid phase, V ! 0. Under
weak supersaturation, equation (3) can be expressed as
(Jackson, 2004; Ratke & Voorhees, 2013)
V ¼ �s½hcLCo;NiiðtÞ � c
L;equilCo;Ni ðtÞ
nð4Þ
where �s is the kinetic coefficient (as before); the term in
square brackets ½� � � represents the supersaturation driving
force (in at.%), �c; and n is an integer exponent that deter-
mines the mechanism of cluster attachment [e.g. n ¼ 1
corresponds to ‘normal’ growth on interfacial steps, n ¼ 2 to
growth on screw dislocations etc. (Ratke & Voorhees, 2013)].
The supersaturation is defined here as the difference between
the instantaneous, area-averaged liquid composition,
hcLCo;NiiðtÞ, and the equilibrium liquidus composition, c
L;equilCo;Ni ðtÞ,
both of which are time t (and hence, temperature) dependent
during the in situ solidification experiment. Equation (4)
assumes implicitly that growth is governed by the kinetic
contribution to the total driving force. This is a reasonable
assumption to make due to the appearance of facets (Figs. 2
and 6), which inherently have few positions on the solid
surface that are available for attachment (Herlach, 2015;
Libbrecht, 2003). That is, not every atomic (or cluster)
jump from the liquid to the solid will be successful, and
thus the growth process will be limited by the kinetics of
attachment at the solid–liquid interface. In other words,
the kinetic coefficient �s is much less than the ‘diffusive speed’
given by �diff ¼~DD
L=½RðcS
Co;Ni � hcLCo;NiiÞ, where ~DD
Lis the
interdiffusivity in the liquid phase, R is the crystal size, and
cSCo;Ni is the composition of Co and Ni in the solid X phase (see
Appendix B). A similar assumption was made by Han et al.
(2017) in considering the growth of d-QCs in the aperiodic
plane, on the basis that all bounding {10000} facets have
the same velocity irrespective of their
physical orientation and are therefore
limited by their own intrinsic mobility
(as represented by the quantity �s).
According to equation (4), we
require the (i) growth velocity V and (ii)
supersaturation �c in order to compute
the kinetic coefficient �s of the X phase
in the crystallographic {010} plane, and
compare with that of the d-QC in the
aperiodic {00001} plane (Han et al.,
2017). Both phases have nearly isotropic
growth rates in the planes perpendicular
to the ‘long axis’. In extracting para-
meters (i) and (ii) from our real-time
X-ray imaging data, we must consider
carefully the consequence of a relatively
high nucleation rate: namely, crystals
290 Insung Han et al. � Quasicrystalline and approximant phases in Al–Co–Ni Acta Cryst. (2019). A75, 281–296
aperiodic 2018
Figure 6(a) Solid–liquid interfaces coloured by the local interfacial velocity at 1216.8 K. Positive interfacevelocity represents growth and negative velocity represents dissolution. The shown viewpoint isparallel to the specimen y axis and the crystallographic h010i direction. The red dashed box wasused to calculate the growth velocity V of a single X-phase crystal (see text for details). (b)Interfacial isochrones with 80 s time increments within the dashed boxed region. The grey arrowindicates the motion of the facet in time. The represented temperatures and times are as follows:1226.2 K (2820 s), 1224.8 K (2900 s), 1223.5 K (2980 s), 1222.2 K (3060 s), 1220.8 K (3140 s),1219.5 K (3220 s), 1218.2 K (3300 s), 1216.8 K (3380 s) and 1215.5 K (3460 s).

that grow in close proximity to one another must ‘compete’ for
the available solute and thus growth may stagnate as it becomes
solute limited. That is, the neighbouring crystals act as solute
sinks and can dramatically lower the nearby supersaturation.
As an example, low facet velocities [indicated by light-blue
colours in Fig. 6(a)] are found where the diffusional fields of
neighbouring crystals overlap. As the crystals grow, Al is
rejected into the melt, accumulating in the open spaces
between the crystals. Such solutal interactions have been seen
to deactivate the growth of equiaxed grains in metal castings
(Badillo & Beckermann, 2006). For this reason, and to
determine the unbiased facet velocity, we isolate a
freely growing crystal [red dashed box in Figs. 6(a) and 6(b)]
that has less of an interaction with other crystals and also
enough space to grow further. In addition, we are able to
retrieve the instantaneous composition of the bulk liquid
hcLCo;NiiðtÞ directly from our X-ray projection images, and the
equilibrium liquidus composition cL;equilCo;Ni ðtÞ from recent
thermodynamic assessments of the Al–Co–Ni system (see
Section 2).
The two compositions are plotted as functions of
temperature in Fig. 7(a). At short times (high temperatures)
following crystal nucleation, the difference hcLCo;NiiðtÞ �
cL;equilCo;Ni ðtÞ is large, indicating that the liquid phase is highly
supersaturated in the elements Co and Ni, whereas at long
times (low temperatures) this supersaturation decays to near-
zero and hence the two composition curves overlap. Fig. 7(b)
indicates that the temporal variations in velocity and super-
saturation are comparable with one another during the growth
process. By fitting the time-dependent velocity versus super-
saturation data to a function of the form given by equation (4),
we find the kinetic coefficient �s and the temporal exponent n
to be 1.73 � 10�3 cm s�1 and 1.0347 for the X phase, respec-
tively. An R2 value of 0.974 was obtained, which indicates a
good fit of the model to the experimental data. Therefore, the
growth process of the X phase is dominated by the kinetics of
interfacial attachment in the regime of weak supersaturation.
More specifically, its growth follows first-order kinetics (n ’ 1)
akin to the d-QC (in directions perpendicular to the ‘long’
axis). In addition, we can convert the measured kinetic coef-
ficient in a supersaturated (s) matrix, �s, to the more wide-
spread kinetic coefficient in an undercooled (m) melt, �m, by
making use of the liquidus slope. The latter parameter
represents the interfacial velocity V under unit undercooling
(�T ¼ 1 K). We find �m = 4.49 � 10�7 cm s�1 K�1 for the X
phase in the {010} plane, which is five times smaller than that
of the d-QC in the aperiodic {00001} plane [�m = 2.41 �
10�6 cm s�1 K�1, see also Fig. 7(c)].
One might suppose that the difference in the two kinetic
coefficients might be due to different growth temperatures (of
approximately 32 K, see also Fig. 2), since �m is known to have
an Arrhenius-type dependence on temperature T (Wilson,
1900; Frenkel, 1932; Jackson, 2004):
�m / exp �Ea
kBT
� �ð5Þ
aperiodic 2018
Acta Cryst. (2019). A75, 281–296 Insung Han et al. � Quasicrystalline and approximant phases in Al–Co–Ni 291
Figure 7(a) Calculated liquid composition (hcL
Co;Nii, in red) during the XRTexperiment, superimposed on a portion of the pseudobinaryAl1�2mComNim phase diagram (0.074 � m � 0.088) that shows the
equilibrium liquidus curve (cL;equilCo;Ni , in black). Errors in the calculation
of the former are due to slight differences in the sample thicknessbetween independent measurements, which in turn may influence theintensity I of the forward attenuated beam (by the Beer–Lambert law,U / expð�dÞ, where d is sample thickness). The horizontal spacingbetween the red and black curves represents the supersaturation drivingforce at a given time and temperature. (b) Average facet velocity of afreely growing X-phase crystal [in red, see also Fig. 6(b)] andsupersaturation (in blue), during the growth process. (c) Average facetvelocity versus driving force of the d-QC and X phase. The slopes give thekinetic coefficient �s which is associated with the growth process [i.e.equation (4) with n = 1].
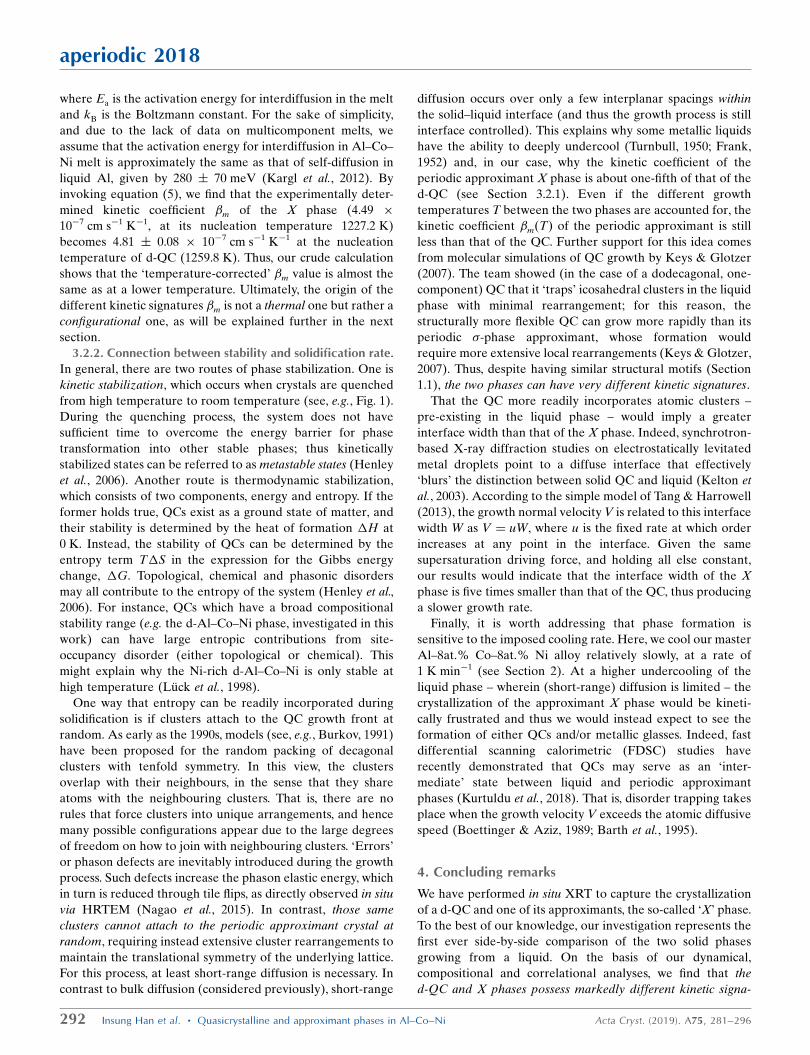
where Ea is the activation energy for interdiffusion in the melt
and kB is the Boltzmann constant. For the sake of simplicity,
and due to the lack of data on multicomponent melts, we
assume that the activation energy for interdiffusion in Al–Co–
Ni melt is approximately the same as that of self-diffusion in
liquid Al, given by 280 70 meV (Kargl et al., 2012). By
invoking equation (5), we find that the experimentally deter-
mined kinetic coefficient �m of the X phase (4.49 �
10�7 cm s�1 K�1, at its nucleation temperature 1227.2 K)
becomes 4.81 0.08 � 10�7 cm s�1 K�1 at the nucleation
temperature of d-QC (1259.8 K). Thus, our crude calculation
shows that the ‘temperature-corrected’ �m value is almost the
same as at a lower temperature. Ultimately, the origin of the
different kinetic signatures �m is not a thermal one but rather a
configurational one, as will be explained further in the next
section.
3.2.2. Connection between stability and solidification rate.
In general, there are two routes of phase stabilization. One is
kinetic stabilization, which occurs when crystals are quenched
from high temperature to room temperature (see, e.g., Fig. 1).
During the quenching process, the system does not have
sufficient time to overcome the energy barrier for phase
transformation into other stable phases; thus kinetically
stabilized states can be referred to as metastable states (Henley
et al., 2006). Another route is thermodynamic stabilization,
which consists of two components, energy and entropy. If the
former holds true, QCs exist as a ground state of matter, and
their stability is determined by the heat of formation �H at
0 K. Instead, the stability of QCs can be determined by the
entropy term T�S in the expression for the Gibbs energy
change, �G. Topological, chemical and phasonic disorders
may all contribute to the entropy of the system (Henley et al.,
2006). For instance, QCs which have a broad compositional
stability range (e.g. the d-Al–Co–Ni phase, investigated in this
work) can have large entropic contributions from site-
occupancy disorder (either topological or chemical). This
might explain why the Ni-rich d-Al–Co–Ni is only stable at
high temperature (Luck et al., 1998).
One way that entropy can be readily incorporated during
solidification is if clusters attach to the QC growth front at
random. As early as the 1990s, models (see, e.g., Burkov, 1991)
have been proposed for the random packing of decagonal
clusters with tenfold symmetry. In this view, the clusters
overlap with their neighbours, in the sense that they share
atoms with the neighbouring clusters. That is, there are no
rules that force clusters into unique arrangements, and hence
many possible configurations appear due to the large degrees
of freedom on how to join with neighbouring clusters. ‘Errors’
or phason defects are inevitably introduced during the growth
process. Such defects increase the phason elastic energy, which
in turn is reduced through tile flips, as directly observed in situ
via HRTEM (Nagao et al., 2015). In contrast, those same
clusters cannot attach to the periodic approximant crystal at
random, requiring instead extensive cluster rearrangements to
maintain the translational symmetry of the underlying lattice.
For this process, at least short-range diffusion is necessary. In
contrast to bulk diffusion (considered previously), short-range
diffusion occurs over only a few interplanar spacings within
the solid–liquid interface (and thus the growth process is still
interface controlled). This explains why some metallic liquids
have the ability to deeply undercool (Turnbull, 1950; Frank,
1952) and, in our case, why the kinetic coefficient of the
periodic approximant X phase is about one-fifth of that of the
d-QC (see Section 3.2.1). Even if the different growth
temperatures T between the two phases are accounted for, the
kinetic coefficient �mðTÞ of the periodic approximant is still
less than that of the QC. Further support for this idea comes
from molecular simulations of QC growth by Keys & Glotzer
(2007). The team showed (in the case of a dodecagonal, one-
component) QC that it ‘traps’ icosahedral clusters in the liquid
phase with minimal rearrangement; for this reason, the
structurally more flexible QC can grow more rapidly than its
periodic �-phase approximant, whose formation would
require more extensive local rearrangements (Keys & Glotzer,
2007). Thus, despite having similar structural motifs (Section
1.1), the two phases can have very different kinetic signatures.
That the QC more readily incorporates atomic clusters –
pre-existing in the liquid phase – would imply a greater
interface width than that of the X phase. Indeed, synchrotron-
based X-ray diffraction studies on electrostatically levitated
metal droplets point to a diffuse interface that effectively
‘blurs’ the distinction between solid QC and liquid (Kelton et
al., 2003). According to the simple model of Tang & Harrowell
(2013), the growth normal velocity V is related to this interface
width W as V ¼ uW, where u is the fixed rate at which order
increases at any point in the interface. Given the same
supersaturation driving force, and holding all else constant,
our results would indicate that the interface width of the X
phase is five times smaller than that of the QC, thus producing
a slower growth rate.
Finally, it is worth addressing that phase formation is
sensitive to the imposed cooling rate. Here, we cool our master
Al–8at.% Co–8at.% Ni alloy relatively slowly, at a rate of
1 K min�1 (see Section 2). At a higher undercooling of the
liquid phase – wherein (short-range) diffusion is limited – the
crystallization of the approximant X phase would be kineti-
cally frustrated and thus we would instead expect to see the
formation of either QCs and/or metallic glasses. Indeed, fast
differential scanning calorimetric (FDSC) studies have
recently demonstrated that QCs may serve as an ‘inter-
mediate’ state between liquid and periodic approximant
phases (Kurtuldu et al., 2018). That is, disorder trapping takes
place when the growth velocity V exceeds the atomic diffusive
speed (Boettinger & Aziz, 1989; Barth et al., 1995).
4. Concluding remarks
We have performed in situ XRT to capture the crystallization
of a d-QC and one of its approximants, the so-called ‘X’ phase.
To the best of our knowledge, our investigation represents the
first ever side-by-side comparison of the two solid phases
growing from a liquid. On the basis of our dynamical,
compositional and correlational analyses, we find that the
d-QC and X phases possess markedly different kinetic signa-
292 Insung Han et al. � Quasicrystalline and approximant phases in Al–Co–Ni Acta Cryst. (2019). A75, 281–296
aperiodic 2018

tures despite being crystallographically related. While growth
of the X phase is governed by first-order kinetics, in the same
manner as for the d-QC, the two solid phases differ with
respect to their nucleation and growth rates. A greater
constitutional undercooling enables a higher nucleation rate
for the X-phase crystals. The nucleated, approximant-phase
crystals are unable to grow as fast as the d-QC due to ‘soft
collisions’ between overlapping diffusion fields. Yet even those
X-phase crystals that grow freely and away from other
X-phase crystals have anomalously slow growth rates. This is
most likely because extensive cluster rearrangements are
necessary to maintain the translational symmetry of the
periodic lattice. Meanwhile, the d-QC does not experience as
great a kinetic undercooling at the solid–liquid interface since
it is able to incorporate the atomic clusters at random. It is for
this reason that the measured kinetic coefficient of the X
phase is about one-fifth that of the d-QC. We expect that this
study will improve our understanding of the kinetic factors
that drive crystallization of QCs and their related approx-
imants. Further work is well underway to relate the observed
growth forms to the chemical structure of the parent liquid
phase as well as that of the oxide nucleant, Al2O3.
APPENDIX AAnalysis of correlation regimes
Correlation maps measure the size of
features, as well as their distribution in
the microstructure (the feature of
interest in our work being the local
interfacial orientation). In order to
untangle the two in our analysis, we
consider four simulated 2D images and
their corresponding correlation maps
(see Fig. 8). As can be seen in Figs. 8(a)
and 8(b), the length jrj of the steepest
drop in slope in the map of Pearson
autocorrelations measures the size of
the feature (here, clusters of white
pixels). Meanwhile, the period in the
high-frequency oscillations in the
correlation maps shown in Figs. 8(c) and
8(d) measures the distance between the
white clusters (of same size here). Those
same long-range correlations are absent
in Figs. 8(a) and 8(b) since the two
images were randomly generated. In
our analysis, we use ‘long range’ to refer
to the oscillations outside of the stee-
pest drop; ‘short range’ is just the
opposite (Section 3.1.2).
APPENDIX BAnalysis of crystal growth regimes
In general, the growth of crystals from a
supersaturated solution can be influ-
enced by (i) diffusive transport through the solution and (ii)
attachment kinetics at the crystal surface. In order to illustrate
the relative importance of both processes, we will consider the
growth of a 3D fictitious crystal with an infinite number of
facets on all sides (thus rendering it spherical). Diffusive
transport can be described by Fick’s second law (Shewmon,
1989). Assuming that growth proceeds slowly and near equi-
librium, the diffusion equation reduces to Laplace’s equation
(in spherical coordinates),
r2� ¼ 0 ð6Þ
where � denotes the supersaturation field at radial distances r,
�ðrÞ � cLðrÞ � cL;eq: ð7Þ
Equation (6) has the well-known solution (Jackson, 2004;
Ratke & Voorhees, 2013)
�ðrÞ ¼A
rþ B ð8Þ
where the constants A and B are determined by the boundary
conditions. Far away from the growing crystal (i.e. as r!1),
the supersaturation is given by a baseline value �1 so that
aperiodic 2018
Acta Cryst. (2019). A75, 281–296 Insung Han et al. � Quasicrystalline and approximant phases in Al–Co–Ni 293
Figure 8Two-point Pearson autocorrelation maps of four segmented images (inset): (a) random noise at theone-pixel scale, (b) random noise at the ten-pixel scale, (c) square pattern with periodicity of fivepixels, and (d) square pattern with periodicity of 20 pixels. Features (white) in (c)–(d) have the samesize as 3 pixels. It can be seen in (a), (b) that the initial descent in the Pearson correlation (from g = 1at r = 0 to g ’ 0 for jrj ’ rc) corresponds to the feature size rc; meanwhile, the high-frequencyoscillations in (c), (d) correspond to the distances between features in the images (separated by r).Both scale bars in (d) measure 20 pixels.

B ¼ �1. To solve for the remaining term A we require a mass
balance condition at the crystal surface r ¼ R, given as
~DDL @�
@r
���r¼R¼ VðcS
Co;Ni � hcLCo;NiiÞ ð9Þ
where ~DDL
is the interdiffusivity in the liquid (L) phase and
cSCo;Ni is the composition of the solid (S) phase. We also know
from equation (4) that the velocity V is directly proportional
to the driving force �ðRÞ. Combining equations (4) and (9) by
eliminating V gives the mixed boundary condition at the
crystal surface,
�s�ðRÞ ¼~DD
L
ðcSCo;Ni � hc
LCo;NiiÞ
@�
@r
���r¼R: ð10Þ
Substituting equation (8) into equation (10) gives the solution
of the diffusion equation and the velocity V as
V ¼�s�diff
�s þ �diff
� ��1 ð11Þ
where the term �diff is the ‘diffusive speed’, which we define as
�diff ¼~DD
L
RðcSCo;Ni � hc
LCo;NiiÞ
: ð12Þ
In the limit as �s � �diff, the growth velocity in equation (11)
becomes V ¼ ð ~DDL�1Þ=½Rðc
SCo;Ni � hc
LCo;NiiÞ (which is inde-
pendent of the kinetic coefficient �s) and thus describes purely
diffusion-limited growth. In the opposite limit, we have
V ¼ �s�1 which is valid for interface-limited growth; note this
expression is analogous to equation (4) in the main text. Thus,
the dominant mechanism of crystallization depends on the
relative magnitudes of the characteristic speeds �s and �diff .
We can compare the two using some realistic parameters. As
in Section 3.2.2, we assume that ~DDL
is equivalent to the self-
diffusivity of Al in its melt (8 0:7� 10�5 cm2 s�1 at 1020 K)
(Kargl et al., 2012); we let R be 1� 10�3 cm; and we take
cSCo;Ni � hc
LCo;Nii to be approximately 0.15, based on our
compositional analysis. The calculated �diff is 6� 10�1 cm s�1
which is far greater than typical values seen for �s (e.g.
5� 10�3 cm s�1 for the d-QC). Thus, �diff is always greater
than �s in the range of our crystal size. It follows that diffusion
is fast (for the crystal sizes so-investigated) and hence inter-
facial attachment is the rate-determining step in crystal-
lization. Of course, as crystallization proceeds and the crystal
size R increases, the diffusive speed [equation (12)] lags and
the process will eventually become diffusion limited (see
Fig. 9).
While the preceding analysis illustrates concisely the two
regimes of crystal growth, it is important to bear in mind that it
makes a number of simplifying assumptions: (i) the super-
saturation is certainly not a constant value but instead changes
with time until it is depleted and growth is finished [cf. Fig.
6(a)]. (ii) Only growth of a single crystal is considered here.
Instead, the multi-particle diffusion problem (Ratke & Voor-
hees, 2013) is likely more realistic since it accounts for the ‘soft
collisions’ that are seen at high nucleation rates [i.e. nearby
crystals act as solutal sinks, cf. Fig. 5(a)]. (iii) We do not
account for the influence of capillarity, in which the interfacial
composition hcLCo;Nii depends on the interfacial curvature [or
weighted mean curvature for a faceted surface (see Taylor,
1992; Roosen & Carter, 1998)]. This assumption may not be so
detrimental given the effects of attachment kinetics are
usually much greater than the effects of the Gibbs–Thomson
mechanism (see, e.g., Libbrecht et al., 2002). (iv) Another
potential shortcoming is that our analysis does not account for
the deposition of latent heat in the transition from liquid to
solid, which may change the supersaturation locally (especially
if thermal diffusion is slow). (v) Lastly, for the sake of
simplicity, we neglect the strong crystallographic anisotropy of
the rod-like X-phase crystals. We would need to invoke the
conformal mapping of the Shwarz–Christoffel type (Trefethen,
1980) in order to solve equation (6) under realistic boundary
conditions and ultimately for the orientation-dependent facet
velocities. Indeed, including all effects from (i) to (v) would
require substantial numerical modelling, which is beyond the
scope of the present investigation.
Acknowledgements
We are grateful to Saman Moniri, Caleb Reese, Mushfequr
Rahman, Riddhiman Bhattacharya and Nancy Senabulya
from the University of Michigan for assisting in the synchro-
tron-based tomography experiment; Pavel Shevshenko from
Argonne National Laboratory for assistance in sample
preparation; and Yao Wang from Universita di Genova for
providing the files necessary for CALPHAD-based thermo-
dynamic calculations. We would also like to thank the
294 Insung Han et al. � Quasicrystalline and approximant phases in Al–Co–Ni Acta Cryst. (2019). A75, 281–296
aperiodic 2018
Figure 9Relationship between crystal radius (R) and characteristic speed[interface attachment speed �s and diffusive speed �diff , equation (12)].The interface attachment speed is less than the diffusive speed when thecrystal radius is approximately smaller than 0.1 cm (which coincides withthe physical sample size). Since crystal sizes observed in our XRTexperiment never reach such large dimensions, the growth of the d-QCand X phase is dominated by the kinetics of interface attachment. Weassume that the surface roughness does not change as the crystal grows,and thus the interface attachment speed is a constant value independentof the crystal radius.

Michigan Center for Materials Characterization for use of the
electron microscopes and staff assistance.
Funding information
We acknowledge support from the US Department of Energy
(DOE), Office of Science, Office of Basic Energy Sciences,
under Award No. DE-SC0019118. This research used
resources of the Advanced Photon Source, a US Department
of Energy (DOE), Office of Science User Facility operated for
the DOE Office of Science by Argonne National Laboratory
under Contract No. DE-AC02-06CH11357. This research used
resources of the Full-Field X-ray Imaging Beamline (FXI) at
18-ID of the National Synchrotron Light Source, a US
Department of Energy (DOE), Office of Science User Facility
operated for the DOE Office of Science by Brookhaven
National Laboratory under Contract No. DE-AC02-
98CH10886.
References
Andersson, J.-O., Helander, T., Hoglund, L., Shi, P. & Sundman, B.(2002). Calphad, 26, 273–312.
Badillo, A. & Beckermann, C. (2006). Acta Mater. 54, 2015–2026.Barth, M., Wei, B. & Herlach, D. (1995). Phys. Rev. B, 51, 3422–3428.Becker, M., Klein, S. & Kargl, F. (2016). Scr. Mater. 124, 34–37.Bendersky, L. (1985). Phys. Rev. Lett. 55, 1461–1463.Blaiszik, B., Chard, K., Pruyne, J., Ananthakrishnan, R., Tuecke, S. &
Foster, I. (2016). JOM, 68, 2045–2052.Boettinger, W. & Aziz, M. (1989). Acta Metall. 37, 3379–3391.Botsch, M., Kobbelt, L., Pauly, M., Alliez, P. & Levy, B. (2010).
Polygon Mesh Processing. New York: AK Peters/CRC Press.Burkov, S. (1991). Phys. Rev. Lett. 67, 614–617.Cecen, A., Fast, T. & Kalidindi, S. R. (2016). Integr. Mater. Manuf.
Innov. 5, 1.Cecen, A. & Kalidindi, S. R. (2015). MATLAB Spatial Correlation
Toolbox. Release 3.1. doi: 10.5281/zenodo.31329.Cervellino, A., Haibach, T. & Steurer, W. (2002). Acta Cryst. B58, 8–
33.Chernov, A. A. (2012). Modern Crystallography III: Crystal Growth.
Berlin: Springer Science & Business Media.Coriell, S. & Turnbull, D. (1982). Acta Metall. 30, 2135–2139.Dolinsek, J., Komelj, M., Jeglic, P., Vrtnik, S., Stanic, D., Popcevic, P.,
Ivkov, J., Smontara, A., Jaglicic, Z., Gille, P. & Grin, Y. (2009). Phys.Rev. B, 79, 184201.
Dowd, B. A., Campbell, G. H., Marr, R. B., Nagarkar, V. V., Tipnis,S. V., Axe, L. & Siddons, D. P. (1999). Proc. SPIE, 3772, 224–236.
Easton, M. & StJohn, D. (2001). Acta Mater. 49, 1867–1878.Edagawa, K., Chernikov, M. A., Bianchi, A. D., Felder, E., Gubler, U.
& Ott, H. R. (1996). Phys. Rev. Lett. 77, 1071–1074.Enomoto, Y. (1991). Acta Metall. Mater. 39, 2013–2016.Enomoto, Y., Kawasaki, K. & Tokuyama, M. (1987). Acta Metall. 35,
915–922.Enomoto, Y., Tokuyama, M. & Kawasaki, K. (1986). Acta Metall. 34,
2119–2128.Feuerbacher, M., Thomas, C. & Urban, K. (2003). Single-quasicrystal
Growth. Quasicrystals: Structure and Physical Properties, pp. 2–25.Weinheim: VCH Wiley.
Fleischer, F., Weber, T., Jung, D. & Steurer, W. (2010). J. AlloysCompd. 500, 153–160.
Frank, F. C. (1952). Proc. R. Soc. London Ser. A, 215, 43–46.Frenkel, J. (1932). Phys. Z. Sowjetunion, 1, 498–510.Gille, P., Bauer, B., Hahne, M., Smontara, A. & Dolinsek, J. (2011). J.
Cryst. Growth, 318, 1016–1020.
Gille, P., Meisterernst, G. & Faber, N. (2005). J. Cryst. Growth, 275,224–231.
Gu, N., Henley, C. & Mihalkovic, M. (2006). Philos. Mag. 86, 593–599.
Gu, N., Mihalkovic, M. & Henley, C. (2007). Philos. Mag. Lett. 87,923–933.
Guo, J. Q., Sato, T. J., Hirano, T. & Tsai, A.-P. (1999). J. Cryst. Growth,197, 963–966.
Gupta, A., Cecen, A., Goyal, S., Singh, A. K. & Kalidindi, S. R.(2015). Acta Mater. 91, 239–254.
Gursoy, D., De Carlo, F., Xiao, X. & Jacobsen, C. (2014). J.Synchrotron Rad. 21, 1188–1193.
Han, I., Xiao, X. & Shahani, A. J. (2017). Sci. Rep. 7, 17407.Henley, C., de Boissieu, M. & Steurer, W. (2006). Philos. Mag. 86,
1131–1151.Henley, C. L., Mihalkovic, M. & Widom, M. (2002). J. Alloys Compd.
342, 221–227.Herlach, D. M. (1994). Mater. Sci. Eng. Rep. 12, 177–272.Herlach, D. M. (2015). Crystals, 5, 355–375.Hinkley, D. V. & Cox, D. (1979). Theoretical Statistics. New York:
Chapman & Hall/CRC.Hiraga, K., Ohsuna, T. & Nishimura, S. (2001a). J. Alloys Compd. 325,
145–150.Hiraga, K., Ohsuna, T., Sun, W. & Sugiyama, K. (2001b). Mater.
Trans. 42, 2354–2367.Holland-Moritz, D., Herlach, D. & Urban, K. (1993). Phys. Rev. Lett.
71, 1196–1199.Honal, M., Haibach, T. & Steurer, W. (1998). Acta Cryst. A54, 374–
387.Hoyt, J. J. (2011). Phase Transformations. McMaster University
Bookstore.Husseini, N. S., Kumah, D. P., Yi, J. Z., Torbet, C. J., Arms, D. A.,
Dufresne, E. M., Pollock, T. M., Wayne Jones, J. & Clarke, R.(2008). Acta Mater. 56, 4715–4723.
Jackson, K. A. (2004). Kinetic Processes: Crystal Growth, Diffusionand Phase Transformations in Materials. Weinheim: John Wiley &Sons.
Kalidindi, S. R. (2015). Hierarchical Materials Informatics: NovelAnalytics for Materials Data. Amsterdam: Elsevier.
Kalidindi, S. R., Niezgoda, S. R. & Salem, A. A. (2011). JOM, 63, 34–41.
Kargl, F., Weis, H., Unruh, T. & Meyer, A. (2012). J. Phys. Conf. Ser.340, 012077.
Katrych, S., Mihalkovic, M., Gramlich, V., Widom, M. & Steurer, W.(2006). Philos. Mag. 86, 451–456.
Katrych, S. & Steurer, W. (2009). J. Alloys Compd. 481, 258–263.Kelton, K., Lee, G., Gangopadhyay, A. K., Hyers, R., Rathz, T.,
Rogers, J., Robinson, M. & Robinson, D. (2003). Phys. Rev. Lett. 90,195504.
Kelton, K. F. & Greer, A. L. (2012). Ordering and Crystal Nucleationin Undercooled Melts. Solidification of Containerless UndercooledMelts, pp. 87–111. Weinheim: John Wiley & Sons.
Keys, A. S. & Glotzer, S. C. (2007). Phys. Rev. Lett. 99, 235503.Kurtuldu, G., Shamlaye, K. F. & Loffler, J. F. (2018). Proc. Natl Acad.
Sci. USA, 115, 6123–6128.Land, T. A. & De Yoreo, J. J. (2000). J. Cryst. Growth, 208, 623–
637.Libbrecht, K. G. (2003). J. Cryst. Growth, 258, 168–175.Libbrecht, K. G., Crosby, T. & Swanson, M. (2002). J. Cryst. Growth,
240, 241–254.Luck, R., Scheffer, M., Godecke, T., Ritschj, S. & Beelif, C. (1998).
MRS Proc. 553, 25–36.Markov, I. V. (2016). Crystal Growth for Beginners: Fundamentals of
Nucleation, Crystal Growth and Epitaxy. Singapore: WorldScientific.
MathWorks (2016). MATLAB. Release R2016b. Natick, Massachu-setts, USA.
Men, H. & Fan, Z. (2014). Metall. Mater. Trans. A, 45, 5508–5516.
aperiodic 2018
Acta Cryst. (2019). A75, 281–296 Insung Han et al. � Quasicrystalline and approximant phases in Al–Co–Ni 295

Mihalkovic, M., Al-Lehyani, I., Cockayne, E., Henley, C., Moghadam,N., Moriarty, J., Wang, Y. & Widom, M. (2002). Phys. Rev. B, 65,104205.
Mihalkovic, M. & Widom, M. (2007). Phys. Rev. B, 75, 014207.Miller, D., Lu, L. & Dahle, A. (2006). Met. Mater. Trans. B, 37, 873–
878.Munch, B., Trtik, P., Marone, F. & Stampanoni, M. (2009). Opt.
Express, 17, 8567–8591.Nagao, K., Inuzuka, T., Nishimoto, K. & Edagawa, K. (2015). Phys.
Rev. Lett. 115, 075501.Narayanan, L. A., Samuel, F. & Gruzleski, J. (1994). Metall. Mater.
Trans. A, 25, 1761–1773.Ni, N., Kaufmann, Y., Kaplan, W. D. & Saiz, E. (2014). Acta Mater. 64,
282–296.Oh, S. H., Kauffmann, Y., Scheu, C., Kaplan, W. D. & Ruhle, M.
(2005). Science, 310, 661–663.Ratke, L. & Voorhees, P. W. (2013). Growth and Coarsening: Ostwald
Ripening in Material Processing. Berlin: Springer Science &Business Media.
Ritsch, S. (1996). Philos. Mag. Lett. 74, 99–106.Ritsch, S., Beeli, C., Nissen, H., Godecke, T., Scheffer, M. & Luck, R.
(1998). Philos. Mag. Lett. 78, 67–75.Roosen, A. R. & Carter, W. C. (1998). Phys. A, 261, 232–247.Russ, J. C. (2016). The Image Processing Handbook. Boca Raton:
CRC Press.Saiz, E., Cannon, R. & Tomsia, A. (1999). Acta Mater. 47, 4209–
4220.Salleh, M. M., Gourlay, C., Xian, J., Belyakov, S., Yasuda, H.,
McDonald, S. & Nogita, K. (2017). Sci. Rep. 7, 40010.Sato, T. J., Hirano, T. & Tsai, A. P. (1998). J. Cryst. Growth, 191, 545–
552.Sekerka, R. F. (2005). Cryst. Res. Technol. 40, 291–306.Senabulya, N., Xiao, X., Han, I. & Shahani, A. J. (2018). Scr. Mater.
146, 218–221.Shahani, A. J., Xiao, X., Skinner, K., Peters, M. & Voorhees, P. W.
(2016). Mater. Sci. Eng. A, 673, 307–320.Shechtman, D. & Blech, I. A. (1985). Metall. Trans. A, 16, 1005–1012.Shechtman, D., Blech, I., Gratias, D. & Cahn, J. W. (1984). Phys. Rev.
Lett. 53, 1951–1953.
Shewmon, P. (1989). Diffusion in Solids. The Minerals, Metals andMaterials Society.
Shibuya, T., Hashimoto, T. & Takeuchi, S. (1990). J. Phys. Soc. Jpn,59, 1917–1920.
Smontara, A., Smiljanic, I., Ivkov, J., Stanic, D., Barisic, O.-S., Jaglicic,Z., Gille, P., Komelj, M., Jeglic, P., Bobnar, M. & Dolinsek, J. (2008).Phys. Rev. B, 78, 104204.
Stadnik, Z. M. (2012). Physical Properties of Quasicrystals. Berlin:Springer Science & Business Media.
Steurer, W. (2001). Ferroelectrics, 250, 377–380.Steurer, W. (2017). J. Phys. Conf. Ser. 809, 012001.Steurer, W. (2018). Acta Cryst. A74, 1–11.Sun, Y., Cecen, A., Gibbs, J. W., Kalidindi, S. R. & Voorhees, P. W.
(2017). Acta Mater. 132, 374–388.Tang, C. & Harrowell, P. (2013). Nat. Mater. 12, 507–511.Taylor, J. E. (1992). Acta Metall. Mater. 40, 1475–1485.Terzi, S., Taylor, J., Cho, Y., Salvo, L., Suery, M., Boller, E. & Dahle,
A. (2010). Acta Mater. 58, 5370–5380.Trefethen, L. N. (1980). SIAM J. Sci. Stat. Comput. 1, 82–102.Tsai, A.-P. & Cui, C. (2015). Crystal Growth of Quasicrystals.
Handbook of Crystal Growth, 2nd ed., pp. 1113–1156. Amsterdam:Elsevier.
Tsai, A.-P., Inoue, A. & Masumoto, T. (1989). Mater. Trans. JIM, 30,463–473.
Turnbull, D. (1950). J. Appl. Phys. 21, 1022–1028.Villain, J. (1991). Nature, 350, 273–274.Wang, Y. & Cacciamani, G. (2018). Calphad, 61, 198–210.Wang, Y., Zhou, P., Peng, Y., Du, Y., Sundman, B., Long, J., Xu, T. &
Zhang, Z. (2016). J. Alloys Compd. 687, 855–866.Wilson, H. W. (1900). London Edinb. Dubl. Philos. Mag. J. Sci. 50,
238–250.Yamamoto, A., Kato, K., Shibuya, T. & Takeuchi, S. (1990). Phys.
Rev. Lett. 65, 1603–1606.Yokoyama, Y., Note, R., Kimura, S., Inoue, A., Fukaura, K. &
Sunada, H. (1997). Mater. Trans. JIM, 38, 943–949.Yuhara, J., Klikovits, J., Schmid, M., Varga, P., Yokoyama, Y.,
Shishido, T. & Soda, K. (2004). Phys. Rev. B, 70, 024203.Zurkirch, M., Bolliger, B., Erbudak, M. & Kortan, A. (1998). Phys.
Rev. B, 58, 14113–14116.
296 Insung Han et al. � Quasicrystalline and approximant phases in Al–Co–Ni Acta Cryst. (2019). A75, 281–296
aperiodic 2018
Related Documents