A sharp increase in sex ratio at birth in the Caucasus. Why? How? CEPED-CICRED-INED Seminar on Female Deficit in Asia: Trends and Perspectives, Singapore, 5-7 December 2005. Draft paper before publication; please do not use it as reference. A sharp increase in sex ratio at birth in the Caucasus. Why? How? France Meslé*, Jacques Vallin*, and Irina Badurashvili**, *Institut national d’études démographiques, Paris **Georgian Centre of Demographic Studies, Tbilissi

Welcome message from author
This document is posted to help you gain knowledge. Please leave a comment to let me know what you think about it! Share it to your friends and learn new things together.
Transcript
A sharp increase in sex ratio at birth in the Caucasus. Why? How? CEPED-CICRED-INED Seminar on Female Deficit in Asia: Trends and Perspectives, Singapore, 5-7 December 2005. Draft paper before publication; please do not use it as reference.
A sharp increase in sex ratio at birth in the Caucasus. Why? How?
France Meslé*, Jacques Vallin*, and Irina Badurashvili**, *Institut national d’études démographiques, Paris
**Georgian Centre of Demographic Studies, Tbilissi
A sharp increase in sex ratio at birth in the Caucasus. Why? How?
2
A sharp increase in sex ratio at birth in the Caucasus. Why? How?
France Meslé*, Jacques Vallin*, and Irina Badurashvili**,
*Institut national d’études démographiques, Paris **Georgian Centre of Demographic Studies, Tbilissi
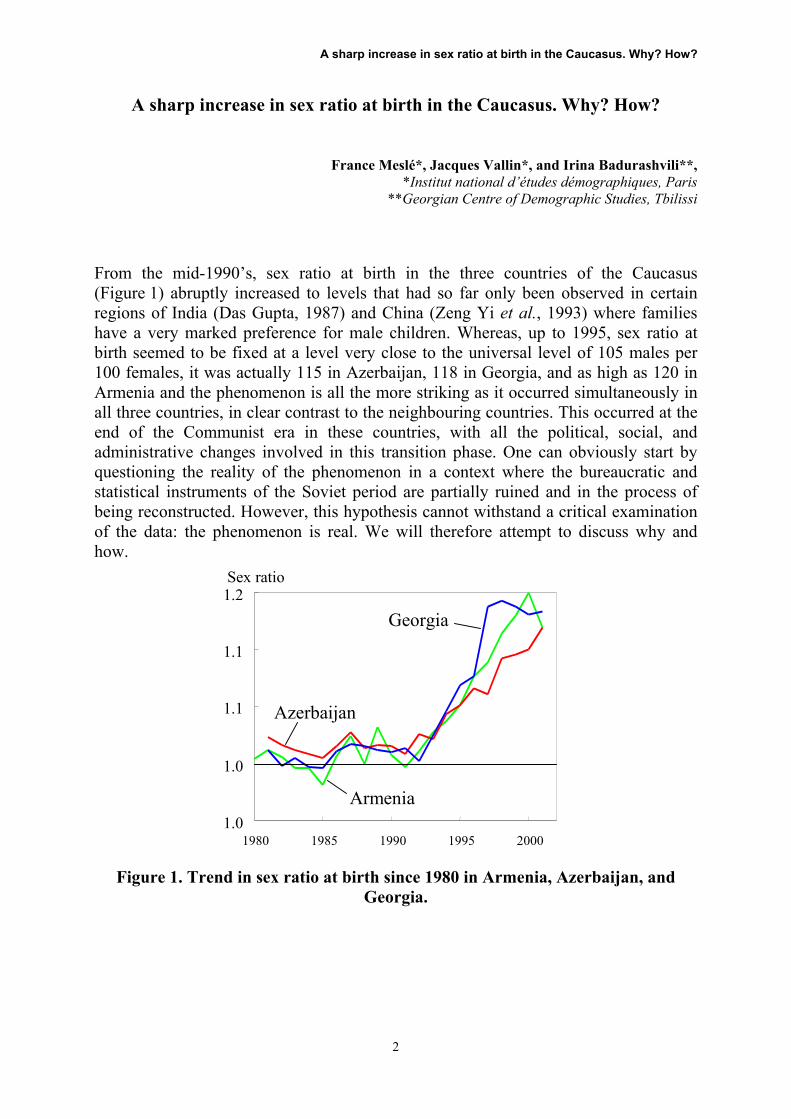
From the mid-1990’s, sex ratio at birth in the three countries of the Caucasus (Figure 1) abruptly increased to levels that had so far only been observed in certain regions of India (Das Gupta, 1987) and China (Zeng Yi et al., 1993) where families have a very marked preference for male children. Whereas, up to 1995, sex ratio at birth seemed to be fixed at a level very close to the universal level of 105 males per 100 females, it was actually 115 in Azerbaijan, 118 in Georgia, and as high as 120 in Armenia and the phenomenon is all the more striking as it occurred simultaneously in all three countries, in clear contrast to the neighbouring countries. This occurred at the end of the Communist era in these countries, with all the political, social, and administrative changes involved in this transition phase. One can obviously start by questioning the reality of the phenomenon in a context where the bureaucratic and statistical instruments of the Soviet period are partially ruined and in the process of being reconstructed. However, this hypothesis cannot withstand a critical examination of the data: the phenomenon is real. We will therefore attempt to discuss why and how.
1.0
1.0
1.1
1.1
1.2
1980 1985 1990 1995 2000
Azerbaijan
Georgia
Armenia
Sex ratio
Figure 1. Trend in sex ratio at birth since 1980 in Armenia, Azerbaijan, and Georgia.
A sharp increase in sex ratio at birth in the Caucasus. Why? How?
3
I. A phenomenon limited to the Caucasus
We have known for some time that sex ratio at birth has deviated significantly from the universal level in some regions of India and China under the influence of a strong son preference recently combined with the availability of simple and relatively effective means of foetal sex-determination at the beginning of a pregnancy. Selective induced abortion therefore allows couples to choose the sex of their child. The temptation is even greater when an authoritarian population policy like that of China deprives couples of the freedom of having as many children as they wish.
We also know that in some Mediterranean and Muslim countries significant son preference has existed for a long time and in some countries has resulted (and still results) in differential behaviour towards a child depending on the sex, with extreme consequences such as, for example, the excess mortality of female children in Bangladesh (Chen et al., 1981), in Tunisia (Haffad, 1984; Chekir and Vallin, 2001), in Algeria (Vallin, 1978; Ferry, 1979), and more generally in the Muslim countries (Adlakha and Suchindran, 1985). Sex ratio at birth could also be expected to increase in such countries when methods of foetal sex-determination start to develop. It is however surprising that the phenomenon appears abruptly in an area where it was undoubtedly least expected: three countries of the Caucasus that were for a long time subject to the Soviet system, a system that cannot be said to have supported a preference for one sex over another. It is even more surprising that of all the countries of the former USSR three such different nations as Georgia, Armenia, and Azerbaijan are concerned by this while neither the other Caucasian republics nor the Muslim Central Asian countries of the former Soviet Union are affected. It is no doubt even more striking that this phenomenon has appeared first in these countries of the Caucasus rather than in the southern Mediterranean Muslim countries.
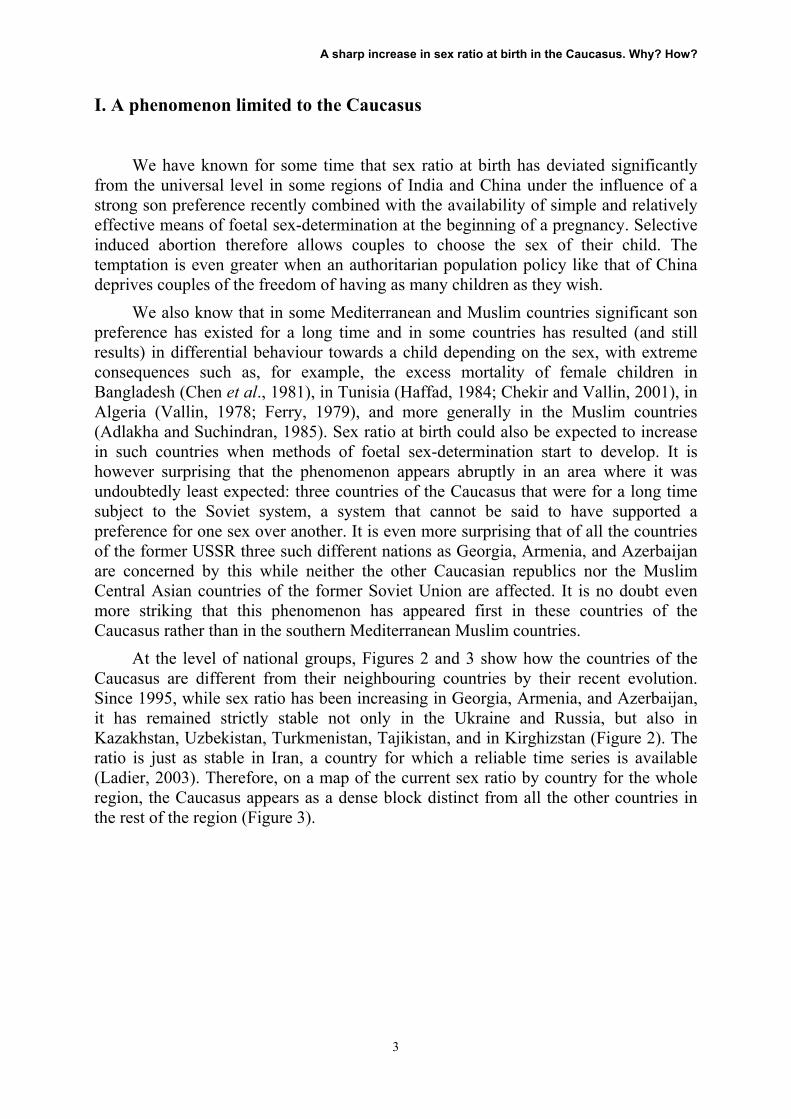
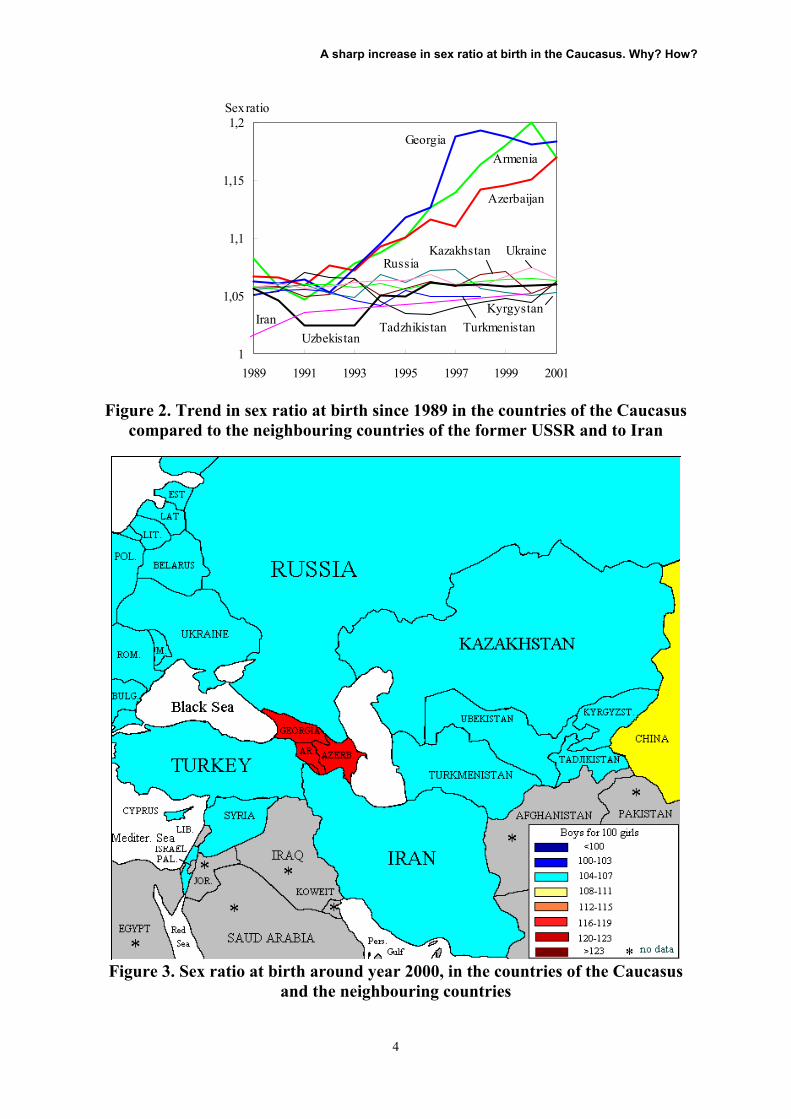
At the level of national groups, Figures 2 and 3 show how the countries of the Caucasus are different from their neighbouring countries by their recent evolution. Since 1995, while sex ratio has been increasing in Georgia, Armenia, and Azerbaijan, it has remained strictly stable not only in the Ukraine and Russia, but also in Kazakhstan, Uzbekistan, Turkmenistan, Tajikistan, and in Kirghizstan (Figure 2). The ratio is just as stable in Iran, a country for which a reliable time series is available (Ladier, 2003). Therefore, on a map of the current sex ratio by country for the whole region, the Caucasus appears as a dense block distinct from all the other countries in the rest of the region (Figure 3).
A sharp increase in sex ratio at birth in the Caucasus. Why? How?
4
1
1,05
1,1
1,15
1,2
1989 1991 1993 1995 1997 1999 2001
GeorgiaArmenia
Azerbaijan
UzbekistanTadzhikistan
KyrgystanTurkmenistan
UkraineKazakhstanRussia
Iran
Sex ratio
Figure 2. Trend in sex ratio at birth since 1989 in the countries of the Caucasus
compared to the neighbouring countries of the former USSR and to Iran
Figure 3. Sex ratio at birth around year 2000, in the countries of the Caucasus
and the neighbouring countries
A sharp increase in sex ratio at birth in the Caucasus. Why? How?
5
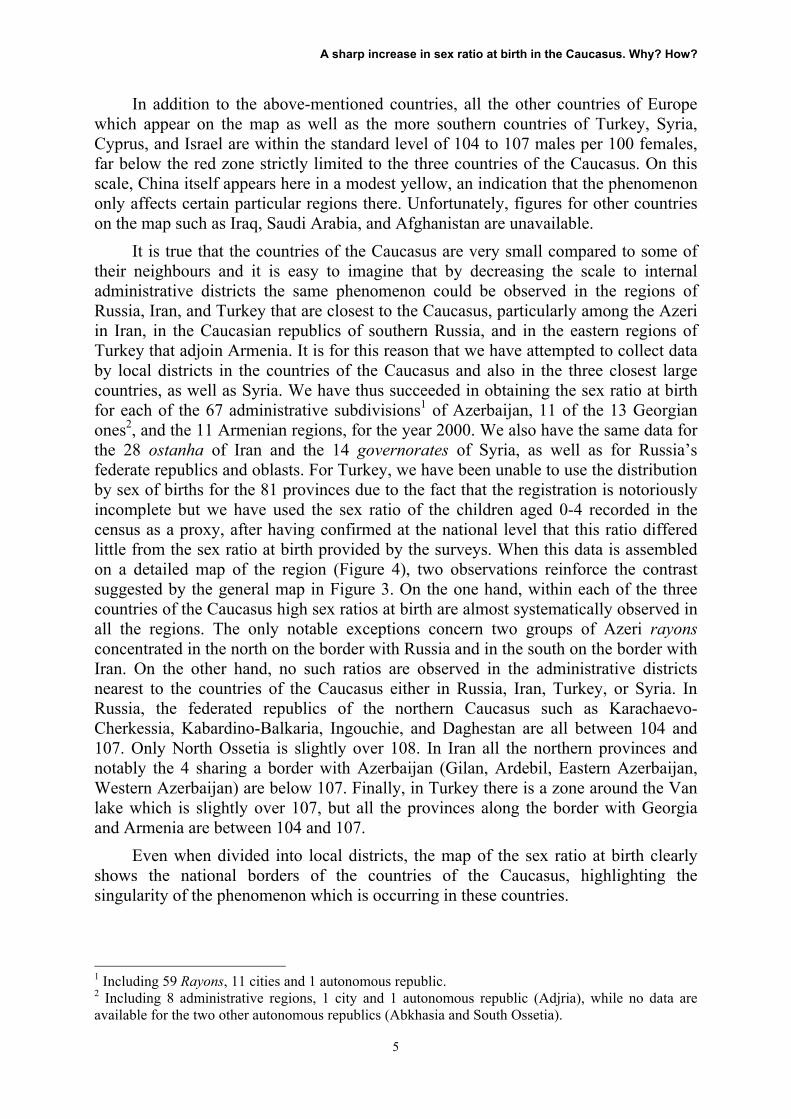
In addition to the above-mentioned countries, all the other countries of Europe which appear on the map as well as the more southern countries of Turkey, Syria, Cyprus, and Israel are within the standard level of 104 to 107 males per 100 females, far below the red zone strictly limited to the three countries of the Caucasus. On this scale, China itself appears here in a modest yellow, an indication that the phenomenon only affects certain particular regions there. Unfortunately, figures for other countries on the map such as Iraq, Saudi Arabia, and Afghanistan are unavailable.
It is true that the countries of the Caucasus are very small compared to some of their neighbours and it is easy to imagine that by decreasing the scale to internal administrative districts the same phenomenon could be observed in the regions of Russia, Iran, and Turkey that are closest to the Caucasus, particularly among the Azeri in Iran, in the Caucasian republics of southern Russia, and in the eastern regions of Turkey that adjoin Armenia. It is for this reason that we have attempted to collect data by local districts in the countries of the Caucasus and also in the three closest large countries, as well as Syria. We have thus succeeded in obtaining the sex ratio at birth for each of the 67 administrative subdivisions1 of Azerbaijan, 11 of the 13 Georgian ones2, and the 11 Armenian regions, for the year 2000. We also have the same data for the 28 ostanha of Iran and the 14 governorates of Syria, as well as for Russia’s federate republics and oblasts. For Turkey, we have been unable to use the distribution by sex of births for the 81 provinces due to the fact that the registration is notoriously incomplete but we have used the sex ratio of the children aged 0-4 recorded in the census as a proxy, after having confirmed at the national level that this ratio differed little from the sex ratio at birth provided by the surveys. When this data is assembled on a detailed map of the region (Figure 4), two observations reinforce the contrast suggested by the general map in Figure 3. On the one hand, within each of the three countries of the Caucasus high sex ratios at birth are almost systematically observed in all the regions. The only notable exceptions concern two groups of Azeri rayons concentrated in the north on the border with Russia and in the south on the border with Iran. On the other hand, no such ratios are observed in the administrative districts nearest to the countries of the Caucasus either in Russia, Iran, Turkey, or Syria. In Russia, the federated republics of the northern Caucasus such as Karachaevo-Cherkessia, Kabardino-Balkaria, Ingouchie, and Daghestan are all between 104 and 107. Only North Ossetia is slightly over 108. In Iran all the northern provinces and notably the 4 sharing a border with Azerbaijan (Gilan, Ardebil, Eastern Azerbaijan, Western Azerbaijan) are below 107. Finally, in Turkey there is a zone around the Van lake which is slightly over 107, but all the provinces along the border with Georgia and Armenia are between 104 and 107.
Even when divided into local districts, the map of the sex ratio at birth clearly shows the national borders of the countries of the Caucasus, highlighting the singularity of the phenomenon which is occurring in these countries.
1 Including 59 Rayons, 11 cities and 1 autonomous republic. 2 Including 8 administrative regions, 1 city and 1 autonomous republic (Adjria), while no data are available for the two other autonomous republics (Abkhasia and South Ossetia).
A sharp increase in sex ratio at birth in the Caucasus. Why? How?
6
Figure 4. Geographic variations in sex ratio at birth around year 2000 in each of
the countries of the Caucasus and in the neighbouring districts of Russia, Turkey, Syria, and Iran.
A sharp increase in sex ratio at birth in the Caucasus. Why? How?
7
II. Appearance or reality?
The first possible explanation of this surprising trend could be deterioration in the quality of birth registration. During the Soviet era there was already doubt regarding the exhaustiveness of registration, particularly concerning births followed by deaths at a young age. It is possible with the fall of the system and the weakening of bureaucracy that statistical coverage of civil registration diminished. Subject to less pressure, families, perhaps more often than in the past, gave up sometimes complicated, time-consuming and expensive administrative procedures in time and even money. In a context of son preference, the deterioration in the coverage can be expected to be more significant regarding female children with less importance being attached to officially declaring the births. Indeed, this is the explanation which is generally given in the available publications that deal with the subject (Meladze and Tsuladze, 1998; Tsuladze and Meladze, 1998; Tsuladze et al., 1998; Donahue and Fortado, 2003).
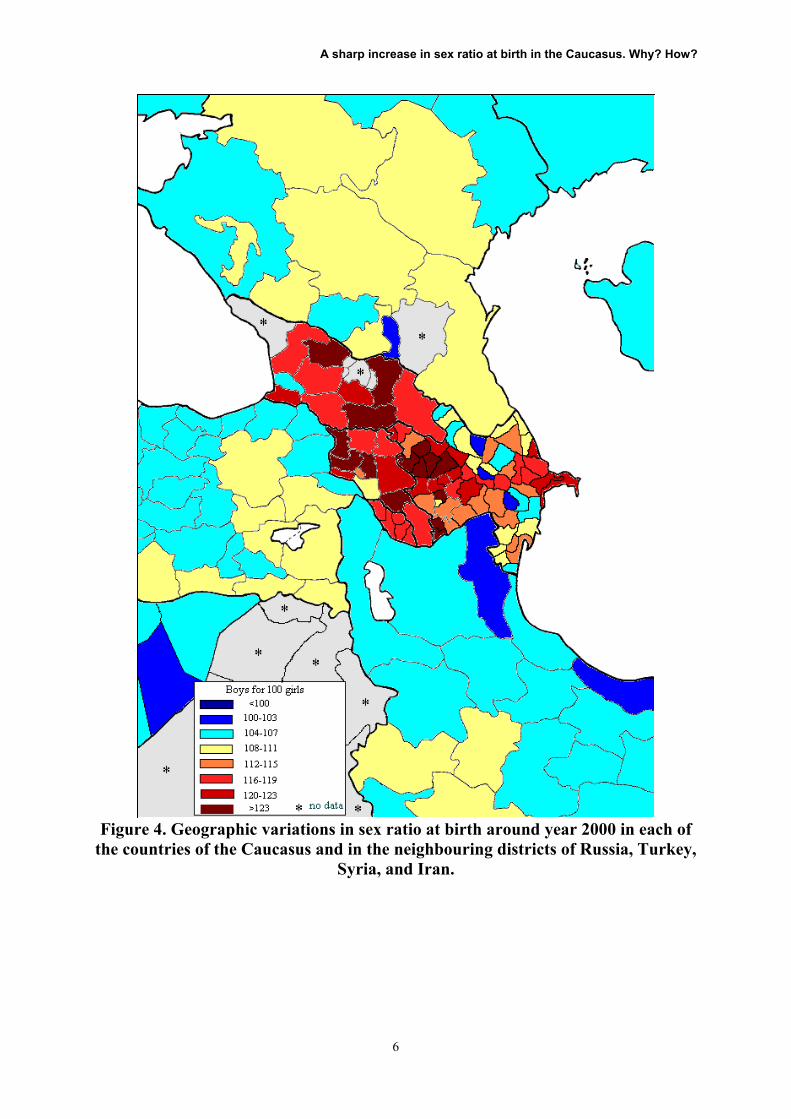
The results of the two recent fertility surveys in Armenia (ANSS and ORC Macro, 2001) and Georgia (Serbanescu et al., 2001) enable us to assert that this hypothesis is certainly not the decisive explanation3. The sex ratio at birth observed during the 15 years before each survey has not shown any difference from that observed in Civil Registration data (Figure 5). The two series originating from the surveys certainly fluctuate much more as a result of their small numbers than those originating from Civil Registration records but the trends are exactly the same. It is true that data taken from retrospective surveys can be affected by under-recording which is variable with time but, in this case, it is the oldest births which were likely to be under-recorded and which, due to son preference, would have caused an over estimate of the sex ratio. If this were the case, the series obtained from surveys in Figure 5 should show trends opposite to those of Civil Registration data. Yet not only do these trends clearly move in the same direction, but in Armenia the survey suggests an increase in the sex ratio even more drastic than that suggested in Civil Registration. We cannot therefore in any way attribute this increase to a simple deterioration in the quality of birth registration.
3 A similar survey was produced in Azerbaijan in the same year, but, in spite of the fact that the final report has been published in March 2003 (Serbanescu et al.), unitl now, it was not possible for us to obtain the data file and carry out the specific analyses made here on the data from the Armenian and Georgian surveys.
A sharp increase in sex ratio at birth in the Caucasus. Why? How?
8
0,9
1,0
1,1
1,2
1,3
1,4
1,5
1,6
1985 1990 1995 2000
Georgia
Sex ratio
Civil registration
Survey
0,9
1,0
1,1
1,2
1,3
1,4
1,5
1,6
1985 1990 1995 2000
Armenia
Sex ratio
Survey
Civil registration
Figure 5. Trend in sex ratio at birth during the last fifteen years according to the fertility surveys and Civil Registration data in Armenia and Georgia.
III. The key role of the 3rd child
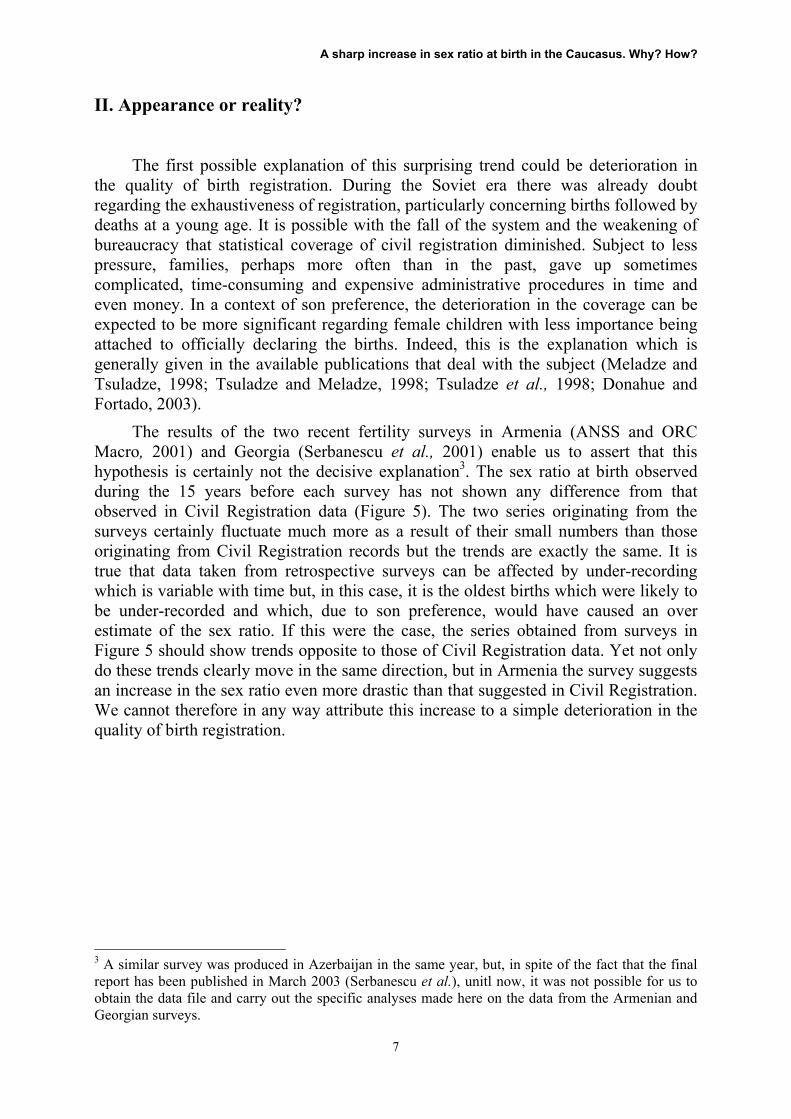
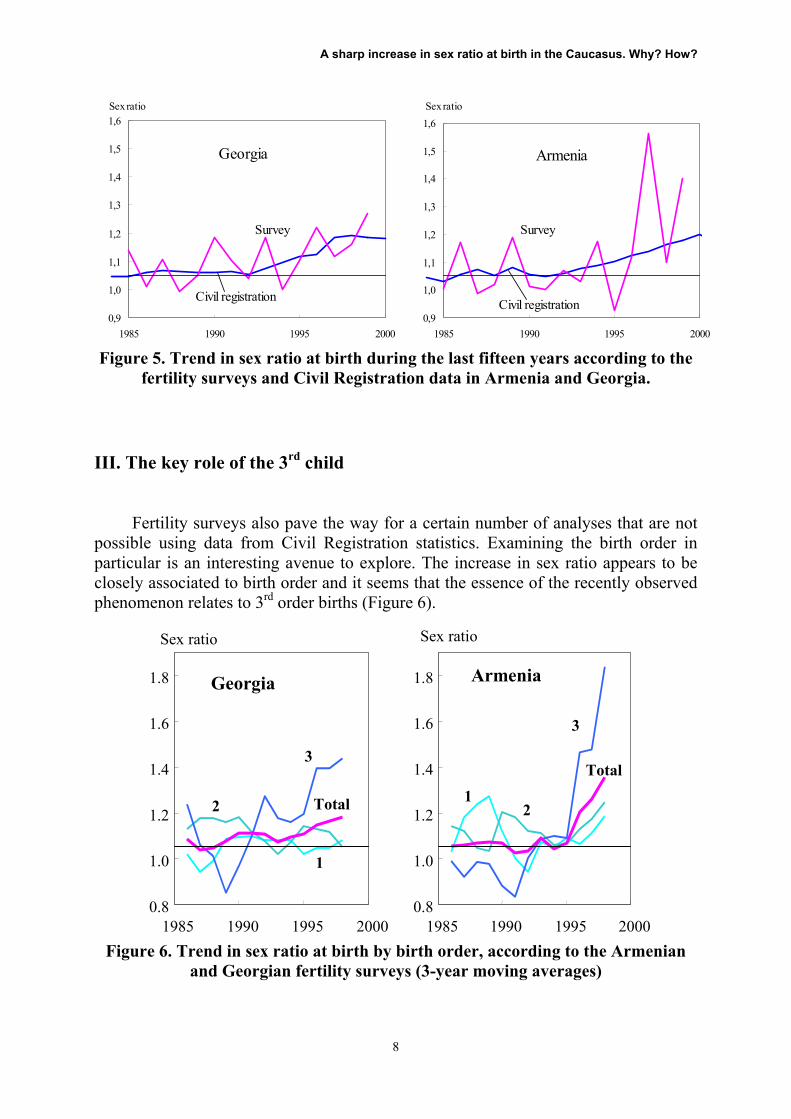
Fertility surveys also pave the way for a certain number of analyses that are not possible using data from Civil Registration statistics. Examining the birth order in particular is an interesting avenue to explore. The increase in sex ratio appears to be closely associated to birth order and it seems that the essence of the recently observed phenomenon relates to 3rd order births (Figure 6).
0.8
1.0
1.2
1.4
1.6
1.8
1985 1990 1995 2000
Georgia
Sex ratio
1
2 Total
3
0.8
1.0
1.2
1.4
1.6
1.8
1985 1990 1995 2000
Armenia
1
3
2
Total
Sex ratio
Figure 6. Trend in sex ratio at birth by birth order, according to the Armenian
and Georgian fertility surveys (3-year moving averages)
A sharp increase in sex ratio at birth in the Caucasus. Why? How?
9
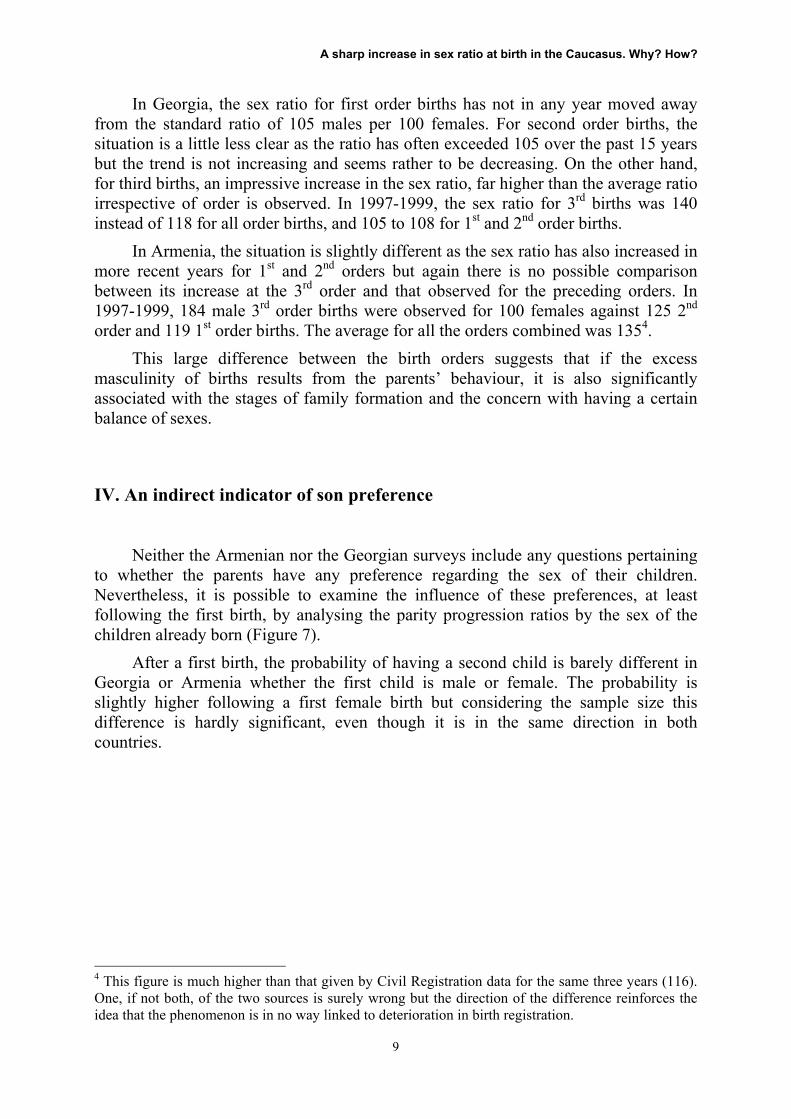
In Georgia, the sex ratio for first order births has not in any year moved away from the standard ratio of 105 males per 100 females. For second order births, the situation is a little less clear as the ratio has often exceeded 105 over the past 15 years but the trend is not increasing and seems rather to be decreasing. On the other hand, for third births, an impressive increase in the sex ratio, far higher than the average ratio irrespective of order is observed. In 1997-1999, the sex ratio for 3rd births was 140 instead of 118 for all order births, and 105 to 108 for 1st and 2nd order births.
In Armenia, the situation is slightly different as the sex ratio has also increased in more recent years for 1st and 2nd orders but again there is no possible comparison between its increase at the 3rd order and that observed for the preceding orders. In 1997-1999, 184 male 3rd order births were observed for 100 females against 125 2nd order and 119 1st order births. The average for all the orders combined was 1354.
This large difference between the birth orders suggests that if the excess masculinity of births results from the parents’ behaviour, it is also significantly associated with the stages of family formation and the concern with having a certain balance of sexes.
IV. An indirect indicator of son preference
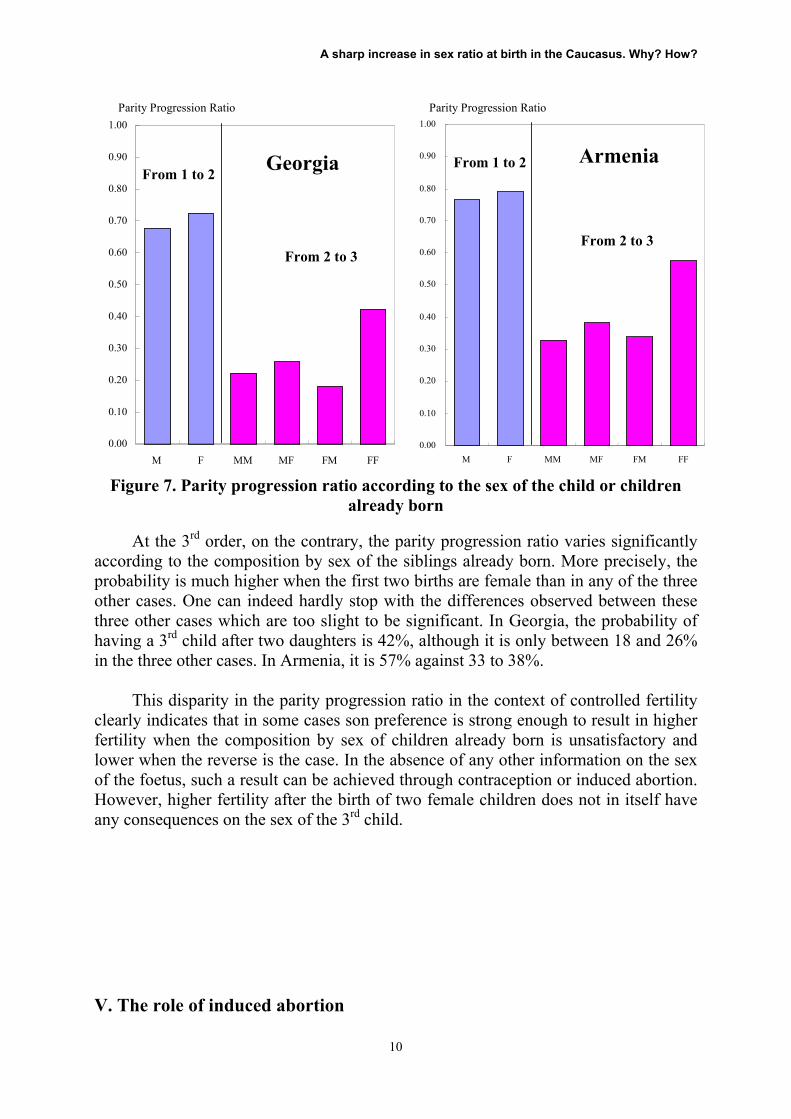
Neither the Armenian nor the Georgian surveys include any questions pertaining to whether the parents have any preference regarding the sex of their children. Nevertheless, it is possible to examine the influence of these preferences, at least following the first birth, by analysing the parity progression ratios by the sex of the children already born (Figure 7).
After a first birth, the probability of having a second child is barely different in Georgia or Armenia whether the first child is male or female. The probability is slightly higher following a first female birth but considering the sample size this difference is hardly significant, even though it is in the same direction in both countries.
4 This figure is much higher than that given by Civil Registration data for the same three years (116). One, if not both, of the two sources is surely wrong but the direction of the difference reinforces the idea that the phenomenon is in no way linked to deterioration in birth registration.
A sharp increase in sex ratio at birth in the Caucasus. Why? How?
10
0.00
0.10
0.20
0.30
0.40
0.50
0.60
0.70
0.80
0.90
1.00
M F MM MF FM FF
From 1 to 2
From 2 to 3
Armenia
Parity Progression Ratio
0.00
0.10
0.20
0.30
0.40
0.50
0.60
0.70
0.80
0.90
1.00
M F MM MF FM FF
From 1 to 2
From 2 to 3
Parity Progression Ratio
Georgia
Figure 7. Parity progression ratio according to the sex of the child or children already born
At the 3rd order, on the contrary, the parity progression ratio varies significantly according to the composition by sex of the siblings already born. More precisely, the probability is much higher when the first two births are female than in any of the three other cases. One can indeed hardly stop with the differences observed between these three other cases which are too slight to be significant. In Georgia, the probability of having a 3rd child after two daughters is 42%, although it is only between 18 and 26% in the three other cases. In Armenia, it is 57% against 33 to 38%.
This disparity in the parity progression ratio in the context of controlled fertility clearly indicates that in some cases son preference is strong enough to result in higher fertility when the composition by sex of children already born is unsatisfactory and lower when the reverse is the case. In the absence of any other information on the sex of the foetus, such a result can be achieved through contraception or induced abortion. However, higher fertility after the birth of two female children does not in itself have any consequences on the sex of the 3rd child.
V. The role of induced abortion
A sharp increase in sex ratio at birth in the Caucasus. Why? How?
11
The most probable hypothesis to explain the excess masculinity of births resulting from son preference is obviously selective induced abortion as has already been shown in India and China (Miller, 1996; Arnold et al., 1998; Croll, 2000; Das Gupta and Mari Bhat, 1997, Nanda and Véron, forthcoming), a hypothesis which has indeed been suggested for the Caucasus by some authors (Totadze, 2001; Donahue and Fortado, 2003). It now remains to be confirmed.
First, let us note that the scan, a relatively simple and cheap method of detecting the sex of a child in utero, appears to have started to spread in the countries of the Caucasus at the beginning of the 1990’s (AIHA, 2001; Eurasia Foundation, 2003; quoted by Donahue and Fortado, 2003).
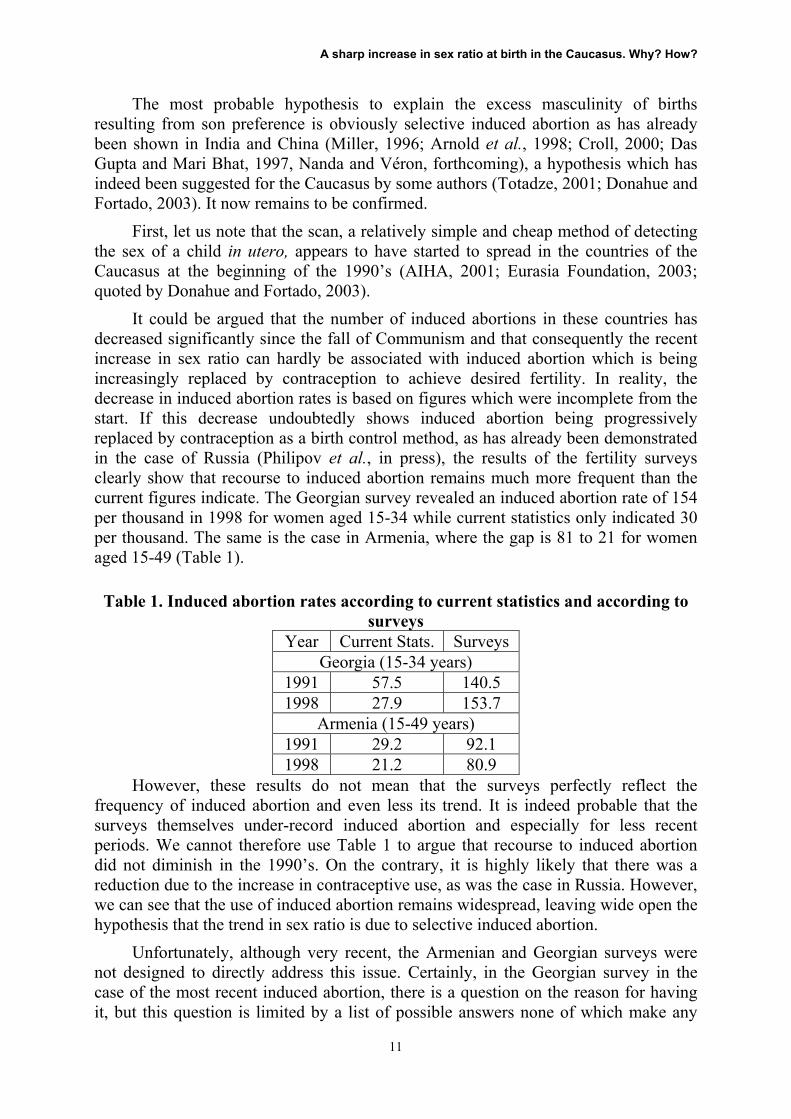
It could be argued that the number of induced abortions in these countries has decreased significantly since the fall of Communism and that consequently the recent increase in sex ratio can hardly be associated with induced abortion which is being increasingly replaced by contraception to achieve desired fertility. In reality, the decrease in induced abortion rates is based on figures which were incomplete from the start. If this decrease undoubtedly shows induced abortion being progressively replaced by contraception as a birth control method, as has already been demonstrated in the case of Russia (Philipov et al., in press), the results of the fertility surveys clearly show that recourse to induced abortion remains much more frequent than the current figures indicate. The Georgian survey revealed an induced abortion rate of 154 per thousand in 1998 for women aged 15-34 while current statistics only indicated 30 per thousand. The same is the case in Armenia, where the gap is 81 to 21 for women aged 15-49 (Table 1).
Table 1. Induced abortion rates according to current statistics and according to surveys
Year Current Stats. Surveys Georgia (15-34 years)
1991 57.5 140.5 1998 27.9 153.7
Armenia (15-49 years) 1991 29.2 92.1 1998 21.2 80.9
However, these results do not mean that the surveys perfectly reflect the frequency of induced abortion and even less its trend. It is indeed probable that the surveys themselves under-record induced abortion and especially for less recent periods. We cannot therefore use Table 1 to argue that recourse to induced abortion did not diminish in the 1990’s. On the contrary, it is highly likely that there was a reduction due to the increase in contraceptive use, as was the case in Russia. However, we can see that the use of induced abortion remains widespread, leaving wide open the hypothesis that the trend in sex ratio is due to selective induced abortion.
Unfortunately, although very recent, the Armenian and Georgian surveys were not designed to directly address this issue. Certainly, in the Georgian survey in the case of the most recent induced abortion, there is a question on the reason for having it, but this question is limited by a list of possible answers none of which make any
A sharp increase in sex ratio at birth in the Caucasus. Why? How?
12
allusion to a preference for one sex in particular5. We can therefore only attempt to confirm our hypothesis in an indirect way.
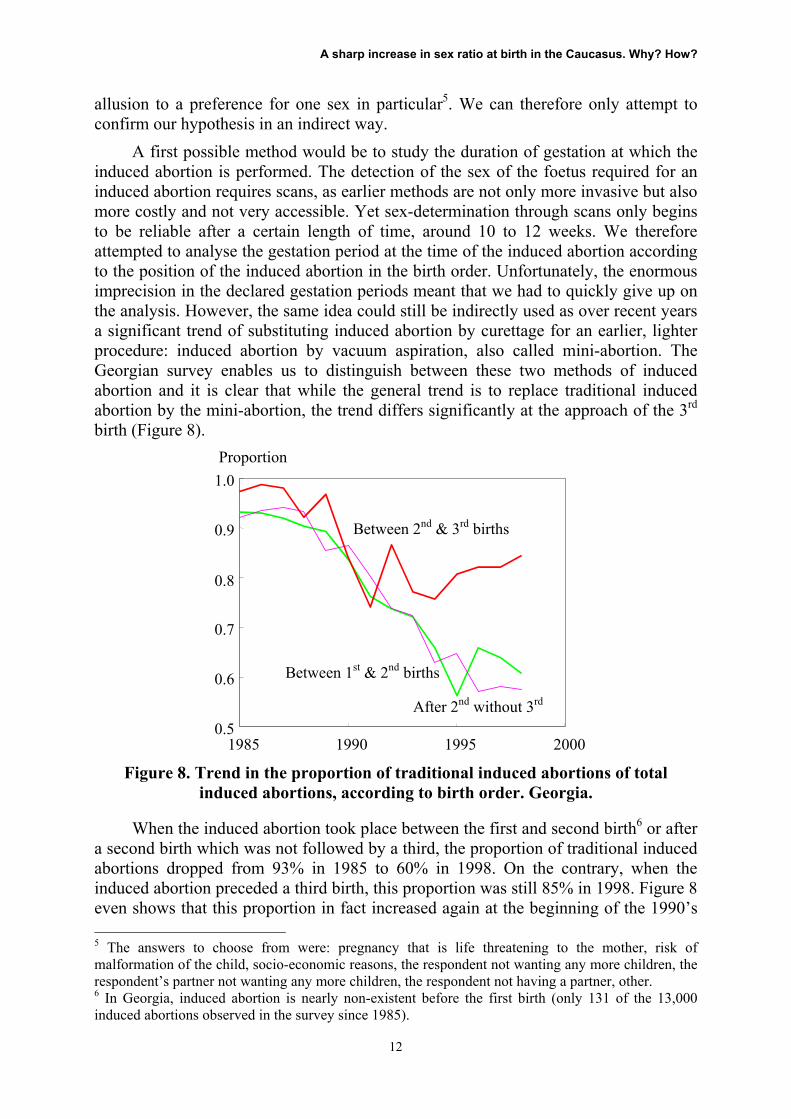
A first possible method would be to study the duration of gestation at which the induced abortion is performed. The detection of the sex of the foetus required for an induced abortion requires scans, as earlier methods are not only more invasive but also more costly and not very accessible. Yet sex-determination through scans only begins to be reliable after a certain length of time, around 10 to 12 weeks. We therefore attempted to analyse the gestation period at the time of the induced abortion according to the position of the induced abortion in the birth order. Unfortunately, the enormous imprecision in the declared gestation periods meant that we had to quickly give up on the analysis. However, the same idea could still be indirectly used as over recent years a significant trend of substituting induced abortion by curettage for an earlier, lighter procedure: induced abortion by vacuum aspiration, also called mini-abortion. The Georgian survey enables us to distinguish between these two methods of induced abortion and it is clear that while the general trend is to replace traditional induced abortion by the mini-abortion, the trend differs significantly at the approach of the 3rd birth (Figure 8).
0.5
0.6
0.7
0.8
0.9
1.0
1985 1990 1995 2000
Proportion
After 2nd without 3rd
Between 2nd & 3rd births
Between 1st & 2nd births
Figure 8. Trend in the proportion of traditional induced abortions of total
induced abortions, according to birth order. Georgia.
When the induced abortion took place between the first and second birth6 or after a second birth which was not followed by a third, the proportion of traditional induced abortions dropped from 93% in 1985 to 60% in 1998. On the contrary, when the induced abortion preceded a third birth, this proportion was still 85% in 1998. Figure 8 even shows that this proportion in fact increased again at the beginning of the 1990’s 5 The answers to choose from were: pregnancy that is life threatening to the mother, risk of malformation of the child, socio-economic reasons, the respondent not wanting any more children, the respondent’s partner not wanting any more children, the respondent not having a partner, other. 6 In Georgia, induced abortion is nearly non-existent before the first birth (only 131 of the 13,000 induced abortions observed in the survey since 1985).
A sharp increase in sex ratio at birth in the Caucasus. Why? How?
13
following a reduction similar to that of the two cases in the previous figure. It seems to us that this is a serious indicator of a possible recourse to induced abortion in order to satisfy the son preference observed above in the parity progression ratio.
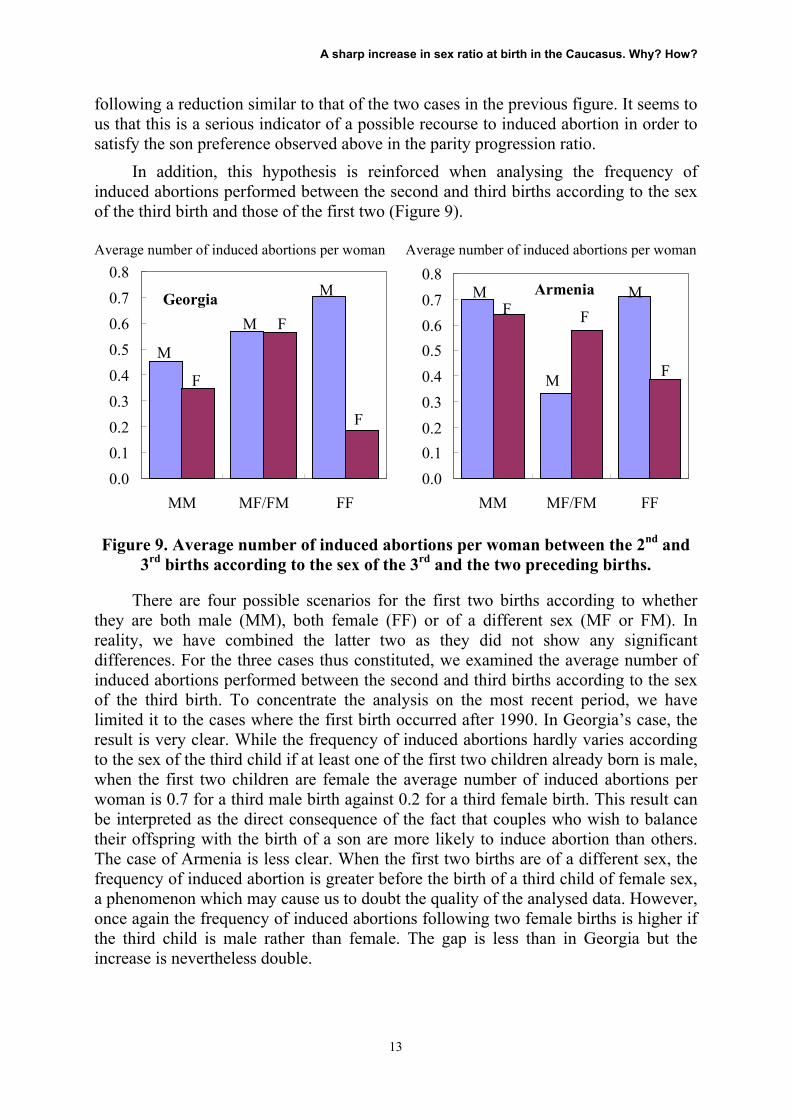
In addition, this hypothesis is reinforced when analysing the frequency of induced abortions performed between the second and third births according to the sex of the third birth and those of the first two (Figure 9).
0.0 0.1 0.2 0.3 0.4 0.5 0.6 0.7 0.8
MM MF/FM FF
M
M
M
F
F
F
Average number of induced abortions per woman
Georgia
0.00.10.20.30.40.50.60.70.8
MM MF/FM FF
F F
F
M
M
M Armenia
Average number of induced abortions per woman
Figure 9. Average number of induced abortions per woman between the 2nd and 3rd births according to the sex of the 3rd and the two preceding births.
There are four possible scenarios for the first two births according to whether they are both male (MM), both female (FF) or of a different sex (MF or FM). In reality, we have combined the latter two as they did not show any significant differences. For the three cases thus constituted, we examined the average number of induced abortions performed between the second and third births according to the sex of the third birth. To concentrate the analysis on the most recent period, we have limited it to the cases where the first birth occurred after 1990. In Georgia’s case, the result is very clear. While the frequency of induced abortions hardly varies according to the sex of the third child if at least one of the first two children already born is male, when the first two children are female the average number of induced abortions per woman is 0.7 for a third male birth against 0.2 for a third female birth. This result can be interpreted as the direct consequence of the fact that couples who wish to balance their offspring with the birth of a son are more likely to induce abortion than others. The case of Armenia is less clear. When the first two births are of a different sex, the frequency of induced abortion is greater before the birth of a third child of female sex, a phenomenon which may cause us to doubt the quality of the analysed data. However, once again the frequency of induced abortions following two female births is higher if the third child is male rather than female. The gap is less than in Georgia but the increase is nevertheless double.
A sharp increase in sex ratio at birth in the Caucasus. Why? How?
14
Conclusion
As convincing as these indicators may be, we do not have definitive proof that the increase in sex ratio at birth in the countries of the Caucasus is due to the spread of scans and the practice of selective induced abortion. Research must therefore continue.
A first step that should soon be possible would be to access the data of the Azerbaijan survey to check whether the observations made in Armenia and Georgia can also be made there.
Beyond this, an element that would enable progress to be made in this area would certainly be access to regional information on the real spread of scanning resources. Such information could be compared to geographic variations of sex ratio, a study which would be particularly interesting in Azerbaijan where we observed a contrast between the majority of the country and its Russian and Iranian fringes.
It would also be interesting to associate this research to an anthropological study which would enable us to better understand how a preference for the male sex, doubtless inherited from the Mediterranean culture, was able to withstand 70 years of Communist rule to suddenly re-emerge this way as soon as the technical facilities become available. It is also necessary to understand how such a phenomenon has been able to simultaneously affect three countries that differ in a number of socio-cultural aspects.
But the most decisive progress in explaining the phenomenon can probably only be found in new surveys which include questions specifically designed to achieve this objective. In the case of a future Gender and Generation survey, we have suggested the inclusion of a module on couples’ preferences regarding their children’s sex according to their fertility history.
A sharp increase in sex ratio at birth in the Caucasus. Why? How?
15
REFERENCES ADLAKHA Arjun and SUCHINDRAN C. M., 1985. – Infant and child mortality in middle eastern
countries, in: IUSSP (ed.), General Population Conference, Florence 1985, vol.2, p.367-376. – Liège, Ordina Editions, 456p.
AIHA (American International Health Alliance), 2001. – Armenia: partnerships report. (http://www.aiha.com/).
ANSS and ORC Macro, 2001. – Armenia demographic and health survey 2000. – Yerevan (Armenia): National Statistical Service, Ministry of Health and Calverton (Maryland): ORC, 370p.
ARNOLD Fred, CHOE Minja Kim and ROY T. K., 1998. – Son preference, the family building process and child mortality in India, Population Studies, vol.52, no.3, p.301-315.
BOOTH Beverly E., VERMA Manorama M. and BERI R. Singh, 1994. – Foetal sex determination in infants in Punjab, India: correlations and implications, British Medical Journal, vol.309, no.***, p.1259.
CHEKIR Hafedh and VALLIN Jacques, 2001. – Les déterminants de la santé et de la baisse de la mortalité, in: Jacques Vallin and Thérèse Locoh (dir.), Population et développement en Tunisie : la métamorphose, p.113-142. – Tunis, Cérès Éditions, 801p.
CHEN Lincoln C., HUQ Embadul and D'SOUZA Stan, 1981. – Sex bias in the allocation of food and health care in rural Bengladesh, Population and Development Review, vol. 7, no.1, p. 55-70.
CROLL Elisabeth, 2000. – Endangered daughters: Discrimination and development in Asia. – London and New York, Routledge, ***p.
DAS GUPTA Monica, 1987. – Selective discrimination against female children in rural Punjab, India Population and Development Review, vol.13, no.1, p.77-100.
DAS GUPTA Monica and MARI Bhat P. N, 1997. – Fertility decline and increased manifestation of sex bias in India, Population Studies, vol.51, no.3, p.307-315.
DONAHUE Dennis and FORTADO Jennifer, 2003. – Surprising sex ratios in the South Caucasus: son preferences in the Former Soviet States of Armenia, Azerbaijan and Georgia. - US Census Bureau. (Poster presented at 2003 Annual Meeting of the Population Association of America, Minneapolis, May 1-3, 2003).
EURASIA FOUNDATION, 2003. – A Eurasia Foundation grantee profile: making a difference in Northern Armenia. (http://www.eurasia.org/SuccessStories/article-armenia.htm ).
FERRY Nicole, 1979. – La femme et l'enfant en milieu rural algérien: étude sociologique et médicale de la maternité et du premier âge. – Lille, Université de Lille, 120 p. (Doctoral thesis in medicine).
HAFFAD Tahar, 1984. – Les différences de mortalité selon le sexe et leurs conséquences. – Paris, EHESS, 494p. (Doctoral thesis).
LADIER-FOULADI Marie, 2003. – Population et politique en Iran. De la monarchie à la république islamique. – Paris, INED et PUF, 356 p. (Les Cahiers de l'INED, n° 150).
MELADZE Giorgi and TSULADZE Giorgi, 1998. – skesta raodenobrivi tanapardoba [Sex ratio at birth], in: Giorgi MELADZE and Giorgi TSULADZE (eds.), saqartvelos mosakhleoba da demographiuli procesebi [Georgian population dynamics], p.68-78. – Tbilissi, IDSR, GAS, 102p.
MILLER Barbara D., 1996. – Chasing equality: the politics of sex selective abortion in Asia, in: IUSSP Committee on Anthropological Demography and Centre for Development Studies (ed.), Seminar on socio-cultural and political aspects of abortion in a changing world, Kovalam, Trivandrum, India, 25-28 March 1996, p.1-15. – Liège, IUSSP, multiple pagination.
NANDA Aswini K. and VÉRON Jacques, forthcoming. – Child Sex Ratio Imbalances, Fertility Behaviour and Development in India : Recent Evidence from Haryana and Punjab.
PHILIPOV Dimiter, ANDREEV Evgueni, KHARKOVA Tatiana and SHKOLNIKOV Vladimir, in press. – Recent trends in induced abortions in Russia and under-reporting in surveys, European Journal of Population,
SERBANESCU Florina, MORRIS Leo, NUTSUBIDZE Nick, IMNADZE Paapa and SHAKNAZAROVA Marina, 2001. – Women's reproductive health survey Georgia, 1999-2000. – Tbilisi (Georgia): NCDC, CMSI, and Atlanta (Georgia): CDC, 306p. + annexes.
SERBANESCU Florina, MORRIS Leo, NUTSUBIDZE Nick, IMNADZE Paapa and SHAKNAZAROVA Marina, 2001. – Women's reproductive health survey Georgia, 1999-2000. – Tbilisi (Georgia)
A sharp increase in sex ratio at birth in the Caucasus. Why? How?
16
and Atlanta (Georgia), National Center for Disease Control (NCDC), Center for Medical Statistics and Information (CMSI), Center for disease Control and Prevention (CDC) and United Nations Fund for Population Activities (UNFPA), 306p. + annexes.
TOTADZE Anzor, 2001. – akhali demographiuli saprtkhe [New demographic threat], demographia, vol. 2, no.4, p.73-80.
TSULADZE Giorgi and MELADZE Giorgi, 1998. – skesta raodenobrivi tanapardoba [Sex ratio at birth], in: Tsuladze Giorgi and Meladze Giorgi (ed.), demographiuli vitareba saqartveloshi, 1997 [Demographic situation in Georgia, 1997], p.45-50. – Tbilissi, IDSR, GAS and GCPR, 72 p.
TSULADZE Giorgi, MELADZE Giorgi and BADURASHVILI Irina, 1998. – skesta raodenobrivi tanapardoba saqartveloshi [Sex ratio at birth in Georgia], saqartvelo [Georgia], no.1, p.145-154.
VALLIN Jacques, 1978. – Un fait social, la surmortalité des petites filles en Algérie. – Paris, INED, 26p. (Paper presented at the 3rd Conference on the demography of the Maghreb, Tunis, 24-28 April 1978).
ZENG Yi, TU Ping, GU Baochang, XU Yi, LI Bohua and LI Yongping , 1993. – Causes and implications of the recent increase in the reported sex ratio at birth in China, Population Development Review, vol.19, no.2, p.283-302.
Related Documents


