Journal of Science and Technology Research 1(2) 2019 pp. 41-52 ISSN-2682-5821 41 A Selection of Drill Rigs using Overall Equipment Efficiency Approach a George Agyei, b Isaac Asamoah a Department of Mining Engineering, University of Mines and Technology, Tarkwa, Ghana b Asanko Gold Mine Ltd., Ashanti Region, Ghana ARTICLE INFORMATION ABSTRACT Article history: Received 15 April 2019 Revised 24 April 2019 Accepted 26 April 2019 Available online 13 June 2019 This paper examines the utilisation, availability and penetration rates of percussive Pantera drill rig fleet used in lower saprolite and the fresh ore profiles at Nkran Pit of Asanko Gold, Ghana. The adapted application of Overall Equipment Effectiveness (OEE) in drill rigs for the determination of penetration rates for mining operations is done. For the measurement of overall equipment effectiveness, it is necessary to determine the magnitude of the types of production losses in order to plan activities and allocate resources effectively. The availability and utilisation data from the field were analysed using graphical and analytical methods. The data collected on the projected annual metres as well as the rock characteristics of the various rock formations helped improve the planning of drilling operations. Analysis of the information from analytical and graphical sources suggested that the Pantera drill rigs were more productive in the transition zone. It was also determined that a total of five (5) active Pantera drill rigs would be required by the open pit mine to meet the projected annual metres of 543 027 m. The results obtained may serve as guide for the determination production indices of drill rigs in similar geologic formations for an effective mine planning. Keywords: OEE, Drill Rig, Penetration Rate, Availability, Utilisation, Mining Equipment 1. Introduction Overall Equipment Effectiveness (OEE) is elaborated in [1] to evaluate how equipment is utilized. OEE is an indicator of how well the equipment works as compared to its potentialities. The combination of OEE and Total Productive Maintenance (TPM) provide a good indicator that can lead to performance management priorities. OEE can be an important performance indicator for drilling machines, however the application of this concept for drill rigs for mining applications is scanty. [1] expresses OEE as a function of availability, performance and quality rates shown in Eq.(1). This concept reveals six main losses for computing availability performance and quality. The operating time is also negatively affected by downtime, speed and quality losses which are further divided on the basis of their concrete reasons. Fig.1 depicts that any time component of the operating system is affected by three losses like downtime, speed and quality losses. In Fig. 2, [2] proposes that the equipment must work for a full calendar year. The constituents of [2] model are shown in Fig. 2. The distinctive features between Jeong and Phillips and Nakajima are as follows: Jeong and Phillips model is based on full calendar year whilst Nakajima considers active time of the equipment for evaluating the OEE.

Welcome message from author
This document is posted to help you gain knowledge. Please leave a comment to let me know what you think about it! Share it to your friends and learn new things together.
Transcript
Journal of Science and Technology Research 1(2) 2019 pp. 41-52 ISSN-2682-5821
41
A Selection of Drill Rigs using Overall Equipment Efficiency Approach
aGeorge Agyei,
bIsaac Asamoah
a Department of Mining Engineering, University of Mines and Technology, Tarkwa, Ghana b Asanko Gold Mine Ltd., Ashanti Region, Ghana
ARTICLE
INFORMATION ABSTRACT
Article history:
Received 15 April 2019
Revised 24 April 2019
Accepted 26 April 2019
Available online 13 June 2019
This paper examines the utilisation, availability and penetration rates of
percussive Pantera drill rig fleet used in lower saprolite and the fresh ore
profiles at Nkran Pit of Asanko Gold, Ghana. The adapted application of
Overall Equipment Effectiveness (OEE) in drill rigs for the determination
of penetration rates for mining operations is done. For the measurement
of overall equipment effectiveness, it is necessary to determine the
magnitude of the types of production losses in order to plan activities and
allocate resources effectively. The availability and utilisation data from
the field were analysed using graphical and analytical methods. The data
collected on the projected annual metres as well as the rock
characteristics of the various rock formations helped improve the
planning of drilling operations. Analysis of the information from
analytical and graphical sources suggested that the Pantera drill rigs
were more productive in the transition zone. It was also determined that
a total of five (5) active Pantera drill rigs would be required by the open
pit mine to meet the projected annual metres of 543 027 m. The results
obtained may serve as guide for the determination production indices of
drill rigs in similar geologic formations for an effective mine planning.
Keywords: OEE, Drill Rig,
Penetration Rate, Availability,
Utilisation, Mining Equipment
1. Introduction
Overall Equipment Effectiveness (OEE) is elaborated in [1] to evaluate how equipment is
utilized. OEE is an indicator of how well the equipment works as compared to its
potentialities. The combination of OEE and Total Productive Maintenance (TPM) provide a
good indicator that can lead to performance management priorities. OEE can be an important
performance indicator for drilling machines, however the application of this concept for drill
rigs for mining applications is scanty. [1] expresses OEE as a function of availability,
performance and quality rates shown in Eq.(1). This concept reveals six main losses for
computing availability performance and quality. The operating time is also negatively
affected by downtime, speed and quality losses which are further divided on the basis of their
concrete reasons. Fig.1 depicts that any time component of the operating system is affected
by three losses like downtime, speed and quality losses.
In Fig. 2, [2] proposes that the equipment must work for a full calendar year. The constituents
of [2] model are shown in Fig. 2. The distinctive features between Jeong and Phillips and
Nakajima are as follows: Jeong and Phillips model is based on full calendar year whilst
Nakajima considers active time of the equipment for evaluating the OEE.

George Agyei, Isaac Asamoah / Journal of Energy Technology and Environment
1(2) 2019 pp. 41-52
42
Due to the distinctive approaches between these models, it is important to define the method
of analysis clearly before the evaluation of production systems. Active time approach gives
higher values for OEE index as compared to the calendar time models.
Conceptualised applications of OEE for drilling machines are found in [3]. For other mine
machinery, [4] applies OEE components for evaluating the performance of Bucket based
Excavating, Loading and Transport (BELT) equipment. A plethora of publications shows the
applicability of OEE in manufacturing industries [5]; [6]; [7]; [8]. Maintenance
methodologies have been put in place to improve truck availability and utilisation in open pit
mines [9]; [10]. However, limited attention is given to the impacts of drill rigs availability
and utilisation on mine production [3]. Given the holistic approach of the OEE and its
practical applications, the aim of this research is to translate the concept of OEE for MMU’s
equipment by introducing the appropriate methodologies and tools for measurement of OEE
in MMU’s in large scale mining operations. Therefore, the objective of this work is to
translate the OEE for drilling equipment by evolving appropriate methodologies and tools for
measurement of penetration rates to estimate the performance of drilling to determine the
number of drill rigs needed to match the projected annual meters at Nkran Pit of Asanco
Mine, Ghana.
Fig.1 The Components of OEE based on Nakajima’s Proposition [1]
The proposal of Nakajima defines OEE as directly proportional to availability, performance
and quality rates as expressed in Eq. (1).
QEE = Availability x Performance rate x Quality (1)
Deductions from
Fig.1 shows that OEE can be expressed as in Eq. (2) as follows;
LT
VOTOEE (2)
[2] considers the calculation of OEE using the calendar time in contrast to Nakajima’s
method which is centered on the loading time. The factors considered for the calculation of
OEE using [2] are shown in Fig. 2.
Basic Concept of OEE
Loading Time (LT)
Operating Time (OT)
Net Operating Time (NOT)
Valuable Operating Time (VOT) Quality
losses
Downtime
losses
Time Component Loss Component OEE Component
Availability rate = OT/LT
Speed
losses
Performance rate = NOT/OT
Quality rate = VOT/NOT
Equipment Failure
Set-up & Adjustment
Idling and minor stoppage
Reduced speed
Defect in process
Reduced yield

George Agyei, Isaac Asamoah / Journal of Energy Technology and Environment
1(2) 2019 pp. 41-52
43
Fig. 2. The OEE factors [2]
(3)
However, drill rigs in the mining industry have very limited adoption of OEE as a good
performance indicator. The concept of OEE and its application has not been fully realised in
the use of drilling in the mining industry.
Drilling is the initial step in hard rock open-pit mining. It goes hand-in-hand with the blasting
operation to ensure sufficient fragments for the excavation employed [11]. Drilling is
required for a variety of mining or mining-related activities including production, ground
support installation, hydrological studies, dewatering, and exploration and geotechnical
investigations [12].
Penetration rate is the most important parameter for drilling performance optimisation [13].
Penetration rate is the depth of penetration achieved per unit of time with a given type of
rock, drill, bit diameter and air or water pressure (m/hr.). Penetration rate (PR) is expressed in
Eq. (4) as:
LPR
T (4)
Penetration rate is a function of the impact energy imparted to the bit, frequency of impacts,
feed pressure, rotational speed, drill bit type, and rock mass properties. A typical drill unit is
capable of delivering 10 to 25 kW of energy to the drill string with an impact frequency
between 20 Hz and 70 Hz (impacts per second). The drill rotational speed ranges from 0 to
about 100 rpm, with the maximum for a given drillhole size defined by an angular speed at
the bit perimeter of approximately 0.4 m/s. Depending on the rock mass properties,
penetration rates of 0.5 – 2.5 m/min can be achieved. [10] , defines availability as the
probability that a piece of equipment is functioning satisfactorily at a specified time, when
used according to specified conditions, where the total time includes operating time, logistical
time, active repair time, and administrative time. Therefore, the equipment availability is the
proportion of time the equipment is able to be used for its intended purpose. Availability
reflects the part of the scheduled hours that the machine is mechanically and electrically
ready to be operated.
Availability is expressed in Eq. (5) as [14]:

George Agyei, Isaac Asamoah / Journal of Energy Technology and Environment
1(2) 2019 pp. 41-52
44
SSH MH BHA
SSH
(5)
The scheduled shift hours (SSH) is the total time available for the operation of the drill rig
during a shift. Such time excludes break times, change over times, safety/production meeting
times and other delays within the shift.
Maintenance hours (MH) represent the hours the drill rig is not available due to
planned/preventive maintenance schedule of the machine. This is also known as planned
downtime.
Breakdown hours (BH) represent the time that the drill rig is being repaired due to
unscheduled breakdowns. This may also be referred to as unplanned downtime.
Utilisation is the operational availability to the fraction of the available time that the drill rig
is actually operated. It is also referred to as the percentage or fraction of the scheduled shift
hours (SSH) that the machine does productive work. Events that may lead to the non-
utilisation of the machine include dozer works, delays in marking up and operator
convenience time. Other factors that may affect the utilisation of the rigs include competency
of mine personnel, efficiency of mine plan and support equipment commitment [14].
Utilisation is expressed in Eq. (6) as [15]:
SSH MH BH IHU
SSH
(6)
Idle hours (IH) represent the hours that the machine is mechanically and electrically ready to
be operated but is not utilised due to some of the factors listed earlier on.
The Nkran deposit is located within the Asankragwa gold belt, which is hosted along the axis
of the North East-striking Kumasi Basin, a meta-sedimentary group forming the upper portion
of the Birimian volcano-sedimentary sequence (supergene) group [16].
2. Methodology
To achieve the objective, the following methods were employed:
(i) Field visit and data collection; and
(ii) Graphical and statistical analysis of data.
The research was conducted at Nkran Pit of Asanko Gold Ghana Limited (Nkran pit) to
examine the performance of Pantera drill rigs on the various rock formations for the
determination the number of drill rigs needed to match the planned production.
The penetration rates of nine (9) Pantera drill rigs were determined in a systematic manner.
During the data collection, the daily drilling report per rig was taken into consideration. The
daily distance drilled and productive time per rig were considered for a period of eight (8)
working days both in the fresh and the transition zones. The projected penetration rate for the
Sandvick Pantera drill rigs at Asanko Gold Ghana Limited is 26 m/hr.

George Agyei, Isaac Asamoah / Journal of Energy Technology and Environment
1(2) 2019 pp. 41-52
45
The determination of the Number of Pantera Drill Rig (ND) to match the Projected Annual
Meters (PAM) was done using the following: Scheduled Time per Day (STD), Effective
Working Regime per Day (EWD), Meters Drilled per Day (MDD), Meters Drilled per Year
(MDY), Number of Drill Rigs (ND)
Scheduled Time per Day (STD) was determined using Eq. (7).
NSDSTFSTD , hours (7)
Effective Working Regime per Day was calculated using Eq. (8) as:
UASTDEWD (8)
For a particular drill rig; Meters Drilled per Day was determined using Eq. 9 as
EWDPRMDD (9)
The calculation of meters drilled by year was done using Eq. (9) as:
MDY = M DD × W Y
(10)
Number of drill rigs required was projected using Eq. (10).
MDR
TAMND (11)
The mythologies used in [3] and [4] were considered in the elaboration of the procedures for
this work. [3] discusses availability and utilisation of drill rigs and their impacts on output in
surface mine whilst [4] translates the concepts of OEE to Bucket based Excavation Loading
and Transport Equipment (BELT).
3. Results and Discussion
3.1 Rock Properties
The physical and mechanical properties of the massive rock intended for drilling have
significant effects on the penetration rate, bit wear and overall drilling costs. Hence, the
appraisal and understanding of the rock formation and its characteristics contribute to the
comprehensive analysis of the performance of the drill rig. However, the strength of the rock
(uniaxial compressive strength) has an appreciable influence on drilling force required and
the penetration rate. Table 1 presents summary of uniaxial compressive strength and specific
gravity of the various rock formations at Nkran pit.
Table 1: Summary of Rock Properties at Nkran Pit, AGGL
Rock
Formation
Uniaxial
Compressive
Strength (MPa)
Specific
Gravity
(g/cm3)
Oxide - 1.7
Transition 35 2.3
Fresh 75 2.7

George Agyei, Isaac Asamoah / Journal of Energy Technology and Environment
1(2) 2019 pp. 41-52
46
3.2 Penetration Rate of the Pantera Drill Rigs in the Transition Zone
In order to determine the penetration rate of the various Pantera drill rigs, the productive time
and the length drilled per drill rig for a period of eight (8) working days at Nkran West (lower
saprolite or transition zone) were taken. The results are shown in Table 2.
Table 2: Penetration Rate of the Various Pantera Drill Rigs in the Transition Zone
Drill Rig ID Productive Hours
(hr)
Meters Drilled
(m)
Penetration Rate
(m/hr)
HDR19 95.99 2303.20 23.99
HDR22 113.00 2892.00 25.59
HDR23 112.00 2612.50 23.33
HDR24 135.00 3472.50 25.72
HDR25 110.00 2744.00 24.95
HDR26 34.00 737.60 21.69
HDR27 114.00 3242.30 28.44
HDR28 136.00 4394.70 32.31
HDR29 106.00 3158.40 29.80
Average Penetration Rate (m/hr.) 26.20
3.3 Analysis of the Penetration Rate of the Pantera Drill Rigs in the Transition Zone
Fig.3 illustrates the penetration rates of nine (9) Pantera drill rigs used for the analysis at the
lower saprolite zone (transition zone) at Asanko Gold Mine Ghana Limited, Nkran Pit.
From Fig 3, HDR27, HDR28 and HDR29 exceeded the projected penetration rate of 26 m/hr.
whilst the penetration rates of the remaining rigs HDR19, HDR22, HDR23, HDR24, HDR25,
and HDR26 fell below the projected penetration rate of 26 m/hr. HDR27, HDR28 and
HDR29 are new versions of Sandvick DP 1500i Pantera drill rigs with high impact rate whilst
the remaining drill rigs are old versions with relatively low impact rate. The new versions
have an average impact rate of 3.80 m/min and the old versions have an impact rate of 3.06
m/min in the transition zone which probably accounted for the differences in the penetration
rates.

George Agyei, Isaac Asamoah / Journal of Energy Technology and Environment
1(2) 2019 pp. 41-52
47
Fig. 3 Graph of Penetration Rate versus Drill Rig ID in the Transition Zone
Penetration Rate of the Pantera Drill Rigs in the Fresh Zone
To determine the penetration rates of the various Pantera drill rigs at fresh zone, the
productive time and the length drilled per drill rig for a period of eight (8) working days at
Nkran East (fresh zone) were measured. The results are shown in Table 3.
Table 3: Penetration Rate of Various Pantera Drill Rigs in the Fresh Zone
Drill Rig ID Productive Hours
(hr.)
Meters Drilled
(m)
Penetration Rate
(m/hr.)
HDR19 86.00 1874.70 21.80
HDR22 140.00 3338.40 23.85
HDR23 135.00 3088.10 22.87
HDR24 137.00 3050.80 22.27
HDR25 102.00 2326.10 22.80
HDR26 60.90 1288.10 21.15
HDR27 132.00 3670.10 27.80
HDR28 103.00 3102.00 30.12
HDR29 133.00 3882.20 29.19
Average Penetration Rate (m/hr.) 24.65
23.99 25.59 23.33 25.72 24.95 21.69
28.44 32.31 29.80
0.00
10.00
20.00
30.00
40.00
Pen
etra
tion R
ate
(m/h
r)
Drill Rig ID
Penetration Rate (m/hr) Transition Zone
Actual Penetration Rate (m/hr)

George Agyei, Isaac Asamoah / Journal of Energy Technology and Environment
1(2) 2019 pp. 41-52
48
3.4 Analysis of the Penetration Rate of the Pantera Drill Rigs in the Fresh Zone
Fig. 4 illustrates the penetration rate versus the drill rig ID of the various Pantera drill rigs
whose performance were assessed at Nkran East (Fresh zone).
Fig. 4: Graph of Penetration Rate versus Drill Rig ID in the Fresh Zone
From Fig.4, HDR27, HDR28 and HDR29 outstripped the projected penetration rate of 26
m/hr. whilst the remaining rigs have their penetration rate below the projected penetration
rate of 26 m/hr. The new versions i.e. HDR27, HDR28 and HDR29 have relatively higher
frequency rock drills which deliver more impacts at a rate of 3.87 m/min with greater power
whilst the old versions have relatively low frequency rock drills which deliver less impacts at
a rate of 3.38 m/min with less power accounting for the differences in the penetration rates of
the Pantera drill rigs in the fresh zone.
3.5 Determination of the Number of Pantera Drill Rig to match the Projected Annual Meters
Based on Nakajima’s proposition, the overall equipment effectiveness of drill rig has been
transcribed and defined as a product of availability, utilisation, speed factors and operational
factors. Fig.5 shows that OEE and all the losses associated to time, speed, drill utilisation
deployed in the open pit. Operating factors include parameters related to the components of
the drilling unit, drill rod, bit, and the nature of the circulating fluid. These variables are
considered together with the specific environmental conditions. Other key variables
intimately related to the operating factors are drill power, axial trust, torque, blow energy,
blow frequency and rotary drill speed. Drillbility is associated with opposition of the rock to
penetration of a drilling instrument (Kramadibrata et al., 2001). Therefore, the application of
tensional force beyond the compressive strength of the rock will cause the rock to
disintegrate.
Drill Performance is related the following:
i. The cost of drilling per meter of drillhole;
ii. The ratio of the total maintenance cost per year to the meter drilled pert year;
iii. Ratio of breakdown hours to operation hours;
iv. Availability; and
v. Utilisation.
21.80 23.85 22.87 22.27 22.80 21.15 27.80 30.12 29.19
0.0020.0040.00
Pen
etra
tio
n R
ate
(m/h
r)
Drill Rig ID
Penetration Rate (m/hr) Fresh Zone
Actual Penetration Rate (m/hr)
Projected Penetration Rate (m/hr)

George Agyei, Isaac Asamoah / Journal of Energy Technology and Environment
1(2) 2019 pp. 41-52
49
Fig. 5 OEE components of drill rig equipment
Availability factor is related to the operation of the rig. It can be denoted as (A). Utilization
means the effective use of the equipment in available hours. It can be expressed as (U). Speed
factor explains the rate of planned productive time and the actual productive time of the rig.
Penetration factor (P) is associated with the productive use of the working organ of the drill
taking into consideration the actual penetration rate and the projected penetration. The
penetration factor is intimately dependent on parameters of the drill bit and the circulating
fluid. Consequently the mathematical relationship is expressed in Eq. (11).
OEE = A × U × S ×D (11)
Given the projected annual drilled length of 543 027 m , it is vital to determine the total
number of Pantera drill rigs that can accurately match the projected annual drilled length such
that the overall drilling cost can be minimised. Tables 4 provides the essential data required
to clearly determine the total number of Pantera drill rigs needed.
Table 4: Requirements for Determining the Number of Pantera Drill Rigs
Parameters Rock Formation
Average Transitional Zone Fresh Zone
Actual Availability (%) 90.56 88.89 89.73
Actual Utilisation (%) 63.26 67.83 65.55
Actual Penetration Rate (m/hr.) 26.20 24.65 25.43
George Agyei, Isaac Asamoah / Journal of Science and Technology Research
1(2) 2019 pp. 41-52
50
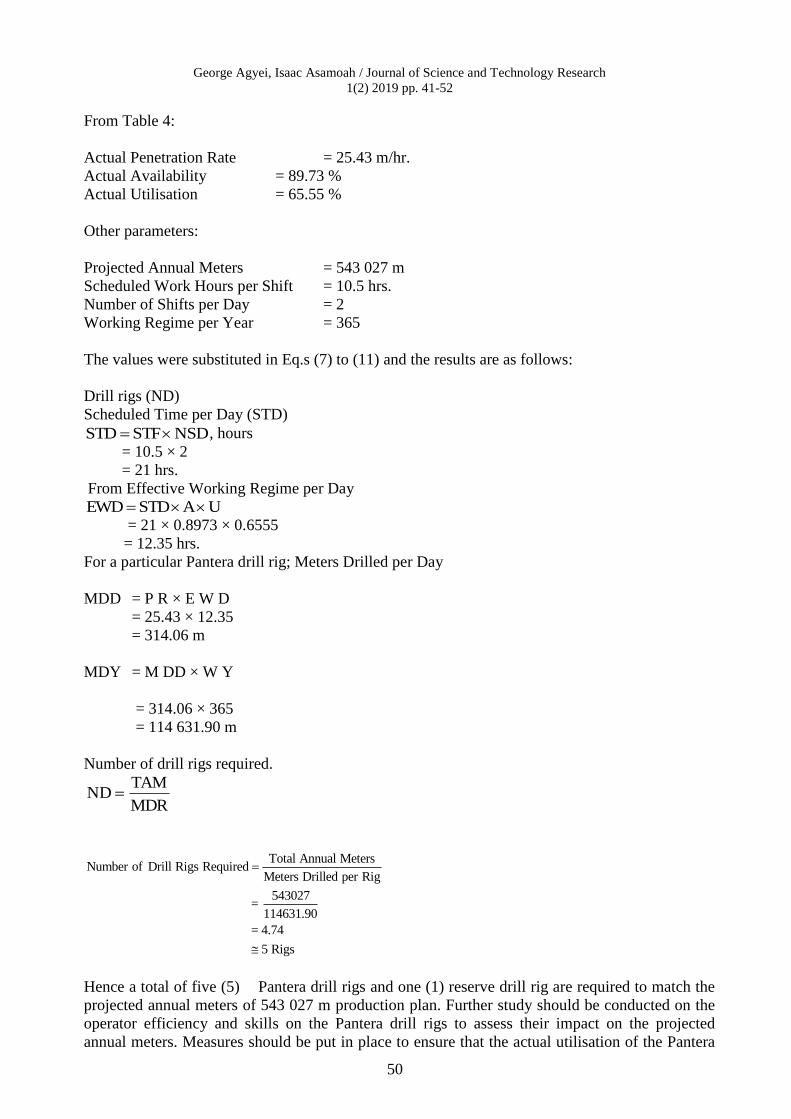
From Table 4:
Actual Penetration Rate = 25.43 m/hr.
Actual Availability = 89.73 %
Actual Utilisation = 65.55 %
Other parameters:
Projected Annual Meters = 543 027 m
Scheduled Work Hours per Shift = 10.5 hrs.
Number of Shifts per Day = 2
Working Regime per Year = 365
The values were substituted in Eq.s (7) to (11) and the results are as follows:
Drill rigs (ND)
Scheduled Time per Day (STD)
NSDSTFSTD , hours
= 10.5 × 2
= 21 hrs.
From Effective Working Regime per Day
UASTDEWD
= 21 × 0.8973 × 0.6555
= 12.35 hrs.
For a particular Pantera drill rig; Meters Drilled per Day
MDD = P R × E W D
= 25.43 × 12.35
= 314.06 m
MDY = M DD × W Y
= 314.06 × 365
= 114 631.90 m
Number of drill rigs required.
MDR
TAMND
Total Annual Meters
Meters Drilled per Rig
543027 =
114631.90
Number of Drill Rigs
Requ
= 4.
ired
74
5 Rigs
Hence a total of five (5) Pantera drill rigs and one (1) reserve drill rig are required to match the
projected annual meters of 543 027 m production plan. Further study should be conducted on the
operator efficiency and skills on the Pantera drill rigs to assess their impact on the projected
annual meters. Measures should be put in place to ensure that the actual utilisation of the Pantera

George Agyei, Isaac Asamoah / Journal of Science and Technology Research
1(2) 2019 pp. 41-52
51
drill rigs conforms to the AGGL’s projected utilisation of 85%. This technical assessment would
contribute to the methodology for the determination of production rigs fleets and the selection of
drills for similar geologic formation to ensure and efficient mine planning.
4. Conclusion
The application of Overall Equipment Efficiency for drill rigs with the use of appropriate
methodologies and tools for measurement of penetration rates to estimate the performance of
drilling to determine the number of drill rigs needed to match the projected annual meters at Nkran
Pit of Asanco Mine in Ghana was done.
Penetration rates in the transition and fresh zone and estimation of the performance of drill rig for
the calculation of the number of drill rigs that could be matched with the projected annual meters
have been determined. The average penetration rates are 26.20 m/hr. and 24.65 m/hr. in the
transition and fresh zone respectively. This might be attributed to the differences in the uniaxial
compressive strength of the various rock formations. A total of five (5) Pantera drill rigs would be
required to meet the projected annual meters of 543 027 m.
Nomenclature
L Length of Drill Hole
T Blast Hole Drilling Hours
A Equipment Availability
SSH Scheduled Shift Hours
MH Maintenance Hours
U Drill Rig Utilization
IH Idle Hour
STF Scheduled Work Time per Shift,
NSD Number of Shifts per Day
A,
Actual Availability
U Actual Utilisation
STD Scheduled Time per Day
PR Actual Penetration Rate
WY. Working Regime of the Year
TAM Total Annual Meters
MDR Meters Drilled per Rig

George Agyei, Isaac Asamoah / Journal of Science and Technology Research
1(2) 2019 pp. 41-52
52
References
[1] S. Nakajima (1988). Introduction to TPM- total productive maintenance. Productivity, Cambridge Press,
[2] K.Y. Jeong and D.T. Phillips (2001). Operational Efficiency and Effectiveness Measurement, .IJOPM, Vol.21,
No. 11, pp. 1404-1416.
[3] B.A. Kansake and R.S. Suglo (2015). Impact of availability and utilisation of drill on production at Kanjorle
Minerals Limited. International Journal of Science, Environment and Technology, Vol.4, No.6, pp. 1524-1537.
[4] M. Mohammadi, P. Rai, S. Gupta 2017. Performance evaluation of Bucket based Excavating, Loading and
Transport Equipment. Arch. Min. Sci. 62, 1, pp. 105-120.
[5] P.H. Tsarouhas 2013.Evaluation of overall Equipment effectiveness in the beverage industry. IJPR 51, 2, pp.
515-523.
[6] S. Zendied, S.A.N Nilipour, M. Ghandehary (2012) Evaluation of overall equipment effectiveness in a continuous
process production system of condensate stabilisation plant in Assaloyeh. IJCRB 3, 10, pp. 590-598.
[7] F. Anvari, R. Edwards A. Starr (2010).Methodology and theory evaluation of overall equipment effectiveness
based on market. JQME, 16(3), 256-270.
[8] H. Wibowo (2012). Analysis of Overall Equipment Effectiveness in improving productivity in the machine
processing creeper hammer mill crumb rubber. IJES 3, 2, pp. 52-60.
[9] S. Elevli and B. Elevli (2010).Performance Measurement of Mining Equipment by Utilizing OEE. Acta
Montanistica Slovaca Rocnik, 15(2,) 2010, pp. 95-101.
[10] B.S. Dhilton (2008). Mining Equipment Reliability, Maintainability and Safety. Springer. Verlag, London, pp
209.
[11] B. Chitwood and N.E Norman (1977). Blasthole Drilling Economics a Look at the Costs behind the Costs. Engr.
and Min. J, pp.300 – 301.
[12] J. Rostami and D.F Hambley (2011). Blasthole Drilling, In Darling. P. (ed.) Chap. 7.2 of SME Mining
Engineering Handbook. 3rd Edition, Vol. 1, Society for Mining, Metallurgy, and Exploration, Inc., pp. 435 –
441.
[13] S.A. Aalizad (2011). Prediction Penetration of Rotary-Percussive Drilling using Artificial Neural Networks. A
Case Study Sangan Iron mine Project (SIMP), Unpublished MSc Thesis, Islamic Azad University. Science and
Research Branch. Tehran, Iran. 179 pp.
[14] V.A. Temeng (2015) Surface Mining Systems. Unpublished BSc. Lecture Notes University of Mines and
Technology. Tarkwa. .
[15] P. Rai (2004). Performance Assessment of Draglines in Opencast Mines. Indian J. of Engr.and Mat. Sci. Vol. 11:
493 – 498.
[16] D James (2014). Nkran 3D Geological Model and Constraints on Mineralisation. Asanko Gold Inc. PMI Gold
Corp. Asanko Gold Ghana Limited, Ghana
[17] S. Kramadibrata, A.R. Made, J. Juanda, G.M. Simangunsong, N. Priagun (2001). The use of dimensional
analysis to anlyse the relationship between penetration rate of Jack Hammer and rock properties and
operational characteristics Proceedings of Indonesian Mining Conference and Exhibition, Jakarta, Indonesia,
pp. 7 – 8.
Related Documents