A Score Function for Optimizing the Cycle-Life of Battery-Powered Embedded Systems Erik Ramsgaard Wognsen 1(B ) , Boudewijn R. Haverkort 2 , Marijn Jongerden 2 , Ren´ e Rydhof Hansen 1 , and Kim Guldstrand Larsen 1 1 Aalborg University, Aalborg, Denmark {erw,rrh,kgl}@cs.aau.dk 2 University of Twente, Enschede, The Netherlands {b.r.h.m.haverkort,m.r.jongerden}@utwente.nl Abstract. An ever increasing share of embedded systems is powered by rechargeable batteries. These batteries deteriorate with the number of charge/discharge cycles they are subjected to, the so-called cycle life. In this paper, we propose the wear score function to compare and evalu- ate the relative impact of usage (charge and discharge) profiles on cycle life. The wear score function can not only be used to rank different usage profiles, these rankings can also be used as a criterion for optimizing the overall lifetime of a battery-powered system. We perform such an optimization on a nano-satellite case study provided by the company GomSpace. The scheduling of the system is modelled as a network of (stochastic) weighted timed games. In a stochas- tic setting, exact optimization is very expensive. However, the recently introduced Uppaal Stratego tool combines symbolic synthesis with statistical model checking and reinforcement learning to synthesize near- optimal scheduling strategies subject to possible hard timing-constaints. We use this to study the trade-off between optimal short-term dynamic payload selection and the operational life of the satellite. 1 Introduction Battery-powered devices are ubiquitous: Satellites, pacemakers, sensor networks, laptops, tablets, smartphones, etc. Electric cars are also becoming popular. But while batteries provide portable power, they only do this for a limited period of time, be it a day or several years. Primary (non-rechargeable) batteries by defi- nition need replacement when they run out, but even secondary (rechargeable) batteries deteriorate with time and use. This is due to various unwanted chem- ical reactions which accompany the desired reactions that bind and release the chemically stored energy. Predicting this wear is important for battery-powered systems. For those systems that are not easily serviceable, such as unmanned spacecraft and sensors embedded in bridges and buildings, predicting the wear on secondary batteries is a central part of predicting the total system lifetime. This work is supported by the 7th EU Framework Program under grant agreement 318490 (SENSATION — Self Energy-Supporting Autonomous Computation). c Springer International Publishing Switzerland 2015 S. Sankaranarayanan and E. Vicario (Eds.): FORMATS 2015, LNCS 9268, pp. 305–320, 2015. DOI: 10.1007/978-3-319-22975-1 20

Welcome message from author
This document is posted to help you gain knowledge. Please leave a comment to let me know what you think about it! Share it to your friends and learn new things together.
Transcript
A Score Function for Optimizing the Cycle-Lifeof Battery-Powered Embedded Systems
Erik Ramsgaard Wognsen1(B), Boudewijn R. Haverkort2, Marijn Jongerden2,Rene Rydhof Hansen1, and Kim Guldstrand Larsen1
1 Aalborg University, Aalborg, Denmark{erw,rrh,kgl}@cs.aau.dk
2 University of Twente, Enschede, The Netherlands{b.r.h.m.haverkort,m.r.jongerden}@utwente.nl
Abstract. An ever increasing share of embedded systems is poweredby rechargeable batteries. These batteries deteriorate with the numberof charge/discharge cycles they are subjected to, the so-called cycle life.In this paper, we propose the wear score function to compare and evalu-ate the relative impact of usage (charge and discharge) profiles on cyclelife. The wear score function can not only be used to rank different usageprofiles, these rankings can also be used as a criterion for optimizing theoverall lifetime of a battery-powered system.
We perform such an optimization on a nano-satellite case studyprovided by the company GomSpace. The scheduling of the system ismodelled as a network of (stochastic) weighted timed games. In a stochas-tic setting, exact optimization is very expensive. However, the recentlyintroduced Uppaal Stratego tool combines symbolic synthesis withstatistical model checking and reinforcement learning to synthesize near-optimal scheduling strategies subject to possible hard timing-constaints.We use this to study the trade-off between optimal short-term dynamicpayload selection and the operational life of the satellite.
1 Introduction
Battery-powered devices are ubiquitous: Satellites, pacemakers, sensor networks,laptops, tablets, smartphones, etc. Electric cars are also becoming popular. Butwhile batteries provide portable power, they only do this for a limited period oftime, be it a day or several years. Primary (non-rechargeable) batteries by defi-nition need replacement when they run out, but even secondary (rechargeable)batteries deteriorate with time and use. This is due to various unwanted chem-ical reactions which accompany the desired reactions that bind and release thechemically stored energy. Predicting this wear is important for battery-poweredsystems. For those systems that are not easily serviceable, such as unmannedspacecraft and sensors embedded in bridges and buildings, predicting the wearon secondary batteries is a central part of predicting the total system lifetime.
This work is supported by the 7th EU Framework Program under grant agreement318490 (SENSATION — Self Energy-Supporting Autonomous Computation).
c© Springer International Publishing Switzerland 2015S. Sankaranarayanan and E. Vicario (Eds.): FORMATS 2015, LNCS 9268, pp. 305–320, 2015.DOI: 10.1007/978-3-319-22975-1 20

306 E.R. Wognsen et al.
For serviceable systems, prediction can be part of calculating the maintenancecost of the complete battery-powered system.
As part of design space exploration, a system designer may propose a setof possible system designs that use the battery differently. To help evaluatethese designs, he or she may consult battery documentation and data sheetsbut will often find that the manufacturer has only included limited performanceand endurance data. Another option is therefore to test the proposed designs inexperiments with physical batteries. However, these tests can be prohibitivelyslow and expensive, even with accelerated testing techniques that wear out thebattery faster at artificially high temperatures.
To greatly reduce the effort required for this part of the design space explo-ration, we propose a scoring function that takes as input a battery usage profile(state-of-charge time-series) obtained from system simulation, for example. Tobe able to analyze complicated workloads that cannot easily be decomposedinto alternating phases of discharging and full recharging, we analyze the usageprofile in the frequency domain. The advantage of our approach is that we pro-vide a fully model-based evaluation approach for the performance and lifetimeof battery-powered systems.
We demonstrate the feasibility of our approach on a nano-satellite case study,provided by the company GomSpace, in which we examine the trade-off betweenshort-term dynamic payload selection and the operational life of the satellite.We do this by combining the wear score function with a timed automata-basedsystem model, which is then subjected to near-optimization using reinforcementlearning as provided by the new tool Uppaal Stratego.
This paper is organized as follows. Section 2 introduces the Uppaal Strat-ego tool, Section 3 introduces batteries and battery degradation, Section 4introduces our wear score function, and Section 5 puts it all together in ourcase study. Section 6 discusses limitations and assumptions, Section 7 considersrelated work, and Section 8 concludes.
2 Uppaal Stratego
For the model-based evaluation we will use (weighted and stochastic) timedautomata (and games), exploiting the tool Uppaal Stratego [2] being a novelbranch of the Uppaal tool suite that allows to generate, optimize, compare andexplore consequences and performance of strategies synthesized for stochasticpriced timed games (SPTG) in a user-friendly manner. In particular, UppaalStratego comes with an extended query language (see Appendix A), wherestrategies are first class objects that may be constructed, compared, optimizedand used when performing (statistical) model checking of a game under theconstraints of a given synthesized strategy.
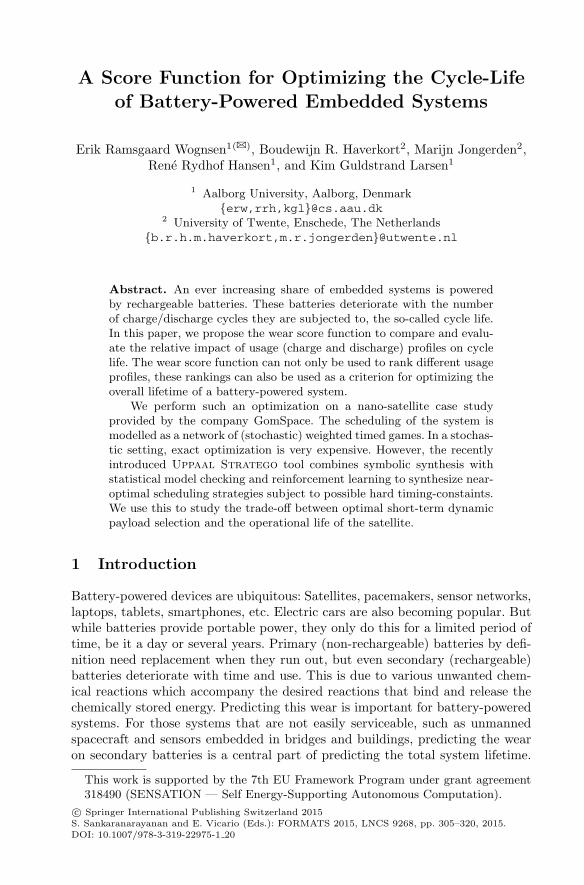
To illustrate the features of Uppaal Stratego, let us look at the example inFig. 1, providing an “extended” timed automata model of a small task with twophases. In the first phase the task must choose between two treatments indicatedby the location A and U differing in time (up to 100 time-units respectively 50
A Score Function for Optimizing the Cycle-Life 307
Fig. 1. A small task with two phases.
time-units) and cost-rate (3 respectively 10). Similarly, in the second phase, thetask must choose between two treatments indicated by locations B and V againdiffering in time and cost-rate. Whereas the choice of treatment in the two phasesis up to the task to control (indicated by the solid transitions), the actual time ofthe treatment is left to an uncontrollable environment (indicated by the dashedtransitions). In one scenario, the objective of the task is to make choices that willensure a given completion time regardless of a possible antagonistic environment.Under this interpretation, Fig. 1 represents a timed game. However, it may alsobe seen as a stochastic priced timed game (SPTG), assuming that the durationof the uncontrollable treatments are chosen by uniform distributions, and theobjective of the control strategy is to optimize the expected completion time, orthe expected completion cost (e.g. the cost-rate c’==3 in location A indicatesthat the cost variable c grows with rate 3 in this location).
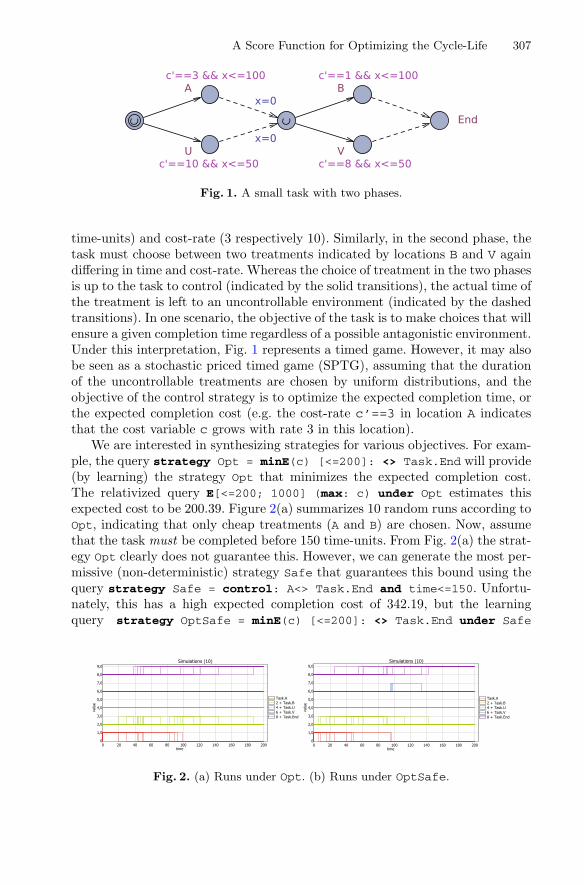
We are interested in synthesizing strategies for various objectives. For exam-ple, the query strategy Opt = minE(c) [<=200]: <> Task.End will provide(by learning) the strategy Opt that minimizes the expected completion cost.The relativized query E[<=200; 1000] (max: c) under Opt estimates thisexpected cost to be 200.39. Figure 2(a) summarizes 10 random runs according toOpt, indicating that only cheap treatments (A and B) are chosen. Now, assumethat the task must be completed before 150 time-units. From Fig. 2(a) the strat-egy Opt clearly does not guarantee this. However, we can generate the most per-missive (non-deterministic) strategy Safe that guarantees this bound using thequery strategy Safe = control: A<> Task.End and time<=150. Unfortu-nately, this has a high expected completion cost of 342.19, but the learningquery strategy OptSafe = minE(c) [<=200]: <> Task.End under Safe
Fig. 2. (a) Runs under Opt. (b) Runs under OptSafe.
308 E.R. Wognsen et al.
Pstochastic priced timed game
P|σ σ◦strategy
P|σ◦stochastic timed atomata(statistical model checking)
Gtimed game
σstrategy
G|σtime automata
((statistical)model checking)
abstraction
(optimization)Learning
min E(C)
(synthesis)Uppaal Tiga
φ
Fig. 3. Overview of Uppaal Stratego
will provide a sub-strategy OptSafe optimizing the expected completion cost– here found to be 279.87 – subject to the constraints of Safe. Figure 2(b)summarizes 10 random runs according to SafeOpt, indicating that only thetreatment U is never chosen. Model checking confirms that treatment B mayonly be chosen in case the first phase is completed before 50 time-units by theunsatisfiable query E<> Task.B and time>=51 and Task.x==0 under Safe.
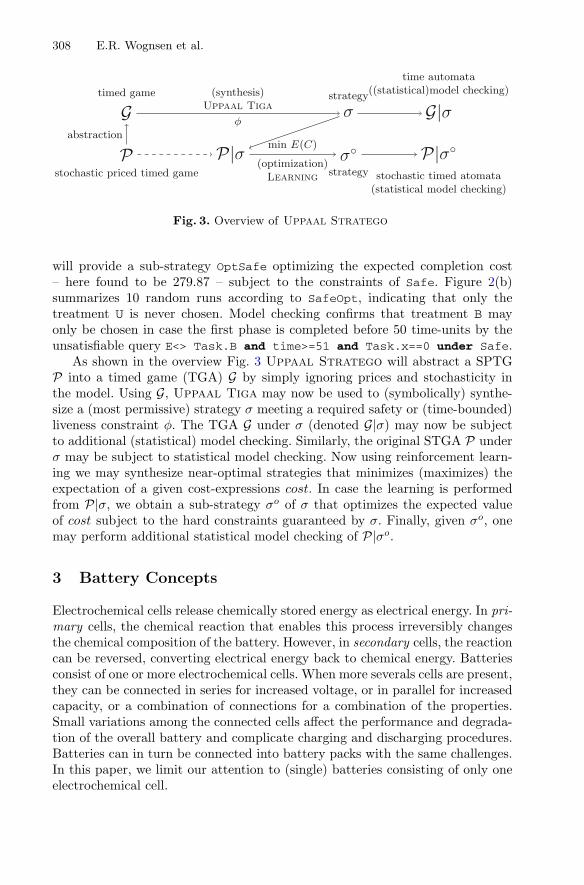
As shown in the overview Fig. 3 Uppaal Stratego will abstract a SPTGP into a timed game (TGA) G by simply ignoring prices and stochasticity inthe model. Using G, Uppaal Tiga may now be used to (symbolically) synthe-size a (most permissive) strategy σ meeting a required safety or (time-bounded)liveness constraint φ. The TGA G under σ (denoted G|σ) may now be subjectto additional (statistical) model checking. Similarly, the original STGA P underσ may be subject to statistical model checking. Now using reinforcement learn-ing we may synthesize near-optimal strategies that minimizes (maximizes) theexpectation of a given cost-expressions cost. In case the learning is performedfrom P|σ, we obtain a sub-strategy σo of σ that optimizes the expected valueof cost subject to the hard constraints guaranteed by σ. Finally, given σo, onemay perform additional statistical model checking of P|σo.
3 Battery Concepts
Electrochemical cells release chemically stored energy as electrical energy. In pri-mary cells, the chemical reaction that enables this process irreversibly changesthe chemical composition of the battery. However, in secondary cells, the reactioncan be reversed, converting electrical energy back to chemical energy. Batteriesconsist of one or more electrochemical cells. When more severals cells are present,they can be connected in series for increased voltage, or in parallel for increasedcapacity, or a combination of connections for a combination of the properties.Small variations among the connected cells affect the performance and degrada-tion of the overall battery and complicate charging and discharging procedures.Batteries can in turn be connected into battery packs with the same challenges.In this paper, we limit our attention to (single) batteries consisting of only oneelectrochemical cell.
A Score Function for Optimizing the Cycle-Life 309
0.0 0.5 1.0 1.5 2.0
Time [hours]
Stat
e of
Cha
rge
0.0
0.5
1.0
1.0
0.5
0.0
Dep
th o
f Dis
char
geDischarge Recharge
Cycle
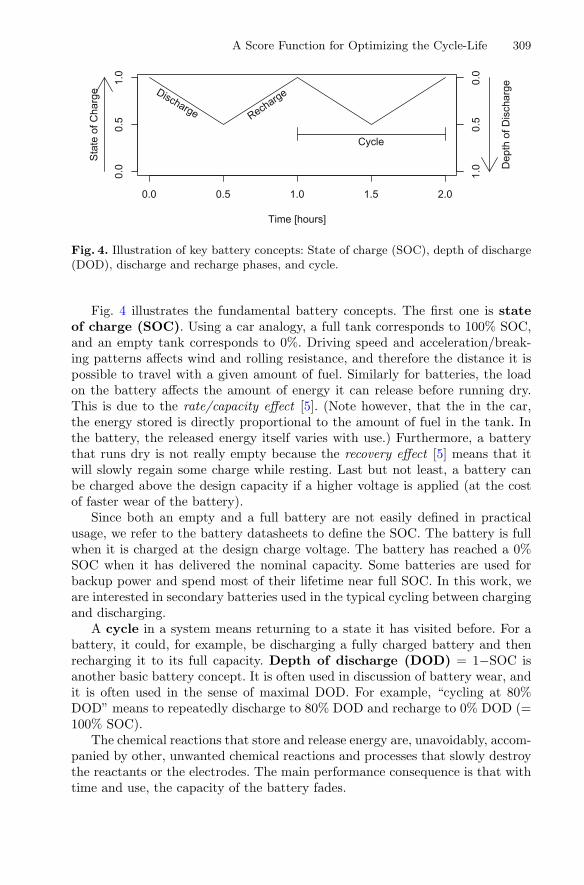
Fig. 4. Illustration of key battery concepts: State of charge (SOC), depth of discharge(DOD), discharge and recharge phases, and cycle.
Fig. 4 illustrates the fundamental battery concepts. The first one is stateof charge (SOC). Using a car analogy, a full tank corresponds to 100% SOC,and an empty tank corresponds to 0%. Driving speed and acceleration/break-ing patterns affects wind and rolling resistance, and therefore the distance it ispossible to travel with a given amount of fuel. Similarly for batteries, the loadon the battery affects the amount of energy it can release before running dry.This is due to the rate/capacity effect [5]. (Note however, that the in the car,the energy stored is directly proportional to the amount of fuel in the tank. Inthe battery, the released energy itself varies with use.) Furthermore, a batterythat runs dry is not really empty because the recovery effect [5] means that itwill slowly regain some charge while resting. Last but not least, a battery canbe charged above the design capacity if a higher voltage is applied (at the costof faster wear of the battery).
Since both an empty and a full battery are not easily defined in practicalusage, we refer to the battery datasheets to define the SOC. The battery is fullwhen it is charged at the design charge voltage. The battery has reached a 0%SOC when it has delivered the nominal capacity. Some batteries are used forbackup power and spend most of their lifetime near full SOC. In this work, weare interested in secondary batteries used in the typical cycling between chargingand discharging.
A cycle in a system means returning to a state it has visited before. For abattery, it could, for example, be discharging a fully charged battery and thenrecharging it to its full capacity. Depth of discharge (DOD) = 1−SOC isanother basic battery concept. It is often used in discussion of battery wear, andit is often used in the sense of maximal DOD. For example, “cycling at 80%DOD” means to repeatedly discharge to 80% DOD and recharge to 0% DOD (=100% SOC).
The chemical reactions that store and release energy are, unavoidably, accom-panied by other, unwanted chemical reactions and processes that slowly destroythe reactants or the electrodes. The main performance consequence is that withtime and use, the capacity of the battery fades.
310 E.R. Wognsen et al.
The rate of deterioration depends, among other things, on the maximal DODreached, the rate of charge and discharge, temperature, dwelling at high and lowSOC, and overcharging [3]. The maximal DOD that is discharged to is especiallyimportant, and can be the only focus of battery manufacturers’ datasheets. Forexample, one battery is expected to reach end-of-life (80% capacity remaining)after 350 cycles at 100% DOD, 1000 cycles at 50%, and 1700 cycles at at 25%1.This kind of data can be good enough for simple workloads and system designs,but is not enough for advanced workloads, which motivates our approach.
4 The Wear Score Function for SOC-Profiles
In the discussion of battery powered systems with complicated workloads, thedefinition of a cycle from Section 3 often falls short because it is too precise.Consider, for example, a fully charged battery (100% SOC) that is dischargedto 20%, recharged to 90%, discharged again to 20%, then recharged to 100%.According to the precise definition, this trajectory from 100% to 100% is onecycle, but from a battery application point of view, it is very close to being twocycles in the sense of “discharge-then-recharge”.
Not only is this very likely usage of a battery difficult to discuss, but it is alsounlikely that a battery data sheet will say anything about the expected batterylifetime for this type of load. To circumvent this issue, we propose to examineSOC profiles in the frequency domain. Using the discrete Fourier transform, weconvert the SOC profile (time-series) into a frequency spectrum containing allcomponent frequencies and their magnitudes. The discrete Fourier transformis computed by the Fast Fourier transform (FFT) algorithm, which outputs asequence of complex numbers. The moduli (absolute values) of these numberscorrespond to the magnitudes of the component frequencies. If the SOC profileis a sequence S = s1s2 . . . sn of SOC values sampled at frequency f , its score is
wsf(S, f) =2f
n
�n/2�∑
i=0
i|F(S)i|2 (1)
where |F(S)i| is the modulus of the ith element of the output of the FFTfunction on S. The input consists only of real numbers, i.e., complex numberswith imaginary part zero. Therefore, only the first half of the FFT output (belowthe Nyquist frequency) is relevant to us. Hence, the sequence is summed up toindex �n/2�, and the multiplied by 2 to account for the frequencies lost abovethe Nyquist frequency. The fraction fi
n (distributed inside and outside the sum)is the frequency corresponding to the FFT magnitude at index i. The outsidefraction 2f
n does not affect ordering of scores, but it does bring them into acomfortable order of magnitude.
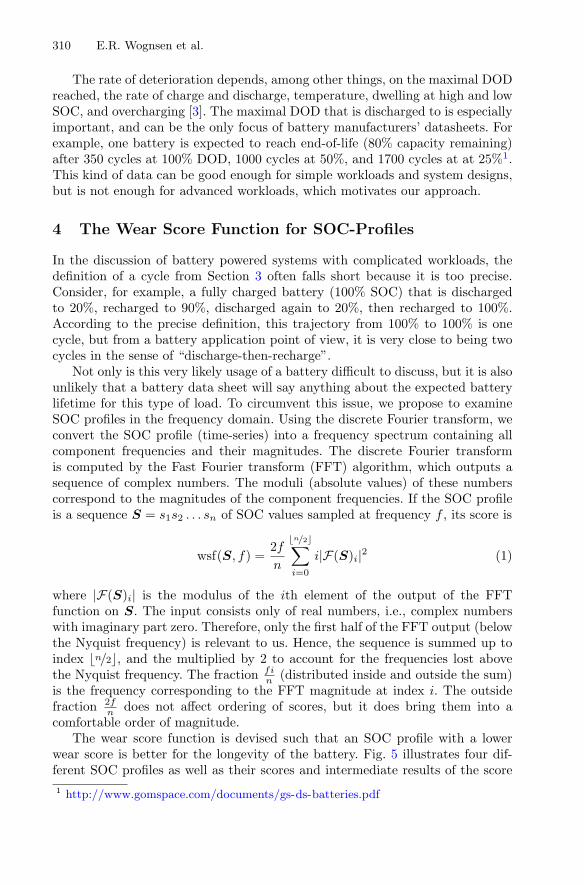
The wear score function is devised such that an SOC profile with a lowerwear score is better for the longevity of the battery. Fig. 5 illustrates four dif-ferent SOC profiles as well as their scores and intermediate results of the score1 http://www.gomspace.com/documents/gs-ds-batteries.pdf
A Score Function for Optimizing the Cycle-Life 311
0 1 2 3 4 5 6
0.0
0.5
1.0
Time (hours)
Profile ASO
C
0 1 2 3 4 5 6
0.0
0.5
1.0
Time (hours)
Profile B
0 1 2 3 4 5 6
0.0
0.5
1.0
Time (hours)
Profile C
0 1 2 3 4 5 6
0.0
0.5
1.0
Time (hours)
Profile D
0.0 0.5 1.0 1.5
0.0
0.6
Frequency (mHz)
Score 0.13
0.0 0.5 1.0 1.50.
00.
6
Frequency (mHz)
Score 0.26
0.0 0.5 1.0 1.5
0.0
0.6
Frequency (mHz)
Score 0.52
0.0 0.5 1.0 1.5
0.0
0.6
Frequency (mHz)
Score 1.04
Fig. 5. Four example SOC profiles and their scores.
calculation. The FFT-like plots in fact show the magnitudes of the SOC oscil-lations at the component frequencies fi
n for i = 0, . . . , �n/2� (not to be confusedwith the sampling frequency, f). Each value is thus an element in the sequence2fin |F(S)|2, with modulus, exponentiation, and multiplication applied element-
wise on the sequence. The wear score is the sum of this sequence. In the plot,the frequency axes are truncated to zoom in on the interesting harmonics.
Comparing profiles A and B, we see discharging to the same DOD (50%), buta doubling of the charge rate, discharge rate, the number of cycles that can becompleted in the same time frame, and finally, the score. The same applies whencomparing C and D. In these two simple comparisons, the score is proportional tothe number of cycles/time, which conforms with the general idea that a batterycan sustain a fixed number of cycles at a given DOD.
Comparing profiles B and C, we see that the same amount of charge is deliv-ered — equivalent to three full capacities discharged in six hours. However, profileC discharges to twice the DOD while delivering this charge. This also increasesthe score because a higher DOD wears out the battery faster, even when thesame charge is delivered. This matches what [3] cites as Symon’s [7] Premise 2:“The charge life of the cell will always [. . . ] be greater than [the rated charge life]when the battery is cycled less deeply.” In other words, shallow DOD cyclingimproves the total amp-hour throughput in the lifetime of a battery.
The above examples serve only to test the wear score function on simpleworkloads, like those found in battery datasheets. The strength of the wearscore function is however its ability to accept arbitrarily complicated workloads,including those mentioned at the beginning of this section. To demonstrate this,we turn to the nano-satellite case study in Section 5.
5 Nano-satellite Case Study
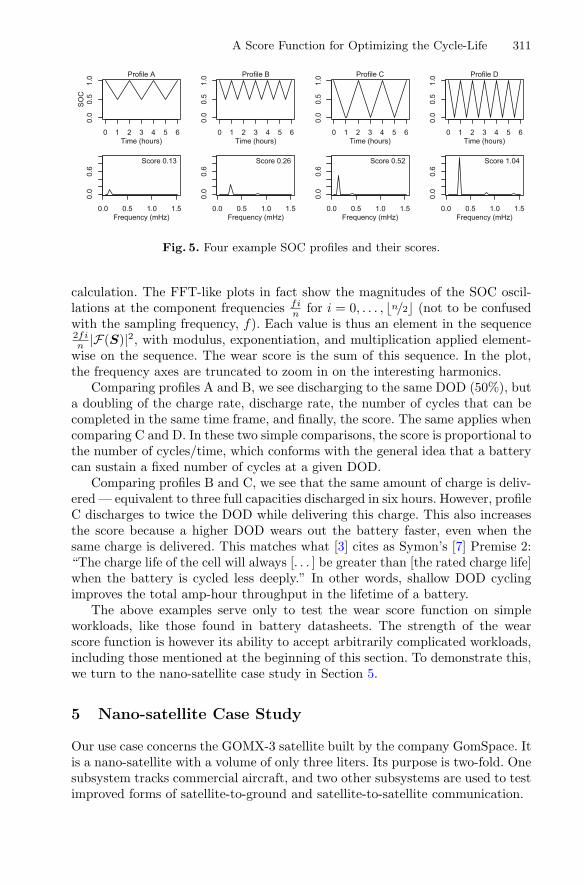
Our use case concerns the GOMX-3 satellite built by the company GomSpace. Itis a nano-satellite with a volume of only three liters. Its purpose is two-fold. Onesubsystem tracks commercial aircraft, and two other subsystems are used to testimproved forms of satellite-to-ground and satellite-to-satellite communication.
312 E.R. Wognsen et al.
ADS-B antenna
X-band patch antenna
L-band patch antenna
4x UHF antennaSolar panels
Fig. 6. The GOMX-3 nano-satellite
5.1 System Description
As you can see in Fig. 6, the satellite is covered in solar panels, and four differ-ent types of antennas for radio communication are attached. On the inside, itpacks circuitry for all the radios, reaction wheels and magnetic coils for attitude(orientation) control, a main computer, and a battery.
The ADS-B system continuously tracks aircraft to assist ground-based sys-tems, such as those in Europe and North America that cannot “see” the air-craft over the Atlantic Ocean. The UHF radio is the tried and tested means forreceiving commands from the ground station and sending measurements back.The X-band radio is for experimenting with higher throughput ground commu-nication. The L-band radio is for testing satellite-to-satellite communication.
Due to the locations of the antennas on the satellite body, only one of themcan be pointed towards its target at a time (using the attitude control system).Therefore, for each orbit the satellite makes around the Earth, a single type ofcommunication is chosen, referred to as an orbit type. An orbit takes 90 minutes.
The four radios on the satellite consume a lot of energy, and the small numberof solar panels can only generate a limited amount of energy. The challenge is,therefore, to do the most useful work with the available energy. Useful work canbe seen from different perspectives. From a short-term perspective, the focus ison the number of experiments done in a short time-frame such as a week. Butas we know from Section 3, the battery wears out with use. So from a long-termperspective, more work done every week means that the battery, and thereforethe satellite, will last fewer weeks. We model the aspects of the case relevant forassessing battery wear and mission utility to study this trade-off as follows.
5.2 Satellite Model
The satellite is modelled in Uppaal. The battery SOC is represented with a sim-ple floating point percentage value using the declaration double soc = 80.0;.The initial value is set to 80% SOC to represent the energy lost during the launchand the storage period until the launch. The energy harvested from the solar pan-els, and the energy consumed by the subsystems and radios is represented by
A Score Function for Optimizing the Cycle-Life 313
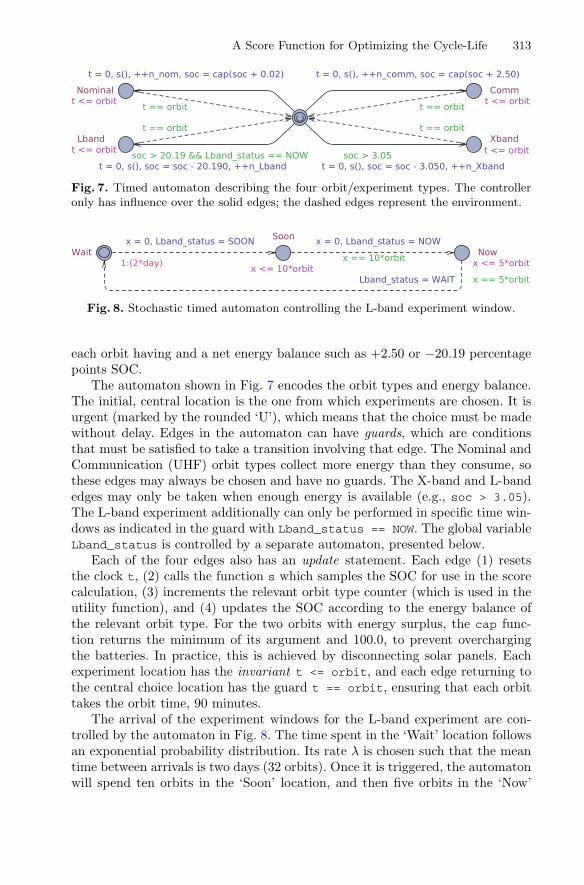
Fig. 7. Timed automaton describing the four orbit/experiment types. The controlleronly has influence over the solid edges; the dashed edges represent the environment.
Fig. 8. Stochastic timed automaton controlling the L-band experiment window.
each orbit having and a net energy balance such as +2.50 or −20.19 percentagepoints SOC.
The automaton shown in Fig. 7 encodes the orbit types and energy balance.The initial, central location is the one from which experiments are chosen. It isurgent (marked by the rounded ‘U’), which means that the choice must be madewithout delay. Edges in the automaton can have guards, which are conditionsthat must be satisfied to take a transition involving that edge. The Nominal andCommunication (UHF) orbit types collect more energy than they consume, sothese edges may always be chosen and have no guards. The X-band and L-bandedges may only be taken when enough energy is available (e.g., soc > 3.05).The L-band experiment additionally can only be performed in specific time win-dows as indicated in the guard with Lband_status == NOW. The global variableLband_status is controlled by a separate automaton, presented below.
Each of the four edges also has an update statement. Each edge (1) resetsthe clock t, (2) calls the function s which samples the SOC for use in the scorecalculation, (3) increments the relevant orbit type counter (which is used in theutility function), and (4) updates the SOC according to the energy balance ofthe relevant orbit type. For the two orbits with energy surplus, the cap func-tion returns the minimum of its argument and 100.0, to prevent overchargingthe batteries. In practice, this is achieved by disconnecting solar panels. Eachexperiment location has the invariant t <= orbit, and each edge returning tothe central choice location has the guard t == orbit, ensuring that each orbittakes the orbit time, 90 minutes.
The arrival of the experiment windows for the L-band experiment are con-trolled by the automaton in Fig. 8. The time spent in the ‘Wait’ location followsan exponential probability distribution. Its rate λ is chosen such that the meantime between arrivals is two days (32 orbits). Once it is triggered, the automatonwill spend ten orbits in the ‘Soon’ location, and then five orbits in the ‘Now’
314 E.R. Wognsen et al.
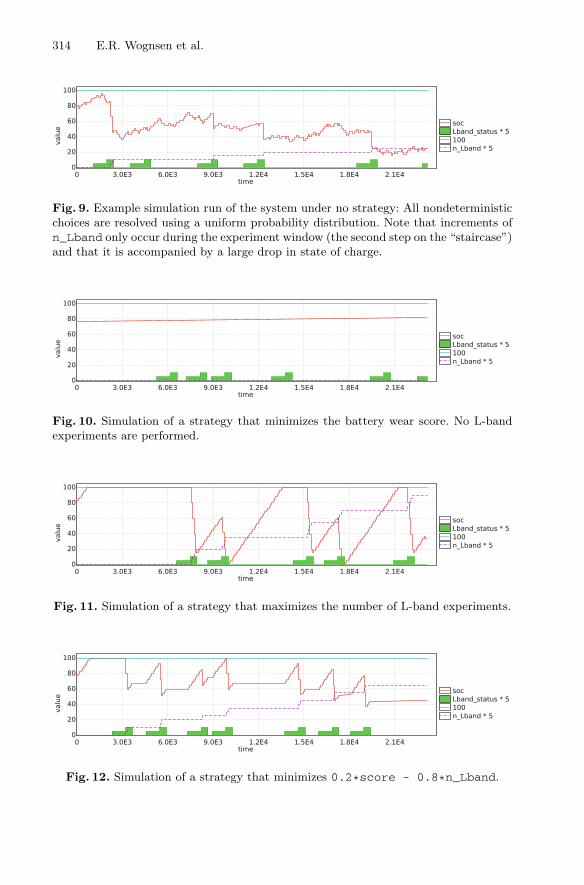
Fig. 9. Example simulation run of the system under no strategy: All nondeterministicchoices are resolved using a uniform probability distribution. Note that increments ofn_Lband only occur during the experiment window (the second step on the “staircase”)and that it is accompanied by a large drop in state of charge.
Fig. 10. Simulation of a strategy that minimizes the battery wear score. No L-bandexperiments are performed.
Fig. 11. Simulation of a strategy that maximizes the number of L-band experiments.
Fig. 12. Simulation of a strategy that minimizes 0.2*score - 0.8*n_Lband.
A Score Function for Optimizing the Cycle-Life 315
location, wherein the L-band orbits are possible. The purpose of the ‘Soon’ loca-tion is to give the reinforcement learning (see Section 5.3) the option of reactingto the upcoming experiment window.
An example simulation run of the system is shown in Fig. 9. The solid curveshows the evolution of the SOC between 0 and 100%. The solid “staircases”show the value of the variable Lband_status, as set in Fig. 8. The low stepcorresponds to the ‘Soon’ location, and the high step to the ‘Now’ location. Thedashed line shows the accumulated number of L-band experiments performed,scaled by five to make the value more easily readable.
In addition to the two automata for the orbit type and the experiment win-dow, the overall system model contains a separate automaton for calculating thewear score. This automaton waits until the end of the predefined system simula-tion period (16 days), and then calculates the score using (1) on the SOC samplestaken by the orbit automaton’s s function. Once the wear score has been calcu-lated, the boolean done is set. Thus, the linear temporal logic (LTL) property“<> done” can be used as the requirement for the runs used in optimization.
5.3 Learning and Optimization
We use Uppaal Stratego’s “minimize expected value” query as follows:strategy s = minE( . . . expression . . . ) [<=nn*orbit]: <> done
The expression to minimize is our cost function. The first choice of cost functioncould be just the wear score. Fig. 10 shows a simulation run of the system under astrategy that minimizes the expected value of the score. The simulation is gener-ated with the query simulate 1 [<=nn*orbit+1] {soc, Lband_status*5,
100, n_Lband*5} under s. The strategy almost always chooses the Nominalorbit because this orbit has the smallest effect on the SOC and will thus wearout the battery the least. The score is a low 0.003. But none of the L-bandexperiments are performed, so this is probably a bad strategy. It does not helpif the battery will last for 15 years if nothing useful is done in those years!
In another extreme, we maximize the number of L-band experiments done.In the example simulation in Fig. 11, 18 L-band experiments were performed,and the sharp changes in SOC result in the high (bad) wear score of 73.5.
In between these two extremes, we might choose a cost function that com-bines the two previous in a weighted sum, e.g., 0.2*score - 0.8*n_Lband. Thenumber of L-band experiments is subtracted rather than added because mini-mizing -n_Lband maximizes n_Lband. As we see in Fig. 12, the strategy haslearned to choose the battery (wear) friendly Nominal orbit in waiting periods,save up energy with the Communication orbit just before the experiment win-dow, and then do only a few L-band experiments, rather than almost depletingthe battery as in Fig. 11. In this simulation, the number of L-band experimentswas 13, and the wear score was 33.7.
The simulations discussed above only illustrate the strategies. To examinethem more systematically, we find the mean value of the score from a numberof runs (here, 25000) under the given strategy (here, s) with the query:
E[<=nn*orbit+1; 25000] (max: score) under s

316 E.R. Wognsen et al.
0 5 10 15 20
−100
−80
−60
−40
−20
0
n_Lband mean
−Sco
re m
ean
0.0
0.1
0.2
0.30.4
0.5
0.6
0.7
0.80.91.0
Fig. 13. Weighted sum optimizations of trade-offs between score and number of exper-iments done. The number next to each point is the parameter p in the expression beingminimized, p *score/6 - (1 − p) *n_Lband.
We do this for both the score and n_Lband on a whole family of strategies2
parameterized by p ∈ [0, 1]:strategys_p= minE(p*score/6- (1 − p)*n_Lband)[<=nn*orbit]:<>done
Fig. 13 shows the Pareto-like frontier corresponding to this family of strate-gies. Note that the score axis is flipped such that the top right corner holdsthe most desirable values. The plot shows how improving one objective hurtsthe other. But going from p = 0 to p = 0.1 improves the wear score while onlyimpacting the number of experiments minimally. Finding the largest numberof experiments for p = 0.2 is unexpected. It is possible that the strategy thatachieves this result is learned in a part of the state space that is, ironically, lesslikely to be explored thoroughly for the single objective optimization at p = 0.
6 Discussion of the Wear Score Function
Our score function is generic rather than tailored for a specific battery technologyor application domain. We can see this, for example, when we consider the twoprofiles B and C in Section 4: The score doubles with a doubled DOD. The
2 The strategies are learned and evaluated using the command line version ofUppaal, verifyta with the learning parameters --learning-method 2 --filter 2
--good-runs 1000 --total-runs 1000 --runs-pr-state 500 --eval-runs 500.
A Score Function for Optimizing the Cycle-Life 317
tendency in this is correct, but the wear may not be directly proportional tothe DOD. To more exactly predict battery lifetime, the approach will have tobe targeted to a specific battery technology.
However, obtaining wear data from battery manufacturers’ datasheets can bevery challenging. Petricca et al. [6] report that “from an extensive survey of morethan 100 datasheets of commercial battery of different chemistries, sizes, energyand form factors, we did not find a single datasheet that report informationabout the following characteristics altogether in the same document: batterybehavior due to constant current, pulse current, and aging effects.”
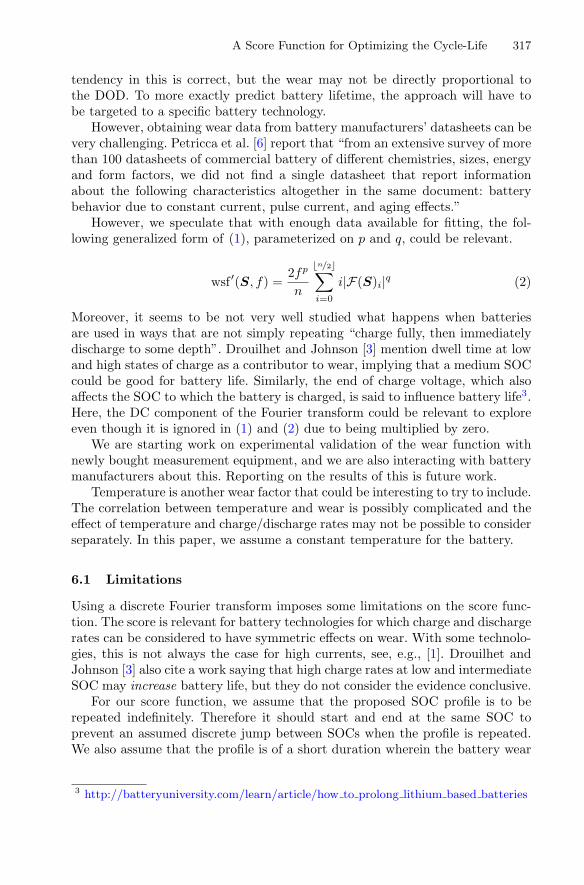
However, we speculate that with enough data available for fitting, the fol-lowing generalized form of (1), parameterized on p and q, could be relevant.
wsf ′(S, f) =2fp
n
�n/2�∑
i=0
i|F(S)i|q (2)
Moreover, it seems to be not very well studied what happens when batteriesare used in ways that are not simply repeating “charge fully, then immediatelydischarge to some depth”. Drouilhet and Johnson [3] mention dwell time at lowand high states of charge as a contributor to wear, implying that a medium SOCcould be good for battery life. Similarly, the end of charge voltage, which alsoaffects the SOC to which the battery is charged, is said to influence battery life3.Here, the DC component of the Fourier transform could be relevant to exploreeven though it is ignored in (1) and (2) due to being multiplied by zero.
We are starting work on experimental validation of the wear function withnewly bought measurement equipment, and we are also interacting with batterymanufacturers about this. Reporting on the results of this is future work.
Temperature is another wear factor that could be interesting to try to include.The correlation between temperature and wear is possibly complicated and theeffect of temperature and charge/discharge rates may not be possible to considerseparately. In this paper, we assume a constant temperature for the battery.
6.1 Limitations
Using a discrete Fourier transform imposes some limitations on the score func-tion. The score is relevant for battery technologies for which charge and dischargerates can be considered to have symmetric effects on wear. With some technolo-gies, this is not always the case for high currents, see, e.g., [1]. Drouilhet andJohnson [3] also cite a work saying that high charge rates at low and intermediateSOC may increase battery life, but they do not consider the evidence conclusive.
For our score function, we assume that the proposed SOC profile is to berepeated indefinitely. Therefore it should start and end at the same SOC toprevent an assumed discrete jump between SOCs when the profile is repeated.We also assume that the profile is of a short duration wherein the battery wear
3 http://batteryuniversity.com/learn/article/how to prolong lithium based batteries
318 E.R. Wognsen et al.
can be ignored, i.e., the capacity remains close to constant. Such a profile couldbe on the order of weeks rather than months or years.
The sampling/simulation parameters f and n are chosen according to thespeed of changes in the SOC. The sampling frequency f should be large enoughthat the oscillations of interest are slower than the Nyquist frequency f/2. Higherharmonics are negligible at realistic uses of batteries because they would notsupport sustained high currents (changes in SOC), which in turn give rise tostrong high frequency harmonics. The sampling window n/f affects the lowestobservable frequency, which is its reciprocal f/n. The lowest observable frequencyshould be low enough to observe the oscillations of interest. The score dependson the sampling parameters, so for now it only makes sense to compare scorescalculated with the same parameters.
7 Related Work
Drouilhet and Johnson [3] in the context of energy storage describe a batterylife prediction method that takes into account DOD and discharge rate. Theypropose a function for each of these to which manufacturer data can be fit-ted. Combining the two expressions, the effective discharge affecting the batterywith respect to wear can be computed from a user-prescribed discharge profileconsisting of a series of discharge events. The battery is seen as having a fixedcharge life (lifetime Ampere-hour throughput until end-of-life), but relative to“effective” discharge, which depends on DOD and discharge rate. They applytheir method to a case study of peak shaving in an Alaskan village powered bywind energy. By predicting the lifetime of different sizes of NiCd and VRLAbatteries, they find the most cost effective battery technology and size for thegiven application. In our approach, we try to generalize from the focus on simpleworkloads wherein each discharge is followed by a full recharge.
Petricca et al. [6] describe an electrical circuit model of capacity fading dueto cycling, as well as the increase of the internal resistance due to cycling. Whatis needed to build the model is manufacturer’s data on capacity fading due tocycling at different temperatures and discharges rates (C-rates), and data onincrease of the internal resistance at a reference discharge rate and for variousDODs. It is questionable whether this data is always available to the user. Asmentioned in Section 6, the authors had a hard time obtaining it. The capacityloss is based on an equation that takes as input the number of cycles. Againwe encounter the concept of cycles that only works for simple workloads, whereeach discharge phase starts at 100% SOC.
Guena and Leblanc [4] in the context of backup power experimentally exam-ine how DOD affects the cycle life of lithium-metal-polymer batteries. They testat 0.6%, 50%, 60%, 70%, 80%, and 100% DOD and find that reduced DODimproves cycle life and total charge throughput. This matches our expectations.They also test micro cycling (to 0.6% DOD) and find it to have no effect oncycle life, i.e., the micro cycled cell had the same capacity fade as one with afloat charge (no cycling). Unfortunately the sample sizes are too small to say
A Score Function for Optimizing the Cycle-Life 319
anything conclusive (one cycled cell compared to three floating cells), and moreinformation would be interesting to have.
8 Conclusion
In this paper we have presented the wear score function, which ranks batteryusage profiles according to their relative impact on the cycle life of the battery.The score function takes into account the workload characteristics that influencethe cycle life the most: charge rate, discharge rate, and depth of discharge. Thekey strength of the score function is that it is not limited to standard regularcharge-discharge profiles, but it allows comparison of complex workload profiles.This makes it a very useful tool in the design of battery powered devices, aswe have shown in the GOMX-3 nano-satellite case study. In the case study, wehave integrated the wear score function into an automata-based model of thesatellite as a stochastic timed game. The wear score function is however suitedfor use with any system modelling formalism and field of application.
In its current form the wear score function allows ranking usage profiles andoptimizing. The scores, however, may not be directly proportional to the actualbattery life. We expect that the score function can be tailored to a specificbattery type. However, in order to do this much experimental data is needed.Obtaining such data, and fitting the score function to match the real cycle life,is part of the future work.
Acknowledgments. This work has been done in cooperation with the partners ofthe EU FP7 project SENSATION. We would especially like to thank Peter Bak, DavidGerhardt, and Morten Bisgaard of GomSpace ApS for our fruitful discussions aboutchallenges of nano-satellites and the GOMX-3 project. We would also like to thankGilles Nies, Jan Krcal, and Holger Hermanns of Saarland University for inspiring dis-cussions of battery modelling and wear. Finally, our colleague at AAU Peter GjølJensen has been helpful in explaining the inner workings of Uppaal Stratego andits learning algorithm.
References
1. Choi, S.S., Lim, H.S.: Factors that affect cycle-life and possible degradation mecha-nisms of a Li-ion cell based on LiCoO2. Journal of Power Sources 111(1), 130–136(2002)
2. David, A., Jensen, P.G., Larsen, K.G., Mikucionis, M., Taankvist, J.H.: UppaalStratego. In: Baier, C., Tinelli, C. (eds.) TACAS 2015. LNCS, vol. 9035,pp. 206–211. Springer, Heidelberg (2015)
3. Drouilhet, S., Johnson, B.L.: A battery life prediction method for hybrid powerapplications. In: AIAA Aerospace Sciences Meeting and Exhibit (1997)
4. Guena, T., Leblanc, P.: How depth of discharge affects the cycle life of lithium-metal-polymer batteries. In: 28th Annual International Telecommunications EnergyConference, INTELEC 2006, pp. 1–8, September 2006

320 E.R. Wognsen et al.
5. Martin, T.L.: Balancing batteries, power, and performance: System issues in CPUspeed-setting for mobile computing. PhD thesis, Carnegie Mellon (1999)
6. Petricca, M., Shin, D., Bocca, A., Macii, A., Macii, E., Poncino, M.: Automated gen-eration of battery aging models from datasheets. In: Computer Design, pp. 483–488.IEEE (2014)
7. Symons, P.: Life estimation of lead-acid battery cells for utility energy storage.In: Proceedings of the Fifth conference on Batteries for Utility Storage, San Juan,Puerto Rico, July 1995
A Appendix
Query Language of Uppaal Stratego
Uppaal Stratego allows for strategy assignment “strategy S =” and strat-egy usage “under S”, using strategy identifiers S. In particular, the queries ofUppaal Stratego allow for constructing (and binding) strategies that guar-antee safety or reachability objectives, or that optimize (minimize or maximize)the expected value of a given expression (within a given bound on time, steps orchosen cost). Constructed (and bound) strategies may now be used to relativizethe queries already used in Uppaal, Uppaal Tiga and Uppaal Smc.
Table 1. A non-comprehensive list of different types of now supported queries. NS(non-deterministic), DS (deterministic) and SS ( stochastic ) are used to signify thetype of the strategy allowed in the given situation.
Related Documents