1 ASEAN RUBBER BUSINESS COUNCIL DATA INPUT ON NR STATISTICS (Reported from ARBC Member Associations during 18 th Meeting of the Economics & Statistic Committee (ESC) held on 13 May 2017 in Bangkok, Thailand) 1. NR Statistics (Tonnes) Table 1: NR Production (1) Period THAILAND INDONESIA MALAYSIA 2016 Jan - Mar (actual) 1,100,600 775,700 187,707 Apr - Jun (actual) 772,100 835,700 122,499 Jul – Sep (actual) 1,184,100 798,400 165,354 Oct – Dec (actual) 1,112,200 748,000 197,953 Total (actual) 4,169,000 3,157,800 673,513 2017 Jan - Mar (estimated) 980,100 800,000 205,000 Apr - Jun (estimated) 805,500 850,000 141,000 Jul – Sep (estimated) 1,244,400 780,000 180,000 Oct – Dec (estimated) 1,270,000 800,000 174,000 Total (estimated) 4,300,000 3,230,000 700,000 Table 1: NR Production (2) Period SINGAPORE VIETNAM CAMBODIA 2016 Jan - Mar (actual) 206,000 25,800 Apr - Jun (actual) 215,000 30,400 Jul – Sep (actual) 320,000 35,300 Oct – Dec (actual) 291,100 53,700 Total (actual) 1,032,100 145,200 2017 Jan - Mar (estimated) 251,000 Apr - Jun (estimated) 215,000 Jul – Sep (estimated) 315,000 Oct – Dec (estimated) 339,000 Total (estimated) 1,120,000 160,000

Welcome message from author
This document is posted to help you gain knowledge. Please leave a comment to let me know what you think about it! Share it to your friends and learn new things together.
Transcript

1
A S E A N R U B B E R B U S I N E S S C O U N C I L
DATA INPUT ON NR STATISTICS (Reported from ARBC Member Associations during 18th Meeting of the
Economics & Statistic Committee (ESC) held on 13 May 2017 in Bangkok, Thailand)
1. NR Statistics (Tonnes)
Table 1: NR Production (1)
Period THAILAND INDONESIA MALAYSIA
2016
Jan - Mar (actual) 1,100,600 775,700 187,707
Apr - Jun (actual) 772,100 835,700 122,499
Jul – Sep (actual) 1,184,100 798,400 165,354
Oct – Dec (actual) 1,112,200 748,000 197,953
Total (actual) 4,169,000 3,157,800 673,513
2017
Jan - Mar (estimated) 980,100 800,000 205,000
Apr - Jun (estimated) 805,500 850,000 141,000
Jul – Sep (estimated) 1,244,400 780,000 180,000
Oct – Dec (estimated) 1,270,000 800,000 174,000
Total (estimated) 4,300,000 3,230,000 700,000
Table 1: NR Production (2)
Period SINGAPORE VIETNAM CAMBODIA
2016
Jan - Mar (actual) 206,000 25,800
Apr - Jun (actual) 215,000 30,400
Jul – Sep (actual) 320,000 35,300
Oct – Dec (actual) 291,100 53,700
Total (actual) 1,032,100 145,200
2017
Jan - Mar (estimated) 251,000
Apr - Jun (estimated) 215,000
Jul – Sep (estimated) 315,000
Oct – Dec (estimated) 339,000
Total (estimated) 1,120,000 160,000

2
Table 2: NR Consumption (1)
Period
THAILAND INDONESIA
MALAYSIA
2016
Jan - Mar (actual) 150,400 148,100 124,300
Apr - Jun (actual) 151,600 153,800 127,300
Jul – Sep (actual) 174,400 148,400 123,400
Oct – Dec (actual) 173,500 150,600 130,500
Total (actual) 649,900
600,900
505,500
2017
Jan - Mar (estimated) 162,000 157,500 122,100
Apr - Jun (estimated) 163,300 157,500 125,200
Jul – Sep (estimated) 184,700 157,500 121,000
Oct – Dec (estimated) 190,000 157,500 121,700
Total (estimated) 700,000 631,100 490,000
Table 2: NR Consumption (2)
Period SINGAPORE VIETNAM CAMBODIA
2016
Jan - Mar (actual) 48,000
Apr - Jun (actual) 48,000
Jul – Sep (actual) 48,000
Oct – Dec (actual) 50,000
Total (actual) 194,000 0
2017
Jan - Mar (estimated) 52,000
Apr - Jun (estimated) 54,000
Jul – Sep (estimated) 54,000
Oct – Dec (estimated) 54,000
Total (estimated) 214,000 0
3
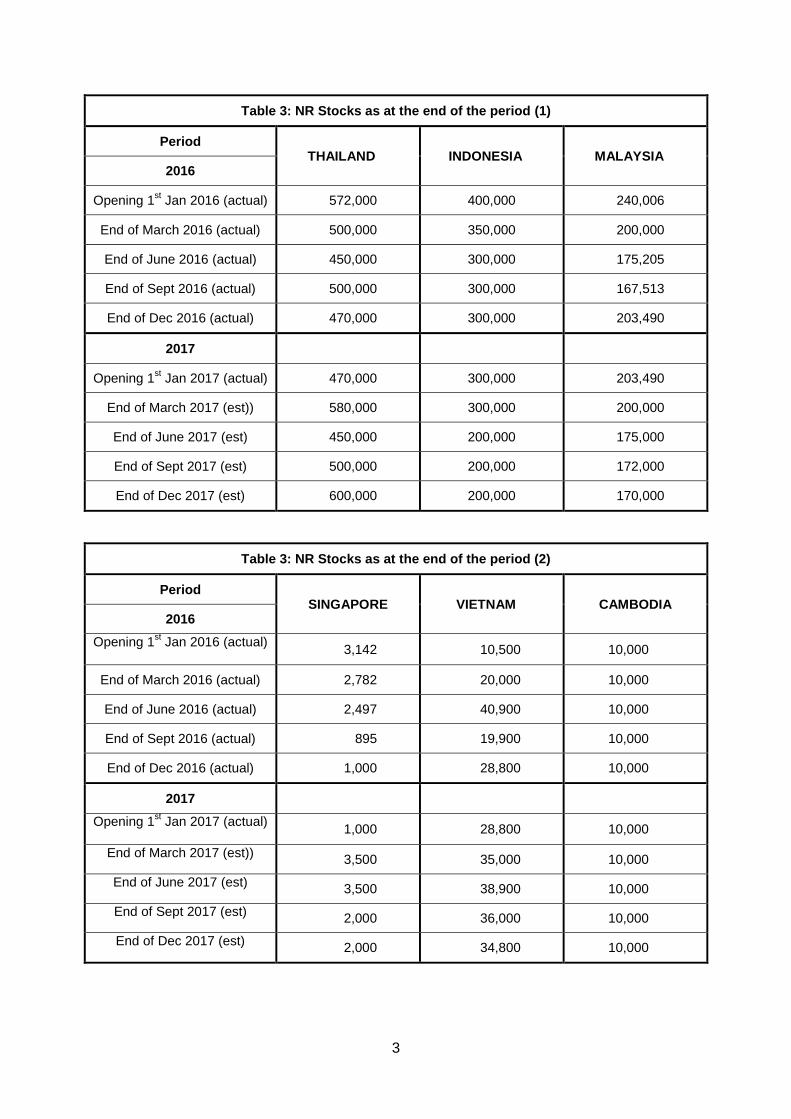
Table 3: NR Stocks as at the end of the period (1)
Period THAILAND INDONESIA MALAYSIA
2016
Opening 1st Jan 2016 (actual) 572,000 400,000 240,006
End of March 2016 (actual) 500,000 350,000 200,000
End of June 2016 (actual) 450,000 300,000 175,205
End of Sept 2016 (actual) 500,000 300,000 167,513
End of Dec 2016 (actual) 470,000 300,000 203,490
2017
Opening 1st Jan 2017 (actual) 470,000 300,000 203,490
End of March 2017 (est)) 580,000 300,000 200,000
End of June 2017 (est) 450,000 200,000 175,000
End of Sept 2017 (est) 500,000 200,000 172,000
End of Dec 2017 (est) 600,000 200,000 170,000
Table 3: NR Stocks as at the end of the period (2)
Period SINGAPORE VIETNAM CAMBODIA
2016
Opening 1st Jan 2016 (actual)
3,142 10,500 10,000
End of March 2016 (actual) 2,782 20,000 10,000
End of June 2016 (actual) 2,497 40,900 10,000
End of Sept 2016 (actual) 895 19,900 10,000
End of Dec 2016 (actual) 1,000 28,800 10,000
2017
Opening 1st Jan 2017 (actual)
1,000 28,800 10,000
End of March 2017 (est)) 3,500 35,000 10,000
End of June 2017 (est) 3,500 38,900 10,000
End of Sept 2017 (est) 2,000 36,000 10,000
End of Dec 2017 (est) 2,000 34,800 10,000
4
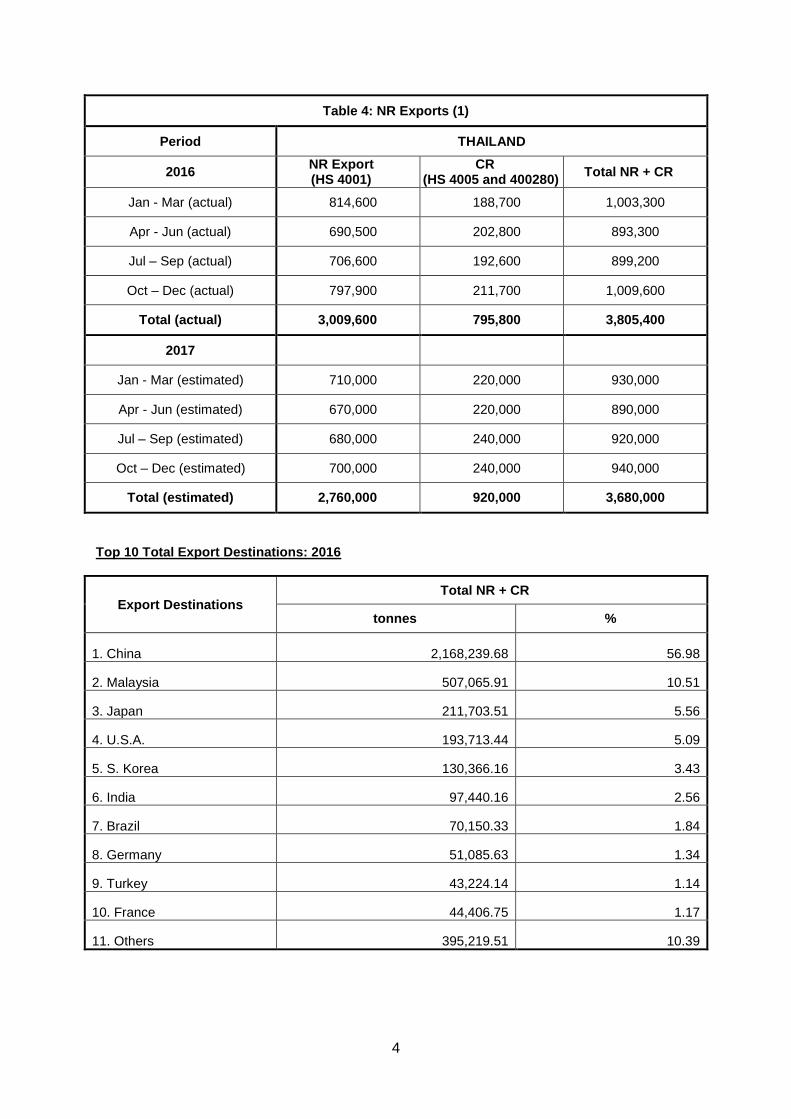
Table 4: NR Exports (1)
Period THAILAND
2016 NR Export (HS 4001)
CR (HS 4005 and 400280)
Total NR + CR
Jan - Mar (actual) 814,600 188,700 1,003,300
Apr - Jun (actual) 690,500 202,800 893,300
Jul – Sep (actual) 706,600 192,600 899,200
Oct – Dec (actual) 797,900 211,700 1,009,600
Total (actual) 3,009,600 795,800 3,805,400
2017
Jan - Mar (estimated) 710,000 220,000 930,000
Apr - Jun (estimated) 670,000 220,000 890,000
Jul – Sep (estimated) 680,000 240,000 920,000
Oct – Dec (estimated) 700,000 240,000 940,000
Total (estimated) 2,760,000 920,000 3,680,000
Top 10 Total Export Destinations: 2016
Export Destinations Total NR + CR
tonnes %
1. China 2,168,239.68 56.98
2. Malaysia 507,065.91 10.51
3. Japan 211,703.51 5.56
4. U.S.A. 193,713.44 5.09
5. S. Korea 130,366.16 3.43
6. India 97,440.16 2.56
7. Brazil 70,150.33 1.84
8. Germany 51,085.63 1.34
9. Turkey 43,224.14 1.14
10. France 44,406.75 1.17
11. Others 395,219.51 10.39

5
Top 10 NR Export Destinations: 2016
Export Destinations NR
tonnes %
1. China 1,416,808.07 47.08
2. Malaysia 503,938.00 13.18
3. Japan 211,230.79 7.02
4. U.S.A. 187,523.65 6.23
5. S. Korea 130,366.16 4.33
6. India 84,666.69 2.81
7. Brazil 70,150.33 2.33
8. Germany 50,528.49 1.68
9. Turkey 43,224.14 1.44
10. France 44,406.75 1.48
11. Others 373,971.65 12.43
Top 10 CR Export Destinations: 2016
Export Destinations
CR (HS 4005 and 400280)
tonnes %
1. China 751,431.61 94.42
2. Spain 13,303.10 1.67
3. India 12,773.47 1.61
4. U.S.A. 6,189.79 0.78
5. Malaysia 3,127.91 0.39
6. Vietnam 2,736.57 0.34
7. Indonesia 2,388.79 0.30
8. Philippines 900.37 0.11
9. Germany 557.14 0.07
10. Japan 472.72 0.06
11. Others 1,918.52 0.24

6
Table 4: NR Exports (2)
Period INDONESIA
2016 NR Export (HS 4001)
CR (HS 4005 and 400280)
Total NR + CR
Jan - Mar (actual) 591,637 18,063 609,700
Apr - Jun (actual) 647,919 17,726 665,645
Jul – Sep (actual) 649,608 15,725 665,333
Oct – Dec (actual) 688,999 26,790 715,789
Total (actual) 2,578,163 78,304 2,656,467
2017
Jan - Mar (estimated) 650.000 20,000 670.000
Apr - Jun (estimated) 660.000 20,000 680.000
Jul – Sep (estimated) 670.000 20,000 690.000
Oct – Dec (estimated) 640.000 20,000 660.000
Total (estimated) 2,620.000 80,000 2,700,000
Top 10 Total Export Destinations: 2016
Export Destinations Total NR + CR
tonnes %
1. U S A 577,700 21.7
2. China 368,100 13.9
3. Japan 421,300 15.9
4. Singapore 22,700 0.9
5. Brazil 96,000 3.6
6. India 231,000 8.7
7. Korea 179,300 6.7
8. Canada 74,000 2.8
9. Germany 70,100 2.6
10. Turkey 70,700 2.7
11. Others 545,600 20.5

7
Top 10 NR Export Destinations: 2016
Export Destinations NR
tonnes %
1. U S A 577,669 22.4
2. China 302,918 11.7
3. Japan 421,288 16.3
4. Singapore 18,681 0.7
5. Brazil 96,084 3.7
6. India 230,947 9.0
7. Korea 179,347 7.0
8. Canada 74,043 2.9
9. Germany 70,153 2.7
10. Turkey 5,724 0.2
11. Others 601,309 23.3
Top 10 CR Export Destinations: 2016
Export Destinations
CR (HS 4005 and 400280)
tonnes %
1. U S A 14 0.0
2. China 65,226 83.3
3. Japan 18 0.0
4. Singapore 3,989 5.1
5. Brazil - 0.0
6. India 2,042 2.6
7. Korea - 0.0
8. Canada - 0.0
9. Germany - 0.0
10. Turkey - 0.0
11. Others 7,015 9.0

8
Table 4: NR Exports (3)
Period MALAYSIA
2016 NR Export (HS 4001)
CR (HS 4005 and 400280)
Total NR + CR
Jan - Mar (actual) 157,741 91,991 249,732
Apr - Jun (actual) 158,678 101,803 260,481
Jul – Sep (actual) 150,161 102,349 252,510
Oct – Dec (actual) 175,383 114,662 290,044
Total (actual) 641,962 410,805 1,052,767
2017
Jan - Mar (estimated) 161,410 104,988 266,400
Apr - Jun (estimated) 167,000 117,000 284,000
Jul – Sep (estimated) 160,000 113,000 273,000
Oct – Dec (estimated) 161,590 115,000 276,600
Total (estimated) 650,000 450,000 1,100,000
Top 10 Total Export Destinations: 2016
Export Destinations Total NR + CR
tonnes %
1. China 702,015 66.7
2. Germany 85,883 8.2
3. Iran 43,830 4.2
4. United States 23,635 2.2
5. Finland 17,096 1.6
6. Turkey 14,558 1.4
7. South Korea 12,994 1.2
8. Brazil 12,443 1.2
9. India 12,075 1.1
10. Taiwan 11,332 1.1
11. Others 116,907 11.1

9
Top 10 NR Export Destinations: 2016
Export Destinations NR
tonnes %
1. China 300,524 46.8
2. Germany 85,234 13.3
3. Iran 43,828 6.8
4. United States 23,422 3.6
5. Finland 17,096 2.7
6. Turkey 14,291 2.2
7. South Korea 12,884 2.0
8. Brazil 12,419 1.9
9. India 11,999 1.9
10. Taiwan 11,285 1.8
11. Others 108,980 17.0
Top 10 CR Export Destinations: 2016
Export Destinations
CR (HS 4005 and 400280)
tonnes %
1. China 401,491 97.7
2. Australia 3,413 0.8
3. Singapore 1,987 0.5
4. Germany 649 0.2
5. Viet Nam 495 0.1
6. Japan 438 0.1
7. Indonesia 437 0.1
8. Turkey 268 0.1
9. Hong Kong 261 0.1
10. United States 213 0.1
11. Others 1,153 0.3

10
Table 4: NR Exports (4)
Period SINGAPORE
2016 NR Export (HS 4001)
CR (HS 4005 and 400280)
Total NR + CR
Jan - Mar (actual) 16,069 1,831 17,900
Apr - Jun (actual) 19,979 2,640 22,619
Jul – Sep (actual) 17,548 2,174 19,722
Oct – Dec (actual) 10,523 2,373 12,896
Total (actual) 64,119 9,018 73,137
2017
Jan - Mar (estimated) 16,000 2,000 18,000
Apr - Jun (estimated) 19,000 2,000 21,000
Jul – Sep (estimated) 19,000 2,000 21,000
Oct – Dec (estimated) 16,000 2,000 18,000
Total (estimated) 70,000 8,000 78,000
Top 10 Total Export Destinations: 2016
Export Destinations Total NR + CR
tonnes %
1. China 26,217 35.85
2. United States 18,157 24.83
3. Spain 3,615 4.94
4. Canada 3,482 4.76
5. Netherlands 2,450 3.35
6. France 1,990 2.72
7. Italy 1,933 2.64
8. India 1,767 2.42
9. South Africa 1,492 2.04
10. Brazil 1,130 1.55
11. Others

11
Top 10 NR Export Destinations: 2016
Export Destinations NR
tonnes %
1. China 21,504 33.54
2. United States 18,100 28.23
3. Canada 3,479 5.43
4. Spain 3,122 4.87
5. Netherlands 2,450 3.82
6. France 1,990 3.10
7. Italy 1,933 3.01
8. India 1,512 2.36
9. Romania 1,511 2.36
10. South Africa 1,492 2.33
11. Others
Top 10 CR Export Destinations: 2016
Export Destinations
CR (HS 4005 and 400280)
tonnes %
1. China 4,712 52.25
2. Hong Kong 859 9.53
3. Thailand 763 8.46
4. Spain 492 5.46
5. Malaysia 423 4.69
6. Vietnam 361 4.00
7. Indonesia 348 3.86
8. India 255 2.83
9. Korea, Rep Of 221 2.45
10. Japan 176 1.95
11. Others
12
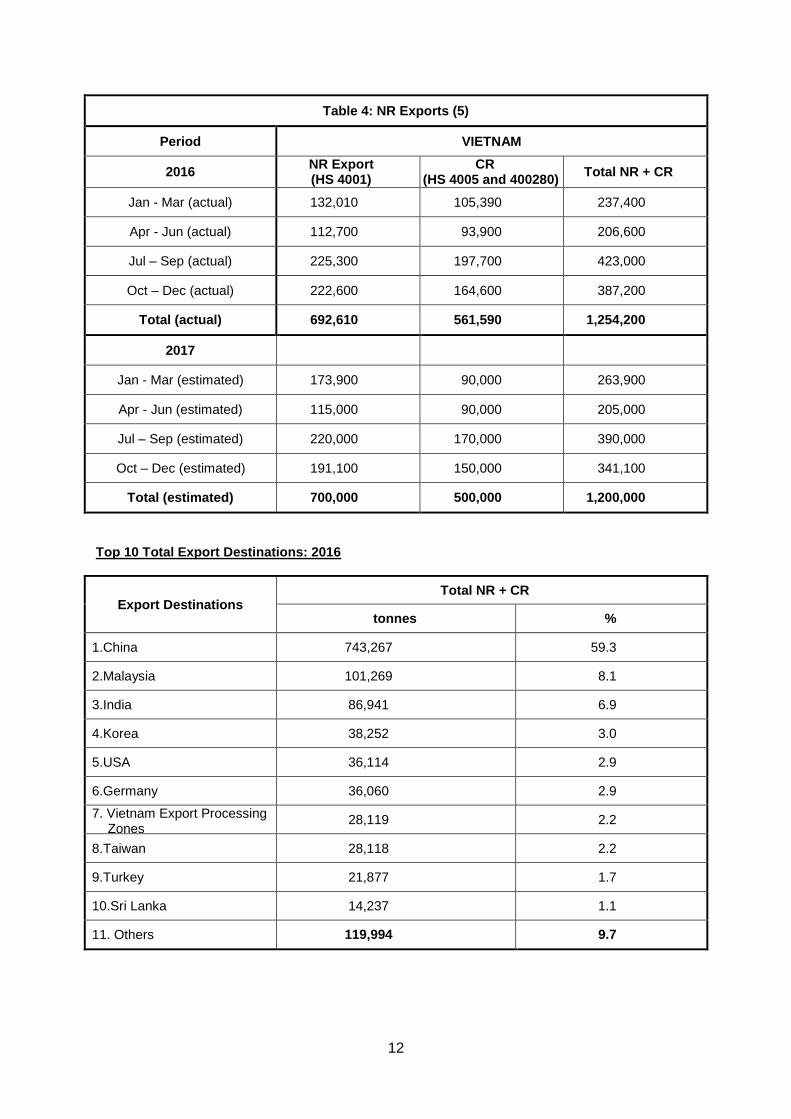
Table 4: NR Exports (5)
Period VIETNAM
2016 NR Export (HS 4001)
CR (HS 4005 and 400280)
Total NR + CR
Jan - Mar (actual) 132,010 105,390 237,400
Apr - Jun (actual) 112,700 93,900 206,600
Jul – Sep (actual) 225,300 197,700 423,000
Oct – Dec (actual) 222,600 164,600 387,200
Total (actual) 692,610 561,590 1,254,200
2017
Jan - Mar (estimated) 173,900 90,000 263,900
Apr - Jun (estimated) 115,000 90,000 205,000
Jul – Sep (estimated) 220,000 170,000 390,000
Oct – Dec (estimated) 191,100 150,000 341,100
Total (estimated) 700,000 500,000 1,200,000
Top 10 Total Export Destinations: 2016
Export Destinations Total NR + CR
tonnes %
1.China 743,267 59.3
2.Malaysia 101,269 8.1
3.India 86,941 6.9
4.Korea 38,252 3.0
5.USA 36,114 2.9
6.Germany 36,060 2.9
7. Vietnam Export Processing Zones
28,119 2.2
8.Taiwan 28,118 2.2
9.Turkey 21,877 1.7
10.Sri Lanka 14,237 1.1
11. Others 119,994 9.7

13
Top 10 NR Export Destinations: 2016
Export Destinations NR
tonnes %
1. China 185,012 26.7
2. Malaysia 98,790 14.3
3. India 86,941 12.6
4. Korea 38,172 5.5
5. USA 36,114 5.2
6. Germany 36,060 5.2
7. Taiwan 28,118 4.1
8. Turkey 21,877 3.2
9. Vietnam Export Processing Zones 17,605 2.5
10.Sri Lanka 14,237 2.1
11. Others 129,684 18.6
Top 10 CR Export Destinations: 2016
Export Destinations
CR (HS 4005 and 400280)
tonnes %
1. China 558,255 99.4
2. Malaysia 2,479 0.4
3.
4.
5.
6.
7.
8.
9.
10.
11. Others 856 0.2

14
Table 4: NR Exports (6)
Period CAMBODIA
2016 NR Export (HS 4001)
CR (HS 4005 and 400280)
Total NR + CR
Jan - Mar (actual) 24,700 0 24,700
Apr - Jun (actual) 29,100 0 29,100
Jul – Sep (actual) 35,000 0 35,000
Oct – Dec (actual) 56,300 0 56,300
Total (actual) 145,100 0 145,100
2017
Jan - Mar (estimated)
Apr - Jun (estimated)
Jul – Sep (estimated)
Oct – Dec (estimated)
Total (estimated) 190,600 0 190,600
Top 10 Total Export Destinations: 2016
Export Destinations Total NR + CR
tonnes %
1.
2.
3.
4.
5.
6.
7.
8.
9.
10.
11. Others

15
Top 10 NR Export Destinations: 2016
Export Destinations NR
tonnes %
1.
2.
3.
4.
5.
6.
7.
8.
9.
10.
11. Others
Top 10 CR Export Destinations: 2016
Export Destinations
CR (HS 4005 and 400280)
tonnes %
1.
2.
3.
4.
5.
6.
7.
8.
9.
10.
11. Others

16
SUMMARY: TOP EXPORT DESTINATION FROM ARBC MEMBERS COUNTRIES IN 2016
Export Destination
Thailand Indonesia Vietnam Malaysia Singapore Cambodia Total
China NR
1,416,808.07 302,918
185,012
300,524
21,504
2,226,766
MR* 751,431.61 65,226
558,255
401,491
4,712
1,781,116
Malaysia
NR 503,938
98,790
602,728
CR 3,127.91
2,479
42
5,649
Japan
NR 211,230.79 421,288
632,519
CR 472.72 18
438
176
1,105
U.S.A
NR 187,523.65 577,669
36,114
23,422
18,100
842,829
CR 6,189.79 14
213
6,417
S. Korea
NR 130,366.16 179,347
38,172
12,884
360,769
CR
221
India NR
84,666.69 230,947
86,941
11,999
1,512
416,066
CR 12,773.47 2,042
255
15,070
Brazil NR
70,150.33 96,084
12,419
178,653
CR
Germany NR
50,528.49 70,153
36,060
85,234
241,975
CR 557.14
649
1,206
Iran NR
43,828
43,828
CR
Turkey NR
43,224.14 5,724
21,877
14,291
85,116
CR 268
France NR
44,406.75
1,990
46,397
CR
Finland NR
17,096
17,096
CR
Canada NR
74,043
3,479
77,522
CR
Spain
NR
3,122
3,122
CR 13,303.10
492
13,795

17
Note: *MR = China Mixture Rubber (MR)
Export Destination
Thailand Indonesia Vietnam Malaysia Singapore Cambodia Total
Vietnam
NR 17,605
CR 2,736.57
495
361
3,593
Indonesia
NR
CR 2,388.79
437
348
3,174
Philippines NR
CR 900.37
900
Singapore
NR 18,681
18,681
CR 3,989
1,987
5,976
Taiwan NR
28,118
11,285
39,403
CR
Australia
NR
CR
3,413
3,413
Hong Kong NR
CR
261
859
1,120
Netherlands NR
2,450
2,450
CR
Italy NR
1,933
1,933
CR
Romania NR
1,511
CR
-
South Africa
NR
1,492
1,492
CR
Thailand NR
CR
763
763
Sri Lanka NR
14,237
14,237
CR
Others NR
373,971.65 601,309 129,684 108,980
1,213,945
CR 1,918.52 7,015
856 1,153
10,943

18
Table 5: NR Imports (1)
Period THAILAND INDONESIA
2016
Jan - Mar (actual)
Apr - Jun (actual)
Jul – Sep (actual)
Oct – Dec (actual)
Total (actual)
2017
Jan - Mar (estimated)
Apr - Jun (estimated)
Jul – Sep (estimated)
Oct – Dec (estimated)
Total (estimated)
Countries of Imports
Jan - Dec 2016 Countries tonnage % Countries tonnage %
Top 5 countries 1) 1)
2) 2)
3) 3)
4) 4)
5) 5)
Note: Thailand - Import figures of Thailand is insignificant (2,000 ton/year). Indonesia - Not available.

19
Table 5: NR Imports (2)
Period MALAYSIA SINGAPORE
2016
Jan - Mar (actual) 269,300 15,409
Apr - Jun (actual) 184,300 19,235
Jul – Sep (actual) 204,100 16,087
Oct – Dec (actual) 278,000 10,951
Total (actual) 935,700 61,682
2017
Jan - Mar (estimated) 265,300
15,000
Apr - Jun (estimated) 191,000
18,000
Jul – Sep (estimated) 200,000
18,000
Oct – Dec (estimated) 244,000
15,000
Total (estimated) 900,300
66,000
Countries of Imports
Jan - Dec 2016 Countries tonnage % Countries tonnage %
Top 5 countries 1) Thailand 503,938 54.2 1) Malaysia 26,357 42.73
2) Cote D'Ivoire 137,800 14.8 2) Indonesia 19,995 32.42
3) Vietnam 121,059 13.0 3) Thailand 10,702 17.35
4) Philippines 68,302 7.3 4) Cote D’Ivoire 1,472 2.39
5) Myanmar 27,298 2.9 5) Cameroon 760 1.23

20
Table 5 : NR Imports (3)
Period VIETNAM CAMBODIA
2016
Jan - Mar (actual) 63,300
Apr - Jun (actual) 70,000
Jul – Sep (actual) 130,000
Oct – Dec (actual) 155,000
Total (actual) 418,300
2017
Jan - Mar (estimated) 49,000
Apr - Jun (estimated) 70,000
Jul – Sep (estimated) 80,000
Oct – Dec (estimated) 101,000
Total (estimated) 300,000
Countries of Imports
Jan - Dec 2016 Countries tonnage % Countries tonnage %
Top 5 countries 1) Vietnam EPZs 287,033 68.6 1)
2) Cambodia 56,323 13.5 2)
3) Laos 38,471 9.2 3)
4) Thailand 11,655 2.8 4)
5) Malaysia 10,432 2.5 5)

21
2. Comparison of TSR 20 FOB Prices
2.1 Monthly Average Prices of TSR 20 FOB (US cents/kg) for the year 2016
2016 Thailand Indonesia Malaysia Singapore Vietnam Cambodia
(STR 20) (SIR 20) (SMR 20) (TSR 20) (SVR 20) (CSR 10)
January 109.92 108.30 109.05 108.33 118.80 106.30
February 109.11 109.63 110.32 108.60 118.00 107.63
March 128.24 126.94 128.91 127.10 124.30 124.94
April 149.07 148.64 149.41 147.60 142.80 146.64
May 138.92 137.73 136.65 137.90 146.70 135.73
June 127.72 127.29 127.21 127.40 128.40 125.29
July 131.00 130.58 128.79 131.30 126.10 128.58
August 128.30 129.62 130.34 129.70 129.70 127.62
September 130.18 134.59 136.63 134.60 134.40 132.59
October 139.06 146.34 148.60 146.50 151.40 144.34
November 169.31 163.90 166.81 164.00 166.50 161.90
December 194.83 187.36 190.99 187.00 196.60 185.36
Yearly Average 137.97 137.57 139.15 137.50 140.30 135.57
2.2 Daily Prices of TSR 20 FOB (US cents/kg) for the months January – March 2017
January 2017
Thailand Indonesia Malaysia Singapore Vietnam Cambodia
(STR 20) (SIR 20) (SMR 20) (TSR 20) (SVR 20) (CSR 10)
3 200.20 205.90 193.50 202.50
4 201.92 201.10 199.30 201.10 202.50
5 205.00 201.10 203.75 201.50 206.50
6 205.35 196.20 199.50 196.20 206.50
9 206.43 193.00 205.25 193.00 206.50
10 209.73 202.60 211.05 202.60 211.50
11 208.70 217.05 208.70 216.50
12 221.06 211.20 222.85 211.20 221.50
13 226.02 212.20 222.85 212.20 221.50
16 228.52 208.70 227.80 208.70 227.50
17 231.86 222.10 225.95 222.10 227.50
18 218.80 223.05 218.80 227.50
19 220.00 225.30 220.00 227.50
20 232.51 216.80 216.60 216.80 227.50
23 229.78 207.70 215.20 207.70 227.50
24 230.46 209.30 215.80 209.30 220.50
25 232.91 214.60 221.25 214.60 220.50
26 238.85 220.90 227.90 220.90
27 243.84 223.70 230.30 223.70
30 223.70
31 256.08 223.70 242.85
Average 225.02 211.25 217.98 209.61 217.74 #DIV/0!
Max 256.08 223.70 242.85 223.70 227.50 0.00
Min 201.92 193.00 199.30 193.00 202.50 0.00
Date

22
February 2017
Thailand Indonesia Malaysia Singapore Vietnam Cambodia
(STR 20) (SIR 20) (SMR 20) (TSR 20) (SVR 20) (CSR 10)
1 253.56 229.00 227.50
2 251.18 229.00 237.35 229.00 235.50
3 248.11 229.00 222.10 229.00 235.50
6 243.00 222.40 224.45 222.40 235.50
7 239.94 218.60 219.15 218.60 235.50
8 242.65 221.50 223.40 221.50 235.50
9 242.82 221.60 221.60 235.50
10 242.37 218.90 219.30 218.90 235.50
13 223.80 232.65 223.80 240.50
14 230.20 231.30 230.20 240.50
15 245.64 231.60 227.70 231.60 240.50
16 245.75 227.90 229.40 227.90 240.50
17 243.00 224.50 218.30 224.50 240.50
20 237.04 220.50 215.55 220.50 232.50
21 233.95 217.00 220.55 217.00 232.50
22 231.30 216.40 214.55 216.40 227.50
23 230.20 215.90 215.40 215.90 227.50
24 221.68 207.50 205.95 207.50 219.50
27 222.29 208.40 212.10 208.40 219.50
28 219.13 207.50 204.05 207.50 219.50
Average 238.53 221.06 220.74 220.99 233.13 #DIV/0!
Max 253.56 231.60 237.35 231.60 240.50 0.00
Min 219.13 207.50 204.05 207.50 219.50 0.00
Date
March 2017
Thailand Indonesia Malaysia Singapore Vietnam Cambodia
(STR 20) (SIR 20) (SMR 20) (TSR 20) (SVR 3L) (CSR 10)
1 218.54 207.20 209.15 207.80 219.50
2 210.00 207.95 210.00 219.50
3 221.11 211.30 210.85 211.30 219.50
6 222.60 215.30 215.25 215.30 219.50
7 222.38 208.90 207.40 208.90 219.50
8 216.28 208.00 199.95 208.00 219.50
9 213.33 199.10 197.35 199.10 219.50
10 214.59 197.60 201.00 197.60 219.50
13 199.60 199.75 199.60 216.50
14 214.98 199.90 201.45 199.90 216.50
15 196.70 201.05 196.70 216.50
16 198.90 197.15 198.90 216.50
17 215.10 200.70 203.35 200.70 216.50
20 216.75 204.00 205.20 204.00 216.50
21 202.30 198.95 202.30 216.50
22 210.83 199.10 190.50 199.10 216.50
23 207.76 190.60 192.65 190.60 216.50
24 204.79 193.40 190.20 193.40 216.50
27 189.70 181.40 189.70 209.50
28 185.55 181.50 209.50
29 199.77 180.80 182.35 180.80 209.50
30 180.80 177.75 180.80 209.50
31 198.84 175.90 183.45 175.90 209.50
Average 213.18 198.63 197.38 197.91 216.02 #DIV/0!
Max 222.60 215.30 215.25 215.30 219.50 0.00
Min 198.84 175.90 177.75 175.90 209.50 0.00
Date

23
Related Documents