Paper No. 44 APCBM 2011 The 3 rd Asia Pacific Coalbed Methane Symposium May 3-6, 2011, Brisbane, Australa 1 A rock mechanical model developed for a Coal Seam Well V. Minaeian * , and V. Rasouli Department of Petroleum Engineering Curtin University, 6151 Perth, Australia * Corresponding Author’s E-mail: [email protected] Keywords: Coalbed methane; Rock mechanical model; In-situ stresses; Wellbore instability. Abstract Drilling operation in order to produce from Coalbed methane (CBM) is prone to various geomechanics related problems not only within the coal seam but also across the overburden layers. Wellbore instability in the form of shear failure (breakout) and washout in one hand and mud loss and fracturing in other hand are examples of failures which a wellbore may experience if a proper mud weight is not used for drilling. In order to conduct such an analysis the input data required includes mechanical properties of formations as well as the magnitude and direction of in-situ stresses and pore pressure. It is well known that mechanical properties of formations are related to their physical characteristics. For example, the formation Young’s Modulus or strength is expected to be higher in formations with larger sonic velocities or lesser porosities. Petrophysical logs reflect various rock physical properties from which continuous curves of rock mechanical properties could be estimated using several correlations developed in similar fields. Similarly, continuous logs of in-situ stresses (i.e. vertical as well as minimum and maximum horizontal stresses) could be estimated, for example from poroelastic formulae, in conjunction with rock physical properties. The estimated logs could be calibrated against lab tests on cores and field test data. For example, performing triaxial tests in the lab on cores obtained at different depths, the elastic and strength properties such as Young’s Modulus, Poisson’s ratio and uniaxial compressive strength (UCS) could be measured and this is used to correct the corresponding estimated logs. Similarly, the minimum horizontal stress log could be calibrated against any existing leak-off-test data whereas pore pressure curve can be calibrated if any MDT data is available. The direction of horizontal stress can be estimated from the image logs, for example FMI. The combination of continuous curves of formation mechanical properties and magnitude of in- situ stresses together with stress directions is referred to as rock mechanical model (RMM). The RMM is constructed for a drilled well and then it is used for prediction of events in a new planned well in a nearby area. The RMM includes the input data for any geomechanics study such as wellbore instability analysis, fracturing design or sanding prediction. In this study the RMM was constructed for data corresponding to Well Ridgwood 2 drilled in Surat basin in Queensland, Australia. The results indicate how the mechanical properties are changing across the coal seam comparing to other intervals and that the stress magnitudes experience significant changes accordingly. The results are used to predict the fraccability of the CBM for stimulation purposes using a hydraulic fracturing operation. Other applications of the constructed RMM will be discussed and the results interpreted.

Welcome message from author
This document is posted to help you gain knowledge. Please leave a comment to let me know what you think about it! Share it to your friends and learn new things together.
Transcript

Paper No. 44 APCBM 2011
The 3rd Asia Pacific Coalbed Methane Symposium May 3-6, 2011, Brisbane, Australa
1
A rock mechanical model developed for a Coal Seam Well
V. Minaeian
*, and V. Rasouli
Department of Petroleum Engineering
Curtin University, 6151 Perth, Australia
*Corresponding Author’s E-mail: [email protected]
Keywords: Coalbed methane; Rock mechanical model; In-situ stresses; Wellbore instability.
Abstract
Drilling operation in order to produce from Coalbed methane (CBM) is prone to various
geomechanics related problems not only within the coal seam but also across the overburden layers.
Wellbore instability in the form of shear failure (breakout) and washout in one hand and mud loss and
fracturing in other hand are examples of failures which a wellbore may experience if a proper mud
weight is not used for drilling. In order to conduct such an analysis the input data required includes
mechanical properties of formations as well as the magnitude and direction of in-situ stresses and pore
pressure.
It is well known that mechanical properties of formations are related to their physical
characteristics. For example, the formation Young’s Modulus or strength is expected to be higher in
formations with larger sonic velocities or lesser porosities. Petrophysical logs reflect various rock
physical properties from which continuous curves of rock mechanical properties could be estimated
using several correlations developed in similar fields. Similarly, continuous logs of in-situ stresses (i.e.
vertical as well as minimum and maximum horizontal stresses) could be estimated, for example from
poroelastic formulae, in conjunction with rock physical properties. The estimated logs could be
calibrated against lab tests on cores and field test data. For example, performing triaxial tests in the
lab on cores obtained at different depths, the elastic and strength properties such as Young’s Modulus,
Poisson’s ratio and uniaxial compressive strength (UCS) could be measured and this is used to correct
the corresponding estimated logs. Similarly, the minimum horizontal stress log could be calibrated
against any existing leak-off-test data whereas pore pressure curve can be calibrated if any MDT data
is available. The direction of horizontal stress can be estimated from the image logs, for example FMI.
The combination of continuous curves of formation mechanical properties and magnitude of in-
situ stresses together with stress directions is referred to as rock mechanical model (RMM). The
RMM is constructed for a drilled well and then it is used for prediction of events in a new planned
well in a nearby area. The RMM includes the input data for any geomechanics study such as wellbore
instability analysis, fracturing design or sanding prediction.
In this study the RMM was constructed for data corresponding to Well Ridgwood 2 drilled in Surat
basin in Queensland, Australia. The results indicate how the mechanical properties are changing
across the coal seam comparing to other intervals and that the stress magnitudes experience
significant changes accordingly. The results are used to predict the fraccability of the CBM for
stimulation purposes using a hydraulic fracturing operation. Other applications of the constructed
RMM will be discussed and the results interpreted.
Paper No. 44 APCBM 2011
The 3rd Asia Pacific Coalbed Methane Symposium May 3-6, 2011, Brisbane, Australa
2
1. Introduction
Coal seam gas (CSG) or coalbed methane (CBM) reservoirs are unconventional gas reservoirs
which are different from the conventional ones in different aspects. First, despite of conventional
reservoirs, in coal seams the gas is not in the pore space but adsorbed within the matrix. Second, in
conventional gas reservoirs, gas flows to the well as a result of any pressure gradient between the well
and the formation, but in CBM reservoirs the reservoir pressure should be under a threshold value in
order to produce gas. Besides, in the CBM reservoirs, the main production procedure is to dewater
coal layer so the gas molecules will desorb from the coal matrix and could flow within the cleats and
also fractures made by hydraulic fracturing [Morad et al., 2008]. For hydraulic fracturing to be
effective, the stress state of the filed, which controls the hydraulic conductivity of the fracture
networks [Barton et al., 1995], should be precisely studied [Johnson et al., 2010b]. In order to
determine the stress regime of a field, the Rock Mechanical Model (RMM), which includes
continuous logs of formation elastic and strength properties, in-situ stresses and pore pressure, should
be constructed. Based on the RMM, hydraulic fracturing and wellbore stability analysis could be done
and the stable mud weight windows could be determined.
This paper aims at constructing an RMM for Well Ridgewood 2 which is located at the Walloon
Sub Group (WSG), in Surat Basin, Queensland, Australia. The first coal seam gas well was drilled in
1995 in Surat basin in order to investigate the gas content and saturation of the WSG, which is the
main coal bearing formation in the Injune Creek Group. During late 2000 full evaluation of coal seam
gas content, saturation and production rates in WSG was implemented [Scott et al., 2007]. The WSG
has 1000-1200 ft thickness containing a net coal of about 65-120 ft with gas content 0f 1 to 14 ftm /3 .
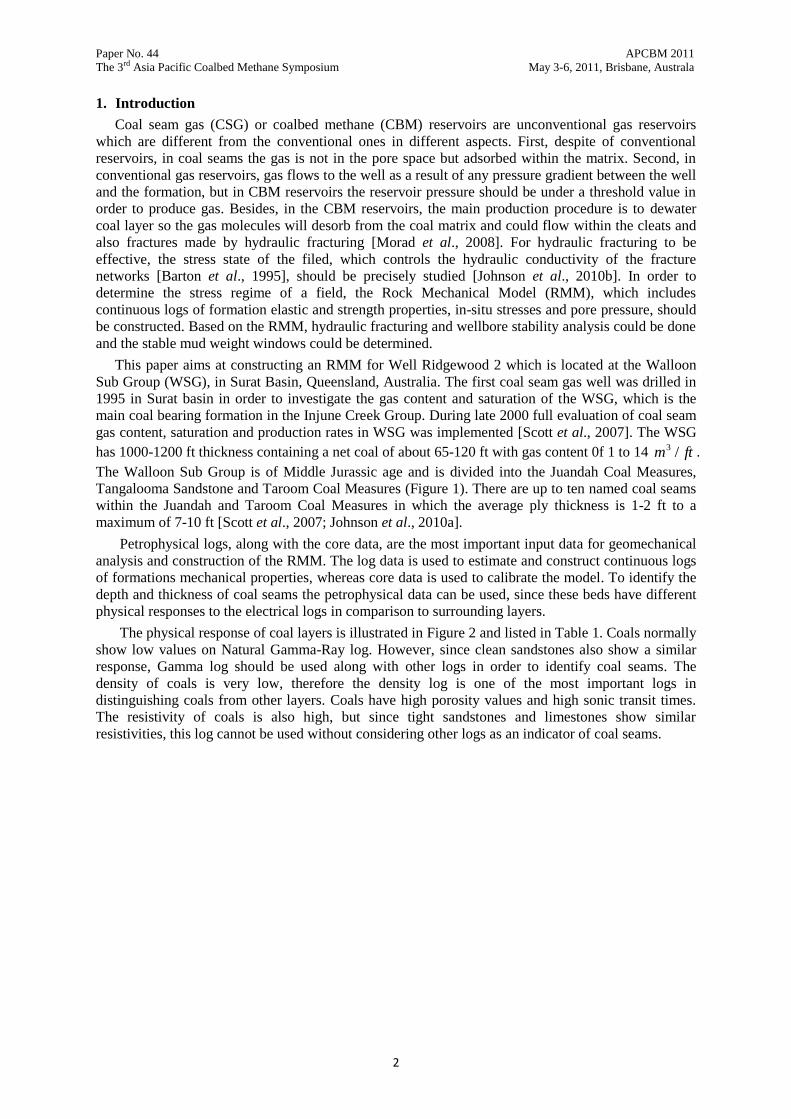
The Walloon Sub Group is of Middle Jurassic age and is divided into the Juandah Coal Measures,
Tangalooma Sandstone and Taroom Coal Measures (Figure 1). There are up to ten named coal seams
within the Juandah and Taroom Coal Measures in which the average ply thickness is 1-2 ft to a
maximum of 7-10 ft [Scott et al., 2007; Johnson et al., 2010a].
Petrophysical logs, along with the core data, are the most important input data for geomechanical
analysis and construction of the RMM. The log data is used to estimate and construct continuous logs
of formations mechanical properties, whereas core data is used to calibrate the model. To identify the
depth and thickness of coal seams the petrophysical data can be used, since these beds have different
physical responses to the electrical logs in comparison to surrounding layers.
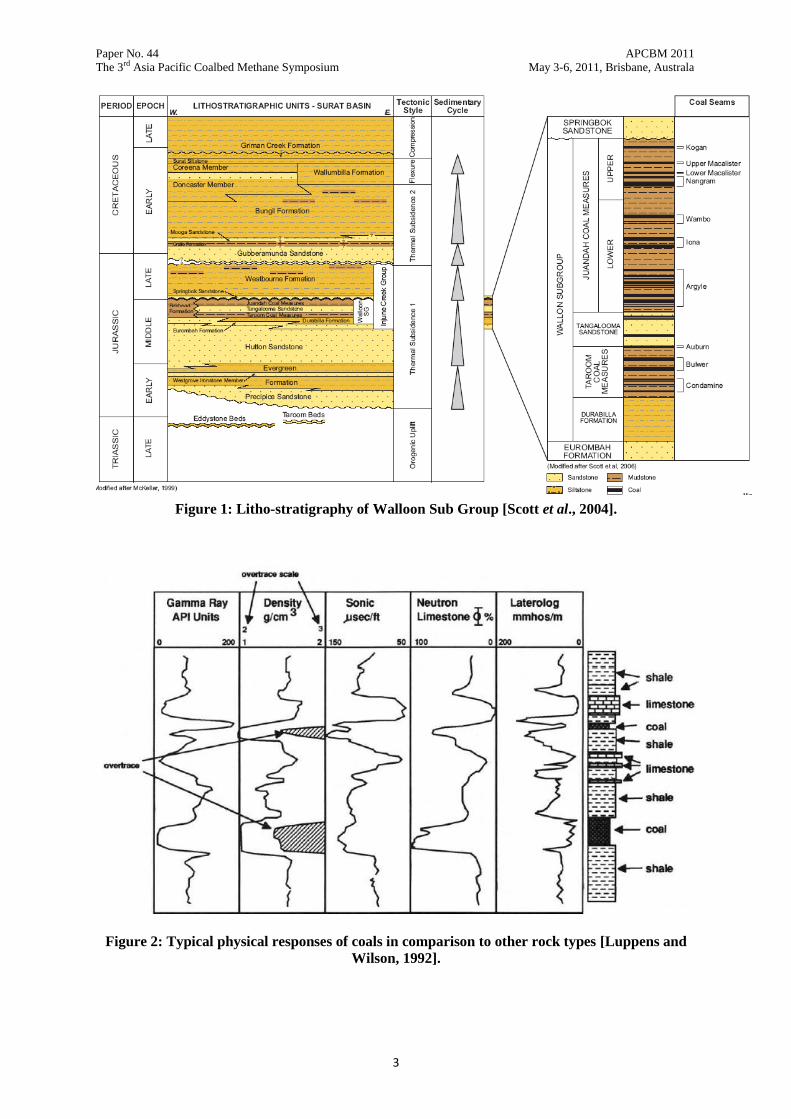
The physical response of coal layers is illustrated in Figure 2 and listed in Table 1. Coals normally
show low values on Natural Gamma-Ray log. However, since clean sandstones also show a similar
response, Gamma log should be used along with other logs in order to identify coal seams. The
density of coals is very low, therefore the density log is one of the most important logs in
distinguishing coals from other layers. Coals have high porosity values and high sonic transit times.
The resistivity of coals is also high, but since tight sandstones and limestones show similar
resistivities, this log cannot be used without considering other logs as an indicator of coal seams.
Paper No. 44 APCBM 2011
The 3rd Asia Pacific Coalbed Methane Symposium May 3-6, 2011, Brisbane, Australa
3
Figure 1: Litho-stratigraphy of Walloon Sub Group [Scott et al., 2004].
Figure 2: Typical physical responses of coals in comparison to other rock types [Luppens and
Wilson, 1992].

Paper No. 44 APCBM 2011
The 3rd Asia Pacific Coalbed Methane Symposium May 3-6, 2011, Brisbane, Australa
4
Table 1: Logging characteristics of Coals [After Luppens and Wilson, 1992].
Log Type Units Response to Coal Conditions which Invalidate Log or
Make Interpretation More Difficult
Gamma Ray API Low natural Gamma
Clean sand adjacent to Coal.
Coal bed containing Uranium-bearing
minerals.
Density 3/ cmg Low density
Washout.
Caved shale adjacent to coal bed.
Fractured strata surrounding coal.
Neutron
Porosity % High porosity
Caving Shale next to coal bed.
Wet clay adjacent to coal bed.
Irregular hole diameter.
Fractured strata surrounding borehole.
Sonic
msft / or
Interval transit
time
Low velocity or
High interval transit
Loose, clean sand next to coal bed.
Irregular hole diameter.
Seam thinner than tool spacing.
Fractured strata surrounding borehole.
Resistivity mohm High resistivity Highly resistant strata next to coal.
2. Rock Mechanical Model (RMM) Constructed for Well Ridgewood 2
Figure 3 shows the workflow used for construction of a Rock Mechanical Model (RMM). This
includes a thorough review of all available data (including seismic, drilling, geology, etc.) and the use
of petrophysical logs to extract formations elastic and strength properties as well as in-situ stresses,
pore pressure and the direction of the maximum horizontal stress. The estimated logs are calibrated
against any available core or downhole test results. For example, rock elastic properties (Young’s
modulus, E) or formation strength (Uniaxial Compressive Strength, UCS) can be calibrated with the
results of triaxial tests conducted on a core plug or the minimum horizontal stress log could be
compared with the results of LOTs performed at specific depths. Rock Mechanical Model was
constructed for Well Ridgewood 2. The details of the process are explained in this section and the
results are presented.
Well Ridgewood 2 is one of a number of wells drilled in WSG in Surat Basin. The coal appears as
thin layers of few metres thickness in Juandah and Taroom Coal Measures, which locate below a
depth of 800 m. Figure 4 shows the Gamma Ray and porosity logs as well as generated Shale volume
log from this formula [Serra et al., 1980]:
,)(
)(
minmax
minlog
GRGR
GRGRVShale
(1)
Where logGR is the value of Gamma-Ray log, minGR is the minimum value of Gamma-Ray log and
maxGR is the maximum value on the Gamma-Ray log.
Figure 4 shows that most of the intervals (between 450 and 750 m) are Shale with interbeds of
Sandstone and Coal seam. Figure 5 shows the compression (DTCO) sonic log together with the
synthetically generated shear log, as no shear log was acquired in this well. We used the Castagna
empirical correlations [Castagna et al., 1993] for this purpose and applied correlation for Sand to
extract shear sonic values for coal:
9.8558042.0 cs VV Sand, (2)

Paper No. 44 APCBM 2011
The 3rd Asia Pacific Coalbed Methane Symposium May 3-6, 2011, Brisbane, Australa
5
4.8677700.0 cs VV Shale. (3)
The velocity is in m/s in above correlations. We used GR and Shale volume logs together with other
available logs to discriminate Shale, Sand and Coal interbeds.
E
Pet
rophysical Logs E
lastic Properties
Rock Strength
RHOBNPHI
v
Vertical Stress
Pp
Pore Pressure
H
h
Hor
izontal Stresses
Image Log
Stre
sses Directions
h
H
RMM
Figure 3: Workflow for construction of a RMM.
Elastic properties:
Dynamic elastic properties of rock including Young’s modulus (Edyn), Poisson’s ratio (dyn), Shear
modulus (Gdyn) and Bulk modulus (Kdyn) can be estimated from shear and compressional sonic
velocity through the following equations [Fjaer et al., 2008]:
)(
)43(22
222
sc
scs
dynVV
VVVE
, (4)
)(2
222
22
sc
scdyn
VV
VV
, (5)
2
sdyn VG , (6)
)3
4( 22
scdyn VVK . (7)
In above equations is density (g/cm3), Vc and Vs are compressional and shear sonic velocity
(m/s), respectively. This shows the importance of acquiring shear sonic log data in any future planned
wells in order to be able to perform a reliable rock mechanics study.
The dynamic properties obtained from above equations need to be changed to static properties. The dynamic elastic modules are higher than those under static load, known as static elastic modules
[Fjaer et al., 2008]. The static Poisson’s ratio was considered to be equal to the dynamic Poisson ratio.
Also, the Biot coefficient of the formations was assumed to be 1 here, which is a conservative
approached commonly used [Rasouli et al., 2011].
The estimated static and dynamic Young’s Modulus as well as Poisson’s ratio and Biot factor
corresponding to Well Ridgewood 2 are illustrated in Figure 6. The results show a range of static
Young’s modulus of 5 – 25 GPa within the studied interval with lower limits being corresponding to
Coal seams. The Poisson’s ratio has an average value of 0.30 for the whole interval with slightly
lower values for Coal seams. Also the core test data available [Johnson et al., 2010b] was used to
calibrate the constructed Young’s modulus log. The results show a good match in general (Figure 6).

Paper No. 44 APCBM 2011
The 3rd Asia Pacific Coalbed Methane Symposium May 3-6, 2011, Brisbane, Australa
6
Strength properties:
The formation fails as the stresses exceed the rock strength. Based on the Mohr-Coulomb criteria,
the rock strength parameter can be defined as uni-axial compressive strength (UCS), internal friction
angle () and tensile strength of the rock (T0). The Mohr-Coulomb failure criteria in the form of
principal stresses expressed as:
,sin1
sin131
UCS (8)
where σ1 and 3 are the maximum and minimum stresses, respectively. The strength parameters are
generally obtained from core tests in the rock mechanics laboratory. Correlations developed based on
lab experiments are used in a specific field to derive the UCS log. Several such correlations have been
developed in Coal seams [Sharma and Singh, 2008; McNally, 1987]. Here we used correlation below
for Sand and Coal intervals [McNally, 1987]:
,DTCO0367.0exp1277 UCS (9)
where UCS is in MPa and DTCO is in terms of s/ft.
Figure 4: GR, porosity and generated Shale volume logs for Well Ridgewood 2.
For Shale intervals we found a linear correlation developed between UCS and static Young’s
Modulus based on previous experiences to be more appropriate. The modified correlation used for this
interval is:
208.0 staEUCS . (10)
In above equations UCS is in MPa, Young’s modulus is in GPa and compression sonic is in s/ft. The
lab UCS results on cores [Johnson et al., 2010b] was used to calibrate the UCS log, which shows a
relatively good match as is shown in Figure 7.

Paper No. 44 APCBM 2011
The 3rd Asia Pacific Coalbed Methane Symposium May 3-6, 2011, Brisbane, Australa
7
Tensile strength of the rock (T0) is usually estimated as 1/8 to 1/12 of its UCS. In this study the
tensile strength was estimated to be approximately 1/10 of the UCS for Well Ridgewood 2.
The internal friction angle (FANG) values shown in Figure 7 were estimated from Plumb (1994)
correlation:
2)1(1.62)1(4.375.26 shaleshale VPorosityVPorosity . (11)
The friction angle shows an average value of 25 deg with lager values of up to 40 deg.
The rock strength properties of Well Ridgewood 2, obtained from the procedure explained above,
are shown in Figure 7. No rock mechanical laboratory tests were available to calibrate and validate the
UCS, tensile strength and the internal friction angle profile.
The results show the UCS changing between 20 and 55 MPa with the lowest values belonging to Coal
seams. The tensile strength follows a similar trend as UCS profile.
450
500
550
600
650
700
750
4080120160200240
Measure
d D
epth
(m
)
DTSM (US/F)
DTCO (US/F)
Figure 5: Compression and synthesised shear sonic logs for Well Ridgewood 2.
Vertical stress and pore pressure:
The principal stresses in a field are considered as a vertical stress (v) and two horizontal stresses
(h and H). The vertical stress is the result of the weight of the overburden rocks and is directly
calculated from the density log as an integration of the density of different formations as [Rasouli et
al., 2011]:
TVD
Surfacev gdh . (12)
The density log can be extrapolated to the surface using the following equation:

Paper No. 44 APCBM 2011
The 3rd Asia Pacific Coalbed Methane Symposium May 3-6, 2011, Brisbane, Australa
8
,0
f
eExtrapolat TVDdRHOB (13)
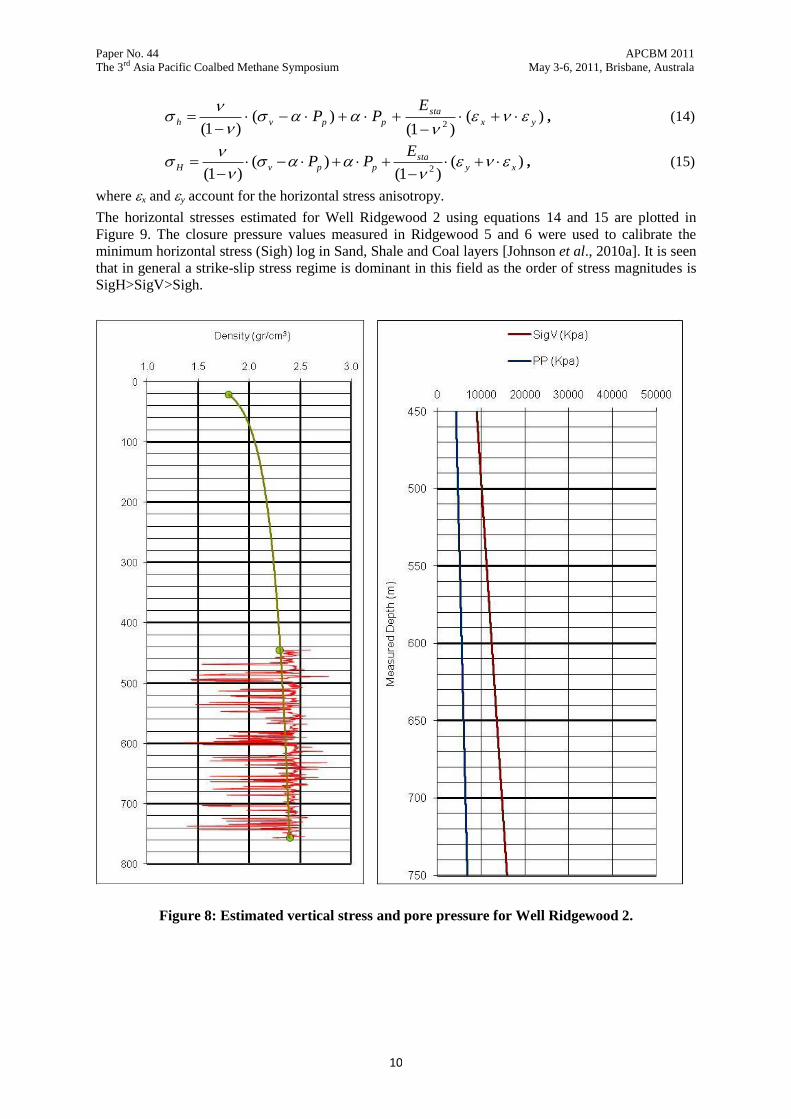
where 0 is the surface density and d and f are constants derived from the density log. Figure 8 shows
the extrapolated density log and the overburden stress estimated in Well Ridgewood 2.
The pore pressure is normal in the studied interval and an estimation of it is shown in Figure 8, which
was obtained from available data from nearby wells [Johnson et al., 2010a].
450
500
550
600
650
700
750
0 10 20 30
Measure
d D
epth
(m
)
E_dynamic (Gpa)
E_static (Gpa)
E_Core (Gpa)
450
500
550
600
650
700
750
0 0.3 0.6 0.9 1.2
Measure
d D
epth
(m
)
Poisson's Ratio
Biot Factor
Figure 6: Dynamic and static Young’s modulus, Poisson’s ratio and Biot factor logs for Well
Ridgewood 2.

Paper No. 44 APCBM 2011
The 3rd Asia Pacific Coalbed Methane Symposium May 3-6, 2011, Brisbane, Australa
9
450
500
550
600
650
700
750
0 20 40 60 80
Measure
d D
epth
(m
)
UCS (Mpa)
TSTR (Mpa)
FANG (deg)
UCS-Core (Mpa)
Figure 7: Estimated UCS, tensile strength and friction angle logs for Well Ridgewood 2.
Horizontal Stresses:
The regional principal tectonic directions can be estimated from the regional geology structure of
the field and at local scales from the direction of breakouts in a drilled well. Usually faults are
directed along the direction of maximum horizontal stress whereas the breakouts (borehole ovalisation)
occur along the minimum horizontal stress direction.
In this study the direction of maximum horizontal stress was considered N7.5°E, which was
obtained from the existing information from nearby wells [Johnson et al., 2010b]. However, this is
unimportant in wellbore stability analysis as the wellbore is vertical.
Poro-elastic formulae were used to extract the magnitude of horizontal stresses as below [Fjaer et
al., 2008]:
Paper No. 44 APCBM 2011
The 3rd Asia Pacific Coalbed Methane Symposium May 3-6, 2011, Brisbane, Australa
10
)()1(
)()1( 2 yx
sta
ppvh
EPP
, (14)
)()1(
)()1( 2 xy
stappvH
EPP
, (15)
where x and y account for the horizontal stress anisotropy.
The horizontal stresses estimated for Well Ridgewood 2 using equations 14 and 15 are plotted in
Figure 9. The closure pressure values measured in Ridgewood 5 and 6 were used to calibrate the
minimum horizontal stress (Sigh) log in Sand, Shale and Coal layers [Johnson et al., 2010a]. It is seen
that in general a strike-slip stress regime is dominant in this field as the order of stress magnitudes is
SigH>SigV>Sigh.
Figure 8: Estimated vertical stress and pore pressure for Well Ridgewood 2.

Paper No. 44 APCBM 2011
The 3rd Asia Pacific Coalbed Methane Symposium May 3-6, 2011, Brisbane, Australa
11
Figure 9: Estimated horizontal stresses for Well Ridgewood 2.
3. Mud weight windows determination
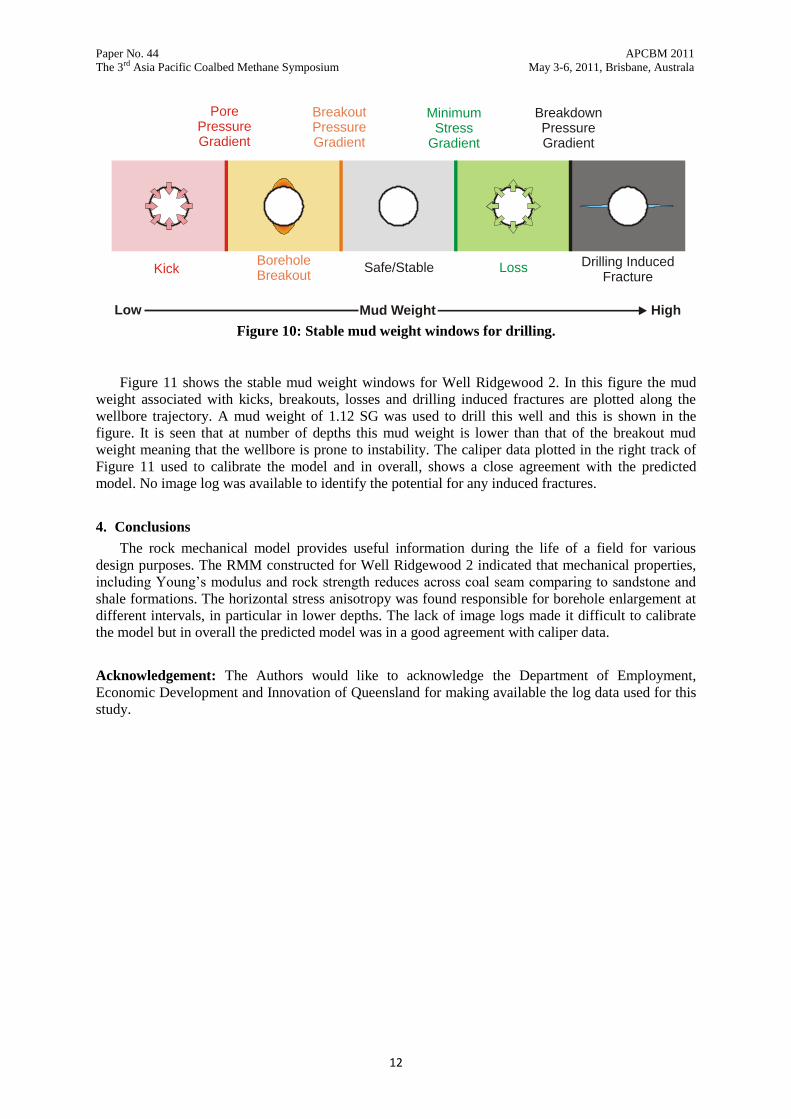
The stable mud weight windows concept is shown schematically in Figure 10 where it is seen
how reduction of mud weight below the optimum mud weight windows could result in wellbore
breakout and kick. On the other hand increasing the mud weight above the minimum stress gradient
and fracture gradient will result in mud loss and fracturing of the formation, respectively.
Paper No. 44 APCBM 2011
The 3rd Asia Pacific Coalbed Methane Symposium May 3-6, 2011, Brisbane, Australa
12
De
pth
Drilling Induced Fracture
Kick
Pore Pressure Gradient
Breakout Pressure Gradient
Minimum Stress
Gradient
Breakdown Pressure Gradient
A’A
B’ B
KickBorehole Breakout
Loss Drilling Induced Fracture
Safe/Stable
Mud Weight HighLow
Figure 10: Stable mud weight windows for drilling.
Figure 11 shows the stable mud weight windows for Well Ridgewood 2. In this figure the mud
weight associated with kicks, breakouts, losses and drilling induced fractures are plotted along the
wellbore trajectory. A mud weight of 1.12 SG was used to drill this well and this is shown in the
figure. It is seen that at number of depths this mud weight is lower than that of the breakout mud
weight meaning that the wellbore is prone to instability. The caliper data plotted in the right track of
Figure 11 used to calibrate the model and in overall, shows a close agreement with the predicted
model. No image log was available to identify the potential for any induced fractures.
4. Conclusions
The rock mechanical model provides useful information during the life of a field for various
design purposes. The RMM constructed for Well Ridgewood 2 indicated that mechanical properties,
including Young’s modulus and rock strength reduces across coal seam comparing to sandstone and
shale formations. The horizontal stress anisotropy was found responsible for borehole enlargement at
different intervals, in particular in lower depths. The lack of image logs made it difficult to calibrate
the model but in overall the predicted model was in a good agreement with caliper data.
Acknowledgement: The Authors would like to acknowledge the Department of Employment,
Economic Development and Innovation of Queensland for making available the log data used for this
study.

Paper No. 44 APCBM 2011
The 3rd Asia Pacific Coalbed Methane Symposium May 3-6, 2011, Brisbane, Australa
13
Figure 11: Mud weight windows for Well Ridgewood 2.

Paper No. 44 APCBM 2011
The 3rd Asia Pacific Coalbed Methane Symposium May 3-6, 2011, Brisbane, Australa
14
References
1. Castagna, J.P., Batzle, M.L. and Kan T.K. Rock Physics—the Link between Rock Properties and
AVO Response. Theory and Practice of AVO Analysis Investigations in Geophysics. Society of
Exploration Geophysicists. 8, 135–171, 1993.
2. Johnson, R.L., Scott, M.P., Jeffrey, R.G., Chen, Z., Bennett, L., Vandenborn, C. and
Tcherkashnev S. Evaluating Hydraulic Fracture Effectiveness in a Coal Seam Gas Reservoir from
Surface Tiltmeter and Microseismic Monitoring. The SPE Annual Technical Conference and
Exhibition held in Florence, Italy. SPE 133063, 2010a.
3. Johnson, R.L., Glassborow, B., Scott, M.P., Datery, A., Pallikathekathil, Z.J. and Meyer, J.
Utilizing Current Technologies to Understand Permeability, Stress Azimuths and Magnitudes and
Their Impact on Hydraulic Fracturing Success in a Coal Seam Gas Reservoir. The SPE Asia
Pacific Oil and Gas Conference and Exhibition held in Brisbane, Australia. SPE 133066, 2010b.
4. Luppens, J.A. and Wilson S.E. Manual on Drilling, Sampling, and Analysis of Coal. American
Society for Testing and Materials, 1992.
5. McNally, G.H. Estimation of Coal Measures Rock Strength Using Sonic and Neutron Logs.
Geoexploration. 24, 381-395, 1987.
6. Plumb R.A. Influence of Composition and Texture on the Failure Properties of Clastic Rocks.
SPE 28022, 1994.
7. Rasouli, V., Zacharia, J. and Elike M. The Influence of Perturbed Stresses near Faults on Drilling
Strategy: A Case Study in Blacktip Field, North Australia. Journal of Petroleum Science &
Engineering. 76, 37-50, 2011.
8. Serra, О., Baldwin, J. and Quirein, J. Theory, Interpretation, and Practical Applications of Natural
Gamma Ray Spectroscopy. SPWLA 21st Annual Logging Symposium Transactions, Paper Q,
1980.
9. Scott, S.G., Anderson, B., Crosdale, P.J., Dingwall, J.A. and Leblang G. Coal Petrology and Coal
Seam Gas Contents of the Walloon Subgroup – Surat Basin, Queensland, Australia. International
Journal of Coal Geology 70, 209-222, 2007.
10. Scott, S.G., Anderson, B., Crosdale, P.J., Dingwall, J.A. and Leblang G. Revised Geology and
Coal Seam Gas Characteristics of the Walloon Subgroup – Surat Basin Queensland. Paper
presented at Eastern Australasian Basins Symposium II, Petroleum Exploration Society of
Australia, Special Pub., In: P.J. Boult, D.R. Johns and S.C. Lang, eds., 345-355, 2004.
11. Sharma, P.K. and Singh T.N. A Correlation between P-wave Velocity, Impact Strength Index,
Slake Durability Index and Uniaxial Compressive Strength. Bulletin of Engineering Geology And
The Environment 67, 17-22, 2008.
Related Documents