FINAL REPORT A Risk Assessment Of Selected Landfill Sites In The North Eastern Waste Management Region Prepared for NevRwaste PO BOX 672 Wangaratta VIC 11 September 2006 43294913 J:\JOBS\43294913\Reporting\NevRwaste Final Report.doc

Welcome message from author
This document is posted to help you gain knowledge. Please leave a comment to let me know what you think about it! Share it to your friends and learn new things together.
Transcript
F I N A L R E P O R T
A Risk Assessment Of Selected Landfill Sites In The North Eastern Waste Management Region
Prepared for
NevRwaste PO BOX 672 Wangaratta VIC
11 September 2006 43294913
J:\JOBS\43294913\Reporting\NevRwaste Final Report.doc

A R I S K A S S E S S M E N T O F S E L E C T E D L A N D F I L L S I T E S I N T H E N O R T H E A S T E R N W A S T E M A N A G E M E N T R E G I O N
Contents
Prepared for NevRwaste, 11 September 2006 J:\JOBS\43294913\Reporting\NevRwaste Final Report.doc
1 Introduction ................................................................................................... 1-1 1.1 Background .....................................................................................................1-1 1.2 Scope of Work.................................................................................................1-2
2 Approach and Methodology......................................................................... 2-1 2.1 Features of Environmental Risk ....................................................................2-1
2.1.1 Risk to Groundwater Quality ..............................................................2-1 2.1.2 Risk to Surface Water Quality ............................................................2-1 2.1.3 Risk to Nearby Land Uses .................................................................2-1 2.1.4 General Environmental Risk ..............................................................2-2 2.1.5 Rehabilitation .....................................................................................2-2 2.1.6 Greenhouse Gas Generation .............................................................2-2
2.2 Data Collection and Collation ........................................................................2-3 2.2.1 Geodatabase Creation .......................................................................2-3 2.2.2 Questionnaire.....................................................................................2-3 2.2.3 Integrating Geodatabases and Questionnaire ...................................2-4 2.2.4 Existing Geodatabases ......................................................................2-4 2.2.5 Created Geodatabases ......................................................................2-5
2.3 Risk Assessment ............................................................................................2-5 2.3.1 Risk Calculations................................................................................2-6
2.4 Assumptions and Limitations........................................................................2-7 2.5 Assessment of Relative Risk Ranking..........................................................2-8 2.6 Verification/Validation ....................................................................................2-8
3 Risk Assessment Results ............................................................................ 3-1 3.1.1 Verification/ Validation Results...........................................................3-1 3.1.2 Risk by Environmental Category........................................................3-1 3.1.3 Identification of Key Risk Variables....................................................3-2 3.1.4 NevRwaste Closed Landfill GIS .........................................................3-3
4 Recommendations ........................................................................................ 4-1
5 Conclusion..................................................................................................... 5-1
6 References..................................................................................................... 6-1
7 Limitations..................................................................................................... 7-1
A R I S K A S S E S S M E N T O F S E L E C T E D L A N D F I L L S I T E S I N T H E N O R T H E A S T E R N W A S T E M A N A G E M E N T R E G I O N
List of Tables, Figures & Appendices
Prepared for NevRwaste, 11 September 2006 J:\JOBS\43294913\Reporting\NevRwaste Final Report.doc
List of Tables, Figures & Appendices
Tables
Table 1 Environmental Risk Categories and Variables Table 2a Likelihood and Consequence Scores by Risk Segment (Surface Water X 2) Table 2b Likelihood and Consequence Scores by Risk Segment (Even Weighting) Table 2c Likelihood and Consequence Scores by Risk Segment (No Weighting) Table 3a GIS and Questionnaire – Likelihood and Consequence Scores (Surface Water X 2) Table 3b GIS and Questionnaire – Likelihood and Consequence Scores (Even Weighting) Table 3c GIS and Questionnaire – Likelihood and Consequence Scores (No Weighting) Error! No table of figures entries found.
Figures
Figure 1 Online Questionnaire Interface Figure 2a Relative Risk Assessment Overall Rankings of all Sites (Surface Water x 2) Figure 2b Relative Risk Assessment Overall Rankings of all Sites (Even Weighting) Figure 2c Relative Risk Assessment Overall Rankings of all Sites (No Weighting) Figure 3 Relative Risk Plot of GIS risk scores (No Weighting). Figure 4 Relative Risk Plot of Questionnaire risk scores (No Weighting). Figure 5 Alpine Shire Closed Landfill Relative Risk Assessment Figure 6 Benalla Shire Closed Landfill Relative Risk Assessment Figure 7 Indigo Shire Closed Landfill Relative Risk Assessment Figure 8 Mansfield Shire Closed Landfill Relative Risk Assessment Figure 9 Towong Shire Closed Landfill Relative Risk Assessment Figure 10 Wangaratta Shire Closed Landfill Relative Risk Assessment Error! No table of figures entries found. Error! No table of figures entries found. Error! No table of figures entries found.
Appendices A. Landfill site names sorted by site number B. Example Landfill Questionnaire
A R I S K A S S E S S M E N T O F S E L E C T E D L A N D F I L L S I T E S I N T H E N O R T H E A S T E R N W A S T E M A N A G E M E N T R E G I O N
Section 1 Introduction
Prepared for NevRwaste, 11 September 2006. J:\JOBS\43294913\Reporting\NevRwaste Final Report.doc
1-1
1 Introduction
1.1 Background In recent years the focus of rural waste management in Victoria has been to move from numerous small, unlicensed landfills to larger, centralised regional facilities. This has been facilitated by strategic planning undertaken by Regional Waste Management Group’s (RWMG’s) and has been complemented by the establishment of transfer stations to replace the closed landfills. This has resulted in the short term closure of many small rural landfills with limited resources available to LG and RWMG’s, for planning and site rehabilitation.
This project is focusing on closed landfills located in the North East Waste Management Region (NEWMR). NevRwaste is the RWMG for North East Victoria, and is one of sixteen RWMG’s. Operating in partnership with the Environment Protection Authority (EPA), EcoRecycle and LG to implement the state’s solid waste management and resource efficiency programs in north east Victoria. NevRwaste developed a regional waste management plan in 1999 and subsequently, over 30 landfills have been closed across the NEWMR. Typically, these landfills were small, received solid municipal waste, unlicensed by the EPA, served a local population of less than 5000 people, were operated and managed by the Council, underwent varying degrees of supervision and controls, and in many cases have little or no environmental monitoring. When combined with the varying environments relating to the location of each closed landfill, varying environmental risks are associated with these sites.
Prior to this project, in 2005 URS completed an environmental risk assessment of operating unlicensed landfills in Victoria on behalf of the Environment Protection Authority Victoria (EPAV). In that project URS developed a desktop Geographical Information System (GIS), which linked with other collated data to calculate a relative risk score for each operating landfill. The results of the risk assessment were communicated through digital maps, graphs and a written report. The outcomes of the study provided much needed assistance to RWMG’s and LG in providing a tool that enabled the prioritisation of limited regional resources.
The scope of the EPA unlicensed landfill risk assessment project was limited to operating landfills, resulting in closed landfills being excluded from the assessment. This provided the impetus for NevRwaste to initiate a similar (but not identical) study focusing on closed landfills within the NEWMR.
URS Australia Pty Ltd (URS) had been engaged by NevRwaste to conduct an environmental risk assessment of selected closed landfills within the NEWMR. The objective of the project is to rank selected closed landfills according to their relative environmental risk, and provide a tool for NevRwaste to prioritise sites for further investigation and rehabilitation. The relative environmental risk is measured against the other closed landfills considered in this study and does not have regard to any licensed or operating facilities which, due to their waste intake, both in terms of tonnage and waste types, are generally subject to higher standards of engineering design and environmental control.
In order to achieve the objective, the environmental risk assessment has been conducted as a desktop study and utilised information from state databases and specific information provided by RWMG’s in a questionnaire. The information was processed and assessed using a GIS, to rank the environmental risk of selected closed landfills (relative to the other landfills being assessed). The aim of the ranking is the provision of a screening tool to be used to prioritise effort and resources to the highest risk sites as determined to be appropriate by NevRwaste.

A R I S K A S S E S S M E N T O F S E L E C T E D L A N D F I L L S I T E S I N T H E N O R T H E A S T E R N W A S T E M A N A G E M E N T R E G I O N
Section 1 Introduction
Prepared for NevRwaste, 11 September 2006. J:\JOBS\43294913\Reporting\NevRwaste Final Report.doc
1-2
Some closed landfills will pose a greater environmental risk relative to others because of the varying operational controls and environmental settings. There is limited information and resources available to undertake a detailed assessment of the environmental risk posed by each closed landfill within the NEWMR. URS has undertaken this relative risk assessment based on the currently available information
Meetings with NevRwaste Steering Committee provided a forum for discussion and review of various technical and more general aspects of the project during its development, formulation and finalisation.
The results of this risk assessment will provide NevRwaste with a greater understanding of the relative environmental risks posed by each closed landfill in their jurisdiction. This will assist NevRwaste in the investigation, strategic planning and management of the aftercare and rehabilitation of closed landfills within the NEWMR.
1.2 Scope of Work A total of 35 unlicensed landfills from six municipalities were initially identified by NevRwaste to be assessed by this project. Landfill managers identified that some were not to be included. Consequently, a total of 30 closed landfill sites have been included in the risk assessment. Refer to Appendix A for a full list of sites.
The scope of work for this project includes the following key tasks:
• Review and collate information regarding the siting and past operation of closed unlicensed landfills in the NEWMR.
• Development of a simple, easy to follow relative risk ranking system using GIS manipulation of critical siting and environmental parameters;
• Undertake an assessment of the relative environmental risks associated with currently closed landfills in North East Victoria, to assist NevRwaste in their prioritisation of any further investigation.
• Consultation with NevRwaste, it members and stakeholders on the findings of the relative risk assessment; and
• Presentation of the final report combined with appropriate GIS maps to visually convey the geographic distribution of key sites as well as their overall ranking.
A R I S K A S S E S S M E N T O F S E L E C T E D L A N D F I L L S I T E S I N T H E N O R T H E A S T E R N W A S T E M A N A G E M E N T R E G I O N
Section 2 Approach and Methodology
Prepared for NevRwaste, 11 September 2006. J:\JOBS\43294913\Reporting\NevRwaste Final Report.doc
2-1
2 Approach and Methodology
2.1 Features of Environmental Risk There are numerous features of landfill location and design, operational controls, aftercare program and environmental factors that translate to potential environmental risks for closed landfills. These risks are categorised as – risk i) groundwater, ii) surface water quality, iii) nearby landuses, iv) general environmental risks, v) rehabilitation, and v) greenhouse gas emissions. These features are discussed in the following sections, and included in Table 1 (attached).
Consultation with NevRwaste members confirmed these risk categories.
2.1.1 Risk to Groundwater Quality
The factors considered under this category relate to the potential for landfill leachate to enter the groundwater system and impact on groundwater quality. The factors considered include:
• Permeability of the geology underlying the site;
• Depth to groundwater from the base of the landfill;
• Groundwater quality/salinity and beneficial uses;
• Groundwater bores in vicinity of the landfill; and
• Potential for leachate generation related to rainfall and evaporation at the site.
2.1.2 Risk to Surface Water Quality
Environmental risks considered under this category relate to the potential for landfill leachate to enter local surface waters. The factors considered include:
• Distance from the landfill to surface waters; and
• Site run-off controls.
2.1.3 Risk to Nearby Land Uses
This category considers potential risks related to sensitive land uses and their susceptibility to odour, litter and amenity problems. The primary factors are:
• Distance from the landfill to landuse zones that enable sensitive uses (eg. residential zones);
• Distance from the landfill to land covered by planning instruments such as Vegetation Protection Overlays (VPOs), Environmental Significance Overlays (ESOs) and Schools and Hospitals (PUZ2, PUZ3), which identify areas of environmental sensitivity.

A R I S K A S S E S S M E N T O F S E L E C T E D L A N D F I L L S I T E S I N T H E N O R T H E A S T E R N W A S T E M A N A G E M E N T R E G I O N
Section 2 Approach and Methodology
Prepared for NevRwaste, 11 September 2006. J:\JOBS\43294913\Reporting\NevRwaste Final Report.doc
2-2
• Visibility of the landfill to the public within 500m. Identifies if the landfill reduces aesthetic amenity of the area.
2.1.4 General Environmental Risk
This category was developed to include a variety of potential environmental risks that could not be considered in any of the above categories or an appropriate individual category. The factors are:
• Waste-types accepted;
• Potential to have received prohibited waste (eg. pesticide containers, batteries and waste oils);
• Operational standards in accordance with the State Environment Protection Policy (Siting and Management of Landfills Receiving Municipal Waste) (referred to as the State Environment Protection Policy), including fencing, site supervision requirements;
• Environmental monitoring and if any impacts have been discovered;
• Identified presence of landfill leachate on site and leachate collection.
2.1.5 Rehabilitation
This category measures the extent of aftercare, rehabilitation and capping undertaken at each site and the compliance against, EPA Publication 674 – Rehabilitation of Landfills Exempt From Licensing; November 1999. It was assumed that the extent of rehabilitation undertaken at a site related inversely to environmental risk.
• Rehabilitation work undertaken at the former landfill site;
• Landfill Capping;
• Drainage Controls;
• Regularity of closed landfill inspection and maintenance.
2.1.6 Greenhouse Gas Generation
Greenhouse gas generation potential is measured in this category, the categories are based on EPA Publication 788- Siting, Design, Operation and Rehabilitation of Landfills; October 2001. Variables affecting greenhouse gas generation include the volume and age of waste. That is;
• Years since closure, relates to the age of waste and its potential to generate greenhouse gas. This reduces with age up to 30 years.
• The Volume of waste directly related to the amount of greenhouse gas generated.

A R I S K A S S E S S M E N T O F S E L E C T E D L A N D F I L L S I T E S I N T H E N O R T H E A S T E R N W A S T E M A N A G E M E N T R E G I O N
Section 2 Approach and Methodology
Prepared for NevRwaste, 11 September 2006. J:\JOBS\43294913\Reporting\NevRwaste Final Report.doc
2-3
Given the small volumes of waste, most of the closed landfills will have an almost negligible contribution to greenhouse gas.
2.2 Data Collection and Collation Two types of data were used in this risk assessment, being:
1. Existing digital environmental and planning geodatabases with state wide coverage; and
2. Site-specific hardcopy data collected from landfill managers and NevRwaste members using a questionnaire and direct consultation (i.e. email and telephone).
Both sets of data were combined in a customised NevRwaste Closed Landfill GIS which was used to calculate the likelihood and consequence scores for all variables, based on the scoring system developed in consultation with the NevRwaste steering committee outlined in Table 1 (attached).
2.2.1 Geodatabase Creation
Geodatabases (GIS layers as listed in 2.2.3) were supplied to, or sourced by URS. Spatial features of environmental risk were represented in the geodatabase. The risk scores assigned to each geodatabase are outlined in Table 1 (attached).
The risk scores were determined in accordance with requirements of the SEPP, and generally varied with the distance to a feature to represent natural attenuation. Examples include distance to rivers and depth to groundwater. Risk scores also vary with various feature types such as Geology type or Beneficial Use. From this interpretation of the data sets, appropriate risk scores were assigned. For example for a groundwater bore <500m, the landfill was assigned a likelihood score of 3 (see Section 2.3).
The use of geodatabases was restricted to the chosen buffer distance from each landfill to represent natural attenuation from the source, which varied from 100m (for Planning Overlays) to 1000m (for groundwater bores) , this also allowed for quicker processing of the data. It should be noted that this use of data does not affect the accuracy of the assessment.
The final output was a collation of all the GIS risk variables for each landfill, as presented in Tables 3a, 3b, 3c (attached). This GIS table was then incorporated with the questionnaire database to provide a complete listing of all the risk variables for each site to then allow the total risk to be calculated. (See Section 2.2.2)
2.2.2 Questionnaire
URS prepared an internet questionnaire (see Figure 1) addressing some of the site-specific environmental risk factors identified in Section 2.1, including the type of waste received, site supervision and surface water controls. In addition, the questionnaire included several questions to obtain ancillary and/or background information to confirm information provided by an existing database, for example, to confirm if surface water bodies are close to the site. These questionnaires were provided through a webpage on the internet to NevRwaste members or
A R I S K A S S E S S M E N T O F S E L E C T E D L A N D F I L L S I T E S I N T H E N O R T H E A S T E R N W A S T E M A N A G E M E N T R E G I O N
Section 2 Approach and Methodology
Prepared for NevRwaste, 11 September 2006. J:\JOBS\43294913\Reporting\NevRwaste Final Report.doc
2-4
local councils for completion. Where required, further consultation with NevRwaste members or council officers was conducted to clarify their responses. A blank hardcopy example questionnaire is provided in Appendix B.
For each landfill, NevRwaste members entered the responses to key questions into the questionnaire. Based on the response to each question, a risk score was assigned, the interface was used to calculate the likelihood and/or consequence scores associated with the relevant environmental risk factor as specified in Table 1 (attached), (refer to Section 2.3).
2.2.3 Integrating Geodatabases and Questionnaire
The information received from questionnaires was incorporated into a database. If the information from the GIS database did not correspond with the information from the questionnaire, the information from the questionnaire was used, when appropriate. The outcome is presented in Tables 3a, 3b, 3c.
The GIS risk information was subsequently linked with the questionnaire and compiled. The risk variables were added up to calculate the total likelihood RL and consequence RC scores. These risk totals were then graphed to determine the relative risk ranking from the risk plots, which are presented in the attached relative risk assessment Figures and Tables.
2.2.4 Existing Geodatabases
Several existing geodatabases were incorporated into the risk assessment's GIS platform. These included:
• Landfill Locations (ie. AMG coordinates and addresses) – (Provided by NevRwaste members 2006);
• Transport and Roads - VicMap (State of Victoria, 2006);
• Planning (ie. landuse zones and overlays)- VicMap (State of Victoria, 2006);
• Hydrology - VicMap (State of Victoria, 2004);
• Geology (Geological Survey of Victoria, 1998);
• Groundwater Bores and Beneficial Use – Statewide Groundwater Database (DSE, 2001);
• Depth to Groundwater – Groundwater Vulnerability Project (DSE, 2001); and
• Average Rainfall and Evapotranspiration (Bureau of Meteorology, 1998; Bureau of Meteorology, 2000).
A R I S K A S S E S S M E N T O F S E L E C T E D L A N D F I L L S I T E S I N T H E N O R T H E A S T E R N W A S T E M A N A G E M E N T R E G I O N
Section 2 Approach and Methodology
Prepared for NevRwaste, 11 September 2006. J:\JOBS\43294913\Reporting\NevRwaste Final Report.doc
2-5
2.2.5 Created Geodatabases
Landfill locations
Digital GIS layers were collated From NevRwaste members
A digital GIS layer showing the unlicensed landfills was collated from information received from LG, and NevRwaste. Some landfill location information was received on hardcopy maps or as coordinates. These locations were digitised and compiled to create the final landfill location as a GIS layer.
2.3 Risk Assessment Two aspects of environmental risk have been considered in this assessment:
• Likelihood: The likelihood of an environmental impact (eg. landfill leachate) impacting on the surrounding environment or other receptor; and
• Consequence: The scale or magnitude of the potential impact (ie. the severity/extent if it were to occur).
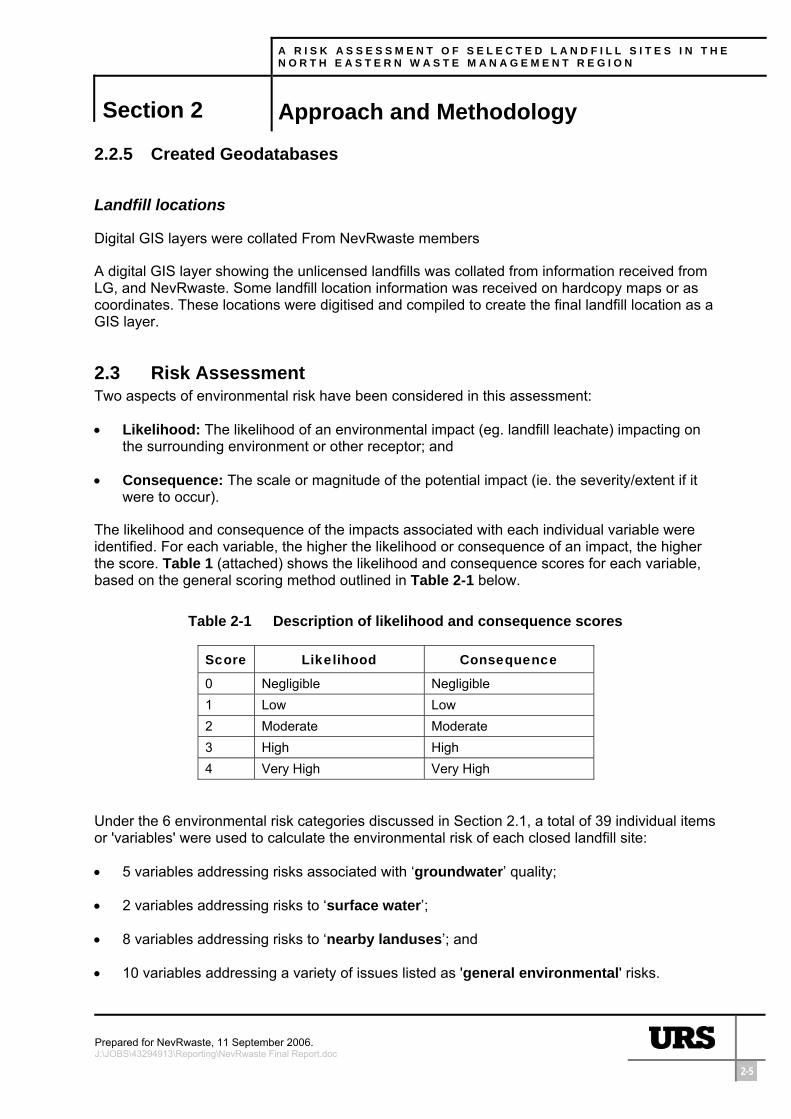
The likelihood and consequence of the impacts associated with each individual variable were identified. For each variable, the higher the likelihood or consequence of an impact, the higher the score. Table 1 (attached) shows the likelihood and consequence scores for each variable, based on the general scoring method outlined in Table 2-1 below.
Table 2-1 Description of likelihood and consequence scores
Score Likelihood Consequence
0 Negligible Negligible 1 Low Low 2 Moderate Moderate 3 High High 4 Very High Very High
Under the 6 environmental risk categories discussed in Section 2.1, a total of 39 individual items or 'variables' were used to calculate the environmental risk of each closed landfill site:
• 5 variables addressing risks associated with ‘groundwater’ quality;
• 2 variables addressing risks to ‘surface water’;
• 8 variables addressing risks to ‘nearby landuses’; and
• 10 variables addressing a variety of issues listed as 'general environmental' risks.

A R I S K A S S E S S M E N T O F S E L E C T E D L A N D F I L L S I T E S I N T H E N O R T H E A S T E R N W A S T E M A N A G E M E N T R E G I O N
Section 2 Approach and Methodology
Prepared for NevRwaste, 11 September 2006. J:\JOBS\43294913\Reporting\NevRwaste Final Report.doc
2-6
• 9 variables addressing the extent of ‘rehabilitation’ undertaken at each to site.
• 5 variables addressing the risk of ‘greenhouse gas’ emissions occurring.
Note that for two groundwater variables (proximity of groundwater bores and the beneficial use of groundwater in the area) there was only likelihood or consequence score, respectively. This is because each of these variables addresses the same risk scenario.
Table 1 (attached) provides a break down of the 6 categories, including the source/s of data (ie. database, questionnaire) and the environmental risk likelihood and consequence scores derived for each variable.
2.3.1 Risk Calculations
The overall relative risk score for each landfill was determined by adding the total likelihood score (RL ) and the total consequence score (RC ). These values are calculated by adding together the scores for all 39 individual variables.
The NevRwaste Committee was consulted following the development of an initial risk assessment methodology. The Committee identified that due to the small number of variables related to surface water, risks associated with this category were not effectively considered when calculating the relative risk. Consequently, the results for the surface water risk segment have been weighted by a factor of two. The resulting equations for calculating RL and RC are:
RL = GWL + 2SWL + NLL +GEL+ REL + GRL ……….Equation 1
RC = GWC + 2SWC + NLC + GEC+ REC + GRC ……….Equation 2
Other feedback received on presentation of the preliminary results to NevRwaste included, using an even weighting on each risk category. This was achieved using a ratio of ‘general environmental’ which has 10 variables.
RL =LLLLLL GR
510 RE
910 GE NL
810 SW
210 GW
510
+++++ ……….Equation 3
RC = CCCCCC GR
510 RE
910 GE NL
810 SW
210 GW
510
+++++ ……….Equation 2
Where,
GWL ∑ Groundwater segment likelihood scores GEL ∑ General environmental segment likelihood scores
GWC ∑ Groundwater segment consequence scores GEC ∑ General environmental segment consequence scores
SWL ∑ Surface water segment likelihood scores REL ∑ Rehabilitation segment likelihood scores
SWC ∑ Surface water segment consequence scores REC ∑ Rehabilitation segment consequence scores
NLL ∑ Nearby landuse segment likelihood scores GRL ∑ Greenhouse segment likelihood scores
NLC ∑ Nearby landuse segment consequence scores GRC ∑ Greenhouse segment consequence scores
A R I S K A S S E S S M E N T O F S E L E C T E D L A N D F I L L S I T E S I N T H E N O R T H E A S T E R N W A S T E M A N A G E M E N T R E G I O N
Section 2 Approach and Methodology
Prepared for NevRwaste, 11 September 2006. J:\JOBS\43294913\Reporting\NevRwaste Final Report.doc
2-7
The results of both weightings are discussed in Section 3.1.
2.4 Assumptions and Limitations The following assumptions were made during the relative risk assessment:
Questionnaire
• Landfill depth, volume– where an estimation of depth or width was provided as a range, the most conservative value (in terms of environmental risk) was used;
• Landfill waste type – where it was noted that more than one waste type is or has been accepted during the life of the landfill, the assessment of relative risk was based on which waste type poses the greatest potential environmental risk;
• Questionnaire responses overrode the risk scores from the geodatabases, especially in cases where higher risk scores were identified in the questionnaire than in the geodatabases.
• If questionnaire risk scores were less than geodatabase risk scores, then the geodatabase risk scores prevailed. For example, In the case where the questionnaire response indicated there was no surface waters within the buffer, and the GIS indicating there was surface water then the GIS risk score prevailed. A low questionnaire score could mean that the question was not answered. It is also a conservative assumption taking the highest possible risk score.
Geodatabases:
• The depth to groundwater layer was in 5m ranges, consequently the rounded average value was assumed as the depth, as provided in the original dataset. For example an original range of 0-5m was represented as the value 2m and a 5-10m range was represented as 7m. The landfill depth (provided in the questionnaire) was subtracted from the depth to groundwater value to give a more accurate representation of the depth to groundwater from the base of the landfill.
• It was assumed that the surface water layer represented water courses that could potentially be impacted by leachate (i.e. irrespective of flow direction etc).
• It was assumed that if no groundwater bores were located within 1000 m of the site then it was considered improbable that leachate would impact current groundwater use. A “zero” likelihood was assigned. Potential future users of groundwater are accounted for by the consequence score for the beneficial use variable.
• Average annual rainfall and evaporation grid layers were assumed to relate to the potential for leachate generation within the landfill. No allowance has been made for seasons, rainfall intensity or the storage capacity of any cover material used.

A R I S K A S S E S S M E N T O F S E L E C T E D L A N D F I L L S I T E S I N T H E N O R T H E A S T E R N W A S T E M A N A G E M E N T R E G I O N
Section 2 Approach and Methodology
Prepared for NevRwaste, 11 September 2006. J:\JOBS\43294913\Reporting\NevRwaste Final Report.doc
2-8
• Planning zones that allowed for residential houses, even though there may not be houses there, were assumed to be a sensitive landuses. The questionnaire variable Q.3.0 (dwellings in area), was used directly as it is a variable indicated if there were houses in the area but not the potential for houses to be in the area.
• Overlays such as ESO (Environmentally Sensitive Overlay), and VGO (Vegetation Protection Overlay), PUZ2 PUZ3 (Public Use Zones Schools and Hospitals) were assumed to be sensitive landuses.
2.5 Assessment of Relative Risk Ranking In order to assist NevRwaste in prioritising management effort and resources, graphs have been used to spatially represent the degree of relative risk posed by each closed landfill.
For each landfill site, the overall likelihood RL and consequence RC values were plotted against each other. Based on the spatial distribution of individual sites in this relative risk graph, groups of sites which represent relatively high, medium and low levels of risk (and therefore priority) could be identified.
Division between the groups can be assigned by visualising an approximate line of best fit. Sites exhibiting greater relative risk will plot towards the top right hand corner of the graph
This technique is graphically represented in the figure below:
Increasing Likelihood
Incr
easi
ng C
onse
quen
ce
Sites presenting minimal relative risk.
Low on ranking scale.
Sites posing greatest relative
risk. High on ranking scale.
Sites presenting some relative
risk. Medium on ranking scale.
Increasing Relative Risk

A R I S K A S S E S S M E N T O F S E L E C T E D L A N D F I L L S I T E S I N T H E N O R T H E A S T E R N W A S T E M A N A G E M E N T R E G I O N
Section 2 Approach and Methodology
Prepared for NevRwaste, 11 September 2006. J:\JOBS\43294913\Reporting\NevRwaste Final Report.doc
2-9
2.6 Verification/Validation URS undertook validation of the GIS and questionnaire data to ensure risk values were consistent once linked together.
Validation of the assessment was achieved by presenting the preliminary relative risk plots, GIS and questionnaire risk score data to NevRwaste Members. As they have the best knowledge of the landfill sites within their municipality and a perception of which sites should pose higher or lower risk.
See Section 3.1 for a discussion of validation results.
A R I S K A S S E S S M E N T O F S E L E C T E D L A N D F I L L S I T E S I N T H E N O R T H E A S T E R N W A S T E M A N A G E M E N T R E G I O N
Section 3 Risk Assessment Results
Prepared for NevRwaste, 11 September 2006. J:\JOBS\43294913\Reporting\NevRwaste Final Report.doc
3-1
3 Risk Assessment Results
Figure 2a, 2b, 2c graphically presents the relative risk rankings using three differently weightings. The 30 closed landfills included in the assessment are effectively ranked by relative risk, depending on their spatial distribution on each graph. The three relative risk groups were arbitrarily identified as, i) those posing a low environmental risk, ii) those posing a moderate risk and iii) those posing a greater environmental risk (relative to the other landfills included in the risk assessment).
In all risk plots a group of at least five landfills consistently ranked as relatively ‘high risk’ due to high RL and high RC, with the remainder in relative medium risk and relative low risk. A general qualitative discussion describes these relative risk trends in section 3.1.3.
The relative risk rankings of the landfills specific to each LG area are presented in Figures 5 to 10. The scores for each variable derived for each landfill are provided in Tables 3a, 3b and 3c.
The risk scores and relative risk rankings for each site generally reflect the conditions at the time of the assessment, and the historical operating conditions. That is, the questionnaire incorporates current site management (eg. capping) as well as the management that has applied for the life of the landfill, for example the ‘waste type accepted’ relates to wastes accepted by the landfill while it was operating.
3.1.1 Verification/ Validation Results
In July 2006 a preliminary relative risk ranking for selected closed landfills in the NevRwaste region was prepared. The results were presented to the Project Steering Committee on 13th July 2006.
Feedback was received on the preliminary relative risk ranking and weighting of the risk categories. None of the landfills appeared to be unexpectedly ranked high or low. It was noted that some LG’s landfill’s appeared to be clustered together. Further sensitivity analysis of the data was undertaken, comparing the GIS and questionnaire risk scores independently of each other.
In the analysis relative risk plots from both the GIS and questionnaire were compared independently. In both instances the clustering of LG’s was evident, see Figure 3 and 4 and Tables 3a, 3b, 3c. The GIS relative risk plot was clustered together, however less than the questionnaire.
This may suggest that the clustering is not due to human induced bias, but rather municipal landfill management procedures as entered in the questionnaire, and regional environmental characteristics which were identified from the GIS.
Each landfill was processed using a site number. A full list of site numbers and their site names is provided in Appendix A.
3.1.2 Risk by Environmental Category
As discussed in Section 2.1, six environmental risk categories were identified – groundwater, surface water, nearby landuses, general environmental issues, rehabilitation and greenhouse
A R I S K A S S E S S M E N T O F S E L E C T E D L A N D F I L L S I T E S I N T H E N O R T H E A S T E R N W A S T E M A N A G E M E N T R E G I O N
Section 3 Risk Assessment Results
Prepared for NevRwaste, 11 September 2006. J:\JOBS\43294913\Reporting\NevRwaste Final Report.doc
3-2
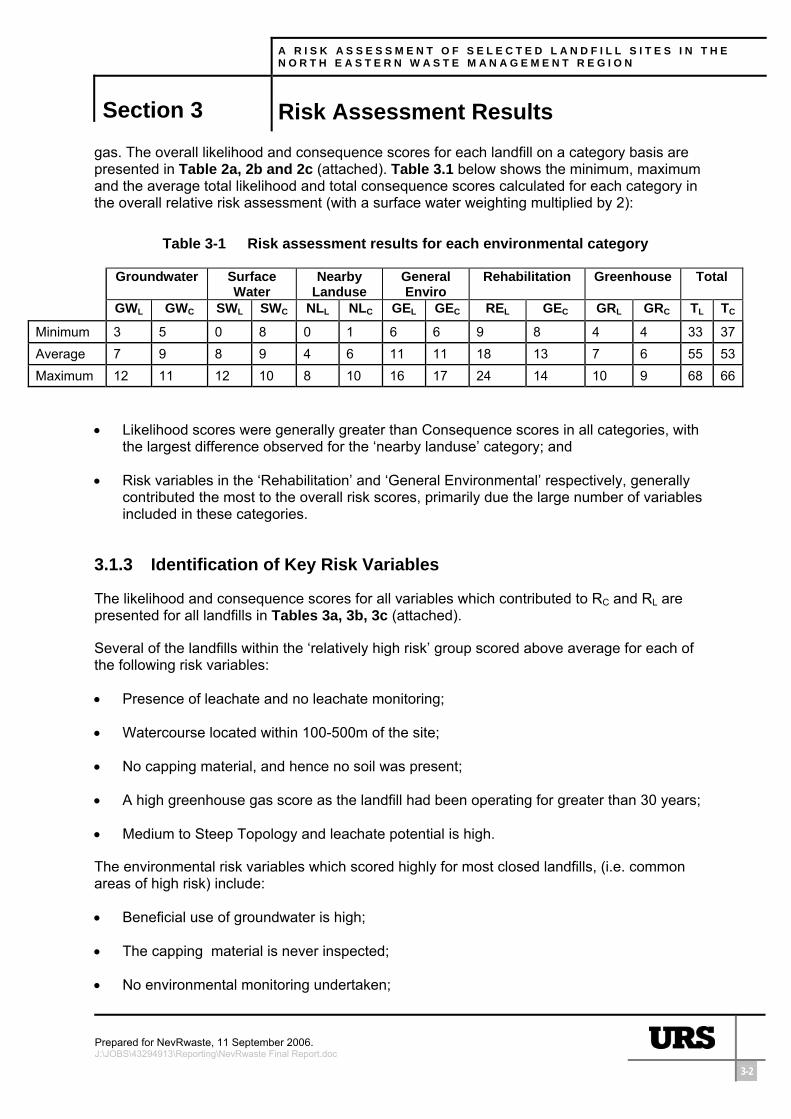
gas. The overall likelihood and consequence scores for each landfill on a category basis are presented in Table 2a, 2b and 2c (attached). Table 3.1 below shows the minimum, maximum and the average total likelihood and total consequence scores calculated for each category in the overall relative risk assessment (with a surface water weighting multiplied by 2):
Table 3-1 Risk assessment results for each environmental category
Groundwater Surface Water
Nearby Landuse
General Enviro
Rehabilitation Greenhouse Total
GWL GWC SWL SWC NLL NLC GEL GEC REL GEC GRL GRC TL TC
Minimum 3 5 0 8 0 1 6 6 9 8 4 4 33 37Average 7 9 8 9 4 6 11 11 18 13 7 6 55 53Maximum 12 11 12 10 8 10 16 17 24 14 10 9 68 66
• Likelihood scores were generally greater than Consequence scores in all categories, with the largest difference observed for the ‘nearby landuse’ category; and
• Risk variables in the ‘Rehabilitation’ and ‘General Environmental’ respectively, generally contributed the most to the overall risk scores, primarily due the large number of variables included in these categories.
3.1.3 Identification of Key Risk Variables
The likelihood and consequence scores for all variables which contributed to RC and RL are presented for all landfills in Tables 3a, 3b, 3c (attached).
Several of the landfills within the ‘relatively high risk’ group scored above average for each of the following risk variables:
• Presence of leachate and no leachate monitoring;
• Watercourse located within 100-500m of the site;
• No capping material, and hence no soil was present;
• A high greenhouse gas score as the landfill had been operating for greater than 30 years;
• Medium to Steep Topology and leachate potential is high.
The environmental risk variables which scored highly for most closed landfills, (i.e. common areas of high risk) include:
• Beneficial use of groundwater is high;
• The capping material is never inspected;
• No environmental monitoring undertaken;

A R I S K A S S E S S M E N T O F S E L E C T E D L A N D F I L L S I T E S I N T H E N O R T H E A S T E R N W A S T E M A N A G E M E N T R E G I O N
Section 3 Risk Assessment Results
Prepared for NevRwaste, 11 September 2006. J:\JOBS\43294913\Reporting\NevRwaste Final Report.doc
3-3
• Existing groundwater bore within 500m of the site;
• Residential dwellings within 500m of the site;
• No surface water runoff controls on site;
• Medium to high likelihood that prohibited wastes may be been received, and;
• Sensitive landuse within <100m of the site.
3.1.4 NevRwaste Closed Landfill GIS
The GIS enables risk information to be compiled and analysed in an efficient way. It proved particularly useful during the initial assigning of the risk variables, where the risk variables from each geodatabase layer were easily assigned to landfill locations.
The final output of the GIS is a digital published map, which contains each of the geodatabase layers, including the landfill locations. This map has been provided to each NevRwaste member on CD, with instructions and help menu. Users can query the landfill location geodatabase by using the information tool. Here they can analyse the risk scores for each variable as assigned from the GIS component and from the questionnaire.
This map allows landfill sites and the contributing risks features to be visualised. These include: rivers, geology, planning, depth to groundwater, beneficial use zones, groundwater bores, and rainfall/evaporation.
A R I S K A S S E S S M E N T O F S E L E C T E D L A N D F I L L S I T E S I N T H E N O R T H E A S T E R N W A S T E M A N A G E M E N T R E G I O N
Section 4 Recommendations
Prepared for NevRwaste, 11 September 2006. J:\JOBS\43294913\Reporting\NevRwaste Final Report.doc
4-1
4 Recommendations
As a result of this assessment, should the LG or NevRwaste decide to facilitate further action, the following steps could be undertaken:
1. A detailed assessment of the risk scores for the site to assess the reality of the risk scores assigned in Tables 3a, 3b and 3c with site-specific knowledge;
2. A site inspection by an appropriately qualified and experienced Waste Management Engineer to confirm the site specific details and identify areas for field investigation (if necessary);
3. Prepare a scope for the site specific field investigation (if it is confirmed to be necessary);
4. Undertake a field assessment of the site to more accurately assess site-specific information (e.g. depth to groundwater, beneficial uses of groundwater, groundwater quality monitoring, rehabilitation measures); and,
5. Depending on the outcome of 4, consider implementing further site rehabilitation measures to reduce the environmental risk, or undertake strategic rehabilitation (if not already undertaken). In doing so, the site rehabilitation plan should be updated to reflect the proposed changes.
In addition, it is recommended that the LG/RWMG consider the use of this information when undertaking long-term strategic planning for all unlicensed landfills within the region.

A R I S K A S S E S S M E N T O F S E L E C T E D L A N D F I L L S I T E S I N T H E N O R T H E A S T E R N W A S T E M A N A G E M E N T R E G I O N
Section 5 Conclusion
Prepared for NevRwaste, 11 September 2006. J:\JOBS\43294913\Reporting\NevRwaste Final Report.doc
5-1
5 Conclusion
In order to conduct the desktop risk assessment, spatial information was collected from existing state environmental and planning databases including geology, sensitive landuses and surface water courses. In addition, site specific information including details of landfill rehabilitation, design, operation and surrounding landuses was obtained from LG and NevRwaste members using a questionnaire.
A GIS has been used to evaluate the relative environmental risks associated with each landfill. After assigning a value to the likelihood of environmental impact and the consequence of impact for each potential environmental impact, a score indicating environmental risk relative to other sites being assessed for each site was determined. This was then used to rank all sites relative to each other as either high, medium or low risk.
The collated data has been analysed in a variety of ways, regardless of the weighting or assessment the same site are consistently ranked as relatively high risk, compared with the other sites being assessed. These are the sites that should be prioritised by NevRwaste for further investigation and if necessary rehabilitation.
As this is a desktop study, the proposed next step in managing these sites is to undertake field investigations to confirm (or otherwise) the key information that resulted in the sites being of high environmental risk relative to the other sites (eg. depth to groundwater and groundwater quality in the vicinity of the site).
A R I S K A S S E S S M E N T O F S E L E C T E D L A N D F I L L S I T E S I N T H E N O R T H E A S T E R N W A S T E M A N A G E M E N T R E G I O N
Section 6 References
Prepared for NevRwaste, 11 September 2006. J:\JOBS\43294913\Reporting\NevRwaste Final Report.doc
6-1
6 References
Bureau of Meteorology (1998) Gridded rainfall data, based on the standard rainfall climatology (1961-1990). National Climate Centre, Melbourne
Bureau of Meteorology (2000) Gridded areal potential evapotranspiration data, based on the standard rainfall climatology (1961-1990). National Climate Centre, Melbourne
EcoRecycle (2003) Victorian Landfill Location Data.
Environment Protection Authority (1999) Publication 674- Rehabilitation of Landfills Exempt From Licensing.
Environment Protection Authority (2001) Publication 788- Siting, Design, Operation and Rehabilitation of Landfills.
Geological Survey of Victoria (1998) 1:250,000 Statewide Digital Geological Dataset. Department of Natural Resources and Environment, Melbourne
MapInfo Australia (2006) StreetPro Feature Data
NevRwaste (1999) Waste Management Plan
Department of Sustainability and Environment (2001) Victorian Statewide Groundwater Database, Melbourne
Department of Sustainability and Environment (2001) & SKM (2001) Groundwater Vulnerability Project, Melbourne
State of Victoria (2004) VicMap Data, Department of Sustainability and Environment, Melbourne

A R I S K A S S E S S M E N T O F S E L E C T E D L A N D F I L L S I T E S I N T H E N O R T H E A S T E R N W A S T E M A N A G E M E N T R E G I O N
Section 7 Limitations
Prepared for NevRwaste, 11 September 2006. J:\JOBS\43294913\Reporting\NevRwaste Final Report.doc
7-1
7 Limitations
URS Australia Pty Ltd (URS) has prepared this report for the use of NevRwaste in accordance with the usual care and thoroughness of the consulting profession. It is based on generally accepted practices and standards at the time it was prepared. No other warranty, expressed or implied, is made as to the professional advice included in this report. It is prepared in accordance with the scope of work and for the purpose outlined in the Proposal dated 25th January 2006.
The methodology adopted and sources of information used by URS are outlined in this report. URS has made no independent verification of this information beyond the agreed scope of works and URS assumes no responsibility for any inaccuracies or omissions. No indications were found during our investigations that information contained in this report as provided to URS was false.
This report was prepared between 01/04/06 and 11/09/06 and is based on the information reviewed at the time of preparation. URS disclaims responsibility for any changes that may have occurred after this time.
This report should be read in full. No responsibility is accepted for use of any part of this report in any other context or for any other purpose or by third parties. This report does not purport to give legal advice. Legal advice can only be given by qualified legal practitioners.

A R I S K A S S E S S M E N T O F S E L E C T E D L A N D F I L L S I T E S I N T H E N O R T H E A S T E R N W A S T E M A N A G E M E N T R E G I O N
Tables
Prepared for NevRwaste, 11 September 2006 J:\JOBS\43294913\Reporting\NevRwaste Final Report.doc
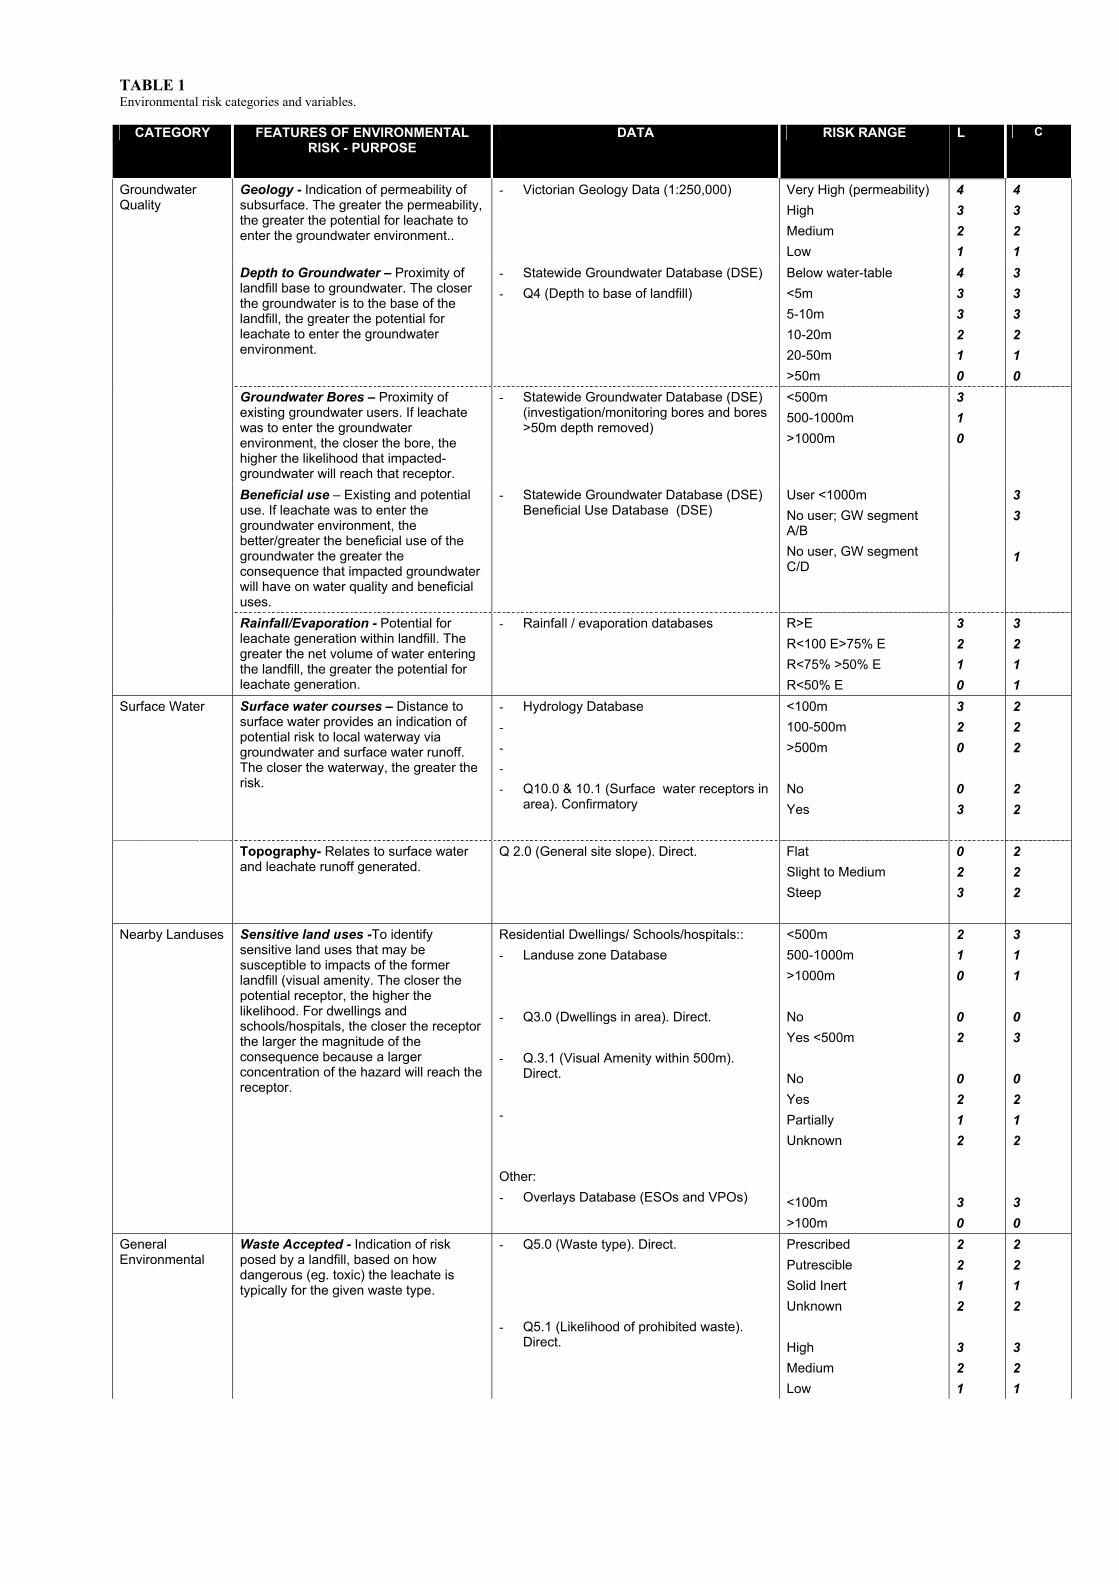
TABLE 1 Environmental risk categories and variables.
CATEGORY FEATURES OF ENVIRONMENTAL RISK - PURPOSE
DATA RISK RANGE L C
Groundwater Quality
Geology - Indication of permeability of subsurface. The greater the permeability, the greater the potential for leachate to enter the groundwater environment..
- Victorian Geology Data (1:250,000)
Very High (permeability) High Medium Low
4 3 2 1
4 3 2 1
Depth to Groundwater – Proximity of landfill base to groundwater. The closer the groundwater is to the base of the landfill, the greater the potential for leachate to enter the groundwater environment.
- Statewide Groundwater Database (DSE) - Q4 (Depth to base of landfill)
Below water-table <5m 5-10m 10-20m 20-50m >50m
4 3 3 2 1 0
3 3 3 2 1 0
Groundwater Bores – Proximity of existing groundwater users. If leachate was to enter the groundwater environment, the closer the bore, the higher the likelihood that impacted-groundwater will reach that receptor.
- Statewide Groundwater Database (DSE) (investigation/monitoring bores and bores >50m depth removed)
<500m 500-1000m >1000m
3 1 0
Beneficial use – Existing and potential use. If leachate was to enter the groundwater environment, the better/greater the beneficial use of the groundwater the greater the consequence that impacted groundwater will have on water quality and beneficial uses.
- Statewide Groundwater Database (DSE) Beneficial Use Database (DSE)
User <1000m No user; GW segment A/B No user, GW segment C/D
3 3 1
Rainfall/Evaporation - Potential for leachate generation within landfill. The greater the net volume of water entering the landfill, the greater the potential for leachate generation.
- Rainfall / evaporation databases R>E R<100 E>75% E R<75% >50% E R<50% E
3 2 1 0
3 2 1 1
Surface Water Surface water courses – Distance to surface water provides an indication of potential risk to local waterway via groundwater and surface water runoff. The closer the waterway, the greater the risk.
- Hydrology Database - - - - Q10.0 & 10.1 (Surface water receptors in
area). Confirmatory
<100m 100-500m >500m No Yes
3 2 0 0 3
2 2 2 2 2
Topography- Relates to surface water and leachate runoff generated.
Q 2.0 (General site slope). Direct. Flat Slight to Medium Steep
0 2 3
2 2 2
Nearby Landuses Sensitive land uses -To identify sensitive land uses that may be susceptible to impacts of the former landfill (visual amenity. The closer the potential receptor, the higher the likelihood. For dwellings and schools/hospitals, the closer the receptor the larger the magnitude of the consequence because a larger concentration of the hazard will reach the receptor.
Residential Dwellings/ Schools/hospitals:: - Landuse zone Database - Q3.0 (Dwellings in area). Direct. - Q.3.1 (Visual Amenity within 500m).
Direct. - Other: - Overlays Database (ESOs and VPOs)
<500m 500-1000m >1000m No Yes <500m No Yes Partially Unknown <100m >100m
2 1 0 0 2 0 2 1 2 3 0
3 1 1 0 3 0 2 1 2 3 0
General Environmental
Waste Accepted - Indication of risk posed by a landfill, based on how dangerous (eg. toxic) the leachate is typically for the given waste type.
- Q5.0 (Waste type). Direct. - Q5.1 (Likelihood of prohibited waste).
Direct.
Prescribed Putrescible Solid Inert Unknown High Medium Low
2 2 1 2 3 2 1
2 2 1 2 3 2 1
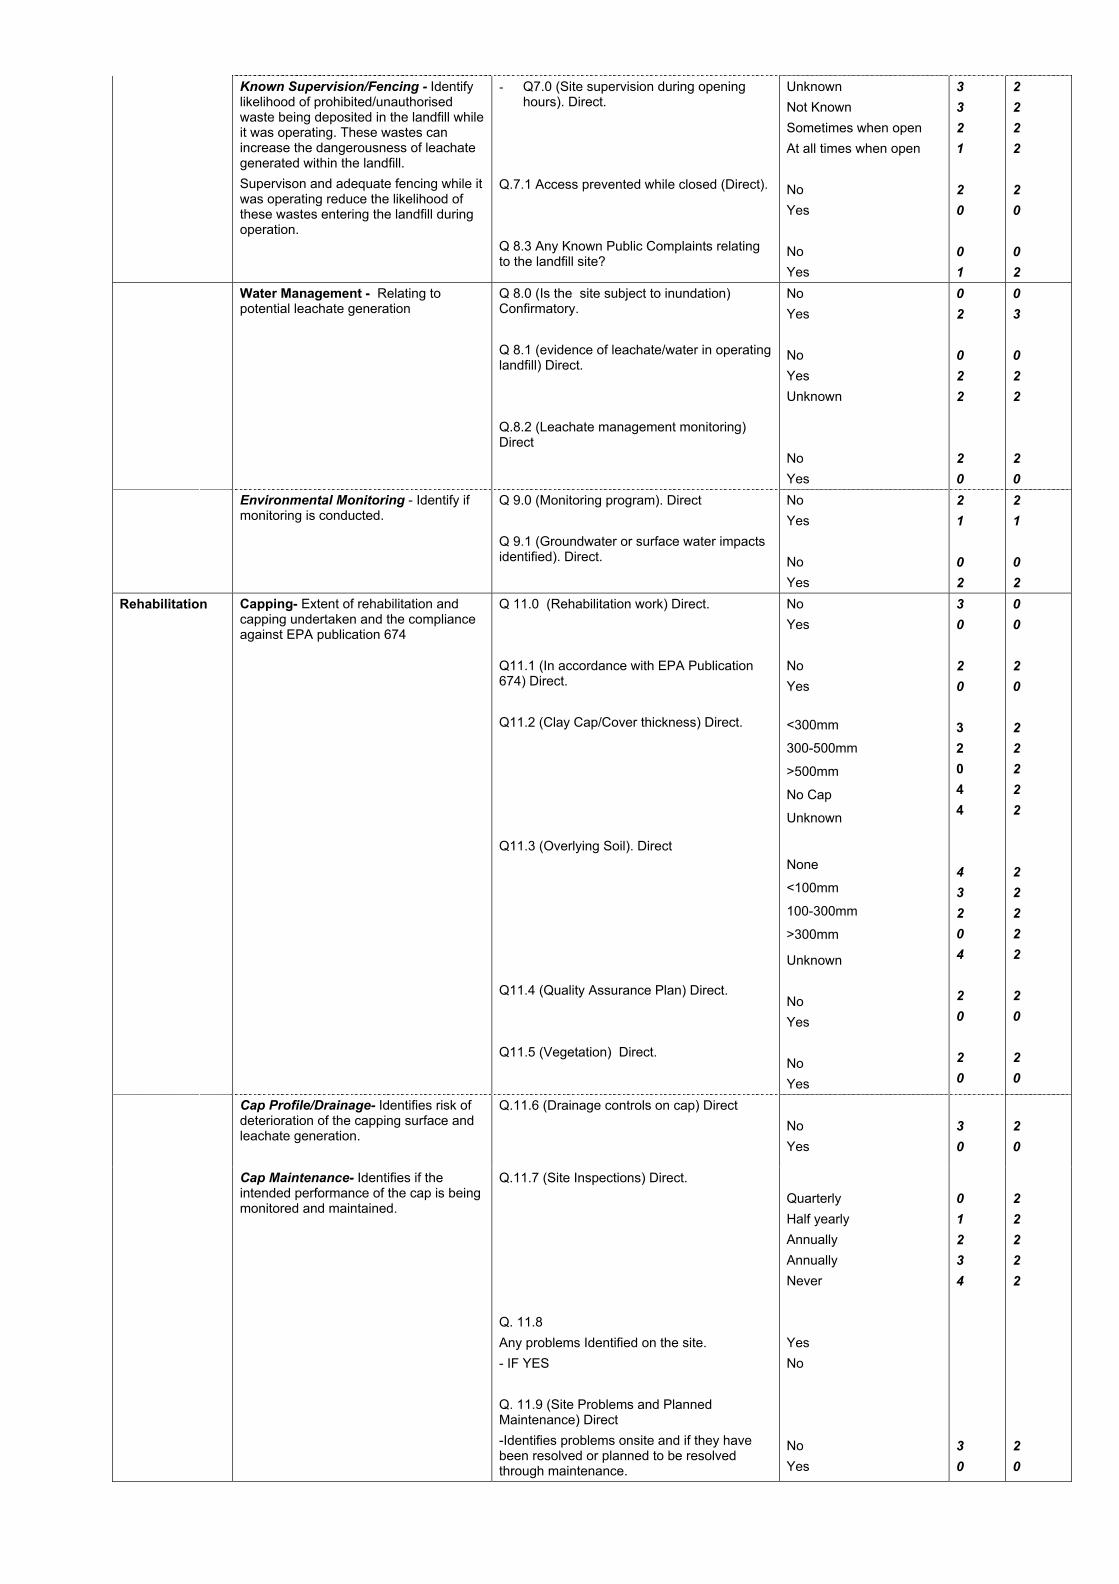
Known Supervision/Fencing - Identify likelihood of prohibited/unauthorised waste being deposited in the landfill while it was operating. These wastes can increase the dangerousness of leachate generated within the landfill. Supervison and adequate fencing while it was operating reduce the likelihood of these wastes entering the landfill during operation.
- Q7.0 (Site supervision during opening hours). Direct.
Q.7.1 Access prevented while closed (Direct). Q 8.3 Any Known Public Complaints relating to the landfill site?
Unknown Not Known Sometimes when open At all times when open No Yes No Yes
3 3 2 1 2 0 0 1
2 2 2 2 2 0 0 2
Water Management - Relating to potential leachate generation
Q 8.0 (Is the site subject to inundation) Confirmatory. Q 8.1 (evidence of leachate/water in operating landfill) Direct. Q.8.2 (Leachate management monitoring) Direct
No Yes No Yes Unknown No Yes
0 2 0 2 2 2 0
0 3 0 2 2 2 0
Environmental Monitoring - Identify if monitoring is conducted.
Q 9.0 (Monitoring program). Direct Q 9.1 (Groundwater or surface water impacts identified). Direct.
No Yes No Yes
2 1 0 2
2 1 0 2
Rehabilitation
Capping- Extent of rehabilitation and capping undertaken and the compliance against EPA publication 674
Q 11.0 (Rehabilitation work) Direct. Q11.1 (In accordance with EPA Publication 674) Direct. Q11.2 (Clay Cap/Cover thickness) Direct. Q11.3 (Overlying Soil). Direct Q11.4 (Quality Assurance Plan) Direct. Q11.5 (Vegetation) Direct.
No Yes No Yes <300mm
300-500mm
>500mm
No Cap
Unknown
None
<100mm
100-300mm
>300mm
Unknown No Yes No Yes
3 0 2 0 3 2 0 4 4 4 3 2 0 4 2 0 2 0
0 0 2 0 2 2 2 2 2 2 2 2 2 2 2 0 2 0
Cap Profile/Drainage- Identifies risk of deterioration of the capping surface and leachate generation.
Q.11.6 (Drainage controls on cap) Direct
No Yes
3 0
2 0
Cap Maintenance- Identifies if the intended performance of the cap is being monitored and maintained.
Q.11.7 (Site Inspections) Direct. Q. 11.8 Any problems Identified on the site. - IF YES Q. 11.9 (Site Problems and Planned Maintenance) Direct -Identifies problems onsite and if they have been resolved or planned to be resolved through maintenance.
Quarterly Half yearly Annually Annually Never Yes No No Yes
0 1 2 3 4 3 0
2 2 2 2 2 2 0
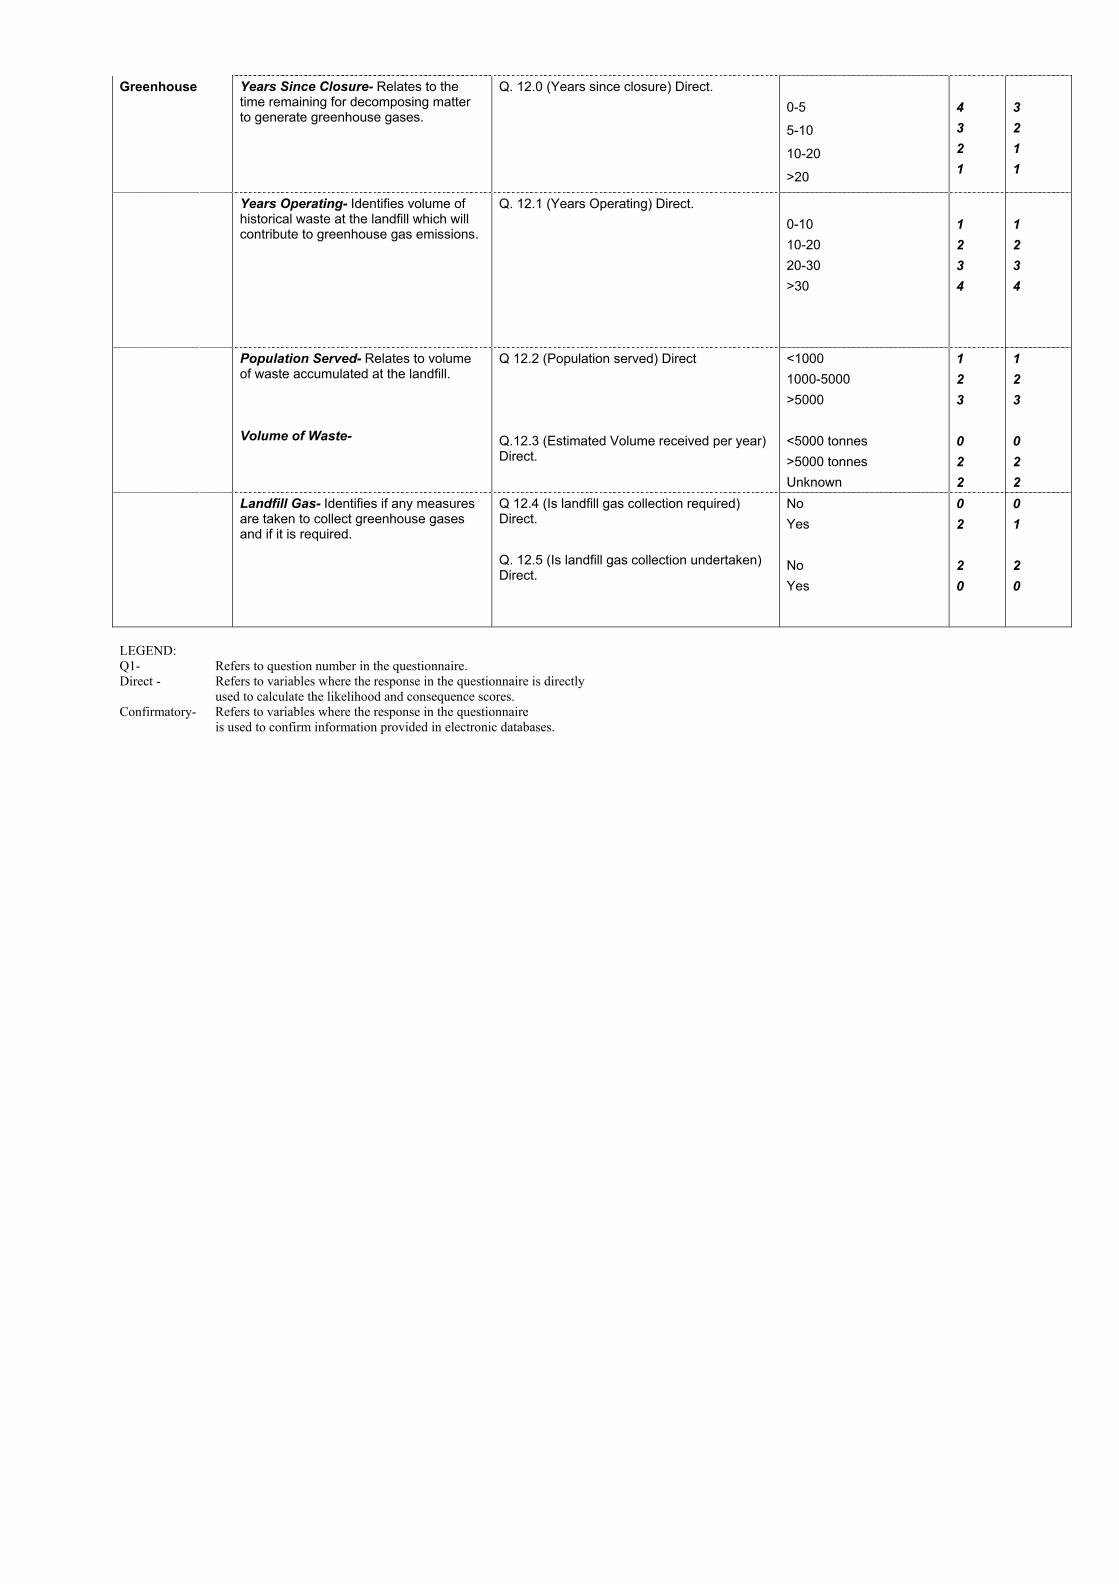
Greenhouse
Years Since Closure- Relates to the time remaining for decomposing matter to generate greenhouse gases.
Q. 12.0 (Years since closure) Direct.
0-5
5-10
10-20
>20
4 3 2 1
3 2 1 1
Years Operating- Identifies volume of historical waste at the landfill which will contribute to greenhouse gas emissions.
Q. 12.1 (Years Operating) Direct.
0-10 10-20 20-30 >30
1 2 3 4
1 2 3 4
Population Served- Relates to volume of waste accumulated at the landfill. Volume of Waste-
Q 12.2 (Population served) Direct Q.12.3 (Estimated Volume received per year) Direct.
<1000 1000-5000 >5000 <5000 tonnes >5000 tonnes Unknown
1 2 3 0 2 2
1 2 3 0 2 2
Landfill Gas- Identifies if any measures are taken to collect greenhouse gases and if it is required.
Q 12.4 (Is landfill gas collection required) Direct. Q. 12.5 (Is landfill gas collection undertaken) Direct.
No Yes No Yes
0 2 2 0
0 1 2 0
LEGEND: Q1- Refers to question number in the questionnaire. Direct - Refers to variables where the response in the questionnaire is directly used to calculate the likelihood and consequence scores. Confirmatory- Refers to variables where the response in the questionnaire
is used to confirm information provided in electronic databases.
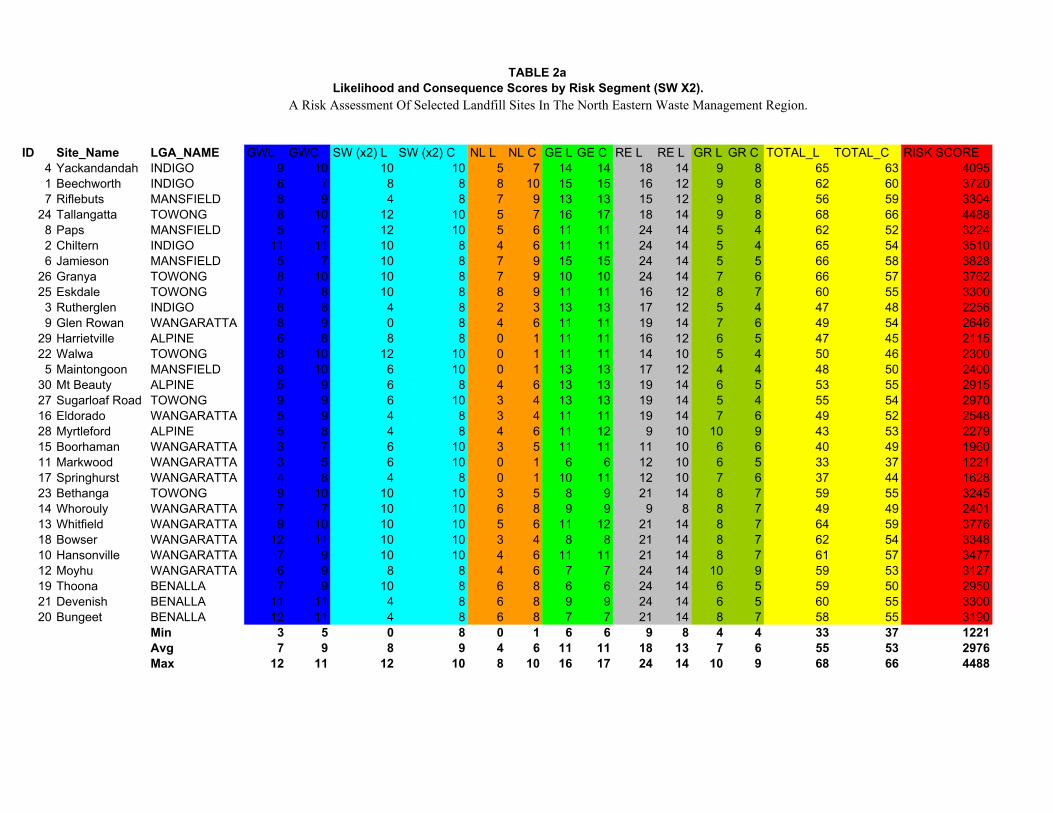
TABLE 2aLikelihood and Consequence Scores by Risk Segment (SW X2).
A Risk Assessment Of Selected Landfill Sites In The North Eastern Waste Management Region.
ID Site_Name LGA_NAME GWL GWC SW (x2) L SW (x2) C NL L NL C GE L GE C RE L RE L GR L GR C TOTAL_L TOTAL_C RISK SCORE4 Yackandandah INDIGO 9 10 10 10 5 7 14 14 18 14 9 8 65 63 40951 Beechworth INDIGO 6 7 8 8 8 10 15 15 16 12 9 8 62 60 37207 Riflebuts MANSFIELD 8 9 4 8 7 9 13 13 15 12 9 8 56 59 3304
24 Tallangatta TOWONG 8 10 12 10 5 7 16 17 18 14 9 8 68 66 44888 Paps MANSFIELD 5 7 12 10 5 6 11 11 24 14 5 4 62 52 32242 Chiltern INDIGO 11 11 10 8 4 6 11 11 24 14 5 4 65 54 35106 Jamieson MANSFIELD 5 7 10 8 7 9 15 15 24 14 5 5 66 58 3828
26 Granya TOWONG 8 10 10 8 7 9 10 10 24 14 7 6 66 57 376225 Eskdale TOWONG 7 8 10 8 8 9 11 11 16 12 8 7 60 55 3300
3 Rutherglen INDIGO 6 8 4 8 2 3 13 13 17 12 5 4 47 48 22569 Glen Rowan WANGARATTA 8 9 0 8 4 6 11 11 19 14 7 6 49 54 2646
29 Harrietville ALPINE 6 8 8 8 0 1 11 11 16 12 6 5 47 45 211522 Walwa TOWONG 8 10 12 10 0 1 11 11 14 10 5 4 50 46 2300
5 Maintongoon MANSFIELD 8 10 6 10 0 1 13 13 17 12 4 4 48 50 240030 Mt Beauty ALPINE 5 9 6 8 4 6 13 13 19 14 6 5 53 55 291527 Sugarloaf Road TOWONG 9 9 6 10 3 4 13 13 19 14 5 4 55 54 297016 Eldorado WANGARATTA 5 9 4 8 3 4 11 11 19 14 7 6 49 52 254828 Myrtleford ALPINE 5 8 4 8 4 6 11 12 9 10 10 9 43 53 227915 Boorhaman WANGARATTA 3 7 6 10 3 5 11 11 11 10 6 6 40 49 196011 Markwood WANGARATTA 3 5 6 10 0 1 6 6 12 10 6 5 33 37 122117 Springhurst WANGARATTA 4 8 4 8 0 1 10 11 12 10 7 6 37 44 162823 Bethanga TOWONG 9 10 10 10 3 5 8 9 21 14 8 7 59 55 324514 Whorouly WANGARATTA 7 7 10 10 6 8 9 9 9 8 8 7 49 49 240113 Whitfield WANGARATTA 9 10 10 10 5 6 11 12 21 14 8 7 64 59 377618 Bowser WANGARATTA 12 11 10 10 3 4 8 8 21 14 8 7 62 54 334810 Hansonville WANGARATTA 7 9 10 10 4 6 11 11 21 14 8 7 61 57 347712 Moyhu WANGARATTA 6 9 8 8 4 6 7 7 24 14 10 9 59 53 312719 Thoona BENALLA 7 9 10 8 6 8 6 6 24 14 6 5 59 50 295021 Devenish BENALLA 11 11 4 8 6 8 9 9 24 14 6 5 60 55 330020 Bungeet BENALLA 12 11 4 8 6 8 7 7 21 14 8 7 58 55 3190
Min 3 5 0 8 0 1 6 6 9 8 4 4 33 37 1221Avg 7 9 8 9 4 6 11 11 18 13 7 6 55 53 2976Max 12 11 12 10 8 10 16 17 24 14 10 9 68 66 4488
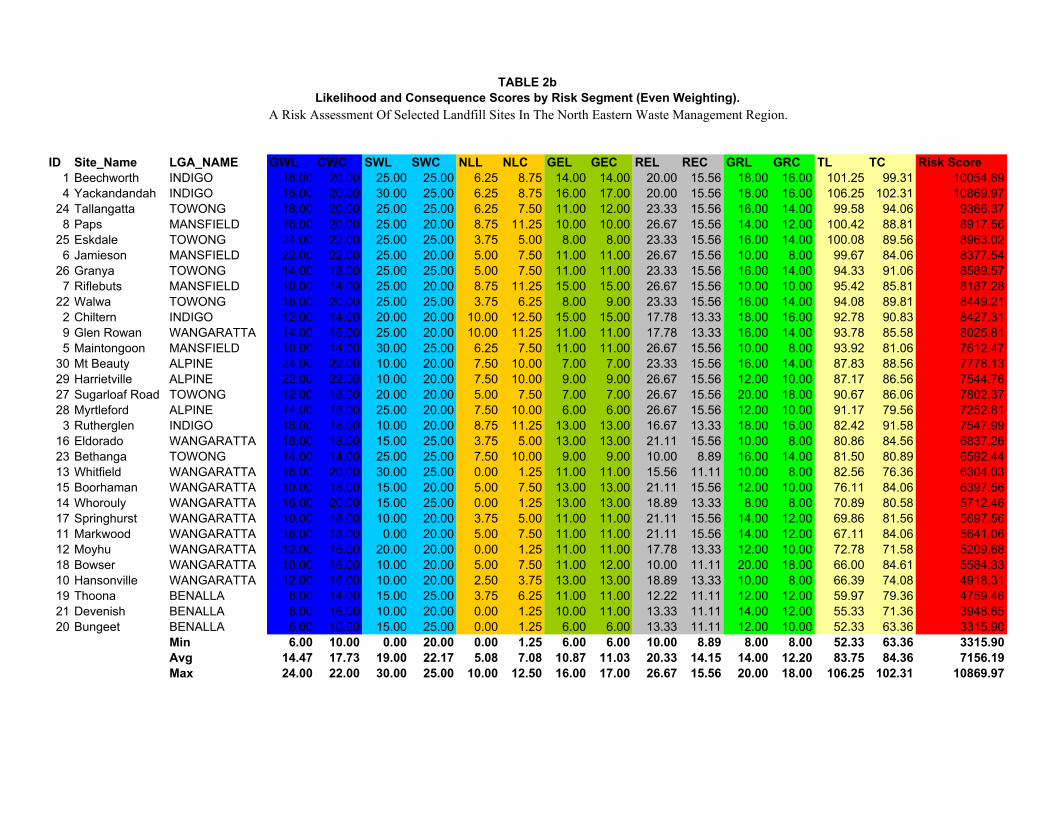
ID Site_Name LGA_NAME GWL CWC SWL SWC NLL NLC GEL GEC REL REC GRL GRC TL TC Risk Score1 Beechworth INDIGO 18.00 20.00 25.00 25.00 6.25 8.75 14.00 14.00 20.00 15.56 18.00 16.00 101.25 99.31 10054.694 Yackandandah INDIGO 16.00 20.00 30.00 25.00 6.25 8.75 16.00 17.00 20.00 15.56 18.00 16.00 106.25 102.31 10869.97
24 Tallangatta TOWONG 18.00 20.00 25.00 25.00 6.25 7.50 11.00 12.00 23.33 15.56 16.00 14.00 99.58 94.06 9366.378 Paps MANSFIELD 16.00 20.00 25.00 20.00 8.75 11.25 10.00 10.00 26.67 15.56 14.00 12.00 100.42 88.81 8917.56
25 Eskdale TOWONG 24.00 22.00 25.00 25.00 3.75 5.00 8.00 8.00 23.33 15.56 16.00 14.00 100.08 89.56 8963.026 Jamieson MANSFIELD 22.00 22.00 25.00 20.00 5.00 7.50 11.00 11.00 26.67 15.56 10.00 8.00 99.67 84.06 8377.54
26 Granya TOWONG 14.00 18.00 25.00 25.00 5.00 7.50 11.00 11.00 23.33 15.56 16.00 14.00 94.33 91.06 8589.577 Riflebuts MANSFIELD 10.00 14.00 25.00 20.00 8.75 11.25 15.00 15.00 26.67 15.56 10.00 10.00 95.42 85.81 8187.28
22 Walwa TOWONG 18.00 20.00 25.00 25.00 3.75 6.25 8.00 9.00 23.33 15.56 16.00 14.00 94.08 89.81 8449.212 Chiltern INDIGO 12.00 14.00 20.00 20.00 10.00 12.50 15.00 15.00 17.78 13.33 18.00 16.00 92.78 90.83 8427.319 Glen Rowan WANGARATTA 14.00 16.00 25.00 20.00 10.00 11.25 11.00 11.00 17.78 13.33 16.00 14.00 93.78 85.58 8025.815 Maintongoon MANSFIELD 10.00 14.00 30.00 25.00 6.25 7.50 11.00 11.00 26.67 15.56 10.00 8.00 93.92 81.06 7612.47
30 Mt Beauty ALPINE 24.00 22.00 10.00 20.00 7.50 10.00 7.00 7.00 23.33 15.56 16.00 14.00 87.83 88.56 7778.1329 Harrietville ALPINE 22.00 22.00 10.00 20.00 7.50 10.00 9.00 9.00 26.67 15.56 12.00 10.00 87.17 86.56 7544.7627 Sugarloaf Road TOWONG 12.00 18.00 20.00 20.00 5.00 7.50 7.00 7.00 26.67 15.56 20.00 18.00 90.67 86.06 7802.3728 Myrtleford ALPINE 14.00 18.00 25.00 20.00 7.50 10.00 6.00 6.00 26.67 15.56 12.00 10.00 91.17 79.56 7252.81
3 Rutherglen INDIGO 16.00 18.00 10.00 20.00 8.75 11.25 13.00 13.00 16.67 13.33 18.00 16.00 82.42 91.58 7547.9916 Eldorado WANGARATTA 18.00 18.00 15.00 25.00 3.75 5.00 13.00 13.00 21.11 15.56 10.00 8.00 80.86 84.56 6837.2623 Bethanga TOWONG 14.00 14.00 25.00 25.00 7.50 10.00 9.00 9.00 10.00 8.89 16.00 14.00 81.50 80.89 6592.4413 Whitfield WANGARATTA 16.00 20.00 30.00 25.00 0.00 1.25 11.00 11.00 15.56 11.11 10.00 8.00 82.56 76.36 6304.0315 Boorhaman WANGARATTA 10.00 18.00 15.00 20.00 5.00 7.50 13.00 13.00 21.11 15.56 12.00 10.00 76.11 84.06 6397.5614 Whorouly WANGARATTA 16.00 20.00 15.00 25.00 0.00 1.25 13.00 13.00 18.89 13.33 8.00 8.00 70.89 80.58 5712.4617 Springhurst WANGARATTA 10.00 18.00 10.00 20.00 3.75 5.00 11.00 11.00 21.11 15.56 14.00 12.00 69.86 81.56 5697.5611 Markwood WANGARATTA 16.00 18.00 0.00 20.00 5.00 7.50 11.00 11.00 21.11 15.56 14.00 12.00 67.11 84.06 5641.0612 Moyhu WANGARATTA 12.00 16.00 20.00 20.00 0.00 1.25 11.00 11.00 17.78 13.33 12.00 10.00 72.78 71.58 5209.6818 Bowser WANGARATTA 10.00 16.00 10.00 20.00 5.00 7.50 11.00 12.00 10.00 11.11 20.00 18.00 66.00 84.61 5584.3310 Hansonville WANGARATTA 12.00 16.00 10.00 20.00 2.50 3.75 13.00 13.00 18.89 13.33 10.00 8.00 66.39 74.08 4918.3119 Thoona BENALLA 6.00 14.00 15.00 25.00 3.75 6.25 11.00 11.00 12.22 11.11 12.00 12.00 59.97 79.36 4759.4621 Devenish BENALLA 8.00 16.00 10.00 20.00 0.00 1.25 10.00 11.00 13.33 11.11 14.00 12.00 55.33 71.36 3948.6520 Bungeet BENALLA 6.00 10.00 15.00 25.00 0.00 1.25 6.00 6.00 13.33 11.11 12.00 10.00 52.33 63.36 3315.90
Min 6.00 10.00 0.00 20.00 0.00 1.25 6.00 6.00 10.00 8.89 8.00 8.00 52.33 63.36 3315.90Avg 14.47 17.73 19.00 22.17 5.08 7.08 10.87 11.03 20.33 14.15 14.00 12.20 83.75 84.36 7156.19Max 24.00 22.00 30.00 25.00 10.00 12.50 16.00 17.00 26.67 15.56 20.00 18.00 106.25 102.31 10869.97
A Risk Assessment Of Selected Landfill Sites In The North Eastern Waste Management Region.Likelihood and Consequence Scores by Risk Segment (Even Weighting).
TABLE 2b

ID Site_Name LGA_NAME GWL CWC SWL SWC NLL NLC GEL GEC REL REC GRL GRC TL TC Risk Score4 Yackandandah INDIGO 8 10 6 5 5 7 16 17 18 14 9 8 62 61 37821 Beechworth INDIGO 9 10 5 5 5 7 14 14 18 14 9 8 60 58 34807 Riflebuts MANSFIELD 5 7 5 4 7 9 15 15 24 14 5 5 61 54 3294
24 Tallangatta TOWONG 9 10 5 5 5 6 11 12 21 14 8 7 59 54 31868 Paps MANSFIELD 8 10 5 4 7 9 10 10 24 14 7 6 61 53 32332 Chiltern INDIGO 6 7 4 4 8 10 15 15 16 12 9 8 58 56 32486 Jamieson MANSFIELD 11 11 5 4 4 6 11 11 24 14 5 4 60 50 3000
26 Granya TOWONG 7 9 5 5 4 6 11 11 21 14 8 7 56 52 291225 Eskdale TOWONG 12 11 5 5 3 4 8 8 21 14 8 7 57 49 2793
3 Rutherglen INDIGO 8 9 2 4 7 9 13 13 15 12 9 8 54 55 29709 Glen Rowan WANGARATTA 7 8 5 4 8 9 11 11 16 12 8 7 55 51 2805
29 Harrietville ALPINE 11 11 2 4 6 8 9 9 24 14 6 5 58 51 295822 Walwa TOWONG 9 10 5 5 3 5 8 9 21 14 8 7 54 50 2700
5 Maintongoon MANSFIELD 5 7 6 5 5 6 11 11 24 14 5 4 56 47 263230 Mt Beauty ALPINE 12 11 2 4 6 8 7 7 21 14 8 7 56 51 285627 Sugarloaf Road TOWONG 6 9 4 4 4 6 7 7 24 14 10 9 55 49 269516 Eldorado WANGARATTA 9 9 3 5 3 4 13 13 19 14 5 4 52 49 254828 Myrtleford ALPINE 7 9 5 4 6 8 6 6 24 14 6 5 54 46 248415 Boorhaman WANGARATTA 5 9 3 4 4 6 13 13 19 14 6 5 50 51 255011 Markwood WANGARATTA 8 9 0 4 4 6 11 11 19 14 7 6 49 50 245017 Springhurst WANGARATTA 5 9 2 4 3 4 11 11 19 14 7 6 47 48 225623 Bethanga TOWONG 7 7 5 5 6 8 9 9 9 8 8 7 44 44 193614 Whorouly WANGARATTA 8 10 3 5 0 1 13 13 17 12 4 4 45 45 202513 Whitfield WANGARATTA 8 10 6 5 0 1 11 11 14 10 5 4 44 41 180418 Bowser WANGARATTA 5 8 2 4 4 6 11 12 9 10 10 9 41 49 200910 Hansonville WANGARATTA 6 8 2 4 2 3 13 13 17 12 5 4 45 44 198012 Moyhu WANGARATTA 6 8 4 4 0 1 11 11 16 12 6 5 43 41 176319 Thoona BENALLA 3 7 3 5 3 5 11 11 11 10 6 6 37 44 162821 Devenish BENALLA 4 8 2 4 0 1 10 11 12 10 7 6 35 40 140020 Bungeet BENALLA 3 5 3 5 0 1 6 6 12 10 6 5 30 32 960
Min 3 5 0 4 0 1 6 6 9 8 4 4 30 32 960Avg 7.23 8.87 3.80 4.43 4.07 5.67 10.87 11.03 18.30 12.73 7.00 6.10 51.27 48.83 2544.57Max 12 11 6 5 8 10 16 17 24 14 10 9 62 61 3782
A Risk Assessment Of Selected Landfill Sites In the North Eastern Waste Management Region.Likelihood and Consequence Scores by Risk Segment (No Weighting).
TABLE 2c

Table 3a - GIS and Questionnaire – Likelihood and Consequence Scores (Suface Water x 2).A Risk Assessment Of Selected Landfill Sites In The North Eastern Waste Management Region.
ID Site_Name LANDFILLTYPE LGA_NAME RISK SCORE GEOLOGY_L GWDEPTH_L GWBORE_L EVAP_L GEOLOGY_C GWDEPTH_C GWUSE_C EVAP_C GW L GW C1 Beechworth Gully fill INDIGO 4095 2 4 1 2 2 3 3 2 9 102 Chiltern Gully fill INDIGO 3720 2 1 3 0 2 1 3 1 6 73 Rutherglen Former quarry/borrow pit INDIGO 3304 2 3 3 0 2 3 3 1 8 94 Yackandandah Gully fill INDIGO 4488 2 3 1 2 2 3 3 2 8 105 Maintongoon Former quarry/borrow pit MANSFIELD 3224 2 1 1 1 2 1 3 1 5 76 Jamieson Former quarry/borrow pit MANSFIELD 3510 2 3 3 3 2 3 3 3 11 117 Riflebuts Gully fill MANSFIELD 3828 1 1 1 2 1 1 3 2 5 78 Paps Former quarry/borrow pit MANSFIELD 3762 2 4 0 2 2 3 3 2 8 109 Glen Rowan Trench and fill WANGARATTA 3300 2 2 3 0 2 2 3 1 7 8
10 Hansonville Trench and fill WANGARATTA 2256 2 2 1 1 2 2 3 1 6 811 Markwood Trench and fill WANGARATTA 2646 2 4 1 1 2 3 3 1 8 912 Moyhu Trench and fill WANGARATTA 2115 2 2 1 1 2 2 3 1 6 813 Whitfield Trench and fill WANGARATTA 2300 3 1 1 3 3 1 3 3 8 1014 Whorouly Trench and fill WANGARATTA 2400 2 3 1 2 2 3 3 2 8 1015 Boorhaman Trench and fill WANGARATTA 2915 2 3 0 0 2 3 3 1 5 916 Eldorado Former quarry/borrow pit WANGARATTA 2970 2 3 3 1 2 3 3 1 9 917 Springhurst Gully fill WANGARATTA 2548 2 3 0 0 2 3 3 1 5 918 Bowser Trench and fill WANGARATTA 2279 2 2 1 0 2 2 3 1 5 819 Thoona Trench and fill BENALLA 1960 2 1 0 0 2 1 3 1 3 720 Bungeet Trench and fill BENALLA 1221 2 1 0 0 2 1 1 1 3 521 Devenish Trench and fill BENALLA 1628 2 2 0 0 2 2 3 1 4 822 Walwa Trench and fill TOWONG 3245 2 4 1 2 2 3 3 2 9 1023 Bethanga Gully fill TOWONG 2401 2 1 3 1 2 1 3 1 7 724 Tallangatta Trench and fill TOWONG 3776 2 4 1 2 2 3 3 2 9 1025 Eskdale Gravel Pit TOWONG 3348 2 4 3 3 2 3 3 3 12 1126 Granya Trench and fill TOWONG 3477 2 2 1 2 2 2 3 2 7 927 Sugarloaf Road Trench and fill TOWONG 3127 2 2 0 2 2 2 3 2 6 928 Myrtleford Trench and fill ALPINE 2950 2 2 1 2 2 2 3 2 7 929 Harrietville Gravel Pit ALPINE 3300 2 3 3 3 2 3 3 3 11 1130 Mt Beauty Trench and fill ALPINE 3190 2 4 3 3 2 3 3 3 12 11
MIN 1221 MIN 3 5AVG 2976 AVG 7 9MAX 4488 MAX 12 11
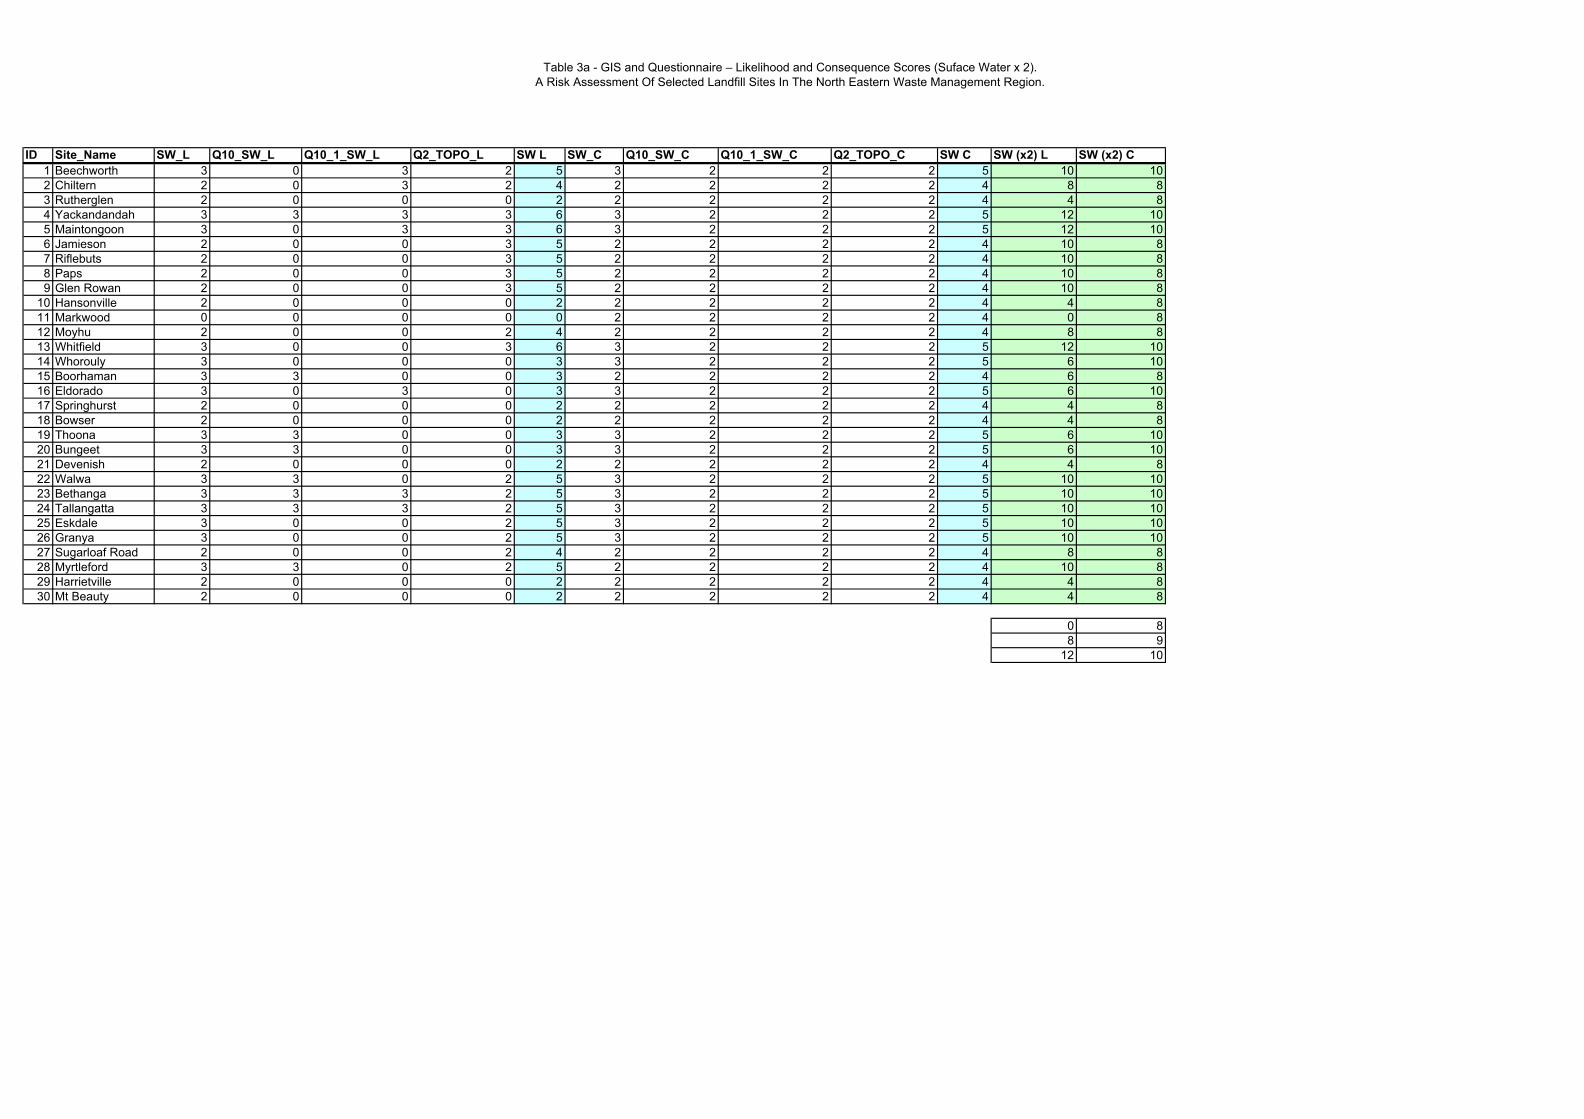
Table 3a - GIS and Questionnaire – Likelihood and Consequence Scores (Suface Water x 2).A Risk Assessment Of Selected Landfill Sites In The North Eastern Waste Management Region.
ID Site_Name SW_L Q10_SW_L Q10_1_SW_L Q2_TOPO_L SW L SW_C Q10_SW_C Q10_1_SW_C Q2_TOPO_C SW C SW (x2) L SW (x2) C1 Beechworth 3 0 3 2 5 3 2 2 2 5 10 102 Chiltern 2 0 3 2 4 2 2 2 2 4 8 83 Rutherglen 2 0 0 0 2 2 2 2 2 4 4 84 Yackandandah 3 3 3 3 6 3 2 2 2 5 12 105 Maintongoon 3 0 3 3 6 3 2 2 2 5 12 106 Jamieson 2 0 0 3 5 2 2 2 2 4 10 87 Riflebuts 2 0 0 3 5 2 2 2 2 4 10 88 Paps 2 0 0 3 5 2 2 2 2 4 10 89 Glen Rowan 2 0 0 3 5 2 2 2 2 4 10 8
10 Hansonville 2 0 0 0 2 2 2 2 2 4 4 811 Markwood 0 0 0 0 0 2 2 2 2 4 0 812 Moyhu 2 0 0 2 4 2 2 2 2 4 8 813 Whitfield 3 0 0 3 6 3 2 2 2 5 12 1014 Whorouly 3 0 0 0 3 3 2 2 2 5 6 1015 Boorhaman 3 3 0 0 3 2 2 2 2 4 6 816 Eldorado 3 0 3 0 3 3 2 2 2 5 6 1017 Springhurst 2 0 0 0 2 2 2 2 2 4 4 818 Bowser 2 0 0 0 2 2 2 2 2 4 4 819 Thoona 3 3 0 0 3 3 2 2 2 5 6 1020 Bungeet 3 3 0 0 3 3 2 2 2 5 6 1021 Devenish 2 0 0 0 2 2 2 2 2 4 4 822 Walwa 3 3 0 2 5 3 2 2 2 5 10 1023 Bethanga 3 3 3 2 5 3 2 2 2 5 10 1024 Tallangatta 3 3 3 2 5 3 2 2 2 5 10 1025 Eskdale 3 0 0 2 5 3 2 2 2 5 10 1026 Granya 3 0 0 2 5 3 2 2 2 5 10 1027 Sugarloaf Road 2 0 0 2 4 2 2 2 2 4 8 828 Myrtleford 3 3 0 2 5 2 2 2 2 4 10 829 Harrietville 2 0 0 0 2 2 2 2 2 4 4 830 Mt Beauty 2 0 0 0 2 2 2 2 2 4 4 8
0 88 9
12 10

Table 3a - GIS and Questionnaire – Likelihood and Consequence Scores (Suface Water x 2).A Risk Assessment Of Selected Landfill Sites In The North Eastern Waste Management Region.
ID Site_Name ZONE_L Q3BUFFERS_L Q3_1BUFFERS_L ESO_VPO_L ZONE_C ESO_VPO_C Q3BUFFERS_C Q3_1BUFFERS_C NL L NL C1 Beechworth 2 2 1 0 3 0 3 1 5 72 Chiltern 2 2 1 3 3 3 3 1 8 103 Rutherglen 0 2 2 3 1 3 3 2 7 94 Yackandandah 2 2 1 0 3 0 3 1 5 75 Maintongoon 2 0 3 3 3 0 5 66 Jamieson 2 2 0 0 3 0 3 0 4 67 Riflebuts 2 2 0 3 3 3 3 0 7 98 Paps 0 2 2 3 1 3 3 2 7 99 Glen Rowan 1 2 2 3 1 3 3 2 8 9
10 Hansonville 2 0 0 3 0 0 2 311 Markwood 0 2 2 0 1 0 3 2 4 612 Moyhu 0 0 0 1 0 0 0 113 Whitfield 0 0 0 1 0 0 0 114 Whorouly 0 0 0 1 0 0 0 115 Boorhaman 0 2 2 0 1 0 3 2 4 616 Eldorado 1 2 0 0 1 0 3 0 3 417 Springhurst 1 2 0 0 1 0 3 0 3 418 Bowser 0 2 2 0 1 0 3 2 4 619 Thoona 0 2 1 0 1 0 3 1 3 520 Bungeet 0 0 0 1 0 0 0 121 Devenish 0 0 0 1 0 0 0 122 Walwa 0 2 1 0 1 0 3 1 3 523 Bethanga 2 2 2 0 3 0 3 2 6 824 Tallangatta 1 2 2 0 1 0 3 2 5 625 Eskdale 0 0 3 1 3 0 3 426 Granya 0 2 2 0 1 0 3 2 4 627 Sugarloaf Road 0 2 2 0 1 0 3 2 4 628 Myrtleford 2 2 2 0 3 0 3 2 6 829 Harrietville 2 2 2 0 3 0 3 2 6 830 Mt Beauty 2 2 2 0 3 0 3 2 6 8
MIN 0 1AVG 4 6MAX 8 10

Table 3a - GIS and Questionnaire – Likelihood and Consequence Scores (Suface Water x 2).A Risk Assessment Of Selected Landfill Sites In The North Eastern Waste Management Region.
ID Site_Name Q5WASTE_L Q5WASTE_C Q5_2WASTE_L Q5_1WASTE_C Landfill area Site Q7SUPERVISION_L Q7SUPERVISION_C Q7_1ACCESS_L Q7_1ACCESS_C Q8LSIO_L Q8LSIO_C Q8_1LEACHATE_L1 Beechworth 2 2 3 3 28500 65044 3 3 0 0 0 0 22 Chiltern 2 2 2 2 12000 33132 3 3 2 2 0 0 23 Rutherglen 2 2 2 2 17500 38500 3 3 2 2 0 0 24 Yackandandah 2 2 2 2 5300 13000 3 3 2 2 0 0 25 Maintongoon 1 1 3 3 5000 5000 3 3 2 2 0 0 06 Jamieson 1 1 3 3 7000 7000 3 3 2 2 0 0 07 Riflebuts 1 1 3 3 5000 5000 3 3 2 2 0 0 28 Paps 2 2 2 2 11000 11000 2 2 0 0 0 0 09 Glen Rowan 2 2 2 2 30000 60000 3 3 0 0 0 0 2
10 Hansonville 2 2 2 2 2500 6000 3 3 2 2 0 0 211 Markwood 2 2 2 2 30000 85000 3 3 0 0 0 0 212 Moyhu 2 2 2 2 4000 200000 3 3 0 0 0 0 213 Whitfield 2 2 2 2 3000 110000 3 3 0 0 0 0 214 Whorouly 2 2 2 2 3000 7000 3 3 2 2 0 0 215 Boorhaman 2 2 2 2 2000 15000 3 3 2 2 0 0 216 Eldorado 2 2 2 2 4000 17000 3 3 2 2 0 0 217 Springhurst 2 2 2 2 1000 34000 3 3 0 0 0 0 218 Bowser 2 2 3 3 150000 185000 2 2 0 0 0 0 219 Thoona 2 2 2 2 85000 50752 3 3 2 2 0 0 020 Bungeet 2 2 1 1 54000 27199 1 1 0 0 0 0 021 Devenish 2 2 1 1 31437 20000 2 2 0 0 0 0 022 Walwa 2 2 2 2 7000 12000 1 1 0 0 0 0 023 Bethanga 2 2 2 2 7000 10000 2 2 0 0 0 0 224 Tallangatta 2 2 2 2 5000 10000 2 2 2 2 0 0 025 Eskdale 2 2 2 2 6000 10000 2 2 0 0 0 0 026 Granya 2 2 2 2 3000 10000 3 3 2 2 0 0 027 Sugarloaf Road 2 2 2 2 16000 20000 1 1 0 0 0 0 028 Myrtleford 2 2 1 1 20000 24200 1 1 0 0 0 0 029 Harrietville 2 2 1 1 6800 7500 2 2 2 2 0 0 030 Mt Beauty 2 2 1 1 18000 20500 1 1 0 0 0 0 2

Table 3a - GIS and Questionnaire – Likelihood and Consequence Scores (Suface Water x 2).A Risk Assessment Of Selected Landfill Sites In The North Eastern Waste Management Region.
ID Site_Name Q8_1LEACHATE_C Q8_2LEACHATE_L Q8_2LEACHATE_C Q8_3LITTER_L Q8_3LITTER_C Q9ENV_MONITORING_L Q9ENV_MONITORING_C Q9_1GWIMPACTS_L Q9_1GWIMPACTS_C GE L GE C1 Beechworth 2 2 2 0 0 2 2 0 0 14 142 Chiltern 2 2 2 0 0 2 2 0 0 15 153 Rutherglen 2 0 0 2 2 0 0 13 134 Yackandandah 2 2 2 1 2 2 2 0 0 16 175 Maintongoon 0 0 0 2 2 0 0 11 116 Jamieson 0 0 0 2 2 0 0 11 117 Riflebuts 2 2 2 0 0 2 2 0 0 15 158 Paps 0 0 0 2 2 2 2 10 109 Glen Rowan 2 0 0 2 2 0 0 11 11
10 Hansonville 2 0 0 2 2 0 0 13 1311 Markwood 2 0 0 2 2 0 0 11 1112 Moyhu 2 0 0 2 2 0 0 11 1113 Whitfield 2 0 0 2 2 0 0 11 1114 Whorouly 2 0 0 2 2 0 0 13 1315 Boorhaman 2 0 0 2 2 0 0 13 1316 Eldorado 2 0 0 2 2 0 0 13 1317 Springhurst 2 0 0 2 2 0 0 11 1118 Bowser 2 0 0 1 2 1 1 0 0 11 1219 Thoona 0 0 0 2 2 0 0 11 1120 Bungeet 0 0 0 2 2 0 0 6 621 Devenish 0 1 2 2 2 2 2 10 1122 Walwa 0 1 2 2 2 0 0 8 923 Bethanga 2 0 0 0 0 1 1 0 0 9 924 Tallangatta 0 1 2 2 2 0 0 11 1225 Eskdale 0 0 0 2 2 0 0 8 826 Granya 0 0 0 2 2 0 0 11 1127 Sugarloaf Road 0 0 0 2 2 0 0 7 728 Myrtleford 0 0 0 2 2 0 0 6 629 Harrietville 0 0 0 2 2 0 0 9 930 Mt Beauty 2 0 0 1 1 0 0 7 7
MIN 6 6AVG 11 11MAX 16 17

Table 3a - GIS and Questionnaire – Likelihood and Consequence Scores (Suface Water x 2).A Risk Assessment Of Selected Landfill Sites In The North Eastern Waste Management Region.
ID Site_Name Q11_L q11_C Q11-1_L Q11-1_C Q11-2_L Q11-2_C Q11-3_L Q11-3_C Q11-4_L Q11-4_C Q11-5_L Q11-5_C Q11-6_L Q11-6_C Q11-7_L Q11-7_C Q11-9_L Q11-9_C RE L RE L1 Beechworth 0 0 2 2 2 2 3 2 2 2 2 2 3 2 4 2 18 142 Chiltern 0 0 2 2 2 2 3 2 0 0 2 2 3 2 4 2 16 123 Rutherglen 0 0 2 2 2 2 3 2 2 2 2 2 0 0 4 2 15 124 Yackandandah 0 0 2 2 2 2 3 2 2 2 2 2 3 2 4 2 18 145 Maintongoon 3 0 2 2 4 2 4 2 2 2 2 2 3 2 4 2 24 146 Jamieson 3 0 2 2 4 2 4 2 2 2 2 2 3 2 4 2 24 147 Riflebuts 3 0 2 2 4 2 4 2 2 2 2 2 3 2 4 2 24 148 Paps 3 0 2 2 4 2 4 2 2 2 2 2 3 2 4 2 24 149 Glen Rowan 3 0 2 2 3 2 0 2 2 2 2 2 0 0 4 2 16 12
10 Hansonville 3 0 2 2 3 2 0 2 2 2 0 0 3 2 4 2 17 1211 Markwood 3 0 2 2 0 2 3 2 2 2 2 2 3 2 4 2 19 1412 Moyhu 3 0 2 2 3 2 0 2 2 2 2 2 0 0 4 2 16 1213 Whitfield 3 0 2 2 3 2 0 2 2 2 0 0 0 0 4 2 14 1014 Whorouly 3 0 2 2 0 2 3 2 2 2 0 0 3 2 4 2 17 1215 Boorhaman 3 0 2 2 3 2 0 2 2 2 2 2 3 2 4 2 19 1416 Eldorado 3 0 2 2 3 2 0 2 2 2 2 2 3 2 4 2 19 1417 Springhurst 3 0 2 2 3 2 0 2 2 2 2 2 3 2 4 2 19 1418 Bowser 0 0 2 2 2 2 0 2 0 0 0 0 3 2 2 2 0 0 9 1019 Thoona 0 0 2 2 3 2 3 2 2 2 0 0 0 0 1 2 0 0 11 1020 Bungeet 0 0 2 2 3 2 4 2 2 2 0 0 0 0 1 2 0 0 12 1021 Devenish 0 0 2 2 3 2 4 2 2 2 0 0 0 0 1 2 0 0 12 1022 Walwa 0 0 2 2 4 2 4 2 2 2 2 2 3 2 4 2 21 1423 Bethanga 0 0 0 0 2 2 2 2 2 2 0 0 0 0 3 2 0 0 9 824 Tallangatta 0 0 2 2 4 2 4 2 2 2 2 2 3 2 4 2 21 1425 Eskdale 0 0 2 2 4 2 4 2 2 2 2 2 3 2 4 2 21 1426 Granya 0 0 2 2 4 2 4 2 2 2 2 2 3 2 4 2 21 1427 Sugarloaf Road 3 0 2 2 4 2 4 2 2 2 2 2 3 2 4 2 24 1428 Myrtleford 3 0 2 2 4 2 4 2 2 2 2 2 3 2 4 2 24 1429 Harrietville 3 0 2 2 4 2 4 2 2 2 2 2 3 2 4 2 24 1430 Mt Beauty 0 0 2 2 4 2 4 2 2 2 2 2 3 2 4 2 21 14
MIN 9 8AVG 18 13MAX 24 14
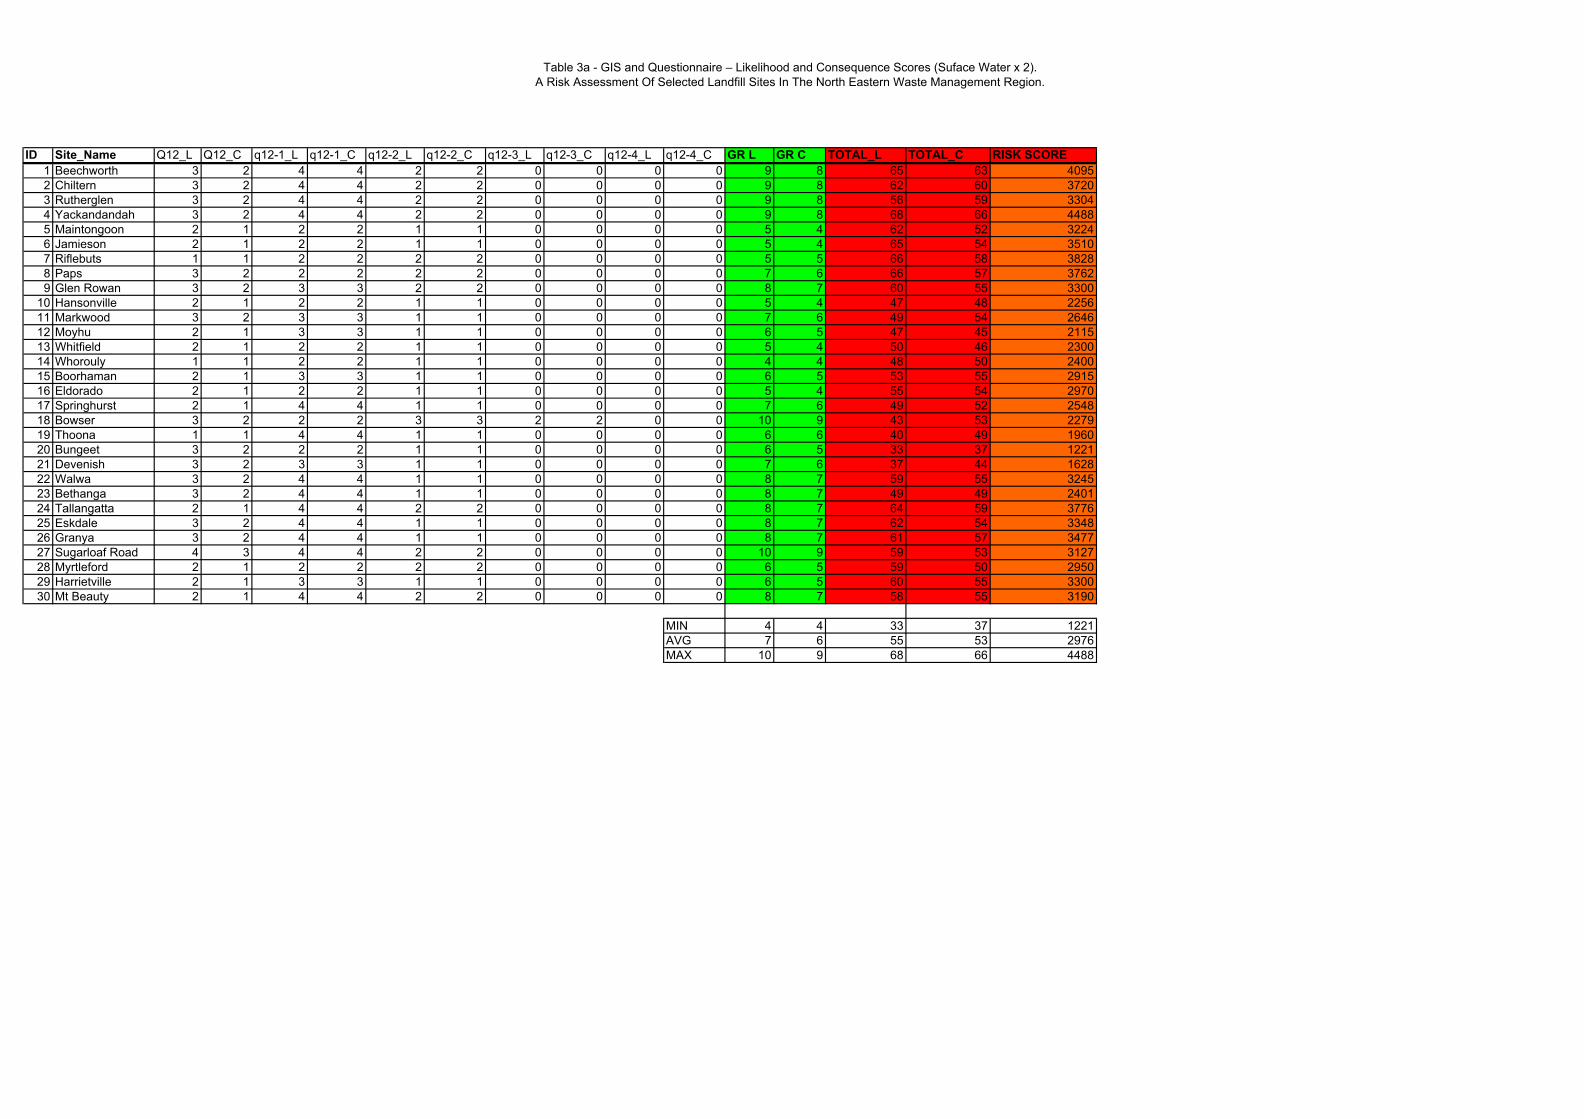
Table 3a - GIS and Questionnaire – Likelihood and Consequence Scores (Suface Water x 2).A Risk Assessment Of Selected Landfill Sites In The North Eastern Waste Management Region.
ID Site_Name Q12_L Q12_C q12-1_L q12-1_C q12-2_L q12-2_C q12-3_L q12-3_C q12-4_L q12-4_C GR L GR C TOTAL_L TOTAL_C RISK SCORE1 Beechworth 3 2 4 4 2 2 0 0 0 0 9 8 65 63 40952 Chiltern 3 2 4 4 2 2 0 0 0 0 9 8 62 60 37203 Rutherglen 3 2 4 4 2 2 0 0 0 0 9 8 56 59 33044 Yackandandah 3 2 4 4 2 2 0 0 0 0 9 8 68 66 44885 Maintongoon 2 1 2 2 1 1 0 0 0 0 5 4 62 52 32246 Jamieson 2 1 2 2 1 1 0 0 0 0 5 4 65 54 35107 Riflebuts 1 1 2 2 2 2 0 0 0 0 5 5 66 58 38288 Paps 3 2 2 2 2 2 0 0 0 0 7 6 66 57 37629 Glen Rowan 3 2 3 3 2 2 0 0 0 0 8 7 60 55 3300
10 Hansonville 2 1 2 2 1 1 0 0 0 0 5 4 47 48 225611 Markwood 3 2 3 3 1 1 0 0 0 0 7 6 49 54 264612 Moyhu 2 1 3 3 1 1 0 0 0 0 6 5 47 45 211513 Whitfield 2 1 2 2 1 1 0 0 0 0 5 4 50 46 230014 Whorouly 1 1 2 2 1 1 0 0 0 0 4 4 48 50 240015 Boorhaman 2 1 3 3 1 1 0 0 0 0 6 5 53 55 291516 Eldorado 2 1 2 2 1 1 0 0 0 0 5 4 55 54 297017 Springhurst 2 1 4 4 1 1 0 0 0 0 7 6 49 52 254818 Bowser 3 2 2 2 3 3 2 2 0 0 10 9 43 53 227919 Thoona 1 1 4 4 1 1 0 0 0 0 6 6 40 49 196020 Bungeet 3 2 2 2 1 1 0 0 0 0 6 5 33 37 122121 Devenish 3 2 3 3 1 1 0 0 0 0 7 6 37 44 162822 Walwa 3 2 4 4 1 1 0 0 0 0 8 7 59 55 324523 Bethanga 3 2 4 4 1 1 0 0 0 0 8 7 49 49 240124 Tallangatta 2 1 4 4 2 2 0 0 0 0 8 7 64 59 377625 Eskdale 3 2 4 4 1 1 0 0 0 0 8 7 62 54 334826 Granya 3 2 4 4 1 1 0 0 0 0 8 7 61 57 347727 Sugarloaf Road 4 3 4 4 2 2 0 0 0 0 10 9 59 53 312728 Myrtleford 2 1 2 2 2 2 0 0 0 0 6 5 59 50 295029 Harrietville 2 1 3 3 1 1 0 0 0 0 6 5 60 55 330030 Mt Beauty 2 1 4 4 2 2 0 0 0 0 8 7 58 55 3190
MIN 4 4 33 37 1221AVG 7 6 55 53 2976MAX 10 9 68 66 4488
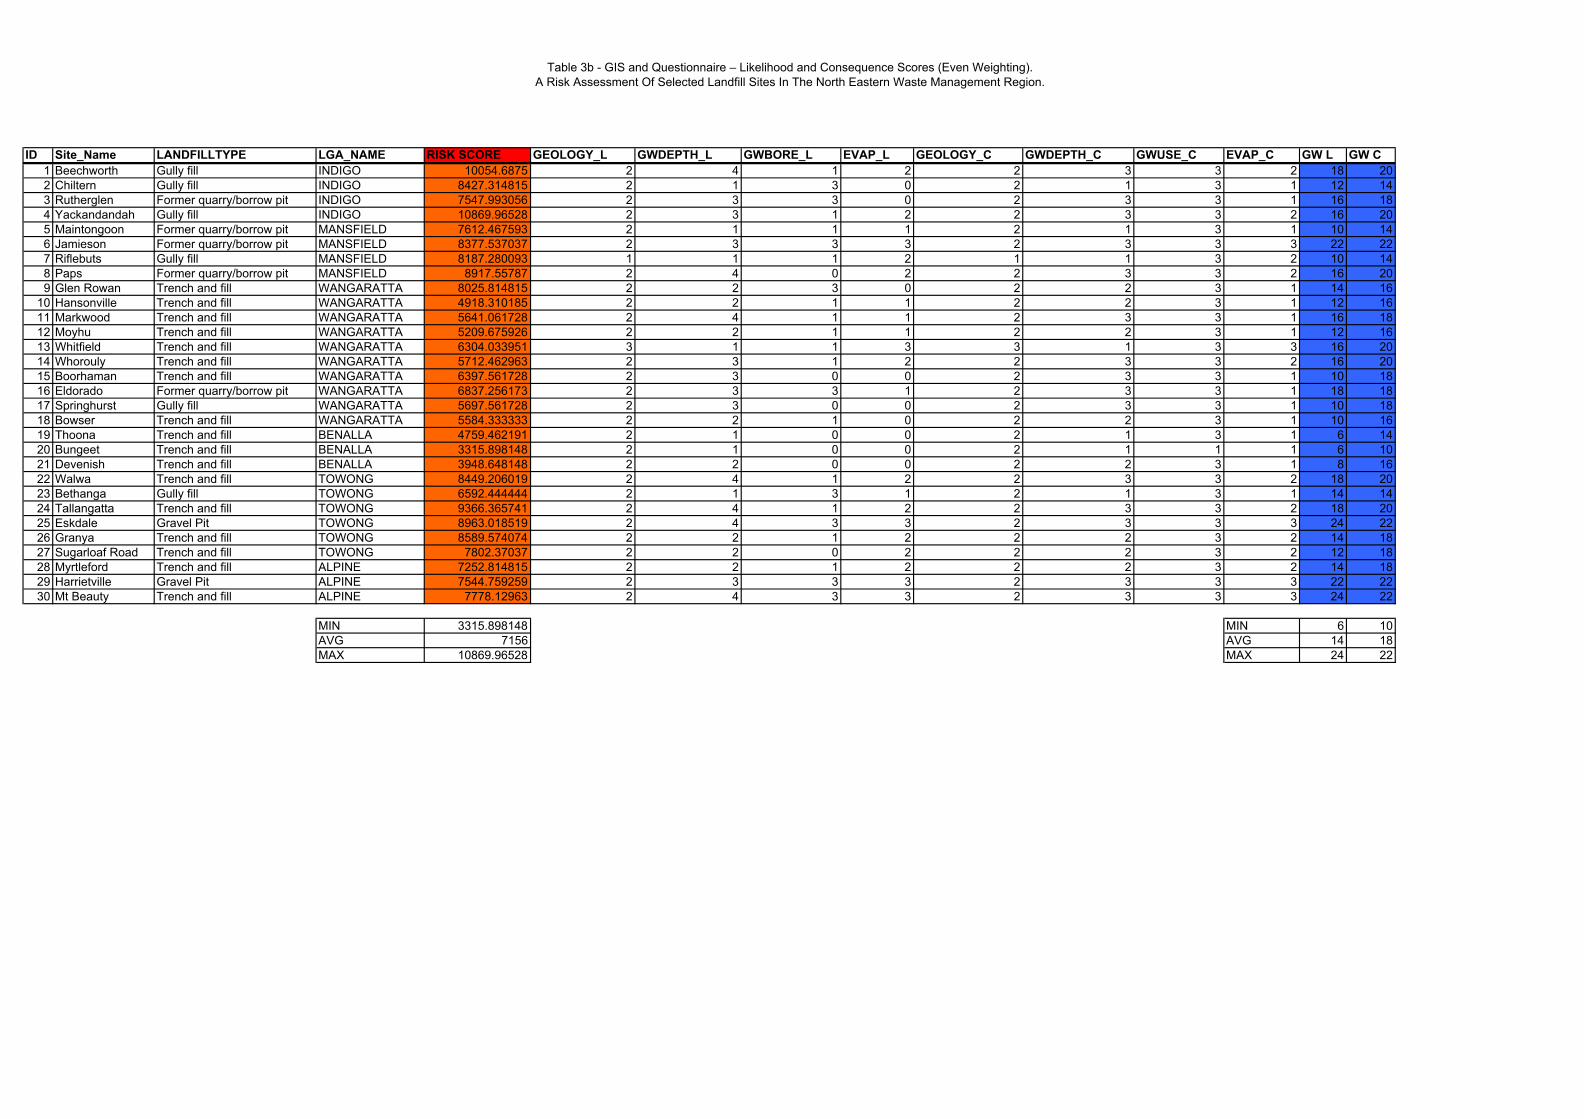
Table 3b - GIS and Questionnaire – Likelihood and Consequence Scores (Even Weighting).A Risk Assessment Of Selected Landfill Sites In The North Eastern Waste Management Region.
ID Site_Name LANDFILLTYPE LGA_NAME RISK SCORE GEOLOGY_L GWDEPTH_L GWBORE_L EVAP_L GEOLOGY_C GWDEPTH_C GWUSE_C EVAP_C GW L GW C1 Beechworth Gully fill INDIGO 10054.6875 2 4 1 2 2 3 3 2 18 202 Chiltern Gully fill INDIGO 8427.314815 2 1 3 0 2 1 3 1 12 143 Rutherglen Former quarry/borrow pit INDIGO 7547.993056 2 3 3 0 2 3 3 1 16 184 Yackandandah Gully fill INDIGO 10869.96528 2 3 1 2 2 3 3 2 16 205 Maintongoon Former quarry/borrow pit MANSFIELD 7612.467593 2 1 1 1 2 1 3 1 10 146 Jamieson Former quarry/borrow pit MANSFIELD 8377.537037 2 3 3 3 2 3 3 3 22 227 Riflebuts Gully fill MANSFIELD 8187.280093 1 1 1 2 1 1 3 2 10 148 Paps Former quarry/borrow pit MANSFIELD 8917.55787 2 4 0 2 2 3 3 2 16 209 Glen Rowan Trench and fill WANGARATTA 8025.814815 2 2 3 0 2 2 3 1 14 16
10 Hansonville Trench and fill WANGARATTA 4918.310185 2 2 1 1 2 2 3 1 12 1611 Markwood Trench and fill WANGARATTA 5641.061728 2 4 1 1 2 3 3 1 16 1812 Moyhu Trench and fill WANGARATTA 5209.675926 2 2 1 1 2 2 3 1 12 1613 Whitfield Trench and fill WANGARATTA 6304.033951 3 1 1 3 3 1 3 3 16 2014 Whorouly Trench and fill WANGARATTA 5712.462963 2 3 1 2 2 3 3 2 16 2015 Boorhaman Trench and fill WANGARATTA 6397.561728 2 3 0 0 2 3 3 1 10 1816 Eldorado Former quarry/borrow pit WANGARATTA 6837.256173 2 3 3 1 2 3 3 1 18 1817 Springhurst Gully fill WANGARATTA 5697.561728 2 3 0 0 2 3 3 1 10 1818 Bowser Trench and fill WANGARATTA 5584.333333 2 2 1 0 2 2 3 1 10 1619 Thoona Trench and fill BENALLA 4759.462191 2 1 0 0 2 1 3 1 6 1420 Bungeet Trench and fill BENALLA 3315.898148 2 1 0 0 2 1 1 1 6 1021 Devenish Trench and fill BENALLA 3948.648148 2 2 0 0 2 2 3 1 8 1622 Walwa Trench and fill TOWONG 8449.206019 2 4 1 2 2 3 3 2 18 2023 Bethanga Gully fill TOWONG 6592.444444 2 1 3 1 2 1 3 1 14 1424 Tallangatta Trench and fill TOWONG 9366.365741 2 4 1 2 2 3 3 2 18 2025 Eskdale Gravel Pit TOWONG 8963.018519 2 4 3 3 2 3 3 3 24 2226 Granya Trench and fill TOWONG 8589.574074 2 2 1 2 2 2 3 2 14 1827 Sugarloaf Road Trench and fill TOWONG 7802.37037 2 2 0 2 2 2 3 2 12 1828 Myrtleford Trench and fill ALPINE 7252.814815 2 2 1 2 2 2 3 2 14 1829 Harrietville Gravel Pit ALPINE 7544.759259 2 3 3 3 2 3 3 3 22 2230 Mt Beauty Trench and fill ALPINE 7778.12963 2 4 3 3 2 3 3 3 24 22
MIN 3315.898148 MIN 6 10AVG 7156 AVG 14 18MAX 10869.96528 MAX 24 22

Table 3b - GIS and Questionnaire – Likelihood and Consequence Scores (Even Weighting).A Risk Assessment Of Selected Landfill Sites In The North Eastern Waste Management Region.
ID Site_Name SW_L Q10_SW_L Q10_1_SW_L Q2_TOPO_L SW L SW_C Q10_SW_C Q10_1_SW_C Q2_TOPO_C SW C SW L SW C1 Beechworth 3 0 3 2 5 3 2 2 2 5 25 252 Chiltern 2 0 3 2 4 2 2 2 2 4 20 203 Rutherglen 2 0 0 0 2 2 2 2 2 4 10 204 Yackandandah 3 3 3 3 6 3 2 2 2 5 30 255 Maintongoon 3 0 3 3 6 3 2 2 2 5 30 256 Jamieson 2 0 0 3 5 2 2 2 2 4 25 207 Riflebuts 2 0 0 3 5 2 2 2 2 4 25 208 Paps 2 0 0 3 5 2 2 2 2 4 25 209 Glen Rowan 2 0 0 3 5 2 2 2 2 4 25 20
10 Hansonville 2 0 0 0 2 2 2 2 2 4 10 2011 Markwood 0 0 0 0 0 2 2 2 2 4 0 2012 Moyhu 2 0 0 2 4 2 2 2 2 4 20 2013 Whitfield 3 0 0 3 6 3 2 2 2 5 30 2514 Whorouly 3 0 0 0 3 3 2 2 2 5 15 2515 Boorhaman 3 3 0 0 3 2 2 2 2 4 15 2016 Eldorado 3 0 3 0 3 3 2 2 2 5 15 2517 Springhurst 2 0 0 0 2 2 2 2 2 4 10 2018 Bowser 2 0 0 0 2 2 2 2 2 4 10 2019 Thoona 3 3 0 0 3 3 2 2 2 5 15 2520 Bungeet 3 3 0 0 3 3 2 2 2 5 15 2521 Devenish 2 0 0 0 2 2 2 2 2 4 10 2022 Walwa 3 3 0 2 5 3 2 2 2 5 25 2523 Bethanga 3 3 3 2 5 3 2 2 2 5 25 2524 Tallangatta 3 3 3 2 5 3 2 2 2 5 25 2525 Eskdale 3 0 0 2 5 3 2 2 2 5 25 2526 Granya 3 0 0 2 5 3 2 2 2 5 25 2527 Sugarloaf Road 2 0 0 2 4 2 2 2 2 4 20 2028 Myrtleford 3 3 0 2 5 2 2 2 2 4 25 2029 Harrietville 2 0 0 0 2 2 2 2 2 4 10 2030 Mt Beauty 2 0 0 0 2 2 2 2 2 4 10 20
0 2019 2230 25
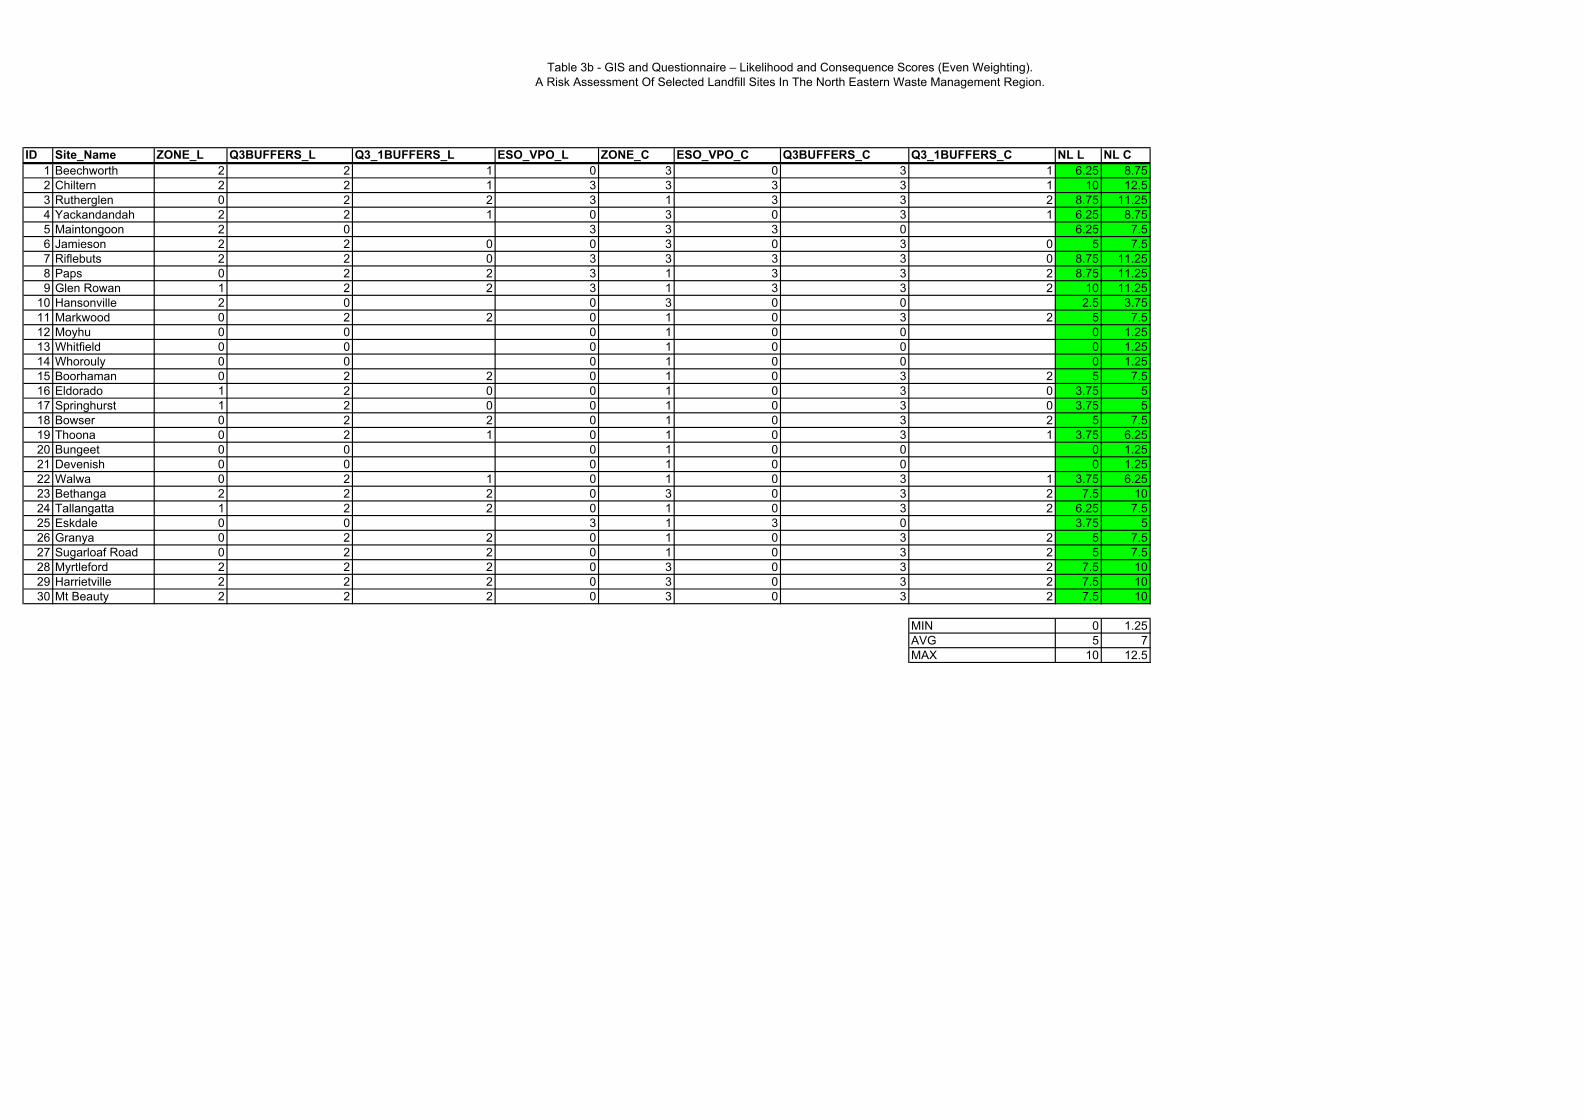
Table 3b - GIS and Questionnaire – Likelihood and Consequence Scores (Even Weighting).A Risk Assessment Of Selected Landfill Sites In The North Eastern Waste Management Region.
ID Site_Name ZONE_L Q3BUFFERS_L Q3_1BUFFERS_L ESO_VPO_L ZONE_C ESO_VPO_C Q3BUFFERS_C Q3_1BUFFERS_C NL L NL C1 Beechworth 2 2 1 0 3 0 3 1 6.25 8.752 Chiltern 2 2 1 3 3 3 3 1 10 12.53 Rutherglen 0 2 2 3 1 3 3 2 8.75 11.254 Yackandandah 2 2 1 0 3 0 3 1 6.25 8.755 Maintongoon 2 0 3 3 3 0 6.25 7.56 Jamieson 2 2 0 0 3 0 3 0 5 7.57 Riflebuts 2 2 0 3 3 3 3 0 8.75 11.258 Paps 0 2 2 3 1 3 3 2 8.75 11.259 Glen Rowan 1 2 2 3 1 3 3 2 10 11.25
10 Hansonville 2 0 0 3 0 0 2.5 3.7511 Markwood 0 2 2 0 1 0 3 2 5 7.512 Moyhu 0 0 0 1 0 0 0 1.2513 Whitfield 0 0 0 1 0 0 0 1.2514 Whorouly 0 0 0 1 0 0 0 1.2515 Boorhaman 0 2 2 0 1 0 3 2 5 7.516 Eldorado 1 2 0 0 1 0 3 0 3.75 517 Springhurst 1 2 0 0 1 0 3 0 3.75 518 Bowser 0 2 2 0 1 0 3 2 5 7.519 Thoona 0 2 1 0 1 0 3 1 3.75 6.2520 Bungeet 0 0 0 1 0 0 0 1.2521 Devenish 0 0 0 1 0 0 0 1.2522 Walwa 0 2 1 0 1 0 3 1 3.75 6.2523 Bethanga 2 2 2 0 3 0 3 2 7.5 1024 Tallangatta 1 2 2 0 1 0 3 2 6.25 7.525 Eskdale 0 0 3 1 3 0 3.75 526 Granya 0 2 2 0 1 0 3 2 5 7.527 Sugarloaf Road 0 2 2 0 1 0 3 2 5 7.528 Myrtleford 2 2 2 0 3 0 3 2 7.5 1029 Harrietville 2 2 2 0 3 0 3 2 7.5 1030 Mt Beauty 2 2 2 0 3 0 3 2 7.5 10
MIN 0 1.25AVG 5 7MAX 10 12.5

Table 3b - GIS and Questionnaire – Likelihood and Consequence Scores (Even Weighting).A Risk Assessment Of Selected Landfill Sites In The North Eastern Waste Management Region.
ID Site_Name Q5WASTE_L Q5WASTE_C Q5_2WASTE_L Q5_1WASTE_C Landfill area Site Q7SUPERVISION_L Q7SUPERVISION_C Q7_1ACCESS_L Q7_1ACCESS_C Q8LSIO_L Q8LSIO_C Q8_1LEACHATE_L1 Beechworth 2 2 3 3 28500 65044 3 3 0 0 0 0 22 Chiltern 2 2 2 2 12000 33132 3 3 2 2 0 0 23 Rutherglen 2 2 2 2 17500 38500 3 3 2 2 0 0 24 Yackandandah 2 2 2 2 5300 13000 3 3 2 2 0 0 25 Maintongoon 1 1 3 3 5000 5000 3 3 2 2 0 0 06 Jamieson 1 1 3 3 7000 7000 3 3 2 2 0 0 07 Riflebuts 1 1 3 3 5000 5000 3 3 2 2 0 0 28 Paps 2 2 2 2 11000 11000 2 2 0 0 0 0 09 Glen Rowan 2 2 2 2 30000 60000 3 3 0 0 0 0 2
10 Hansonville 2 2 2 2 2500 6000 3 3 2 2 0 0 211 Markwood 2 2 2 2 30000 85000 3 3 0 0 0 0 212 Moyhu 2 2 2 2 4000 200000 3 3 0 0 0 0 213 Whitfield 2 2 2 2 3000 110000 3 3 0 0 0 0 214 Whorouly 2 2 2 2 3000 7000 3 3 2 2 0 0 215 Boorhaman 2 2 2 2 2000 15000 3 3 2 2 0 0 216 Eldorado 2 2 2 2 4000 17000 3 3 2 2 0 0 217 Springhurst 2 2 2 2 1000 34000 3 3 0 0 0 0 218 Bowser 2 2 3 3 150000 185000 2 2 0 0 0 0 219 Thoona 2 2 2 2 85000 50752 3 3 2 2 0 0 020 Bungeet 2 2 1 1 54000 27199 1 1 0 0 0 0 021 Devenish 2 2 1 1 31437 20000 2 2 0 0 0 0 022 Walwa 2 2 2 2 7000 12000 1 1 0 0 0 0 023 Bethanga 2 2 2 2 7000 10000 2 2 0 0 0 0 224 Tallangatta 2 2 2 2 5000 10000 2 2 2 2 0 0 025 Eskdale 2 2 2 2 6000 10000 2 2 0 0 0 0 026 Granya 2 2 2 2 3000 10000 3 3 2 2 0 0 027 Sugarloaf Road 2 2 2 2 16000 20000 1 1 0 0 0 0 028 Myrtleford 2 2 1 1 20000 24200 1 1 0 0 0 0 029 Harrietville 2 2 1 1 6800 7500 2 2 2 2 0 0 030 Mt Beauty 2 2 1 1 18000 20500 1 1 0 0 0 0 2

Table 3b - GIS and Questionnaire – Likelihood and Consequence Scores (Even Weighting).A Risk Assessment Of Selected Landfill Sites In The North Eastern Waste Management Region.
ID Site_Name Q8_1LEACHATE_C Q8_2LEACHATE_L Q8_2LEACHATE_C Q8_3LITTER_L Q8_3LITTER_C Q9ENV_MONITORING_L Q9ENV_MONITORING_C Q9_1GWIMPACTS_L Q9_1GWIMPACTS_C GE L GE C1 Beechworth 2 2 2 0 0 2 2 0 0 14 142 Chiltern 2 2 2 0 0 2 2 0 0 15 153 Rutherglen 2 0 0 2 2 0 0 13 134 Yackandandah 2 2 2 1 2 2 2 0 0 16 175 Maintongoon 0 0 0 2 2 0 0 11 116 Jamieson 0 0 0 2 2 0 0 11 117 Riflebuts 2 2 2 0 0 2 2 0 0 15 158 Paps 0 0 0 2 2 2 2 10 109 Glen Rowan 2 0 0 2 2 0 0 11 11
10 Hansonville 2 0 0 2 2 0 0 13 1311 Markwood 2 0 0 2 2 0 0 11 1112 Moyhu 2 0 0 2 2 0 0 11 1113 Whitfield 2 0 0 2 2 0 0 11 1114 Whorouly 2 0 0 2 2 0 0 13 1315 Boorhaman 2 0 0 2 2 0 0 13 1316 Eldorado 2 0 0 2 2 0 0 13 1317 Springhurst 2 0 0 2 2 0 0 11 1118 Bowser 2 0 0 1 2 1 1 0 0 11 1219 Thoona 0 0 0 2 2 0 0 11 1120 Bungeet 0 0 0 2 2 0 0 6 621 Devenish 0 1 2 2 2 2 2 10 1122 Walwa 0 1 2 2 2 0 0 8 923 Bethanga 2 0 0 0 0 1 1 0 0 9 924 Tallangatta 0 1 2 2 2 0 0 11 1225 Eskdale 0 0 0 2 2 0 0 8 826 Granya 0 0 0 2 2 0 0 11 1127 Sugarloaf Road 0 0 0 2 2 0 0 7 728 Myrtleford 0 0 0 2 2 0 0 6 629 Harrietville 0 0 0 2 2 0 0 9 930 Mt Beauty 2 0 0 1 1 0 0 7 7
MIN 6 6AVG 11 11MAX 16 17

Table 3b - GIS and Questionnaire – Likelihood and Consequence Scores (Even Weighting).A Risk Assessment Of Selected Landfill Sites In The North Eastern Waste Management Region.
ID Site_Name Q11_L q11_C Q11-1_L Q11-1_C Q11-2_L Q11-2_C Q11-3_L Q11-3_C Q11-4_L Q11-4_C Q11-5_L Q11-5_C Q11-6_L Q11-6_C Q11-7_L Q11-7_C Q11-9_L Q11-9_C RE L RE L1 Beechworth 0 0 2 2 2 2 3 2 2 2 2 2 3 2 4 2 20 15.5562 Chiltern 0 0 2 2 2 2 3 2 0 0 2 2 3 2 4 2 17.778 13.3333 Rutherglen 0 0 2 2 2 2 3 2 2 2 2 2 0 0 4 2 16.667 13.3334 Yackandandah 0 0 2 2 2 2 3 2 2 2 2 2 3 2 4 2 20 15.5565 Maintongoon 3 0 2 2 4 2 4 2 2 2 2 2 3 2 4 2 26.667 15.5566 Jamieson 3 0 2 2 4 2 4 2 2 2 2 2 3 2 4 2 26.667 15.5567 Riflebuts 3 0 2 2 4 2 4 2 2 2 2 2 3 2 4 2 26.667 15.5568 Paps 3 0 2 2 4 2 4 2 2 2 2 2 3 2 4 2 26.667 15.5569 Glen Rowan 3 0 2 2 3 2 0 2 2 2 2 2 0 0 4 2 17.778 13.333
10 Hansonville 3 0 2 2 3 2 0 2 2 2 0 0 3 2 4 2 18.889 13.33311 Markwood 3 0 2 2 0 2 3 2 2 2 2 2 3 2 4 2 21.111 15.55612 Moyhu 3 0 2 2 3 2 0 2 2 2 2 2 0 0 4 2 17.778 13.33313 Whitfield 3 0 2 2 3 2 0 2 2 2 0 0 0 0 4 2 15.556 11.11114 Whorouly 3 0 2 2 0 2 3 2 2 2 0 0 3 2 4 2 18.889 13.33315 Boorhaman 3 0 2 2 3 2 0 2 2 2 2 2 3 2 4 2 21.111 15.55616 Eldorado 3 0 2 2 3 2 0 2 2 2 2 2 3 2 4 2 21.111 15.55617 Springhurst 3 0 2 2 3 2 0 2 2 2 2 2 3 2 4 2 21.111 15.55618 Bowser 0 0 2 2 2 2 0 2 0 0 0 0 3 2 2 2 0 0 10 11.11119 Thoona 0 0 2 2 3 2 3 2 2 2 0 0 0 0 1 2 0 0 12.222 11.11120 Bungeet 0 0 2 2 3 2 4 2 2 2 0 0 0 0 1 2 0 0 13.333 11.11121 Devenish 0 0 2 2 3 2 4 2 2 2 0 0 0 0 1 2 0 0 13.333 11.11122 Walwa 0 0 2 2 4 2 4 2 2 2 2 2 3 2 4 2 23.333 15.55623 Bethanga 0 0 0 0 2 2 2 2 2 2 0 0 0 0 3 2 0 0 10 8.888924 Tallangatta 0 0 2 2 4 2 4 2 2 2 2 2 3 2 4 2 23.333 15.55625 Eskdale 0 0 2 2 4 2 4 2 2 2 2 2 3 2 4 2 23.333 15.55626 Granya 0 0 2 2 4 2 4 2 2 2 2 2 3 2 4 2 23.333 15.55627 Sugarloaf Road 3 0 2 2 4 2 4 2 2 2 2 2 3 2 4 2 26.667 15.55628 Myrtleford 3 0 2 2 4 2 4 2 2 2 2 2 3 2 4 2 26.667 15.55629 Harrietville 3 0 2 2 4 2 4 2 2 2 2 2 3 2 4 2 26.667 15.55630 Mt Beauty 0 0 2 2 4 2 4 2 2 2 2 2 3 2 4 2 23.333 15.556
MIN 10 8.8889AVG 20 14MAX 26.667 15.556

Table 3b - GIS and Questionnaire – Likelihood and Consequence Scores (Even Weighting).A Risk Assessment Of Selected Landfill Sites In The North Eastern Waste Management Region.
ID Site_Name Q12_L Q12_C q12-1_L q12-1_C q12-2_L q12-2_C q12-3_L q12-3_C q12-4_L q12-4_C GR L GR C TOTAL_L TOTAL_C RISK SCORE1 Beechworth 3 2 4 4 2 2 0 0 0 0 18 16 101.25 99.30555556 10054.68752 Chiltern 3 2 4 4 2 2 0 0 0 0 18 16 92.77777778 90.83333333 8427.3148153 Rutherglen 3 2 4 4 2 2 0 0 0 0 18 16 82.41666667 91.58333333 7547.9930564 Yackandandah 3 2 4 4 2 2 0 0 0 0 18 16 106.25 102.3055556 10869.965285 Maintongoon 2 1 2 2 1 1 0 0 0 0 10 8 93.91666667 81.05555556 7612.4675936 Jamieson 2 1 2 2 1 1 0 0 0 0 10 8 99.66666667 84.05555556 8377.5370377 Riflebuts 1 1 2 2 2 2 0 0 0 0 10 10 95.41666667 85.80555556 8187.2800938 Paps 3 2 2 2 2 2 0 0 0 0 14 12 100.4166667 88.80555556 8917.557879 Glen Rowan 3 2 3 3 2 2 0 0 0 0 16 14 93.77777778 85.58333333 8025.814815
10 Hansonville 2 1 2 2 1 1 0 0 0 0 10 8 66.38888889 74.08333333 4918.31018511 Markwood 3 2 3 3 1 1 0 0 0 0 14 12 67.11111111 84.05555556 5641.06172812 Moyhu 2 1 3 3 1 1 0 0 0 0 12 10 72.77777778 71.58333333 5209.67592613 Whitfield 2 1 2 2 1 1 0 0 0 0 10 8 82.55555556 76.36111111 6304.03395114 Whorouly 1 1 2 2 1 1 0 0 0 0 8 8 70.88888889 80.58333333 5712.46296315 Boorhaman 2 1 3 3 1 1 0 0 0 0 12 10 76.11111111 84.05555556 6397.56172816 Eldorado 2 1 2 2 1 1 0 0 0 0 10 8 80.86111111 84.55555556 6837.25617317 Springhurst 2 1 4 4 1 1 0 0 0 0 14 12 69.86111111 81.55555556 5697.56172818 Bowser 3 2 2 2 3 3 2 2 0 0 20 18 66 84.61111111 5584.33333319 Thoona 1 1 4 4 1 1 0 0 0 0 12 12 59.97222222 79.36111111 4759.46219120 Bungeet 3 2 2 2 1 1 0 0 0 0 12 10 52.33333333 63.36111111 3315.89814821 Devenish 3 2 3 3 1 1 0 0 0 0 14 12 55.33333333 71.36111111 3948.64814822 Walwa 3 2 4 4 1 1 0 0 0 0 16 14 94.08333333 89.80555556 8449.20601923 Bethanga 3 2 4 4 1 1 0 0 0 0 16 14 81.5 80.88888889 6592.44444424 Tallangatta 2 1 4 4 2 2 0 0 0 0 16 14 99.58333333 94.05555556 9366.36574125 Eskdale 3 2 4 4 1 1 0 0 0 0 16 14 100.0833333 89.55555556 8963.01851926 Granya 3 2 4 4 1 1 0 0 0 0 16 14 94.33333333 91.05555556 8589.57407427 Sugarloaf Road 4 3 4 4 2 2 0 0 0 0 20 18 90.66666667 86.05555556 7802.3703728 Myrtleford 2 1 2 2 2 2 0 0 0 0 12 10 91.16666667 79.55555556 7252.81481529 Harrietville 2 1 3 3 1 1 0 0 0 0 12 10 87.16666667 86.55555556 7544.75925930 Mt Beauty 2 1 4 4 2 2 0 0 0 0 16 14 87.83333333 88.55555556 7778.12963
MIN 8 8 52.33333333 63.36111111 3315.898148AVG 14 12 84 84 7156MAX 20 18 106.25 102.3055556 10869.96528
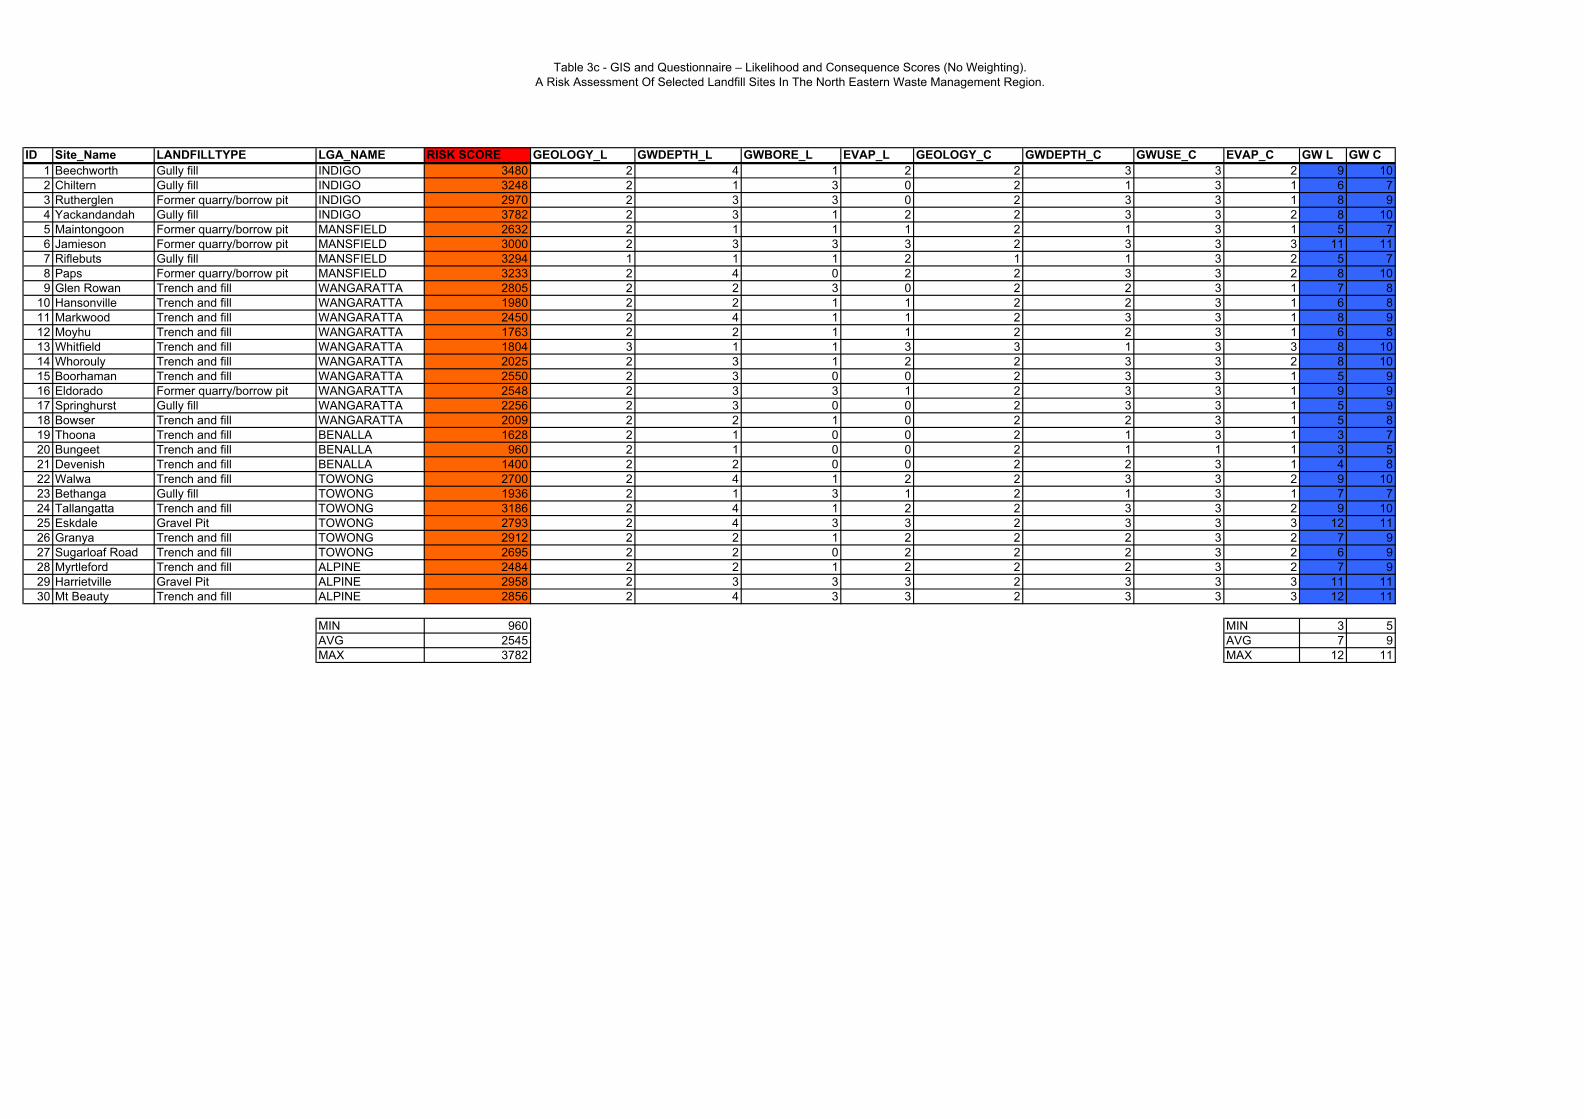
Table 3c - GIS and Questionnaire – Likelihood and Consequence Scores (No Weighting).A Risk Assessment Of Selected Landfill Sites In The North Eastern Waste Management Region.
ID Site_Name LANDFILLTYPE LGA_NAME RISK SCORE GEOLOGY_L GWDEPTH_L GWBORE_L EVAP_L GEOLOGY_C GWDEPTH_C GWUSE_C EVAP_C GW L GW C1 Beechworth Gully fill INDIGO 3480 2 4 1 2 2 3 3 2 9 102 Chiltern Gully fill INDIGO 3248 2 1 3 0 2 1 3 1 6 73 Rutherglen Former quarry/borrow pit INDIGO 2970 2 3 3 0 2 3 3 1 8 94 Yackandandah Gully fill INDIGO 3782 2 3 1 2 2 3 3 2 8 105 Maintongoon Former quarry/borrow pit MANSFIELD 2632 2 1 1 1 2 1 3 1 5 76 Jamieson Former quarry/borrow pit MANSFIELD 3000 2 3 3 3 2 3 3 3 11 117 Riflebuts Gully fill MANSFIELD 3294 1 1 1 2 1 1 3 2 5 78 Paps Former quarry/borrow pit MANSFIELD 3233 2 4 0 2 2 3 3 2 8 109 Glen Rowan Trench and fill WANGARATTA 2805 2 2 3 0 2 2 3 1 7 8
10 Hansonville Trench and fill WANGARATTA 1980 2 2 1 1 2 2 3 1 6 811 Markwood Trench and fill WANGARATTA 2450 2 4 1 1 2 3 3 1 8 912 Moyhu Trench and fill WANGARATTA 1763 2 2 1 1 2 2 3 1 6 813 Whitfield Trench and fill WANGARATTA 1804 3 1 1 3 3 1 3 3 8 1014 Whorouly Trench and fill WANGARATTA 2025 2 3 1 2 2 3 3 2 8 1015 Boorhaman Trench and fill WANGARATTA 2550 2 3 0 0 2 3 3 1 5 916 Eldorado Former quarry/borrow pit WANGARATTA 2548 2 3 3 1 2 3 3 1 9 917 Springhurst Gully fill WANGARATTA 2256 2 3 0 0 2 3 3 1 5 918 Bowser Trench and fill WANGARATTA 2009 2 2 1 0 2 2 3 1 5 819 Thoona Trench and fill BENALLA 1628 2 1 0 0 2 1 3 1 3 720 Bungeet Trench and fill BENALLA 960 2 1 0 0 2 1 1 1 3 521 Devenish Trench and fill BENALLA 1400 2 2 0 0 2 2 3 1 4 822 Walwa Trench and fill TOWONG 2700 2 4 1 2 2 3 3 2 9 1023 Bethanga Gully fill TOWONG 1936 2 1 3 1 2 1 3 1 7 724 Tallangatta Trench and fill TOWONG 3186 2 4 1 2 2 3 3 2 9 1025 Eskdale Gravel Pit TOWONG 2793 2 4 3 3 2 3 3 3 12 1126 Granya Trench and fill TOWONG 2912 2 2 1 2 2 2 3 2 7 927 Sugarloaf Road Trench and fill TOWONG 2695 2 2 0 2 2 2 3 2 6 928 Myrtleford Trench and fill ALPINE 2484 2 2 1 2 2 2 3 2 7 929 Harrietville Gravel Pit ALPINE 2958 2 3 3 3 2 3 3 3 11 1130 Mt Beauty Trench and fill ALPINE 2856 2 4 3 3 2 3 3 3 12 11
MIN 960 MIN 3 5AVG 2545 AVG 7 9MAX 3782 MAX 12 11
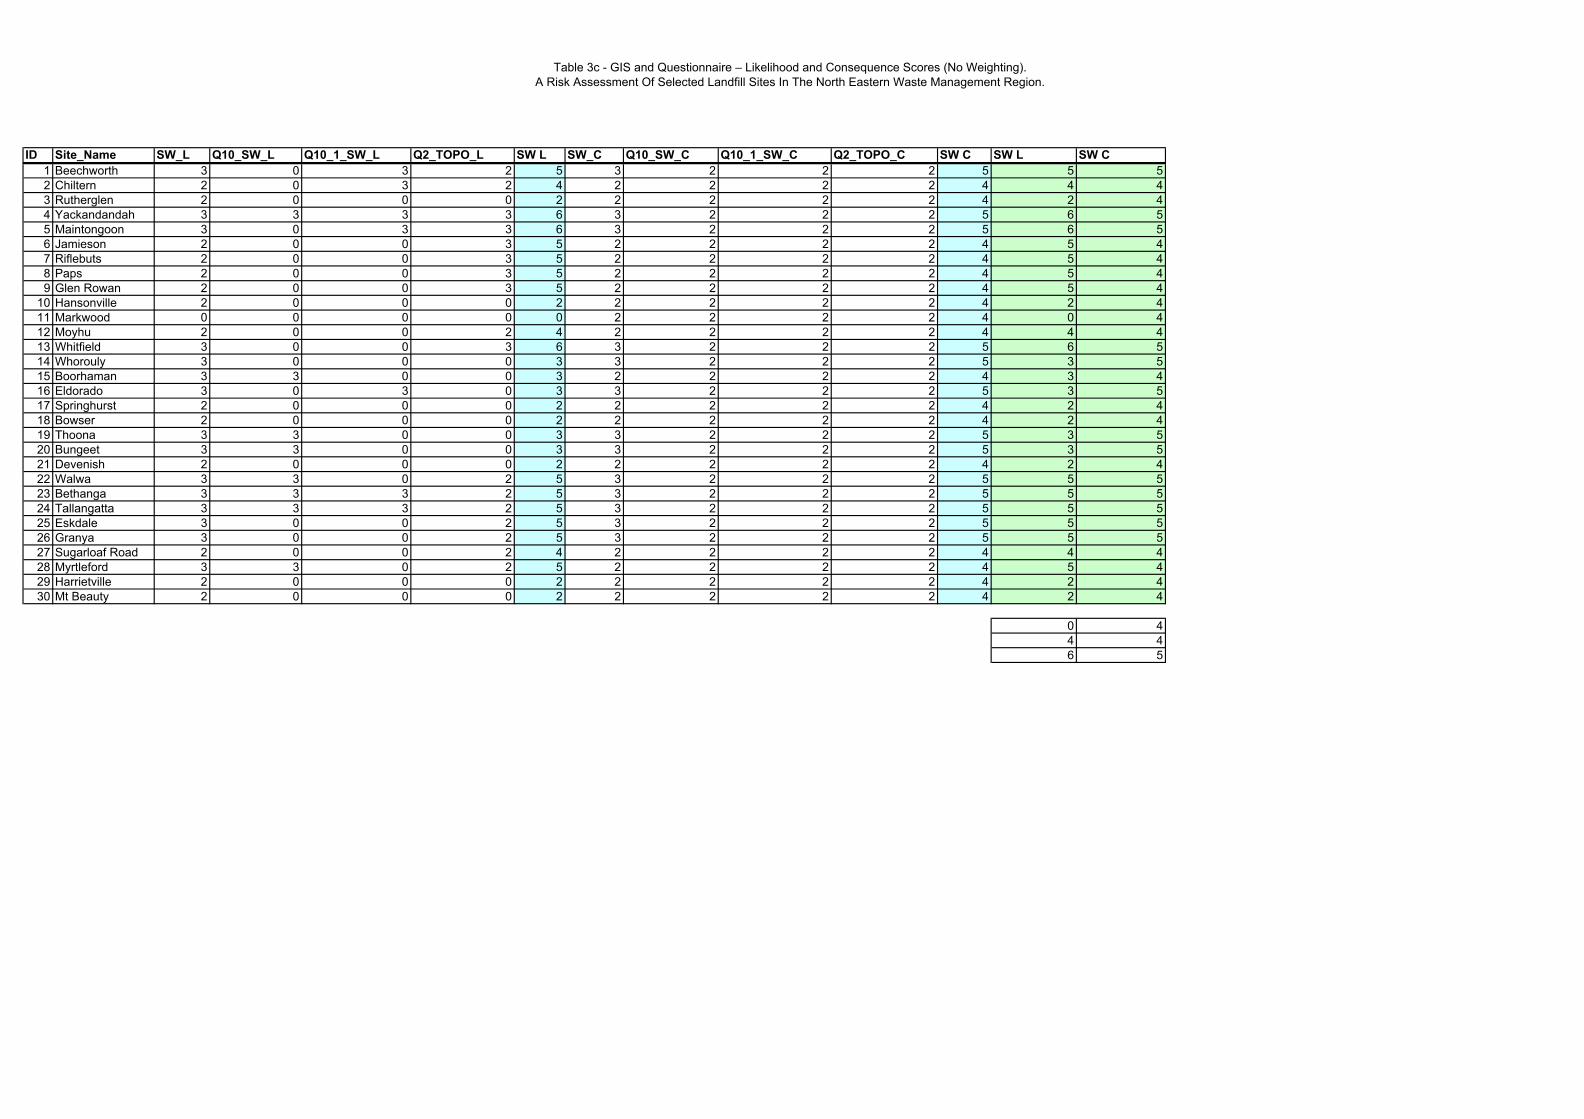
Table 3c - GIS and Questionnaire – Likelihood and Consequence Scores (No Weighting).A Risk Assessment Of Selected Landfill Sites In The North Eastern Waste Management Region.
ID Site_Name SW_L Q10_SW_L Q10_1_SW_L Q2_TOPO_L SW L SW_C Q10_SW_C Q10_1_SW_C Q2_TOPO_C SW C SW L SW C1 Beechworth 3 0 3 2 5 3 2 2 2 5 5 52 Chiltern 2 0 3 2 4 2 2 2 2 4 4 43 Rutherglen 2 0 0 0 2 2 2 2 2 4 2 44 Yackandandah 3 3 3 3 6 3 2 2 2 5 6 55 Maintongoon 3 0 3 3 6 3 2 2 2 5 6 56 Jamieson 2 0 0 3 5 2 2 2 2 4 5 47 Riflebuts 2 0 0 3 5 2 2 2 2 4 5 48 Paps 2 0 0 3 5 2 2 2 2 4 5 49 Glen Rowan 2 0 0 3 5 2 2 2 2 4 5 4
10 Hansonville 2 0 0 0 2 2 2 2 2 4 2 411 Markwood 0 0 0 0 0 2 2 2 2 4 0 412 Moyhu 2 0 0 2 4 2 2 2 2 4 4 413 Whitfield 3 0 0 3 6 3 2 2 2 5 6 514 Whorouly 3 0 0 0 3 3 2 2 2 5 3 515 Boorhaman 3 3 0 0 3 2 2 2 2 4 3 416 Eldorado 3 0 3 0 3 3 2 2 2 5 3 517 Springhurst 2 0 0 0 2 2 2 2 2 4 2 418 Bowser 2 0 0 0 2 2 2 2 2 4 2 419 Thoona 3 3 0 0 3 3 2 2 2 5 3 520 Bungeet 3 3 0 0 3 3 2 2 2 5 3 521 Devenish 2 0 0 0 2 2 2 2 2 4 2 422 Walwa 3 3 0 2 5 3 2 2 2 5 5 523 Bethanga 3 3 3 2 5 3 2 2 2 5 5 524 Tallangatta 3 3 3 2 5 3 2 2 2 5 5 525 Eskdale 3 0 0 2 5 3 2 2 2 5 5 526 Granya 3 0 0 2 5 3 2 2 2 5 5 527 Sugarloaf Road 2 0 0 2 4 2 2 2 2 4 4 428 Myrtleford 3 3 0 2 5 2 2 2 2 4 5 429 Harrietville 2 0 0 0 2 2 2 2 2 4 2 430 Mt Beauty 2 0 0 0 2 2 2 2 2 4 2 4
0 44 46 5
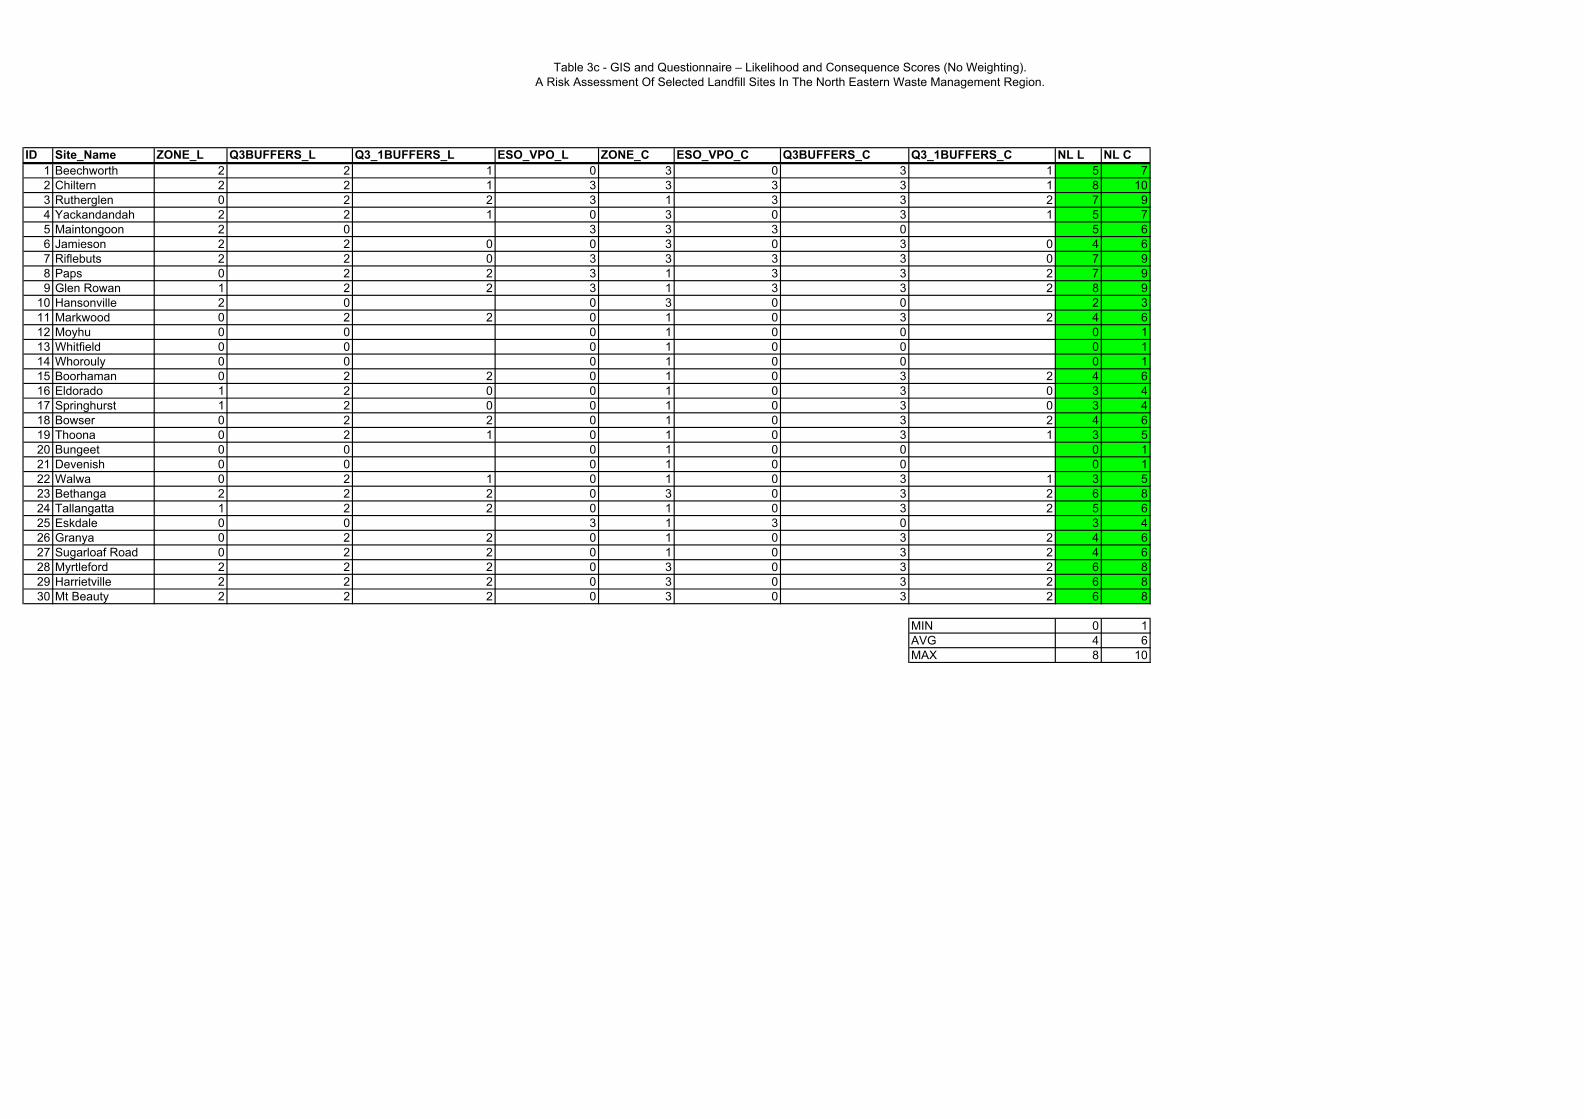
Table 3c - GIS and Questionnaire – Likelihood and Consequence Scores (No Weighting).A Risk Assessment Of Selected Landfill Sites In The North Eastern Waste Management Region.
ID Site_Name ZONE_L Q3BUFFERS_L Q3_1BUFFERS_L ESO_VPO_L ZONE_C ESO_VPO_C Q3BUFFERS_C Q3_1BUFFERS_C NL L NL C1 Beechworth 2 2 1 0 3 0 3 1 5 72 Chiltern 2 2 1 3 3 3 3 1 8 103 Rutherglen 0 2 2 3 1 3 3 2 7 94 Yackandandah 2 2 1 0 3 0 3 1 5 75 Maintongoon 2 0 3 3 3 0 5 66 Jamieson 2 2 0 0 3 0 3 0 4 67 Riflebuts 2 2 0 3 3 3 3 0 7 98 Paps 0 2 2 3 1 3 3 2 7 99 Glen Rowan 1 2 2 3 1 3 3 2 8 9
10 Hansonville 2 0 0 3 0 0 2 311 Markwood 0 2 2 0 1 0 3 2 4 612 Moyhu 0 0 0 1 0 0 0 113 Whitfield 0 0 0 1 0 0 0 114 Whorouly 0 0 0 1 0 0 0 115 Boorhaman 0 2 2 0 1 0 3 2 4 616 Eldorado 1 2 0 0 1 0 3 0 3 417 Springhurst 1 2 0 0 1 0 3 0 3 418 Bowser 0 2 2 0 1 0 3 2 4 619 Thoona 0 2 1 0 1 0 3 1 3 520 Bungeet 0 0 0 1 0 0 0 121 Devenish 0 0 0 1 0 0 0 122 Walwa 0 2 1 0 1 0 3 1 3 523 Bethanga 2 2 2 0 3 0 3 2 6 824 Tallangatta 1 2 2 0 1 0 3 2 5 625 Eskdale 0 0 3 1 3 0 3 426 Granya 0 2 2 0 1 0 3 2 4 627 Sugarloaf Road 0 2 2 0 1 0 3 2 4 628 Myrtleford 2 2 2 0 3 0 3 2 6 829 Harrietville 2 2 2 0 3 0 3 2 6 830 Mt Beauty 2 2 2 0 3 0 3 2 6 8
MIN 0 1AVG 4 6MAX 8 10
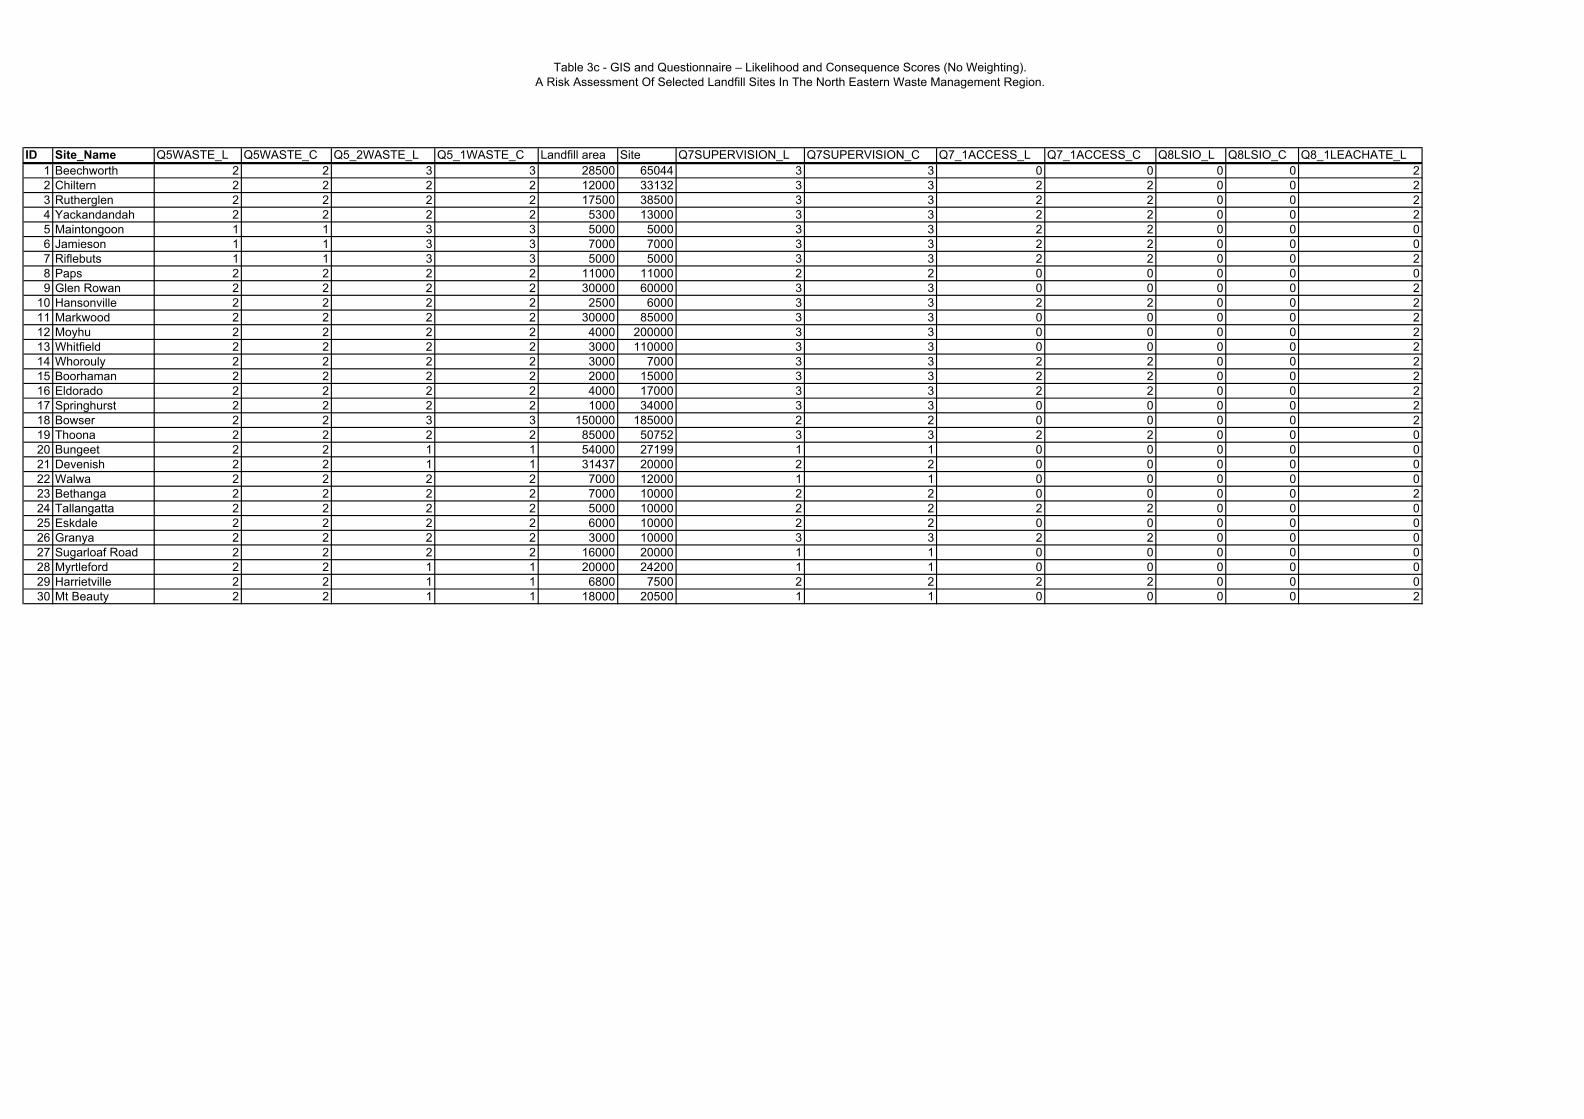
Table 3c - GIS and Questionnaire – Likelihood and Consequence Scores (No Weighting).A Risk Assessment Of Selected Landfill Sites In The North Eastern Waste Management Region.
ID Site_Name Q5WASTE_L Q5WASTE_C Q5_2WASTE_L Q5_1WASTE_C Landfill area Site Q7SUPERVISION_L Q7SUPERVISION_C Q7_1ACCESS_L Q7_1ACCESS_C Q8LSIO_L Q8LSIO_C Q8_1LEACHATE_L1 Beechworth 2 2 3 3 28500 65044 3 3 0 0 0 0 22 Chiltern 2 2 2 2 12000 33132 3 3 2 2 0 0 23 Rutherglen 2 2 2 2 17500 38500 3 3 2 2 0 0 24 Yackandandah 2 2 2 2 5300 13000 3 3 2 2 0 0 25 Maintongoon 1 1 3 3 5000 5000 3 3 2 2 0 0 06 Jamieson 1 1 3 3 7000 7000 3 3 2 2 0 0 07 Riflebuts 1 1 3 3 5000 5000 3 3 2 2 0 0 28 Paps 2 2 2 2 11000 11000 2 2 0 0 0 0 09 Glen Rowan 2 2 2 2 30000 60000 3 3 0 0 0 0 2
10 Hansonville 2 2 2 2 2500 6000 3 3 2 2 0 0 211 Markwood 2 2 2 2 30000 85000 3 3 0 0 0 0 212 Moyhu 2 2 2 2 4000 200000 3 3 0 0 0 0 213 Whitfield 2 2 2 2 3000 110000 3 3 0 0 0 0 214 Whorouly 2 2 2 2 3000 7000 3 3 2 2 0 0 215 Boorhaman 2 2 2 2 2000 15000 3 3 2 2 0 0 216 Eldorado 2 2 2 2 4000 17000 3 3 2 2 0 0 217 Springhurst 2 2 2 2 1000 34000 3 3 0 0 0 0 218 Bowser 2 2 3 3 150000 185000 2 2 0 0 0 0 219 Thoona 2 2 2 2 85000 50752 3 3 2 2 0 0 020 Bungeet 2 2 1 1 54000 27199 1 1 0 0 0 0 021 Devenish 2 2 1 1 31437 20000 2 2 0 0 0 0 022 Walwa 2 2 2 2 7000 12000 1 1 0 0 0 0 023 Bethanga 2 2 2 2 7000 10000 2 2 0 0 0 0 224 Tallangatta 2 2 2 2 5000 10000 2 2 2 2 0 0 025 Eskdale 2 2 2 2 6000 10000 2 2 0 0 0 0 026 Granya 2 2 2 2 3000 10000 3 3 2 2 0 0 027 Sugarloaf Road 2 2 2 2 16000 20000 1 1 0 0 0 0 028 Myrtleford 2 2 1 1 20000 24200 1 1 0 0 0 0 029 Harrietville 2 2 1 1 6800 7500 2 2 2 2 0 0 030 Mt Beauty 2 2 1 1 18000 20500 1 1 0 0 0 0 2

Table 3c - GIS and Questionnaire – Likelihood and Consequence Scores (No Weighting).A Risk Assessment Of Selected Landfill Sites In The North Eastern Waste Management Region.
ID Site_Name Q8_1LEACHATE_C Q8_2LEACHATE_L Q8_2LEACHATE_C Q8_3LITTER_L Q8_3LITTER_C Q9ENV_MONITORING_L Q9ENV_MONITORING_C Q9_1GWIMPACTS_L Q9_1GWIMPACTS_C GE L GE C1 Beechworth 2 2 2 0 0 2 2 0 0 14 142 Chiltern 2 2 2 0 0 2 2 0 0 15 153 Rutherglen 2 0 0 2 2 0 0 13 134 Yackandandah 2 2 2 1 2 2 2 0 0 16 175 Maintongoon 0 0 0 2 2 0 0 11 116 Jamieson 0 0 0 2 2 0 0 11 117 Riflebuts 2 2 2 0 0 2 2 0 0 15 158 Paps 0 0 0 2 2 2 2 10 109 Glen Rowan 2 0 0 2 2 0 0 11 11
10 Hansonville 2 0 0 2 2 0 0 13 1311 Markwood 2 0 0 2 2 0 0 11 1112 Moyhu 2 0 0 2 2 0 0 11 1113 Whitfield 2 0 0 2 2 0 0 11 1114 Whorouly 2 0 0 2 2 0 0 13 1315 Boorhaman 2 0 0 2 2 0 0 13 1316 Eldorado 2 0 0 2 2 0 0 13 1317 Springhurst 2 0 0 2 2 0 0 11 1118 Bowser 2 0 0 1 2 1 1 0 0 11 1219 Thoona 0 0 0 2 2 0 0 11 1120 Bungeet 0 0 0 2 2 0 0 6 621 Devenish 0 1 2 2 2 2 2 10 1122 Walwa 0 1 2 2 2 0 0 8 923 Bethanga 2 0 0 0 0 1 1 0 0 9 924 Tallangatta 0 1 2 2 2 0 0 11 1225 Eskdale 0 0 0 2 2 0 0 8 826 Granya 0 0 0 2 2 0 0 11 1127 Sugarloaf Road 0 0 0 2 2 0 0 7 728 Myrtleford 0 0 0 2 2 0 0 6 629 Harrietville 0 0 0 2 2 0 0 9 930 Mt Beauty 2 0 0 1 1 0 0 7 7
MIN 6 6AVG 11 11MAX 16 17
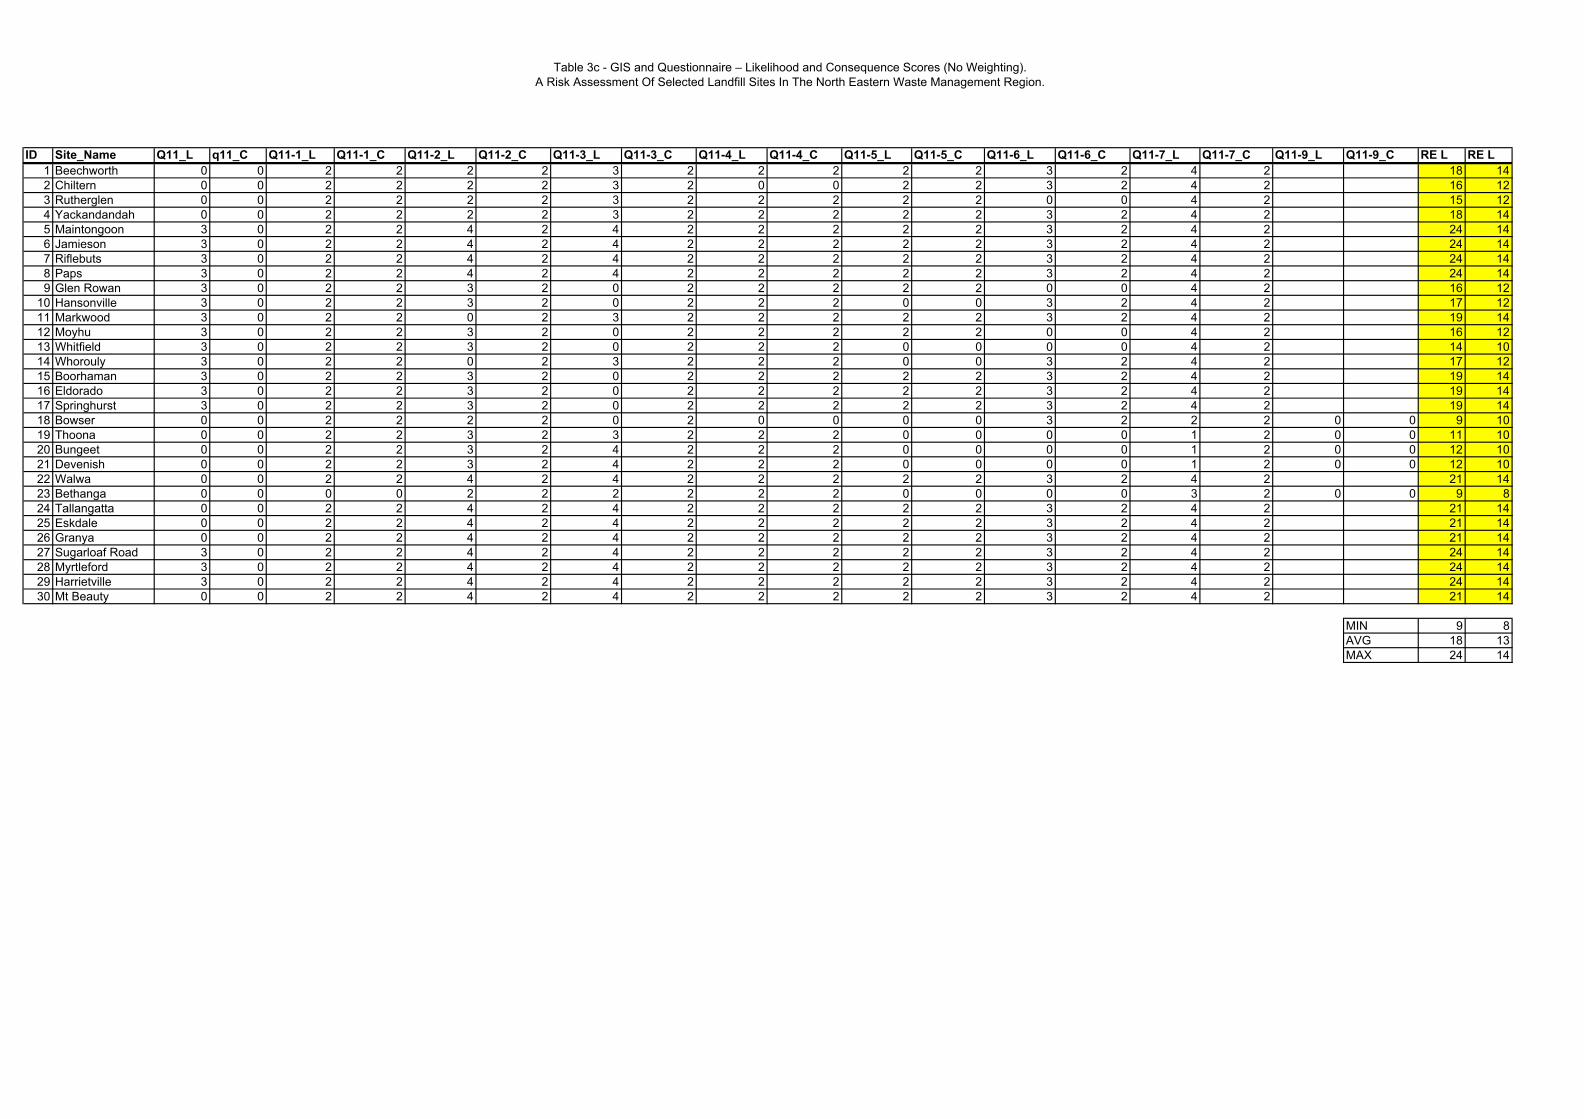
Table 3c - GIS and Questionnaire – Likelihood and Consequence Scores (No Weighting).A Risk Assessment Of Selected Landfill Sites In The North Eastern Waste Management Region.
ID Site_Name Q11_L q11_C Q11-1_L Q11-1_C Q11-2_L Q11-2_C Q11-3_L Q11-3_C Q11-4_L Q11-4_C Q11-5_L Q11-5_C Q11-6_L Q11-6_C Q11-7_L Q11-7_C Q11-9_L Q11-9_C RE L RE L1 Beechworth 0 0 2 2 2 2 3 2 2 2 2 2 3 2 4 2 18 142 Chiltern 0 0 2 2 2 2 3 2 0 0 2 2 3 2 4 2 16 123 Rutherglen 0 0 2 2 2 2 3 2 2 2 2 2 0 0 4 2 15 124 Yackandandah 0 0 2 2 2 2 3 2 2 2 2 2 3 2 4 2 18 145 Maintongoon 3 0 2 2 4 2 4 2 2 2 2 2 3 2 4 2 24 146 Jamieson 3 0 2 2 4 2 4 2 2 2 2 2 3 2 4 2 24 147 Riflebuts 3 0 2 2 4 2 4 2 2 2 2 2 3 2 4 2 24 148 Paps 3 0 2 2 4 2 4 2 2 2 2 2 3 2 4 2 24 149 Glen Rowan 3 0 2 2 3 2 0 2 2 2 2 2 0 0 4 2 16 12
10 Hansonville 3 0 2 2 3 2 0 2 2 2 0 0 3 2 4 2 17 1211 Markwood 3 0 2 2 0 2 3 2 2 2 2 2 3 2 4 2 19 1412 Moyhu 3 0 2 2 3 2 0 2 2 2 2 2 0 0 4 2 16 1213 Whitfield 3 0 2 2 3 2 0 2 2 2 0 0 0 0 4 2 14 1014 Whorouly 3 0 2 2 0 2 3 2 2 2 0 0 3 2 4 2 17 1215 Boorhaman 3 0 2 2 3 2 0 2 2 2 2 2 3 2 4 2 19 1416 Eldorado 3 0 2 2 3 2 0 2 2 2 2 2 3 2 4 2 19 1417 Springhurst 3 0 2 2 3 2 0 2 2 2 2 2 3 2 4 2 19 1418 Bowser 0 0 2 2 2 2 0 2 0 0 0 0 3 2 2 2 0 0 9 1019 Thoona 0 0 2 2 3 2 3 2 2 2 0 0 0 0 1 2 0 0 11 1020 Bungeet 0 0 2 2 3 2 4 2 2 2 0 0 0 0 1 2 0 0 12 1021 Devenish 0 0 2 2 3 2 4 2 2 2 0 0 0 0 1 2 0 0 12 1022 Walwa 0 0 2 2 4 2 4 2 2 2 2 2 3 2 4 2 21 1423 Bethanga 0 0 0 0 2 2 2 2 2 2 0 0 0 0 3 2 0 0 9 824 Tallangatta 0 0 2 2 4 2 4 2 2 2 2 2 3 2 4 2 21 1425 Eskdale 0 0 2 2 4 2 4 2 2 2 2 2 3 2 4 2 21 1426 Granya 0 0 2 2 4 2 4 2 2 2 2 2 3 2 4 2 21 1427 Sugarloaf Road 3 0 2 2 4 2 4 2 2 2 2 2 3 2 4 2 24 1428 Myrtleford 3 0 2 2 4 2 4 2 2 2 2 2 3 2 4 2 24 1429 Harrietville 3 0 2 2 4 2 4 2 2 2 2 2 3 2 4 2 24 1430 Mt Beauty 0 0 2 2 4 2 4 2 2 2 2 2 3 2 4 2 21 14
MIN 9 8AVG 18 13MAX 24 14

Table 3c - GIS and Questionnaire – Likelihood and Consequence Scores (No Weighting).A Risk Assessment Of Selected Landfill Sites In The North Eastern Waste Management Region.
ID Site_Name Q12_L Q12_C q12-1_L q12-1_C q12-2_L q12-2_C q12-3_L q12-3_C q12-4_L q12-4_C GR L GR C TOTAL_L TOTAL_C RISK SCORE1 Beechworth 3 2 4 4 2 2 0 0 0 0 9 8 60 58 34802 Chiltern 3 2 4 4 2 2 0 0 0 0 9 8 58 56 32483 Rutherglen 3 2 4 4 2 2 0 0 0 0 9 8 54 55 29704 Yackandandah 3 2 4 4 2 2 0 0 0 0 9 8 62 61 37825 Maintongoon 2 1 2 2 1 1 0 0 0 0 5 4 56 47 26326 Jamieson 2 1 2 2 1 1 0 0 0 0 5 4 60 50 30007 Riflebuts 1 1 2 2 2 2 0 0 0 0 5 5 61 54 32948 Paps 3 2 2 2 2 2 0 0 0 0 7 6 61 53 32339 Glen Rowan 3 2 3 3 2 2 0 0 0 0 8 7 55 51 2805
10 Hansonville 2 1 2 2 1 1 0 0 0 0 5 4 45 44 198011 Markwood 3 2 3 3 1 1 0 0 0 0 7 6 49 50 245012 Moyhu 2 1 3 3 1 1 0 0 0 0 6 5 43 41 176313 Whitfield 2 1 2 2 1 1 0 0 0 0 5 4 44 41 180414 Whorouly 1 1 2 2 1 1 0 0 0 0 4 4 45 45 202515 Boorhaman 2 1 3 3 1 1 0 0 0 0 6 5 50 51 255016 Eldorado 2 1 2 2 1 1 0 0 0 0 5 4 52 49 254817 Springhurst 2 1 4 4 1 1 0 0 0 0 7 6 47 48 225618 Bowser 3 2 2 2 3 3 2 2 0 0 10 9 41 49 200919 Thoona 1 1 4 4 1 1 0 0 0 0 6 6 37 44 162820 Bungeet 3 2 2 2 1 1 0 0 0 0 6 5 30 32 96021 Devenish 3 2 3 3 1 1 0 0 0 0 7 6 35 40 140022 Walwa 3 2 4 4 1 1 0 0 0 0 8 7 54 50 270023 Bethanga 3 2 4 4 1 1 0 0 0 0 8 7 44 44 193624 Tallangatta 2 1 4 4 2 2 0 0 0 0 8 7 59 54 318625 Eskdale 3 2 4 4 1 1 0 0 0 0 8 7 57 49 279326 Granya 3 2 4 4 1 1 0 0 0 0 8 7 56 52 291227 Sugarloaf Road 4 3 4 4 2 2 0 0 0 0 10 9 55 49 269528 Myrtleford 2 1 2 2 2 2 0 0 0 0 6 5 54 46 248429 Harrietville 2 1 3 3 1 1 0 0 0 0 6 5 58 51 295830 Mt Beauty 2 1 4 4 2 2 0 0 0 0 8 7 56 51 2856
MIN 4 4 30 32 960AVG 7 6 51 49 2545MAX 10 9 62 61 3782
A R I S K A S S E S S M E N T O F S E L E C T E D L A N D F I L L S I T E S I N T H E N O R T H E A S T E R N W A S T E M A N A G E M E N T R E G I O N
Figures
Prepared for NevRwaste, 11 September 2006 J:\JOBS\43294913\Reporting\NevRwaste Final Report.doc

Client: Title:NevRwaste LANDFILL INTERNET QUESTIONNAIRE FIGURE
Project: Refer to Appendix A for a listing of landfill names and site numbers.
ENVIRONMENTAL RISK ASSESSMENT OF DESIGNED: SS APPROVED: DS PROJECT: 43294913
SELECTED LANDFILLS IN NORTH EAST VICTORIA DRAWN: SS DATE: 08/08/06 FILE: Reporting/Final Report Copies/…DATE: 08/08/06 STATUS: FINAL ...Risk Graphs and Tables2006.xls
1
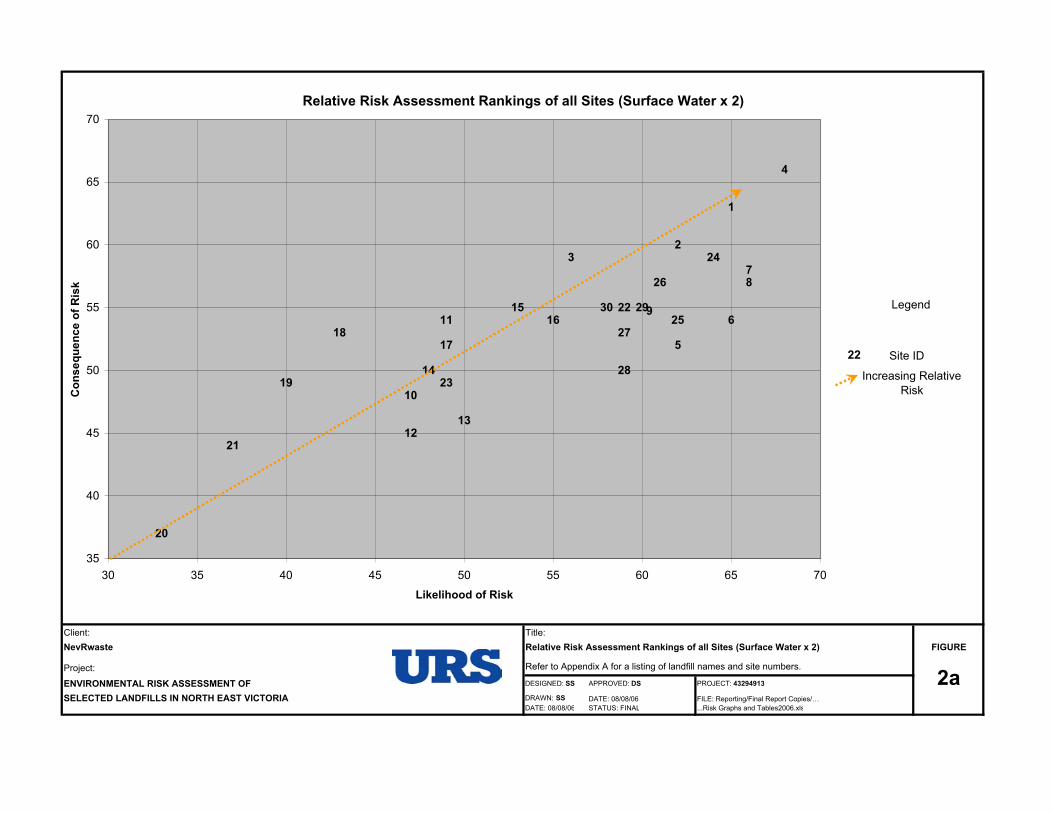
Client: Title:NevRwaste Relative Risk Assessment Rankings of all Sites (Surface Water x 2) FIGURE
Project: Refer to Appendix A for a listing of landfill names and site numbers.
ENVIRONMENTAL RISK ASSESSMENT OF DESIGNED: SS APPROVED: DS PROJECT: 43294913
SELECTED LANDFILLS IN NORTH EAST VICTORIA DRAWN: SS DATE: 08/08/06 FILE: Reporting/Final Report Copies/…DATE: 08/08/06 STATUS: FINAL ...Risk Graphs and Tables2006.xls
2a
Relative Risk Assessment Rankings of all Sites (Surface Water x 2)
1
23
4
5
6
78
10
11
12
14
16
1718
19
20
21
23
24
2527
28
2992230
26
15
13
35
40
45
50
55
60
65
70
30 35 40 45 50 55 60 65 70
Likelihood of Risk
Con
sequ
ence
of R
isk
Site ID
Increasing Relative Risk
Legend
22
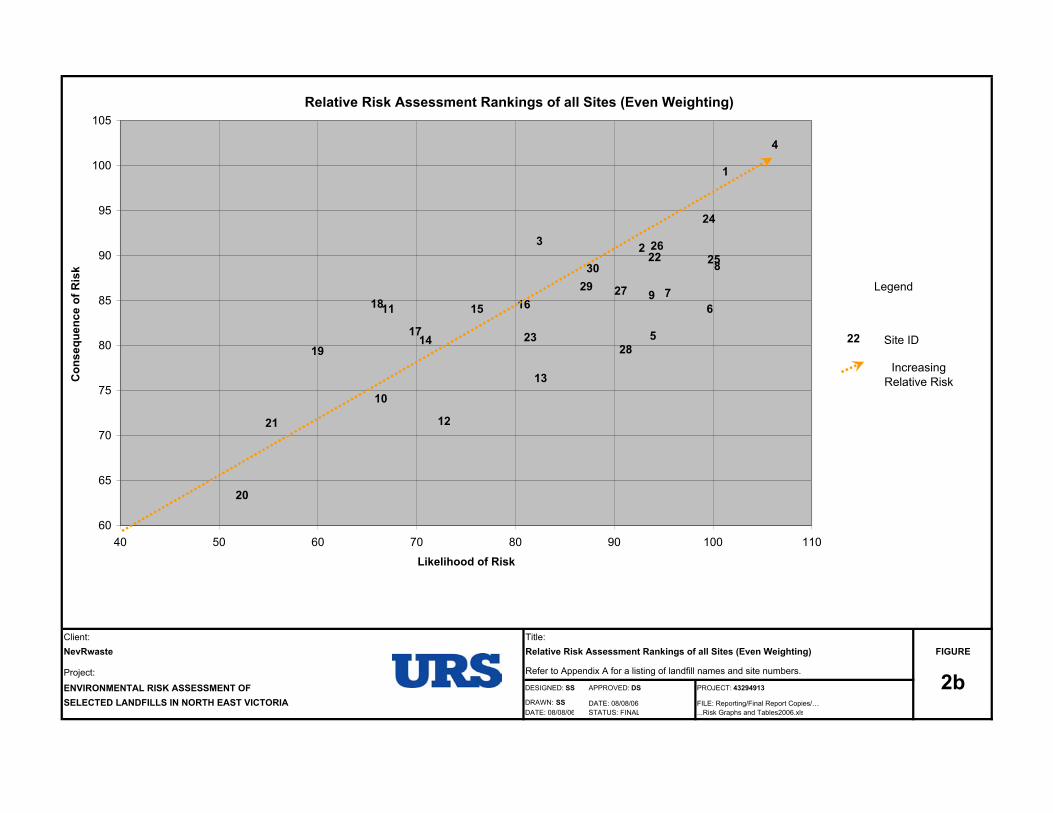
Client: Title:NevRwaste Relative Risk Assessment Rankings of all Sites (Even Weighting) FIGURE
Project: Refer to Appendix A for a listing of landfill names and site numbers.
ENVIRONMENTAL RISK ASSESSMENT OF DESIGNED: SS APPROVED: DS PROJECT: 43294913
SELECTED LANDFILLS IN NORTH EAST VICTORIA DRAWN: SS DATE: 08/08/06 FILE: Reporting/Final Report Copies/…DATE: 08/08/06 STATUS: FINAL ...Risk Graphs and Tables2006.xls
2b
Relative Risk Assessment Rankings of all Sites (Even Weighting)
4
2622
14
18 6
25
19
7
12
11
1
8
10
21
20
24
28
30
17
2729
5
23
916
23
15
13
60
65
70
75
80
85
90
95
100
105
40 50 60 70 80 90 100 110
Likelihood of Risk
Con
sequ
ence
of R
isk
22 Site ID
Legend
Increasing Relative Risk

Client: Title:NevRwaste Relative Risk Assessment Rankings of all Sites (No Weighting) FIGURE
Project: Refer to Appendix A for a listing of landfill names and site numbers.
ENVIRONMENTAL RISK ASSESSMENT OF DESIGNED: SS APPROVED: DS PROJECT: 43294913
SELECTED LANDFILLS IN NORTH EAST VICTORIA DRAWN: SS DATE: 08/08/06 FILE: Reporting/Final Report Copies/…DATE: 08/08/06 STATUS: FINAL ...Risk Graphs and Tables2006.xls
2c
Relative Risk Assessment Rankings of all Sites (No Weighting)
4
1
7248
2
6
26
3
9 29
5
2716
28
1511
17
14
13
18
12
19
21
25
23 10
3022
35
40
45
50
55
60
65
70
30 35 40 45 50 55 60 65 70
Likelihood of Risk
Con
sequ
ence
of R
isk
22 Site ID
Legend
Increasing Relative Risk

Client: Title:NevRwaste Relative Risk Plot of GIS risk scores (No Weighting). FIGURE
Project: Refer to Appendix A for a listing of landfill names and site numbers.
ENVIRONMENTAL RISK ASSESSMENT OF DESIGNED: SS APPROVED: DS PROJECT: 43294913
SELECTED LANDFILLS IN NORTH EAST VICTORIA DRAWN: SS DATE: 08/08/06 FILE: Reporting/Final Report Copies/…DATE: 08/08/06 STATUS: FINAL ...Risk Graphs and Tables2006.xls
3
Relative Risk Plot of GIS risk scores (No Weighting).
308
2
27
12
41
19
5
11
17
25
29
1821
20
6
28
7
15
22
16
9
3
23
2413
14
10
26
8
10
12
14
16
18
5 7 9 11 13 15 17 19
Likelihood of Risk
Con
sequ
ence
of R
isk
22 Site ID
Legend
Increasing Relative Risk

Client: Title:NevRwaste Relative Risk Plot of Questionnaire risk scores (No Weighting). FIGURE
Project: Refer to Appendix A for a listing of landfill names and site numbers.
ENVIRONMENTAL RISK ASSESSMENT OF DESIGNED: SS APPROVED: DS PROJECT: 43294913
SELECTED LANDFILLS IN NORTH EAST VICTORIA DRAWN: SS DATE: 08/08/06 FILE: Reporting/Final Report Copies/…DATE: 08/08/06 STATUS: FINAL ...Risk Graphs and Tables2006.xls
4
Relative Risk Plot of Questionnaire risk scores (No Weighting).
24
827
2514
17
18
30
5
22
28
3
9
6
16
23
11
29
1
20
2112
2
4
19
10
15
13
726
25
30
35
40
45
50
55
25 30 35 40 45 50 55 60Likelihood of Risk
Con
sequ
ence
of R
isk
22 Site ID
Legend
Increasing Relative Risk

Client: Title:NevRwaste Alpine Shire Closed Landfill Relative Risk Assessment FIGURE
Project: Refer to Appendix A for a listing of landfill names and site numbers.
ENVIRONMENTAL RISK ASSESSMENT OF DESIGNED: SS APPROVED: DS PROJECT: 43294913
SELECTED LANDFILLS IN NORTH EAST VICTORIA DRAWN: SS DATE: 08/08/06 FILE: Reporting/Final Report Copies/…DATE: 08/08/06 STATUS: FINAL ...Risk Graphs and Tables2006.xls
5
Alpine Shire Closed Landfill Relative Risk Assessment (SW x 2)
28
2930
35
40
45
50
55
60
65
70
30 35 40 45 50 55 60 65 70
Likelihood of Risk
Con
sequ
ence
of R
isk
22 Site ID
Legend
Increasing Relative Risk
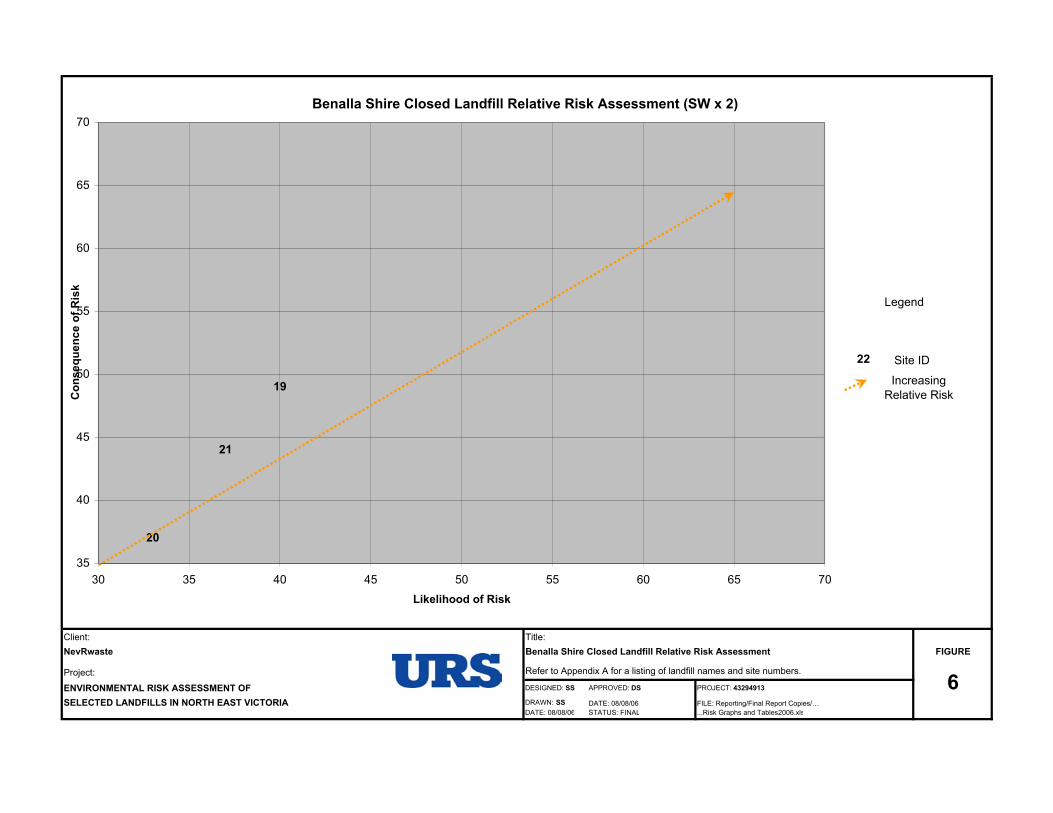
Client: Title:NevRwaste Benalla Shire Closed Landfill Relative Risk Assessment FIGURE
Project: Refer to Appendix A for a listing of landfill names and site numbers.
ENVIRONMENTAL RISK ASSESSMENT OF DESIGNED: SS APPROVED: DS PROJECT: 43294913
SELECTED LANDFILLS IN NORTH EAST VICTORIA DRAWN: SS DATE: 08/08/06 FILE: Reporting/Final Report Copies/…DATE: 08/08/06 STATUS: FINAL ...Risk Graphs and Tables2006.xls
6
Benalla Shire Closed Landfill Relative Risk Assessment (SW x 2)
19
20
21
35
40
45
50
55
60
65
70
30 35 40 45 50 55 60 65 70Likelihood of Risk
Con
sequ
ence
of R
isk
22 Site ID
Legend
Increasing Relative Risk

Client: Title:NevRwaste Indigo Shire Closed Landfill Relative Risk Assessment FIGURE
Project: Refer to Appendix A for a listing of landfill names and site numbers.
ENVIRONMENTAL RISK ASSESSMENT OF DESIGNED: SS APPROVED: DS PROJECT: 43294913
SELECTED LANDFILLS IN NORTH EAST VICTORIA DRAWN: SS DATE: 08/08/06 FILE: Reporting/Final Report Copies/…DATE: 08/08/06 STATUS: FINAL ...Risk Graphs and Tables2006.xls
7
Indigo Shire Closed Landfill Relative Risk Assessment (SW x 2)
1
23
4
35
40
45
50
55
60
65
70
30 35 40 45 50 55 60 65 70
Likelihood of Risk
Con
sequ
ence
of R
isk
22 Site ID
Legend
Increasing Relative Risk

Client: Title:NevRwaste Mansfield Shire Closed Landfill Relative Risk Assessment FIGURE
Project: Refer to Appendix A for a listing of landfill names and site numbers.
ENVIRONMENTAL RISK ASSESSMENT OF DESIGNED: SS APPROVED: DS PROJECT: 43294913
SELECTED LANDFILLS IN NORTH EAST VICTORIA DRAWN: SS DATE: 08/08/06 FILE: Reporting/Final Report Copies/…DATE: 08/08/06 STATUS: FINAL ...Risk Graphs and Tables2006.xls
8
Mansfield Shire Closed Landfill Relative Risk Assessment (SW x 2)
5
6
78
35
40
45
50
55
60
65
70
30 35 40 45 50 55 60 65 70
Likelihood of Risk
Con
sequ
ence
of R
isk
22 Site ID
Legend
Increasing Relative Risk

Client: Title:NevRwaste Towong Shire Closed Landfill Relative Risk Assessment FIGURE
Project: Refer to Appendix A for a listing of landfill names and site numbers.
ENVIRONMENTAL RISK ASSESSMENT OF DESIGNED: SS APPROVED: DS PROJECT: 43294913
SELECTED LANDFILLS IN NORTH EAST VICTORIA DRAWN: SS DATE: 08/08/06 FILE: Reporting/Final Report Copies/…DATE: 08/08/06 STATUS: FINAL ...Risk Graphs and Tables2006.xls
9
Towong Shire Closed Landfill Relative Risk Assessment (SW x 2)
22
23
24
25
26
27
35
40
45
50
55
60
65
70
30 35 40 45 50 55 60 65 70
Likelihood of Risk
Con
sequ
ence
of R
isk
22 Site ID
Legend
Increasing Relative Risk

Client: Title:NevRwaste Wangaratta Shire Closed Landfill Relative Risk Assessment FIGURE
Project: Refer to Appendix A for a listing of landfill names and site numbers.
ENVIRONMENTAL RISK ASSESSMENT OF DESIGNED: SS APPROVED: DS PROJECT: 43294913
SELECTED LANDFILLS IN NORTH EAST VICTORIA DRAWN: SS DATE: 08/08/06 FILE: Reporting/Final Report Copies/…DATE: 08/08/06 STATUS: FINAL ...Risk Graphs and Tables2006.xls
10
Wangaratta Shire Closed Landfill Relative Risk Assessment (SW x 2)
9
10
11
1213
14
1516
1817
35
40
45
50
55
60
65
70
30 35 40 45 50 55 60 65 70Likelihood of Risk
Con
sequ
ence
of R
isk
22 Site ID
Legend
Increasing Relative Risk
A R I S K A S S E S S M E N T O F S E L E C T E D L A N D F I L L S I T E S I N T H E N O R T H E A S T E R N W A S T E M A N A G E M E N T R E G I O N
Appendix A Landfill site names sorted by site number
Prepared for NevRwaste, 11 September 2006 J:\JOBS\43294913\Reporting\NevRwaste Final Report.doc
A. Landfill site names sorted by site number

Appendix A Landfill Site Names Sorted by Site Number
SITE # SITE NAME LGA1 Beechworth INDIGO2 Chiltern INDIGO3 Rutherglen INDIGO4 Yackandandah INDIGO5 Maintongoon MANSFIELD6 Jamieson MANSFIELD7 Riflebuts MANSFIELD8 Paps MANSFIELD9 Glen Rowan WANGARATTA
10 Hansonville WANGARATTA11 Markwood WANGARATTA12 Moyhu WANGARATTA13 Whitfield WANGARATTA14 Whorouly WANGARATTA15 Boorhaman WANGARATTA16 Eldorado WANGARATTA17 Springhurst WANGARATTA18 Bowser WANGARATTA19 Thoona BENALLA20 Bungeet BENALLA21 Devenish BENALLA22 Walwa TOWONG23 Bethanga TOWONG24 Tallangatta TOWONG25 Eskdale TOWONG26 Granya TOWONG27 Sugarloaf Road TOWONG28 Myrtleford ALPINE29 Harrietville ALPINE30 Mt Beauty ALPINE
A R I S K A S S E S S M E N T O F S E L E C T E D L A N D F I L L S I T E S I N T H E N O R T H E A S T E R N W A S T E M A N A G E M E N T R E G I O N
Appendix B Example Landfill Questionnaire
Prepared for NevRwaste, 11 September 2006 J:\JOBS\43294913\Reporting\NevRwaste Final Report.doc
B. Example Landfill Questionnaire
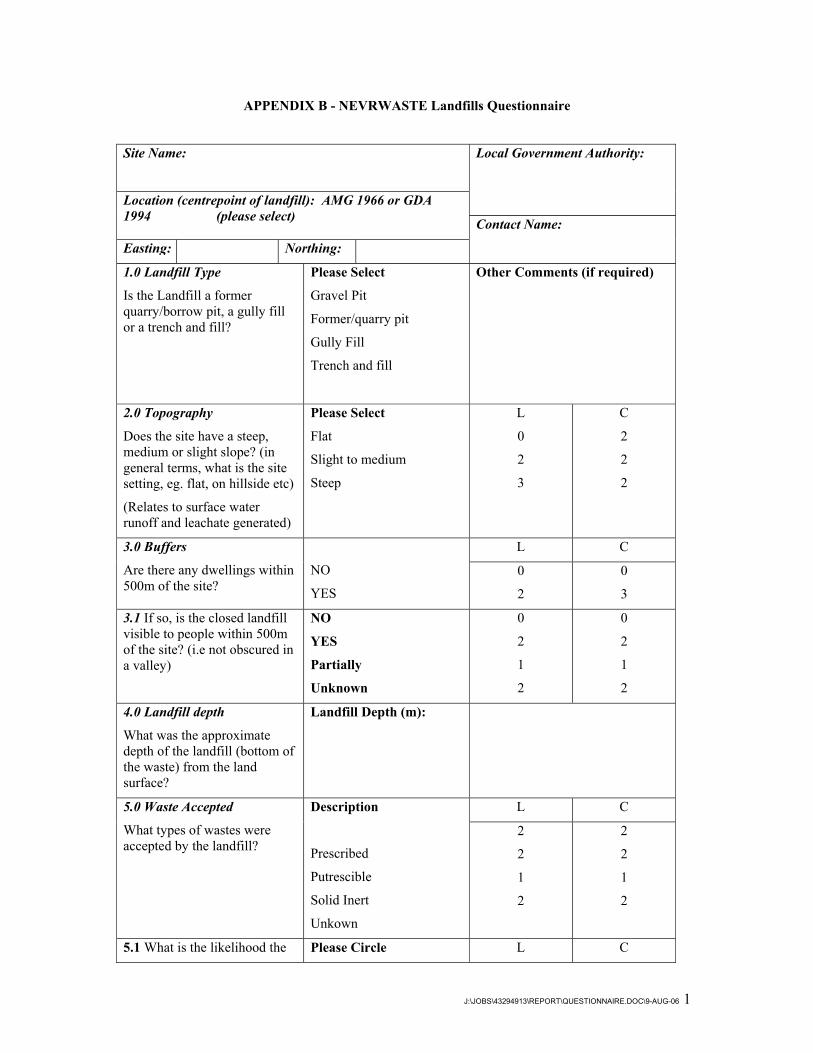
J:\JOBS\43294913\REPORT\QUESTIONNAIRE.DOC\9-AUG-06 1
APPENDIX B - NEVRWASTE Landfills Questionnaire
Site Name:
Local Government Authority:
Location (centrepoint of landfill): AMG 1966 or GDA 1994 (please select)
Easting: Northing:
Contact Name:
1.0 Landfill Type
Is the Landfill a former quarry/borrow pit, a gully fill or a trench and fill?
Please Select
Gravel Pit
Former/quarry pit
Gully Fill
Trench and fill
Other Comments (if required)
2.0 Topography
Does the site have a steep, medium or slight slope? (in general terms, what is the site setting, eg. flat, on hillside etc)
(Relates to surface water runoff and leachate generated)
Please Select
Flat
Slight to medium
Steep
L
0
2
3
C
2
2
2
L C 3.0 Buffers
Are there any dwellings within 500m of the site?
NO
YES
0
2
0
3
3.1 If so, is the closed landfill visible to people within 500m of the site? (i.e not obscured in a valley)
NO
YES
Partially
Unknown
0
2
1
2
0
2
1
2
4.0 Landfill depth
What was the approximate depth of the landfill (bottom of the waste) from the land surface?
Landfill Depth (m):
L C 5.0 Waste Accepted
What types of wastes were accepted by the landfill?
Description
Prescribed
Putrescible
Solid Inert
Unkown
2
2
1
2
2
2
1
2
5.1 What is the likelihood the Please Circle L C

J:\JOBS\43294913\REPORT\QUESTIONNAIRE.DOC\9-AUG-06 2
landfill received liquid wastes, farm chemicals, car batteries, waste oil, and infectious wastes?
Low
Medium
High
Unknown
1
2
3
3
1
2
3
3
6.0 Landfill area
What was the area of the landfill and landfill site?
Area m2
Site:
Landfill
L C 7.0 Operational Site Security/Fencing
When operating was the site attended/supervised?
Not known.
No supervision.
Sometimes when open.
At all times while open.
3
3
2
1
2
2
2
2
L C 7.1 Was access prevented when the landfill was closed? (Out of operating hours i.e. locked gate.)
NO
YES 2
0
2
0
L C 8.0 Water Management
Is the former landfill site within an area that is subject to inundation?
NO
YES
0
2
0
3
0
2
2
0
2
2
8.1 Was leachate/ water evident within the landfill while operating?
8.2 If Yes to 8.1 is there an ongoing leachate management monitoring/pumping within the landfill site?
NO
YES
UNKNOWN
NO
YES
2
0
2
0
8.3 Is The Council aware of any public complaints relating to this landfill?
NO
YES
0
1
0
2
9.0 Environmental Monitoring
Is groundwater or surface water monitoring undertaken at the landfill?
NO
YES
2
1
2
1
9.1 Have any groundwater or surface water impacts been identified
NO
YES
0
2
0
2
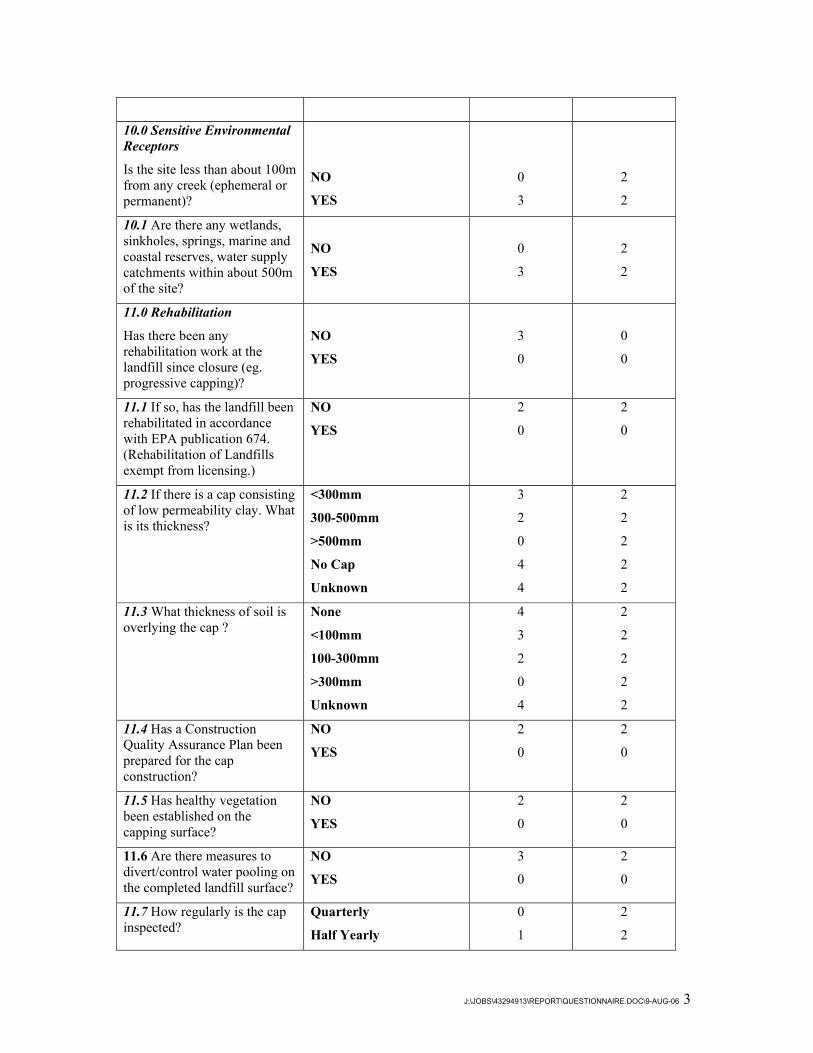
J:\JOBS\43294913\REPORT\QUESTIONNAIRE.DOC\9-AUG-06 3
10.0 Sensitive Environmental Receptors
Is the site less than about 100m from any creek (ephemeral or permanent)?
NO
YES
0
3
2
2
10.1 Are there any wetlands, sinkholes, springs, marine and coastal reserves, water supply catchments within about 500m of the site?
NO
YES
0
3
2
2
11.0 Rehabilitation
Has there been any rehabilitation work at the landfill since closure (eg. progressive capping)?
NO
YES
3
0
0
0
11.1 If so, has the landfill been rehabilitated in accordance with EPA publication 674. (Rehabilitation of Landfills exempt from licensing.)
NO
YES
2
0
2
0
11.2 If there is a cap consisting of low permeability clay. What is its thickness?
<300mm
300-500mm
>500mm
No Cap
Unknown
3
2
0
4
4
2
2
2
2
2
11.3 What thickness of soil is overlying the cap ?
None
<100mm
100-300mm
>300mm
Unknown
4
3
2
0
4
2
2
2
2
2
11.4 Has a Construction Quality Assurance Plan been prepared for the cap construction?
NO
YES
2
0
2
0
11.5 Has healthy vegetation been established on the capping surface?
NO
YES
2
0
2
0
11.6 Are there measures to divert/control water pooling on the completed landfill surface?
NO
YES
3
0
2
0
11.7 How regularly is the cap inspected?
Quarterly
Half Yearly
0
1
2
2

J:\JOBS\43294913\REPORT\QUESTIONNAIRE.DOC\9-AUG-06 4
Yearly
Less than once yearly
Never
2
3
4
2
2
2
11.8 If Inspection have occurred, Have any problems been observed or reported at the site: (Please Select)
water pooling,
erosion
leachate,
waste protruding
odour
settlement
Land slippage
NO
YES
0
3
2
2
11.9 If there have been problems with the cap, have they been resolved or planned to be resolved through maintenance?
NO
YES
3
0
2
2
12. Greenhouse
How many years since the landfill was closed?
0-5
5-10
10-20
>20
4
3
2
1
3
2
1
1
12.1 How many years did the landfill operate?
0-10
10-20
20-30
>30
1
2
3
4
1
2
3
4
12.2 How many people did the landfill serve?
<1000
1000-5000
>5000
1
2
3
1
2
3
12.3 Estimated volume of waste received per year?
<5000 tonnes
>5000 tonnes
Unknown
0
2
2
0
2
2
12.4 Is landfill gas collection considered to be required, given the volume of waste?
NO
YES
0
2
0
1
12.5 If so is landfill gas collection undertaken?
NO
YES
2
0
2
0
J:\JOBS\43294913\REPORT\QUESTIONNAIRE.DOC\9-AUG-06 5
Related Documents