Astronomy & Astrophysics manuscript no. Galli_printer c ESO 2016 October 19, 2016 A revised moving cluster distance to the Pleiades open cluster P.A.B. Galli 1, 2, 3 , E. Moraux 1, 2 , H. Bouy 4 , J. Bouvier 1, 2 , J. Olivares 1, 2, 5 , and R. Teixeira 3 1 Univ. Grenoble Alpes, IPAG, 38000, Grenoble, France 2 CNRS, IPAG, F-38000 Grenoble, France 3 Instituto de Astronomia, Geofísica e Ciências Atmosféricas, Universidade de São Paulo, Rua do Matão, 1226, Cidade Universitária, 05508-900, São Paulo - SP, Brazil 4 Centro de Astrobiología, INTA-CSIC, PO Box 78, ESAC Campus, 28691 Villanueva de la Cañada, Madrid, Spain 5 Dpto. de Inteligencia Artificial, UNED, Juan del Rosal, 16, 28040, Madrid, Spain ABSTRACT Context. The distance to the Pleiades open cluster has been extensively debated in the literature over several decades. Although different methods point to a discrepancy in the trigonometric parallaxes produced by the Hipparcos mission, the number of individual stars with known distances is still small compared to the number of cluster members to help solve this problem. Aims. We provide a new distance estimate for the Pleiades based on the moving cluster method, which will be useful to further discuss the so-called Pleiades distance controversy and compare it with the very precise parallaxes from the Gaia space mission. Methods. We apply a refurbished implementation of the convergent point search method to an updated census of Pleiades stars to calculate the convergent point position of the cluster from stellar proper motions. Then, we derive individual parallaxes for 64 cluster members using radial velocities compiled from the literature, and approximate parallaxes for another 1146 stars based on the spatial velocity of the cluster. This represents the largest sample of Pleiades stars with individual distances to date. Results. The parallaxes derived in this work are in good agreement with previous results obtained in different studies (excluding Hipparcos) for individual stars in the cluster. We report a mean parallax of 7.44 ± 0.08 mas and distance of 134.4 +2.9 -2.8 pc that is consistent with the weighted mean of 135.0 ± 0.6 pc obtained from the non-Hipparcos results in the literature. Conclusions. Our result for the distance to the Pleiades open cluster is not consistent with the Hipparcos catalog, but favors the recent and more precise distance determination of 136.2 ± 1.2 pc obtained from Very Long Baseline Interferometry observations. It is also in good agreement with the mean distance of 133 ± 5 pc obtained from the first trigonometric parallaxes delivered by the Gaia satellite for the brightest cluster members in common with our sample. Key words. stars: distances, open clusters and associations: Pleiades 1. Introduction The problem of distance determination has always played a cen- tral role in astronomy. For example, distances are necessary to determine the dimensions of celestial objects, the physical prop- erties of stars, and their true motion (i.e., spatial velocity). In this context, determining the distance to open clusters is also vi- tally important when calibrating the astronomical distance scale. The stars associated with open clusters are assumed to have sim- ilar properties (age, distance, kinematics, and chemical compo- sition), which makes them ideal targets to refine stellar evolution models. As the closest open cluster to the Sun in terms of age and richness, the Pleiades is an important cornerstone to many stud- ies related to star formation from physical models to observa- tional properties of young stars. Given the crucial role of the Pleiades for calibration purposes, one would expect its distance to be well established. However, there is still a current debate in the literature regarding the distance to the cluster. The Pleiades distance controversy began when the first stud- ies in the pre-Hipparcos era using the isochrone fitting method (Nicolet 1981; Giannuzzi 1995) delivered a distance estimate for the cluster that roughly exceeds by 10-15% the distance determi- nation of 118.3 ± 3.5 pc (van Leeuwen 1999) that was obtained from the trigonometric parallaxes of the Hipparcos catalog (ESA 1997). Later studies using the same method but different sam- ples of stars (Pinsonneault et al. 1998; Stello & Nissen 2001; Percival et al. 2005; An et al. 2007) confirmed the previous re- sults for the distance of the cluster, and the new distance esti- mate of 120.2 ± 1.9 pc (van Leeuwen 2009) that was based on the re-calibrated parallaxes of 53 stars from the new version of the Hipparcos catalog (van Leeuwen 2007) did not change the situation. In the meantime, two independent studies returned trigono- metric parallaxes for a few Pleiades stars. Gatewood et al. (2000) measured the parallax of seven stars in the cluster yielding a weighted mean distance of 130.9 ± 7.4 pc, and Soderblom et al. (2005) find a distance of 134.6 ± 3.1 pc based on trigonometric parallaxes for another three stars. Distance determination obtained from orbital modeling of eclipsing binaries is another possibility for estimating the dis- tance to the Pleiades, and the results vary from 132.0 ± 5.0 pc (David et al. 2016) to 139.1 ± 3.5 pc (Southworth et al. 2005). Unfortunately, this method is restricted to a few systems that have been discovered to date and that can be used in this regard (Zwahlen et al. 2004; Munari et al. 2004; Groenewegen et al. 2007). Recently, Melis et al. (2014) measured the trigonometric par- allaxes of four stars (or stellar systems) in the Pleiades based on multi-epoch Very Long Baseline Interferometry (VLBI) obser- vations. The weighted mean distance of 136.2 ± 1.2 pc obtained in their work represents the most precise distance determination Article number, page 1 of 22 arXiv:1610.05641v1 [astro-ph.SR] 18 Oct 2016

Welcome message from author
This document is posted to help you gain knowledge. Please leave a comment to let me know what you think about it! Share it to your friends and learn new things together.
Transcript

Astronomy & Astrophysics manuscript no. Galli_printer c©ESO 2016October 19, 2016
A revised moving cluster distance to the Pleiades open clusterP.A.B. Galli1, 2, 3, E. Moraux1, 2, H. Bouy4, J. Bouvier1, 2, J. Olivares1, 2, 5, and R. Teixeira3
1 Univ. Grenoble Alpes, IPAG, 38000, Grenoble, France2 CNRS, IPAG, F-38000 Grenoble, France3 Instituto de Astronomia, Geofísica e Ciências Atmosféricas, Universidade de São Paulo, Rua do Matão, 1226, Cidade Universitária,
05508-900, São Paulo - SP, Brazil4 Centro de Astrobiología, INTA-CSIC, PO Box 78, ESAC Campus, 28691 Villanueva de la Cañada, Madrid, Spain5 Dpto. de Inteligencia Artificial, UNED, Juan del Rosal, 16, 28040, Madrid, Spain
ABSTRACT
Context. The distance to the Pleiades open cluster has been extensively debated in the literature over several decades. Althoughdifferent methods point to a discrepancy in the trigonometric parallaxes produced by the Hipparcos mission, the number of individualstars with known distances is still small compared to the number of cluster members to help solve this problem.Aims. We provide a new distance estimate for the Pleiades based on the moving cluster method, which will be useful to further discussthe so-called Pleiades distance controversy and compare it with the very precise parallaxes from the Gaia space mission.Methods. We apply a refurbished implementation of the convergent point search method to an updated census of Pleiades stars tocalculate the convergent point position of the cluster from stellar proper motions. Then, we derive individual parallaxes for 64 clustermembers using radial velocities compiled from the literature, and approximate parallaxes for another 1146 stars based on the spatialvelocity of the cluster. This represents the largest sample of Pleiades stars with individual distances to date.Results. The parallaxes derived in this work are in good agreement with previous results obtained in different studies (excludingHipparcos) for individual stars in the cluster. We report a mean parallax of 7.44 ± 0.08 mas and distance of 134.4+2.9
−2.8 pc that isconsistent with the weighted mean of 135.0 ± 0.6 pc obtained from the non-Hipparcos results in the literature.Conclusions. Our result for the distance to the Pleiades open cluster is not consistent with the Hipparcos catalog, but favors the recentand more precise distance determination of 136.2±1.2 pc obtained from Very Long Baseline Interferometry observations. It is also ingood agreement with the mean distance of 133 ± 5 pc obtained from the first trigonometric parallaxes delivered by the Gaia satellitefor the brightest cluster members in common with our sample.
Key words. stars: distances, open clusters and associations: Pleiades
1. Introduction
The problem of distance determination has always played a cen-tral role in astronomy. For example, distances are necessary todetermine the dimensions of celestial objects, the physical prop-erties of stars, and their true motion (i.e., spatial velocity). Inthis context, determining the distance to open clusters is also vi-tally important when calibrating the astronomical distance scale.The stars associated with open clusters are assumed to have sim-ilar properties (age, distance, kinematics, and chemical compo-sition), which makes them ideal targets to refine stellar evolutionmodels.
As the closest open cluster to the Sun in terms of age andrichness, the Pleiades is an important cornerstone to many stud-ies related to star formation from physical models to observa-tional properties of young stars. Given the crucial role of thePleiades for calibration purposes, one would expect its distanceto be well established. However, there is still a current debate inthe literature regarding the distance to the cluster.
The Pleiades distance controversy began when the first stud-ies in the pre-Hipparcos era using the isochrone fitting method(Nicolet 1981; Giannuzzi 1995) delivered a distance estimate forthe cluster that roughly exceeds by 10-15% the distance determi-nation of 118.3 ± 3.5 pc (van Leeuwen 1999) that was obtainedfrom the trigonometric parallaxes of the Hipparcos catalog (ESA1997). Later studies using the same method but different sam-
ples of stars (Pinsonneault et al. 1998; Stello & Nissen 2001;Percival et al. 2005; An et al. 2007) confirmed the previous re-sults for the distance of the cluster, and the new distance esti-mate of 120.2 ± 1.9 pc (van Leeuwen 2009) that was based onthe re-calibrated parallaxes of 53 stars from the new version ofthe Hipparcos catalog (van Leeuwen 2007) did not change thesituation.
In the meantime, two independent studies returned trigono-metric parallaxes for a few Pleiades stars. Gatewood et al. (2000)measured the parallax of seven stars in the cluster yielding aweighted mean distance of 130.9 ± 7.4 pc, and Soderblom et al.(2005) find a distance of 134.6 ± 3.1 pc based on trigonometricparallaxes for another three stars.
Distance determination obtained from orbital modeling ofeclipsing binaries is another possibility for estimating the dis-tance to the Pleiades, and the results vary from 132.0 ± 5.0 pc(David et al. 2016) to 139.1 ± 3.5 pc (Southworth et al. 2005).Unfortunately, this method is restricted to a few systems thathave been discovered to date and that can be used in this regard(Zwahlen et al. 2004; Munari et al. 2004; Groenewegen et al.2007).
Recently, Melis et al. (2014) measured the trigonometric par-allaxes of four stars (or stellar systems) in the Pleiades based onmulti-epoch Very Long Baseline Interferometry (VLBI) obser-vations. The weighted mean distance of 136.2 ± 1.2 pc obtainedin their work represents the most precise distance determination
Article number, page 1 of 22
arX
iv:1
610.
0564
1v1
[as
tro-
ph.S
R]
18
Oct
201
6

for the cluster to date, and the parallaxes for individual stars havea precision that is better than 1%. Indeed, the VLBI trigonomet-ric parallax method is the most precise and accurate techniquefor measuring distances nowadays, and it has already proved todeliver good results in nearby associations of young stars (seee.g., Loinard et al. 2007, 2008).
In a recent paper, Mädler et al. (2016) use a different ap-proach to derive the distance of 15 stars in the cluster based onstellar twins. This method assumes that the difference in bright-ness between two stars with different locations in the sky, butidentical physical properties (i.e., stellar twins), results directlyfrom the difference in their distances. Thus, by knowing the dis-tance of one star from other methods, they calculate the distanceto its stellar twin. Doing so, they found an average distance of134.8 ± 1.7 pc for the Pleiades open cluster that clearly supportsthe non-Hipparcos results.
The moving cluster method is another alternative to com-pute distances of comoving groups of stars. The method takesthe observables proper motions and radial velocities into ac-count to compute the distance to individual cluster members (seee.g., Galli et al. 2012). Although a variant of this methodol-ogy has already been used in previous studies to investigate thedistance of the Pleiades, the admittedly large error bars in thedistances results of 130.6 ± 10.8 pc (Narayanan & Gould 1999)and 125.9 ± 7.5 pc (Röser & Schilbach 2013) make it difficultto resolve the current dispute between the Hipparcos and VLBIdistance determinations of the cluster.
In this context, we decided to revisit the Pleiades based onthe moving cluster method by using a refurbished implementa-tion of the method, an updated census of cluster members andmore precise data to provide a revised distance determination tothe cluster with this technique. The results obtained in this workare independent of previous distance determinations of the clus-ter in the literature and they will be useful for double-checkingthe upcoming state-of-the-art parallaxes delivered by the Gaiaspace mission in the near future.
This paper is organized as follows. In Sect. 2 we describe themoving cluster method and present a new implementation of themethod that is used in this work. In Sect. 3 we present the sam-ple of Pleiades stars and the dataset (proper motions and radialvelocities) used in this analysis. Section 4 describes our conver-gent point analysis using different samples of cluster members toinvestigate our solution. In Sect. 5, we present the individual par-allaxes (i.e., distances) for Pleiades stars obtained in this work,and discuss our results in Sect. 6. We summarize our results andconclusions in Sect. 7.
2. The moving cluster method
2.1. Kinematic parallaxes
Moving groups are kinematic aggregates of stars whose mem-bers share the same space motion. The low velocity dispersion,typically of a few km/s (Mathieu 1986), allows them to be easilyidentified as overdensities in the velocity space (see e.g., Antojaet al. 2008). As discussed in the seminal work of Blaauw (1964),the proper motions of comoving stars in such kinematic groupsconverge to a vertex referred to as the convergent point (CP) ofthe moving group, because of their parallel space motion or thestate of linear expansion.
In this context, individual parallaxes for members of youngmoving groups can be derived from their proper motions, radial
velocities and the CP position. They are given by,
π =A µ‖
Vr tan λ, (1)
where A = 4.74047 km yr/s is the ratio of one astronomicalunit in km to the number of seconds in one Julian year, µ‖ is theproper motion component directed parallel to the great circle thatjoins the star and the CP (see Galli et al. 2012, for more details),Vr is the radial velocity of the star, and λ is the angular distancebetween the star and the CP position.
Alternatively, for binaries (or multiple systems) and groupmembers with unknown (or poor) radial velocities one can derivethe kinematic parallax of the star from the spatial velocity of themoving group under the assumption that all members share thesame space motion. In this case, it is given by
π =A µ‖
Vspace sin λ, (2)
where Vspace is the average spatial velocity of the moving group.In both cases, the parallax uncertainty is calculated from errorpropagation of the equations above, and takes the error budgetsowing to proper motions, radial velocities, (or the spatial veloc-ity) and the CP into account. The parallaxes derived in this wayare obviously not as precise as those obtained from VLBI ob-servations, but errors in the same order of the Hipparcos catalogand recent trigonometric parallax results from the ground (Wein-berger et al. 2013; Ducourant et al. 2014) can be achieved (seee.g., Bertout & Genova 2006; Galli et al. 2013).
2.2. A new implementation of the convergent point searchmethod based on Markov chain Monte Carlo methods
The computation of kinematic parallaxes using the moving clus-ter method requires prior knowledge of the CP position. Thetechnique that we use to calculate the CP of a moving group isbased on methods developed by de Bruijne (1999) and Galli et al.(2012) (see these papers for a more detailed description about thebasic concepts, algorithms, and implementation of the method).As discussed in these papers, the convergent point search method(CPSM) simultaneously determines the most likely CP positionand performs a membership analysis to select the moving groupmembers.
The CPSM takes stellar proper motions, the velocity dis-persion, and a distance estimate of the cluster as input param-eters. However, in general, the results are not sensitive to theassumed distance of the cluster (see also Mamajek 2005). Weanticipate that the results and conclusions for the Pleiades clus-ter presented in the upcoming sections are rather insensitive tothe assumed distance of the cluster ranging from the Hipparcosdistance (∼120 pc) to the VLBI distance (∼136 pc). On the otherhand, the velocity dispersion is one important input parameter inthe CPSM to identify the moving group members. While a lowvelocity dispersion value would not be sufficient to recover allcluster members, a high velocity dispersion would enable themethod to include field stars (interlopers) in the solution.
The original implementation of the CPSM (de Bruijne 1999;Galli et al. 2012) uses an analytical minimization routine to solvethe least-square equations and return the CP position with itsuncertainty. Although this procedure has already proved to de-liver good results for nearby associations with tens of stars (Galliet al. 2013; Ducourant et al. 2014), it was clearly less attractivewhen dealing with rich clusters, such as the Pleiades, which re-quire more computing time to converge to a final solution. Thus,
Article number, page 2 of 22

P.A.B. Galli et al.: A revised moving cluster distance to the Pleiades open cluster
50 100 150 200 250
99.0
99.5
100.
010
0.5
101.
0
Number of walkers
α (d
eg)
●
● ● ● ●●
●●
●●
● ● ● ●● ● ● ●
● ● ●● ● ●
●
50 100 150 200 250
−28
.0−
27.5
−27
.0−
26.5
−26
.0
Number of walkers
δ (d
eg)
●● ● ● ● ●
● ● ● ● ● ● ● ● ● ● ● ● ● ● ● ● ● ● ●
50 100 150 200 250
2.3
2.4
2.5
2.6
2.7
Number of walkers
σ α (
deg)
● ●● ● ● ● ● ● ● ●
●● ● ● ● ●
● ● ● ● ● ● ● ● ●
50 100 150 200 250
0.9
1.0
1.1
1.2
1.3
Number of walkers
σ δ (
deg) ● ●
● ● ● ● ● ● ● ● ● ● ● ● ● ● ● ● ● ● ● ● ● ● ●
Fig. 1. CP coordinates (upper panel) and associated errors (lower panels) for the TW Hydrae association as a function of the number of walkers(with 200 iteration steps) used in the MCMC-based version of the CPSM . Each point is an average of 1000 MCMC realizations of the methodand the error bars indicate the scatter of the solution given for each ensemble of walkers.
we developed a new version of the CPSM that exploits paral-lelism and exhibits good performance at low computational cost.This was achieved using the emcee package (Foreman-Mackeyet al. 2013) written in Python programming language, which im-plements the Markov chain Monte Carlo (MCMC) method pro-posed by Goodman & Weare (2010). The algorithm was adaptedto our purposes and applied to the general problem of comput-ing the CP coordinates (αcp, δcp) of a moving group. Briefly, thenew implementation of the CPSM that we use in this work ex-ploits the parameter space using a number of so-called walkersand iteration steps, which are defined by the user to search for theCP position via Bayesian inference. The walkers move aroundthe parameter space (α, δ) and take tentative steps towards thelowest valley of X2 that roughly defines the CP position (see deBruijne 1999; Galli et al. 2012). Our final CP solution obtainedafter one MCMC realization is computed from the distributionof individual solutions given by the ensemble of walkers.
In the following, we apply the CPSM to the TW Hydrae as-sociation whose CP position is well established (Mamajek 2005;Ducourant et al. 2014) to calibrate our new implementation ofthe CPSM and illustrate its application. In this context, we usethe sample of 30 stars identified as kinematic members of the
association by Ducourant et al. (2014). We vary the number ofwalkers from 10 to 200 and run the MCMC version of the CPSMusing 50, 100, and 200 iteration steps for each walker to comparethe results. Figure 1 shows the CP coordinates with their errorsobtained for 200 iteration steps. We conclude that the formalerrors on the CP coordinates are significantly larger than the ob-served scatter in the individual CP solutions obtained with theensemble of walkers used in each case. This makes our choiceof the minimum number of walkers to be used in our analysisrather arbitrary. In practice, we verified that our final solution isnot sensitive to the number of walkers in the range of 100 to 200if we run a significant number of MCMC realizations. We alsoconfirmed that convergence of the Markov-chains of the ensem-ble of walkers was attained after 50 iterations where the meanof both CP coordinates is clearly bounded by the variance of thesample. So, we decided to work with 100 walkers and 200 it-eration steps as a more conservative approach. In addition, weemphasize that all CP solutions presented in this paper are cal-culated from a total of 1000 MCMC realizations of the CPSM,and the results listed are averaged values obtained from the dis-tribution of the CP coordinates.
Article number, page 3 of 22

αcp (deg)
Den
sity
99.0 99.5 100.0 100.5 101.0
0.0
0.5
1.0
1.5
δcp (deg)
Den
sity
−27.4 −27.2 −27.0 −26.8 −26.6
0.0
0.5
1.0
1.5
2.0
2.5
3.0
Fig. 2. Distribution of the CP coordinates after 1000 MCMC realizations of the CPSM for the TW Hydrae association. The red solid lineindicates the kernel density estimator.
Doing so, we run the CPSM for the TW Hydrae associationusing a velocity dispersion of 0.8 km/s and distance estimate of50 pc (as described in Sect 4.1 of Ducourant et al. 2014). Theresulting CP solution is located at (see also Fig 2)
(αcp, δcp) = (100.0◦,−26.9◦) ± (2.5◦, 1.1◦) .
We conclude that our result is in very good agreement with themore recent CP solution obtained by Ducourant et al. (2014),(αcp, δcp) = (100.1◦,−27.1◦) ± (3.0◦, 1.3◦), but the formal errorsof our solution are smaller. Thus, we have tested and calibratedour new version of the CPSM based on the MCMC method, andit will be used in the upcoming sections to investigate the CPposition of the Pleiades cluster.
3. Sample of Pleiades stars
3.1. An updated census of the cluster (Bouy et al. 2015)
In a recent work, Bouy et al. (2015) apply a probabilistic methodbased on multivariate data analysis (see Sarro et al. 2014) to se-lect high probability members of the Pleiades open cluster in theDANCe (Bouy et al. 2013) and Tycho-2 (Høg et al. 2000) cata-logs. They identify a total of 2107 high probability members ofthe Pleiades open cluster making it the most complete census ofthe cluster to date. This list includes most cluster members iden-tified in previous surveys (e.g., Stauffer et al. 2007; Lodieu et al.2012) and 812 previously unknown members. As discussed inSect. 2 of their paper, the absence of some cluster members inthis sample is justified by their different properties implying lowmembership probabilities, while a few of them may have beenmissed because they fall in the domain of incompleteness be-tween the DANCe survey (i ≥ 14 mag) and the Tycho-2 catalog(V ≤ 12 mag).
The catalog of Pleiades stars given by Bouy et al. (2015)contains stellar positions, proper motions, multi-band photom-etry (filters u, g, r, i, z,Y, J,H,Ks) and membership probabilities.This is the initial sample of stars that we use in our forthcominganalysis to investigate the distance of the Pleiades.
3.2. Proper motions
Our initial sample of Pleiades stars consists of 2010 stars (prob.≥ 75%) from the DANCe survey and 207 stars (prob. ≥ 48%)from the Tycho-2 catalog with 110 stars in common (see Bouyet al. 2015). Thus, the proper motions that we use in this workcome mostly from the DANCe survey (1900 stars), and we usethe proper motions from Tycho-2 for the remaining stars (i.e.,the brightest stars in our sample). The proper motions from theDANCe catalog provided by the Vizier/CDS tables are not an-chored to an absolute reference system. We applied the proce-dure described in Sect. 7.10 of Bouy et al. (2013) to tie theseproper motions to the International Celestial Reference System(ICRS). The corrected measurements are presented in the up-coming tables, together with other results from our analysis.
The DANCe project combines multi-epoch panchromaticimages collected with different instruments at various observa-tories (see Bouy et al. 2013, for more details) to derive accurateproper motions over a wide field from the ground. The propermotions were computed using, on average, about 40 stellar po-sitions collected at different epochs and a time-base longer than10 yrs for most stars in our sample (see Fig. 3). The stars have amedian proper motion of (µα cos δ, µδ) = (+19,−44) mas/yr anda median precision better than 1 mas/yr in each component.
Figure 4 shows the relative errors on proper motions in eachcomponent and reveals the existence of different subgroups inour sample regarding the quality of their proper motions mea-surements. One reason for the observed distribution of propermotion errors is the different observing campaign for each starin the sample, which is based on archival data collected in theDANCe project.
To identify the stars with best proper motion measurementsin our sample (to be used in Sect. 4.2) we model the ob-served distribution of proper motion errors as a mixture of k-components. In this case, each component follows a normal dis-tribution N(µ, σ) with mean µ and variance σ2. The mixture
Article number, page 4 of 22

P.A.B. Galli et al.: A revised moving cluster distance to the Pleiades open cluster
Number of positions
Den
sity
0 50 100 150
0.00
00.
005
0.01
00.
015
Time base (yr)D
ensi
ty
0 5 10 15
0.0
0.1
0.2
0.3
0.4
Fig. 3. Number of positions (left panel) and time-base (right panel) used to compute the stellar proper motions for Pleiades stars in the DANCeproject. The red solid lines indicate the kernel density estimator. The blue dashed lines indicate the selection criteria applied to our sample asdescribed in Sect. 4.1.
µα/σµα
Den
sity
0 20 40 60 80
0.00
0.01
0.02
0.03
0.04
µδ/σµδ
Den
sity
0 50 100 150 200 250
0.00
00.
005
0.01
00.
015
0.02
0
Fig. 4. Distribution of the relative errors on proper motions (i.e., µ/σµ) in right ascension (left panel) and in declination (right panel). The solidlines indicate the normal components of our mixture model (with k = 4), and the dashed line indicates the observed distribution of proper motionserrors.
Article number, page 5 of 22

model probability distribution is given by
p =
k∑i=1
φiN(µi, σi) , (3)
where φi is the probability that a star belongs to the k-componentof the model. We use the mixtools package in R programminglanguage to calculate the mixture model parameters (φi, µi, σi)based on the expectation-maximization algorithm implementedin the normalmixEM procedure.
We perform a Kolmogorov-Smirnov (KS) test between theobserved distribution of proper motion errors (see Fig. 4) andthe empirical probability-density function that is given by ourmixture model to investigate the number of components (i.e., thevalue of k) that best represent our data. To assess the robustnessof this finding, we construct a total of 1000 synthetic samplesfrom Eq. (3) using k = 2, 3, and 4. Then, we perform a KS testbetween each synthetic dataset and the observed distribution ofproper motion errors. We compute the fraction f0.05 of syntheticrealizations of our data sample with a p-value higher than theadopted significance level of α = 0.05 (see e.g., Feigelson & Jo-gesh Babu 2012). Our results from this analysis are summarizedin Table 1 and they indicate that the mixture model with fourcomponents (k = 4) is the one that best describes the observeddistribution of proper motions errors. These results will be usedin Section 4 to construct a control sample to investigate the CPposition of the cluster.
Table 1. Results of the mixture model applied to the distribution ofproper motions errors in right ascension and declination.
k µi σi f0.05(mas/yr) (mas/yr) (%)
Right Ascension2 12.4; 50.3 7.2; 11.2 0.93 10.7; 36.6; 58.8 6.0; 13.2; 4.8 36.04 6.5 ;16.2; 42.9; 59.4 3.4; 5.9; 11.7; 4.3 99.8
Declination2 28.4; 145.9 17.0; 53.0 0.03 15.8; 44.0; 154.0 7.7; 17.0; 48.5 10.94 16.0; 43.0; 109.0; 194.0 7.7; 14.7; 35.3; 21.8 99.5
Notes. We provide in each case the number k of normal componentswith the corresponding parameters (µ, σ), and the fraction of simulateddatasets with p > 0.05 as given by the KS-test.
3.3. Radial velocities
The radial velocity is one important parameter that is needed toderive the kinematic parallax of cluster members in our analy-sis. In the following, we describe our search in the literature forradial velocity information for the stars in our sample.
First, we searched the Apache Point Observatory GalacticEvolution Experiment (APOGEE) catalog in the Sloan DigitalSky Survey III (SDSS-III). The APOGEE program completeda systematic and homogeneous spectroscopic survey to build ahigh-resolution (R ∼ 22500), near-infrared spectra database formore than 105 stars in our Galaxy (Majewski et al. 2015). Weidentified a total of 174 stars from our sample in the APOGEEsurvey. The zeropoint of the APOGEE radial velocities is esti-mated to be −0.355 ± 0.033 km/s from comparison with otherstudies (see Nidever et al. 2015). As discussed in Appendix Bof Galli et al. (2013), a small shift in the radial velocities could
lead to a more significant offset in the parallaxes derived fromthe moving cluster method. We verified that a small variationof 0.355 km/s in the radial velocities would produce an offset of0.45 mas in parallaxes using typical values of proper motions,radial velocities, and the CP position of the Pleiades cluster thatwill be presented in the forthcoming analysis. Thus, to avoida systematic bias in the resulting parallaxes we decided to cor-rect the APOGEE radial velocities from their absolute zeropointbefore using them in this work.
Then, we searched the CDS databases to access more radialvelocity data for the remaining stars in the sample. The searchmade use of a query for radial velocity information in scriptmode using the web-based data mining tools available in theSIMBAD database (Wenger et al. 2000). Our search results forradial velocities is based on: Wilson (1953), Gontcharov (2006),Kharchenko et al. (2007), White et al. (2007), Mermilliod et al.(2009) and Kordopatis et al. (2013). Doing so, we retrieved ra-dial velocity information for 241 stars. We note that 21 stars inthis list are in common with the APOGEE sample and we calcu-lated the weighted mean of the multiple radial velocity values.
Thus, our search for radial velocity data returned a sample of394 stars with at least one radial velocity measurement publishedin the literature. However, this sample also includes stars withpoor radial velocity measurements and obvious outliers. Afterremoving obvious outliers from the radial velocity distributionby a 3σ elimination, we end up with a sample of 340 stars.Figure 5 shows the distribution of radial velocity data for thestars in our sample. The average radial velocity of this sampleis 5.6 ± 0.1 km/s with a median value of 5.4 km/s. The radialvelocities collected in this work will be used in Sect. 5 to de-rive individual kinematic parallaxes of Pleiades stars from themoving cluster method.
Vrad (kms/)
Fre
quen
cy
0 2 4 6 8 10 12
020
4060
8010
0
Fig. 5. Distribution of radial velocities for Pleiades stars collectedfrom the literature.
Article number, page 6 of 22

P.A.B. Galli et al.: A revised moving cluster distance to the Pleiades open cluster
3.4. Binaries and multiple systems
Binaries and multiple systems are common features during starformation and various surveys in different regions and clustershave been performed to measure the frequency of such systems(see e.g., Ghez et al. 1993; Duchêne et al. 1999; Daemgen et al.2015). Previous studies on the Pleiades cluster indicate that thebinary fraction varies from 28% to 44%, depending on the massrange, orbital period, and angular separation of the binary sys-tems (Bouvier et al. 1997; Lodieu et al. 2007).
Despite previous efforts, the binarity/multiplicity census ofthe Pleiades cluster is still far from complete and would requirea large observing programme, which is clearly beyond the scopeof this paper. However, unresolved binaries and high-order mul-tiple systems (n ≥ 3) appear brighter than single stars and canbe identified in a color-magnitude diagram (CMD). To do so, weplot different CMDs using the i, J,H,Ks filters that are availablefor most stars in our sample, and identified those stars that de-fine a binary sequence as potential binaries and multiple systemcandidates. Figure 6 illustrates this procedure for one CMD usedin our analysis. We consider the star to be a binary or multiplesystem if it is classified as such in more than one CMD. Thus,we found 510 binary or multiple systems that amounts to 24%of our initial sample. Although this procedure is more likely toremove only the equal-mass binaries, it serves as a first estimateto characterize the binarity/multiplicity in our sample, and it willbe useful in our forthcoming analysis to investigate the distanceof the cluster. We note that we are not rejecting these stars fromthe sample. As explained in Sect. 2.2, the parallaxes of binariesand multiple systems derived in this work will be inferred fromthe average spatial velocity of the cluster (see Sect. 5).
●
●
●
●
●
●
●
●
●
●
●
●●
●
●
●
●
●
●
●
●
●
●
●
●●
●
●
●
●
●
●
●
●
●
●
●
●
●
●
●
●
●
●
●
●
●
●
●
●
●
●
●
●
●
●
●
●
●
●
●
●
●
●
●
●
●
●
●
●
●
●
●
●
●
●
●
●
●
●
●
●
●
●
●
●
●
●
●
●
●
●
●
●
●
●
●
●
●
●
●
●
● ●
●
●
●
●
●
●
●
●
●
●
●
●
●
●
●
●●
●
●●
●
●
●
●
●
●
●
●
●
●
●
●
●
●
●
●
●
●
● ●
●
●
●
●
●
●
●
●
●●
●
●
●
●
●
●
●
●
●
●
●
●
●
●
●
●
●
●
●
●
●
●
●
●
●
●
●
●
●
●
●
●
●
●
●
●
●
●
●
●
●
●
●
●
●
●
●
●
●
●
●
●
●
●
●
●
●
●
●
●
●
●
●
●
●
●
●
●
●
●
●
●
●
●
●
●
●
●
●
●
●●
●
●
●
●
●
●
●
●
●
●
●
●
●
●
●
●
●
●
●
●
●
●
●
●
●
●
●
●
●
●
●
●
●
●
●
●
●
●
●
●
●
●
●
●
●
●
●
●
●
●
●
●
●
●
●
●
●
●
●
●
●
●
●
●
●
●
●
●
●
●
●
●
●
●
●
●
●
●
●
●
●
●
●
●
●
●
●
●
●
●
●
●●
●
●
●
●
●
●
●
●
●
●
●
●
●
●
●
●
●
●
●
●
●
●
●
●
●
●
●
●
●
●
●
●
●
●
●
●
●
●
●
●
●
●
●
●
●
●
●
●
●
●
●
●
●
●
●
●
●
●
●
●
●
●
●
●
●
●
●
●
●
●
●
●
●
●
●
●
●
●
●
●
●
●
●
●
●
●
●
●
●
●
●
●
●
●
●
●
●
●
●
●
●
●
●
●
●
●
●
●
●
●
●
●
●
●
●
●
●
●
●
●
●
●
●
●
●
●
●
●
●
●
●
●
●
●
●
●
●
●
●
●
●
●
●
●
●
●
●
●
●
●
●
●
●●
●
●
●
●
●
●
●
●
●
●
●
●
●
●
●
●
●
●
●
●
●
●
●
●
●
●
●
●
●
●
●
●
●
●
●
●
●
●
●
●
●
●
●
●
●
●
●
●
●
●
●
●
●
●
●
●
●
●
●
●
●
●
●
●
●
●
●
●
●
●
●
●
●
●
●
●
●
●
●
●
●
●
●
●
●
●
●
●
●
●
●
●
●
●
●
●
●
●
●
●
●
●
●
●
●
●
●
●
●
●
●
●
●
●
●
●
●
●
●
●
●
●
●
●
●
●
●
●
●
●
●
●
●
●
●
●
●
●
●
●
●
● ●
●
●
●
●
●
●
●
●
●
●
●
●
●
●
●
●
●
●
●
●
●
●
●
●
●
●
●
●
●
●
●
●
●
●
●
●
●
●
●
●
●
●
●
●
●
●
●
●
●
●
●
●
●
●
●
●
●
●
●
●
●
●
●
●
●
●●
●
●
●●
●
●
●
●
●
●
●
●
●
●
●
●
●
●
●
●
●
●
●
●
●
●
●
●
●
●
●
●
●
●
●
●
●
●
●
●●
●
●
●
●
●
●
●
●
●
●
●
●
●
●
●
●
● ●
●
●
●
●
●
●
●
●
●
●
●
●
●
●
●
●
●
●
●
●
●
●
●
●
●
●
●
●
●
●
●
●
●
●
●
●
●
●
●
●
●
●
●
●
●
●
●
●
●
●
●
●
●
●
●
●
●
●
●
●
●
●
●
●
●
●
●
●
●
●
●
●
●
●
●
●
●
●
●
●
●
●
●
●
●
●
●
●
●
●
●
●
●
●
●
●
●
●
●
●
●
●●
●
●
●
●
●
●
●
●
●
●
●
●
●
●
●
●
●
●
●
●
●
●
●
●
●
●
●
●
●
●
●
●
●
●
●
●
●
●
●
●
●
●
●
●
●
●
●
●
●
●
●
●
●
●
●
●
●
●
●
●
●
●
●
●
●
●
●
●
●
●
●
●
●
●
●
●
●
●
●
●
●
●
●
●
●
●
●
●
●
●
●
●
●
●
●
●
●
●
●
●
●
●
●
●
●
●
●
●
●
●
●
●
●
●
●
●
●
●
●
●
●
●
●
●
●
●
●
●
●
●
●
●
●
●
●
●
●
●
●
●
●
●
●
●
●
●
●
●
●
●
●
●
●
●
●
●
●
●
●
●
●
●
●
●
●
●
●
●
●
●
●
●
●
●
●
●
●
●
●
●
●
●
●
●
●
●
●
●
●
●
●
●
●
●
●
●
●
●
●
●
●
●
●
●
●
●
●
●
●
●
●
●
●
●
●
●
●
●
●
●
●
●
●
●
●
●
●
●
●
●
●
●
●●
●
●
●●
●
●
●
●
●
●
●
●
●
●
●
●
●
●
●
●
●
●
●
●
●
●
●
●
●
●
●
●
●
●
●
●
●
● ●
●
●
●
●
●
●
●
●
●
●
●
●
●
●
●
●
●
●
●
●
●
●
●
●
●
●
●●
●
●
●
●
●
●
●
●
●
●
●
●
●
●
●
●
●
●
●
●
●
●
●
●
●
●
●
●
●
●
●
●
●
●
●
●
●
●
●
●
●
●
●
●
●
●
●
●
●
●
●
●
●
●
●
●
●
●
●
●
●
●
●
●
●
●
●
●
●
●
●
●
●
●
●
●
●
●
●
●
●
●
●
●
●
●
●
●
●
●
●
●
●
●
●
●
●
●
●
●
●
●
●
●
●
0 1 2 3 4 5 6 7
2018
1614
1210
86
i−H (mag)
H (
mag
)
●●
●
●
●
●
●
●
●
●
●
●
●
●
●
●
●●
●
●
●●
●
●
●
●
●
●
●
●●
●
●●
●
●
●
●
●
●
●●
●
●
●
●
●
●
●
●
●●
●
●
●●
●
●
●
● ●
●
●
●
●
●
●
●●●
●
●
●●
●
●
●
●
●
● ●
●
●
●
●●
●
●
●
●
●
●
●
●
●
●
●
●
●
●
●
●
●
●
●
●
●
●
●
●
●
●
●
●
●
●
●
●
●
●●
●
●
●
●
●
●
●
●
●
●
●
●
●
●
●
●●
●
●
●
●
●
●●
●
●
●
●
●
●
●
●
●●
●
●
●
●
●
●
●
●
●
●
●
●
●
●●
●
●●
●
●
●
●
●
●
●
●
●
●
●
●
●
●
●●
●
●●
●
●
●
● ●
●
●
●●
●
●
●
●
●
●
●
●
●
●
●
●
●
●
●
●
●
●
●
●
●
●
●
●
●
●
●
●
●
●
●●
●
●
●●●
●
●
●
●●
●
●
●
●
●
●
●
●
●
●
●
●
●
●
●
●
●
●
●
●
●
●
●
●
●
●●
●
●
●
●
●
●
●
●
●
●
●
●
●
●
●
●
●
●
●
●
●
●
●
●
●
●
●
●●●●
●
●
●●
●
●
●
●
●
●
●
●
●
●
●
●
●
●
●
●
●
●
●
●
●
●
●
●
●
●●
●
●
●
●
●
●
●
●
●
●●
●
●
●
●
●
●
●
●
●
●
●
●
●
●
●
●
●
●●
●
●
●
●
●
●
●
●
●
●
●
●
●
●
●
●
●
●
●
●
●
●
●
●
●
●
●
●
●
●
●
●
●
●●
●
●●
●
●
●
●
●
●
●
●
●
●
●
●
●
●
●
●
●
●
●
●
●●
●
●
●
●
●
●
●
●
●
●
●
●
●
●
●
●
●
●
●●
●
●
●●
●
●
●
●●
●
●
●
●
●
●
●
●
●●
●
●
●
●
●
●
●●
●
●●
●
●
●
● ●
●
●
●
●
●●
●
●
●
●
●
●
●
●
●
●
●
●
●
●
●
●
●
●
●
●
●
●
●
●
●●
●
●
●●
●
●
●
●
●
●
●
●
●
●●
●
●
●
●
●
●
●
●
●
●
●
●
●
●
●
●
●
●
●
●
●
●
●
●
●
●●●
●
●
●
●
●
●
●
●
●
●
●
●
●
●
●
●
●
●
●
●
●
●
●
●
●
●
●
●
●
●
●
●
●
●
●
●
●
●
●
●
●
●
●
●
●
●
●
●
●
●●
●
●
●
●
●
●
●
●
●
●
●
●●
●
●
●
●
●
●
●
●
●
●
●
●
●●
●
●
●
●
●
●
●●
●
●
●
●
●
●
●
●
●
●
●
●●●
●
●
●
●
●●
●
●
●
●
●
●●
●
●
●
●
●
●
●
●
●
●
●
●
●
●
●
●
●
●
●
●
●
●
●
●●
●
●
●
●
●
●
●
●
●
●
●
●
●
●
●
●
●
●
●
●
●
●
●
●
●
●
●
●
●
●
●
●
●
●
●
●
●
●
●
●
●
●
●
●
●
●
●●
●
●
●
●
●
●
●
●
●
●
●
●
●
●
●
●
●
●
●
●
●
●
●
●
●
●
●
●
●
●
●
●
●
●
●●
●
●
●
●
●
●
●
●
●
●
●
●
●
●
●
●
●
●
●
●
●
●
●
●
●
●
●
●
●●
●
●
●
●
●●
●●
●●
●
●●
●
●
●
●
●
●
●
●●
●
●
●
●
●
●
●
●●
●
●
●
●
●
●
●
●
●
●
●
●
●
●
●
●
●
●
●
●
●
●●
●
●
●
●
●
●
●
●
●
●
●
●
●●
●
●
●
●
●
●
●
●
●
●●
●
●
●
●●
●
●
●
●
●
●
●
●
●
●
●
●
●
●
●
●
●
●
●
●
●
●
●
●
●
●
●
●
●
●
●
●●
●
●●
●
●
●
●
●●
●
●●
●
●
●●
●
●●
●
●
●
●
●
●●
●
●
●
●
●
●
●
●
●
●
●
●
●
●●
●
●
●
●
●
●
●
●
● single starsbinary/multiple systems
Fig. 6. CMD to illustrate the locus of potential binaries and multiplesystems that might be present in our sample.
4. Convergent point analysis
In the following, we investigate the CP position of the Pleiadesopen cluster obtained from different subsets of our initial sampleof stars. First, we build two control samples as a quality checkof our results and to discuss the velocity dispersion of the clus-ter. Then, we apply the CPSM to the full sample of stars andinvestigate our solution based on Monte Carlo simulations.
4.1. Preliminary inspection of proper motion data
The accuracy and precision of proper motions are of ultimate im-portance in the CP analysis. To ensure the quality of our resultspresented in the forthcoming sections, we proceed as follows.
First, we select from our initial sample of 2107 stars onlythose stars whose proper motion measurements have been com-puted with a minimum of n ≥ 10 positions and a time base∆t ≥ 10 yr (see Fig. 3). These selection criteria reduce the sam-ple to 1657 stars.
Then, we remove the outliers from the proper motion distri-butions based on a 3σ elimination in each component. Doing so,we end up with a sample of 1551 stars that will be used in theremaining of this paper to investigate the distance of the cluster.
4.2. Control sample 1: the high probability cluster members
The DANCe catalog is not a homogeneous dataset because thestars in our sample have different astrometric observing cam-paigns and the multi-band photometry (u, g, r, i, z,Y, J,H,Ks) isnot complete for all stars. The membership probabilities com-puted from the DANCe project take both astrometric and pho-tometric data into account, and they are more accurate for starswith a complete dataset.
With this in mind, we apply the following selection criteria(in addition to those described in Sect. 4.1) to identify the mostlikely cluster members and the stars with more precise propermotion measurements in our sample:
1. stars with complete data (astrometry + photometry),2. proper motion errors (µα/σµα ) ≥ 47 and (µδ/σµδ ) ≥ 128,3. membership probability p ≥ 0.9975 (3σ).
Our selection criterium #2 refers to the stars that roughly definethe last component of the mixture model applied to the distribu-tion of proper motion errors in Fig. 4. Our choice of using themembership probability threshold of 99.75% (see criterium #3)is justified to minimize, as much as possible, the contaminationrate in our control sample (see Table 4 of Sarro et al. 2014 formore details). Doing so, we end up with a sample of 296 stars.
Then, we applied the CPSM with σv = 0 to identify the starsthat show strict convergence to the CP of the moving group. Wefind a sample of 118 stars that defines a core moving group ofthe cluster (thus, our control sample 1). The corresponding CPis located at
(αcp, δcp) = (92.9◦,−49.4◦) ± (1.2◦, 1.2◦) ,
with chi-squared statistics χ2red = 1.15 (i.e., χ2/ν = 133.0/116)
and correlation coefficient of ρ = −0.99. We note that our firstCP estimate is already consistent with the solution of (αcp, δcp) =(92.5◦,−47.9◦) ± (5.4◦, 5.3◦) derived by Makarov & Robichon(2001). However, our result is more precise, which is a result ofthe more precise proper motion data available nowadays and theimproved methodology (described in Sect. 2.2) to calculate theCP position.
Article number, page 7 of 22

We repeated this analysis after removing the binary (andmultiple system) candidates from our sample (as described inSect. 3.4), and confirmed that the resulting CP position is inperfect agreement with the solution given above. For clarity ofpresentation, we provide only the results, including binaries andmultiple systems, because they contain more stars in the solu-tion. In Appendix A we provide an alternative approach to es-timate the CP coordinates of the Pleiades that also supports theresults presented in this section.
4.3. Control sample 2: the nuclear members of the cluster
The DANCe catalog for the Pleiades open cluster covers an areaof ∼ 80 deg around the cluster center. Ideally, one would expectthe contamination rate by field stars to increase with increasingdistance to the cluster center. To minimize the existence of fieldstars (interlopers), we decided to build a second control sampleby retaining only the nuclear members of the cluster within 2 degfrom the cluster center (α ' 57◦, δ ' +24◦) out of the sample of1551 stars, which was selected as described in Sect. 4.1. Do-ing so, we end up with a sample of 914 stars that will be usedto investigate the typical velocity dispersion in the center of thecluster. In the outer regions, the velocity dispersion required toidentify all cluster members might be larger owing to a combi-nation of several effects (e.g. mass segregation, stellar encoun-ters, tidal disruption, and cluster evaporation). Thus, we arguethat the cluster members identified by the CPSM in this workrepresent a minimum moving group of the Pleiades cluster. Asillustrated in Fig. 7, this sample contains most of the stars withknown distances in the literature that can be used to comparewith our results.
Then, we run the CPSM using different values for the veloc-ity dispersion of the cluster from 0 to 2 km/s in steps of 0.1 km/s.In each step we calculate the CP position and count the num-ber of stars identified by the CPSM as kinematic moving groupmembers. The results of this analysis are shown in Fig. 8. Weobserve that the solution is rather unstable at low values for thevelocity dispersion, although the resulting CP positions are stillstatistically compatible with the results obtained from controlsample 1 (see Sect. 4.1). The scatter reduces significantly af-ter σv = 0.5 km/s with the inclusion of more cluster membersin the solution. We note that with σv = 0.8 km/s, our solutionretrieves the maximum number of cluster members (732 stars)that can be identified by the CPSM from this sample of stars,and that the CP coordinates converge to the solution obtainedwith the control sample 1. Thus, our methodology confirmed80% of the selected sample as moving group members, as ex-pected for the CPSM (see Fig. 8 of Galli et al. 2012). Increasingthe velocity dispersion in the CP analysis for values higher thanσv = 0.8 km/s only increases the noise (i.e., errors) in the CPcoordinates with no benefit of including more cluster members(see Fig. 8). Thus, based on this analysis, we infer the veloc-ity dispersion of the cluster to be σv = 0.8 ± 0.1 km/s (see alsodiscussion Sect. 4.5). The corresponding CP solution is locatedat
(αcp, δcp) = (93.0◦,−49.1◦) ± (2.5◦, 2.4◦) ,
with chi-squared statistics χ2red = 1.03 (i.e., χ2/ν = 753.0/730)
and correlation coefficient of ρ = −0.99. Figure 7 illustrates thedistribution of the stellar proper motion for the 732 stars selectedby the CPSM. These stars define our control sample 2, and theresults obtained in this section will be used as a quality check ofour final CP solution for the Pleiades cluster (see below).
4.4. The CPSM applied to the full sample of Pleiades stars
Our final analysis consists in running the CPSM on the selectedsample of 1551 stars used in this work (see Sect. 4.1). Usinga velocity dispersion of σv = 0.8 km/s, we identify a movinggroup with 1210 stars and CP located at
(αcp, δcp) = (93.3◦,−49.4◦) ± (1.4◦, 1.4◦) ,
with chi-squared statistics χ2red = 0.95 (i.e., χ2/ν =
1142.8/1208) and correlation coefficient of ρ = −0.99. The re-sulting CP solution is in good agreement with the results pre-sented in Sect. 4.2 and 4.3. Based on this investigation, we con-sider the 1210 stars identified directly by the CPSM to be con-firmed members of the cluster.
To gain more confidence in the results presented above, weconstructed a number of 1000 synthetic samples of the Pleiadescluster based on Monte Carlo simulations. These samples aregenerated by resampling the stellar proper motions of individualstars from a Gaussian distribution with mean and variance thatcorresponds to the proper motion measurements and their uncer-tainties. Then, we run the CPSM for each synthetic realizationof the Pleiades cluster and compute the CP position. The resultsof this analysis are shown in Fig. 9. The centroid of the MonteCarlo simulations is located at
(αcp, δcp) = (93.3◦,−49.3◦) ± (1.0◦, 1.0◦) ,
with χ2red = 1.19 and ρ = −0.99. This confirms our CP solu-
tion showing that it is indeed representative of the Pleiades opencluster.
All the investigations reported in this section, using differentsamples and techniques to derive the CP position of the Pleiadescluster, make us confident that our solution is well constrained. Itwill be used in Sect. 5 to calculate individual distances of clustermembers.
4.5. A posteriori assessment of the velocity dispersion
An alternative approach for investigating the velocity dispersionof the cluster consists of analyzing the distribution of the propermotion component that results from the peculiar motions of thestars. To do so, we calculate the proper motion component µ⊥that is directed perpendicular to the great circle that joins thestar and the CP of the moving group following the procedureoutlined in Sect. 2.1 of Galli et al. (2012). The distribution ofµ⊥ values for the 1210 cluster members identified in Sect. 4.4 isshown in Figure 10. The average and standard deviation of thedistribution are, respectively, 0.03 mas/yr and 1.45 mas/yr. Asexpected, the average value of µ⊥ is close to zero, which reflectsthe good convergence of the stellar proper motions to our CPsolution.
The one-dimensional velocity dispersion of the cluster canbe roughly estimated from σv ' 4.74 dσµ, where we consider σµto be the observed scatter that comes from the µ⊥ statistics. Theresulting velocity dispersion depends on the assumed distance dof the cluster that is needed to convert the dispersion of propermotions (in units of mas/yr) to velocity (in units of km/s). Usingthe Hipparcos and VLBI distance estimates of ∼ 120 pc and ∼136 pc for the Pleiades we find a velocity dispersion of 0.82 km/sand 0.93 km/s, respectively. These numbers confirm the valueof σv = 0.8 ± 0.1 km/s inferred from the analysis presented inSect. 4.3.
Article number, page 8 of 22

P.A.B. Galli et al.: A revised moving cluster distance to the Pleiades open cluster
●
●
●
● ●
● ●
●
●
●●●
●●
●
●
●●
●
●
●
●
●
●
●
●
●
●
●
●
●
●●
●
●
●
●●
●
●
●●●
●
●
●
●
●
●●
● ●● ●●
●●
●
●
●
●●
●
●
●
●● ●●● ●
●
●
●
●
●●
●
●
●
●●
●
●●
●●●
●
●
●
●●
●
●● ●
●
●
●
●
●
●
●
●
●
●●
●
●
●
●
●
●
●
●
●●
●
●
●
●
●
●
● ●
●
● ●
●
●
●
●
●
●
●
●
●
●
●●●
●●
●
●
●
●
●
●
●
●
●●
●
● ●● ●
●●
●
●
●
●
●
●●
●
●
●●
●
●● ●●
●
●
●
●
●●
●
●
●
●
●●
●●
●●●
●
●
●●
●
●
●●
●
●
●
●
●●
●
●
●
●
● ●
●●
●●●
●●
●●
●
●●●
●●
●
●● ●
●
●
●
●
●
●
●
●● ●●●
●●● ●
●● ●
●●
●
●
●●●
●
●
●●
●● ●
●●
●●
●
●
●
●
●
●
●●
●●●●
●●
●
●●●
●
●● ●●
●
●●●●
●
●
● ●●
●●●●
●●
●
●●●
● ●
●
●
●●
●
●●
●● ●
●
●
● ●●●
●●●●●
●
●●
●
●
●●
●
●
●●
●●
●
● ●●
●
●●
●● ●
●
●●
●
● ●
●
●●●
●●
●
● ●●
●●●●
●●
●●●●●
●
●●●●●●
●●●●
●●●
●●●●●●
●
●●●
●● ●●●●
●●●●
●●●
●
●
●●●●
●
●●●●
●
●●●●
●●●●●●
●●●●
●●●●●
●● ●
●
●●●●
●
●
● ●●
●●● ●●●●●●●●
●
●
●●
●
● ●
●
●
●
●●
●
●
●●●●
●●● ●
●●●●●●
●●
●●
●●
●●
●●●●●●●● ●●●●
●●
●●● ●●●●●
● ●
●
● ●
●●●●●
●●
●●●● ●●
● ●
●●
●
●
●
●
●●
●●
●
●
●
●
● ● ●●
●
●●●●
●
●●●
●
●● ●
●
●●●
●
●
●●
●
● ●●
●
●●
●
●
●●
●
●●●
● ●●
●●●●●●
●●
●
●● ●
●●●●●●●
●● ●●
●● ●●●●
●●
●●
● ●
●
●●●
●●
●●●●●●●●
●
●●
●
●●●
●●●
●●●●●●●
●●●●
●
●●●●
●●
●
●●●
●●
●● ●●●●●
●●●●●●●●●●●●●●●●●
●●
●●●
●●●●●●●●●●●●
●●●●●●●●●●●
●● ●●
●
●
●●●●●
●●●●●●●
●●●●●●
●●●●●●
●●●●
●●●
●
●
●
●●
●●●● ●●●
●●●●●●●
●●● ●●
●
●●
●● ●●●●●
●●●●●●
●●●●●●
●●●
●●● ●
●●●
●●
● ●
●
● ●
●●
●
●
● ●●●●●
●
● ●●●●
●● ●
●●
●●●●●
●●●●●
●●●●●●●
●● ●●●●●
●●●
●
●
● ●●●
●●●●
●
●●
●●●
●●● ●
●
●●● ●●
● ●
●●
●
●
●
●●
●
●●
●●
●
●●
● ●●
●●
●●
●●
●●
●
●
● ●
●
●
●
●
●●●
●●●●
●●
●●●●
●●
●●●●●●●
●●●●
●
●●●●●●●●●●
●●●●●
● ●● ●●●●●
●● ●
●
●●●
●
● ●●
●●
●●●
●●●●
●
●●●●●
●●
●●
●●●
●● ●●●
●●●
● ●
●●●
●
●● ●
●●
●
●● ●●●
●●●●●●
●●●
●●
●●●● ●●●●
●●●
●
●●
●
●
●
●
●
●
●
●●
●●
●
●
●●● ●● ●
●●●●
●●●●●
●
●●
●● ●●
●●●●
●●
●●●●
●●● ●●
● ●●●●●
●
●●
●● ●
●●●
●● ●
●●●●
●●
● ●
●● ●●
●●●
●
● ●
●●
● ●
●
●●
●●
●
●
●
●
●●
● ●
●●
●●
●
●
●●
●
●●
●● ●
●
●●
●●
●
●●●
●●●
● ●●
● ●
●
● ●
●● ●
●●●●●
●
●● ●●
●●●●
●
●
●
●●●●●●
●●●
●●
● ●
●
●●● ●●
●●●
●●
●
●
●
●●●● ●●
●
●
●●
●●●●
● ●●●
●●
●● ●●
●●
●● ●
●
●
●●●●●
●●
●●●●●●●
●
●
●
●
●●●
●
●●
●
● ●●●
●●●
● ●
●●●
●
●●
●
●
●●
●●
●● ●●●
●
●
●
●
●●
● ●●
●●
●
● ●●●
●●
●●
●●
●
●
●
●
●
●
●●●●
●●
●●
●
●●●●●
●●
●
●
● ●
●
●
●
●
●
●
●
●●● ●
●
●
●
●●
●
●
●
●
●
●●
●
●
●
●
●●
●
●
●●
●
●
●
●●●
●● ●
●
●
●
●
●
●
●●
●
●
●●
●
●
●
●
●
●
●
●●
●●
●
●
●
●
●● ●
●
●●
●
●
● ●●
●●
●
●
●
●
●
●
●
●
●
●
●
●
●
●
●
● ●
●
●
●
●
●
●
●
●
●
●
●
●
●
●
●
●
●
●
●
●
●
●
●
●●
●
●
●
●
●
●●
●
●
●
●
●
●●
●●
●●
●
●
● ●
52 54 56 58 60 62
2022
2426
28Stellar Positions
α (deg)
δ (d
eg)
●
●
●
● ●
● ●
●●
●●
● ●●●
●
●
●
●
●
●
●
●●
●
●
●
●●
●
●●
●
●●
●●● ●●
●●●
●
● ●
●
● ●●● ●
●
●
●●
●
●
●
●
●
●●●
●
●
●
●
●●●●
●
●●
●
● ●
●
●●●
●●●●
●
●
●●●●
●●●
●
●●
●●
●●
●
●●
●●
●
●●●●
●● ●
●●●●●
●
●●
●●●●●●●●
●●●
●
●
●● ●●
●●●
●●●●
●●●●●●●●●
●
●● ●
●
●●●
●
●
● ●●
●●●●●●●●●●●
●
●●
●●
●●●●●
●●
●
●●
●●
●●●●●●●●●●●
●●
●●●●●●●
● ●
●
● ●
●●● ●● ●●●●●
●●
●
●●●●
●●●●●
●
●● ●
●●●●●●
●● ●●
●●●●●●
●●
●● ●
●
● ●●●●●
●●●●●●
●●
●
●● ●
●●●●●●●
●●●●
●●●●
●●
●●●
●●
●● ●●●●●●●●●●●●●●●
●●●●●
●●
●●
●●●●●●●
●●●●●●●●●●●●●
●
●
●●●●
●●●●●●●●●●●●
●●●●●●●●●
●●●
●
●
●
●●●● ●●●
●●●●●●●
●●●● ●
●● ●●●●
●●●●●
●●●●●
●●●●●● ●
●●●●
●
●●
●
●
● ●●●●●
●●●●
●●●
●
●●
●●●●●●●●●
●●●●
●●●● ●●●
●●●●
●●
●●●●
●●
●●
●●●
●●●● ●
●●
●●●●●●●●●
●●●●
●●●●●●●●
●● ●
●
●●
●
● ●
●●
●●
●●●●
●●●●●
●●
●●
● ●●
●●●●
●●●
●● ●
●
●
● ●●●
●●●●●
●
●
●●● ●●●●
●●●
●
●
●●● ●
●●●●
●●●●● ●
●●
●●● ●●● ●●
●●●
●●● ●●
●●●●●
●●●●
●●
●● ●
●
●
●●
●●●
●●●●● ●●
●● ●●●●
●
●●●●
●●●●●●
●
●●
●● ●●
●●
●● ●●
●
●●●
●●●
●●
●
●●●●
●
●
●
●
●
●
●
●
●
●
●
●
●
●
●●
●
●
●
●
●
●
●
●●
●
●
●
●
●
●●
●
● ●
●●●●
●
●● ●
● Control Sample 2HipparcosMelis et al. (2014)Madler et al. (2016)Soderblom et al. (2005)Gatewood et al. (2000)
●
●
●
●
●
●
●
●
●●●
●
●
●
●
●
●●
●●●
●
●
●
●
●
●
●
●
●
●
●
●
●
●●
●
●
●
●
●
●
●
●
●
●
●
●
●
●
●
●
●
●
●●
●
●
●
●
●
●
●●
●●
●
●
●
●
●
●
●
●
●
●
●
●
●
●
●
●
●
●
●
●
●
●●
● ●●
●
●
●●
●
●
● ●
●
●
●
●
●
●
●
●
●
●
●
●
●
●●
●
●
●
●
●
●
●
●
●
●
●
●
●
●
● ●
●
●
●
●
●
●
●
●
●
●
●
●
●
●
●
●
●
●
●
●
● ●
●
●
● ●
●
●●
●
●
●
●
●
●
●
●
●
●
●
●
●
●
●
●
●
●
●
●
●
●
●
●
●
●
●
● ●
●
●
●
●
●
●
●
●
●
●
●
●
●
●
● ●
●
●
●
●
●
●
●
●
●
●
●
●
●
●●
●
●
●
●
●
●
●
●
●
●
●
●●●
●
●
●
●
●
●
●
●
●
●
●
●
●
●
●
●
●
●
●
●
●
●
●
●
●
●
●
●
●
●
●●
●
●
●
●
●
●
●
●
●
●
●
●
●
●
●
●
●
●
●
●
●
●
●
●
●
●
●
●
●
●●
●
●
●
●
●●
●●●
●
●
●
●
●
●
●
●
●
● ●
●
●
●
●
●
●
●
●
●
●
●
●
●
●
●
●●
●
●
●
●
●
●
●
●
●
●
●
●
●
●
●
●
●
●
●
●●
●
●
●
●
●
●
●
●
●●
●
●
●●
●●
●
●
●
●
●
●
●
●
●
●
●●
●
●
●
●
●
●
●●
●
●
●
●●
●
●
●●
●
●
●
●
●
●
●
●
●
●
●
●
●
●
●
●
●
●
●
●
●
●●
●
●
●●
●
●
●
●
●
●
●
●
●
●
●
●
●
●
●
●
●
●
●
●
● ●
●
●
●
●
●
●
●
●
●
●
●
●
●●
●
●
●
●
●
●
●
●
●
●
●
●●
●● ●
●
●
●
●
●
●
●
●
●
●
●●
●
●
●
●
●
●
●
●
●
●
●
●
●
●
●
●
●
●
●
●
●
●
●
●
●
●
●
●
● ●
●
●
●
●
●
●
●
●
●
●
●
●
●●
●
●
●
●
●
●
●
●●
●
●
●
●
●
●
●
●
●
●
●
●
●
●
●
●
●
●
●
●
●
●
●
●●
●
●
●
●●
●
●
●
●
●
●
●
●
●
●
●
●
●
●
●
●
●
●
●
●
●
●
●
●
●
●
●
●
●
●
●
●
●
●
●
●
●
●
●
●
●
●
●
●
●
●
●
●
●
●
●
●
●
●
●
●
●
●
●
●
●
●
●
●
●
●
●
●
●
●
●
●
●
●
● ●●
●
●
● ●
●
●
●●
●
●
●●
●
●
●
●
●
●
●
●
●
●
●
● ●
●
●
●
●
●●
●
●
●●
●
●
●●
●
●
●●
● ●
●
●
●●
●
●
●
●
●
●
●
●
●
●
●●
●
●
●
●
● ●
●
●
●
●
●
●
● ●
●
●
●
●
●
●
●
●
●
●
●
●
●
●
●
●
●
●
●●
●
●
●
●●
●
●
●
●●
●
●
●
●
●
●
●
●
●
●
●
●
●●
●●
●
●● ●
●
●
●
●
●
●
●
●
●
●
●
●
●
●
●
●
●
●
●
●
●●
●
●
●
●
●
●
●
●
●
●
●
●
●
●
●
●
●●
●
●
●
●
●
●
●●
●
●
●
●
●
●
●
●
●
●●
●
●
●
●
●
●
●
●
●
●
●
●
●
●
● ●●
●●
●
●
●
●
●
●
●
●
●
●
●
●
●
●
●
●
●
●
●
●
●
●
●●
●
●
●
●
● ●
●
●
●
●
●
●
●
●
●
●
●
●
●
●●
●
●
●
●
●
●
●
●
●
●
●
●
●
●
●
●●
●
●●
●
●
●
●
●
●
●
●
●
●
●
●
●
●
●
●
●
●
●
●
●
●
●
●
●
●
●
●
●
●
●
●
●
●
● ●
●
●
●
●
●
●
●
●
●
●
●
●
●
●
●
●
●
●
●
●
●
●
●
●
●
●
●
●
●
●
●
●
●
●
●
●
●
●
●
●
●
●
●
●
●
●
●
●
●
●
●
●
●
●
●
●
●
●
●
●
●
●
●
●
●
●
●
●
●
●
●
●
●
●
●
●
●
●
●
●
●
●
●
●
●
●
●
●
● ●
●
●
●
●
●
●
●
●●
●
●
●
●
●
●●
●
●
●
●
●●
●
●
●
●
●
●
●
●
●
●
●
●
●
●
●
● ●
●
●
●
●
●
●
●
●
●
●
●
●
●
●
●
●
●
●●
●●
●
●
●
●
●
●
●
●
●
●
●
●
●
●●
●
●
●
●
●
●
●
●
●
●
●
●
●
●
●
●
●
●
●
●●
●
● ●
●
●
●
●
●
●
●
●
●
●
●
●●
●
●
●
●
●
●
●
●
●
●
●
●
●
●
●
●
●
●
●
●
●
●
●
●
●
●
●
●
●
●●
●
●
●
●
●
●
●● ●
●
●
●
●
●
●
●
●
●
●
●
●
●
●
●
●
●
● ●
●
●●
●
●
●
●
●
●
●
●
●
●
●
●
●
●
●
●●
●
●
●
●
●
●
●
●
●
●
● ●●
●
●
●
●
●
●
●
●
●
●
●
●
●
●
●
●
●
●
●
●
●
●
●●
●
●
●
●
●
●
●●
●●
●
●
●
●
●
●
●
●
●
●
●
●
●
●
●
●
●
●
●
●
●
● ●
●
●
●
●
●
●
●
●
●
●
●●
●
●
●
●
●
●
●
●
●
● ●
●●
●
●
●
●
●
●
●
●
●
●
●
●
●
●
●
●
●
●
●
●
●
●
●
●
●
●
●
●
●
●
●
●
●
●
●
●
●
●
●
●
●
●
●
●
●
●
●
●
●
●
●
●
●
●
●
●
●●
●
●
●
●●
●
●
●
●
●
●
●
●
●
●
●
●
●●
●
●
●
●
●
●
●
●
●
●
●
●
●
●
●
●
●
●
●
●
●
●
●
●
●
●
●
●
●●
●
●
●
●
●
●
●
●
●
●
●
●
●
● ●
●
●
●
●
●
●
●
●
●
●
●
●
●
●
●
●
●
●
●
●
●
●
●
●
●
●
●
●
●
●
●
●
●
●
●
●
●
●
●
●●
●
●
●
●
●
●
●
●●
●
●
●
●
●
●
●
●
●●
●
●
●
●
●
●
●
●
●
●
●
●
●
●
●
●●
●●
●
●
●
●
●
●
●
●
●
●
●●
●
●
●
●
●
●
●
10 15 20 25 30
−55
−50
−45
−40
−35
Proper Motions
µαcosδ (mas/yr)
µ δ (
mas
/yr)
●
●
●●
●
●
●
●●
●
●
●●
●● ●
●●
●
●
●
●
●
●
●
●
●
●
●
●
●
●
●
●●
●
●●
●
●●
●●
●
●
●
●●
●
●
●
●●
●
●
●
●
●
●
●
●
●●
●●
● ●●
●
●●
●
●
●
●
●
●
●
●
●
●
●
●
●●
●
● ●
● ●●
●
●
●
●
● ●
●
●
●
●
●
●
●
●●
●●
●
●
●
●
●●
●
●
●
●●
●
●
●●
●
●
●
●
●
●
●●
●
●●
●
●
●
●
●
●
●
●
●●
●
●
●
●
●
●
●
● ●
●
●
●
●
●
●
●
●
●
●
●
●
●
●
●
●
●
●
●
●
●
●
●●●
● ●
●
●
●
●
●
●●
●
●● ●
●
●
●
●
●
●
●
●
●
●
●
●
●
●
●
●
●
●
●
●
●
●
●
●●
●
●
●
●
●
●
●●
●
●
●
●
●
●
●
●
●
●
●
●
●
●
●
●
●
●
●
● ●
●
●●
●
●
●
●
●
●
●
●
●
●
●
●
●
●
●
●
●
●
●
●
●
● ●●
●
●
● ●
●●
●
●
●●
●
●
●
●
●
●
●
●
● ●
●
●●
●
●●
●
● ●
●
●
●●
●
●●
● ●
●
●
●●
●●
●
●
●
●
●
●
●●
●
●
●
●
● ●●
●
●
●
●
● ●
●
●
●
●
●
●
●
●
●
●●●
●
●
●
●
●
● ●
●
●
●●
●●
●
●
●
●
●
●
●
●●●
●●
●
●●●
●
●
●●
●
●
●
●
●
●
●
●
●
●
●
●
●
●●
●
●
●
●
●
●
●
●
●
●
●
●
●
● ●
●
●
●
●
●●
●
●
●●
●
●
●
●
●●
●
●
●
●
●
●●
●
●
● ●●
●●
●●
●●
●
●
●
●
●
●
●
●
●
● ●●
●
●
●
●● ● ●
●
● ●
●●
●
●
●
●
●
●
●
●
●
●
●
●
●
●
●
●
●
●
●
●
●●
●
●
●
●
●
●
●
●
●●
●
●
●
●
●
●
●●
●
●
●
●●
●
●
●
●
●
●
●
●
●
●●
●
●●
●
●
●
●
●●
●
●
●
●
●
●
●
●●
●
●●
●
●
●
●
●
●
●
●
●●
●
●
●
●
●
●
●
●
●
●
●
●
●
●
●
●
●
●●
●
● ●
●
●
●
●
●
●●
●
●
●
●
●
●
●
●
●
●
●
●●
●
●
●
●
●
●
●
●
●
●
●
●
●
●
●
●●●
●
● ●
●
●●
●
●
●
●
●●
●
●
●
●
●
●
●
●
●●
●
●
●
●
●
●
●
●
●
●●
●●
●
● ●
●
●
●●
●
●●
●●
●●
●
●
●
●
●
●
●
●
●
●
●
●
●
●
●●
●
●
●
●
●
●
● ●
●●
●●
●●
●
●●
●
●
●
●
●
●
●
●
●
●
●
●●
●
●●
●●
●
●
●
●
●
●
● ●
●
●
●
●
●
●
●
● Control Sample 2HipparcosMelis et al. (2014)Madler et al. (2016)Soderblom et al. (2005)Gatewood et al. (2000)
Fig. 7. Distribution of stellar positions (left panel) and proper motions (right panel) for the Pleiades stars in the DANCe catalog. The varioussymbols and colors indicate the nuclear members of the cluster that define our control sample 2, and the stars with individual distances reported inthe literature.
df_res$eV
α cp
(deg
)
●●
●
●
●
● ●
●● ● ● ● ● ● ● ● ● ● ● ● ●
8689
9295
98
df_res$eV
δ cp
(deg
) ●●
●
●
●
● ●
●● ● ● ● ● ● ● ● ● ● ● ● ●
−56
−52
−48
−44
●●
●
●
●
●
●
●
● ● ● ● ● ● ● ● ● ● ● ● ●
σv (km/s)
Num
ber
of s
tars
0.0 0.2 0.4 0.6 0.8 1.0 1.2 1.4 1.6 1.8 2.0
300
500
700
Fig. 8. Results obtained from the CPSM (CP coordinates and number of moving group members) as a function of the velocity dispersion of thecluster. The solid and dashed lines indicate the CP solution derived from our control sample 1 at 1σ and 3σ (see Sect. 4.1).
Article number, page 9 of 22
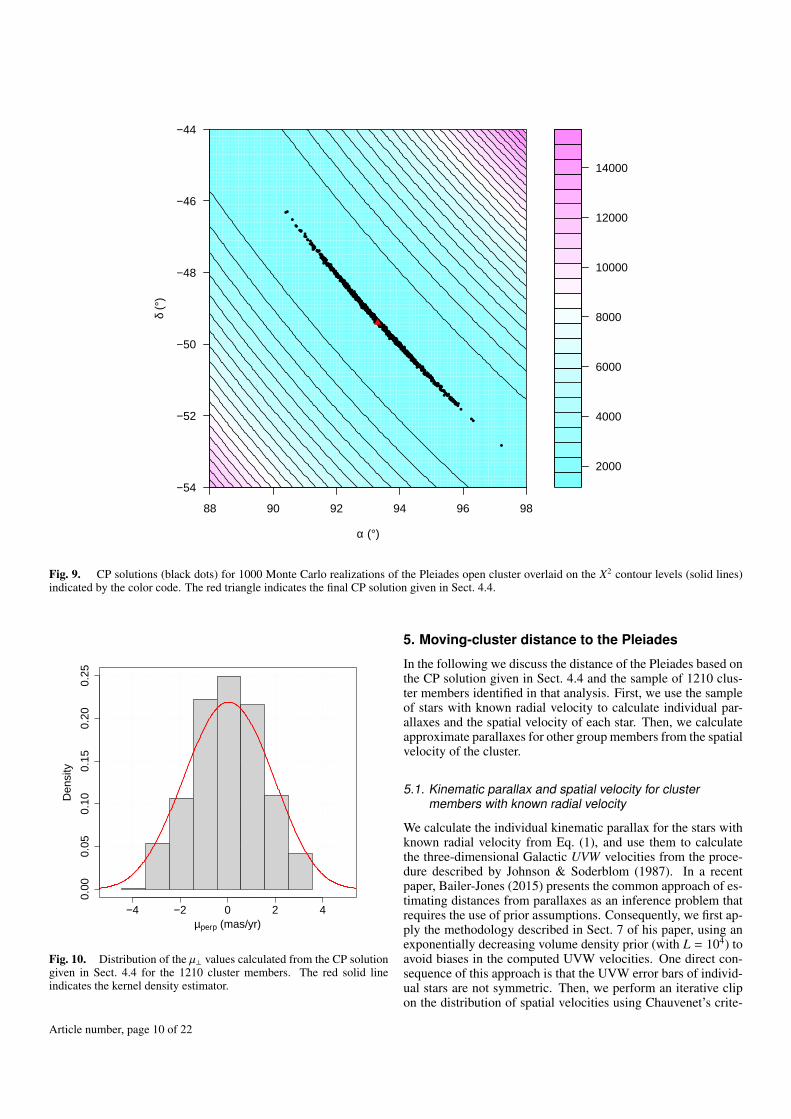
2000
4000
6000
8000
10000
12000
14000
88 90 92 94 96 98
−54
−52
−50
−48
−46
−44
●
●
●
●
●
●
●
●
●
●
●
●
●
●
●
●
●
●●
●
●
●
●
●
●
●
●
●
●
●
●
●
●
●
●
●●
●●
●
●
●
●
●
●
●
●
●
●
●
●
●
●
●
●
●
●
●●
●
●
●
●
●
●●
●
●
●
●
●
●
●
●
●
●
●
●
●
●
●
●
●
●
●
●
●
●
●
●●
●
●
●
●
●
●
●
●
●●
●
●
●
●
●
●
●
●
●
●
●
●
●
●
●
●
●
●
●
●
●
●
●
●
●
●
●
●
●
●
●
●●
●
●
●
●
●
●
●
●
●
●
●
●
●
●
●●
●
●
●
●
●●
●
●
●
●
●
●
●
●
●
●
●
●
●
●
●
●
●
●
●
●
●
●
●
●
●
●
●●
●
●
●
●
●●●
●
●
●●
●
●
●
●
●
●
●
●●
●
●
●
●
●
●
●
●
●
●
●
●●
●
●
●
●
●
●
●
●
●
●
●
●●
●
●
●
●
●
●
●
●
●
●
●
●
●
●
●
●
●
●
●
●
●
●
●
●
●
●
●
●
●
●
●
●
●
●
●●
●
●
●
●
●
●
●
●
●●
●
●
●
●●
●
●
●●
●●
●
●
●
●●
●
●
●
●
●
●
●
●
●
●
●
●
●●
●
●
●
●
●
●
●
●
●
●
●
●
●
●
●
●
●
●
●
●
●
●
●
●
●
●
●
●
●
●
●
●
●
●
●
●
●
●
●
●
●
●●
● ●
●
●
●
●
●
●
●
●
●
●
●
●
●
●
●
●
●
●
●
●
●
●
●
●●
●
●
●
●
●●●
●
●
●
●
●
●
●
●
●
●
●●
●
●
●
●
●
●
●
●
●
●●
●
●
●
●
●
●
●
●●
●
●
●
●
●
●
●
●
●●
●
●
●
●
●
●
●
●
●
●
●
●●
●
●
●
●
●
●
●
●
●
●●
●●
●
●
●
●
●
●
●
●
●
●
●
●
●
●●
●
●
●
●
●
●
●
●
●
●
●
●
●
●
●
●
●
●●
●
●
●
●
●
●
●
●
●
●
●
●
●
●
●
●
●
●
●
●
●
●
●
●
●
●
●
●
●
●
●
●
●●
●
●
●
●
●
●
●
●
●
●●
●
●
●
●
●
●
●
●
●
●
●
●
●
●
●
●
●
●
●
●
●
●
●
●
●●
●
●
●
●
●
●
●
●
●
●●
●
●
●
●
●●
●
●
●
●
●
●
●●
●
●
●
●
●
●
●●
●
●
●
●
●
●
●
●
●●
●
●
●
●
●
●
●
●
●
●
●
●
●
●
●
●
●
●
●
●
●
●
●
●
●
●●
●
●
●
●
●
●
●
●
●
●
●
●
●
●
●
●
●
●
●
●
●
●
●
●
●
●
●●
●
●
●
●
●
●
●
●
●
●
●
●
●
●
●
●
●
●
●
●
●
●
●
●
●
●
●
●
●
●
●
●
●
●
●
●
●
●
●
●
●
●
●
●
●
●
●
●
●
●
●
●
●
●
●
●
●
●●
●
●
●
●
●●
●
●
●
●
●
●
●
●
●
●
●
●
●
●
●
●
●
●
●
●
●
●
●
●
●
●
●
●
●
●
●
●
●●
●
●
●
●
●
●
●
●
●
●
●
●
●
●
●●
●
●
●
●
●
●
●
●
●
●
●
●
●
●
●
●
●
●
●
●
●
●
●
●
●
●
●
●
●
●
●
●
●
●
●
●
●
●
●
●
●
●
●
●
●
●
●
●
●
●
●
●
●
●
●
●
●
●●
●
●
●●
●
●
●
●
●
●
●
●●
●
●
●
●
●
●
●
●
●●
●
●
●
●
●
●
●●
●
●
●
●
●
●
●
●
●
●
●
●●
●
●
●
●●
●
●
●
●●
●
●
●
●●
●
●
●
●
●
●
●
●
●
●
●
●
●●●
●
●
●
●
●
●
●
●
●
●
●
●
●
●
●
●
●
●
●
●
●
●
●
●
●
●
●
●●
●
●
●
●
●
●
●
●
●
●
●
●
●
●
●
●
●
●
●
●
●
●
●
●
●
●
●
●
●
●
●
●
●
●
●
●●
●
●
●
●
●
●
●
●
●
●
●
●
●
●
●
●
●
●
●
●
●
●
●
●
●
●
●
●●●
●
α (°)
δ (°
)
Fig. 9. CP solutions (black dots) for 1000 Monte Carlo realizations of the Pleiades open cluster overlaid on the X2 contour levels (solid lines)indicated by the color code. The red triangle indicates the final CP solution given in Sect. 4.4.
µperp (mas/yr)
Den
sity
−4 −2 0 2 4
0.00
0.05
0.10
0.15
0.20
0.25
Fig. 10. Distribution of the µ⊥ values calculated from the CP solutiongiven in Sect. 4.4 for the 1210 cluster members. The red solid lineindicates the kernel density estimator.
5. Moving-cluster distance to the Pleiades
In the following we discuss the distance of the Pleiades based onthe CP solution given in Sect. 4.4 and the sample of 1210 clus-ter members identified in that analysis. First, we use the sampleof stars with known radial velocity to calculate individual par-allaxes and the spatial velocity of each star. Then, we calculateapproximate parallaxes for other group members from the spatialvelocity of the cluster.
5.1. Kinematic parallax and spatial velocity for clustermembers with known radial velocity
We calculate the individual kinematic parallax for the stars withknown radial velocity from Eq. (1), and use them to calculatethe three-dimensional Galactic UVW velocities from the proce-dure described by Johnson & Soderblom (1987). In a recentpaper, Bailer-Jones (2015) presents the common approach of es-timating distances from parallaxes as an inference problem thatrequires the use of prior assumptions. Consequently, we first ap-ply the methodology described in Sect. 7 of his paper, using anexponentially decreasing volume density prior (with L = 104) toavoid biases in the computed UVW velocities. One direct con-sequence of this approach is that the UVW error bars of individ-ual stars are not symmetric. Then, we perform an iterative clipon the distribution of spatial velocities using Chauvenet’s crite-
Article number, page 10 of 22

P.A.B. Galli et al.: A revised moving cluster distance to the Pleiades open cluster
rion (see e.g. Bevington & Robinson 2003) to remove obviousoutliers and spot possible errors on the parallaxes derived fromradial velocities. This leaves us with a sample of 64 stars withknown radial velocity, which is used to accurately constrain thespatial velocity of the cluster. Binaries and multiple systems (seeSect. 3.4) are excluded from this count, because it is not possi-ble to derive their kinematic parallaxes based on a single radialvelocity measurement.
Table 2 lists the parallaxes derived in this work for clus-ter members with known radial velocity. The mean parallaxis 7.44 ± 0.08 mas (median of 7.38 mas and standard devia-tion of 0.66 mas). This is consistent with a distance estimateof 134.4+2.9
−2.8 pc given a confidence interval of 95%. This resultis in good agreement with the VLBI distance determination of136.2±1.2 pc reported by Melis et al. (2014), but it is not consis-tent with the Hipparcos distance of 120.2±1.9 pc (van Leeuwen2009).
Individual values for the space velocity of each star are alsolisted in Table 2. Figure 11 illustrates the distribution of theGalactic space velocity in each component and Table 3 lists theiraverage values. In a previous paper, Robichon et al. (1999) re-port the space velocity of (U,V,W) = (−6.4,−24.4,−13.0) ±(0.5, 0.7, 0.4) km/s (not corrected for the Solar motion) basedon Hipparcos parallaxes. The difference of (∆U,∆V,∆W) =(0.2,−4.3,−1.7) ± (0.5, 0.8, 0.4) km/s between these two esti-mates is significant and comes from the different parallaxes usedfor each star in both studies.
Table 3. Spatial velocity of the Pleiades cluster derived in this workfrom the sample of 64 stars with known radial velocities.
Mean ± SEM Median Mode SD(km/s) (km/s) (km/s) (km/s)
U −6.2 ± 0.1 -6.2 -6.1 0.7V −28.7 ± 0.3 -28.5 -28.2 2.5W −14.7 ± 0.2 -14.6 -14.6 1.3Vspace 32.9 ± 0.3 32.8 31.3 2.8
Notes. We provide for each velocity component the mean, standard er-ror of the mean (SEM), median, mode and standard deviation (SD) val-ues.
5.2. Kinematic parallax for other cluster members
Once the spatial velocity of the cluster is defined we can deriveapproximate parallaxes to the remaining group members underthe assumption that all stars in a moving group share the samespace motion. As a consistency check, we first compare the par-allaxes derived from Eqs. (1) and (2) for the sample of 64 starswith known radial velocities. Figure 12 illustrates this compar-ison. We find a mean difference and root mean square (rms) of0.01 mas and 0.58 mas, respectively, between the two methods tocompute kinematic parallaxes. These numbers are smaller thanthe typical error (about 1.0 mas) of the parallaxes listed in Ta-ble 2 and confirm that both techniques yield consistent results.We performed a consistency check of the parallaxes derived fromEq. (2) using the mean, median, and mode of the cluster spatialvelocity. We verified that the agreement between both methodsto compute kinematic parallaxes is better when we use the modeinstead of the mean (or median) of the cluster spatial velocityowing to the asymmetry observed in the distribution for the totalspatial velocity Vspace (see Fig. 11).
Then, we calculate from Eq. (2) the kinematic parallax forthe remaining 1146 cluster members with unknown (or poor) ra-
U (km/s)
Den
sity
−10 −8 −7 −6 −5 −4 −3
0.0
0.1
0.2
0.3
0.4
V (km/s)
Den
sity
−40 −35 −30 −25 −20
0.00
0.05
0.10
0.15
W (km/s)D
ensi
ty
−22 −18 −14 −10
0.00
0.10
0.20
0.30
Vspace (km/s)
Den
sity
20 25 30 35 40 45
0.00
0.04
0.08
0.12
Fig. 11. Histogram of the Galactic space velocity components forthe 64 cluster members with known radial velocities. The red solid lineindicates the kernel density estimator.
●
●
● ●●
●● ●●
● ●●
●
●
●
●
●
●
●●
●
●
●●
● ●
●
●●●●
●●
●
●●
●
●
●●●
●
●●
●
●
●
●●
●
●
●
●
●
●
● ●
●●
●
●
●
●
●
4 6 8 10 12
46
810
12
π (mas) − from radial velocities
π (m
as)
− fr
om c
lust
er s
patia
l vel
ocity
●
●
● ●●
●● ●●
● ●●
●
●
●
●
●
●
●●
●
●
●●
● ●
●
●●●●
●●
●
●●
●
●
●●●
●
●●
●
●
●
●●
●
●
●
●
●
●
● ●
●●
●
●
●
●
●
●
●
● ●●
●● ●●
● ●●
●
●
●
●
●
●
●●
●
●
●●
● ●
●
●●●●
●●
●
●●
●
●
●●●
●
●●
●
●
●
●●
●
●
●
●
●
●
● ●
●●
●
●
●
●
●
Fig. 12. Comparison of the parallaxes derived from individual radialvelocities and the mode of the cluster spatial velocity for the sample of64 stars. The red solid line indicates perfect correlation.
dial velocities, binaries and multiple systems in our sample ofstars selected by the CPSM. Table 4 lists the resulting kinematicparallaxes for these stars. As explained in Sect. 2.1, the asso-ciated uncertainties take into account the errors on proper mo-tions, the CP position, and the average error of the individual
Article number, page 11 of 22

Table 2. Parallaxes and spatial velocities for the sample of 64 stars with known radial velocities.
DANCe α δ µα cos δ µδ Vr Ref. π U V W(h:m:s) (◦ ′ ′′) (mas/yr) (mas/yr) (km/s) (mas) (km/s) (km/s) (km/s)
J034051.27+233554.3 03 40 51.27 23 35 54.3 15.8 ± 1.2 −39.9 ± 1.1 4.90 ± 0.10 1 7.0 ± 0.9 −5.3+0.2−0.2 −26.5+4.0
−3.0 −14.5+1.9−1.4
J034203.30+243213.3 03 42 03.30 24 32 13.3 20.3 ± 0.3 −44.9 ± 0.2 4.90 ± 0.20 1 7.4 ± 1.1 −6.6+0.5−0.4 −29.5+5.0
−3.6 −14.5+2.1−1.6
J034204.72+225130.8 03 42 04.72 22 51 30.8 21.1 ± 0.9 −43.5 ± 0.9 5.72 ± 1.42 2 7.3 ± 2.0 −7.2+2.0−1.5 −34.9+12.7
−4.3 −15.7+5.4−2.3
J034208.84+233517.0 03 42 08.84 23 35 17.0 16.8 ± 0.4 −44.7 ± 0.3 4.60 ± 0.28 1 8.3 ± 1.2 −4.8+0.4−0.3 −24.6+4.0
−2.9 −13.9+2.0−1.5
J034221.54+243952.7 03 42 21.54 24 39 52.7 18.6 ± 0.4 −47.4 ± 0.3 4.24 ± 0.09 1 8.7 ± 1.2 −5.1+0.3−0.2 −25.3+4.2
−3.0 −13.9+2.0−1.5
J034227.60+250249.1 03 42 27.60 25 02 49.1 18.9 ± 0.4 −42.3 ± 0.3 5.19 ± 0.47 1,3 6.2 ± 0.9 −7.3+0.5−0.4 −32.9+5.7
−4.1 −16.3+2.4−1.7
J034228.65+250100.4 03 42 28.65 25 01 00.4 20.7 ± 0.3 −47.5 ± 0.2 4.34 ± 0.09 1 8.3 ± 1.2 −6.0+0.4−0.3 −27.3+4.7
−3.4 −13.8+2.0−1.5
J034312.12+244445.4 03 43 12.12 24 44 45.4 20.2 ± 0.3 −46.9 ± 0.2 5.19 ± 0.14 1 7.1 ± 1.0 −6.8+0.5−0.4 −31.4+5.2
−3.8 −16.0+2.3−1.7
J034335.21+252431.0 03 43 35.21 25 24 31.1 21.5 ± 0.3 −47.2 ± 0.2 5.03 ± 0.22 1 7.0 ± 1.1 −7.5+0.7−0.6 −33.1+6.1
−4.2 −16.0+2.6−1.8
J034336.60+232714.0 03 43 36.60 23 27 14.1 19.8 ± 0.3 −43.8 ± 0.2 4.79 ± 0.05 1 8.3 ± 1.0 −5.7+0.2−0.2 −25.2+3.6
−2.7 −12.4+1.4−1.1
J034336.92+242338.1 03 43 36.92 24 23 38.1 18.9 ± 0.3 −43.8 ± 0.2 5.11 ± 0.09 1 7.0 ± 1.0 −6.4+0.4−0.3 −29.5+4.6
−3.4 −15.0+2.0−1.5
J034347.97+250311.1 03 43 47.97 25 03 11.1 18.1 ± 0.9 −44.3 ± 0.8 4.79 ± 0.10 1 7.0 ± 1.0 −6.2+0.4−0.3 −29.6+5.1
−3.6 −15.6+2.3−1.7
J034355.70+242534.9 03 43 55.70 24 25 34.9 22.5 ± 0.4 −46.7 ± 0.3 4.47 ± 0.18 1 8.8 ± 1.2 −6.2+0.5−0.4 −26.3+4.3
−3.1 −12.1+1.7−1.3
J034356.69+251544.1 03 43 56.69 25 15 44.1 19.6 ± 0.3 −46.6 ± 0.2 4.19 ± 0.10 1 8.3 ± 1.2 −5.7+0.4−0.3 −26.6+4.6
−3.3 −13.7+2.1−1.5
J034356.71+245936.3 03 43 56.71 24 59 36.3 21.9 ± 0.4 −46.3 ± 0.3 5.33 ± 0.14 1 6.8 ± 1.0 −7.8+0.6−0.5 −33.3+5.6
−4.1 −15.5+2.3−1.6
J034420.87+233339.9 03 44 20.87 23 33 39.9 18.8 ± 0.3 −46.0 ± 0.2 6.13 ± 0.39 1 6.7 ± 0.9 −6.7+0.5−0.5 −32.3+5.1
−3.7 −17.1+2.4−1.8
J034435.42+240004.5 03 44 35.42 24 00 04.5 20.3 ± 0.5 −44.2 ± 0.5 5.63 ± 0.06 1 6.9 ± 0.9 −7.2+0.4−0.3 −31.2+4.6
−3.5 −14.9+1.8−1.4
J034458.92+220156.8 03 44 58.92 22 01 56.8 17.8 ± 1.1 −43.0 ± 1.0 5.80 ± 0.40 4 7.6 ± 1.0 −5.6+0.4−0.4 −26.6+3.9
−2.9 −13.9+1.8−1.4
J034458.96+232319.9 03 44 58.96 23 23 19.9 18.8 ± 0.3 −47.1 ± 0.2 5.23 ± 0.10 1,3 8.2 ± 1.0 −5.5+0.2−0.2 −26.6+3.7
−2.8 −14.3+1.7−1.3
J034509.74+245021.3 03 45 09.74 24 50 21.3 19.7 ± 0.8 −45.5 ± 0.8 4.80 ± 0.80 4 7.6 ± 1.6 −6.5+1.3−1.0 −30.8+8.2
−4.4 −15.3+3.8−2.2
J034516.14+240716.0 03 45 16.14 24 07 16.0 17.0 ± 0.5 −43.2 ± 0.4 4.95 ± 0.22 1 7.4 ± 1.0 −5.6+0.4−0.3 −27.1+4.3
−3.1 −14.6+2.0−1.5
J034522.19+232818.1 03 45 22.19 23 28 18.1 19.3 ± 0.4 −44.2 ± 0.3 5.02 ± 0.10 1 8.1 ± 1.0 −5.8+0.3−0.2 −26.0+3.6
−2.8 −13.0+1.5−1.2
J034529.58+234537.6 03 45 29.58 23 45 37.6 18.3 ± 0.3 −46.6 ± 0.2 5.54 ± 0.09 1 7.4 ± 0.9 −6.0+0.2−0.2 −29.1+4.2
−3.2 −15.8+1.9−1.5
J034530.23+241845.2 03 45 30.23 24 18 45.2 17.8 ± 0.5 −46.5 ± 0.4 4.89 ± 0.43 1 7.9 ± 1.2 −5.5+0.6−0.5 −27.6+5.0
−3.5 −15.1+2.5−1.8
J034539.04+251327.6 03 45 39.04 25 13 27.6 20.2 ± 0.3 −43.5 ± 0.3 4.51 ± 0.04 1 7.5 ± 1.1 −6.6+0.4−0.3 −28.3+4.8
−3.4 −13.3+1.9−1.4
J034544.08+240426.7 03 45 44.08 24 04 26.7 17.8 ± 0.3 −44.4 ± 0.2 5.00 ± 0.13 1 7.6 ± 1.0 −5.7+0.3−0.2 −27.1+4.0
−3.0 −14.4+1.8−1.4
J034548.95+235110.2 03 45 48.95 23 51 10.2 19.7 ± 0.4 −44.3 ± 0.3 5.58 ± 0.07 1 7.1 ± 0.9 −6.8+0.3−0.3 −30.0+4.3
−3.3 −14.7+1.8−1.3
J034606.52+235020.2 03 46 06.52 23 50 20.2 19.6 ± 0.3 −45.7 ± 0.2 4.97 ± 0.18 1 8.2 ± 1.0 −5.8+0.4−0.3 −26.5+3.9
−2.9 −13.4+1.7−1.3
J034607.52+242227.4 03 46 07.52 24 22 27.4 18.9 ± 0.5 −44.9 ± 0.4 4.69 ± 0.06 1 8.1 ± 1.1 −5.7+0.3−0.2 −26.3+4.0
−3.0 −13.4+1.7−1.3
J034617.95+244109.2 03 46 17.95 24 41 09.2 18.1 ± 0.7 −41.3 ± 0.7 5.07 ± 0.24 1 6.7 ± 1.0 −6.6+0.6−0.5 −29.6+4.9
−3.6 −14.6+2.1−1.6
J034627.01+242713.9 03 46 27.01 24 27 13.9 16.2 ± 1.7 −42.8 ± 1.7 5.68 ± 0.62 1 6.2 ± 1.1 −6.4+0.8−0.7 −32.6+6.7
−4.4 −17.9+3.4−2.3
J034628.64+244532.0 03 46 28.64 24 45 32.0 17.7 ± 1.0 −46.2 ± 0.9 4.38 ± 0.06 1 8.4 ± 1.2 −5.1+0.2−0.2 −25.2+4.0
−3.0 −13.8+1.9−1.4
J034632.87+231819.1 03 46 32.87 23 18 19.1 21.1 ± 0.3 −44.7 ± 0.3 5.77 ± 0.10 1 7.4 ± 0.9 −6.9+0.3−0.3 −29.4+4.0
−3.1 −13.6+1.5−1.2
J034635.92+235800.9 03 46 35.92 23 58 00.9 17.1 ± 0.7 −41.7 ± 0.7 4.68 ± 0.08 1,3 7.8 ± 1.0 −5.3+0.2−0.2 −25.0+3.6
−2.8 −13.0+1.6−1.2
J034639.39+240146.7 03 46 39.39 24 01 46.7 19.5 ± 0.4 −44.9 ± 0.3 5.26 ± 0.76 1,3 7.5 ± 0.9 −6.3+0.3−0.2 −28.4+4.1
−3.1 −14.1+1.7−1.3
J034643.59+235942.4 03 46 43.59 23 59 42.4 18.9 ± 0.3 −44.9 ± 0.2 5.12 ± 0.20 1 7.7 ± 1.0 −6.0+0.4−0.3 −27.5+4.1
−3.1 −14.0+1.8−1.4
J034649.21+243559.8 03 46 49.21 24 35 59.8 20.2 ± 0.4 −43.0 ± 0.3 5.19 ± 0.11 1 7.0 ± 0.9 −7.1+0.5−0.4 −30.1+4.7
−3.5 −13.9+1.8−1.4
J034653.27+225251.0 03 46 53.27 22 52 51.0 19.5 ± 0.6 −48.3 ± 0.5 6.01 ± 0.59 1,3 7.8 ± 0.9 −6.1+0.2−0.2 −28.8+3.7
−2.9 −15.2+1.6−1.3
J034654.03+251444.8 03 46 54.03 25 14 44.8 18.9 ± 0.3 −45.6 ± 0.2 5.45 ± 0.09 1 6.5 ± 0.9 −7.2+0.5−0.4 −33.3+5.5
−4.0 −17.1+2.5−1.8
J034709.45+234431.6 03 47 09.45 23 44 31.7 19.6 ± 0.3 −44.4 ± 0.2 4.95 ± 0.26 1 8.2 ± 1.1 −5.9+0.4−0.4 −26.1+3.9
−2.9 −12.8+1.7−1.3
J034713.54+234251.1 03 47 13.54 23 42 51.1 17.4 ± 0.4 −45.2 ± 0.4 5.94 ± 0.17 1,3 6.8 ± 0.8 −6.3+0.2−0.2 −30.5+4.3
−3.3 −16.6+2.0−1.5
J034720.97+234812.0 03 47 20.97 23 48 12.0 16.3 ± 1.0 −46.3 ± 1.0 4.90 ± 0.80 4 8.3 ± 1.7 −4.9+0.8−0.8 −26.8+6.7
−3.8 −15.3+3.6−2.2
J034722.99+245055.9 03 47 22.99 24 50 55.9 18.4 ± 0.8 −47.6 ± 0.7 4.47 ± 0.33 1 8.5 ± 1.3 −5.3+0.5−0.5 −26.1+4.7
−3.3 −14.1+2.3−1.7
J034725.35+240256.7 03 47 25.35 24 02 56.7 18.8 ± 0.5 −43.3 ± 0.5 5.86 ± 0.16 1 6.5 ± 0.8 −7.1+0.4−0.3 −31.6+4.6
−3.5 −15.6+2.0−1.5
J034730.60+242213.7 03 47 30.60 24 22 13.7 19.7 ± 0.4 −46.4 ± 0.3 4.95 ± 0.10 1 8.0 ± 1.0 −6.0+0.3−0.3 −27.4+4.1
−3.1 −13.8+1.8−1.3
J034733.47+234132.7 03 47 33.47 23 41 32.7 19.9 ± 0.4 −41.6 ± 0.3 5.71 ± 0.56 1 6.8 ± 1.0 −7.2+0.9−0.8 −30.7+5.5
−3.8 −13.9+2.3−1.7
J034733.69+244102.8 03 47 33.69 24 41 02.8 17.8 ± 0.6 −47.1 ± 0.6 5.42 ± 0.07 1 7.1 ± 0.9 −6.2+0.3−0.2 −30.5+4.7
−3.5 −16.8+2.2−1.7
J034738.02+232804.8 03 47 38.02 23 28 04.8 21.3 ± 0.3 −41.9 ± 0.2 5.16 ± 0.08 1 7.8 ± 0.9 −6.7+0.3−0.3 −26.7+3.6
−2.8 −11.5+1.3−1.0
J034738.05+244911.1 03 47 38.05 24 49 11.1 18.5 ± 0.3 −41.9 ± 0.2 4.98 ± 0.22 1 6.9 ± 1.0 −6.6+0.5−0.4 −29.2+4.8
−3.5 −14.2+2.0−1.5
J034740.46+242152.1 03 47 40.46 24 21 52.1 15.9 ± 0.7 −45.2 ± 0.6 4.96 ± 0.32 1,3 7.6 ± 1.0 −5.2+0.2−0.2 −26.8+4.1
−3.1 −15.4+2.1−1.6
J034741.19+234424.7 03 47 41.19 23 44 24.7 20.1 ± 0.4 −44.2 ± 0.4 5.81 ± 0.36 1 7.0 ± 0.9 −7.0+0.6−0.5 −30.7+4.8
−3.5 −14.6+2.0−1.5
J034750.95+243018.7 03 47 50.95 24 30 18.7 17.6 ± 0.3 −46.4 ± 0.2 4.88 ± 0.32 1 7.9 ± 1.1 −5.5+0.5−0.4 −27.2+4.6
−3.3 −14.9+2.3−1.7
J034755.28+231905.7 03 47 55.28 23 19 05.8 16.6 ± 0.3 −39.5 ± 0.2 5.83 ± 0.21 1 6.4 ± 0.8 −6.4+0.3−0.3 −29.0+4.0
−3.1 −14.7+1.7−1.4
J034757.61+263745.2 03 47 57.61 26 37 45.2 20.2 ± 2.0 −41.5 ± 1.9 4.22 ± 0.16 3 6.7 ± 1.2 −7.5+0.9−0.6 −31.4+6.5
−4.3 −13.9+2.6−1.7
J034805.83+230202.8 03 48 05.83 23 02 02.8 18.7 ± 0.3 −43.4 ± 0.2 5.91 ± 0.22 1 7.2 ± 0.8 −6.4+0.3−0.3 −28.7+3.9
−3.0 −14.3+1.7−1.3
J034807.97+234423.4 03 48 07.97 23 44 23.4 17.6 ± 0.4 −42.7 ± 0.3 5.54 ± 0.29 1 7.0 ± 0.9 −6.2+0.4−0.4 −28.7+4.3
−3.2 −14.8+2.0−1.5
J034813.78+233759.1 03 48 13.78 23 37 59.1 15.5 ± 0.5 −42.2 ± 0.5 5.24 ± 0.20 1 7.3 ± 0.9 −5.3+0.3−0.2 −26.4+3.8
−2.9 −14.7+1.8−1.4
J034817.30+243015.7 03 48 17.30 24 30 15.7 18.4 ± 0.3 −49.2 ± 0.2 4.74 ± 0.17 1 8.7 ± 1.2 −5.3+0.3−0.3 −26.1+4.0
−3.0 −14.4+2.0−1.5
J034819.84+233611.7 03 48 19.84 23 36 11.7 17.0 ± 0.7 −43.1 ± 0.7 5.01 ± 0.35 1 7.9 ± 1.1 −5.3+0.4−0.4 −25.5+4.0
−3.0 −13.6+1.9−1.5
J034822.81+244853.5 03 48 22.81 24 48 53.5 19.5 ± 0.3 −46.4 ± 0.2 5.81 ± 0.22 1,3 6.6 ± 0.9 −7.3+0.5−0.4 −33.5+5.3
−3.9 −16.9+2.4−1.8
J034834.52+232604.9 03 48 34.52 23 26 04.9 16.9 ± 1.5 −44.2 ± 1.4 5.73 ± 0.23 1,3 7.2 ± 0.9 −5.8+0.2−0.2 −28.3+3.9
−3.0 −15.4+1.8−1.4
J034902.35+231508.4 03 49 02.35 23 15 08.4 15.6 ± 1.5 −43.5 ± 1.4 5.87 ± 0.19 3 7.0 ± 0.8 −5.6+0.2−0.2 −28.3+3.9
−3.0 −16.0+1.9−1.5
J034928.76+234243.6 03 49 28.76 23 42 43.6 18.7 ± 0.5 −45.5 ± 0.5 5.73 ± 0.22 3 7.3 ± 0.9 −6.3+0.4−0.3 −29.2+4.1
−3.2 −14.9+1.8−1.4
J035020.92+242800.0 03 50 20.92 24 28 00.0 19.1 ± 1.2 −46.5 ± 1.2 5.60 ± 0.85 5 7.2 ± 1.4 −6.7+1.2−1.0 −32.2+7.7
−4.5 −16.3+3.7−2.3
Notes. We provide for each star the DANCe identifier, position, proper motion, radial velocity, source of radial velocity in the literature (seereferences below), parallax derived in this work and the Galactic spatial velocity components.
References. Radial velocity sources: (1) Majewski et al. (2015); (2) Kordopatis et al. (2013); (3) Mermilliod et al. (2009); (4) Gontcharov (2006);(5) White et al. (2007).
Article number, page 12 of 22

P.A.B. Galli et al.: A revised moving cluster distance to the Pleiades open cluster
Table 4. Approximate parallaxes for the sample of 1146 stars.
DANCe α δ µα cos δ µδ π(h:m:s) (◦ ′ ′′) (mas/yr) (mas/yr) (mas)
J032727.94+240458.8 03 27 27.94 24 04 58.8 20.5 ± 2.1 −49.0 ± 2.1 8.1 ± 1.3J032733.90+264340.6 03 27 33.90 26 43 40.6 19.7 ± 6.0 −42.1 ± 5.5 7.1 ± 1.5J032801.57+230442.3 03 28 01.57 23 04 42.3 18.5 ± 0.4 −38.4 ± 0.3 6.5 ± 1.1J032816.07+222732.1 03 28 16.07 22 27 32.1 24.4 ± 2.7 −46.5 ± 2.9 8.1 ± 1.3J032835.63+240043.7 03 28 35.63 24 00 43.7 23.4 ± 2.4 −44.4 ± 2.5 7.7 ± 1.3J032856.70+261831.0 03 28 56.70 26 18 31.0 21.8 ± 1.1 −49.8 ± 1.1 8.3 ± 1.3J032907.68+252143.5 03 29 07.68 25 21 43.5 22.6 ± 2.0 −40.5 ± 2.0 7.1 ± 1.2J032911.26+270952.5 03 29 11.26 27 09 52.6 20.5 ± 2.6 −39.1 ± 2.7 6.7 ± 1.2J032933.69+214237.8 03 29 33.69 21 42 37.8 20.5 ± 3.7 −38.2 ± 4.0 6.7 ± 1.2J032958.76+232218.2 03 29 58.76 23 22 18.2 19.6 ± 2.2 −41.7 ± 2.1 7.1 ± 1.2J033016.90+213525.6 03 30 16.90 21 35 25.6 21.7 ± 4.8 −45.3 ± 4.8 7.7 ± 1.4J033023.16+250223.1 03 30 23.16 25 02 23.1 24.2 ± 1.7 −45.0 ± 1.7 7.8 ± 1.3J033109.77+261113.2 03 31 09.77 26 11 13.2 24.5 ± 2.2 −47.3 ± 2.2 8.1 ± 1.3J033111.29+241356.2 03 31 11.29 24 13 56.2 23.1 ± 1.5 −44.6 ± 1.4 7.7 ± 1.2J033115.95+251519.7 03 31 15.95 25 15 19.7 22.2 ± 0.8 −45.3 ± 0.8 7.7 ± 1.2J033116.63+264303.1 03 31 16.63 26 43 03.1 21.2 ± 2.2 −40.3 ± 2.2 6.9 ± 1.2J033117.94+260143.4 03 31 17.94 26 01 43.4 19.6 ± 2.3 −43.7 ± 2.3 7.3 ± 1.2J033120.70+255733.6 03 31 20.70 25 57 33.6 22.4 ± 2.0 −43.9 ± 2.0 7.5 ± 1.2J033126.72+271936.0 03 31 26.72 27 19 36.0 21.2 ± 3.5 −40.7 ± 3.5 7.0 ± 1.3J033127.36+263009.5 03 31 27.36 26 30 09.5 18.7 ± 2.3 −38.6 ± 2.3 6.5 ± 1.1
Notes. We provide for each star the DANCe identifier, position, proper motion and the parallax obtained in this work. This is a short version ofthe table. The complete version will be available in electronic format.
4 5 6 7 8 9 10 11
0.0
0.1
0.2
0.3
0.4
0.5
0.6
π (mas)
Den
sity
All StarsParallax from Radial Velocity
Fig. 13. Probability density function for the parallaxes obtained fromthe sample of members with known radial velocities (64 stars) and allcluster members (1210 stars).
spatial velocities derived for the 64 stars with known radial ve-locities (see Sect. 5.1). The rms of 0.58 mas that results from theanalysis shown in Figure 12 is added quadratically to the par-allax uncertainties to consider for possible systematic errors thatcould arise from using the spatial velocity of the cluster to deriveindividual kinematic parallaxes.
The mean parallax of the complete sample of cluster mem-bers (1210 stars) is 7.44 ± 0.01 mas (median of 7.46 mas andstandard deviation of 0.42 mas). This result is consistent withour first estimate using radial velocities (see Sect. 5.1), but itis more precise, which comes naturally from the more signif-icant number of stars used to derive the standard error of themean. Figure 13 illustrates the density distribution of paral-laxes obtained for these two samples. We note that the observeddispersion of parallaxes is also smaller for the complete sam-ple. This mostly reflects the spread of the stellar proper motionssince radial velocities are available for only a small fraction ofthe sample. However, we retain the results given in Sect 5.1 asour final solution in this work, because the individual parallaxescomputed from radial velocities, when available, are better con-strained.
6. Discussion
6.1. Parallaxes for different samples of the Pleiades cluster
In Sect. 4 we built two control samples based on the membershipprobability of cluster members and their distance to the clustercenter to guide our CP analysis. Here, we perform a posteri-ori assessment of our results to investigate the distance of thePleiades given by different subsets of our sample of cluster mem-bers selected by the CPSM (see Sect. 4.4). We construct thesesamples by selecting the stars within a given radius from thecluster center and membership probability threshold. Table 5lists the basic properties and Figure 14 illustrates the parallaxdistribution of each sample.
It is apparent from this analysis that the parallax results ob-tained with different samples of cluster members are consistentbetween themselves. In particular, we note that the average par-allaxes listed in Table 5 are all compatible at the 3σ level. Thisgives us more confidence in the distance determination of thePleiades open cluster derived in this paper (see Sect. 5.1) and
Article number, page 13 of 22

6.0 6.5 7.0 7.5 8.0 8.5 9.0
0.0
0.2
0.4
0.6
0.8
1.0
1.2
π (mas)
Den
sity
p > 0.7500p > 0.9545p > 0.9975
6.0 6.5 7.0 7.5 8.0 8.5 9.0
0.0
0.2
0.4
0.6
0.8
1.0
1.2
π (mas)D
ensi
ty
radius < 2degradius < 3degradius < 5deg
Fig. 14. Probability density function for the parallaxes of different samples of cluster members selected from their membership probability (leftpanel) and distance to the cluster center (right panel).
confirms that it is not dependent on the adopted selection crite-ria.
We also observe from Table 5 that the standard deviation ofparallaxes increases with the distance to the cluster center. Fig-ure 15 shows the parallax dispersion as expected from the clusterdepth along the line of sight as a function of the apparent mag-nitudes (from the i-filter) and radius from cluster centre. Thisdiagram provides information on the spatial distribution and seg-regation of stars within the cluster. We note a clear decrease ofthe stellar magnitudes with increasing radius and parallax disper-sion. This confirms the effect of mass segregation in the cluster(using the stellar magnitudes as a proxy for spectral types) asanticipated in previous studies (see e.g. Raboud & Mermilliod1998; Palmer et al. 2014).
Table 5. Kinematic parallax of the Pleiades derived from different sub-groups in our sample of cluster members selected by the CPSM.
Sample Stars Mean ± SEM Median SD(mas) (mas) (mas)
p ≥ 0.7500 1209 7.44 ± 0.01 7.46 0.42p ≥ 0.9545 1146 7.44 ± 0.01 7.46 0.41p ≥ 0.9975 789 7.47 ± 0.01 7.47 0.34radius ≤ 2◦ 809 7.46 ± 0.01 7.46 0.37radius ≤ 3◦ 1024 7.46 ± 0.01 7.46 0.39radius ≤ 5◦ 1189 7.45 ± 0.01 7.46 0.41
Notes. We provide for each sample the number of stars, mean, standarderror of the mean (SEM), median and standard deviation (SD) values.
●
●
●
●
●
●
●
●
●
●
●●
●
●
●
●
●
●
●●●
●
●
●
●
●
●
●
●
●
●
●
●
●
●
●
●
●
●
●
●
●
●
●
●
●
●
●
●
●
●
●
●
●
●
●
●
●●
●
●
●
●
●
●
●
●
●
●
●
●
●
●
●
●
●
●
●
●
●●
●
●
●
●
●●
●
●
●
●
●
●● ●
●
●●
●
●
● ●
●
●
●
●
●●
●
●
●
●
●
●
●
●
●●●
●
●●
●●
●
●
●●
●
●
●
●
●
●
●
●
●
●
●
●
●
●
●●
●
●
●
●
●
●
●
●
●
●
●
●
●
●
●
●
●
●
●
●
●
●
●
●
●
●
●●
●●
●
●
●
●
●●
●
●
●
●
●
●
●●
●●
●
●
●
●●
●
●
●
●
●
●
●●
●
●
●
●
●
●
●
●
●●
●
●
●
●
●
●
●
●
●
●
●
●
●
●
●
●
●●
●
●
●
●
●
●
●●
●
●
●
●
●
●
●
●
●
●
●
●●●
●
●
●
●
●
●
●
●●
●
●
●
●
●
●
●
●
●
●
●
●
●
●
●
●
●
●
●
●
●
●
●
●
●
●●●
●
●
●
●
●
●
●
●
●
●
●
●
●
●
●
●
●
●
●
●●
●
●
●
●
●
●
●
●●
●
●
●
●
●
●●
●●
●
●
●
●
●
●●
●
●
●●
●
●●
●●
●
●
●
●
●
●
●
●●
●●●
●
●
●
●●
●
●●
●
●
●
●
●●●
●
●
●
●
●
●
●
●
●
●
●
●
●
●●
●
●
●
●
●●
●
●
●●
●
●
●
●
●
●
●
●
●
●
●
●
●
●
●
●
●
●
●
●
●
●
●
●
●
●
●●
●
●
●
●
●
●
●
●
●
●
●
●
●●●
●
●
●
●
●
●
●
●
●
●
●
●
●
●
●
●
●
●
●
●
●
●
●
●
●
●
●
●
●
●
●●
●
●
●
●
●
●
●
●●
●
●
●
●
●
●
●●
●
●
●
●
●
●●
●
●
●●
●●
●
●
●●●
●
●
●
●
●
●●
●
●
●
●
●
●
●
●
●
● ●●●
●●
●●
●
●
●
●●
●
●
●●
●
●
●
●
●
●●
●
●
●
●
●
●
●
●
●●
●
●
●
●
●
●
●●
●
●
●
●
●
●
●
●●
●
●
●
●
●●
●
●●
●
●
●
●
●
●
●
●
●
●
●
●
●
●
●
●●●
●
●
●
●
●
●
●●
●
●
●
●
●
●
●
●
●
●
●
●
●
●
● ●
●●
●
●
●●
●●
●
●
●
●
●
●
●●
●
●
●
●
●
●
●
●
● ●
●
●
●
●
●
●●●
●
●●
●
●●
●
●
●
●
●
●
●
●
●
●
●
●
●
●
● ●
● ●
●
●
●
●
●
●
●
●
●
●
●
●●
●
●
●●●
●
●●
●
● ●●
●
●
●
●
●
●
●
●
●
●
●
●
●
●
●
●
●
●
●
●●
●
●
●
●
●●
●
●●
●
●
●
●
●
●
●
●
● ●
●●
●
● ●
●
●
●
●
●
●
●
●●
●
● ●
●
●
●
●
●
●
●
●
●
●
●
●
●
●
●
●
●●
●
●
9
12
15
18
0 1 2 3 4Radius from cluster centre (deg)
mi (
mag
)
7
8
π (mas)
Fig. 15. Apparent magnitudes of cluster members as a function of thedistance to the cluster center and parallaxes for individual stars.
6.2. Comparison with previous parallaxes of individual stars
Here, we compare the parallaxes derived in this work with pre-vious results published in the literature for individual stars. For-tunately, our sample of 1210 cluster members contains 64 stars
Article number, page 14 of 22

P.A.B. Galli et al.: A revised moving cluster distance to the Pleiades open cluster
from various sources in the literature that applied different tech-niques to measure the stellar parallaxes. Their parallaxes arelisted in Table 6. This comparison includes results from Gate-wood et al. (2000); Melis et al. (2014); Mädler et al. (2016),Hipparcos catalog (van Leeuwen 2007) and the first results de-livered by the Gaia satellite. In this context, it is important tomention that the binary system HII 2147 NW+HII 2147 SE fromthe VLBI study of Melis et al. (2014) is not resolved in our sam-ple. To make a better comparison with our results we decidedto work with the weighted average of the proper motions andparallaxes of the two components.
Figure 16 compares our kinematic parallaxes with publishedresults in the literature, and Table 7 presents the mean differ-ence and rms that result from the comparison with each source.This comparison confirms the good accuracy of our results whencompared to the individual parallaxes of twin stars obtained byMädler et al. (2016) and the very precise multi-epoch VLBItrigonometric parallaxes from Melis et al. (2014) given that theseworks are independent. The comparison with the trigonometricparallaxes measured by Gatewood et al. (2000) returned that theparallax for one star is not consistent with our results, althoughwe observe a good agreement with the other two stars in com-mon. In general our results do not reproduce the parallaxes fromthe Hipparcos catalog. But, interestingly, a few stars in our sam-ple with parallaxes between 7.0 mas and 8.0 mas show a rea-sonable agreement with the Hipparcos parallaxes. The questionarises whether the discrepancy of Hipparcos parallaxes indeedapplies to all cluster members as commonly reported in the liter-ature.
Table 7. Comparison of the parallaxes derived in this work with otherstudies in the literature.
Sample Stars Difference rms(mas) (mas)
Melis et al. (2014) 4 0.16 0.26Mädler et al. (2016) 5 0.07 0.28Gatewood et al. (2000) 3 -0.34 1.09Hipparcos (van Leeuwen 2007) 39 -0.69 1.25TGAS (from Gaia DR1) 48 0.16 1.09
Notes. We provide for each comparison sample the number of stars incommon with this work, the mean difference and the rms of the com-parison.
During the submission process of the current manuscript,the first Gaia data release (Gaia DR1) became available pro-viding astrometry and photometry for 1 billion sources brighterthan magnitude 20.7 in the satellite’s white-light photometricband (Gaia Collaboration et al. 2016). Gaia DR1 also includestrigonometric parallaxes and mean proper motions for about 2million stars from the Tycho-Gaia astrometric solution (TGAS).We use this first dataset of trigonometric parallaxes, which hasjust been delivered by the Gaia collaboration, to make a compar-ison with the results obtained from the moving cluster method inthis work. As expected, this is the source of trigonometric paral-laxes with the largest number of stars in common with our sam-ple of Pleiades stars (see Table 7). This gives us the possibilityto perform a more detailed comparison of the results deliveredby these studies.
As illustrated in Figure 16, the TGAS trigonometric paral-laxes are in good agreement with the kinematic parallaxes de-rived from the moving-cluster method and the other independentstudies discussed before. Indeed, this confirms the long-termsuspicion that the Hipparcos parallaxes for Pleiades stars are bi-
ased. However, there are still a few stars in our sample that ex-hibit discrepant proper motions and/or parallaxes with respect tothe TGAS results (at the 3σ level). We summarize their proper-ties in Table 8.
We note from Figure 16 that the kinematic parallaxes de-rived in this work for three stars (HIP 17999, TYC2 1246-808-1,and TYC2 1807-955-1) are not consistent with TGAS. It is clearfrom Table 8 that the proper motions obtained for HIP 17999in both surveys are consistent between each other and also ingood agreement with the observed proper motions for othercluster members (see, for example, Fig. 7). Interestingly, theTGAS trigonometric parallax of π = 3.40 ± 0.73 mas is alsonot consistent with the results reported by the Hipparcos satel-lite: π = 9.83 ± 1.00 mas (ESA 1997) and π = 9.93 ± 0.75 mas(van Leeuwen 2007). So, if we assume that HIP 17999 is indeeda cluster member, as suggested by its proper motion, then theTGAS trigonometric parallax for this target needs further clari-fication. On the other hand, TYC2 1246-808-1 and TYC2 1807-955-1 exhibit different proper motion values in the right ascen-sion component that justifies the different parallax results in bothstudies. We searched for proper motion measurements for thesetwo stars in the UCAC4 (Zacharias et al. 2013) and PPMXL(Roeser et al. 2010) catalogs, and verified that they are moreconsistent with the TGAS results. As discussed in previous pa-pers of the DANCe project (see e.g. Bouy et al. 2013, 2015)the proper motion measurements close to the saturation limit ofthe instruments (that is considered to be the limit of sensitivityof the Tycho-2 catalog) suffer from biases and incompleteness,such that they should be considered with caution. Replacing theDANCe proper motions for these two stars by the TGAS resultswill force them to be rejected in our membership analysis. Weverified that removing TYC2 1246-808-1 and TYC2 1807-955-1from our sample has negligible impact on the results presentedin the previous sections.
Figure 17 compares the DANCe and TGAS proper motionsfor the stars in common. In general there is a good agreementbetween the proper motions in both surveys, but another fourstars (TYC2 1800-1621-1, TYC2 1800-118-1, HIP 17921, andHIP 18559) exhibit proper motion measurements that are notconsistent at the 3σ level (see also Table 8). However, the par-allaxes derived in this work are still compatible with the TGASresults. The shift (or absolute difference) in the observed propermotions is smaller compared, for example, to TYC2 1246-808-1 and TYC2 1807-955-1 to produce a more significant bias inthe parallaxes. In addition, we note that the proper motions forTYC2 1246-617-1 are still compatible within 3σ, because of thelarge error bars of the DANCe measurement, but the differencein the right ascension component is 10.0 mas/yr and it clearlystands out in the comparison shown in Figure 17. The sys-tematic shift (or mean difference) between the two proper mo-tion datasets (after removing the discrepant stars) is -0.2 mas/yrin right ascension and 0.3 mas/yr in declination. The rms ofthe comparison is 1.2 mas/yr in right ascension and 1.1 mas/yrin declination. This represents a good agreement between theDANCe and TGAS proper motions.
After removing the discrepant stars listed in Table 8 fromour sample of stars in common with TGAS, the mean differenceand rms given in Table 7 become 0.12 mas and 0.49 mas, re-spectively. The mean parallax derived from the TGAS results is7.53± 0.19 mas with median of 7.58 mas and standard deviationof 0.38 mas. However, as reported in the paper describing thesummary of the Gaia DR1 properties, there is a systematic un-certainty of about 0.3 mas, which is correlated over small spatialscales and must be added to the parallax uncertainties. Thus, we
Article number, page 15 of 22

Table 6. Parallax results for cluster members in common with other studies.
Kinematic parallax Hipparcos TGAS VLBI project Twin stars Trigonometric parallax(This Work) (van Leeuwen 2007) (Gaia Collaboration et al. 2016) (Melis et al. 2014) (Mädler et al. 2016) (Gatewood et al. 2000)
DANCe Other name π π π π π π(mas) (mas) (mas) (mas) (mas) (mas)
J032856.70+261831.0 HIP 16217 8.3 ± 1.3 8.51 ± 0.92 7.92 ± 0.31J032933.69+214237.8 TYC2 1246-808-1 6.7 ± 1.2 10.72 ± 0.29J033016.90+213525.6 TYC2 1264-617-1 7.7 ± 1.4 8.28 ± 0.46J033115.95+251519.7 HIP 16407 7.7 ± 1.2 6.75 ± 0.85 7.57 ± 0.34J033128.34+214918.9 HIP 16423 8.3 ± 1.3 8.20 ± 1.32 7.81 ± 0.26J033458.66+233148.5 TYC2 1798-596-1 7.2 ± 1.2 7.43 ± 0.36J033724.05+222103.6 TYC2 1247-211-1 7.6 ± 1.2 6.38 ± 0.35J033840.72+223934.6 HIP 17000 7.6 ± 1.2 8.12 ± 0.51J033913.20+215035.7 HIP 17043 7.3 ± 1.2 7.33 ± 0.61 7.18 ± 0.32J033951.16+251141.5 TYC2 1803-1236-1 7.2 ± 1.2 7.27 ± 0.33J034122.97+232913.0 HIP 17225 7.6 ± 1.2 8.10 ± 1.06 7.85 ± 0.24J034204.72+225130.8 HIP 17289 7.3 ± 2.0 7.65 ± 1.50 7.36 ± 0.25 7.53 ± 0.19J034224.00+212824.6 HIP 17316 8.3 ± 1.3 7.27 ± 1.59 7.84 ± 0.23 7.94 ± 0.15J034229.87+200859.9 HIP 17325 7.9 ± 1.3 7.30 ± 1.00 7.75 ± 0.47J034255.11+242935.1 TYC2 1803-478-1 7.3 ± 1.2 7.61 ± 0.31J034341.53+233856.9 HIP 17401 7.4 ± 1.2 7.58 ± 0.90 8.19 ± 0.52J034348.34+250015.7 TYC2 1803-8-1 7.6 ± 1.2 7.39 ± 0.30 7.418 ± 0.025J034425.72+242341.0 TYC2 1803-188-1 8.2 ± 1.3 8.14 ± 0.32J034444.86+204452.8 HIP 17481 7.4 ± 1.2 9.44 ± 1.03 7.61 ± 0.45J034448.21+241722.1 HIP 17489 7.5 ± 1.2 8.65 ± 0.36J034458.92+220156.8 HIP 17511 7.6 ± 1.0 10.67 ± 1.37 6.98 ± 0.29 7.40 ± 0.24J034509.74+245021.3 HIP 17527 7.6 ± 1.6 7.97 ± 0.37J034512.49+242802.2 HIP 17531 7.5 ± 1.2 7.97 ± 0.33J034521.19+234338.8 HII625 7.4 ± 1.2 7.223 ± 0.057J034531.99+211448.1 HIP 17552 8.0 ± 1.3 11.04 ± 0.93 7.79 ± 0.35J034539.90+224140.1 TYC2 1799-1102-1 7.4 ± 1.2 7.80 ± 0.31J034548.82+230849.7 HIP 17572 8.1 ± 1.3 8.24 ± 0.75 7.83 ± 0.77J034549.61+242203.9 HIP 17573 7.5 ± 1.2 8.51 ± 0.28J034554.48+243316.2 HIP 17579 7.6 ± 1.2 8.77 ± 0.54 7.95 ± 0.87J034555.73+274900.8 TYC2 1807-955-1 6.9 ± 1.2 3.63 ± 0.28J034559.14+252354.9 HIP 17583 7.7 ± 1.2 8.00 ± 0.89 7.57 ± 0.34J034602.90+243140.4 HIP 17588 7.3 ± 1.2 8.58 ± 0.56 7.54 ± 0.64 7.40 ± 0.61J034619.57+235654.1 HIP 17608 7.7 ± 1.2 8.58 ± 0.37J034627.28+241518.0 TYC2 1800-1908-1 7.7 ± 1.2 7.74 ± 0.32J034634.20+233726.5 TYC2 1800-1621-1 7.2 ± 1.2 7.81 ± 0.26J034640.25+232951.7 HII1136 7.7 ± 1.2 7.382 ± 0.031J034659.40+243112.4 HIP 17664 7.8 ± 1.3 7.66 ± 0.66 7.58 ± 0.29 7.25 ± 0.58J034704.21+235942.8 TYC2 1800-1579-1 7.4 ± 1.2 7.13 ± 0.32J034720.97+234812.0 HIP 17692 8.3 ± 1.7 8.90 ± 0.77 7.17 ± 0.38J034721.04+240658.6 TYC2 1800-2201-1 7.4 ± 1.2 7.88 ± 0.46J034722.90+225519.6 HIP 17694 8.0 ± 1.3 8.62 ± 0.84 6.62 ± 0.66J034729.45+241718.0 HIP 17704 7.5 ± 1.2 9.42 ± 0.75 7.57 ± 0.40 8.97 ± 0.68J034820.82+232516.5 HIP 17776 7.8 ± 1.2 8.45 ± 0.39J034830.10+242043.9 HIP 17791 7.3 ± 1.2 7.87 ± 1.32J034834.52+232604.9 HII1924 7.2 ± 0.9 6.98 ± 0.78J034906.12+234652.3 HII2147NW+SE 7.2 ± 1.2 7.322 ± 0.021J034909.74+240312.3 HIP 17847 7.5 ± 1.2 8.53 ± 0.39J034911.22+240812.2 HIP 17851 7.9 ± 1.3 8.54 ± 0.31J034911.26+223634.1 TYC2 1800-118-1 7.3 ± 1.2 7.68 ± 0.35J034912.19+235312.5 TYC2 1800-1406-1 7.3 ± 1.2 7.84 ± 0.29J034921.75+242251.4 HIP 17862 7.4 ± 1.2 8.18 ± 0.59 7.22 ± 0.46J034925.98+241451.7 TYC2 1800-901-1 7.5 ± 1.2 7.33 ± 0.31J034928.76+234243.6 HII2311 7.3 ± 0.9 7.52 ± 0.84J034938.18+223200.5 HIP 17892 7.5 ± 1.2 8.30 ± 0.66 7.65 ± 0.38J034940.92+232029.7 TYC2 1800-628-1 7.4 ± 1.2 7.21 ± 0.31J034943.53+234242.7 HIP 17900 7.3 ± 1.2 8.72 ± 0.60 7.88 ± 0.54J034955.07+221438.9 HIP 17921 7.8 ± 1.2 8.86 ± 0.42 7.52 ± 0.53J034956.60+242056.4 TYC2 1800-985-1 7.4 ± 1.2 7.41 ± 0.35J034958.05+235055.3 HIP 17923 7.8 ± 1.2 6.81 ± 0.72 7.24 ± 0.44J035051.45+231944.5 TYC2 1800-586-1 7.7 ± 1.2 7.07 ± 0.28J035052.43+235741.3 HIP 17999 7.6 ± 1.2 9.93 ± 0.75 3.40 ± 0.73J035253.48+244256.6 HIP 18154 7.3 ± 1.2 10.13 ± 1.66J035801.69+204036.5 HIP 18544 8.2 ± 1.3 8.20 ± 1.44 7.70 ± 0.46J035820.90+240452.0 HIP 18559 8.0 ± 1.3 6.71 ± 1.27 7.31 ± 0.43
Notes. We provide for each star the DANCe identifier, an alternative identifier and the parallax given in each study.
Table 8. Comparison of the proper motions and parallaxes with TGAS results from Gaia DR1 for discrepant stars.
DANCe Proper Motions + Kinematic Parallaxes TGAS (Gaia DR1) ResultsDANCe µα cos δ µδ π TYC2/HIP µα cos δ µδ π
(mas/yr) (mas/yr) (mas) (mas/yr) (mas/yr) (mas)J035052.43+235741.3 20.0 ± 0.9 −45.4 ± 0.9 7.6 ± 1.2 HIP 17999 20.092 ± 0.047 −45.355 ± 0.023 3.40 ± 0.73J032933.69+214237.8 20.5 ± 3.7 −38.2 ± 4.0 6.7 ± 1.2 TYC2 1246-808-1 6.794 ± 1.001 −37.726 ± 0.490 10.72 ± 0.29J034555.73+274900.8 15.1 ± 1.9 −43.1 ± 1.9 6.9 ± 1.2 TYC2 1807-955-1 4.019 ± 1.620 −43.033 ± 0.761 3.63 ± 0.28J034634.20+233726.5 16.8 ± 1.0 −43.9 ± 1.0 7.2 ± 1.2 TYC2 1800-1621-1 21.338 ± 0.562 −42.786 ± 0.411 7.81 ± 0.26J034911.26+223634.1 18.6 ± 1.1 −43.2 ± 1.1 7.3 ± 1.2 TYC2 1800-118-1 19.484 ± 0.361 −47.537 ± 0.389 7.68 ± 0.35J034955.07+221438.9 22.5 ± 0.7 −45.4 ± 0.7 7.8 ± 1.2 HIP 17921 20.169 ± 0.030 −44.225 ± 0.015 7.52 ± 0.53J035820.90+240452.0 16.8 ± 0.9 −49.4 ± 0.9 8.0 ± 1.3 HIP 18559 19.021 ± 0.080 −45.223 ± 0.031 7.31 ± 0.43J033016.90+213525.6 21.7 ± 4.8 −45.3 ± 4.8 7.7 ± 1.4 TYC2 1246-617-1 31.661 ± 1.349 −44.733 ± 0.610 8.28 ± 0.46
Notes. We provide for each star the DANCe identifier, proper motions from the DANCe survey, kinematic parallaxes derived from the movingcluster method, Tycho-2/Hipparcos identifiers, proper motions and parallaxes from the TGAS catalog.
Article number, page 16 of 22

P.A.B. Galli et al.: A revised moving cluster distance to the Pleiades open cluster
●
●
●
●
●
●
●
●
●
●
●
●
●
●
●
●
●
●
●
●
●
●
●
●
●
●
●
●
●
●
●
●
●
●
●
●
●
●
●
4 6 8 10 12
46
810
12
πThisWork (mas)
π Lite
ratu
re (
mas
)
●
●
●●
●
●
●
●●
●
●
●
●
●
●
●
●
●
●
●
●
●
●
●●
●●
●
●●
●
●
●
●●
●
●●
● ●
●
●●
●
●
●
●●
●
●
●
●
●
●
●
●
●
●
●
●
●
●
●●
●●
●
●●
●
●
●
●●
●
●●
●
●
●●
●
●
●●
●
●
●●●
●
●
●
●
●
●●●
●●●●
●
● ●
●
●
●●●
●●
●
●
●
●●
●
●
●
●
●
●
●
●
●
●
●●
●
●
●●
●
●
●●●
●
●
●
●
●
●●●
●●●●
●
● ●
●
●
●●●
●●
●
●
●
●●
●
●
●
●
●
●
●
●
●
●
●
Hipparcos (van Leeuwen 2007)TGAS (Gaia DR−1)Melis et al.(2014)Madler et al.(2016)Gatewood et al.(2000)
Fig. 16. Comparison between the kinematic parallaxes derived in this work and parallaxes from the literature (van Leeuwen 2007; Melis et al.2014; Mädler et al. 2016; Gatewood et al. 2000; Gaia Collaboration et al. 2016). The black dashed line indicates the expected distribution forequal results.
●
●
●
●
●
●
●
●
●
●
●
●
●
●
●
●
●
●
●
●
●
●
●
●
●
●
●
●
●
●
●
●
●
●
●
●
●
●
●
●
●
●
●
●
●
●
●
●
0 5 10 15 20 25 30 35
05
1015
2025
3035
µαcosδ (mas/yr) − DANCe
µ αco
sδ (
mas
/yr)
− T
GA
S
●●
●
●●●
●
●● ●
●●
●●
●
●
●
●
●●●
● ●
●
●
●
●
●●
●
●●●
●
●
●
●
●
●●
●●
●
●
●
●
●
●
●●
●
●●●
●
●● ●
●●
●●
●
●
●
●
●●●
● ●
●
●
●
●
●●
●
●●●
●
●
●
●
●
●●
●●
●
●
●
●
●
●
●
●●
●
●
●
●
●●
●
● ●
●
●
●
●
●
●
●
●●
●●
●
●
●●
●
● ●●
●●
●
● ●
●
● ●
●●
●
●●
●
●
●
●
−55 −50 −45 −40 −35 −30
−55
−50
−45
−40
−35
−30
µδ (mas/yr) − DANCe
µ δ (
mas
/yr)
− T
GA
S
●
●●
●
●
●
●
●●
●
● ●
●
●
●
●
●
●
●
●●
●●
●
●
●●
●
● ●●
●●
●
● ●
●
● ●
●●
●
●●
●
●
●
●
●
●●
●
●
●
●
●●
●
● ●
●
●
●
●
●
●
●
●●
●●
●
●
●●
●
● ●●
●●
●
● ●
●
● ●
●●
●
●●
●
●
●
●
Fig. 17. Comparison between the proper motions measurements in right ascension (left panel) and declination (right panel) from the DANCeproject and the TGAS catalog. The gray squares indicate the discrepant stars listed in Table 8.
Article number, page 17 of 22

report the mean parallax of 7.53 ± 0.30 mas as a more conser-vative solution obtained from the TGAS results for the stars incommon with our sample. This is consistent with a distance es-timate of 133±5 pc for the cluster. However, this result is some-what different from the value of 134 ± 6 pc reported in Sect. 5.5of the Gaia DR1 paper (see Gaia Collaboration et al. 2016), be-cause of the different sample of stars used in each case. So, weconclude that the distance to the Pleiades cluster derived fromthe TGAS trigonometric parallaxes is consistent with the dis-tance determination obtained in this work and previous studies.
To summarize, the investigations reported above using par-allaxes derived from independent studies and different samplesof Pleiades stars show that there is a good agreement with theresults obtained in this work, and this make us confident that ourdistance estimate (see Sect. 5.1) is indeed representative of thecluster.
6.3. Revisiting the distance of the Pleiades open cluster
Figure 18 summarizes the distances obtained for the Pleiadescluster in the literature by each method. This is an updated ver-sion of Figure 1 from Melis et al. (2014) to include the morerecent results.
We note that all methods employed so far yield a distance de-termination that is larger than the result obtained by Hipparcos.However, in many cases the error bars do not allow us to unam-biguously reject the Hipparcos result. In this context, it is im-portant to distinguish between the methods that yield distancesto individual cluster members and the ones that can only beused to estimate the average distance of the cluster. Among themethods included in this discussion, the main sequence fitting(i.e., isochrone fitting) is the only method that cannot be used todeliver individual distances to cluster members. Although thismethodology yields mostly smaller errors in the distance deter-mination, the resulting distance modulus is representative of thecluster photometry, but not individual stars. The error on the av-erage distance obtained in this work is sometimes greater com-pared to the other distance determinations of the cluster. Thisreflects the dispersion of individual parallaxes (see Sect. 5.1) inour solution, which is a direct result of the spread in proper mo-tions and radial velocities.
As illustrated in Fig. 18, the average distance for the Pleiadescluster obtained in this work clearly supports the recent VLBIdistance determination for the cluster, based on the very preciseand accurate astrometry by Melis et al. (2014). Our results arealso very consistent with other non-Hipparcos distances reportedby different studies over the last two decades. The weightedmean distance of the non-Hipparcos results listed in Fig. 18 (in-cluding this work) yields a mean distance of 135.0± 0.6 pc (me-dian of 133.8 pc and standard deviation of 2.7 pc). This con-firms the historical discrepancy between the Hipparcos distancedetermination and the results given by other methods (see alsoSect. 1).
Despite our efforts to investigate the distance of the clus-ter, we emphasize that individual distances for Pleiades stars areavailable for only a few cluster members in the literature (asdiscussed in Sect. 1). The results obtained in this work withthe moving cluster method significantly increase the number ofPleiades stars with known individual distances, thus yielding asample that is the largest one to date (even if we only considerthe 64 stars with parallaxes derived from radial velocities).
7. Conclusions
We have implemented a new version of the CPSM based on theMCMC method that exploits parallelism and exhibits good per-formance when dealing with rich clusters, such as the Pleiades,with several hundreds of stars. This new implementation of theCPSM was calibrated on the TW Hydrae association and appliedto the Pleiades open cluster.
We performed extensive investigations to search for the CPposition of the Pleiades cluster using (i) different samples ofstars, (ii) an alternative approach based on the intersection ofgreat circles defined by the stellar proper motions in the sky, and(iii) Monte Carlo simulations. Our analysis allowed us to ac-curately constrain the CP position, infer the velocity dispersion,and confirm 1210 stars as kinematic members of the cluster.
The moving cluster method applied to our sample returnedindividual parallaxes for 64 stars based on their radial veloci-ties, and approximate parallaxes for the remaining 1146 groupmembers from the spatial velocity of the cluster. We emphasizethat this is the largest sample of Pleiades stars with individualdistances to date. Our results are in good agreement with previ-ous parallaxes for individual stars published in the literature (ex-cluding Hipparcos), and demonstrate the good accuracy of thedistance determination obtained in this work. We report in thispaper a distance estimate of 134.4+2.9
−2.8 pc that is consistent withprevious distance determinations of the cluster given by differ-ent methods. In particular, our results support the recent distancedetermination of 136.2±1.2 pc, obtained from the trigonometricparallax method that is based on VLBI multi-epoch observationsand that represents the most precise and direct alternative to mea-sure distances nowadays. Our distance determination is also ingood agreement with the distance of 133 ± 5 pc obtained fromthe TGAS trigonometric parallaxes for the stars in common withour sample.
Our results are not consistent with the Hipparcos distancedetermination of 120.2 ± 1.9 pc for the cluster, and they confirmthe discrepancy of these parallaxes as reported extensively in theliterature. The weighted mean distance of the non-Hipparcosmethods, including the results of this work, is 135.0 ± 0.6 pc,which exceeds the Hipparcos distance by roughly 12%.
This study represents one more step towards better constrain-ing the distance of the Pleiades cluster before the upcoming andvery precise trigonometric parallaxes from the Gaia space mis-sion. Our results are already consistent with the first trigono-metric parallaxes included in the TGAS catalog for the brighteststars in the cluster and they will be useful in the next future fora comparative analysis of other cluster members that were notincluded in the Gaia DR1.Acknowledgements. We thank the referee for constructive comments that helpedus to improve the manuscript. This work was funded by the São Paulo StateScience Foundation (FAPESP). This research has made use of the computingfacilities of the Laboratory of Astroinformatics at IAG/USP (São Paulo, Brazil).It has also made use of the SIMBAD database operated at the CDS (Strasbourg,France).
ReferencesAbad, C., Vieira, K., Bongiovanni, A., Romero, L., & Vicente, B. 2003, A&A,
397, 345An, D., Terndrup, D. M., Pinsonneault, M. H., et al. 2007, ApJ, 655, 233Antoja, T., Figueras, F., Fernández, D., & Torra, J. 2008, A&A, 490, 135Bailer-Jones, C. A. L. 2015, PASP, 127, 994Bertout, C. & Genova, F. 2006, A&A, 460, 499Bevington, P. R. & Robinson, D. K. 2003, Data reduction and error analysis for
the physical sciencesBlaauw, A. 1964, ARA&A, 2, 213
Article number, page 18 of 22

P.A.B. Galli et al.: A revised moving cluster distance to the Pleiades open cluster
Distance (pc)
●
●
●
●
●
●
●
●
●
●
●
●
●
●
●
●
●
●
TGAS
VLBI●Hipparcos
This Work
110 120 130 140 150
Isochrone Fitting
Twin Stars
Orbital Modeling
Trigonometric Parallax
Moving Cluster
Fig. 18. Summary of distance measurements in the literature for the Pleiades open cluster obtained from different methods. The results presentedhere come from: (i) moving cluster - This Work (see Sect. 5.1), Röser & Schilbach (2013), Narayanan & Gould (1999), (ii) trigonometric parallax -van Leeuwen (1999), van Leeuwen (2009), Melis et al. (2014), Soderblom et al. (2005), Gatewood et al. (2000), TGAS (Gaia Collaboration et al.2016) - using result reported in this work (see Sect. 6.2), (iii) orbital modeling - Groenewegen et al. (2007), Southworth et al. (2005), Zwahlenet al. (2004), Munari et al. (2004), Pan et al. (2004), David et al. (2016), (iv) twin stars- Mädler et al. (2016), (v) isochrone fitting - An et al. (2007),Percival et al. (2005), Stello & Nissen (2001), Pinsonneault et al. (1998), Giannuzzi (1995) and Nicolet (1981),
Bouvier, J., Rigaut, F., & Nadeau, D. 1997, A&A, 323, 139Bouy, H., Bertin, E., Moraux, E., et al. 2013, A&A, 554, A101Bouy, H., Bertin, E., Sarro, L. M., et al. 2015, A&A, 577, A148Daemgen, S., Bonavita, M., Jayawardhana, R., Lafrenière, D., & Janson, M.
2015, ApJ, 799, 155David, T. J., Conroy, K. E., Hillenbrand, L. A., et al. 2016, AJ, 151, 112de Bruijne, J. H. J. 1999, MNRAS, 306, 381Duchêne, G., Bouvier, J., & Simon, T. 1999, A&A, 343, 831Ducourant, C., Teixeira, R., Galli, P. A. B., et al. 2014, A&A, 563, A121ESA. 1997, VizieR Online Data Catalog, 1239
Feigelson, E. D. & Jogesh Babu, G. 2012, Modern Statistical Methods for As-tronomy
Fix, E. & Hodges, J. 1951, Discriminatory analysis. Nonparametric discrimina-tion: Consistency properties, Technical Report 4, Project Number 21-49-004,USAF School of Aviation Medicine, Randolph Field, Texas
Foreman-Mackey, D., Hogg, D. W., Lang, D., & Goodman, J. 2013, PASP, 125,306
Gaia Collaboration, Brown, A. G. A., Vallenari, A., et al. 2016, ArXiv e-prints(arXiv:1609.04172)
Galli, P. A. B., Bertout, C., Teixeira, R., & Ducourant, C. 2013, A&A, 558, A77
Article number, page 19 of 22

Galli, P. A. B., Teixeira, R., Ducourant, C., Bertout, C., & Benevides-Soares, P.2012, A&A, 538, A23
Gatewood, G., de Jonge, J. K., & Han, I. 2000, ApJ, 533, 938Ghez, A. M., Neugebauer, G., & Matthews, K. 1993, AJ, 106, 2005Giannuzzi, M. A. 1995, A&A, 293Gontcharov, G. A. 2006, Astronomy Letters, 32, 759Goodman, J. & Weare, J. 2010, Communications in Applied Mathematics and
Computational Science, 5, 65Groenewegen, M. A. T., Decin, L., Salaris, M., & De Cat, P. 2007, A&A, 463,
579Høg, E., Fabricius, C., Makarov, V. V., et al. 2000, A&A, 355, L27Johnson, D. R. H. & Soderblom, D. R. 1987, AJ, 93, 864Kharchenko, N. V., Scholz, R.-D., Piskunov, A. E., Röser, S., & Schilbach, E.
2007, Astronomische Nachrichten, 328, 889Kordopatis, G., Gilmore, G., Steinmetz, M., et al. 2013, AJ, 146, 134Lodieu, N., Deacon, N. R., & Hambly, N. C. 2012, MNRAS, 422, 1495Lodieu, N., Dobbie, P. D., Deacon, N. R., et al. 2007, MNRAS, 380, 712Loinard, L., Torres, R. M., Mioduszewski, A. J., & Rodríguez, L. F. 2008, ApJ,
675, L29Loinard, L., Torres, R. M., Mioduszewski, A. J., et al. 2007, ApJ, 671, 546Mädler, T., Jofré, P., Gilmore, G., et al. 2016, ArXiv e-prints (arXiv:1606.03015)Majewski, S. R., Schiavon, R. P., Frinchaboy, P. M., et al. 2015, ArXiv e-prints
(arXiv:1509.05420)Makarov, V. V. & Robichon, N. 2001, A&A, 368, 873Mamajek, E. E. 2005, ApJ, 634, 1385Mathieu, R. D. 1986, Highlights of Astronomy, 7, 481Melis, C., Reid, M. J., Mioduszewski, A. J., Stauffer, J. R., & Bower, G. C. 2014,
Science, 345, 1029Mermilliod, J.-C., Mayor, M., & Udry, S. 2009, A&A, 498, 949Munari, U., Dallaporta, S., Siviero, A., et al. 2004, A&A, 418, L31Narayanan, V. K. & Gould, A. 1999, ApJ, 523, 328Nicolet, B. 1981, A&A, 104, 185Nidever, D. L., Holtzman, J. A., Allende Prieto, C., et al. 2015, AJ, 150, 173Palmer, M., Arenou, F., Luri, X., & Masana, E. 2014, A&A, 564, A49Pan, X., Shao, M., & Kulkarni, S. R. 2004, Nature, 427, 326Percival, S. M., Salaris, M., & Groenewegen, M. A. T. 2005, A&A, 429, 887Pinsonneault, M. H., Stauffer, J., Soderblom, D. R., King, J. R., & Hanson, R. B.
1998, ApJ, 504, 170Raboud, D. & Mermilliod, J.-C. 1998, A&A, 329, 101Robichon, N., Arenou, F., Mermilliod, J.-C., & Turon, C. 1999, A&A, 345, 471Roeser, S., Demleitner, M., & Schilbach, E. 2010, AJ, 139, 2440Röser, S. & Schilbach, E. 2013, in IAU Symposium, Vol. 289, Advancing the
Physics of Cosmic Distances, ed. R. de Grijs, 66–69Sarro, L. M., Bouy, H., Berihuete, A., et al. 2014, A&A, 563, A45Soderblom, D. R., Nelan, E., Benedict, G. F., et al. 2005, AJ, 129, 1616Southworth, J., Maxted, P. F. L., & Smalley, B. 2005, A&A, 429, 645Stauffer, J. R., Hartmann, L. W., Fazio, G. G., et al. 2007, ApJS, 172, 663Stello, D. & Nissen, P. E. 2001, A&A, 374, 105van Leeuwen, F. 1999, A&A, 341, L71van Leeuwen, F. 2007, A&A, 474, 653van Leeuwen, F. 2009, A&A, 497, 209Venables, W. N. & Ripley, B. D. 2002, Modern Applied Statistics with S. Fourth
Edition (Springer), iSBN 0-387-95457-0Weinberger, A. J., Anglada-Escudé, G., & Boss, A. P. 2013, ApJ, 762, 118Wenger, M., Ochsenbein, F., Egret, D., et al. 2000, A&AS, 143, 9White, R. J., Gabor, J. M., & Hillenbrand, L. A. 2007, AJ, 133, 2524Wilson, R. E. 1953, Carnegie Institute Washington D.C. PublicationZacharias, N., Finch, C. T., Girard, T. M., et al. 2013, AJ, 145, 44Zwahlen, N., North, P., Debernardi, Y., et al. 2004, A&A, 425, L45
Article number, page 20 of 22

P.A.B. Galli et al.: A revised moving cluster distance to the Pleiades open cluster
Appendix A: Great circle intersections
An alternative approach for investigating the CP position of a moving group is based on the idea of representing the stellar propermotions of individual cluster members by great circles on the celestial sphere and calculating their intersections. One would expectthe density of great circle intersections to be higher close to the CP position and its mirror-point (see e.g. Abad et al. 2003; Galliet al. 2012).
As described in Sect. 3 of Galli et al. (2012), the motion of each cluster member over a great circle on the celestial sphere canbe described by the polar vector p that is given by
p = r × r = µα cos δ
− cosα sin δ− sinα sin δ
cos δ
− µδ − sinα
cosα0
, (A.1)
where r = (x, y, z) = (cosα cos δ, sinα cos δ, sin δ) is the position of a star with coordinates (α, δ) and proper motion (µα, µδ). Theintersection of great circles is defined by pi × pj, where i and j denote the polar vectors of two cluster members. Thus, the numberof great circle intersection points is Nint = n(n − 1) for a sample of n stars.
We calculate the great circle intersections for the stars in our control sample 1 (see Sect. 4.1) and display the results in Fig. A.1.We note that the great circle intersections roughly define a line connecting the CP with its mirror point. The two solutions correspondto the regions of highest density of great circle intersections in the diagram. They appear as an extended region (instead of a point),because of the proper motion errors and the velocity dispersion of the cluster, which prevent perfect parallelism of the stellar motionsfrom occurring. It is clear from this analysis that a preferred direction of motion exists and the search for the CP position can belimited to a small area of the sky to optimize the methodology outlined in Section 2.1. Moreover, the diagram itself confirms theexistence of a moving group structure in this sky region, and it can also be used to provide an independent estimate of the CPcoordinates.
Fig. A.1. Diagram of great circle intersections for the stars in control sample 1. The colors indicate the regions with highest density of greatcircle intersections that are close to the CP position (and its mirror point). Each point (black dots) represents the intersection of two great circlesin the sample.
Article number, page 21 of 22

In this context, one simple approach consists of running a k-NN regression. In this method, the k-NN algorithm (Fix & Hodges1951; Venables & Ripley 2002) is used to predict the CP position, which is taken to be the weighted mean of the k nearest neighbors(i.e., great circle intersections). We perform a weighted regression to weight the contribution of the neighbors by the inverse oftheir distance. The resulting CP position obviously depends on the number of nearest neighbors k that is taken into account. Toovercome this problem, we varied the value of k in the range of 100 ≤ k ≤ Nint, and run the k-NN regression to compute theCP position as a function of k. The lower limit for k is chosen to avoid a noisy CP solution that is derived with only a fewneighbors. Figure A.2 shows the distribution of the CP coordinates obtained from the k-NN regression. The average CP position of(αcp, δcp) = (92.2◦,−48.6◦) ± (0.8◦, 0.9◦) is in good agreement with the solution derived from the CPSM.
αcp (deg)
Den
sity
92.4 92.6 92.8 93.0 93.2
0.0
0.5
1.0
1.5
2.0
2.5
3.0
δcp (deg)
Den
sity
−49.8 −49.6 −49.4 −49.2 −49.0
0.0
0.5
1.0
1.5
2.0
2.5
Fig. A.2. Histogram of the CP coordinates derived from the k-NN analysis of the great circle intersections using different number of neighbors(i.e., values of k). The red solid line indicates the kernel density estimator.
The methodology described in this section, which is based on a k-NN regression analysis of the great circle intersections providesan interesting tool to detect moving group structures in stellar catalogs and to estimate their CP coordinates. It is used to supportand confirm our first CP solution obtained for a control sample of the Pleiades cluster. However, we emphasize that the CP positionderived directly from the CPSM is likely to be more accurate, because it takes into account the proper motion errors and the velocitydispersion of the cluster.
Article number, page 22 of 22
Related Documents