Renewable and Sustainable Energy Reviews 129 (2020) 109917 Available online 5 June 2020 1364-0321/© 2020 The Authors. Published by Elsevier Ltd. This is an open access article under the CC BY-NC-ND license (http://creativecommons.org/licenses/by-nc-nd/4.0/). Classification and challenges of bottom-up energy system models - A review Matteo Giacomo Prina a, b, * , Giampaolo Manzolini b , David Moser a , Benedetto Nastasi c, d , Wolfram Sparber a a Institute for Renewable Energy, EURAC Research, Viale Druso 1, I-39100, Bolzano, Italy b Dipartimento di Energia, Politecnico di Milano, Via Lambruschini, 4, 20156, Milano, MI, Italy c Department of Planning, Design and Technology of Architecture, Sapienza University of Rome, Via Flaminia 72, 00196, Rome, Italy d Department of Architectural Engineering & Technology, TU Delft University of Technology, Julianalaan 139, 2628BX, Delft, the Netherlands A R T I C L E INFO Keywords: Classification Challenges Energy planning Energy system modelling Bottom-up ABSTRACT This paper reviews the classification schemes used for bottom-up energy system modelling and proposes a novel one as re-elaboration of the previous schemes. Moreover, this paper identifies that the main challenges of this research field rotate around the concept of resolution. A matrix of challenges in which four main fields are identified: resolution in time, in space, in techno-economic detail and in sector-coupling. These main fields are divided into different levels of resolution: low, medium and high. The use of a low resolution introduces errors in the modelling as demonstrated by different studies. Several existing bottom-up energy system models are reviewed in order to classify them according to the proposed approach and map them through the proposed matrix. 13 different models are analyzed in the category of bottom-up short-term and 9 as bottom-up long-term energy system models. The following mapping shows how several models reach a high level of resolution in one or more than one area. However, the ultimate challenge is the simultaneous achievement of high resolution in all these fields. The literature review has shown how this final aim is not reached by any model at the current stage and it highlights the gap and weaknesses of this branch of research and the direction versus which is important to work to improve this type of modelling. 1. Introduction The mitigation of climate change through the reduction of anthro- pogenic Green House Gas (GHG) emissions [1,2] is one of the greatest challenges of the international community. The energy sector divided into electricity, transport, heat and industry sectors covers almost 75% of the overall quantity [3]. With the final aim to mitigate CO 2 emissions and strengthen energy security, a large number of regions and nations have approved strict future energy targets characterized by high pene- tration of renewables and energy efficiency. At European level, the “2020 climate and energy package” was approved in 2007 [4], with the aim to reduce GHG emission by 20% (with respect to 1990), ensuring 20% of final energy consumption satisfied with RES and 20% annual energy savings (with respect to the Business-As-Usual, BAU, scenario). In 2014, more ambitious targets were set to be achieved before 2030 with the “2030 climate and energy framework” [5]: 40% cut in GHG emissions (with respect to 1990), 27% share of renewable energy in the total final consumption and 27% energy efficiency improvement (with respect to the BAU scenario). In the United States, California with the Clean Energy and Pollution Reduction Act – SB 350 [6] signed in 2015 had the aim to reduce GHG to 40% below 1990 levels by 2030 and to 80% below 1990 levels by 2050. With the executive order B-55-18 [7] signed in 2018, California aims at achieving carbon neutrality no later than 2045. Another example is the case of New Zealand who signed in 2019 the Climate Change Response (Zero Carbon) Amendment Act [8] in which set the target of net zero emissions of GHG by 2050. Energy system modelling and energy plan- ning are, hence, relevant research disciplines in the evaluation of future energy systems and in the process of supporting policy-makers in the definition of the energy targets and corresponding best energy strategies. Energy planning and scenarios generation have two main goals: to provide guidance and material for discussion about future energy sys- tems and to support decision-makers in developing short and long-term energy strategies [9]. An added value is certainly transparency where not only assumptions, input data and model outputs should be readable but, also the numerical approach implemented in the model. * Corresponding author. Institute for Renewable Energy, EURAC Research, Viale Druso 1, I-39100, Bolzano, Italy. E-mail address: [email protected] (M.G. Prina). Contents lists available at ScienceDirect Renewable and Sustainable Energy Reviews journal homepage: http://www.elsevier.com/locate/rser https://doi.org/10.1016/j.rser.2020.109917 Received 27 September 2019; Received in revised form 6 May 2020; Accepted 17 May 2020

Welcome message from author
This document is posted to help you gain knowledge. Please leave a comment to let me know what you think about it! Share it to your friends and learn new things together.
Transcript

Renewable and Sustainable Energy Reviews 129 (2020) 109917
Available online 5 June 20201364-0321/© 2020 The Authors. Published by Elsevier Ltd. This is an open access article under the CC BY-NC-ND license(http://creativecommons.org/licenses/by-nc-nd/4.0/).
Classification and challenges of bottom-up energy system models - A review
Matteo Giacomo Prina a,b,*, Giampaolo Manzolini b, David Moser a, Benedetto Nastasi c,d, Wolfram Sparber a
a Institute for Renewable Energy, EURAC Research, Viale Druso 1, I-39100, Bolzano, Italy b Dipartimento di Energia, Politecnico di Milano, Via Lambruschini, 4, 20156, Milano, MI, Italy c Department of Planning, Design and Technology of Architecture, Sapienza University of Rome, Via Flaminia 72, 00196, Rome, Italy d Department of Architectural Engineering & Technology, TU Delft University of Technology, Julianalaan 139, 2628BX, Delft, the Netherlands
A R T I C L E I N F O
Keywords: Classification Challenges Energy planning Energy system modelling Bottom-up
A B S T R A C T
This paper reviews the classification schemes used for bottom-up energy system modelling and proposes a novel one as re-elaboration of the previous schemes. Moreover, this paper identifies that the main challenges of this research field rotate around the concept of resolution. A matrix of challenges in which four main fields are identified: resolution in time, in space, in techno-economic detail and in sector-coupling. These main fields are divided into different levels of resolution: low, medium and high. The use of a low resolution introduces errors in the modelling as demonstrated by different studies. Several existing bottom-up energy system models are reviewed in order to classify them according to the proposed approach and map them through the proposed matrix. 13 different models are analyzed in the category of bottom-up short-term and 9 as bottom-up long-term energy system models. The following mapping shows how several models reach a high level of resolution in one or more than one area. However, the ultimate challenge is the simultaneous achievement of high resolution in all these fields. The literature review has shown how this final aim is not reached by any model at the current stage and it highlights the gap and weaknesses of this branch of research and the direction versus which is important to work to improve this type of modelling.
1. Introduction
The mitigation of climate change through the reduction of anthro-pogenic Green House Gas (GHG) emissions [1,2] is one of the greatest challenges of the international community. The energy sector divided into electricity, transport, heat and industry sectors covers almost 75% of the overall quantity [3]. With the final aim to mitigate CO2 emissions and strengthen energy security, a large number of regions and nations have approved strict future energy targets characterized by high pene-tration of renewables and energy efficiency.
At European level, the “2020 climate and energy package” was approved in 2007 [4], with the aim to reduce GHG emission by 20% (with respect to 1990), ensuring 20% of final energy consumption satisfied with RES and 20% annual energy savings (with respect to the Business-As-Usual, BAU, scenario). In 2014, more ambitious targets were set to be achieved before 2030 with the “2030 climate and energy framework” [5]: 40% cut in GHG emissions (with respect to 1990), 27% share of renewable energy in the total final consumption and 27%
energy efficiency improvement (with respect to the BAU scenario). In the United States, California with the Clean Energy and Pollution Reduction Act – SB 350 [6] signed in 2015 had the aim to reduce GHG to 40% below 1990 levels by 2030 and to 80% below 1990 levels by 2050. With the executive order B-55-18 [7] signed in 2018, California aims at achieving carbon neutrality no later than 2045. Another example is the case of New Zealand who signed in 2019 the Climate Change Response (Zero Carbon) Amendment Act [8] in which set the target of net zero emissions of GHG by 2050. Energy system modelling and energy plan-ning are, hence, relevant research disciplines in the evaluation of future energy systems and in the process of supporting policy-makers in the definition of the energy targets and corresponding best energy strategies.
Energy planning and scenarios generation have two main goals: to provide guidance and material for discussion about future energy sys-tems and to support decision-makers in developing short and long-term energy strategies [9]. An added value is certainly transparency where not only assumptions, input data and model outputs should be readable but, also the numerical approach implemented in the model.
* Corresponding author. Institute for Renewable Energy, EURAC Research, Viale Druso 1, I-39100, Bolzano, Italy. E-mail address: [email protected] (M.G. Prina).
Contents lists available at ScienceDirect
Renewable and Sustainable Energy Reviews
journal homepage: http://www.elsevier.com/locate/rser
https://doi.org/10.1016/j.rser.2020.109917 Received 27 September 2019; Received in revised form 6 May 2020; Accepted 17 May 2020
Renewable and Sustainable Energy Reviews 129 (2020) 109917
2
Over the last 20 years, the number of energy system models has significantly increased thanks to the increased computational capabil-ities. As a consequence of the high number of bottom-up energy system models, it is important to carry out a literature review analysis to identify the most suitable model for the scope and also to avoid the duplication of already existing models. A classification scheme can support the identification of differences and similarities of the energy system models, hence assisting the process of selection of the proper one [10].
Numerous classifications of energy system models exist. Grubb et al. [11] in 1993 proposed a first classification of energy system models distinguishing between top-down and bottom-up approach, short-term and long-term and analyzing the sectoral coverage. Van Beeck [10] in 1999 introduced a classification based on the identification of different features such as general and specific purpose, analytical approach, model structure, mathematical approach, underlying methodology, geographical coverage, sectoral coverage and time horizon. Hourcade et al. [12] in 2006 proposed a classification of energy models concen-trating on the difference between bottom-up and top-down models and the need for hybrid integrated models. Tomaschek [13] in his PhD dissertation of 2013 introduced an elaboration of Van Beeck study. He proposed a classification of energy system models with a circular structure placing on the same level of importance the main character-istics introduced by Van Beeck. Cao et al. [9] in 2016 starting from the approach of Tomaschek elaborated a checklist of transparency criteria for model-based scenario studies.
In addition, there are several studies which deal with reviews of energy system models proposing additional characteristics to classify them. In fact, these studies introduce further practical aspects to facili-tate the choice of the model for researchers and planners. Worrell et al. [14] in 2004 differentiated bottom-up energy system models based on the technology representation. This feature allows the distinction be-tween explicit technology representation when the model describes actual characteristics of individual technologies and stylistic technology representation when the model catches the characteristics of a group of technologies. Jebaraj et al. [15] in 2006 presented a review of energy models identifying different categories of models: energy supply-demand models, energy planning models, optimization models, forecasting models, energy models based on neural networks and emission reduction models. Mundaca et al. [16] in 2010 proposed a review of bottom-up energy system models focusing on how these models include and implement energy efficiency of the household
sector. Connolly et al. [17] in 2010 produced a study comparing 37 different models through a survey process to the model developers. Their analysis highlighted additional features more useful from a prac-tical prospective such as number of downloads, specific focus, renewable-energy penetrations simulated (100% electricity simulated vs. 100% renewable energy-system). Hall et al. [18] in 2016 analyzed 22 different energy system models utilized in the United Kingdom. Lund et al. [19] in 2017 investigated the diversity of energy system models subdividing them based on the theoretical background. They examined the differences between simulation and optimization approaches at different levels: the mathematical approach, the role of politics and the role of modelers and planners. Lyden et al. [20] in 2018 presented a comparison of 13 different tools for community scale based on charac-teristics of input data, supply technologies, design optimization, out-puts, demand side management, storage and practical considerations. Ringkjøb et al. [21] in 2018 analyzed and compared 75 different energy and electricity system models with the final aim to help modellers in the choice of the right model for their purposes.
Pfenninger et al. [22] in 2014 presented the challenges of the energy system modelling research field: resolution in time and space, uncer-tainty and transparency, the integration of the increasing complexity of the energy sector, and the integration of social behavioural economics.
In this paper, a new re-elaboration of the classification and chal-lenges of energy system models is suggested as a result of the past pro-posed schemes and the characteristics of newly released models. If compared to the existing presented literature, this paper aims at the achievement of a more detailed and structured approach on classifica-tion and challenges of bottom-up energy system models. The challenges matrix presented in this paper in section 3 can serve as standardized and shared approach to compare different energy system models and in-crease robustness of findings. Moreover, this matrix tool allows an improvement of the transparency in the comparison of the characteris-tics of different energy system models towards the challenges of the research field. These are all relevant elements to identify the common findings and to provide robust evidence to the developed scenarios and transition pathways. This is a strong requirement to be able to better support energy and climate policy at regional and national level. Thus, the scope of the paper is not the presentation and comparison of a high number of different models, but the identification of a classification scheme and challenges in this research field. It is important to point out that this paper will focus only on bottom-up approach as it will be clear in the next section.
The paper is structured as follows: in section 2 the proposed classi-fication scheme of bottom-up energy system models is presented and applied to 22 different models, in section 3 the challenges of bottom-up energy system modelling are identified and organized within a matrix. Moreover, the 22 introduced models are mapped following this matrix criteria. The last section deals with the conclusions of the study.
2. Energy system models classification
In order to classify energy system models, a first distinction that can be made regards the analytical approach: Top-down versus Bottom-up models [23]. Top-down models are typically adopted by economists and public administrations. These models focus on connecting the en-ergy system to other macro-economic sectors. They are usually charac-terized by a simplified representation of the components and complexity of the energy system and are therefore not appropriate to identify sector-specific policies. Their application field is the evaluation of the impacts of energy and climate policies on socio-economic sectors as social growth, public welfare, employment etc.
An opposite approach is provided by bottom-up models which analyze in detail the components and interconnections between the different energy sectors. These detailed models from a techno-economic point of view allow the user to compare the impact of different tech-nologies on the energy system and to evaluate the best future
Nomenclature
GHG Green House gas BAU Business-As-Usual GDP Gross Domestic Product BSAM Business Strategy Assessment Model IAMs Integrated Assessment Models NEMS National Energy Modelling System VRES Variable renewable energy sources DSM Demand side management SO Single-objective MO Multi-objective LP Linear programming MILP Mixed integer linear programming DLR German Aerospace Center KTH Royal Institute of Technology IIASA Applied Systems Analysis DTU Technical University of Denmark UC Unit commitment SES Smart Energy System
M.G. Prina et al.
Renewable and Sustainable Energy Reviews 129 (2020) 109917
3
alternatives to lower GHG emissions for the achievements of the energy targets. However, the bottom-up approach does not take into account the connections between the energy system and the macro-economic sectors, thus neglecting the impacts on these sectors.
A category of top-down energy system models is identified by input- output methods. This type of models uses a matrix of input/output co-efficients to analyze the macroeconomic impacts of a certain policy in the energy sector. An example is the approach of Oliveira et al. [24] who developed an input-output model to support policy makers through the study of the interactions between the energy sector and the whole economy of Portugal. Another category is econometric models. This approach relies on empirical data to test economic relationships be-tween the energy sector and macro-economic indicators such as Gross Domestic Product (GDP), employment or gross value added. An example of this type is the E3ME model [25,26] developed by Cambridge Econometrics [27]. Another type of these models is the computable general equilibrium approach which simulates long-term scenarios with the assumption that the markets are at perfect equilibrium. GEM-E3 model [28] adopts this approach and simulates the correlations be-tween the economy, the energy sector and the environment. System dynamics is another technique that is used for top-down energy system models. It allows the evaluation of the correlations between energy sector and the whole economy through the use of feedback loops mathematically formulated through non-linear differential equations. An example of this approach is provided by Gravelsins et al. [29] who used system dynamics applied to energy transition combining techno-economic and socio-technical aspects. Another type of top-down energy system model is agent-based approach. Papadelis et al. [30] with this approach realized the Business Strategy Assessment Model (BSAM) to evaluate the dynamics of an energy-economic system focusing on the impact of different policies on the decision of private actors. Nikas et al. [31] used the BSAM model to inspect the role of prosumers in the resi-dential sector. Sachs et al. [32] applied an agent-based model to assess energy-related investment decisions in the buildings sector.
Recently, there have been some attempts to build energy models that could benefit from the advantages of both the mentioned approaches. Hybrid models are realized by combining top-down macro-economic models with at least one bottom-up model for each final sector. This can be done either by manually transferring the data and the parameters from one model to the other (soft-linking) or using automatic routines to do the same (hard-linking). Greening et al. [33] proposed a review of hybrid energy system models focusing on the integration of the macro-economic sectors into bottom-up energy system models.
An example of hybrid models is identified by Integrated Assessment Models (IAMs) which are characterized by close loops between the following modules: climate, impacts, economy and energy. Nikas et al. [34] presented a review of these models classifying them based on system coverage, mathematical structure, model perspective, geographic coverage, forecasting period, endogenous/exogenous tech-nological change, type of uncertainty treatment and factors. Doukas et al. [35] proposed a review of techniques such as portfolio analysis, multiple criteria decision making and fuzzy cognitive maps which allow IAMs to reduce the gap towards the correct assessment of specific as-pects in climate policy.
Economic-engineering models are also another example of hybrid models, which combine macro-economic principles with technology details. Gabriel et al. [36] presented the National Energy Modelling System (NEMS) which is used to calculate equilibrium between fuel prices and quantities in the United States energy system. Antonsiewicz et al. [37] coupled a bottom-up energy system model to inspect the optimal energy mix and a dynamic stochastic general equilibrium macro-economic model to assess the socio-economic impacts. Keramidas et al. [38] with the POLES-JRC model created an approach to integrate the energy sector with macro-economic evaluation and climate policy assessment. PRIMES model [39] is a general equilibrium model which integrates techno-economic details and constraints in economic
modelling of behaviors. Moving to bottom-up models, a first distinction is made depending
on the time horizon chosen. This feature subdivides these models into static and long-term approaches [40]. Static or short-term models use a short temporal horizon and usually analyze the energy system config-uration and its future alternatives in a target year. Long-term models operate on a longer temporal horizon inspecting the evolution of the energy system until the target year. This implies including additional variables such as life-cycle, residual capacity, plant decommissioning and commissioning within the transition. To conclude, Static models differ from long-term models in the way the transition is endogenously modeled. Long-term approach endogenously models the entire transi-tion while static approach concentrates on the final year.
Another distinction within long-term models is given by the approach to the optimization problem [41] leading to perfect-foresight approach or myopic approach. Perfect-foresight approach is based on the assumption that the decision-makers have complete knowledge on the whole transition. Thus, they have full information on cost trends, consumption variation, decay of performance of certain technologies, future decommissioning of power plants, future improvement of the efficiencies of certain technologies, etc.. This approach is realized through the formulation of a unique optimization problem analyzing all the time-periods simultaneously. These models can also be classified as intertemporal models. The myopic approach is instead characterized by the time-horizon divided into a sequence of optimization problems where the output of the prior serves as input for the following. For this reason, these models can also be called recursive. The decider has not thus a complete information on the whole horizon, leading to decisions in a certain step sub-optimal with regards of what happens in the following steps. This last approach is more realistic as in reality the decisions are taken without a complete information about the future changes. However, the decider could be misguided in the first time-steps due to its limited knowledge and may not be capable to repair the early wrong decisions in the following steps.
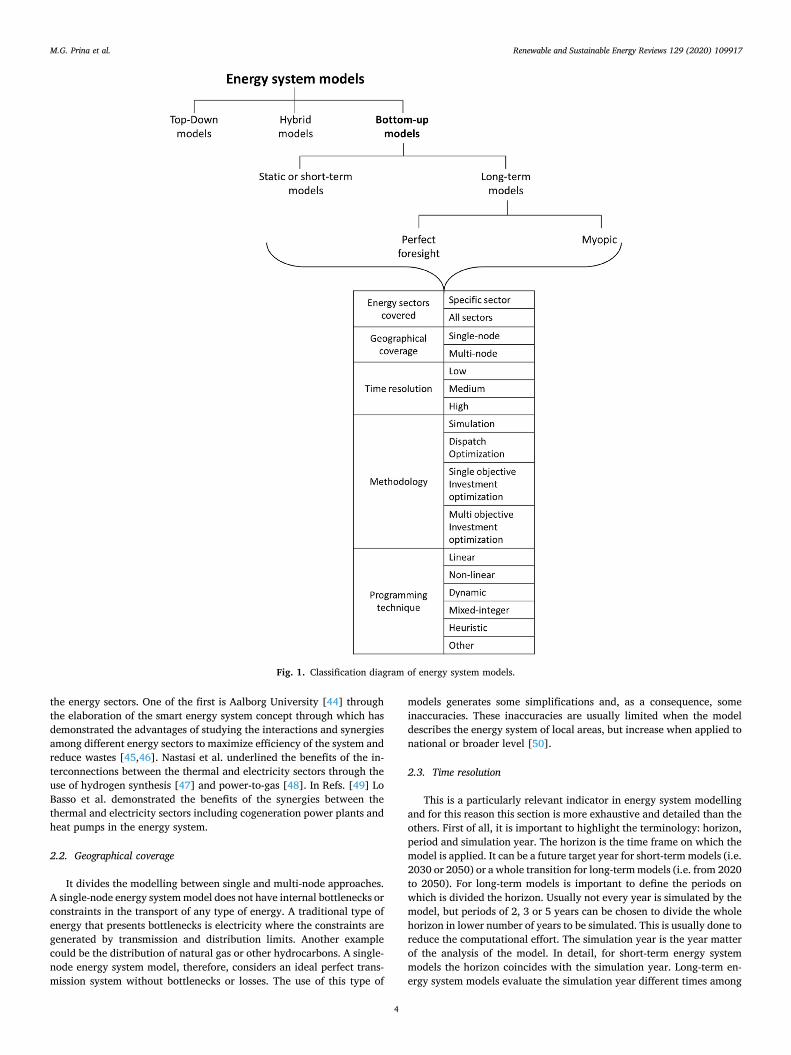
Fig. 1 shows the proposed classification of energy system models. Bottom/up energy system models are divided into static and long-term. Long-term ones are then split in perfect-foresight and myopic ap-proaches. Bottom-up short-term, long-term perfect foresight and long- term myopic models can be subdivided further thanks to additional features and indicators. These features appear also in the previous studies showed above on energy system models classification. Here all these characteristics are aggregated, and some additional and specific elements are provided in order to better classify the models on quanti-tative criteria. Their full explanation and definition follow.
2.1. Energy sectors covered
A model can concentrate on one specific sector of the energy system or include all sectors. Thus, a first indicator is represented by the energy sectors covered. In order to define energy sectors in energy system modelling is important to distinguish between the commodities such as electricity, heat, hydrogen, fuels and the demand sectors such as building, industry and transport sectors [21]. Commercial and residen-tial buildings served by individual heating systems or district heating networks are included in the building sector. Agriculture is usually contained in the industry sector. However, different studies refer to the concept of sector-coupling as the linking between the electricity, heat-ing, industry and transport sectors. An example of this approach is the study of Victoria et al. [42] who analyzed the role of storage in the decarbonization of the sector-coupled European energy system. Brown et al. [43] presented an open energy system model for Europe studying the benefits of flexibility options provided by sector-coupling technol-ogies such as battery electric vehicles, power-to-gas and thermal storage. Therefore, in this paper, this latter approach in the subdivision of the energy sectors is used to refer to the concept of sector-coupling.
Several different studies analyzed the advantages of the coupling of
M.G. Prina et al.
Renewable and Sustainable Energy Reviews 129 (2020) 109917
4
the energy sectors. One of the first is Aalborg University [44] through the elaboration of the smart energy system concept through which has demonstrated the advantages of studying the interactions and synergies among different energy sectors to maximize efficiency of the system and reduce wastes [45,46]. Nastasi et al. underlined the benefits of the in-terconnections between the thermal and electricity sectors through the use of hydrogen synthesis [47] and power-to-gas [48]. In Refs. [49] Lo Basso et al. demonstrated the benefits of the synergies between the thermal and electricity sectors including cogeneration power plants and heat pumps in the energy system.
2.2. Geographical coverage
It divides the modelling between single and multi-node approaches. A single-node energy system model does not have internal bottlenecks or constraints in the transport of any type of energy. A traditional type of energy that presents bottlenecks is electricity where the constraints are generated by transmission and distribution limits. Another example could be the distribution of natural gas or other hydrocarbons. A single- node energy system model, therefore, considers an ideal perfect trans-mission system without bottlenecks or losses. The use of this type of
models generates some simplifications and, as a consequence, some inaccuracies. These inaccuracies are usually limited when the model describes the energy system of local areas, but increase when applied to national or broader level [50].
2.3. Time resolution
This is a particularly relevant indicator in energy system modelling and for this reason this section is more exhaustive and detailed than the others. First of all, it is important to highlight the terminology: horizon, period and simulation year. The horizon is the time frame on which the model is applied. It can be a future target year for short-term models (i.e. 2030 or 2050) or a whole transition for long-term models (i.e. from 2020 to 2050). For long-term models is important to define the periods on which is divided the horizon. Usually not every year is simulated by the model, but periods of 2, 3 or 5 years can be chosen to divide the whole horizon in lower number of years to be simulated. This is usually done to reduce the computational effort. The simulation year is the year matter of the analysis of the model. In detail, for short-term energy system models the horizon coincides with the simulation year. Long-term en-ergy system models evaluate the simulation year different times among
Fig. 1. Classification diagram of energy system models.
M.G. Prina et al.

Renewable and Sustainable Energy Reviews 129 (2020) 109917
5
the horizon and depending on the choice of the periods. The model must match the energy demand and supply in each time-step in which is divided the simulation year. The time-step which divides the simulation year defines the time resolution of the model.
The simulation year is divided in time-steps. In this regard, it is important to introduce the time-slice concept. A time-slice is a stylized temporal representation and it is defined as the number of time-steps in which is divided the simulation year [51]. Bottom-up energy system models have traditionally adopted a low number of time-slices to depict the simulation year. Usually, a single time slice per year or a small set of seasonal and daily time slices are considered. As proof of this, different studies using TIMES adopt the 12 time-slices approach (4 seasonal and 3 diurnal: day, night, peak): TIMES-Canada [52], TIMES-Sweden [53] and the JRC-EU-TIMES [54]. Astudillo et al. [55] applied TIMES with 16 time-slices per year (4 seasonal and 4 diurnal: day, night, morning peak and evening peak). Balyk et al. [56] presented TIMES-DK with 32 time-slices per year (4 seasonal, 2 weekly and 4 diurnal). Another example is GENeSYS-MOD [57] which is an application of the open-source energy modelling system OSeMOSYS with 16 time-slices per year (4 seasonal, 2 weekly and 2 diurnal). This is mainly driven by two main reasons: i) increasing the number of time-steps or time-slices increase the computational burden and ii) in the past, the energy sys-tem was mostly based on fossil fuels or nuclear power plants which production is mainly constant and not affected by fluctuations depending on the weather.
The spread of renewable energy sources has brought an additional level of complexity. The introduction of variable renewable energy sources (VRES), storage, flexibility options and demand side manage-ment (DSM) requires modelling techniques with higher time resolution. However, increasing the time resolution enlarges the computational cost. Hence a trade-off is necessary between increasing time resolution to depict more accurate VRES generation, storage options, DSM and lowering it to reduce computational time.
Different authors have inspected the impact of time resolution. Deane et al. [58] have studied the advantages of soft-linking a power systems model with higher time resolution to an energy systems model (i.e. a dispatch model, no investment optimization is considered). The results showed that an energy systems model adopting a low time res-olution could underestimate VRES curtailments and overestimate the use of baseload plant.
Haydt et al. [59] analyzed the relevance of time resolution in mid/long-term energy planning models confirming the importance of time resolution not to overestimate the diffusion of VRES. They identi-fied and compared three methods to balance demand and generation: the integral, the semi-dynamic and the dynamic method. The first is characterized by a low number of time-slices. The semi-dynamic is characterized by an intermediate number of time-slices selected by using representative days approach. For example, in their paper they used TIMES model with 288 time periods per year (three days per season and 24 h per day). The dynamic method considers each hour of the year. Important differences appeared in the final results highlighting the importance of time resolution not to overestimate renewable resource in the planning of an energy system.
Poncelet et al. [60] studied how temporal and techno-economic operational detail simplifications impact on the final results of bottom-up long-term energy system models. They demonstrated how improving temporal resolution should be prioritized compared to techno-economic operational detail. In addition, they also highlighted how the selection of the time-slices is very relevant. They demonstrated how some methods to choose time-slices such as the representative days’ method or the alternative version of the integral method can reduce the error introduced by the classical 12 time-slices approach saving computational time compared to the hourly time-step.
From these studies, it is possible to deduce a classification for time resolution. Table 1 summarizes the different levels of time resolution with the corresponding categories in terms of the number of time-slices
and the approach used for their selection. Following the classification introduced by Haydt et al. [59], the
lowest time resolution is identified by a low number of time-slices and it can be defined as integral method. Particularly used is the 12 time-slices approach, corresponding to three time-slices per season. This case, as shown in the study of Poncelet et al. [60], presents a large generation mix error compared to the hourly time resolution approach especially when facing high penetration of renewables. The opposite extreme case, or as defined by Haydt et al. [59] the dynamic method, is the high time resolution that is represented by the use of an hourly time-step. The intermediate situation, or semi-dynamic method for Haydt et al. [59], adopts alternative approaches for selecting the time-slices that produce a lower generation mix error and at the same time allows to reduce the computational cost. An example presented by Poncelet et al. is given by the representative days and by the alternative version of the integral method.
2.4. Methodology
Another element that further divides the energy system model is the adopted methodology. This allows for the classification of the models in simulation, dispatch optimization and investment optimization models. A simulation model allows the testing of a certain configuration of the energy system and obtains the final dispatch together with indicators such as total annual costs, annual CO2 emissions, primary energy savings or excess electricity production. The dispatch carried out by simulation models is usually driven by a simple heuristic technique. This method does not guarantee to find the optimal dispatch but has the advantage to reach a sub-optimal solution in a very short computational time. A method that performs dispatch optimization instead is usually based on linear programming and realizes the dispatch following a merit-order logic. Investment optimization models deal with not only the annual dispatch of the energy system but also optimize the investments on ca-pacity expansion. These types of models can be further subdivided in single-objective (SO) and multi-objective (MO) optimization approach [61].
2.5. Programming technique
The last aspect that allows differentiation in energy system models is the programming technique or mathematical approach. Linear pro-gramming (LP), mixed integer linear programming (MILP), dynamic programming and heuristic technique are the most adopted. LP is a method to find the arrangements of activities which maximize or minimize a certain objective subjected to some constraints [62]. MILP is an extension of linear programming with a higher level of detail [63]. Some or all variables are restricted to be integers and thus Yes/No or (0/1) decisions are allowed. Dynamic programming is adopted to ach-ieve an optimal growth path through the subdivision of the problem in sub-problems for which an optimal solution can be easily achieved [64]. Some other models use a heuristic technique [65] that as mentioned allows solving the problem in a shorter computational time. Examples of models that are based on this technique are those where the dispatch is achieved thanks to predefined priorities between the different sources.
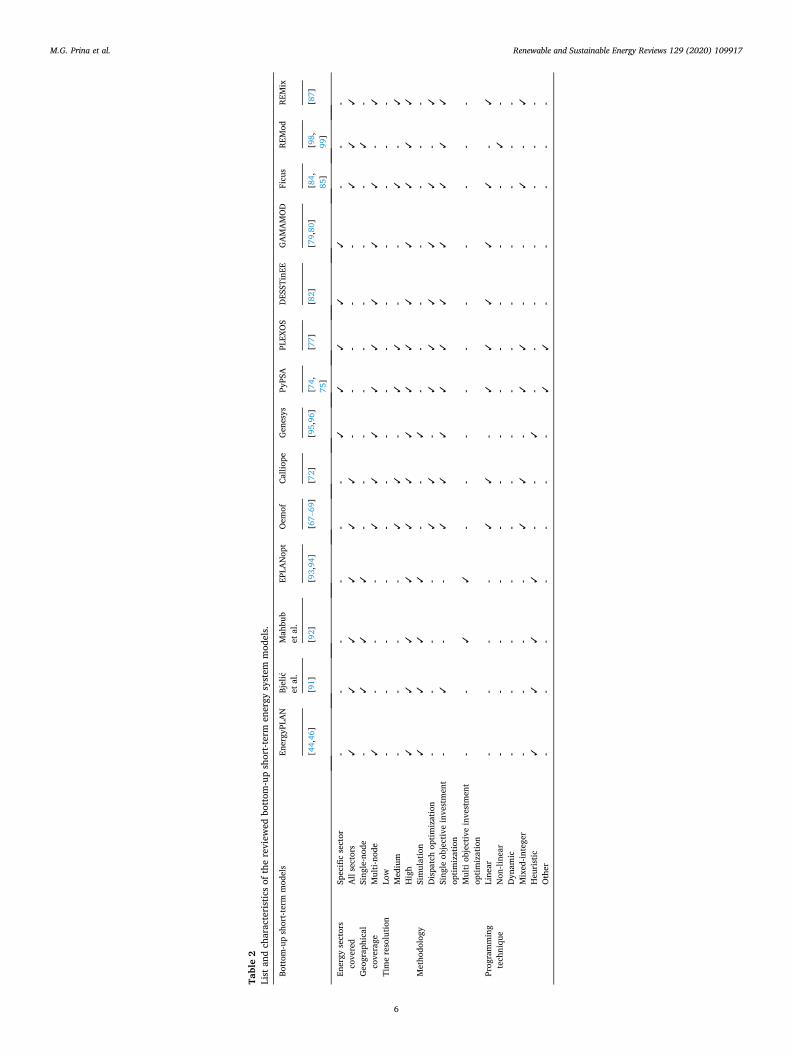
Table 2 shows the list and characteristics of the reviewed bottom-up short-term energy system models. The majority of these models has been found thanks to the Open Energy Modelling (Openmod) Initiative
Table 1 Time resolution characterization.
Total number of time-slices and selection approach
Time resolution
Low 1-32 time-slices Medium 36-288 time-slices (selection approach: representative
days or alternative version of the integral method) High 8760 time-slices (hours of the year)
M.G. Prina et al.
Renewable and Sustainable Energy Reviews 129 (2020) 109917
6
Tabl
e 2
List
and
cha
ract
eris
tics
of th
e re
view
ed b
otto
m-u
p sh
ort-t
erm
ene
rgy
syst
em m
odel
s.
Bott
om-u
p sh
ort-t
erm
mod
els
Ener
gyPL
AN
Bj
eli� c
et
al.
Mah
bub
et a
l. EP
LAN
opt
Oem
of
Calli
ope
Gen
esys
Py
PSA
PL
EXO
S D
ESST
inEE
G
AM
AM
OD
Fi
cus
REM
od
REM
ix
[44,
46]
[91]
[9
2]
[93,
94]
[67–
69]
[72]
[9
5,96
] [7
4,
75]
[77]
[8
2]
[79,
80]
[84,
85
] [9
8,
99]
[87]
Ener
gy s
ecto
rs
cove
red
Spec
ific
sect
or
- -
- -
- -
✓
✓
✓
✓
✓
- -
- A
ll se
ctor
s ✓
✓
✓
✓
✓
✓
-
- -
- -
✓
✓
✓
Geo
grap
hica
l co
vera
ge
Sing
le-n
ode
- ✓
✓
✓
-
- -
- -
- -
- ✓
-
Mul
ti-no
de
✓
- -
- ✓
✓
✓
✓
✓
✓
✓
✓
-
✓
Tim
e re
solu
tion
Low
-
- -
- -
- -
- -
- -
- -
- M
ediu
m
- -
- -
✓
✓
- ✓
✓
-
- ✓
-
✓
Hig
h ✓
✓
✓
✓
✓
✓
✓
✓
✓
✓
✓
✓
✓
✓
M
etho
dolo
gy
Sim
ulat
ion
✓
✓
✓
✓
- -
✓
- -
- -
- -
- D
ispa
tch
optim
izat
ion
- -
- -
✓
✓
- ✓
✓
✓
✓
✓
-
✓
Sing
le o
bjec
tive
inve
stm
ent
optim
izat
ion
- ✓
-
- ✓
✓
✓
✓
✓
✓
✓
✓
✓
✓
Mul
ti ob
ject
ive
inve
stm
ent
optim
izat
ion
- -
✓
✓
- -
- -
- -
- -
- -
Prog
ram
min
g te
chni
que
Line
ar
- -
- -
✓
✓
- ✓
✓
✓
✓
✓
-
✓
Non
-line
ar
- -
- -
- -
- -
- -
- -
✓
- D
ynam
ic
- -
- -
- -
- -
- -
- -
- -
Mix
ed-in
tege
r -
- -
- ✓
✓
-
✓
✓
- -
✓
- ✓
H
euri
stic
✓
✓
✓
✓
-
- ✓
-
- -
- -
- -
Oth
er
- -
- -
- -
- ✓
✓
-
- -
- -
M.G. Prina et al.

Renewable and Sustainable Energy Reviews 129 (2020) 109917
7
Tabl
e 3
List
and
cha
ract
eris
tics
of th
e re
view
ed b
otto
m-u
p lo
ng-te
rm e
nerg
y sy
stem
mod
els.
Bott
om-u
p lo
ng-te
rm m
odel
s
Perf
ect f
ores
ight
app
roac
h M
yopi
c ap
proa
ch
LEA
P M
ARK
AL/
TIM
ES
OSe
MO
SYS
Tem
oa
MES
SAG
E Ba
lmor
el
eMix
EP
LAN
optT
P M
ahbu
b et
al.
LUT
[120
] [1
01,1
02]
[104
,105
] [1
07,1
08]
[110
] [1
12]
[121
] [1
19]
[118
] [1
14,1
17]
Ener
gy s
ecto
rs c
over
ed
Spec
ific
sect
or
- -
- -
- ✓
✓
-
- ✓
A
ll se
ctor
s ✓
✓
✓
✓
✓
-
- ✓
✓
-
Geo
grap
hica
l cov
erag
e Si
ngle
-nod
e ✓
-
- -
- -
- ✓
✓
-
Mul
ti-no
de
- ✓
✓
✓
✓
✓
✓
-
- ✓
Ti
me
reso
lutio
n Lo
w
✓
✓
✓
✓
✓
- -
- -
- M
ediu
m
- -
- -
- -
✓
- -
- H
igh
- -
- -
- ✓
-
✓
✓
✓
Met
hodo
logy
Si
mul
atio
n ✓
-
- -
- -
- -
- D
ispa
tch
optim
izat
ion
- ✓
✓
✓
✓
✓
✓
-
- ✓
Si
ngle
obj
ectiv
e in
vest
men
t opt
imiz
atio
n -
✓
✓
✓
✓
✓
✓
- -
✓
Mul
ti ob
ject
ive
inve
stm
ent o
ptim
izat
ion
- -
- -
- -
- ✓
✓
-
Prog
ram
min
g te
chni
que
Line
ar
- ✓
✓
✓
✓
✓
✓
-
- ✓
N
on-li
near
-
- -
- -
- -
- -
- D
ynam
ic
- -
- -
- -
- -
- -
Mix
ed-in
tege
r -
- -
- ✓
✓
✓
-
- -
Heu
rist
ic
✓
- -
- -
- -
✓
✓
- O
ther
-
- -
- -
- -
✓
✓
-
M.G. Prina et al.
Renewable and Sustainable Energy Reviews 129 (2020) 109917
8
platform [66]. These models can be grouped into different sub-classes. A first numerous group is made up by models based on linear program-ming or mixed integer linear programming. This type of models is usually characterized by a medium-high time resolution, by a multi-node approach and performs an operational optimization or a single-objective investment optimization to develop expansion planning scenarios. One example of this type is the Oemof framework [67–69] developed following an open-source philosophy by the Reiner Lemoine Institut [70] and by the Center for Sustainable Energy Systems of the Flensburg university of applied sciences [71]. Other examples of this type are the Calliope model [72] by ETH Zurich [73], PyPSA [74,75] by the Karlsruhe Institute of Technology [76], the commercial software PLEXOS [77] developed by Energy Exemplar [78], the gas market model GAMAMOD [79,80] by the Technische Universitat Dresden [81], DESSTinEE [82] by the Imperial College London [83], Ficus [84,85] by the Technische Universit€at München [86] and REMix [87] created by the German Aerospace Center (DLR) [88].
Another sub-class of bottom-up short-term energy system models is identified by simulation models based on heuristic technique. An example of this type is the EnergyPLAN software [44,46] distributed and designed by Aalborg University [89]. A review of applications of this software and used performance indicators is provided by Østergaard [90]. The energy demand in this model is covered by sources in an order determined by predefined and unchanged priorities. Bjeli�c et al. [91] and Mahbub et al. [92] have coupled the simulation software Ener-gyPLAN to two different optimization algorithms in order to achieve investment optimization. Prina et al. [93,94] have linked the Ener-gyPLAN software to a multi-objective optimization algorithm inte-grating the energy efficiency of buildings within the optimization. Genesys [95,96] developed by Aachen University [97] also follows the same approach. The core of the program is a genetic algorithm which composes new systems randomly and evaluates the systems by simula-tion. REMod, lastly [98,99], by Fraunhofer ISE [100] performs single-objective investment optimization using a modified
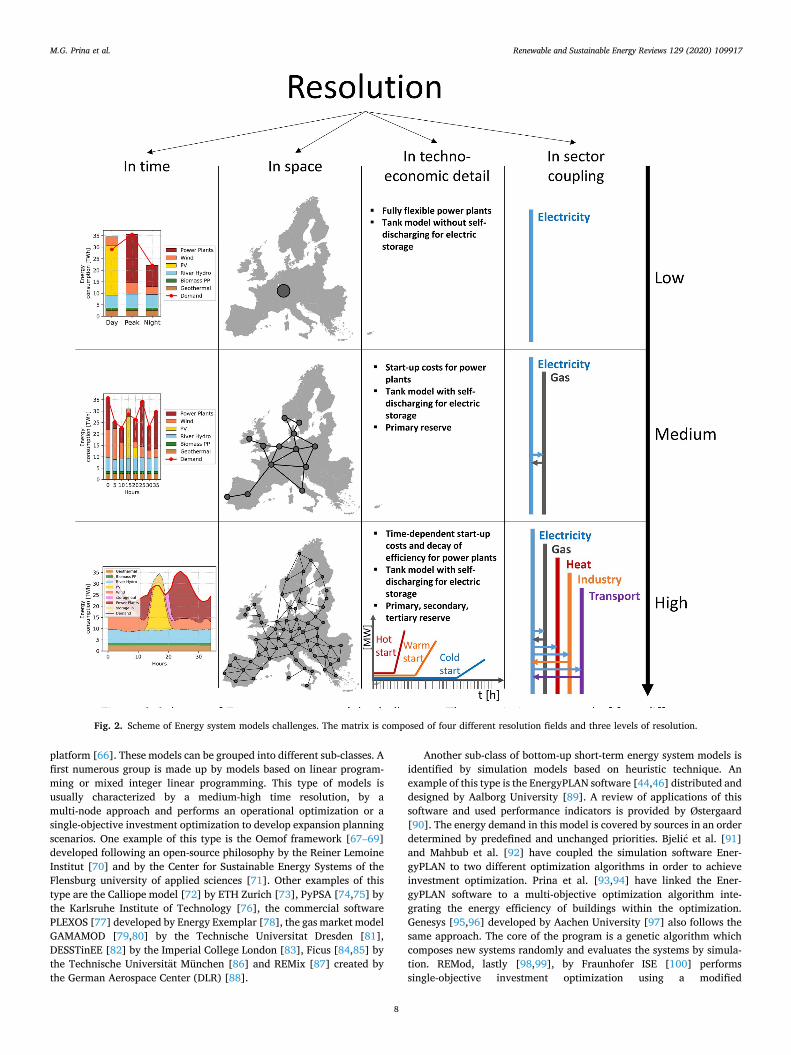
Fig. 2. Scheme of Energy system models challenges. The matrix is composed of four different resolution fields and three levels of resolution.
M.G. Prina et al.
Renewable and Sustainable Energy Reviews 129 (2020) 109917
9
multi-dimensional regula falsi approach. Table 3 shows the list and characteristics of the reviewed bottom-up
long-term energy system models. The table shows the distinction be-tween those following the perfect foresight approach and those based on the myopic approach. Among bottom-up long-term perfect foresight energy system models a first sub-class includes MARKAL/TIMES [101, 102] developed as part of the IEA-ETSAP (Energy Technology Systems Analysis Program of the International Energy Agency) [103], OSe-MOSYS [104,105] by the Royal Institute of Technology (KTH) [106], the open-source Temoa [107,108] by the North Carolina State University [109] and MESSAGE [110] by the International Institute for Applied Systems Analysis (IIASA) [111]. This family of models follows a LP modelling structure able to determine the capacity expansion over a horizon that usually covers 20–50 years. The model objective is the minimization of the present cost of energy supply by using energy technologies and commodities over the time horizon to meet the energy demands. In these linear programming models, the additions of tech-nology capacity are used to cover end-use demands. This type of models implements sector coupling and a multi-node approach but due to the large computational effort uses a low time resolution usually identified by the 12 time-slices approach.
Balmorel [112] developed by Technical University of Denmark (DTU) [113] follows the same technique based on LP but concentrates on the electricity and combined heat and power sectors. This allows increasing the time resolution at the cost of losing resolution on the sector coupling side.
Within the reviewed bottom-up long-term myopic energy system models, it is possible to identify those models not performing the in-vestment optimization in one single shot. Therefore, prices and costs trends of fuels or technologies are not considered by the optimization but are exogenous parameters of the iterative optimization problems done step by step. For each step, the optimization target is usually the minimization of the total annualized energy system cost. This is the case of the LUT energy system transition model [114] developed by the Lappeenranta University of Technology [115] that has been applied to numerous applications such as India [116] and Pakistan [117].
Mahbub et al. [118] presented a bottom-up long-term myopic model that integrates the EnergyPLAN simulation software and a Multi-objective evolutionary algorithm. The optimization target at each step is in this case the minimization of the total annualized energy system cost and the annual CO2 emissions. Prina et al. [119] starting from the coupling of EnergyPLAN to a multi-objective optimization al-gorithm have realized a long-term perfect foresight model which im-plements high time resolution.
3. Challenges in energy system modelling
In order to continuously improve energy system modelling, it is important to have a clear picture of the challenges of this research field. Pfenninger et al. [22] have examined four challenges of energy system modelling: 1) resolution in time and space 2) balancing uncertainty and transparency, 3) the integration of the increasing complexity of the energy sector, and 4) the integration of social behavioural economics.
In this review concentrating on bottom-up energy system models, we propose a further processing of these challenges. Fig. 2 shows the identified four challenges for bottom-up energy system models. These rotate around the concept of resolution and are the following: resolution in time, in space, in techno-economic detail and in sector coupling. For each of these fields, three different levels of resolution are identified: low, medium and high. The result is a matrix with four columns, the different challenges’ fields, and three rows identifying the different levels of resolution. There are numerous models that achieve high res-olution in one or more of these fields. However, the final challenge to improve rigor and accuracy of bottom-up energy system models is the simultaneous achievement of high resolution in all these fields. Next paragraphs will focus and explain the composition of this challenges’ Ta
ble
4 Co
mpa
riso
n of
diff
eren
t app
roac
hes
impl
emen
ting
flexi
bilit
y op
tions
and
hig
h le
vel o
f tec
hno-
econ
omic
det
ail r
esol
utio
n in
to e
nerg
y sy
stem
mod
ellin
g.
Stud
ies
Mod
ellin
g te
chni
que
Tim
e re
solu
tion
Spac
e re
solu
tion
Sect
or c
oupl
ing
reso
lutio
n Po
wer
pla
nts
addi
tiona
l co
nstr
aint
s an
d co
sts,
-R
amp
cons
trai
nts-
part
ial
load
ope
ratio
n - s
tart
-up
cost
s
Tim
e-de
pend
ent
star
t-ups
(h
ot, w
arm
, co
ld s
tart
-up)
Wel
sch
et a
l. [1
24]
Long
-term
dis
patc
h m
odel
(TI
MES
) lin
ked
to U
C (P
LEXO
S)
Low
(TI
MES
),
Hig
h (P
LEXO
S)
Low
H
igh
(TIM
ES)
- Ra
mp
-
Star
t-up
Not
impl
emen
ted
Shor
tt e
t al.
[125
] U
C m
odel
(M
ILP)
H
igh
Low
Lo
w (
elec
tric
ity)
- Ra
mp
-
Part
ial l
oad
-
Star
t-up
Not
impl
emen
ted
Palm
intie
r et
al.
[126
] In
tege
r cl
uste
ring
alg
orith
m a
pplie
d to
UC
(MIL
P)
Hig
h Lo
w
Low
(el
ectr
icity
) -
Ram
p
- Pa
rtia
l loa
d
- St
art-u
p
Not
impl
emen
ted
Kirs
chen
et a
l. [1
27]
UC
(MIL
P)
Med
ium
Lo
w
Low
(el
ectr
icity
) -
Ram
p
- Pa
rtia
l loa
d
- St
art-u
p
Not
impl
emen
ted
Beld
erbo
s et
al.
[128
] Sc
reen
ing
curv
e m
odel
inte
grat
ed in
to a
MIL
P m
odel
H
igh
Low
Lo
w (
elec
tric
ity)
- Ra
mp
-
Star
t-up
Onl
y co
ld s
tart
-up
Palm
intie
r [1
29]
Inte
ger
clus
teri
ng a
pplie
d to
UC
(MIL
P)
Hig
h Lo
w
Low
(el
ectr
icity
) -
Ram
p
- Pa
rtia
l loa
d
- St
art-u
p
Not
impl
emen
ted
Zhan
g et
al.
[130
] U
C m
odel
(LP
) M
ediu
m
Low
Lo
w (
elec
tric
ity)
- Ra
mp
-
Star
t-up
Not
impl
emen
ted
Dea
ne a
t al [
58].
Lo
ng-te
rm d
ispa
tch
mod
el (
TIM
ES)
linke
d to
UC
(PLE
XOS)
Lo
w (
TIM
ES),
H
igh(
PLEX
OS)
Lo
w
Hig
h (T
IMES
) -
Ram
p
- St
art-u
p N
ot im
plem
ente
d
Prin
a et
al.
[131
] EP
LAN
opt (
Ener
gyPL
AN
cou
pled
to m
ulti-
obje
ctiv
e op
timiz
atio
n al
gori
thm
) H
igh
Low
H
igh
-
Ram
p
- Pa
rtia
l loa
d
- St
art-u
p
Yes
M.G. Prina et al.
Renewable and Sustainable Energy Reviews 129 (2020) 109917
10
matrix. Resolution in time has been already a matter of discussion in section
2.3. Following the classification proposed in this study (see Table 1), a low time resolution, or as defined by Haydt et al. [59] an integral approach, is characterized by a low number of different time-slices, usually in the order of 12, one per season and three per day (Day, night and peak). A medium time resolution, or as defined by Haydt et al. a semi-dynamic approach, is an intermediate solution that takes into account a number of time-slices usually between 36 and 288. For example, Pina et al. [122] have used a TIMES model with 288 time-slices (three day for season and 24 h per day) to show the increase of accuracy in the results of a long-term energy system model compared to the classical 12 time-slices approach. Poncelet et al. [60] have compared different time-slices selection approaches through the calculation of the generation mix error. A high time resolution, or as defined by Haydt et al. a dynamic approach, is achieved when the entire hourly distri-bution of VRES over the year is used in the model.
Space resolution is another relevant challenge of energy system models. The potential of VRES, their generation costs and generation profile deeply depend on their spatial location and by the availability of wind and solar radiation. It is also important to underline that the variation in time of their generation is usually lowered through the aggregation of production profiles located in different areas. Variability is in this way smoothed by spatially distributed generations [123]. Space resolution becomes higher at the increase of the number of different nodes in which is divided the energy system model. A low spatial res-olution is characterized by single-node modelling. A high spatial reso-lution corresponds to a larger number of nodes. Each country is thus
characterized by more than one single node. An additional challenge in this direction is the integration of distribution grids into transmission multi-node models.
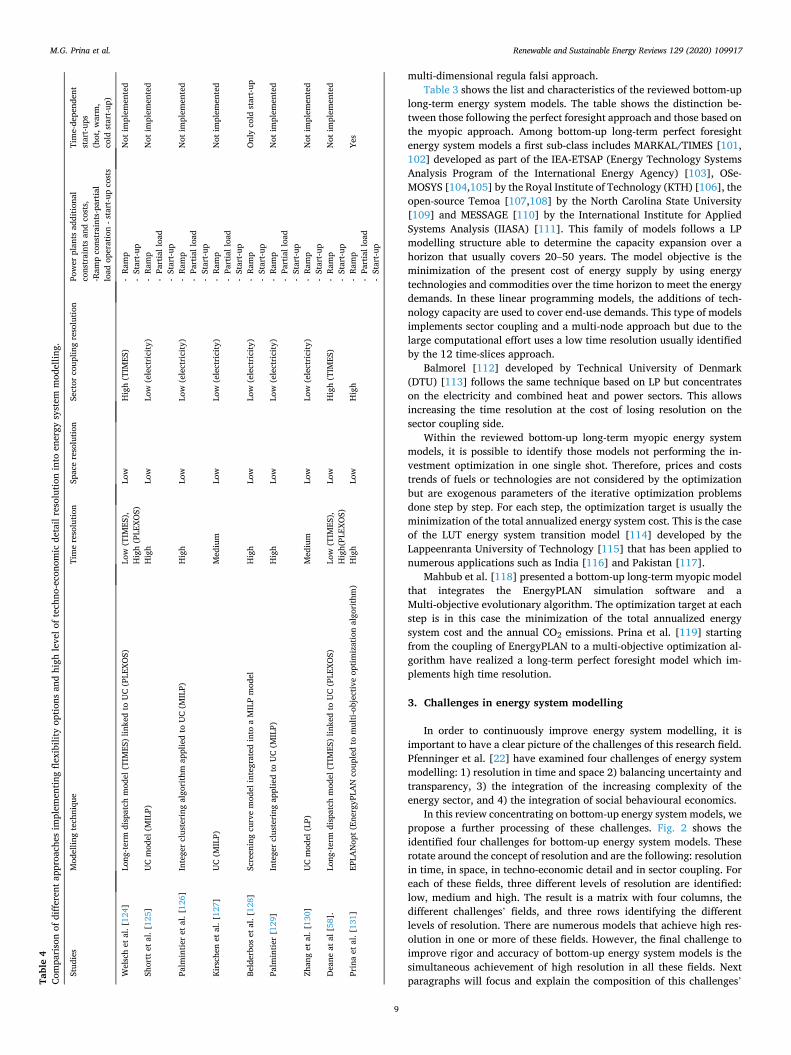
Another challenge identified in Fig. 2 is the achievement of a high resolution in techno-economic detail. Poncelet et al. [60] showed that increasing resolution in time should be prioritized over techno-economic detail resolution. However, they also quantify the error consequence of a low resolution in techno-economic detail. When talking about techno-economic detail resolution, numerous research papers analyzed the impact of the integration of flexibility constraints and costs in energy system modelling (see Table 4). These studies mostly utilized high time resolution unit commitment (UC) models which integrate flexibility requirements of conventional power plants such as ramp constraints, decay of efficiency at partial load and start-up costs. UC models are usually mathematical optimization problems in which the generation covered by different power units has to match the de-mand at the lowest costs. Their focus is almost completely concentrated on the electricity sector (see Table 4). Shortt et al. [125] realized a UC model based on a MILP and applied it to three different states (Finland, Ireland and Texas) to estimate the effects on the results of the imple-mented flexibility constraints and additional costs. Similar approaches are those of Palmintier et al. [126] who used the ERCOT case study which covers majority of Texas, Kirschen et al. [127], Belderbos et al. [128], Palmintier [129], Zhang et al. [130]. They concentrate only on the electricity sector because this type of models is based on MILP to consider these constraints and, therefore, is computationally expensive [132]. Table 4 shows various studies which proposed methods to limit the computational effort. One example is obtained through the use of the
Table 5 Position of the reviewed short-term models towards the identified challenges of energy system modelling.
M.G. Prina et al.
Renewable and Sustainable Energy Reviews 129 (2020) 109917
11
integer clustering technique applied at UC models. Adopting these techniques reduces the computational time, but even with these methods, the focus of the optimization problem remains on the elec-tricity sector, thus not inspecting the flexibility given by the coupling of the electricity sector with other sectors of the energy system. In order to overcome this limitation, Welsch et al. [124] and Deane at al [58]. Introduced a method of soft-linking between the UC PLEXOS software and the TIMES model (with long-term energy system approach) which integrates the electricity, thermal and transport sectors. Nevertheless, the latter is adopted with a low number of time-slices that unlikely captures the variability of renewable energy sources on seasonal and daily bases. Prina et al. [131] realized through the EPLANopt model [133] a simplified model to include time-dependent ramp constraints, start-up costs and decay of efficiency at partial load of the natural gas combined cycles into an energy system model characterized by high resolution in time and in sector-coupling. However, this and the abovementioned approaches are characterized by low space resolution for the abovementioned computational problems.
Some indicators of a low level of resolution in techno-economic detail are: i) power plants modeled as fully flexible power plants with a fixed efficiency, ii) storage that does not consider self-discharging and iii) in general a fixed model in the starting configuration of the energy system that does not allow a user to vary the number of production units, storage and energy demand. Some other indicators of a higher level of resolution in techno-economic detail are, as mentioned, power plants modeled with time-dependent ramp constraints, time-dependent start- up costs and decay of efficiency at partial load operation, primary, secondary and tertiary reserve and prosumer models. In fact, the diffu-sion of geographically distributed renewable energy generation and electric storage has brought to the need to integrate in energy system modelling prosumers and energy communities. The abovementioned models simulate and optimize the energy system sources from the perspective of an omniscient decision maker, with the final aim of the best use of sources for the entire system (nation, region, etc.). Energy communities and prosumers add a level of complexity because introduce
the need of a multi-level optimization model that optimize the use of sources for the energy community and corresponding prosumers, but also the use of sources at wider scale from the perspective of the omniscient decision maker.
The last challenge that appears in Fig. 2 is the resolution in sector coupling. Lund et al. [134,135] elaborated the Smart Energy System (SES) concept highlighting the relevance of sector-coupling and there-fore the synergies and interconnections between sectors. They also demonstrated how sector-coupling increases the overall efficiency of the system, introduces flexibility options and decreases the overall costs. The characteristics of a SES are 100% based on renewable energy system and includes synergies between different sectors and does not neces-sarily raise the cost of the energy system compared to an energy system relying on fossil fuels. This concept has been largely dealt with and a high number of publications exists on the topic. For example Connolly et al. [136] demonstrated how using a SES approach a 100% energy system based on renewables in Europe is technically feasible. Mathiesen et al. [137] showed how focusing only on the power sector decreases the potential for VRES compared to a SES approach. Moreover, as mentioned before, one challenge of energy system models is the increase in techno-economic detail resolution and the inspection of the flexibility options of the electricity sector. However, the achievement of this challenge on the only power sector has limited impact. It is instead important to integrate a high resolution in techno-economic detail and a high resolution in sector coupling so to evaluate all the flexibility op-tions of the energy system. Nastasi et al. [138] investigated all the possible electricity-driven heating technologies from low to high supply temperatures showing the corresponding advantages in primary energy consumption.
It is important to identify a fifth challenge for energy system models not shown in Fig. 2. This is transparency of input and output data, documentation and software. Pfenninger et al. [139] state that the en-ergy system models and data should be open i) to improve quality of science, ii) to create more effective collaboration between science and policy-makers, iii) to increase productivity and avoid unnecessary
Table 6 Position of the reviewed long-term models towards the identified challenges of energy system modelling.
M.G. Prina et al.

Renewable and Sustainable Energy Reviews 129 (2020) 109917
12
duplication but learn from one another and iv) to establish transparent and relevant knowledge as a basis of societal debates. It is possible to identify three different levels of transparency that are mostly wide-spread among reviewed energy system models.
- A first level characterized by a low transparency is typical of those models that present the results and output data without providing a structured database of the input data, a documentation of all the math steps of the model and handling the model as a pure “black box” i.e. without providing the full source code.
- A second intermediate level is characterized by medium trans-parency. This is the case if output data are provided together with a structured database of input data and complete documentation of the math behind the model.
- The third and last level, that can be called high transparency, is identified, in addition to the output and input data and the complete documentation, by the full source code of the model.
The scope of energy planners is to present the results of energy sys-tem modelling and scenarios generation to the policy-makers in the most complete and transparent way. In this regard, multi-objective optimi-zation techniques show some benefits compared to the single-objective optimization methods. Single-objective optimization can reach one optimal solution in a single run while multi-objective optimization methods can find an entire set of optimal solutions, nominated Pareto front, i.e. they can identify the complete trade-off surface. A conse-quence is that in order to obtain the same level of information multiple SO runs need to be executed. In order to do that, there is the need to transform additional objectives in constraints to the SO optimization. Another method to transform MO into SO approach is to assign weights to the different objectives to convert them into a single one.
In this sense, when the SO optimization is adopted, the decision- maker must express preferences before the execution of the model, while in the MO approach the preferences can be expressed looking at results. When the person in charge to solve the technical problem is the decision maker himself, he is conscious of his inclinations towards an economic, environmental or societal objective and the problem can be reduced to SO. MO approach becomes very important when the person who has to solve the technical problem is not the decision-maker and has to present the results in the most transparent way to the policy maker [140].
Østergaard [141] showed how different optimization objectives produce different results in a SO problem and hence how the optimal solution is very sensitive to the chosen weights. This strengthen the need for a MO approach to produce a set of optimal solutions and to present them in the most transparent way to the policy makers. The policy makers looking at the Pareto front of optimal solutions from a techno-economic point of view will choose, based on their political in-clinations, one future optimal scenario. At this point different modelling techniques based on the top-down approach need to be implemented to inspect the best energy policies to subsidize certain sources and push towards the energy mix found through bottom-up approach modelling. Regarding transparency, it is also important to mention the contribution of Doukas et al. [142] who proposed a new paradigm to shift from stand-alone use of models to truly integrative processes in which mul-tiple actors and methods complement each other.
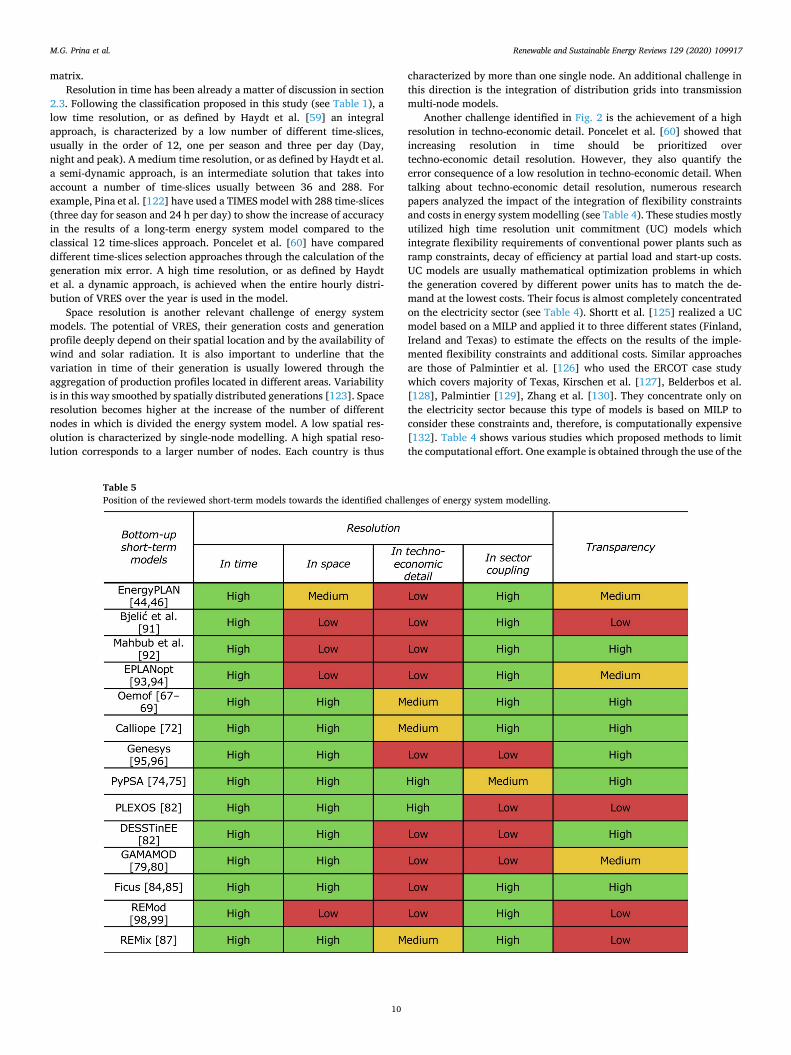
Table 5 shows all reviewed bottom-up short-term models and their position towards the discussed ongoing challenges of energy system modelling. The current table shows the full theoretical potentialities of these models. For example, Oemof and Calliope can theoretically be run with high time resolution, high space resolution and high resolution in sector coupling and medium resolution in techno-economic detail. However, a simulation of this type would have a heavy computation burden and unlikely could be solved as it is. More likely, the time or space resolution would be reduced to have a feasible computational time. Therefore, the models have been mapped through the challenges
matrix based on the introduced features of each level of resolution for each considered challenge field.
The reviewed models show on average to have a high time and space resolution while need to be improved on the techno-economic detail resolution. About sector coupling resolution, it is possible to distinguish between models focusing on the only electricity sectors and other implementing full sector coupling.
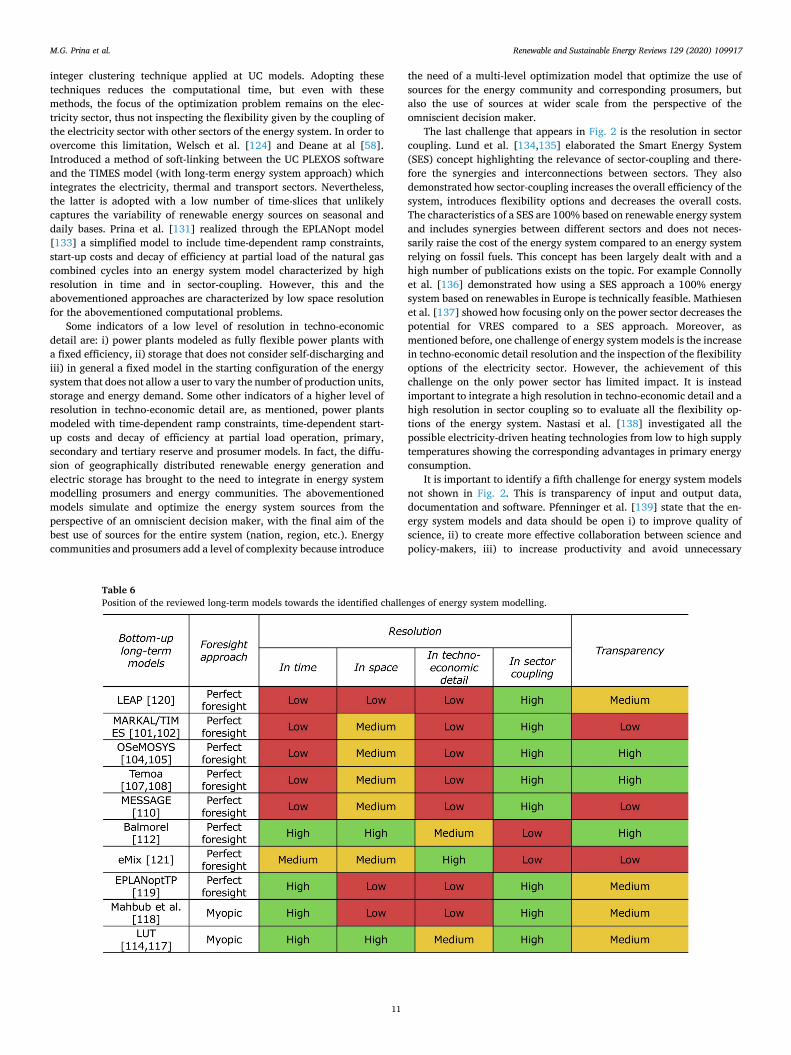
Table 6 shows all reviewed bottom-up long-term models and their position towards the discussed ongoing challenges of energy system modelling. Compared to previous short-term models it is clear that a high time resolution is harder to be achieved with high space resolution and sector coupling. The same consideration can be extended to techno- economic detail resolution. Moreover, for long-term energy system models it is important to consider the foresight approach in this reso-lution balance. The table shows that perfect foresight approach com-plicates the model computationally and high time resolution is very difficult to achieve. It is achievable lowering the resolution in sector coupling as shown by Balmorel [112] and eMix [121]. Mahbub et al. [118] and the LUT model [114,117] from Lappeenranta university have demonstrated that a high time resolution in long-term models is possible if a myopic approach is chosen instead of perfect foresight with all the already mentioned limits that this choice produces.
A challenge that need to be mentioned in bottom-up energy system modelling is uncertainty [21]. The abovementioned models are all deterministic, thus based on historical data and without any randomness linked to the input data parameters. This is mainly driven by the fact that these models are usually too computationally expensive to carry out uncertainty. Moret et al. [143] developed a simplified multi-period MILP model for energy planning under uncertainty. Moret et al. [144] realized a robust optimization framework to account for uncertainties in the objective function and in the constraints of energy system modelling. Swider et al. [145] developed a stochastic electricity market model and applied it to Germany to estimate the integration costs of wind. Yue et al. [146] produced a review of different approaches on uncertainty in en-ergy system modelling. They identified four different methodology to pursue this scope: stochastic programming, Monte Carlo analysis, robust optimization and modelling to generate alternatives.
Some bottom-up energy system models were adapted to implement a stochastic approach. This is the case of the MESSAGE long-term model [147] and the stochastic version of the MARKAL model [148] applied to the case study of Qu�ebec. Others were specifically created to account for uncertainty. This is the case of the stochastic power system investment model EMPIRE [149] which is applied to the European power system to study future investments on generation technologies, storages and transmission infrastructure. SWITCH model [150] is a multiperiod sto-chastic linear programming model which is used to find the least cost energy system over the course of multiyear investment periods. Another example is the SMART model [151], a stochastic multiscale model which accounts for uncertainty in wind generation, demands, prices and rainfall. Nikas et al. [34] analyzed in their already mentioned review also the modelling approach of different IAMs on uncertainty and the different uncertainty factors accounted by each model.
Another challenge in bottom-up energy system modelling is the integration of behavioural economics [22]. The choices of individuals have an influence on energy demand and on the adoption of certain technologies at local level. At a broader level, the choices of commu-nities and organizations have also an influence on energy demand and energy policies. Factors that are usually not considered in bottom-up energy system models. Energy system models usually focus on finding the best use of energy to minimize the total costs and sometimes also optimizing environmental objectives. This is done by the aggregation of the energy demands of the single individuals who, however, are not necessarily driven by the same objectives. This affect the uncertainty in energy system modelling.
Good [152] analyzed the impact of behavioural economics in modelling demand response. Demand response in energy system
M.G. Prina et al.
Renewable and Sustainable Energy Reviews 129 (2020) 109917
13
modelling is usually modeled assuming individuals as rational and active economic agents while in the reality they are strongly influenced by biases and preferences. The results show that preferences can impact demand response and therefore is important to appealing to them for soliciting demand response. Frederiks et al. [153] applied behavioural economics to inspect consumer decision-making in household energy use. Spandagos et al. [154] used a fuzzy model including behavioural economics to better characterize the factors driving consumer energy behaviour. These are all relevant examples of first important steps in the direction to integrate behavioural economics in energy system model-ling and reduce the gap between the modelling and reality. Trutnevyte et al. [155] presented a review with different steps to integrate more insights from social sciences in energy system models: i) inspect the societal assumptions in existing models, ii) evaluate the quantifiable patterns to be integrated into models, iii) extensively validate modified and newly created models. Van Den Berg et al. [156] proposed an expanded range of approaches to account for lifestyle changes in IAMs.
4. Conclusions
Bottom-up energy system modelling as a mean to support energy planning has been the central topic of this paper. Starting from the existing classifications of this type of models, a novel classification has been proposed. A first distinction has been made between short-term and long-term models depending on the considered time horizon. A further subdivision of the latter models has been proposed between perfect foresight and myopic approach which are methods to handle the optimization horizon. After this tree-structure there are different char-acteristics that identify these models. These features can be grouped in the following items: energy sectors covered, geographical coverage, time resolution, methodology and programming technique.
The main challenges of this research field have been identified. The central concept is around the resolution theme. Four different fields have been recognized: resolution in time, in space, in techno-economic detail and in sector-coupling. In addition, a matrix identifying a low, medium and high level of resolution for these four fields has been proposed.
The highest level of resolution in time is given by the hourly time- step while the lowest level of resolution is in the case of low number of time-slices, usually in the order of 12. Space resolution rises at the increase of the number of different nodes in which is divided the energy system model. A low level of resolution in techno-economic detail is given by the use of simplified components in the modelling such as power plants modeled as fully flexible power plants, storage that does not consider self-discharging and in general a fixed model in the initial configuration of the energy system. Some indicators of a high level of techno-economic detail are power plants modeled with time-dependent ramp constraints, time-dependent start-up costs and decay of efficiency at partial load operation, primary, secondary and tertiary reserve and prosumer models. The fourth challenge is the resolution in sector coupling. The level of resolution for this area increases with the amount of the sectors considered within the analysis. This is particularly important to exploit the synergies and flexibility options given by the coupling of different sectors such as electricity, gas, heat, transport and industry.
A fifth challenge that has been taken into account is transparency. Trying to keep the same structure of the developed matrix, three levels have been identified: low, medium and high transparency.
An additional challenge that has been mentioned is the accounting of uncertainty in bottom-up energy system modelling. At the current stage, the majority of the models of this type are deterministic and do not take into consideration uncertainty.
Several existing bottom-up energy system models have been reviewed and classified according to the proposed classification. 13 different models have been analyzed in the category of bottom-up short- term energy system models and 9 as bottom-up long-term ones. The
following mapping has shown how several models reach a high level of resolution in one or more areas. However, it is shown how the real final challenge to improve accuracy of bottom-up energy system models is the simultaneous achievement of high levels of resolution in all the chal-lenges areas. The literature review has shown how this final aim is not reached by any model at the current stage.
The proposed challenges matrix introduced in this study is a first step in the direction of a shared reference tool to classify the bottom-up en-ergy system models. Future works will concentrate on the quantitative evaluation of the errors introduced by a lower resolution modelling compared to a method implementing high resolution in all these chal-lenges’ fields. It is also important to highlight how future review studies need to focus on the themes like uncertainty, behavioural economics and new technologies integration in energy system models.
Declaration of competing interest
The authors declare that they have no known competing financial interests or personal relationships that could have appeared to influence the work reported in this paper.
Acknowledgements
The research leading to these results has received funding from the EFRE/FESR Provincia autonoma di Bolzano-Alto Adige 2014–2020, under Project number FESR 1042 “Integrids”. The authors thank the Department of Innovation, Research and University of the Autonomous Province of Bozen/Bolzano for covering the Open Access publication costs.
References
[1] IPCC report, www.ipcc.ch/ipccreports/far/wg_I/ipcc_far_wg_I_full_report.pdf 1990.
[2] Breidenich C, Magraw D, Rowley A, Rubin JW. The Kyoto protocol to the united nations framework convention on climate change. Am J Int Law 1998;92:315. https://doi.org/10.2307/2998044.
[3] Pichs-Madruga R, Sokona Y, Minx JC, Farahani E, Kadner S, Seyboth K, et al. reportClimate change 2014 mitigation of climate change summary for policymakers technical summary part of the working group III contribution to the fifth assessment report of the intergovernmental panel on climate change 2015.
[4] 2020 climate & energy package | Climate Action 2007. https://ec.europa.eu/clim a/policies/strategies/2020_en.
[5] 2030 Energy Strategy - European Commission 2014. https://ec.europa.eu/energy /en/topics/energy-strategy-and-energy-union/2030-energy-strategy (accessed July 19, 2017).
[6] Clean Energy and Pollution Reduction Act - SB 350 n.d. https://www.energy.ca. gov/rules-and-regulations/energy-suppliers-reporting/clean-energy-and-pollut ion-reduction-act-sb-350 (accessed April 17, 2020).
[7] Executive order B-55-18. 2018. [8] Climate Change Response (Zero Carbon) Amendment Act | Ministry for the
Environment n.d. https://www.mfe.govt.nz/climate-change/zero-carbon-amen dment-act (accessed April 17, 2020).
[9] Cao K-K, Cebulla F, G�omez Vilchez JJ, Mousavi B, Prehofer S. Raising awareness in model-based energy scenario studies—a transparency checklist. Energy Sustain. Soc. 2016;6:28. https://doi.org/10.1186/s13705-016-0090-z.
[10] Beeck N Van. Classification of energy models. Tilbg Univ Eindhoven Univ Technol; 1999. p. 25.
[11] Grubb M, Edmonds J, ten Brink P, Morrison M. The costs of limiting fossil-fuel CO2 emissions: a survey and analysis. Annu Rev Energy Environ 1993;18: 397–478. https://doi.org/10.1146/annurev.eg.18.110193.002145.
[12] Hourcade JC, Jaccard M, Bataille C, Ghersi F. Hybrid modeling: new answers to old challenges. Energy Journal, Int Assoc Energy Econ 2006:1–12.
[13] Tomaschek J. Long-term optimization of the transport sector to address greenhouse gas reduction targets under rapid growth\: application of an energy system model for Gauteng province, South Africa 2013. https://elib.uni-stuttgart. de/handle/11682/2330. [Accessed 22 August 2018].
[14] Worrell E, Ramesohl S, Boyd G. Advances IN energy forecasting models based ON engineering economics. Annu Rev Environ Resour 2004;29:345–81. https://doi. org/10.1146/annurev.energy.29.062403.102042.
[15] Jebaraj S, Iniyan S. A review of energy models. Renew Sustain Energy Rev 2006; 10:281–311. https://doi.org/10.1016/J.RSER.2004.09.004.
[16] Mundaca L, Neij L, Worrell E, McNeil M. Evaluating energy efficiency policies with energy-economy models. Annu Rev Environ Resour 2010;35:305–44. https://doi.org/10.1146/annurev-environ-052810-164840.
M.G. Prina et al.

Renewable and Sustainable Energy Reviews 129 (2020) 109917
14
[17] Connolly D, Lund H, Mathiesen BV, Leahy M. A review of computer tools for analysing the integration of renewable energy into various energy systems. Appl Energy 2010;87:1059–82. https://doi.org/10.1016/j.apenergy.2009.09.026.
[18] Hall LMH, Buckley AR. A review of energy systems models in the UK: prevalent usage and categorisation. Appl Energy 2016;169:607–28. https://doi.org/ 10.1016/J.APENERGY.2016.02.044.
[19] Lund H, Arler F, Østergaard P, Hvelplund F, Connolly D, Mathiesen B, et al. Simulation versus optimisation: theoretical positions in energy system modelling. Energies 2017;10:840. https://doi.org/10.3390/en10070840.
[20] Lyden A, Pepper R, Tuohy PG. A modelling tool selection process for planning of community scale energy systems including storage and demand side management. Sustain. Cities Soc. 2018;39:674–88. https://doi.org/10.1016/j. scs.2018.02.003.
[21] Ringkjøb H-K, Haugan PM, Solbrekke IM. A review of modelling tools for energy and electricity systems with large shares of variable renewables. Renew Sustain Energy Rev 2018;96:440–59. https://doi.org/10.1016/J.RSER.2018.08.002.
[22] Pfenninger S, Hawkes A, Keirstead J. Energy systems modeling for twenty-first century energy challenges. Renew Sustain Energy Rev 2014. https://doi.org/ 10.1016/j.rser.2014.02.003.
[23] Herbst A, Toro F, Reitze F, Jochem E. Introduction to energy systems modelling. Statistics (Ber) 2012;148:111–35.
[24] Oliveira C, Antunes CH. An input-output model for decision support in energy- economy planning - a multiobjective interactive approach. Syst Anal Model Simulat 2002;42:769–90. https://doi.org/10.1080/716067179.
[25] E3ME by Cambridge Econometrics n.d. https://www.e3me.com/(accessed July 23, 2019).
[26] Barker T, Alexandri E, Mercure J-F, Ogawa Y, Pollitt H. GDP and employment effects of policies to close the 2020 emissions gap. Clim Pol 2016;16:393–414. https://doi.org/10.1080/14693062.2014.1003774.
[27] Cambridge Econometrics. https://www.camecon.com/. [Accessed 23 July 2019]. [28] GEM-E3 | EU Science Hub. https://ec.europa.eu/jrc/en/gem-e3. [Accessed 23
July 2019]. [29] Gravelsins A, Bazbauers G, Blumberga A, Blumberga D, Bolwig S, Klitkou A, et al.
Modelling energy production flexibility: system dynamics approach. Energy Procedia 2018;147:503–9. https://doi.org/10.1016/J.EGYPRO.2018.07.060.
[30] Papadelis S, Flamos A, Androulaki S. Setting the framework for a business Strategy assessment model. Int J Energy Sect Manag 2012;6:488–517. https:// doi.org/10.1108/17506221211281993.
[31] Nikas A, Stavrakas V, Arsenopoulos A, Doukas H, Antosiewicz M, Witajewski- Baltvilks J, et al. Barriers to and consequences of a solar-based energy transition in Greece. Environ Innov Soc Transitions 2019. https://doi.org/10.1016/j. eist.2018.12.004.
[32] Sachs J, Meng Y, Giarola S, Hawkes A. An agent-based model for energy investment decisions in the residential sector. Energy 2019;172:752–68. https:// doi.org/10.1016/j.energy.2019.01.161.
[33] Greening LA, Bataille C. Bottom-up models of energy: across the spectrum. Chapters; 2009.
[34] Nikas A, Doukas H, Papandreou A. A detailed overview and consistent classification of climate-economy models. Underst. Risks uncertainties energy clim. Policy multidiscip. Methods tools a low carbon soc.. Springer International Publishing; 2018. p. 1–54. https://doi.org/10.1007/978-3-030-03152-7_1.
[35] Doukas H, Nikas A. Decision support models in climate policy. Eur J Oper Res 2020;280:1–24. https://doi.org/10.1016/j.ejor.2019.01.017.
[36] Gabriel SA, Kydes AS, Whitman P. The national energy modeling system: a large- scale energy-economic equilibrium model. Oper Res 2001;49:14–25. https://doi. org/10.1287/opre.49.1.14.11195.
[37] Antosiewicz M, Nikas A, Szpor A, Witajewski-Baltvilks J, Doukas H. Pathways for the transition of the Polish power sector and associated risks. Environ Innov Soc Transitions 2019. https://doi.org/10.1016/j.eist.2019.01.008.
[38] Keramidas K, Kitous A, Despres J, Schmitz A. POLES-JRC model documentation 2017. https://doi.org/10.2760/814959.
[39] E3mlab/. PRIMES MODEL 2013-2014 Detailed model description. n.d. [40] Despr�es J, Hadjsaid N, Criqui P, Noirot I. Modelling the impacts of variable
renewable sources on the power sector: reconsidering the typology of energy modelling tools. Energy 2015;80:486–95. https://doi.org/10.1016/J. ENERGY.2014.12.005.
[41] Keppo I, Strubegger M. Short term decisions for long term problems – the effect of foresight on model based energy systems analysis. Energy 2010;35:2033–42. https://doi.org/10.1016/J.ENERGY.2010.01.019.
[42] Victoria M, Zhu K, Brown T, Andresen GB, Greiner M. The role of storage technologies throughout the decarbonisation of the sector-coupled European energy system. Energy Convers Manag 2019;201:111977. https://doi.org/ 10.1016/j.enconman.2019.111977.
[43] Brown T, Schlachtberger D, Kies A, Schramm S, Greiner M. Synergies of sector coupling and transmission reinforcement in a cost-optimised, highly renewable European energy system. Energy 2018;160:720–39. https://doi.org/10.1016/j. energy.2018.06.222.
[44] Aalborg University EnergyPLAN | Advanced energy systems analysis computer model n.d. http://www.energyplan.eu/.
[45] Østergaard PA, Lund H, Mathiesen BV. Energy system impacts of desalination in Jordan. Int J Sustain Energy Plan Manag 2014;1:29–40. https://doi.org/10.5278/ ijsepm.2014.1.3.
[46] Lund H, Lund H. Chapter 4 – tool: the EnergyPLAN energy system Analysis model. Renew Energy Syst 2014:53–78. https://doi.org/10.1016/B978-0-12-410423- 5.00004-3.
[47] Nastasi B, Lo Basso G. Hydrogen to link heat and electricity in the transition towards future Smart Energy Systems. Energy 2016;110:5–22. https://doi.org/ 10.1016/J.ENERGY.2016.03.097.
[48] Nastasi B, Lo Basso G. Power-to-Gas integration in the transition towards future urban energy systems. Int J Hydrogen Energy 2017;42:23933–51. https://doi. org/10.1016/J.IJHYDENE.2017.07.149.
[49] Lo Basso G, Nastasi B, Salata F, Golasi I. Energy retrofitting of residential buildings—how to couple Combined Heat and Power (CHP) and Heat Pump (HP) for thermal management and off-design operation. Energy Build 2017;151: 293–305. https://doi.org/10.1016/J.ENBUILD.2017.06.060.
[50] Prina MG, Manzolini G, Moser D, Sparber W. Renewable energy high penetration scenarios using multi-nodes approach: analysis for the Italian case. In: 33rd Eur Photovolt Sol Energy Conf Exhib; 2017. p. 2164–70. https://doi.org/10.4229/ EUPVSEC20172017-6EO.2.1.
[51] Kannan R. The development and application of a temporal MARKAL energy system model using flexible time slicing. Appl Energy 2011;88:2261–72. https:// doi.org/10.1016/J.APENERGY.2010.12.066.
[52] Vaillancourt K, Alcocer Y, Bahn O, Fertel C, Frenette E, Garbouj H, et al. A Canadian 2050 energy outlook: analysis with the multi-regional model TIMES- Canada. Appl Energy 2014;132:56–65. https://doi.org/10.1016/j. apenergy.2014.06.072.
[53] Yeomans GR. Modeling Swedish hydropower and intermittent production variability in TIMES. 2017.
[54] EUROPA - The JRC-EU-TIMES model - Assessing the long-term role of the SET Plan Energy technologies | SETIS - European Commission n.d.. https://setis.ec.eur opa.eu/publications/relevant-reports/jrc-eu-times-model-assessing-long-term-r ole-of-set-plan-energy (accessed May 6, 2020).
[55] Astudillo MF, Vaillancourt K, Pineau PO, Amor B. Can the household sector reduce global warming mitigation costs? sensitivity to key parameters in a TIMES techno-economic energy model. Appl Energy 2017;205:486–98. https://doi.org/ 10.1016/j.apenergy.2017.07.130.
[56] Balyk O, Andersen KS, Dockweiler S, Gargiulo M, Karlsson K, Næraa R, et al. TIMES-DK: technology-rich multi-sectoral optimisation model of the Danish energy system. Energy Strateg Rev 2019;23:13–22. https://doi.org/10.1016/j. esr.2018.11.003.
[57] L€offler K, Hainsch K, Burandt T, Oei P-Y, Kemfert C, von Hirschhausen C. Designing a model for the global energy system—GENeSYS-MOD: an application of the open-source energy modeling system (OSeMOSYS). Energies 2017;10: 1468. https://doi.org/10.3390/en10101468.
[58] Deane JP, Chiodi A, Gargiulo M, �O Gallach�oir BP. Soft-linking of a power systems model to an energy systems model. Energy 2012;42:303–12. https://doi.org/ 10.1016/J.ENERGY.2012.03.052.
[59] Haydt G, Leal V, Pina A, Silva CA. The relevance of the energy resource dynamics in the mid/long-term energy planning models. Renew Energy 2011;36:3068–74. https://doi.org/10.1016/J.RENENE.2011.03.028.
[60] Poncelet K, Delarue E, Six D, Duerinck J, D’haeseleer W. Impact of the level of temporal and operational detail in energy-system planning models. Appl Energy 2016;162:631–43. https://doi.org/10.1016/J.APENERGY.2015.10.100.
[61] Savic D. Single-objective vs. Multiobjective optimisation for integrated decision support. In: Integrated assessment and decision. Proc FIRST bienn meet int environ model softw soc. vol. 1; 2002. p. 7–12.
[62] Slesser M. Macmillan dictionary of energy. Macmillan; 1988. [63] Mixed-Integer Programming (MIP) - A Primer on the Basics - Gurobi n.d. http
s://www.gurobi.com/resource/mip-basics/(accessed September 26, 2019). [64] Dynamic Programming Algorithm - an overview | ScienceDirect Topics n.d. http
s://www.sciencedirect.com/topics/computer-science/dynamic-programming- algorithm (accessed September 26, 2019).
[65] Silver EA, Victor R, Vidal V, de Werra D. A tutorial on heuristic methods. Eur J Oper Res 1980;5:153–62. https://doi.org/10.1016/0377-2217(80)90084-3.
[66] Open Models - wiki.openmod-initiative.org n.d. https://wiki.openmod-initiative. org/wiki/Open_Models (accessed December 21, 2017).
[67] Hilpert S, Kaldemeyer C, Krien U, Günther S, Wingenbach C, Plessmann G. The Open Energy Modelling Framework (oemof) - a novel approach in energy system modelling. DoiOrg 2017. https://doi.org/10.20944/preprints201706.0093.v1.
[68] Hilpert S, Kaldemeyer C, Wiese F, Plessmann G. A qualitative evaluation approach for energy system modelling software—case study results for the open energy modelling framework (Oemof). 2017. https://doi.org/10.20944/ preprints201708.0069.v1.
[69] Oemof Developer Group. A modular open source framework to model energy supply systems n.d. https://oemof.org/(accessed September 15, 2017).
[70] Reiner Lemoine Institut n.d. https://reiner-lemoine-institut.de/(accessed September 26, 2019).
[71] Center for Sustainable Energy Systems | Flensburg University of Applied Sciences n.d. https://hs-flensburg.de/en/hochschule/forschungsinstitut/center-sustain able-energy-systems (accessed September 26, 2019).
[72] Calliope: a multi-scale energy systems (MUSES) modeling framework — Calliope 0.5.4 documentation n.d. https://calliope.readthedocs.io/en/stable/(accessed February 12, 2018).
[73] ETH Zürich - Homepage | ETH Zürich n.d. https://ethz.ch/de.html (accessed September 26, 2019).
[74] Brown T, H€orsch J, Schlachtberger D. PyPSA: Python for power system Analysis. 2017. https://doi.org/10.5334/jors.188.
[75] H€orsch J, Hofmann F, Schlachtberger D, Brown T. PyPSA-eur: an open optimisation model of the European transmission system 2018.
[76] Oberdorf I. (PKM). KIT - homepage. 2019.
M.G. Prina et al.
Renewable and Sustainable Energy Reviews 129 (2020) 109917
15
[77] PLEXOS® Simulation Software - Energy Exemplar n.d. https://energyexemplar. com/products/plexos-simulation-software/(accessed August 30, 2018).
[78] Energy Exemplar n.d. https://energyexemplar.com/(accessed September 26, 2019).
[79] Gamamod — Chair of Business Management, esp Energy Economics — TU Dresden n.d. https://tu-dresden.de/bu/wirtschaft/ee2/forschung/modelle/g amamod?set_language¼en (accessed August 30, 2018).
[80] Hauser P, Heinrichs HU, Gillessen B, Müller T. Implications of diversification strategies in the European natural gas market for the German energy system. Energy 2018;151:442–54. https://doi.org/10.1016/J.ENERGY.2018.03.065.
[81] Technische Universit€at Dresden — TU Dresden n.d. https://tu-dresden. de/(accessed September 26, 2019).
[82] 2050 DESSTINEE n.d. https://sites.google.com/site/2050desstinee/(accessed August 30, 2018).
[83] Imperial College London n.d. https://www.imperial.ac.uk/(accessed September 26, 2019).
[84] ficus n.d. https://github.com/yabata/ficus. [85] Atabay D. An open-source model for optimal design and operation of industrial
energy systems. Energy 2017;121:803–21. https://doi.org/10.1016/J. ENERGY.2017.01.030.
[86] Technische Universit€at München. Nature 2017;544:47–52. https://doi.org/ 10.1038/nature21717.
[87] Gils HC, Scholz Y, Pregger T, Luca de Tena D, Heide D. Integrated modelling of variable renewable energy-based power supply in Europe. Energy 2017;123: 173–88. https://doi.org/10.1016/J.ENERGY.2017.01.115.
[88] Homepage - DLR Portal n.d. https://www.dlr.de/EN/Home/home_node.html (accessed September 26, 2019).
[89] Aalborg University - Knowledge for the World n.d. http://www.en.aau. dk/(accessed October 25, 2017).
[90] Østergaard PA. Reviewing EnergyPLAN simulations and performance indicator applications in EnergyPLAN simulations. Appl Energy 2015;154:921–33. https:// doi.org/10.1016/j.apenergy.2015.05.086.
[91] Batas Bjeli�c I, Rajakovi�c N. Simulation-based optimization of sustainable national energy systems. Energy 2015;91:1087–98. https://doi.org/10.1016/j. energy.2015.09.006.
[92] Mahbub MS, Cozzini M, Østergaard PA, Alberti F. Combining multi-objective evolutionary algorithms and descriptive analytical modelling in energy scenario design. Appl Energy 2016;164:140–51. https://doi.org/10.1016/j. apenergy.2015.11.042.
[93] Garegnani G, Prina MG, Vaccaro R, Cozzini M, Filippi Oberegger U, Moser D. EPLANopt: EnergyPLAN optimization library. https://gitlab.inf.unibz.it/URS /EPLANopt; 2016.
[94] Prina MG, Cozzini M, Garegnani G, Manzolini G, Moser D, Filippi Oberegger U, et al. Multi-objective optimization algorithm coupled to EnergyPLAN software: the EPLANopt model. Energy 2018;149. https://doi.org/10.1016/j. energy.2018.02.050.
[95] GENESYS – ENERGY SYSTEM PATHWAY OPTIMISATION n.d. http://www.gene sys.rwth-aachen.de/wordpress/.
[96] Bußar C, Moraes Jr L, Moser A, Wiernes PE, Sauer DU, St€ocker P, et al. Large-scale integration of renewable energies and impact on storage demand in a European renewable power system of 2050: sensitivity study. J Energy Storage 2016;6: 1–10. 2352-152x.
[97] RWTH AACHEN UNIVERSITY - Rheinisch-Westfaelische Technische Hochschule - English n.d. https://www.rwth-aachen.de/go/id/a/?lidx¼1 (accessed September 26, 2019).
[98] Henning H-M, Palzer A. A comprehensive model for the German electricity and heat sector in a future energy system with a dominant contribution from renewable energy technologies—Part I: Methodology. Renew Sustain Energy Rev 2014;30:1003–18. https://doi.org/10.1016/J.RSER.2013.09.012.
[99] Palzer A, Henning H-M. A comprehensive model for the German electricity and heat sector in a future energy system with a dominant contribution from renewable energy technologies – Part II: Results. Renew Sustain Energy Rev 2014; 30:1019–34. https://doi.org/10.1016/J.RSER.2013.11.032.
[100] Forschen für die Energiewende - Fraunhofer-Institut für Solare Energiesysteme ISE - Fraunhofer ISE n.d. https://www.ise.fraunhofer.de/(accessed February 12, 2018).
[101] Loulou R, Goldstein G, Noble K. Documentation for the MARKAL family of models. 2004.
[102] Loulou R, Remne U, Kanudia A, Lehtila A, Goldstein G. Energy technology systems analysis programme documentation for the TIMES model PART I 2005.
[103] IEA-ETSAP | Energy Systems Analysis n.d. https://iea-etsap.org/(accessed February 12, 2018).
[104] OSeMOSYS - Home n.d. http://www.osemosys.org/(accessed February 12, 2018). [105] Howells M, Rogner H, Strachan N, Heaps C, Huntington H, Kypreos S, et al.
OSeMOSYS: the open source energy modeling system: an introduction to its ethos, structure and development. Energy Pol 2011;39:5850–70. https://doi.org/ 10.1016/J.ENPOL.2011.06.033.
[106] KTH Royal Institute of Technology in Stockholm | KTH n.d. https://www.kth. se/en (accessed September 26, 2019).
[107] The TEMOA Project | Tools for Energy Model Optimization and Analysis n.d. http://www.temoaproject.org/(accessed April 5, 2018).
[108] Hunter K, Sreepathi S, DeCarolis JF. Modeling for insight using tools for energy model optimization and analysis (Temoa). Energy Econ 2013;40:339–49. https:// doi.org/10.1016/J.ENECO.2013.07.014.
[109] NC State University n.d. https://www.ncsu.edu/(accessed September 26, 2019).
[110] IIASA -Model for Energy Supply Strategy Alternatives and their General Environmental Impact (MESSAGE) n.d. http://webarchive.iiasa.ac.at/Research/E NE/model/message.html (accessed August 30, 2018).
[111] IIASA - International Institute for Applied Systems Analysis n.d. https://www. iiasa.ac.at/(accessed September 26, 2019).
[112] Wiese F, Bramstoft R, Koduvere H, Pizarro Alonso A, Balyk O, Kirkerud JG, et al. Balmorel open source energy system model. Energy Strateg Rev 2018;20:26–34. https://doi.org/10.1016/J.ESR.2018.01.003.
[113] Technical University of Denmark - DTU n.d. https://www.dtu.dk/english (accessed September 26, 2019).
[114] Bogdanov D, Breyer C. North-East Asian Super Grid for 100% renewable energy supply: optimal mix of energy technologies for electricity, gas and heat supply options. Energy Convers Manag 2016;112:176–90. https://doi.org/10.1016/J. ENCONMAN.2016.01.019.
[115] LUT University - LUT n.d. https://www.lut.fi/web/en (accessed September 26, 2019).
[116] Gulagi A, Bogdanov D, Breyer C. The demand for storage technologies in energy transition pathways towards 100% renewable energy for India. Energy Procedia 2017;135:37–50. https://doi.org/10.1016/J.EGYPRO.2017.09.485.
[117] Sadiqa A, Gulagi A, Breyer C. Energy transition roadmap towards 100% renewable energy and role of storage technologies for Pakistan by 2050. Energy 2018;147:518–33. https://doi.org/10.1016/J.ENERGY.2018.01.027.
[118] Mahbub MS, Viesi D, Cattani S, Crema L. An innovative multi-objective optimization approach for long-term energy planning. Appl Energy 2017;208: 1487–504. https://doi.org/10.1016/J.APENERGY.2017.08.245.
[119] Prina MG, Lionetti M, Manzolini G, Sparber W, Moser D. Transition pathways optimization methodology through EnergyPLAN software for long-term energy planning. Appl Energy 2019;235:356–68. https://doi.org/10.1016/J. APENERGY.2018.10.099.
[120] LEAP n.d. https://www.energycommunity.org/default.asp?action¼introduction (accessed September 21, 2018).
[121] Wierzbowski M, Lyzwa W, Musial I. MILP model for long-term energy mix planning with consideration of power system reserves. Appl Energy 2016;169: 93–111. https://doi.org/10.1016/J.APENERGY.2016.02.003.
[122] Pina A, Silva C, Ferr~ao P. Modeling hourly electricity dynamics for policy making in long-term scenarios. Energy Pol 2011. https://doi.org/10.1016/j. enpol.2011.06.062.
[123] Perez RR. Wind field and solar radiation characterization and forecasting: a numerical approach for complex terrain. n.d.
[124] Welsch M, Deane P, Howells M, �O Gallach�oir B, Rogan F, Bazilian M, et al. Incorporating flexibility requirements into long-term energy system models – a case study on high levels of renewable electricity penetration in Ireland. Appl Energy 2014;135:600–15. https://doi.org/10.1016/J.APENERGY.2014.08.072.
[125] Shortt A, Kiviluoma J, O’Malley M. Accommodating variability in generation planning. IEEE Trans Power Syst 2013;28:158–69. https://doi.org/10.1109/ TPWRS.2012.2202925.
[126] Palmintier BS, Webster MD. Impact of operational flexibility on electricity generation planning with renewable and carbon targets. IEEE Trans Sustain Energy 2016;7:672–84. https://doi.org/10.1109/TSTE.2015.2498640.
[127] Kirschen DS, Ma J, Silva V, Belhomme R. Optimizing the flexibility of a portfolio of generating plants to deal with wind generation. In: 2011 IEEE Power Energy Soc. Gen. Meet., IEEE; 2011. p. 1–7. https://doi.org/10.1109/PES.2011.6039157.
[128] Belderbos A, Delarue E. Accounting for flexibility in power system planning with renewables. Int J Electr Power Energy Syst 2015;71:33–41. https://doi.org/ 10.1016/J.IJEPES.2015.02.033.
[129] Palmintier B. Flexibility in generation planning: identifying key operating constraints. In: 2014 power syst. Comput. Conf. IEEE; 2014. p. 1–7. https://doi. org/10.1109/PSCC.2014.7038323.
[130] Zhang L, Capuder T, Mancarella P. Unified unit commitment formulation and fast multi-service LP model for flexibility evaluation in sustainable power systems. IEEE Trans Sustain Energy 2016;7:658–71. https://doi.org/10.1109/ TSTE.2015.2497411.
[131] Prina MG, Fanali L, Manzolini G, Moser D, Sparber W. Incorporating combined cycle gas turbine flexibility constraints and additional costs into the EPLANopt model: the Italian case study. Energy 2018. https://doi.org/10.1016/j. energy.2018.07.007.
[132] Ma J, Silva V, Belhomme R, Kirschen DS, Ochoa LF. Evaluating and planning flexibility in sustainable power systems. IEEE Trans Sustain Energy 2013;4:200–9. https://doi.org/10.1109/TSTE.2012.2212471.
[133] Prina MG, Cozzini M, Garegnani G, Manzolini G, Moser D, Filippi Oberegger U, et al. Multi-objective optimization algorithm coupled to EnergyPLAN software: the EPLANopt model. Energy 2018;149:213–21. https://doi.org/10.1016/j. energy.2018.02.050.
[134] Lund H, Østergaard PA, Connolly D, Ridjan I, Mathiesen BV, Hvelplund F, et al. Energy storage and smart energy systems. Int J Sustain Energy Plan Manag 2016; 11:3–14. https://doi.org/10.5278/IJSEPM.2016.11.2.
[135] Connolly D, Lund H, Mathiesen BV, Østergaard PA, M€oller B, Nielsen S, et al. Smart energy systems: holistic and integrated energy systems for the era of 100% renewable energy. 2013.
[136] Connolly D, Lund H, Mathiesen BV. Smart Energy Europe: the technical and economic impact of one potential 100% renewable energy scenario for the European Union. Renew Sustain Energy Rev 2016;60:1634–53. https://doi.org/ 10.1016/j.rser.2016.02.025.
[137] Mathiesen BV, Lund H, Connolly D, Wenzel H, Østergaard PA, M€oller B, et al. Smart Energy Systems for coherent 100% renewable energy and transport
M.G. Prina et al.

Renewable and Sustainable Energy Reviews 129 (2020) 109917
16
solutions. Appl Energy 2015;145:139–54. https://doi.org/10.1016/j. apenergy.2015.01.075.
[138] Nastasi B, Lo Basso G, Astiaso Garcia D, Cumo F, de Santoli L. Power-to-gas leverage effect on power-to-heat application for urban renewable thermal energy systems. Int J Hydrogen Energy 2018. https://doi.org/10.1016/J. IJHYDENE.2018.08.119.
[139] Pfenninger S, DeCarolis J, Hirth L, Quoilin S, Staffell I. The importance of open data and software: is energy research lagging behind? Energy Pol 2017;101: 211–5. https://doi.org/10.1016/J.ENPOL.2016.11.046.
[140] Savic D. Single-objective vs. Multiobjective optimisation for integrated decision support. In: Integrated assessment and decision. Proc FIRST bienn meet int environ model softw soc. vol. 1; 2002. p. 7–12.
[141] Østergaard PA. Reviewing optimisation criteria for energy systems analyses of renewable energy integration. Energy 2009;34:1236–45. https://doi.org/ 10.1016/j.energy.2009.05.004.
[142] Doukas H, Nikas A, Gonz�alez-Eguino M, Arto I, Anger-Kraavi A. From integrated to integrative: delivering on the paris agreement. Sustainability 2018;10:2299. https://doi.org/10.3390/su10072299.
[143] Moret S, Bierlaire M, Mar�echal F. Strategic energy planning under uncertainty: a mixed-integer linear programming modeling framework for large-scale energy systems. 2016. p. 1899–904. https://doi.org/10.1016/B978-0-444-63428- 3.50321-0.
[144] Moret S, Babonneau F, Bierlaire M, Mar�echal F. Decision support for strategic energy planning: a robust optimization framework. Eur J Oper Res 2019. https:// doi.org/10.1016/J.EJOR.2019.06.015.
[145] Swider DJ, Weber C. The costs of wind’s intermittency in Germany: application of a stochastic electricity market model. Eur Trans Electr Power 2007;17:151–72. https://doi.org/10.1002/etep.125.
[146] Yue X, Pye S, DeCarolis J, Li FGN, Rogan F, Gallach�oir B�O. A review of approaches to uncertainty assessment in energy system optimization models. Energy Strateg Rev 2018;21:204–17. https://doi.org/10.1016/J. ESR.2018.06.003.
[147] Messner S, Golodnikov A, Gritsevskii A. A stochastic version of the dynamic linear programming model MESSAGE III. Energy 1996;21:775–84. https://doi.org/ 10.1016/0360-5442(96)00025-4.
[148] Kanudia A, Loulou R. Robust responses to climate change via stochastic MARKAL: the case of Qu�ebec. Eur J Oper Res 1998;106:15–30. https://doi.org/10.1016/ S0377-2217(98)00356-7.
[149] Skar C, Doorman G, P�erez-Vald�es GA, Tomasgard A. A multi-horizon stochastic programming model for the European power system Working paper 2/2016 A multi-horizon stochastic programming model for the European power system 2016.
[150] Fripp M. Switch: a planning tool for power systems with large shares of intermittent renewable energy. Environ Sci Technol 2012;46:6371–8. https://doi. org/10.1021/es204645c.
[151] Powell WB, George A, Sim~ao H, Scott W, Lamont A, Stewart J. SMART: a stochastic multiscale model for the analysis of energy resources, technology, and policy. Inf J Comput 2012;24:665–82. https://doi.org/10.1287/ijoc.1110.0470.
[152] Good N. Using behavioural economic theory in modelling of demand response. Appl Energy 2019;239:107–16. https://doi.org/10.1016/j. apenergy.2019.01.158.
[153] Frederiks ER, Stenner K, Hobman EV. Household energy use: applying behavioural economics to understand consumer decision-making and behaviour. Renew Sustain Energy Rev 2015;41:1385–94. https://doi.org/10.1016/j. rser.2014.09.026.
[154] Spandagos C, Ng TL. Fuzzy model of residential energy decision-making considering behavioral economic concepts. Appl Energy 2018;213:611–25. https://doi.org/10.1016/j.apenergy.2017.10.112.
[155] Trutnevyte E, Hirt LF, Bauer N, Cherp A, Hawkes A, Edelenbosch OY, et al. Societal transformations in models for energy and climate policy: the ambitious next step. One Earth 2019;1:423–33. https://doi.org/10.1016/j. oneear.2019.12.002.
[156] van den Berg NJ, Hof AF, Akenji L, Edelenbosch OY, van Sluisveld MAE, Timmer VJ, et al. Improved modelling of lifestyle changes in Integrated Assessment Models: cross-disciplinary insights from methodologies and theories. Energy Strateg Rev 2019;26:100420. https://doi.org/10.1016/j. esr.2019.100420.
M.G. Prina et al.
Related Documents