! Reference Number: 3 A REVIEW OF THE SALMON SMOLTSURVIVAL INDEX'AS PROPOSED BY THE U.S. ENVIRONMENTAL PROTECTION AGENCY AS WATER QUALITY STANDARDS FOR THE SAN FRANCISCO BAY ESTUARY prepared for The California Urban Water Agencies Sacramento, California by The Metropolitan Water District of Southern California contracted to Randy Bailey Bailey Environmental 3050 Meadow Creek Road Lincoln, CA 95648 91 6-645- 1235 March 7,1994 This draft report was prepared as a technical document for reference use by California Urban Water Agencies and others in preparing their comments to the C U.S. Environmenw Protection Agency on "Water Quality Standards for Surface Waters of the Sacramento River, San Joaquin River, and San kancisco Bay and Delta of the State of California, January 6,1994." Thb draft technical report is I not part of the CUWA formal comments to EPA.

Welcome message from author
This document is posted to help you gain knowledge. Please leave a comment to let me know what you think about it! Share it to your friends and learn new things together.
Transcript

! Reference Number: 3
A REVIEW OF THE SALMON SMOLT SURVIVAL INDEX'AS PROPOSED BY THE U.S. ENVIRONMENTAL PROTECTION AGENCY AS WATER QUALITY
STANDARDS FOR THE SAN FRANCISCO BAY ESTUARY
prepared for
The California Urban Water Agencies Sacramento, California
by The Metropolitan Water District of Southern California
contracted to Randy Bailey
Bailey Environmental 3050 Meadow Creek Road
Lincoln, CA 95648 91 6-645- 1235
March 7,1994
This draft report was prepared as a technical document for reference use by California Urban Water Agencies and others in preparing their comments to the
C U.S. Environmenw Protection Agency on "Water Quality Standards for Surface Waters of the Sacramento River, San Joaquin River, and San kancisco Bay and Delta of the State of California, January 6,1994." Thb draft technical report is
I not part of the CUWA formal comments to EPA.

I PREFACE
This report was prepared for the California Urban Water Agencies (CUWA) by The Metropolitan Water District of Southern California as a part of a CUWA review of the U.S. Environmental Protection Agency's proposed "Water Quality Standards for Surface Waters of the Sacramento River, San Joaquin River, and San Francisco Bay and Delta of the State of California (40 CFR Part 131)". The Metropolitan Water District of Southern California commissioned this report as a part of CUWA's overall review and evaluation of this standard. This report addresses the following scientific question:
1) What is the scientific and technical basis for the proposed salmon smolt survival criteria for the Sacramento and San Joaquin Rivers?

TABLE OF CONTENTS
page The Proposed Standard .................................................................... 4
Summary of Primary Conclusions ............. .. .................................... 5
Technical Analysis ........................................................................... 7
Literature Reviewed ........................................................................ 11
Appendix A ............................................ ................................. 12
Appendix B ....................................................................................... 13

SALMON SMOLT SURVIVAL CRITERIA
THE PROPOSED STANDARD
The U.S. Environmental Protection Agency is proposing salmon smolt survival criteria to protect fall-nm chinook salmon smolts entering the Delta using the following set of values:
Sacramento River Water Year Wet .45 Above Normal -38 Below Normal .36 Dry .32 Critical .29
$an Joaauin Rive1
Wet .46 Above Normal .30 Below Normal .26 Dry .23 Critical .20
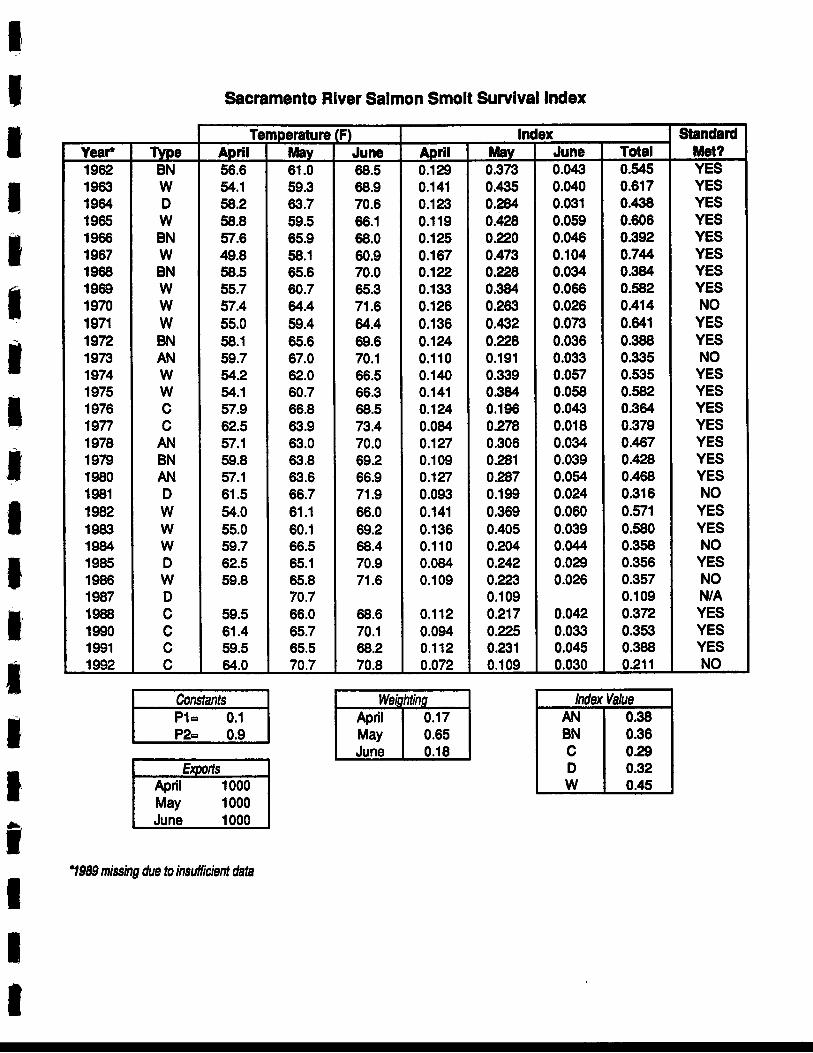
The Salmon Smolt Survival Index is based on two formulas, one for the Sacramento River and one for the San Joaquin River. The Sacramento River Salmon Index (SRSI) is computed according to the following formula: (Author's Note: the formula below is that computed and published by the U.S. Fish and Wildlife Semce in the source documents cited by EPA and differs from the formula published by EPA in the Federal Register. The corrections and correct values are presented in bold type.)
SRSI = 1-[(-2.45925 + 0.0420748 T) + (-0.5916024 + 0.017968 T + 0.0000434 E)(Pl) + (-1.613493 + 0.0319584 T) (P2) - (-2.45925 + 0.0420748 T)(-0.5916024 + 0.01 7968 T + 0.0000434 E)(Pl) - (-2.45925 + 0.0420748 T)(-1.613493 + 0.0319584 T)(P2)]
where:
T = Average Water Temperature in Fahrenheit at Freeport E = Average State Water Project plus Central Valley Project exports in wbic feet per second (cfs) (from DAYFLOW) P1 = Proportion of water diverted into the Delta Cross-Channel and Georgians Slough at Walnut Grove P2 = Proportion of water remaining in the Sacramento River at Walnut Grove
The San Joaquin River Salmon Index (SJSI) is calculated according to the following formula:
SJSI = (0.341271 - 0.000025 E + 0.000067 FM.8
Where: E = Average Central Valley Project plus State Water Project Exports in cfs F = Mean daily flow in cfs in the San Joaquin River at Stockton, calculated as Old River flow subtracted from San Joaquin River flow at Mossdale. Old River flow is calculated from the ratio of Brandt Bridge flow to exports.

SUMMARY OF PRIMARY CONCLUSIONS
1. The index as proposed is not a water quality standard. The proposed standard does include water temperature as one component for one part of the standard. However, the water temperature at the defining location is relatively independent of flow and is nearly completely dependent on ambient air temperature. This conclusion was part of the testimony presented by the U.S. Bureau of Reclamation to the State Water Resources Control Board in previous hearings (Appendix A). The remainder of the terms in the equations used to derive the smolt survival index are all water flow related terms and not tradition water quality constituent parameters.
2. The fundamental basis for the equations developed by the U.S.Fish and Wildlife Service and the Environmental Protection Agency to derive the smolt survival index is flawed. The mortality equations used to develop the Sacramento River index are based on probabilities of mortality occumng in a particular reach. However, since the estimation of survival from the experimental data often exceeds 10096, the U.S. Fish and Wildlife Service has scaled the data by dividing all estimates by 1.8 in order to bring the survival estimates into the biologically meaningful range of 100% or less. According to Dr. John Rice, Statistics Department, University of California, Berkeley, scaling the data by the largest experimental multiplier necessary to bring the survival estimates to unity or less invalidates their use as probabilities. This data transformation invalidates all of the estimates of survival used to develop the regression equations which in turn invalidates the equations used to develop the proposed standards since the equations used to estimate mortality in a particular reach are based on probability estimates.
3. Even if the probability questions raised in 2. above could be solved, the propagation of error throughout the entire mathematical sequence of estimations used by EPA to develop the salmon survival indices render the proposed standard values meaningless. For example, just adjusting the effective sampling width of the trawl to a realistic value Gustified by U.S. Fish .
and Wildlife Service in Exhibit 31, Appendix 12) and placing 95% confidence intervals on the predicted smolt survival index changes the prediction by approximately 100%. Numerous other uncertainty errors associated with the various estimates used to develop the proposed standards only increase the unreliability of the proposed standard.
4. There are numerous mathematical results that can be calculated from the proposed standard, based on reasonable operational assumptions, that do not make any sense biologically. For example, if you assume exports are zero and attempt to reduce mortality to zero on the Sacramento River using the equations in the proposed standard, you get very different results. In Reach 1, above Walnut Grove, mortality is zero when the water temperature is approximately 58 degrees. In Reach 3, below Walnut Grove and after water is diverted through the Delta Cross-Channel and/or Georgiana Slough, the water temperature necessary to reach zero is approximately 50 degrees. If you solve the equations for mortality equal to zero in Reach 2, which is the amount of flow diverted by the Cross-Channel and Georgiana Slough that travels down the lower Mokelumne and San Joaquin rivers, the water temperature must be approximately 30 degrees. The difference in these answers clearly

indicate that factors other than water temperature and proportion of flow diverted are affecting swiva l based on the experimental data. Until all of the factors affecting survival are incorporated into the estimates of survival, the use of the equations to develop salmon survival indices is patently invalid.
5. The U.S. Fish and Wildlife Service has cautioned repeatedly that the results of their analyses should not be used outside the range of parameters from which they were developed. The Environmental Protection Agency ignored this warning and failed to incorporate it into the equations they are proposing as standards. For example, at very high flows it is possible to violate the proposed standards under a normal operational procedures just because of the mathematical calculation of the salmon survival index. None of the experimental data used to develop the various regression equations was based on very high flow data. Most fishery biologists would agree that exports would have a minimal effect on salmon smolt migration at very high flow conditions.
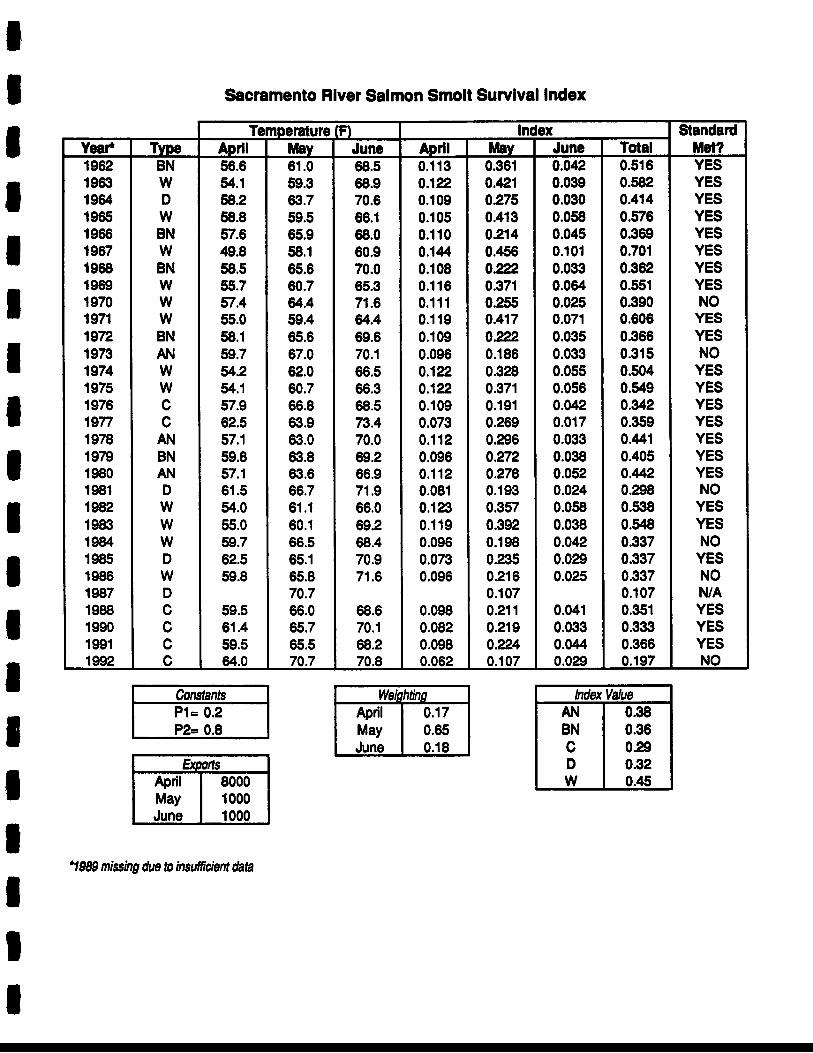
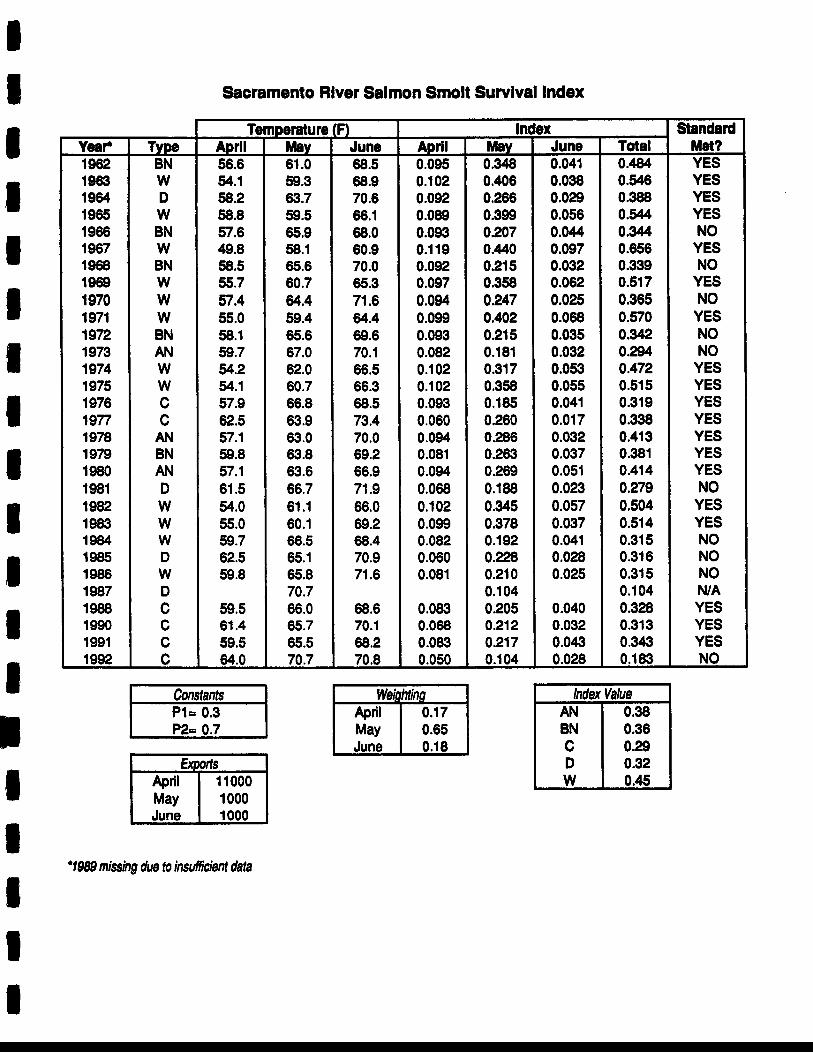
6. Given reasonable operational and flow conditions in the spring, the standard on the Sacramento River will be violated in most years because of the lack of influence of outflow on water temperature at Freeport. An analysis of the 1962-92 mean monthly (April, May, June) water temperature record for Freeport indicates that the proposed standards for the Sacramento River will be violated based on the naturally occumng water temperatures. The ability of flow releases to significantly reduce the temperatures is highly speculative. The data indicate that the proposed standard would have been violated 5 years out of 29 even if exports were zero in April, May and June and both the Delta Cross-Channel and Georgiana Slough were completely closed and no water were permitted to flow into the northern delta (Appendix B). As proposed, the Sacramento River Salmon Index cannot be met even with a physical barrier preventing flow down Georgiana Slough. It is important to note that of the 5 years of violations in the 1962-92 data set, 3 occurred in wet years and an additional violation occurred in an above normal year.

TECHNICAL ANALYSIS
1. The estimates of survival used by the U.S. Fish and Wildlife Service (USFWS) are highly variable and have not been sufficiently validated to be used in developing smolt survival criteria. For example:
The smolt survival index based on recaptures from midwater trawl catches at Chipps Island of coded wire tagged (CWT) smolts released at various locations in the upper estuary is based on the fonnula S = RfMT (0.0078), where R is the number of trawl recaptures from CWT salmon released upstream of the trawling site; M is the number of marked salmon released for a particular tag group, and T is a factor accounting for the portion of time sampled when the marked fish were passing the trawl site (time between capture of first and last marked fish). The value (0.0078) equals the trawl width (9.1 meters) divided by the width of the channel at Chipps Island (1200 m). This information is presented in Appendix 16 of USFWS Exhibit 31 of the 1987 State Water Resources Control Board water qualitylwater rights hearings on the BayPelta. However, in Appendix 12 of the same document, while discussing how the total smolt abundance estimate is made, USFWS uses a smaller effective trawl width to verify earlier estimates. The effective width is 6.5 m not 9.1 m used to estimate smolt survival.
The effect of using just a change in trawl width greatly changes the smolt survival estimate by changing the value (0.0078) to (0.0054) with a resultant change in the smolt survival index of 29%. For example, data from the 1979 Sacramento release of tag group 6-62-05, produces an estimate of S = 0.4198 using the 9.1 m trawl width factor of (0.0078). while the same data produces an estimate of S = 0.6047 using the 6.5 m trawl width factor. The critical point in this analysis is that the estimate of S (smolt survival) is used to develop the regression equations used to develop the smolt survival criteria proposed by EPA.
2. Estimates of survival for an individual tag group exceeds 100% for some tag groups using the existing methods of analysis.
An examination of Table 4-1. of Exhibit 31 of the USFWS submittals for the 1987 hearings and Appendix 9 of the USFWS's Sacramento-San Joaquin Estuary Fishery Resource Office 1991 Annual Progress Report reveals smolt survival values exceeding 100% for various smolt survival estimates. We know that this is biologically impossible and therefore, the methods used to derive the estimates must be examined carefully. The current practice used by USFWS to address this problem is to divide all raw survival estimates (those derived directly from the tag recoveries) by a factor of 1.8 which is the highest ratio of upstream released recoveries to downstream released recoveries found to date. This correction factor is important since it reduces all estimates of smolt survival in the Delta by approximately 55% before the data are used to develop the survival/water temperature regression relationships which are the basis for the EPA's proposed standards. Only some tag groups have raw survival estimates exceeding 100%. but the USFWS has decided that best way to account for these "anomalies" is to divided the raw estimates by the 1.8 factor. This analysis should be looked at carefully since the survivallwater temperature regressions are the cornerstone of the smolt survival index. Discussions with Dr. John Rice, Statistics Department, University of California, Berkeley on
February 10,1994 about the use of the 1.8 scaler reached the conclusion that use of the scaler invalidates the use of estimates of smolt survival (the smolt survival index) as probabilities. If the estimates of molt survival cannot be used as probabilities, then the equations (which are based on probabilities) used to develop the regression relationships and are the foundation of the proposed standard are invalid.
3. The USFWS has used the mean smolt survival index estimate to develop the relationship between molt survival and water temperature using regression analysis. However, the 95% confidence intervals around those estimates are in many cases quite large and result in survival estimates of less than zero and greater than 1 which are both biologically impossible.
Table 4-1. of Exhibit 31 of the USFWS's 1987 hearings submission shows the mean survival estimates 4 1 standard deviation for the trawling effort at Chipps Island. These confidence intervals are large in some cases exceeding 43% of the point estimate. When the confidence intervals are expanded to the scientific standard of 95% (1.96 standard deviations), the interval estimates are as much as 86% of the point estimate. This analysis needs to be carefully examined since the variance around the point estimate is so large (but not unusual in biological data analysis). While this level of precision may be appropriate for management actions, the question of whether or not this level is acceptable for regulatory purposes needs to be examined. A sensitivity analysis of the proposed standards should be conducted incorporating all of the estimates used to derive the proposed standards and rerun using the estimates at 1 and 1.96 standard deviations. This analysis will help determine if the standards are inordinately biased in a certain manner by the errors associated with the data. Propagation of error throughout the development of the equations is a major concern since compounding the errors of numerous estimates seriously weakens or invalidates the predictive capability of the final relationship.
4. There are a number of assumptions that serve as the foundation for the the smolt survival index that are based on USFWS's smolt survival model. Each of these assumptions may have an influence (although possibly unquantifiable in some cases) on the smolt survival estimates generated by the USFWS's model. It appears that EPA has adopted the model as a finite mechanism for determining estimated smolt survival without examining the underlying assumptions adequately. The following assumptions should be examined in light of the model as developed by USFWS:
1. The relationship between the water temperature of the hatchery stocking truck and the receiving waters at the time of stocking of the test fish. The difference in water temperature between the hatchery tmck and the receiving waters have been documented as high as 20 F. with the receiving water at 75 F. only 3 E below the lethal maximum for chinook Amon smolts. Inspection of the limited data indicates that generally lower survival estimates occur at higher water temperatures in the receiving waters and when the water temperature differential between the hatchery truck and receiving waters are greatest. An analysis of this factor is needed.
2. An evaluation of the effects of stocking smolts from different hatchery stocks. The survival estimates are based on the coded wire tag returns from smolts stocked at various

locations in the rivers and a number of downstream locations. An evaluation of the source stocks used in the estimate experiments is needed. Also, only fall-run chinook smolts have been used in the experiments even though all four runs are migrating at sometime during the proposed regulatory period.
3. Data outliers are eliminated from the data analysis without adequate explanation. In several instances data have been excluded from various regression analyses without an adequate explanation by USFWS. The effects of analyzing all the data should be evaluated since including all data could change, in some cases substantially, the linear relationships used to develop portions of the smolt survival indices proposed by EPA.
4. The derivation and use of the survival estimates need to be evaluated further. The entire derivation and use of the survival estimates should be re-examined. A number of the raw estimates of survival exceed 100% using the USFWS's methodology. A survival of greater than 100% is impossible. Also, in some analyses where the estimated values exceed 1.0 or are less than 0, the data are truncated to facilitate the analysis. This data truncation procedure should be examined to determine the effects on the relationships derived.
5. The USFWS assumes that the effects of predators is constant at all water temperatures. The model developed by the USFWS assumes the effects of predators is constant at all water temperatures. Determining the effects of predation at various water temperatures is an extremely difficult, but not impossible task. However, given the abundance of warmwater predators in the Delta, ignoring how the rate of predation changes with increasing water temperature the effects on smolt migration is not justified. Several predators present in the Delta have major increases in activity between the water temperatures of 60-75 F. which coincides with range of temperatures into which the experimental stockings occurred.
6. The USFWS assumes that 90% of the smolts are vulnerable to the trawling gear used to capture fish at Chipps Island. The USFWS has assumed that approximately 90% of the smolts migrating past Chipps Island are subject to capture by their trawling operations. This assumption is not supported in any of the source documents cited by EPA. In addition, USFWS assumes that the probability of capture during daylight hours is equal to the capture probability at night. This assumption is based on the high tubidity levels at Chipps Island. This assumption is not supported by any comparative capture data for day versus night trawling. Data from other river systems indicate that the rate of migration and location in the water column of the smolts changes from day to night. The lack of night sampling may tend to bias the survival estimates lower since the capture probabilities and assumption of random distribution in the water column are probably closer to being met.
5. The proposed standard assumes that since EPA has decided that the standard will improve smolt survival for fall-run chinook salmon smolts, then that same standard will improve conditions for striped bass, delta smelt, longfin smelt, white and green sturgeon, American shad and Sacramento splittail. No data are presented or referenced to support this claim. At a minimum, EPA should document the literature used to reach this conclusion.

6. The proposed standard fails to address the effects of agricultural return flow water quality on salmon smolt survival. The basis for the striped bass spawning survival standard proposal is to protect spawning striped bass from the adverse effects of poor water quality in the San Joaquin River. It would seem prudent to address the effects of the water quality of agricultural return flows on salmon smolt survival in a water quality standard designed to protect salmon smolt survival.
7. The parameters used to derive the San Joaquin smolt survival index are all various measurements of flow in the San Joaquin River and southern Delta. Unless these flow relationships are related to water quality and not some aspect of smolt survival based on migration rates or which Delta channel a particular smolt migrates down, the use of flow parameters seems inappropriate as a water quality parameter. If the flows are directly related to a water quality parameter, such as water temperature, then a possible connection between flows and a water quality parameter is justified. However, no connection between San Joaquin River flow and lower water temperatures out to the recovery location at Chipps Island is presented or referenced.
8. The proposed smolt survival criteria under part 131 of the proposed regulations are based on testimony by the USFWS and several of their publications. However, the equations used to calculate the Sacramento River Salmon Index in part 131 do not match those presented as the USFWS equations in Appendix I11 of the draft regulations or in the USFWS's June 1992 Sacramento-San Joaquin Estuary Fishery Resource Office 1991 Annual Progress Report. Some of the coefficients for the water temperature terms are incorrect and the coefficients of variation for some of the equations are different from the USFWS's documents. No explanation for the changes are given by EPA. Also, the definition of P1 in this part is different than the definition in Appendix III.
9. Calculation of the Sacramento River Salmon Index (SRSI) under a variety of operational and ,
water temperature scenarios and an inspection of the monthly mean water temperature records from Freeport indicate two problems: 1) the use of a water year type to change the SRSI values in the standards is not justified. The critical factor used to derive the index is water temperature at Freeport. The water temperature at Freeport is relatively independent of water year type, with ambient air temperature the predominant factor determining water temperature, not total outflow and 2) Using the mean monthly water temperature records for Freeport for the period 1962-1992 to calculate the SRSI as EPA proposes, indicates that the range of values proposed as standards by water year type by EPA could not have been met under any reasonable circumstances. Influencing the water temperature at Freeport with water releases in considered highly impractical by the U.S. Bureau of Reclamation (Appendix A). Approximately 400 operational scenarios that vary exports by month and change the proportion of flow down the Delta Cross-Channel and Georgians Slough were applied to the 29 year historical water temperature record at Freeport. Representative scenarios, at both high and low levels of exports and proportion of flow (PI) are presented in Appendix B. All 400 scenarios are available for inspection. The bottom line is that the standards as proposed for the SRSI are not attainable, in some years, even under the most restrictive operational scenarios.
Literature Reviewed
Kelley, D.W., S. Greene, W.T. Mitchell. 1991. Estimating the effect of changing delta environmental conditions on Sacramento basin fall run chinook salmon stock. California Department of Water Resources, Sacramento, California.
Kjelson, M., S. Greene, and P. Brandes. 1989. A model for estimating mortality and survival of fall-nm chinook salmon smolts in the Sacramento River delta between Sacramento and Chipps Island. California State Water Resources Control Board, Bay-Delta Proceedings Exhibit WQCP-USFWS-1.
Kjelson, M., B. Loudermilk, D. Hood, and P. Brandes. 1990. The influence of San Joaquin River inflow, Central Valley and State Water Project exports and migration route on fall-run chinook smolt survival in the southern delta during the spring of 1989. State Water Resources Conrtrol Board Proceedings WQCP-USFWS-4.
Rowell, J.H. 1990. U.S. Bureau of Reclamation, monthly temperature model, Sacramento River basin. U.S. Bureau of Reclamation, Sacramento, California. WQCP-USBR-127.
U.S.Fish and Wildlife Service. 1987. The needs of chinook salmon, Oncorhvnchus tshawytscha, in the Sacramento-San Joaquin Estuary. Exhibit 31, State Water Resources Control Board 1987 Water QualitylWater Rights Proceeding on the San Francisco Bay/Sacramento-San Joaquin Delta.
U.S. Fish and Wildlife Service. 1988. Determine survival and productivity of juvenile chinook salmon in the Sacramento-San Joaquin Estuary. Annual Progress Report, Fisheries Assistance Office, Stockton, California. WQCP-USFWS-3.
U.S. Fish and Wildlife Service. 1989. Survival and productivity of juvenile chinook salmon in the Sacramento-San Joaquin Estuary. Annual Progress Report, Fisheries Assistance Office, Stockton, California. WQCP-USFWS-2.
U.S. Fish and Wildlife Service. 1992. Abundance and survival of juvenile chinook salmon in the Sacramento-San Joaquin Estuary. 1991 Annual Progress Report, Fishery Resource Office, Stockton, California. WRINT-USFWS-9.
U.S. Fish and Wildlife Service. 1992. Measures to improve the protection of chinook salmon in the Sacramento/San Joaquin River Delta. Expert testimony of United States Fish and Wildlife Service on chinook salmon technical information for State Water Resources Control Board, Water Rights Phase of the BayPelta Estuary proceedings July 6,1992. WRINT-USFWS-7.

WQCP USBR E x h i b i t 126 also referenced as
- WRINT USBR E x h i b i t 29
Comments of the
United States Bureau of Reclamation on the
Revised Draft Water Quality Control Plan for Salinity San Francisco Bay/Sacramento-San Joaquin Delta Estuary - before the
State Water Resources Control Board August 22. 1990
Introduction
In that the majority of the standards contained in Table 6-4 of the draft Water Quality Control Plan (draft Plan) are not changed from D-1485, our comments are directed at what the Bureau believes the record supports. We have also prepared comments and/or corrections to the discussion on agricultural water quality objectives within the draft Plan. These are attached and identified as WQCP USBR Exhibit 128.
Municipal and Industrial Standards
As we and others mentioned before, the IS0 mg/l chloride standard was and continues to be unsupported by the hearing record. The industrial users in Contra Costa County now have available to them a source of adequate quality to meet their needs. We refer to the evidence and testimony presented in the Phase I hearings. We believe the evidence clearly supports the 250 mgil chloride standard.
As we commented previously, the issue of disinfectant by-products such as trihalomethanes is an important issue. The Board and municipal and industrial suppliers have a responsibility to assure that users of Delta water ultimately have a safe and reliable supply of water. In the protection of this beneficial use, all alternative methods of achieving that protection or attaining a particular standard shou1.d be evaluated including the construction of Delta facilities. That evaluation must. of course, include an analysis of the impact of that protection or the attainment of alternative standards to other beneficial uses. We note. that as presented in the various results of the operation studies work group. the maintenance of high source water quality in the Delta with outflow has significant impacts to water supplies.
Western and Interior Delta Amicnltural Standards
The Bureau believes that the results of the Corn Study, presented in Phase I of these hearings, supports a standard of 1.5 mmho/cm EC. The study noted that leaching may periodically be required to reduce soil salinity to below the threshold value of an adverse affect on corn yield. A study is underway to examine leaching practices and to quantify their costs and effectiveness. This study is being jointly supported by the Bureau along with the Department of Water Resources, the State Water Resources Control Board and the Central Delta Water Agency.

With respect to these and other individual standards, we suggest that the Board establish procedures by which an individual standard can be modified independently of the entire Plan as additional data becomes available, for instance when the leaching study or other similar studies relating to other standards are completed.
South Delta Amicultural Standards
Again we would reference the recommendation we made at the close of Phase I of these hearings. We still recommend that the agreement being negotiated among DWR, USBR and SDWA be completed before the Board sets standards for the South Delta and therefore would suggest that the Board not set standards at this time. The parties are very close to completion of this agreement.
By this agreement the parties will agree on the mitigation measures necessary to resolve the impact of the CVP and the SWP upon the SDWA. The initial physical facilities which will be constructed pursuant to the agreement are designed to provide adequate water levels and circulation in the South Delta. These facilities are an important first step in resolving the South Delta problem. Other measures that may be necessary will include drainage management both upstream of the South Delta and within the South Delta to meet the Stage 2 standards. An important point will be that the agreement will recognize that a11 water users on the San Joaquin River upstream of the South Delta have an impact- and a corresponding responsibility in meeting the water requirements of South Delta agricultural users. The agreement addresses water quality and flow on the San Joaquin River by providing interim protection for the water users in the South Delta Water Agency until a permanent solution is developed according to the framework provided in the agreement.
As the agreement recognizes, the responsibility of upstream users for meeting standards developed for the South Delta will have to be determined and wrapped into the process now underway. This may prove to be a formidable task and we do not presently envision how this will be accomplished.
Striped Bass
The Bureau believes that at this point in time it would be of little use to expand striped bass spawning habitat in the San Joaquin River. Evidence indicates that under present conditions striped bass are not spawning habitat limited. The principal problems that have been identified relate to rearing habitat further downstream and to losses and dislocation caused by export pumping and in-Delta pumping. Until facilities to isolate export pumping from southern Delta channels are constructed, increasing spawning habitat is unlikely to benefit striped bass numbers. As we have mentioned before, a work group to identify and develop guidelines for the operation of cross-Delta transfer facilities is needed.
Chinook Salmon
The proposed temperature objectives for salmon protection in the Delta will require significantly large releases from storage reservoirs and may, in some circumstances, be impossible to meet. The Bureau has recently completed development of a temperature model of the Sacramento River and
2

the CVP-SWP system above the Delta. The results and verification report of this model are being submitted as WQCP USBR Exhibit 127.
These studies indicate that significant quantities of water would be required to beoreleased from system reservoirs to meet the proposed standard ofo68 in the Sacramento River at Freeport. For example, to achieve a 1 F reduction at that location during May and June could requi;e additional releases from Shasta Dam of more than 400,000 acre-feet. A 3 F reduction could require in excess of 1,000,000 acre-feet under certain hydrologic and climatic conditions. Table 14 of USBR Exhibit 127 lists the releases, computed by the temperature model, required to meet the Freeport temperature objective in May and June. This table is based on a 56-year DWR operation study. The meeting of the objective during the July- September period would require even greater releases. In light of the quantities required, we consider it infeasible to meet these objectives with reservoir releases.
The impact of such releases to conditions upstream of the Delta later in the year would be significant. Massive springtime releases to manage Delta temperatures could result in low reservoir levels in the summer and fall. This in turn, would result in temperature problems, for example, in the American River below Folsom Dam and in the upper Sacramento River below Keswick Dam. This could adversely impact the winter, spring, and fall salmon runs on the Sacramento River and the fall run on the American River. We consider attempting to meet Delta temperature objectives with reservoir releases to be not only an impractical action but an unreasonable action.
Figures 15 and 16 of WQCP USBR Exhibit 127 compare temperature model results of two DWR operation studies: A base study and a study augmenting spring flow to reduce Freeport temperatures. The efforts to reduce' Freeport temperatures in May and June (Figure 15) cause temperature increases at Red Bluff in July and August (Figure 16). The results averaged over 56 years are shown in Table 16.
These studies also evaluated the ability of upstream management actions other than increased flows to reduce Freeport temperatures. These actions included a Shasta Dam temperature control device. the bypassing of Oroville releases around Thermalito forebay and afterbay, increasing riparian shade along the entire length of the Sacramento River from Keswick Dam to Freeport by 10 percent, and eliminating the major agricultural drainage discharges to the Sacramento River in the reach from Butte Creek to Sacramento. The Yay and June temperature reductions were computed to be 0.7'~ or less for each action, and 1.5'~ or less for all four actions combined, based on a 56-year average (1922 - 1977) of predicted temperatures using a DWR CVP-SWP operation study. The results are summarized on Table 15. These reductions would not be sufficient to meet the proposed Freeport temperature objectives most of the time considerAng tbat maximum daily river temperatures at Freeport frequently exceed 68 F by 4 F or more during May and June.
Our modeling effort does not cover the San Joaquin River. Our knowledge of the two systems (Sacramento and San Joaquin) indicates that the capability to manage temperatures on the San Joaquin River is no greater and perhaps less than that on the Sacramento River. Our initial assessment is that these objectives are probably impossible to meet and would therefore consider it unreasonable to adopt them.
3

We 'believe that facilities to improve salmon passage through the belta would be a more efficient and cost-effective alternative than massive flows and that they,be studied by the Board and the Five Agency Salmon Committee.
Suisun Marsh
We are pleased to note that the Suisun Marsh Preservation Agreement and the standards within it are proposed for ultimate adoption. As stated by our attorney, the antidegradation concept as it applies to the Suisun Marsh standards is being reviewed. However, we would note that the outflow required to meet the 1978 standard is significant and was deemed unreasonable by the Board at that time. Notwithstanding that legal issue, the Bureau will be participating, to the degree appropriate with our technical staff, in the biological assessments needed for the implementation of the Suisun Marsh Preservation Agreement.
Pronram of Im~lementation. ~ o m ~ l i a n c e Monitorinn and Special Studies
The Bureau is pleased to note the Board's c h a r statement on page 7-2 - Sharing the Obligation to Meet Water Quality Objectives in the Estuary. However, determining exactly how that obligation or responsibility is to be shared will be a significant task.
We note that the compliance monitoring program described in Table 7-1 is essentially the same program as contained in D-1485. We believe that a complete review of the existing program is necessary before a new or revised program is included in a water quality control plan. In fact, a review of certain elements of the current water quality and zooplankton monitoring program is presently underway as part of the Interagency Ecological Studies Program. We believe this review should be expanded i n t o an overall assessment of the effectiveness of the monitoring program over the last two decades in meeting program objectives.
Although this monitoring program is important and necessary, from the Bureau's perspective, resolution of environmental issues associated with . water project operations is the ultimate end product, not the monitoring program itself. In this present review it has been suggested that raiher than modify the present program, it may be a easier task to design a new program from scratch. In doing so principal assumptions would be:
1 ) The monitoring program will include the entire Estuary. from upstream reservoirs in the Sacramento and San Joaquin Valleys to the Golden Gate;
2 ) the program will include monitoring for long-term trends of certain parameters, but should emphasize focused cause and effect studies:
3 ) the program would be designed to separate water project and non- water project impacts to the Estuary; and
4) the program realistically identify what can be accomplished considering available resources.
With respect to special studies. we and the other water right holders on the system do not have unlimited resources to undertake an unlimited range
4

of studies. We recommend that a process be developed for the identification and selection of studies to be undertaken and that this process be implemented within the Interagency Ecological Studies Program. This is particularly important if the responsibility, both in terms of who will actually do the study and/or who will pay for it. is to be borne by all water users.
Because of the importance of economic studies to the development of a plan that balances all beneficial uses, how those studies are done is of great concern to us. Again, as we stated in February, we do not believe that Chapter 4 of the draft plan presents an equitable and complete picture of the concerns facing the users of Bay-Delta waters. In undertaking economic evaluations or studies, careful consideration must be given to make sure that economic, financial and/or expenditure data are not misinterpreted or extended to areas where their use is improper. For instance, Section 6.3 - Economic Considerations provides a general discussion of the costs of achieving higher water quality within San Joaquin River and Delta. This discussion focuses primarily on the revenues forgone as the result of . releasing water for instream uses instead of supply for the traditional water user. The problem with that type of analysis is this: The current contract rate is not the value of water, rather it is the cost necessary to repay the capital investment and interest for the construction of facilities and associated operation and maintenance costs. Because of the absence of a discussion of the value of the water to the farmers, this leaves the reader of the draft Plan with impression that.this is a relative insignificant figure. It is not.
In addition. no mention has been made about the economic impact of denying or changing water service to a relatively small geographic area. Such an action to local communities, in terms of loss in agricultural production and support industries could very well be devastating, both economically and socially.
Summarv
We urge the Board to establish, support. participate and ultimately rely upon the results and findings of technical work groups on specific t o p i c s . A work group concerning the identification of and development of guidelines for the operation of cross-Delta transfer facilities is 'clearly necessary.
Thank you for the opportunity to comment.

Uncontrollable factors, such as climatic influences, and adverse impacts on the other project uses including upseream fisheries would make the strategy of attempting to meet, Delta temperature objectives with reservoir releases impractical and unreasonable.
Jack Rowel1 July 29, 1992
Bay-Delta Testimony - Phase I11 We are resubmitting WQCP-USBR - Exhibit 127 as WRINT-USBR - Exhibit 30
for the record of this hearing. This exhibit documents the USBR temperature model of the Sacramento River Basin which has been used to evaluate the effects of CVP-SWP operations on Sacramento River temperatures at Freeport.
These studies indicate that significant quantities of water would be required to be released from system reservoirs to meet the proposed temperature objectives in the Sacramento River at Freeport. For example, to achieve a 1°F reduction at that location during May and June could require additional releases from Shasta Dam of more than 400,000 acre-feet. A 3OF reduction could require in excess of 1,000,000 acre-feet under certain hydrologic and climatic conditions. Table 14 of USBR exhibit 30 lists the releases, computed by the temperature model, required to meet the Freeport temperature objectives in May and June. This table is based on a 56-year DWR operation study. In light of the quantities required, we consider it infeasible to meet Delta temperature objectives with reservoir releases.
The impact of such releases on conditions upstream of the Delta later in the year would be significant. Massive springtime releases to manage Delta temperatures could result in low reservoir levels in the summer and fall. This in turn, would result in temperature problems, for example, in the American River below Folsom Dam and in the upper Sacramento River below Keswick Dam. This could adversely impact the winter, spring and fall salmon runs on the Sacramento River and the fall run on the American River.

APPENDIX B
SELECTED OPERATIONAL SCENARIOS AND RESULTING SACRAMENTO RIVER SALMON INDEX (SRSI) VALUES
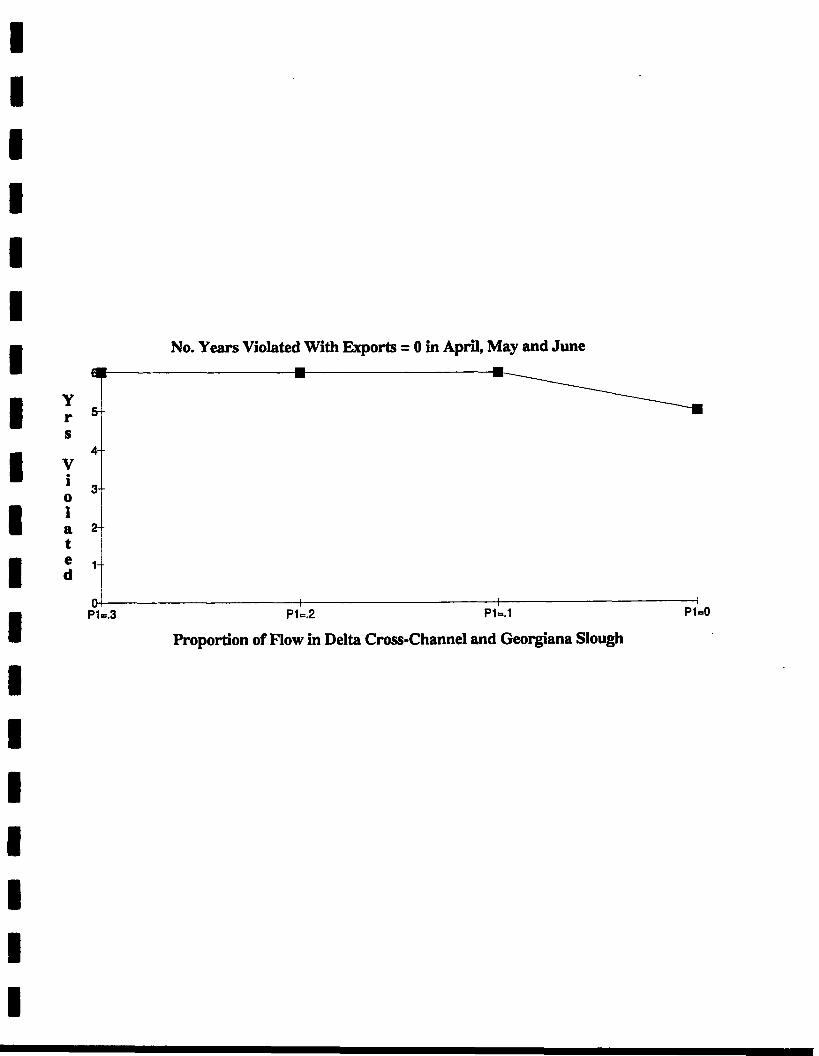
No. Years Violated With Exports = 0 in April, May and June
Proportion of Flow in Delta Cross-Channel and Georgians Slough

No. years standards violated with May & June exports=1000 at four P1 values
10- I I m a I I I I
8
April Exports (cfs)

I SeCmmto River Sam Smalt ~~ Index
YES VES YE$ YES YES YES YE6 NO YES YES NO YES YES YES YES YES YES YES NO YES YES fw YES NO NIA YES YES YES N O .

ml June 0.18
1906 I$%? 1968 1- 1970 1971 IBZ IB73 1-4 1976 1 9 ~ 1977 1978 im 1880
1m 1881 1- 1W 1885 1- 1887 lQW 1900 1 189e
BN W BM W W W BN AN W HI c C
AN BN AN n W W W D w D C C
- C C
67.6 #A 68.5 SS.7 57.4 SJ.0 58.1 a.7 64.2 64.1 s7.a 82.6 57.1 60.8 57.7 61 .s 64.0 56.0 99.7 625 ~9.8
59.5 61.4 59.5 64.0
65.9 S.1 65.8 60.7 ad 69.4 65.8 87.0 620 60.7 g s ~ 63.9 83.0 63.8 $3.6 66.7 61 .I 60.1 686 65.1 =.a 70.7 6 8 , O 65.7 85.5 70.7
88.0 604 70.0 6S.3 n.8 64.4 m.6 70.1 68.6 a.3 60.5 73.4 70.0 692 66.9 ns 66.0 692 6e.4 709 n.6
68.6 70.1 602 70.8
0.1P 0.160 0.118 0.129 0.1P 0.132 o.in 0.108 0.136 0.136 o.rm 0.083 0.124 0.107 0.124 0.081 0137 0.132 0.108 0.083 0.10'~
0.110 0,092 0.110 0.071
M 8 0 4 2 RpS
0.376 0- 0.422 0225 0.190 0.332 0.370 0.194 0273 US01 one 0.262 0.187 0.382 0.387 0202 O P S 0,220 0.108 0216 0,2P Om 0.109
0.046 0.902 0.034 0.06S 0.028 0.072 0.98 0 0.- 0.067 0.043 0.018 0.034 0.m 0.053 0 . w 0.080 0.030 0,043 Om28 0.026
0.042 0.033 0-W O m
0988 0.724 0.379 Om OA08 0.020 om 0&1 0- 0870 OSO 0.374 0.459 0.422 0.460 0.319 0.658 0 s 0.363 0351 0.353 0.109 0.367 0.348 0.382 Om0
YES YES YES YES NO
YES YES I
NO YES YE8 YES YES YES YES YES NO
YES YES NO
YES NO MIA YES YES YE6 NO

'
1867 1- lsQ IBA l9?l $872 1@?3 1 974 1976 1 a76 1Bn 1928 lg?9 1Bm rm la 18Q3 1W 1986 1- re87 1988
1997 (em , 1-
W BN W W W BN AN W W C C AN BN AN D W W W 0 w ' D C C C C
49.8 58.5 66.7 97.4 66-0 58.1 60.7 54.2 54.1 57.0 625 57.1 SBS S7.1 61 -6 54.0 65.0 59.7 §2.5 S.8
S.5 61.4 89.5 64.0
58.1 6S.6 80.7 B ~ A 6Q.4 05.6 67.0 624 60.7 66a 839 63.0 638 63.6 66.7 81.1 60.1 66.5 65.1 BJB 70.7 66.0 65.7 6S.5 70.7
808 70.0 a3 71.6 84.4 68.6 70.1 88.6 $6.3 W.6 73.4 70-0 a2 863 71 s 68.0 692 88.4 70.9 71.6
68.6 70.1 682 70.8
0.168 0.125 0.134 o.rn 0.137 0.124 0.111 0.141 0.141 0.126 0.0W 0.128 0.110 0.128 0.084 0.142 0.137 0.111 0.085 0.110
0.113 0.- 0.113 0.472
0.476 Om 0.366 o s 0.434 0.230 0.193 0.341 0586 0.198 0280 0.308 02B3 OP89 0201 0.372 0.408 0206 0344 0225 0.1 10 Om9 0.22'7 0233 0.110
0.105 0.034 0.066 0.m 0.073 0.037 0.034 0.057 0.058 0.043 0.M8 0.034 0.039 0 . 0 5 4 0.m 0.W 0.039 0.044 0.030 0.026
6.043 0,034 O . W 0.030
0.748 0.987 0886 o . ~ e 0.646 0.m OL138 0.938 0586 0.367 0,383 0.470 O A 3 2 0.471 0.318 0.676 0.584 0.36l 0.338 0.360 0.1 10 0.375 0 3 s 0,391 02l3
YES VES YES NO YES YES NO YES YES YES YES YES YES YES NO
YES YES NO
YES NO WA YES YES YES NO

Set-o FISuw Salmon Smon SuMvnl Index
3- lsgl i968 1984 1970 197l Ion 1W3 1874 f 975 1876 19?7 19718 la79 lam lml 1- 1Q&3 'OBl 1QB5 1988 1987 1- lee0 1981 1992
BN f W BN W W W BN AN W W C C
AN BN AN D W W W D W D C C C c
W.6 498 66.6 S.7 57.4 65.0 88.1 m.7 642 54.1 5719 825 67.1 S.6 57.1 61.5 64.0 95.0 69.7 62.5 69.8
58.5 61.4 S.5 64.0
36.1 65.6 60.7 64.4 W.4 66.6 67.0 $2.0 80.7 688 839 63.0 836 63.6 66.7 61 -1 60.1 66.5 65.1 6S.8 70.7 68.0 65.7 65.5 70.7
80.g 70.0 853 71.6 M A m.8 70.1 86.6 66.3 68.6 73.4 70 ,O 88.2 66.9 71 8 68.0 892 66.4 709 71.6
m.6 70.1 BB2 70.8
0.178 0.128 0.138 0.131 0.142 1 0.114 0.146 0.147 0.129 0.087 0.192 0.113 0.132 0.- 0.147 0.142 0.114 0.087 0.113
0.116 0.097 0.118 0.074
OR80 0235 O m 0271 OA46 0135 0.187 0349 O H 0202 0286 0.316 02es 0396 0204 0.332 0.419 0210 02SO O M g 0.1 12 O m 0.232 O a S 0.112
0.108 0.035 0.067 0.028 0,076 0.037 0.054 0.068 O.Og0
0.044 0.018 0.096 0.040 0.066 0.025 0.062 0.040 0.W 0.030 0.026
0.043 0.034 0.046 0.030
0.m O= 0.602 0- 0,- 0.409 0344 0.554 0.803 0376 0.391 0.42 0.442 0.483 0.326 0.691 0.647 0.368 0388 0.3$8 0.1 12 O m 9383 0.400 o m
YES YES YES I'm YES YES No VES YES YES YES YES YES YES YES YES YES NO
YES NO WA YES YES YES NO

Sacramento River Salmon Smolt Suwlval lndex
E P I il E C
VQtB missing due to insufficient data
Constants
P2= 0.7
June 1000
_ YeaP 1962 1963 1964 1 965 1966 1967 1968 1969 1 970 1971 1 972 1 973 1974 1975 1 976 i 9 n 1978 1 979 1980 1981 1 982 1 983 1 984 1 985 1986 1 987 1 988 1990 1991 1992
Wei htin
June 0.18
Type BN W D W BN W BN W W W BN AN W W C c AN BN AN D W W W D W D C C C C
M x value
0.45
Standard Met? YES YES YES YES YES YES YES YES NO
YES YES NO
YES YES YES YES YES YES YES NO
YES YES NO
YES NO N/ A YES YES YES NO
April 56.6 54.1 58.2 58.8 57.6 49.8 58.5 55.7 57.4 55.0 58.1 59.7 54.2 54.1 57.9 62.5 57.1 59.8 57.1 61.5 54.0 55.0 59.7 62.5 59.8
59.5 61.4 59.5 64.0
Total 0.508 0.573 0.410 0.566 0.367 0.686 0.361 0.542 0.388 0.595 0.364 0.315 0.498 0.541 0.342 0.356 0.437 0.402 0.437 0.298 0.530 0.540 0.336 0.335 0.336 0.1 04 0.349 0.332 0.364 0.200
Temperature May 61 .O 59.3 63.7 59.5 65.9 58.1 65.6 60.7 64.4 59.4 65.6 67.0 62.0 60.7 66.8 63.9 63.0 63.8 63.6 66.7 61.1 60.1 66.5 65.1 65.8 70.7 66.0 65.7 65.5 70.7
June 0.041 0.038 0.029 0.056 0.044 0.097 0.032 0.062 0.025 0.068 0.035 0.032 0.053 0.055 0.041 0.017 0.032 0.037 0.051 0.023 0.057 0.037 0.041 0.028 0.025
0.040 0.032 0.043 0.028
(F) June 68.5 68.9 70.6 66.1 68.0 60.9 70.0 65.3 71.6 64.4 69.6 70.1 66.5 66.3 68.5 73.4 70.0 69.2 66.9 71.9 66.0 69.2 68.4 70.9 71.6
68.6 70.1 68.2 70.8
April 0.119 0.128 0.115 0.1 11 0.116 0.149 0.114 0.122 0.117 0.125 0.115 0.103 0.128 0.128 0.115 0.079 0.118 0.102 0.118 0.087 0.129 0.125 0.103 0.079 0.102
0.104 0.088 0.104 0.067
Index May 0.348 0.406 0.266 0.399 0.207 0.440 0.215 0.358 0.247 0.402 0.215 0.181 0.317 0.358 0.185 0.260 0.286 0.263 0.269 0.188 0.345 0.378 0.192 0.228 0.210 0.1 04 0.205 0.212 0217 0.104

Sacramento River Salmon Smolt Survival lndex
Constants El June 1000
YeaP 1962 1963 1964 1965 1 966 1967 1968 1969 1 970 1971 1972 1973 1974 1975 1976 1 977 1 978 1979 1980 1981 1982 1 983 1 984 1985 1986 1 987 1 988 1990 1991 1992
- --
Wei htin
June 0.18
Type BN W D W BN W BN W W W BN AN W W C C
AN BN AN D W W W D W D C C C
-- C
hdex Value
0.32 0.45
Standard Me13 YES YES YES YES YES YES YES YES NO
YES YES NO YES YES YES YES YES YES YES NO
YES YES NO
YES NO N/ A YES YES YES NO
t 7989 misshg due to insufficient data
April 56.6 54.1 58.2 58.8 57.6 49.8 58.5 55.7 57.4 55.0 58.1 59.7 54.2 54.1 57.9 62.5 57.1 59.8 57.1 61.5 54.0 55.0 59.7 62.5 59.8
59.5 61.4 59.5 64.0
Total 0.527 0.595 0.424 0.586 0.379 0.71 5 0.373 0.562 0.401 0.61 8 0.376 0.325 0.516 0.562 0.353 0.368 0.452 0.415 0.453 0.307 0.551 0.560 0.347 0.345 0.347 0.1 07 0.360 0.342 0.376 0.205
Temperature May 61 .O 59.3 63.7 59.5 65.9 58.1 65.6 60.7 64.4 59.4 65.6 67.0 62.0 60.7 66.8 63.9 63.0 63.8 63.6 66.7 61.1 60.1 66.5 65.1 65.8 70.7 66.0 65.7 65.5 70.7
June 0.042 0.039 0.030 0.058 0.045 0.101 0.033 0.064 0.025 0.071 0.035 0.033 0.055 0.056 0.042 0.017 0.033 0.038 0.052 0.024 0.058 0.038 0.042 0.029 0.025
0.041 0.033 0.044 0.029
April 0.124 0.134 0.119 0.115 0.121 0.158 0.118 0.128 0.1 21 0.130 0.119 0.106 0.134 0.134 0.120 0.082 0.122 0.105 0.122 0.090 0.135 0.130 0.106 0.082 0.105
0.108 0.091 0.108 0.070
(F) June 68.5 68.9 70.6 66.1 68.0 60.9 70.0 65.3 71.6 64.4 69.6 70.1 66.5 66.3 68.5 73.4 70.0 69.2 66.9 71.9 66.0 69.2 68.4 70.9 71.6
68.6 70.1 68.2 70.8
Index May 0.361 0.421 0.275 0.413 0.214 0.456 0.222 0.371 0.255 0.417 0.222 0.186 0.328 0.371 0.191 0.269 0.296 0.272 0.278 0.193 0.357 0.392 0.198 0.235 0.216 0.1 07 0.211 0.219 0.224 0.107
Sacramento River Salmon Smolt Survival lndex
Constants
P2= 0.9
June 1000
Standard Met? YES YES YES YES YES YES YES YES NO
YES YES NO
YES YES YES YES YES YES YES NO
YES YES NO
YES NO N/ A YES YES YES NO
June 0.18
Total 0.545 0.617 0.438 0.606 0.392 0.744 0.384 0.582 0.414 0.641 0.388 0.335 0.535 0.582 0.364 0.379 0.467 0.428 0.468 0.316 0.571 0.580 0.358 0.356 0.357 0.1 09 0.372 0.353 0.388 0.21 1
lndex Value
0.32 0.45
Index June 0.043 0.040 0.031 0.059 0.046 0.104 0.034 0.066 0.026 0.073 0.036 0.033 0.057 0.058 0.043 0.018 0.034 0.039 0.054 0.024 0.060 0.039 0.044 0.029 0.026
0.042 0.033 0.045 0.030
Temperature (F)
YfiM missing due to insufficient data
1
* Year' 1962 1 963 1 964 1 965 1 966 1967 1968 1 969 1970 1971 1972 1 973 1974 1975 1976 ign 1978 1979 1980 1981 1 982 1 983 1 984 1 985 1 986 1987 1 988 1990 1991
, 1992
Type BN W D W BN W BN W W W BN AN W W C c
AN BN AN D W W W D W D C C C C
56.6 54.1 58.2 58.8 57.6 49.8 58.5 55.7 57.4 55.0 58.1 59.7 54.2 54.1 57.9 62.5 57.1 59.8 57.1 61.5 54.0 55.0 59.7 62.5 59.8
59.5 61.4 59.5 64.0
61 .O 59.3 63.7 59.5 65.9 58.1 65.6 60.7 64.4 59.4 65.6 67.0 62.0 60.7 66.8 63.9 63.0 63.8 63.6 66.7 61.1 60.1 66.5 65.1 65.8 70.7 66.0 65.7 65.5 70.7
68.5 68.9 70.6 66.1 68.0 60.9 70.0 65.3 71.6 64.4 69.6 70.1 66.5 66.3 68.5 73.4 70.0 69.2 66.9 71.9 66.0 69.2 68.4 70.9 71.6
68.6 70.1 68.2 70.8
0.129 0.141 0.123 0.119 0.125 0.167 0.122 0.133 0.126 0.136 0.124 0.110 0.140 0.141 0.124 0.084 0.127 0.109 0.127 0.093 0.141 0.136 0.110 0.084 0.109
0.112 0.094 0.112 0.072
May 0.373 0.435 0.284 0.428 0.220 0.473 0.228 0.384 0.263 0.432 0.228 0.191 0.339 0.384 0.196 0.278 0.306 0.281 0.287 0.199 0.369 0.405 0.204 0.242 0.223 0.1 09 0.217 0.225 0.231 0.109

# Sacramento Rlver Salmon Smolt Survival Index
D I I E Y I I I 1 fi 1 I E D 8
*I089 missing due to insufficient data
Constants l7El June 1000
Year* 1 962 1 963 1964 1965 1966 1967 1968 1969 1970 1971 1972 1 973 1974 1975 1976 1977 1978 1 979 1 980 1981 1 082 1 983 1 984 1985 1 986 1 987 1 988 1 990 1991 1 992
June 0.18
Type BN W D W BN W BN W W W BN AN W W C C
AN BN AN D W W W D W D C C C C
lndex Value
0.45
Standard Me13 YES YES YES YES YES YES YES YES NO
YES YES NO
YES YES YES YES YES YES YES YES YES YES NO
YES NO N/A YES YES YES NO
April 56.6 54.1 58.2 58.8 57.6 49.8 58.5 55.7 57.4 55.0 58.1 59.7 54.2 54.1 57.9 62.5 57.1 59.8 57.1 61.5 54.0 55.0 59.7 62.5 59.8
59.5 61.4 59.5 64.0
Total 0.564 0.639 0.452 0.626 0.404 0.772 0.396 0.602 0.428 0.663 0.400 0.344 0.554 0.603 0.375 0.391 0.482 0.442 0.483 0.325 0.591 0.601 0.368 0.366 0.368 0.1 12 0.383 0.363 0.400 0.216
Temperature May 61 .O 59.3 63.7 59.5 65.9 58.1 65.6 60.7 64.4 59.4 65.6 67.0 62.0 60.7 66.8 63.9 63.0 63.8 63.6 66.7 61.1 60.1 66.5 65.1 65.8 70.7 66.0 65.7 65.5 70.7
June 0.044 0.042 0.031 0.061 0.047 0.108 0.035 0.067 0.026 0.075 0.037 0.034 0.058 0.060 0.044 0.018 0.035 0.040 0.055 0.025 0.062 0.040 0.045 0.030 0.026
0.043 0.034 0.046 0.030
April 0.134 0.147 0.128 0.123 0.130 0.175 0.126 0.138 0.131 0.142 0.128 0.114 0.146 0.147 0.129 0.087 0.132 0.113 0.132 0.096 0.147 0.142 0.114 0.087 0.113
0.1 16 0.097 0.116 0.074
(F) June 68.5 68.9 70.6 66.1 68.0 60.9 70.0 65.3 71.6 64.4 69.6 70.1 66.5 66.3 68.5 73.4 70.0 69.2 66.9 71.9 66.0 69.2 68.4 70.9 71.6
68.6 70.1 68.2 70.8
Index May 0.385 0.450 0.293 0.442 0.226 0.490 0.235 0.396 0.271 0.446 0.235 0.197 0.349 0.396 0.202 0.286 0.315 0.289 0.296 0.204 0.382 0.419 0.210 0.250 0.229 0.112 0.224 0.232 0.238 0.112

@ Sacramento River Salmon Smolt Survival Index
I I C i I I I I E I I fi E II I
'1989 missing due to insufficient data
June 3000
June 0.18
YeaP 1962 1963 1 964 1 965 1 966 1967 1968 1 969 1 970 1971 1972 1973 1974 1 975 1976 1 977 1 978 1979 1980 1981 1 982 1 983 1 984 1 985 1986 1987 1988 1990 1991 1 992
lndex Value
0.45
Type BN W D W BN W BN W w W BN AN W W C C
AN BN AN D W W W D W D C C C C
Standard Met? YES YES YES YES NO YES NO YES NO
YES NO NO
YES YES YES YES YES YES YES NO YES YES NO NO NO N/ A YES YES YES NO
April 56.6 54.1 58.2 58.8 57.6 49.8 58.5 55.7 57.4 55.0 58.1 59.7 54.2 54.1 57.9 62.5 57.1 59.8 57.1 61.5 54.0 55.0 59.7 62.5 59.8
59.5 61.4 59.5 64.0
Total 0.481 0.543 0.386 0.538 0.344 0.653 0.338 0.513 0.364 0.565 0.341 0.293 0.470 0.512 0.319 0.334 0.411 0.378 0.412 0.277 0.502 0.511 0.314 0.313 0.314 0.096 0.327 0.310 0.341 0.183
Temperature May 61 .O 59.3 63.7 59.5 65.9 58.1 65.6 60.7 64.4 59.4 65.6 67.0 62.0 60.7 66.8 63.9 63.0 63.8 63.6 66.7 61.1 60.1 66.5 65.1 65.8 70.7 66.0 65.7 65.5 70.7
June 0.038 0.036 0.027 0.053 0.041 0.093 0.030 0.058 0.023 0.065 0.032 0.030 0.050 0.052 0.038 0.015 0.030 0.034 0.048 0.021 0.054 0.034 0.039 0.026 0.023
0.037 0.030 0.040 0.026
April 0.110 0.118 0.106 0.102 0.107 0.137 0.105 0.112 0.108 0.115 0.106 0.094 0.117 0.118 0.106 0.071 0.108 0.093 0.108 0.079 0.118 0.115 0.094 0.071 0.093
0.096 0.080 0.096 0.061
(F) June 68.5 68.9 70.6 66.1 68.0 60.9 70.0 65.3 71.6 64.4 69.6 70.1 66.5 66.3 68.5 73.4 70.0 69.2 66.9 71.9 66.0 69.2 68.4 70.9 71.6
68.6 70.1 68.2 70.8
Index May 0.333 0.390 0.253 0.383 0.196 0.422 0.203 0.343 0.234 0.386 0.203 0.170 0.302 0.343 0.174 0.247 0.273 0.250 0.256 0.177 0.330 0.363 0.181 0.216 0.198 0.096 0.193 0.201 0.206 0.096

Sacramento River Salmon Smolt Survival Index
Constants PI= 0.2 P2a 0.8 6
3000 June 3000
Year" 1962 1963 1964 1 965 1966 1967 1968 1969 1 970 1971 1 972 1 973 1974 1 975 1 976 1 977 1978 1979 1980 1981 1982 1983 1 984 1 98s 1 986 1 987 1 988 1990 1991 1 992
June 0.18
Type BN W D W BN W BN W W W BN AN W W C c
AN BN AN D W W W D W D C C C C
hdex Value
0.45
Standard Met? YES YES YES YES YES YES NO
YES NO
YES YES NO YES YES YES YES YES YES YES NO
YES YES NO
YES NO N/ A YES YES YES NO
VB80 missho due to insufficient data
Aprll 56.6 54.1 58.2 58.8 57.6 49.8 58.5 55.7 57.4 55.0 58.1 59.7 54.2 54.1 57.9 62.5 57.1 59.8 57.1 61.5 54.0 55.0 59.7 62.5 59.8
59.5 61.4 59.5 64.0
, Total 0.509 0.575 0.408 0.567 0.364 0.693 0.357 0.543 0.385 0.598 0.361 0.31 0 0.498 0.542 0.337 0.353 0.435 0.399 0.435 0.293 0.531 0.541 0.332 0.331 0.332 0.1 01 0.345 0.328 0.361 0.194
Tempereture May 61 .O 59.3 63.7 59.5 65.9 58.1 65.6 60.7 64.4 59.4 65.6 67.0 62.0 60.7 66.8 63.9 63.0 63.8 63.6 66.7 61 .I 60.1 66.5 65.1 65.8 70.7 66.0 65.7 65.5 70.7
Aprll 0.118 0.127 0.113 0.109 0.115 0.150 0.112 0.1 21 0.115 0.124 0.113 0.1 01 0.127 0.127 0.114 0.077 0.116 0.100 0.116 0.085 0.128 0.124 0.1 01 0.077 0.100
0.102 0.086 0.102 0.065
(F) June 68.5 68.9 70.6 66.1 68.0 60.9 70.0 65.3 71.6 64.4 69.6 70.1 66.5 66.3 68.5 73.4 70.0 69.2 66.9 71.9 66.0 69.2 68.4 70.9 71.6
68.6 70.1 68.2 70.8
May 0.351 0.410 0266 0.403 0.206 0.445 0214 0.361 0.246 0.406 0.214 0.179 0.318 0.361 0.183 0.260 0.287 0.263 0.269 0.186 0.347 0.381 0.191 0.227 0.208 0.1 01 0.203 0.211 0.216 0.101
Index June 0.040 0.038 0.029 0.056 0.043 0.098 0.032 0.061 0.024 0.068 0.034 0.031 0.053 0.054 0.040 0.016 0.032 0.036 0.050 0.022 0.056 0.036 0.041 0.027 0.024
0.039 0.031 0.042 0.028

1 Sacramento River Salmon Smolt Survival Index
3000 June 3000
June 0.18
YeaP 1962 1 963 1964 1 965 1 966 1967 1 068 1969 1 970 1971 1 972 1 973 1 974 1975 1 976 ign 1978 1979 1980 1981 1 982 1 983 1 984 1985 1 986 1987 1988 1990 1991
, 1992
lndex Value
0.45
Type BN W D W BN W BN W W W BN AN W W C c
AN BN AN D W W W D W D C C C C
'1989 missing due to insufficient data
Standard Me13 YES YES YES YES YES YES YES YES NO
YES YES NO YES YES YES YES YES YES YES NO
YES YES NO
YES NO N/A YES YES YES NO
April 56.6 54.1 58.2 58.8 57.6 49.8 58.5 55.7 57.4 55.0 58.1 59.7 54.2 54.1 57.9 62.5 57.1 59.8 57.1 61.5 54.0 55.0 59.7 62.5 59.8
59.5 61.4 59.5 64.0
Total 0.536 0.607 0.430 0.597 0.384 0.733 0.377 0.573 0.406 0.631 0.380 0.327 0.526 0.573 0.356 0.372 0.459 0.420 0.459 0.309 0.561 0.571 0.350 0.348 0.350 0.1 06 0.364 0.346 0.380 0.205
April 0.126 0.137 0.120 0.116 0.122 0.163 0.119 0.130 0.123 0.133 0.121 0.107 0.137 0.137 0.1 21 0.082 0.124 0.106 0.124 0.090 0.138 0.133 0.107 0.082 0.106
0.109 0.091 0.109 0.070
Temperature May 61 .O 59.3 63.7 59.5 65.9 58.1 65.6 60.7 64.4 59.4 65.6 67.0 62.0 60.7 66.8 63.9 63.0 63.8 63.6 66.7 61.1 60.1 66.5 65.1 65.8 70.7 66.0 65.7 65.5 70.7
(F) June 68.5 68.9 70.6 66.1 68.0 60.9 70.0 65.3 71.6 64.4 69.6 70.1 66.5 66.3 68.5 73.4 70.0 69.2 66.9 71.9 66.0 69.2 68.4 70.9 71.6
68.6 70.1 68.2 70.8
May 0.368 0.430 0.279 0.422 0.216 0.467 0224 0.379 0258 0.426 0.224 0.188 0.334 0.379 0.193 0.273 0.301 0.276 0.282 0.195 0.364 0.400 0.200 0.238 0.219 0.1 06 0.213 0.222 0.227 0.106
Index June 0.042 0.040 0.030 0.058 0.045 0.103 0.033 0.064 0.025 0.072 0.035 0.033 0.055 0.057 0.042 0.017 0.033 0.038 0.053 0.024 0.059 0.038 0.043 0.028 0.025
0.041 0.033 0.044 .0.029

I Sacramento River Salmon Smolt Survival lndex
June 3000
June 0.18
Year' 1 962 1963 1964 1965 1966 1967 1968 1969 1970 1971 1 972 1 973 1974 1 975 1976 1977 1978 1 979 1980 1981 1982 1 983 1 984 1 985 1 986 1987 1 988 1990 1991 1 992
index Value
0.45
Type BN W D W BN W BN W W W BN AN W W C C
AN BN AN D W W W D W D C C C C
- Y989 missing due to insufficient data
Standard Me13 YES YES YES YES YES YES YES YES NO
YES YES NO
YES YES YES YES YES YES YES YES YES YES NO
YES NO NIA YES YES YES NO
April 56.6 54.1 58.2 58.8 57.6 49.8 58.5 55.7 57.4 55.0 58.1 59.7 54.2 54.1 57.9 62.5 57.1 59.8 57.1 61.5 54.0 55.0 59.7 62.5 59.8
59.5 61.4 59.5 64.0
Total 0.564 0.639 0.452 0.626 0.404 0.772 0.396 0.602 0.428 0.663 0.400 0.344 0.554 0.603 0.375 0.391 0.482 0.442 0.483 0.325 0.591 0.601 0.368 0.366 0.368 0.1 12 0.383 0.363 0.400 0.21 6
Temperature May 61 .O 59.3 63.7 59.5 65.9 58.1 65.6 60.7 64.4 59.4 65.6 67.0 62.0 60.7 66.8 63.9 63.0 63.8 63.6 66.7 61.1 60.1 66.5 65.1 65.8 70.7 66.0 65.7 65.5 70.7
Index June 0.044 0.042 0.031 0.061 0.047 0.108 0.035 0.067 0.026 0.075 0.037 0.034 0.058 0.060 0.044 0.018 0.035 0.040 0.055 0.025 0.062 0.040 0.045 0.030 0.026
0.043 0.034 0.046 0.030
April 0.134 0.147 0.128 0.123 0.130 0.175 0.126 0.138 0.131 0.142 0.128 0.114 0.146 0.147 0.129 0.087 0.132 0.113 0.132 0.096 0.147 0.142 0.114 0.087 0.113
0.116 0.097 0.116 0.074
(F) June 68.5 68.9 70.6 66.1 68.0 60.9 70.0 65.3 71.6 64.4 69.6 70.1 66.5 66.3 68.5 73.4 70.0 69.2 66.9 71.9 66.0 69.2 68.4 70.9 71.6
68.6 70.1 68.2 70.8
May 0.365 0.450 0.293 0.442 0.226 0.490 0235 0.396 0.271 0.446 0.235 0.197 0.349 0.396 0.202 0.286 0.315 0.289 0.296 0.204 0.382 0.419 0.210 0.250 0.229 0.1 12 0.224 0.232 0.238 0.112

1- 1964 la66 1- 1967 1- 1989 1m 1m 1872 1973 1874 1875 1876 1Q7?
1 1878 1079 1m 1081
I 1982 lam
' 1984 1985
i 1886 , 1m 1 lam
1880 I 1991 LEL
June 0.18
W? YES YES YES YES No YES F10 YES NO
YES No NO YES YES YES YES YES YES YES NO YES YES NO YES NO 1;

Apm 6500 w 1m June 3C1a0
1967 1936 I869 lg?0 1671 1072 1973 1074 187s 1 0 n 3977 1978 10% 1880 1881 1- 1883 1984 1086 1886 1B87 1988 1Qlaa 1891
, la82
W BN W W W BN AN w w C C
AN BP3 AN D W W W D W 0 C C C C
$9.6 S6.6 55.7 57.4 55.0 58. I 59.7 sp2 64.1 57.8 625 $7.1 59.8 57.1 6'l .5 54.0 6S.O 50.3 62.6 69.8
W .S 61.4 59.5 64.0
58.1 85.6 60-7 64.4 58.4 65.8 67.0 62.0 60.7 68.a 63.8 83.0 63.8 63.6 66.7 61.1 60.1 66.5 65.1 85.8 70.7 66.0 85.7 66.5 70.7
60.9 70.0 85.3 71.8 64.4 6B.6 70.1 66.5 60.3 68.5 ?3,4 70.0 682 $6.9 71 .Q 66.0 8B.2 86.4 703 71.8
88.6 70.1 6B2 70.6
0.114 0.149 0 1 0.120 0.116 0.123 0.113 0.100 0.1~6 o.in 0.118 0.078 0.1d6 0.- 0.115 0.084 0.127 6.123 0.100 0.076 0.089
0.102 0.086 0.102 0.065
0212 0.453 Om 0.368 0.262 0.414 Om 0.184 0.325 ass 0.1eS 0267 0.~4 0270 0278 0.101 0.355 0.388 0.186 0-233 0314 0.105 0.209 0217 0222 0.705
0.043 0.099 0.032 0.081 0.024 0.068 0.034 0.091 0.0~3 0.051 0.040 0.0W 0.032 0.036 0.050 0-OP 0.056 0.036 0.041 0.0s 0.024
0 . m 0.031 0.042 0.028
0.100 0382 0.650 0.391 0.605 0.366 0315 osw o.ws 0.342 0.- 0 . ~ 1 0.405 0.441 0288 0- 0.648 0337 0-336 0,337 O.lQ5 O m Om 0.366 0.187
YES YES YES YES h10 YES YE8 . NO YES YES YES YES YES YfS YES NO
YES YES NO YES NO WA YES YES YES NO

S8mmento River Salmon Smott Survlval Index
June 3000
1968 1969 1870 1971 1072 lQ73 1W4 1W6 1976 lQn 1$78 3970 1980 1881 1982 I= 3984
1887 lm6
1980 lseD 1991 la
0.45
BN W W W 8N AN W W C C
AN BN AN D W W W D W D C C C C
68.3 56.7 S7.4 m.0 58.1 59.7 W.2 St). 1 679 62.6 57.1 69.0 57.1 61 -6 64.0 550 S9.7 62.5 69.6
B.5 W -4 83.5 64-0
65.6 80.7 64.4 69.4 65.6 67.0 820 60.7 66.8 639 63.0 W.8 63.6 86.7 61 -1 80.1 B6.5 66. I 85.8 70.7 66.0 65.7 65.5 70.7
70.0 65.3 71.6 84.4 6B.8 70.1 66.5 66.3 a.5 73.4 70.0 892 66.9 3 .9 66.0 89.2 68.4 70.9 71.6
66.8 70.1 e82 '10.8 -
0.119 0.129 0.123 0.132 0.120 0.107 0.136 0.137 0.124 0.081 0.124 0.106 0.124 0.m 0.137 0.132 0.107 0.081 0.108
0.109 0.031 0.lW 0.089 - -
0227 Om 0.262 0 0227 0.190 0337 O m 0.195 0277 0.305 0- 0286 0.W3 0.366 0.404 0203 0241 Om 0.108 OZl6 0225 0.230 O.qo8
0.033 0.064 0.026 0.072 0 . a 0 0.06s 0.057 0.D42 0.017 0.033 0.038 0.053 0.024 0.059 0.039 0.043 0.028 0,029 '
0.041 0.033 0.044 0.-
0370 0.57a 0.409 0.894 0%3 0.350 0.529 0.676 0.m 0-375. 0- 0.423 0.462 0312 0% 0.674 0.3S 0.351 O m 0.1 08 0.367 0.348 0.3W 0.207
YES YES NO YES YES NO
YES YES VES Y€S YES YE9 YES NO
YES YES Nb YE8 NO NIA YES YES YES 1JO

Sacramento River Wmon Smolt SuwM Index
lgkl 108% 1869 9970 18'11 1972 W73 I n 4 1976 1978 1Bn 197e lg7Q 1b)BD lee1 1982 1083 1084 3985 leQ6 1m7 1Qa
19el 1980 1992
W 813 W W W BN AN W W C C
AN BN AN D W W W D W D C C C C
#B 50.6 56.7 57.4 S . 0 60.1 89.7 642 56.1 5?S 62.6 W.1 59.8 67.1 61.5 54.0 55.0 69.7 62.5 59.8
59.5 81.4 SS 64.0
50.1 85.s 60.7 64.4 59.4 65.6 Sl.0 62.0 a.7 66.8 63.9 63-0 638 63.6 68.7 61 .I 60.1 68.5 66. I 65.8 70.7 6S.O 85.7 66.5 70.7
63.0 am 70.0 8S9 7i.6 64.4 89.6 70.1 865 66.3 68.5 73.4 70.0 692 tpeB n-9 66.0 m.2 68.4 70.8 71 -6
68.6 70.1 a , 2 70.8
0.130 0 . 1 0.126 0.138 0.13 0.142 0.128 0,114 0.14 0.147 0.129 0.087 0.132 0.113 0.132 0.- 0.147 0.142 0.114 0.087 0.133
0 . m 0.037 0.1 16 0.074
Om 0.4W 0.23s 0.396 0.271 0.448 0235 0.1B7 0348 O.S% 0.202 0286 0.315 0.269 029s 0204 0,382 0.419 0210 0.250 0.229 0.112 0 a 4 0232 023B 0.112
0447 0.100 0.095 0.067 0.026 0.075 0.037 0.054 0.058 0.W 0.044 0.010 0.035 0.040 0.065 0,625 0.062 0.040 0.045 0.030 0.026
0.043 0.034 0.046 0.030
0.404 '
On2 0386 0.602 0.428 0- 0.400 0.344 0.554 0.603 0.375 0.391 0.482 0.442 0.483 0.926 0.691 0.801 0.368 0.386 030% 0.1 12 0 ~ 3 0.363 0.400 Om6
YES YES YES YE$ NO YES YES NO
YES YES YES YES YES YES YES YES YES YES NO YES NO MA YES YES YES NO

sacremento River Salmon Smolt Sunhrel Index
1966 7987
1- 1870 1971 1@12 1973 1974 1973 W7'6 IS77 1978 j979 10BO 1981 1882 1903 1964 18815 1- 1687 1980 1890 leBl 1892
BN W BPI W W w 0N AN W W C C
AN BN AM D W W W D W D C C C c
67.8 498 68.5 SS.7 67.4 5s.o 60.9 59.7 542 54.1 672 62.5 S7.1 58.6 57.1 61.5 54.0 65.0 5g.7 626 SB.8
69.6 61.4 58.5 64.0
' 653 68.1 65.6 60.7 64.4 a9.4 65.6 mlo 023 60.7 66.8 63.9 03.0 63.8 63.6 86.7 61.1 60.1 86.5 65.1 658 70.7 66.0 65.7 65.5 70.7
68.0 80.9 70.0 653 71.8 84.4 69.6 70.1 86.5 -3 66.6 73.4 70.0 60.2 663 71 9 S.0 692 68.4 709 71.6
eS.6 70.1 88.2 ir0.e
0.114 0.148 0.111 0.t20 0.115 0.123 0.113 0.100 0.126 0.127 0.113 0.076 0.115 0.099 0.115 0.084 0.127 0.123 0.100 0.076 0.099
0.102 0.085 0.102 0.065
0.104 0.420 0202 0345 0233 0390 0202 0.168 0.304 0.34S O.l7€ 0247 0.273 0250 O W 0.175 03S2 0.388 0.180 om5 0.197 O m 3 0.1W 0.199 0.204 0.053
0.043 0.088 0.032 0.081 0.084 0.068 0.094 0.001 0.063 0.054 0.040 0.016 0.032 0.036 0.050 0.022 0.056 0.036 0.041 0 .0n 0.024
0.039 0.031 0.042 0.028
0351 0.W 0.345 0.527 0.372 om 0348 0.299 0.483 0.528 0.326 0340 0.420 0.385 0.421 028l 0.616 0.624 0.9#) 0.318 0.320 0.093 0- 0.NS 0.348 0.185
NO YES NO YES NO YES NO NO
YES YZS YE$ Y€S YES YES YES NO YES YES NO NO hK) NIA YES YES YES NO

0 . 0210 0.045 037B YES 1987 W 49.8 S8.1 609 0.1e 0.4S9 0.103 0.m YE8 1- EN 58.5 65.8 70.0 0.119 0.216 0.- 0.370 YE6 1- W 55.7 80.7 66.3 0.129 0.971 0.064 0.665 YES 1970 W 57.4 64.4 ' F1.6 0.123 0252 0.025 0.400 NO 1871 ' W 65.0 5B.4 64.4 0.132 0.418 0.072 0.622 YES 1BE BN 58.1 65.6 6Q.8 0.lm On0 0.035 0.374 YES 1973 AN 59.7 67.0 70.1 0.107 0.182 0.039 O m NO t974 W 542 62.0 865 0.136 0.327 0.055 0.618 YES 1975 W 54.1 Q0.7 663 0,137 OS71 0 . W 0.684 YES 1976 C 67s 86.0 68.5 0 . 0.187 0.042 0.350 YES 19TI C g26 83.9 73.4 0.081 0267 0.017 Om W S 1978 AN 67.1 83.0 70.0 0.124 0294 0.033 0.451 YES 1879 BN S.0 63.8 a2 - 0.106 0270 0.036 0.413 YES 1890 AN 67.1 03.6 66.0 0.f24 0276 0.053 0.452 YES 18B1 D 61.5 66.7 71.0 0.090 0.190 0.024 0.303 NO 1982 W 64.0 61 .I -66.0 0.137 0.357 0,069 0.559 YES 1903 W 56.0 60.1 892 0.932 O m 2 0.038 0463 YE$ lm4 W 68.7 80.5 a.4 O.tO7 0.19s O , M 3 0344 NO lee5 D 62.5 65.1 709 6.681 0232 0.028 0.342 YES 1m W 59.8 85s 71 8 0.108 Om3 0.026 0.344 NO 1 987 0 70.7 0.102 0.1 02 NfA 1900 C 69.5 68.0 m.6 0.109 0.208 0.041 0.368 YES 1990 C 01 A 66.7 70.1 0.081 021% 0.033 0.- YES
C m.5 65.5 682 0.109 Om 0.044 0.374 YES 1882 64.0 70.7 ia.8 0 . W 0.102 0.029 0.200 NO
1 'I=-dueto-&
e 8 I - . 0

Sa.0 0.139 0226 0.047 O A 0 4 YES 1881 #I 49.8 58.1 609 0.175 0 .W 0.108 0.772 YE6 188e BN 58.5 85.6 70.0 0.126 0.235 0.035 YES 1868 W , SS.7 60.7 853 0.138 0.998 0.067 0.602 YES 1870 W 57.4 64.4 71.6 0.131 0271 0.026 0.428 NO 1971 W 65.0 69.4 64.4 0.142 0.446 0.075 0.663 YES t0?2 BN 56.1 65.6 8g.6 0.128 0236 0.037 0.400 YES 1913 AN 69.7 67.0 70.1 0.114 0.197 0.034 0.544 N6 197'4 W 542 620 60.3 0.146 0.349 0.058 0.554 YES 1975 W 64-1 60.7 66.3 0.147 0.9B6 0.060 0.608 YES 1876 C SfB 68.0 98.3 0.12g 0.202 0.644 0.375 YES 1077 C 62.5 B.9 73.4 0.087 0.286 0.018 0.391 YES 1978 AN 67.1 63-0 70.0 0.132 0315 0.035 0.462 YE$ 1WB 8N 59.0 63.8 8B2 0.113 01289 0.040 0.442 YES 1980 AN 67.1 63.6 66.9 0.132 0296 0.065 0.- YES 1Q81 P 61.5 m.7 71.9 0.OgS 0204 O M 5 0.325 YES 1982 W 84.0 81.1 66.0 0.147 O S 2 0.062 0-1 YES la83 W 55.0 60.1 892 0.142 0.410 0.040 0.801 YE8 tW4 W 89.7 66.5 68.4 0.114 02lO 0 . W 0- NO 1985 D 62.5 a 1 708 0.a7 0- 0.030 0.3@ YES 1- W 68.8 65.8 71.6 0.113 9.229 0.- 0.36% NO is87 D 70.7 0.1 12 0.1 12 WA 1088 C a . 5 66.0 68.8 0.116 0224 0.043 0.383 YES 1gW) C 61 A 65.7 70.1 0.097 O a 2 0.034 0.363 YES 1891 C S.6 85.5 -2 0.1 16 0.236 0.046 0.400 YES 1- C 64.0 70.7 70.8 0.074 0.112 0.W 0216 NO
6000 June

Sacramento River Salmon Smolt Survival Index
Wei htin
June 0.1 8
lndex Value
0.32 0.45
YgaP 1 962 1963 1964 1 965 1966 1967 1968 1 969 1970 1971 1972 1 973 1974 1 975 1976 1977 1978 1 979 1 980 1981 1982 1983 1 984 1 985 1986 1987 1 988 1990 1991 1 992
I '1989 missrig due to insufficient data
T ype BN W D W BN W BN W W W BN AN W W C C
AN BN AN D W W W D W D C C C C
Standard Met? YES YES YES YES NO
YES NO
YES NO
YES NO NO
YES YES YES YES YES YES YES NO
YES YES NO
YES NO NI A YES YES YES NO
April 56.6 54.1 58.2 58.8 57.6 49.8 58.5 55.7 57.4 55.0 58.1 59.7 54.2 54.1 57.9 62.5 57.1 59.8 57.1 61.5 54.0 55.0 59.7 62.5 59.8
59.5 61.4 59.5 64.0
Temperature May 61 .O 59.3 63.7 59.5 65.9 58.1 65.6 60.7 64.4 59.4 65.6 67.0 62.0 60.7 66.8 63.9 63.0 63.8 63.6 66.7 61.1 60.1 66.5 65.1 65.8 70.7 66.0 65.7 65.5 70.7
Ap ril 0.102 0.110 0.099 0.096 0.100 0.128 0.098 0.105 0.1 01 0.107 0.099 0.088 0.110 0.1 10 0.100 0.066 0.1 01 0.087 0.101 0.073 0.110 0.107 0.088 0.066 0.087
0.090 0.074 0.090 0.056
Index June 0.041 0.030 0.029 0.056 0.044 0.097 0.032 0.062 0.025 0.068 0.035 0.032 0.053 0.055 0.041 0.017 0.032 0.037 0.051 0.023 0.057 0.037 0.041 0.028 0.025
0.040 0.032 0.043 0.028 -
(F) June 68.5 68.9 70.6 66.1 68.0 60.9 70.0 65.3 71.6 64.4 69.6 70.1 66.5 66.3 68.5 73.4 70.0 69.2 66.9 71.9 66.0 69.2 68.4 70.9 71.6
68.6 70.1 68.2 70.8
May 0.348 0.406 0.266 0.399 0.207 0.440 0215 0.358 0.247 0.402 0.215 0.181 0.317 0.358 0.185 0.260 0.286 0.263 0.269 0.188 0.345 0.378 0.192 0.228 0.210 0.1 04 0.205 0.212 0.217 0.104
Total 0.492 0.554 0.395 0.550 0.351 0.665 0.345 0.525 0.372 0.578 0.349 0.300 0.479 0.523 0.326 0.344 0.420 0.387 0.421 0.284 0.512 0.522 0.322 0.322 0.321 0.1 04 0.334 0.318 0.349
- 0.188
1 Sacramento River Salmon Smolt Suwlval Index
June 1000
Wei htin
June 0.18
YeaP 1 962 1963 1 964 1 965 1 966 1967 1968 1969 1970 1971 1 972 1973 1 974 1975 1 976 isn 1978 1979 1980 1981 1 982 1983 1 984 1 985 1986 1 987 1 988 1990 1991 1 992
lndex Value
0.32 0.45
Type BN W D W BN W BN W W W BN AN W W C c
AN BN AN D W W W D W D C C C C
*I080 misshg due to insufficient data
Standard Me13 YES YES YES YES YES YES YES YES NO YES YES NO
YES YES YES YES YES YES YES NO
YES YES NO
YES NO N/ A YES YES YES NO
April 56.6 54.1 58.2 58.8 57.6 49.8 58.5 55.7 57.4 55.0 58.1 59.7 54.2 54.1 57.9 62.5 57.1 59.8 57.1 61.5 54.0 55.0 59.7 62.5 59.8
59.5 61.4 59.5 64.0
April 0.113 0.122 0.109 0.105 0.110 0.144 0.108 0.116 0.1 11 0.1 19 0.109 0.096 0.122 0.122 0.109 0.073 0.112 0.096 0.112 0.081 0.123 0.119 0.096 0.073 0.096
0.098 0.082 0.098 0.062
Temperature May 61 .O 59.3 63.7 59.5 65.9 58.1 65.6 60.7 64.4 59.4 65.6 67.0 62.0 60.7 66.8 63.9 63.0 63.8 63.6 66.7 61.1 60.1 66.5 65.1 65.8 70.7 66.0 65.7 65.5 70.7
Index June 0.042 0.039 0.030 0.058 0.045 0.101 0.033 0.064 0.025 0.071 0.035 0.033 0.055 0.056 0.042 0.017 0.033 0.038 0.052 0.024 0.058 0.038 0.042 0.029 0.025
0.041 0.033 0.044 0.029
May 0.361 0.421 0.275 0.413 0.214 0.456 0.222 0.371 0.255 0.417 0.222 0.186 0.328 0.371 0.191 0.269 0.296 0.272 0.278 0.193 0.357 0.392 0.198 0.235 0.216 0.1 07 0.211 0.219 0.224 0.107
(F) June 68.5 68.9 70.6 66.1 68.0 60.9 70.0 65.3 71.6 64.4 69.6 70.1 66.5 66.3 68.5 73.4 70.0 69.2 66.9 71.9 66.0 69.2 68.4 70.9 71.6
68.6 70.1 68.2 70.8
. Total 0.516 0.582 0.414 0.576 0.369 0.701 0.362 0.551 0.390 0.606 0.366 0.315 0.504 0.549 0.342 0.359 0.441 0.405 0.442 0.298 0.538 0.548 0.337 0.337 0.337 0.1 07 0.351 0.333 0.366 0.197

I Sacramento River Salmon Smolt Survival Index
June 0.18
YeaP 1 962 1963 1964 1965 1966 1967 1 968 1969 1970 1971 1972 1973 1974 1975 1 976 i g n 1 978 1 979 1980 1981 1 982 1 983 1984 1 985 1 986 1 087 1 888 1990 1991 1 992
Exports
Index Value
0.32 0.45
Type BN W D W BN W BN W W W BN AN W W C c
AN BN AN D W W W D W D C C C C
April May June
'1989 missing due to insuffwent data
I
Standard Met? YES YES YES YES YES YES YES YES NO
YES YES NO
YES YES YES YES YES YES YES NO
YES YES NO
YES NO N/ A YES YES YES NO
8000 1000 1000
(F) June 68.5 68.9 70.6 66.1 68.0 60.9 70.0 65.3 71.6 64.4 69.6 70.1 66.5 66.3 68.5 73.4 70.0 69.2 66.9 71.9 66.0 69.2 68.4 70.9 71.6
68.6 70.1 68.2 70.8
April 56.6 54.1 58.2 58.8 57.6 49.8 58.5 55.7 57.4 55.0 58.1 59.7 54.2 54.1 57.9 62.5 57.1 59.8 57.1 61.5 54.0 55.0 59.7 62.5 59.8
59.5 61.4 59.5 64.0
, Total 0.540 0.610 0.433 0.601 0.306 0.737 0.379 0.576 0.409 0.635 0.383 0.330 0.529 0.576 0.358 0.375 0.462 0.423 0.462 0.312 0.565 0.574 0.353 0.351 0.352 0.1 09 0.367 0.348 0.383 0.207
April 0.124 0.134 0.118 0.114 0.120 0.160 0.117 0.127 0.121 0.130 0.118 0.105 0.134 0.134 0.119 0.080 0.122 0.104 0.122 0.088 0.135 0.130 0.105 0.080 0.104
0.107 0.089 0.107 0.068
Temperature May 61 .O 59.3 63.7 59.5 65.9 58.1 65.6 60.7 64.4 59.4 65.6 67.0 62.0 60.7 66.8 63.9 63.0 63.8 63.6 66.7 61 .I 60.1 66.5 65.1 65.8 70.7 66.0 65.7 65.5 70.7
Index May 0.373 0.435 0.284 0.428 0.220 0.473 0.228 0.384 0.263 0.432 0.228 0.191 0.339 0.384 0.196 0.278 0.306 0.281 0.287 0.190 0.369 0.405 0.204 0.242 0.223 0.109 0.217 0.225 0.231 0.109
June 0.043 0.040 0.031 0.059 0.046 0.104 0.034 0.066 0.026 0.073 0.036 0.033 0.057 0.058 0.043 0.018 0.034 0.039 0.054 0.024 0.060 0.039 0.044 0.029 0.026
0.042 0.033 0.045 0.030

! Sacramento River Salmon Smolt Survival Index
I I I I u I I I I N I I u g
*I889 missing due to insufficient data
June 1000
June 0.18
Year 1962 1963 1964 1 965 1 966 1967 1968 1969 1970 1971 1 972 1 973 1974 1975 1 976 1977 1978 1979 1980 1981 1 982 1 983 1984 1 985 1 986 1 987 1 988 1990 1991 1992
Mex Value
0.32 0.45
Type BN W D W BN W BN W W W BN AN W W C C
AN BN AN D W W W D W D C C C _ C
Standard Me13 YES YES YES YES YES YES YES YES NO YES YES NO
YES YES YES YES YES YES YES YES YES YES NO
YES NO N/ A YES YES YES NO
April 56.6 54.1 58.2 58.8 57.6 49.8 58.5 55.7 57.4 55.0 58.1 59.7 54.2 54.1 57.9 62.5 57.1 59.8 n . 1 61.5 54.0 55.0 59.7 62.5 59.8
59.5 61.4 59.5 64.0
Total 0.564 0.639 0.452 0.626 0.404 0.772 0.396 0.602 0.428 0.663 0.400 0.344 0.554 0.603 0.375 0.391 0.482 0.442 0.483 0.325 0.591 0.601 0.368 0.366 0.368 0.1 12 0.383 0.363 0.400 0.216
Temperature May 61 .O 59.3 63.7 59.5 65.9 58.1 65.6 60.7 64.4 59.4 65.6 67.0 62.0 60.7 66.8 63.9 63.0 63.8 63.6 66.7 61.1 60.1 66.5 65.1 65.8 70.7 66.0 65.7 65.5 70.7
June 0.044 0.042 0.031 0.061 0.047 0.108 0.035 0.067 0.026 0.075 0.037 0.034 0.058 0.060 0.044 0.018 0.035 0.040 0.055 0.025 0.062 0.040 0.045 0.030 0.026
0.043 0.034 0.046 0.030
April 0.134 0.147 0.128 0.123 0.130 0.175 0.126 0.138 0.1 31 0.142 0.128 0.114 0.146 0.147 0.129 0.087 0.132 0.113 0.132 0.096 0.147 0.142 0.114 0.087 0.1 13
0.1 16 0.097 0.116 0.074
(F) June 68.5 68.9 70.6 66.1 68.0 60.9 70 .O 65.3 71.6 64.4 69.6 70.1 66.5 66.3 68.5 73.4 70.0 69.2 66.9 71.9 66.0 69.2 68.4 70.9 71.6
68.6 70.1 68.2 70.8
Index May 0.385 0.450 0.293 0.442 0.226 0.490 0.235 0.396 0.271 0.446 0.235 0.197 0.349 0.396 0202 0.286 0.315 0.289 0.296 0.204 0.382 0.419 0.210 0.250 0.229 0.1 12 0.224 0.232 0.238 0.112
I Sacramento Rlver Salmon Smolt Survival Index
11000
June 1000
June 0.18
Year" 1W2 1963 1 964 1965 1966 1 967 1960 1 069 1970 1971 1972 1 973 1974 1975 1 976 1 9 n 1978 1979 1980 1981 1 982 1 983 1 984 1 985 1 986 1 987 1 988 1990 1991
, 1992
lndex Value
0.32 0.45
Type BN W D W BN W BN W W W BN AN W W C c
AN BN AN D W W W D W D C C C C
'1080 missing due to insufficient data
Standard Met? YES YES YES YES NO
YES NO
YES NO
YES NO NO
YES YES YES YES YES YES YES NO
YES YES NO NO NO N/A YES YES YES NO
Aphl 56.6 54.1 58.2 58.8 57.6 49.8 58.5 55.7 57.4 55.0 58.1 59.7 54.2 54.1 57.9 62.5 57.1 59.8 57.1 61.5 54.0 55.0 59.7 62.5 59.8
59.5 61.4 59.5 64.0
Aphl 0.095 0.102 0.092 0.089 0.093 0.119 0.092 0.097 0.084 0.099 0.093 0.082 0.102 0.102 0.093 0.060 0.094 0.081 0.094 0.068 0.102 0.099 0.082 0.060 0.081
0.083 0.068 0.083 0.050
Temperature May 61 .O 59.3 63.7 59.5 65.9 58.1 65.6 60.7 64.4 59.4 65.6 67.0 62.0 60.7 66.8 63.9 63.0 63.8 63.6 66.7 61.1 60.1 66.5 65.1 65.8 70.7 66.0 65.7 65.5 70.7
Index June 0.041 0.030 0.029 0.056 0.044 0.097 0.032 0.062 0.025 0.068 0.035 0.032 0.053 0.055 0.041 0.017 0.032 0.037 0.051 0.023 0.057 0.037 0.041 0.028 0.025
0.040 0.032 0.043 0.028
May 0.348 0.406 0.266 0.399 0207 0.440 0.215 0.358 0.247 0.402 0215 0.181 0.317 0.358 0.185 0.260 0.286 0.263 0.269 0.188 0.345 0.378 0.192 0.228 0.210 0.1 04 0205 0.212 0.217 0.104
(F) June 68.5 68.9 70.6 66.1 68.0 60.9 70.0 65.3 71.6 64.4 69.6 70.1 66.5 66.3 68.5 73.4 70.0 69.2 66.9 71.9 66.0 69.2 68.4 70.9 71.6
68.6 70.1 68.2 70.8
Total 0.484 0.546 0.388 0.544 0.344 0.656 0.339 0.517 0.365 0.570 0.342 0.294 0.472 0.515 0.319 0.338 0.413 0.381 0.41 4 0.279 0.504 0.514 0.31 5 0.316 0.315 0.1 04 0.328 0.313 0.343 0.183

I Sacramento River Salmon Smolt Survival lndex
June 1000
June 0.18
YeaP 1962 1 963 1961 1 965 1 066 1 967 1968 1969 1970 1971 1972 1973 1 974 1975 1976 1977 1978 1979 1980 1981 1982 1983 1 984 1985 1 986 1 987 1 988 1990 1991 1 992
lndex Value
0.32 0.45
Type BN W D W BN W BN W W W BN AN W W C c
AN BN AN D W W W D W D C C C C
7063 missing due to insuRicient data
Standard Me13 YES YES YES YES YES YES NO
YES NO
YES YES NO
YES YES YES YES YES YES YES NO
YES YES NO
YES NO N/ A YES YES YES NO
April 56.6 54.1 58.2 58.8 57.6 49.8 58.5 55.7 57.4 55.0 58.1 59.7 54.2 54.1 57.9 62.5 57.1 59.8 57.1 61.5 54.0 55.0 59.7 62.5 59.8
59.5 61.4 59.5 64.0
Total 0.51 1 0.577 0.409 0.571 0.364 0.695 0.358 0.546 0.386 0.601 0.361 0.311 0.499 0.544 0.337 0.356 0.436 0.401 0.437 0.294 0.533 0.543 0.333 0.333 0.333 0.1 07 0.346 0.329 0.362
- 0.194
Temperature May 61 .O 59.3 63.7 59.5 65.9 58.1 65.6 60.7 64.4 59.4 65.6 67.0 62.0 60.7 66.8 63.9 63.0 63.8 63.6 66.7 61.1 60.1 66.5 65.1 65.8 70.7 66.0 65.7 65.5 70.7
June 0.042 0.039 0.030 0.058 0.045 0.101 0.033 0.064 0.025 0.071 0.035 0.033 0.055 0.056 0.042 0.017 0.033 0.038 0.052 0.024 0.058 0.038 0.042 0.029 0.025
0.041 0.033 0.044 0.029 --
(F) June 68.5 68.9 70.6 66.1 68.0 60.9 70.0 65.3 71.6 64.4 69.6 70.1 66.5 66.3 68.5 73.4 70.0 69.2 66.9 71.9 66.0 69.2 68.4 70.9 71.6
68.6 70.1 68.2 70.8
Aprll 0.108 0.1 17 0.104 0.100 0.106 0.138 0.103 0.1 11 0.106 0.1 14 0.104 0.092 0.117 0.117 0.105 0.069 0.107 0.091 0.107 0.077 0.117 0.114 0.092 0.069 0.091
0.094 0.078 0.094 0.058
Index May 0.361 0.421 0.275 0.413 0.214 0.456 0222 0.371 0.255 0.417 0.222 0.186 0.328 0.371 0.191 0.269 0.296 0.272 0.278 0.193 0.357 0.392 0.198 0.235 0.216 0.107 0.211 0.219 0.224 0.107

I Sacramento River Salmon Smolt Suwlval lndex
1 1 000
June 1000
June 0.18
Year"' 1962 1963 1964 1 965 1966 1967 1 968 1969 1 970 1071 1 972 1973 1974 1975 1 976 1 977 1 978 1 979 1980 1981 1982 1983 1 984 1 985 1986 1987 1 988 1990 1991 1992
lndex Value
0.32 0.45
Type BN W D W BN W BN W W W BN AN W W C C
AN BN AN D W W W D W D C C C C
*I863 misshg dm to insufficient data
Standard Me17 YES YES YES YES YES YES YES YES NO
YES YES NO
YES YES YES YES YES YES YES NO
YES YES NO
YES NO N/A YES YES YES NO --
April 56.6 54.1 58.2 58.8 57.6 49.8 58.5 55.7 57.4 55.0 58.1 59.7 54.2 54.1 57.9 62.5 57.1 59.8 57.1 61.5 54.0 55.0 59.7 62.5 59.8
59.5 61.4 59.5 64.0
April 0.1 21 0.132 0.116 0.112 0.118 0.156 0.115 0.125 0.118 0.128 0.116 0.103 0.131 0.132 0.117 0.078 0.119 0.102 0.119 0.087 0.132 0.128 0.1 03 0.078 0.102
0.105 0.087 0.105 0.066
Temperature May 61 .O 59.3 63.7 59.5 65.9 58.1 65.6 60.7 64.4 59.4 65.6 67.0 62.0 60.7 66.8 63.9 63.0 63.8 63.6 66.7 61.1 60.1 66.5 65.1 65.8 70.7 66.0 65.7 65.5 70.7
Index June 0.043 0.040 0.031 0.059 0.046 0.104 0.034 0.066 0.026 0.073 0.036 0.033 0.057 0.058 0.043 0.018 0.034 0.039 0.054 0.024 0.060 0.039 0.044 0.029 0.026
0.042 0.033 0.045 0.030
May 0.373 0.435 0.284 0.428 0.220 0.473 0.228 0.384 0.263 0.432 0.228 0.191 0.339 0.384 0.196 0.278 0.306 0.281 0.287 0.199 0.369 0.405 0.204 0.242 0.223 0.109 0.217 0.225 0.231 0.109
(F) June 68.5 68.9 70.6 66.1 68.0 60.9 70.0 65.3 71.6 64.4 69.6 70.1 66.5 66.3 68.5 73.4 70.0 69.2 66.9 71.9 66.0 69.2 68.4 70.9 71.6
68.6 70.1 68.2 70.8
Total 0.537 0.608 0.430 0.599 0.384 0.734 0.377 0.574 0.407 0.632 0.381 0.328 0.526 0.573 0.356 0.373 0.459 0.421 0.460 0.310 0.562 0.572 0.351 0.350 0.350 0.1 09 0.365 0.346 0.381 0.205

I Sacramento River Salmon Smolt Survival lndex
June 0.18
k
YeaP 1962 1863 1964 1 965 1966 1967 1 968 1 969 1970 1971 1972 1973 1 974 1975 1976 i9n 1978 1979 1980 1981 1982 1 983 1 984 1 985 1986 1987 1 988 1990 1091 1 992
Exports
lndex Value
0.45
Type BN W D W BN W BN W W W BN AN W W C c
AN BN AN D W W W D W D C C C C
April May June
'1989 missing due to insufficient data
Standard Me13 YES YES YES YES YES YES YES YES NO
YES YES NO
YES YES YES YES YES YES YES YES YES YES NO
YES NO N/ A YES YES YES NO --
1 1000 1000 1000
April 56.6 54.1 58.2 58.8 57.6 49.8 58.5 55.7 57.4 55.0 58.1 59.7 54.2 54.1 57.9 62.5 57.1 59.8 57.1 61.5 54.0 55.0 59.7 62.5 59.8
59.5 61.4 59.5 64.0
April 0.134 0.147 0.128 0.123 0.130 0.175 0.126 0.138 0.131 0.142 0.128 0.114 0.146 0.147 0.129 0.087 0.132 0.113 0.132 0.096 0.147 0.142 0.114 0.087 0.113
0.116 0.097 0.116 0.074
Tanperaturn May 61 .O 59.3 63.7 59.5 65.9 58.1 65.6 60.7 64.4 59.4 65.6 67.0 62.0 60.7 66.8 63.9 63.0 63.8 63.6 66.7 61.1 60.1 66.5 65.1 65.8 70.7 66.0 65.7 65.5 70.7
(F) June 68.5 68.9 70.6 66.1 68.0 60.9 70.0 65.3 71.6 64.4 69.6 70.1 66.5 66.3 68.5 73.4 70.0 69.2 66.9 71.9 66.0 69.2 68.4 70.9 71.6
68.6 70.1 68.2 70.8
May 0.385 0.450 0.293 0.442 0.226 0.490 0.235 0.396 0.271 0.446 0.235 0.197 0.349 0.396 0.202 0.286 0.315 0.289 0.296 0.204 0.382 0.419 0.210 0.250 0.229 0.1 12 0.224 0.232 0.238 0.112
Index June 0.044 0.042 0.031 0.061 0.047 0.108 0.035 0.067 0.026 0.075 0.037 0.034 0.058 0.060 0.044 0.018 0.035 0.040 0.055 0.025 0.062 0.040 0.045 0.030 0.026
0.043 0.034 0.046 0.030
Total 0.564 0.639 0.452 0.626 0.404 0.772 0.396 0.602 0.428 0.663 0.400 0.344 0.554 0.603 0.375 0.391 0.482 0.442 0.483 0.325 0.591 0.601 0.368 0.366 0.368 0.112 0.383 0.363 0.400 0.216

lW6 1867 1868 10W 1B70 lS7l isn 1073 1974 1QK 1878 1977 1079 1979 1980 lB8t 1982 1983 1884 190s
lS87 1- 1990 1981 7892
IBN W 8 N W W W BN AN W W C C
AN EN AN D W W W D w D C C C C
87.6 49.8 58.5 55.7 E7.4 55.0 m.1 S . 7 642 54.1 87.9 625 57.1 B.8 51.1 81 b 54.0 65.0 59.7 e2.5 69.8
B.5 6l.4 SB.6 64.0
85.8 9.1 6S.6 6Q.7 84.4 59.4 85.6 67.0 62.0 60.7 66.8 63.9 63.0 63.8 63.6 66.7 81.1 60.1 88.6 65.1 65.8 70.7 @-0 65.7 66.6 70.7
680 609 704 8523 71.6 64.4 69.6 10.1 665 663 68.5 73.4 70.0 6B2 66s 71 9 66.0 89.2 68.4 70.9 71.6
68.6 70.1 682 70.8
0.083 0.110 0.092 0.097 0.084 0 . m 0.085 0.m 0 . m 0.102 0.099 0.080 0 . M 0.081 0.m 0.060 0.102 0.009 0.082 0.080 0.081
0.083 0.080 0 . W 0.050
0.178 0.387 0.185 0.320 OH6 O.= 0 . 1 0 . 1 0.281 0.920 0.168 O m 0.252 0.230 om 0.160 0.308 0.330 0.164 0.1B7 0.181 0.W 0.176 0.183 0.188 0.084
0.037 0.007 0.026 0.m 0.019 0.060 0.028 0.026 0.046 0.047 0.054 0.013 0.026 0.030 0.043 0.018 0 . W 0.030 0.035 0.022 0.018
0.033 0.028 0.036 0.023
0.308 0- 0309 0.471 0328 O S 1 0.806 0.261 0.428 0.- O W 0.301 0.373 0.342 0.373 02M 0.458 0.469 0.281 0 s 0.281 0.- 0.293 0277 0.306 0.757
NO YES NO YE8 No YES NO NO NO VES NO YES NO NO NO NO
VES YES No MO PI0 WA YES NO YES NO -

1888 1 967 I868 1984 r m 1871 9972 1873 I974 1875 1978 1977 1878 1878 1gSg 1Q8l 1982 1883 law 1905 1- 1B07 1- 1990 199t 1-
BN W BN W w W 0N AN W W G C AN 6N AN D W W W D W D C C C C
67.6 48.8 60.6 55.7 $7.4 SJ.0 B.1 e.7 S.2 64.1 57.9 829 57.1 30.8 57.1 61 8 64.0 55.0 89.7 62.5 60.8
59.5 61 A 68.5 , 84.0
66.9 S8.l 65.6 60.7 86.4 69.4 65.8 67.0 62.0 60.7 608 63.9 03.0 63.8 %3.8 66.7 61 .I 60.1 66.5 65.1 85.8 70.7 66.0 85.7 65.5 70.7
68.0 BOB 70.0 W.3 71.6 64.4 09.0 70.1 W.5 883 685 ?3A 70.0 692 WS 71 9 66.0 692 m.4 709 71.6
88.6 7b.l 68.2 '10.8
0.1W 0.138 0.103 0.111 0.108 0.114 0.104 0.- 0.117 0.117 0.105 0.068 0.107 0.091 0.107 0.077 0.117 0.114 0.082 0 . 0.001
0.084 0.078 0.- 0.W
0.184 0.428 0202 0.345 0133 0.390 0.2Q2 0.168 0.304 0.345 0.172 0247 0.273 0.260 0356 0.175 0.332 ' 0.9166 0.980 on5 0.197 0.093 0.192 0 . 1 0204 0.W3
0.040 0.094 0.029 0.- 0.022 0.085 0.Q31 0.029 0.050 0.061 0.037 0.014 0.W 0.033 0.067 0.020 0.653 0.033 0.038 0.- 0.022
05137 0.028 0.03B 0.026
0.340 0.659 0.334 0.616 0.m 0,- 0.3B7 0289 0.470 0513 0315 0.331 O R 0 9 0375 0.410 02?2 0503 0.613 0.310 0 . 3 ~ Om0 0.683 O.m 0 . m 6.337 0.17
NO YES NO YES NO
YES NO NO YES YES YES YES YES YES YES NO YE8 VES NO NO NO WA YES YES YES NO

Sacmn6nto River S e l m Smlt Swvid Index
1967 W 49.0 68.1 809 0.158 0,459 0.101 0.716 YES ' 1- BN 58.5 05.8 70.0 0.116 On8 a092 0.365 YES 3969 W 66.7 60-7 a3 0.126 0.371 O.W 0558 YES 1970 W 57.4 64.4 71.6 0.116 0.252 0 . m 0.384 NO 1871 W 65.0 ~13.4 W.4 0.128 0.418 0.0'10 O.6l6 YES I @Z BN S8.j 66.6 6S.6 0.116 0278 0.034 0.389 YES 1 Q73 AN 99.7 67.0 70.1 0.W3 0.182 0.091 0.317 NO I874 W 64.2 62.0 885 0.191 0.327 0.054 0512 YES 1875 W W.l 60.7 663 0.192 0.371 0.055 0.568 YES 10m C 57& 66.8 88.5 0.117 0.187 0.041 0.345 YE6 l9n C 62.6 63.9 73.4 0.078 0.267 0.016 0.361 YES 10128 AP( 57.1 m.0 70.0 0.11Q 0= 0.032 0.44s YES 1878 BN 69-8 63.8 692 0.102 0.270 0.037 0.4U8 YES 1980 AN 57.1 63.6 688 0.119 0178 0.051 0.448 YES lQ61 D B1 .5 gS.7 71 8 0.087 0.190 0.023 0- NO
W lm2 W
64.0 6l .I 66.0 0.132 0.357 0.058 O . W YES 1983 5S.O 80.1 692 0.120 0382 0.037 0.567 YES 19Bs W 69.7 66.5 68.4 0 . 0.195 0.041 0.339 NO 1- D 62.5 66.1 70.9 0.078 0232 0.027 0337 YES 1906 W 59.8 85.8 71.6 0.102 0213 0.024 0.339 NO 1BB7 D 70.7 0.1 02 0.102 WA 1988 C 59.5 86.0 68.6 0.105 0- 0.040 0.353 YES
C low 0
81.4 85.7 70.1 0,087 0216 0.031 0.335 YES 1881 S.5 W.5 68.2 0.105 0 .m 0.043 0.389 YES 1992 C 64.0 70.7 708 0.066 0.102 0.028 0.1M _ NO .

0.126 QS 0.036 Om YE6 1880 W 55.7 60.7 65.3 0.138 Om 0.067 0,602 YE6 1OfO W 67.4 64.4 71.6 0.131 0 0.028 0.420 NO 1871 W 55.0 59.4 84.4 0.142 0.446 0.076 0.603 YE8 1B72 BN 88.1 65.8 69.6 0.128 0235 0.037 0.406 YES 1 973 AN S.7 67.0 70.1 0.114 0.187 0.034 0,844 NO 1974 W WS 62.0 66.6 0.146 0.34 0.068 0.684 YES 1076 W 54.1 60.7 66.3 0.147 0.396 0,080 0.603 YE6 1876 C 879 .8 68.5 0.129 0292 0.044 0.375 YES 1977 C 62.6 63.9 78 ,4 0.087 Om 0.018 O S l YES 1- AN 57.1 63.0 70.0 0.132 0315 0.1135 0.482 YES 1079 EN 69a a8 692 0.1 13 Om 0.WO 0 . M YES 18~0 AN 57.1 63.6 g6.9 0.132 0.- 0.066 0.43 YES l a 1 0 61.6 86.7 71 9 0.086 0.204 0.025 03% YES 1W W S.0 64 .I 68.0 0.147 0.582 0.062 0.691 YES 7983 W 65.0 86.1 68.2 0.142 0.416) 0.840 0.801 YES '
1- W 59.7 66.5 68.4 0.114 0210 0.045 0.368 NO D Im5 W
825 66-1 703 0.087 0 0.030 0.388 YES 1886 S.8 E.6 71.6 0.113 0 0.028 0.m No 1987 D 70.7 0.112 0.112 WA 1088 C 59.5 66.0 BB.6 0.116 0224 0.043 0.3&3 YES 1990 C 61.4 6517 irO.1 0.087 0292 0.034 0.3W YES 1891 C 59.5 65.5 QB2 0.416 0238 0.046 0.400 YES la02 C 84.0 70.7 70.8 0.074 0.112 0.030 0216 NO
April 0.1 7 M@)r 0.65 Jum 0.1 8
082 0.45
Related Documents


