Ž . The Science of the Total Environment 271 2001 1125 A review of the calculation procedure for critical acid loads for terrestrial ecosystems Caroline van der Salm , Wim de Vries Alterra Green World Research, P.O. Box 47, 6700 AA Wageningen, The Netherlands. Abstract Target loads for acid deposition in the Netherlands, as formulated in the Dutch environmental policy plan, are based on critical load calculations at the end of the 1980s. Since then knowledge on the effect of acid deposition on terrestrial ecosystems has substantially increased. In the early 1990s a simple mass balance model was developed to calculate critical loads. This model was evaluated and the methods were adapted to represent the current knowledge. The main changes in the model are the use of actual empirical relationships between Al and H concentrations in the soil solution, the addition of a constant base saturation as a second criterion for soil quality and the use of tree Ž . species-dependant critical Albase cation BC ratios for Dutch circumstances. The changes in the model parameter- Ž . isation and in the AlBC criteria led to considerably 50% higher critical loads for root damage. The addition of a second criterion in the critical load calculations for soil quality caused a decrease in the critical loads for soils with a median to high base saturation such as loess and clay soils. The adaptation hardly effected the median critical load for soil quality in the Netherlands, since only 15% of the Dutch forests occur on these soils. On a regional scale, Ž . however, critical loads were much lower in areas where those soils are located. 2001 Elsevier Science B.V. All rights reserved. Keywords: Critical load calculations; Acid deposition; Empirical relationships 1. Introduction Air pollution and the associated high deposi- tion levels of sulfur and nitrogen may have ad- Corresponding author. Ž E-mail address: [email protected] C. van der . Salm . verse effects on the vitality of forested ecosys- tems. To derive abatement strategies the poten- tial effects of air pollutants have to be quantified by calculating critical deposition levels of sulfur and nitrogen. Deposition targets in the Dutch environmental policy plan are based on estimated critical loads for forests, low vegetation and sur- face waters using the available knowledge at the Ž end of the 1980s Schneider and Bresser, 1988; 0048-969701$ - see front matter 2001 Elsevier Science B.V. All rights reserved. Ž . PII: S 0 0 4 8 - 9 6 9 7 00 00807-X

Welcome message from author
This document is posted to help you gain knowledge. Please leave a comment to let me know what you think about it! Share it to your friends and learn new things together.
Transcript

Ž .The Science of the Total Environment 271 2001 11�25
A review of the calculation procedure for critical acidloads for terrestrial ecosystems
Caroline van der Salm�, Wim de VriesAlterra Green World Research, P.O. Box 47, 6700 AA Wageningen, The Netherlands.
Abstract
Target loads for acid deposition in the Netherlands, as formulated in the Dutch environmental policy plan, arebased on critical load calculations at the end of the 1980s. Since then knowledge on the effect of acid deposition onterrestrial ecosystems has substantially increased. In the early 1990s a simple mass balance model was developed tocalculate critical loads. This model was evaluated and the methods were adapted to represent the current knowledge.The main changes in the model are the use of actual empirical relationships between Al and H concentrations in thesoil solution, the addition of a constant base saturation as a second criterion for soil quality and the use of tree
Ž .species-dependant critical Al�base cation BC ratios for Dutch circumstances. The changes in the model parameter-Ž .isation and in the Al�BC criteria led to considerably 50% higher critical loads for root damage. The addition of a
second criterion in the critical load calculations for soil quality caused a decrease in the critical loads for soils with amedian to high base saturation such as loess and clay soils. The adaptation hardly effected the median critical loadfor soil quality in the Netherlands, since only 15% of the Dutch forests occur on these soils. On a regional scale,
Ž .however, critical loads were much lower in areas where those soils are located. � 2001 Elsevier Science B.V. Allrights reserved.
Keywords: Critical load calculations; Acid deposition; Empirical relationships
1. Introduction
Air pollution and the associated high deposi-tion levels of sulfur and nitrogen may have ad-
� Corresponding author.ŽE-mail address: [email protected] C. van der
.Salm .
verse effects on the vitality of forested ecosys-tems. To derive abatement strategies the poten-tial effects of air pollutants have to be quantifiedby calculating critical deposition levels of sulfurand nitrogen. Deposition targets in the Dutchenvironmental policy plan are based on estimatedcritical loads for forests, low vegetation and sur-face waters using the available knowledge at the
Žend of the 1980s Schneider and Bresser, 1988;
0048-9697�01�$ - see front matter � 2001 Elsevier Science B.V. All rights reserved.Ž .PII: S 0 0 4 8 - 9 6 9 7 0 0 0 0 8 0 7 - X

( )C. �an der Salm, W. de Vries � The Science of the Total En�ironment 271 2001 11�2512
.De Vries, 1993 . These critical loads were basedŽ .on empirical data mainly for heather and mass
balance calculations for forest on generic welldrained poor sandy soils. The obtained criticalloads ranged from 350 to 800 mol ha�1 year�1
cfor vegetation changes, from 1000 to 1600 molcha�1 year�1 for forest vitality and up to 3600mol ha�1 year�1 for NO leaching to thec 3groundwater. On the basis of this data, a targetdeposition for 2010 was set at 1400 mol ha�1
cyear�1 for acid deposition and 1000 mol ha�1
cyear�1 for nitrogen deposition. A final depositiontarget of 400 mol ha�1 year�1 for 2050 wascformulated related to surface waters. The currentmean acid deposition level in the Netherlands isapproximately 4000 mol ha�1 year�1. Consider-cable efforts are thus necessary to reach the tar-gets for 2010 and it will be impossible to reachthe final targets set for 2050. Because of thestrong social implications of these targets theDutch government asked recently whether theexisting target loads for sulfur and nitrogen arestill in accordance with the present scientificknowledge.
Knowledge on the effects of acid deposition onsoil and vegetation has increased considerablysince these targets were set. In the early 1990s a
Žsimple steady state mass balance model SMB.model was developed to calculate critical loads
Ž .for forests in The Netherlands De Vries, 1993 .With this model the spatial variability in criticalloads and susceptibility of various ecosystems canbe calculated using both effect based criteriaŽ .protection against damage and precautionary
Ž .principles no decline in soil quality . The modelhas been used to map the critical loads in the
Ž .Netherlands De Vries, 1996 as part of theUN�ECE convention on Long-Range Trans-boundary Air Pollution. The data obtained by thiscalculation procedure have been provided to aCoordination Centre for Effects to be used toconstruct European maps of critical loads. Eventhough improvements have been made in thecalculation procedure since 1993 with respect tobase cation deposition and uptake, the basic ideasare still comparable. This means that for examplethe description of Al mobility is still the same
Ždespite the increase in knowledge e.g. Matzner,
1992; Dahlgren and Walker, 1993; Mulder andStein, 1994; Berggren and Mulder, 1995; Van der
.Salm, 1999 , the relationships between root da-mage and Al�BC ratios have not been evaluatedin view of the Dutch circumstances and criteria toprotect soils from a decline in base saturation arenot considered.
The major aim of this paper was to review thepresent calculation procedure, to indicate the ma-jor shortcomings, to suggest improvements and toillustrate the impacts of the improvements on thecalculated critical loads for the Netherlands.
2. Evaluation of the method used for critical acidload calculations
Critical loads have been defined as: a quantita-tive estimate of an exposure to one or morepollutants below which harmful effects on speci-fied sensitive elements of the environment do not
Žoccur according to present knowledge Nilsson.and Grennfelt, 1988 . According to this definition
the critical load depends on the decisions andassumptions made about the specific sensitive ele-
Žment e.g. the use of root damage as an indicator.for forest vitality , the chemical criterion used
Žand the critical value of this criterion Sverdrup.et al., 1991; De Vries, 1991 . An evaluation of the
present critical load calculation has to focus onwhether these assumptions and decisions are stillin accordance with present knowledge.
In the critical load calculations root damagehas been used as a biological indicator for forest
Ž .vitality and the pool of Al- hydr oxides as anŽ .indicator for soil quality e.g. Posch et al., 1998 .
In particular the choice of Al-hydroxides as theonly indicator for soil quality appears question-able. The idea behind this choice is that sandysoils have a low base saturation and that a severedecline in Al-hydroxides will lead to a degrada-tion of the soil structure and a decline in theavailability of nutrients like phosphate that are
Žbound to Al-hydroxides e.g. De Vries, 1991,.1993 . However, this definition does not protect
soils with a high base saturation against a deple-tion of the exchangeable base cations and theresulting decline in the concentrations of base

( )C. �an der Salm, W. de Vries � The Science of the Total En�ironment 271 2001 11�25 13
cations in the soil solution. Accordingly the pre-sent definition does not protect soils with a highbase saturation against acidification. It is thusworthwhile to add a second indicator for soilquality.
The reliability of the calculated critical load isstrongly influenced by the quality of the criticallimits that are used for the different elements.For abiotic aspects like soil chemistry or groundwater quality the critical limits are clear because
Žthe dose�effect relations e.g. the effect of aciddeposition and changes in Al-hydroxide contents
.and�or base saturation are quite well under-stood. For biotic indicators like root damage it ismore difficult to find critical limits which can beused as a threshold level below which effects arenegligible. Root damage is quite a complex reac-tion that may be caused by a combination offactors such as drought and adverse soil chemical
Žconditions. When a single critical limit such as.the Al�BC ratio is used this will inherently lead
to a considerable uncertainty in the value of thiscritical limit. For example the response of fineroot length on an increase in Al�BC ratios oftenvaries over a factor of 10�100. Using an appropri-ate model to describe root uptake can reduce this
Ž .uncertainty Sverdrup and Warfvinge, 1993 .Despite the possibilities to limit the uncertainty
in the critical Al�BC ratios a considerable uncer-tainty remains with respect to the impact of highAl�BC ratios on root damage. Critical limits arebased on laboratory experiments during a limitedperiod of time in which all roots are subject toconstant elevated Al�BC ratios. In the fieldAl�BC ratios vary considerably with time anddepth. However, the fine root mass has a highturnover rate and a relatively quick response onenvironmental conditions such as drought andhigh Al�BC ratios. Critical load calculations fo-cus on the long-term effects of Al�BC ratios onroot damage and therefore seasonal fluctuationsare not accounted for. Despite the fact that repet-itive high Al�BC ratios during part of the yearpossibly hardly effect the long-term root masssuch variations may have an adverse effect onforest-vitality. Another point of concern is thedepth of the root zone that has to be consideredwhen calculating critical loads for root damage.
In the present application the whole root zone istaken into account leading to relatively low criti-cal loads as the Al concentrations generally in-crease with depth. However, most roots are lo-cated in the upper 10�20 cm of the soil profile.When only these roots are assumed to be signifi-cant in relation to forest vitality higher criticalloads should be allowed. Finally large uncertaintyremains with respect to the use of root damage asan indicator for forest stress. This uncertainty inthe critical limits is affirmed by the fact thatAl�BC ratios are often not a significant factorwhen explaining differences in forest vitalityŽ .Hendriks et al., 1997; Klap et al., 2000 .
Other important aspects in the calculation ofthe critical loads are the assumptions that havebeen made in the calculation procedure. Theseassumptions may become outdated when the sci-entific knowledge increases. One of these aspectsis the description of Al chemistry in the SimpleMass Balance model. When the Simple MassBalance model was formulated large uncertaintyexisted approximately Al chemistry in the soilsolution and as a best approximation it was de-cided that the gibbsite equilibrium would be usedto describe the relation between Al and H con-centrations in the soil solution. However, it is wellknown that soil solution concentrations in thetopsoil are often undersaturated with respect togibbsite because of complexation with organic
Žmatter and�or kinetic constraints e.g. Seip et al.,.1989; Matzner, 1992; Mulder and Stein, 1994 .
Although still a lot of uncertainty remains, suffi-cient data are presently available to constructempirical equilibria between Al and H concentra-tions for the Netherlands that can be used instead
Ž .of the gibbsite equilibrium see Section 3.2 .An other aspect that is often mentioned as one
of the major shortcomings in the current ap-proach is the oversimplification of the actual situ-
Ž .ation Løkke et al., 1996 . Critical loads are calcu-lated using a steady state model and relativelysimple formulation of the calculation of sinks andsources of acid and nitrogen. Temporary sourcesand sinks of acid and nitrogen are not taken intoaccount in the present critical load calculations.
ŽActual critical deposition levels may thus be sub-.stantially higher then steady state critical loads
( )C. �an der Salm, W. de Vries � The Science of the Total En�ironment 271 2001 11�2514
Ž .De Vries et al., 2000 . This is an importantaspect when focussing on the relations betweencurrent deposition levels and forest vitality or forthe optimisation of deposition reduction plans intime. However, due to the temporary effects ofsuch fluxes they do not influence the long-termsustainability of a forest and are thus much lessimportant when critical loads are used to formu-late long-term target loads for the deposition ofsulfur and nitrogen. In this study we thus fo-cussed on the improvement of the calculation ofthe fluxes in the steady state model and an evalu-ation of the presently used critical levels.
3. Calculation of critical acid loads
3.1. The original simple mass balance approach
Critical loads are often calculated using theŽ . ŽSimple Mass Balance SMB model Sverdrup et
.al., 1991; De Vries, 1993 . The SMB model is asteady state model and consequently it includesprocesses that influence acid consumption andproduction during infinite time only. Acid con-sumption and production by processes such ascation exchange, adsorption and desorption ofsulphate and temporary changes in solute fluxes
Ž .due to year-to-year differences in im mobilisa-tion of N and S or changes in meteorologicalconditions are not taken into account. Below, wedescribe the method as it was used to assesscritical loads for acidity at a 1 km�1 km resolu-
Ž .tion in The Netherlands De Vries, 1996 .Critical loads for acidity due to inputs of sulfur
and nitrogen were calculated using the followingequation:
Ž . �CL S�N �BC �BC -BC �Ntd we gu gu
Ž .�N �N �AC 1im crit de le crit
where BC� is the seasalt-corrected total deposi-tdtion flux of base cations, BC is the weatheringweflux of base cations, BC and N are the netgu gugrowth uptake fluxes of base cations and nitro-gen, N is a critical long-term nitrogen im-im Žcrit.mobilisation flux, N is the denitrification fluxde
and AC is a critical leaching flux of acidityle Žcrit.Ž .vertical and�or lateral . Addition of base cationsor acid to the system by lateral flow or seepage is
Ž .not included in Eq. 1 and in this form it maythus be only applied to soils where these fluxesare negligible.
Either the actual growth rates or the availabil-ity of base cations can limit the growth uptake ofnitrogen. The availability of base cations was cal-culated from the mass balances of Ca, Mg and K:
Ž .X �X �X -X 2gu nl td we le min
where X stands for the nutrient limited up-gu nltake of Ca, Mg or K, X for the total depositiontdof Ca, Mg or K, X for the weathering flux andweX for the minimal leaching of Ca, Mg or K.le minFor the Netherlands the minimum leaching fluxof Ca and Mg was set to 50 molc ha�1 year�1 and
�1 �1 Ž .for K to 0 mol ha year De Vries, 1991 .cGrowth uptake of nitrogen was calculated as:
Xgu nl Ž .N �min N , 3gu gu glž /ratio x:n
where N is the growth rate limited uptake ofgu glnitrogen and ratio is the ratio of each basex:n xcation to nitrogen in the biomass. When nitrogenuptake was limited by the availability of one ofthe base cations the actual uptake of base cationswas recalculated from the actual N uptake andthe ratio of nitrogen to base cations in the bio-
Ž .mass cf. De Vries, 1996 . The immobilisation fluxof nitrogen was calculated by accepting a 0.2%
Žincrease in nitrogen in the upper soil layer 0�30.cm during a 100-year period. Denitrification
fluxes were calculated as:
Ž . Ž .N � fr N �N �N 4de de td crit gu im crit
where fr is the denitrification fraction and Nde tdis the critical nitrogen deposition.crit
The critical leaching flux of acidity equals thesum of the critical leaching fluxes of Al and H.The critical Al leaching flux was calculated usinga criterion for the maximum tolerable Al�BCratio in the root zone and a criterion preventingthe depletion of Al pools in the soil solid phase.
( )C. �an der Salm, W. de Vries � The Science of the Total En�ironment 271 2001 11�25 15
These two criteria were chosen to prevent a de-cline in forest vitality due to root damage and adegradation of the soil quality. According to thefirst criterion Al was calculated as:le crit
Al Ž . Ž .Al �3 BC �BC -BC 5le crit td we guž /BC crit
Ž .where Al�BC is the acceptable molar Al�BCcritratio in the root zone. To prevent a depletion ofreadily available Al pools the critical Al leachingflux was calculated as:
Al � fs Ca � fs Mg � fs Kle crit Ca we Mg we K we
Ž .� fs Na 6Na we
where fs , fs , fs and fs are the stoichio-Ca Mg K Nametric ratios of the base cations with respect to
Ž �1 .Al mol mol . For Dutch soils these factorsc care set to 3, 0.6, 3 and 3, respectively, based onthe fact that K and Na are mainly released bymicrocline and albite, Ca by anorthite and Mg by
Žchlorite in sandy soils De Vries and Breeuwsma,.1986 . The critical H leaching flux, H , wasle crit
calculated by multiplying the precipitation surpluswith the critical H concentration in the soil solu-tion. The critical H concentration was calculatedfrom the critical Al concentration assuming equi-librium with gibbsite:
0.33� �Al crit� � Ž .H � 7crit ž /K gibb
� � � �where H and Al are the critical H and Alcrit critŽ � 1.activities mol l and K is the gibbsite equi-gibb
librium constant.
3.2. Impro�ements of the model formulation andcritical limits
The evaluation of the calculation method usedin the original Simple Mass Balance model showed
Ž .the following imperfections see Section 2 :
� The acidity leaching criteria, based on a negli-gible depletion of Al pools, does not protect
soils with a relatively high base saturationfrom acidification.
� Weathering rates are assumed to be indepen-dent of the ‘critical’ pH, which may vary con-siderably depending on the criteria used.
� Leaching of acidity is calculated assuming thatAl concentrations in the soil solution at thebottom of the root zone are in equilibriumwith gibbsite. Data indicate that soil solutionsare often undersaturated with respect togibbsite and that the slope of the Al solubilityline is often less than three.
� Critical Al�BC ratios for given tree speciesare directly taken form Sverdrup and War-
Ž .fvinge 1993 without recalculation.
Improvements related to those aspects are dis-cussed below.
3.2.1. Acidity leaching criteriaCritical Al leaching fluxes are strongly depen-
� Ž .dant on the base cation weathering rates Eqs. 5Ž .�and 6 . The SMB model calculates relatively
high critical Al leaching fluxes in soils with highweathering rates and consequently critical H
� Ž .�leaching fluxes are also high Eq. 7 . Theseleaching fluxes are substantially higher than cur-rent acidity leaching fluxes at soils with a highbase saturation. The calculated critical loads willthus lead to a decline in pH and a decrease inbase saturation of these soils leading to possibleadverse effects, such as Mg deficiency in thevegetation. To avoid a decrease in base saturationa second criterion was added which limits thecritical acidity leaching to the current acidityleaching. The current acidity leaching is calcu-lated from the actual pH of the soils and anequilibrium relation between Al and H in the soil
Ž .solution see below .
3.2.2. Base cation weathering ratesIn the original SMB model weathering rates for
each soil type are set to a fixed value, equal to thecurrent weathering rate. However, the pH of thesoil solution at critical load may be considerablylower than the current values, depending on thecriterion used to calculate the acidity leaching.
( )C. �an der Salm, W. de Vries � The Science of the Total En�ironment 271 2001 11�2516
Actual weathering rates at the critical pH canthus be considerably higher than the values usedin the calculation procedure, leading to an under-estimation of the critical load. To overcome thisdiscrepancy, weathering fluxes in the model arenow calculated as a function of the critical pH:
H crit� Ž .BC �BC � 8we crit we cur -5ž /Ž .max H ,10cur
where BC and BC are the weatheringwe crit we curŽ �1 �1.fluxes mol ha year at the critical andc
current pH of the soil solution, respectively, H critand H are the critical and current H concen-cur
Ž �1 .tration in the soil solution mol l and is thedependency of the weathering rate on the Hconcentration in the soil solution. Weatheringrates of most minerals are independent of pH at
Ž .values between 5 and 8 cf. Sverdrup, 1990 .Therefore, a minimum value of 10 � 5 was used asthe current H concentration in the soil solution.Values for � range between 0 and 1. For most
Žfeldspars � is around 0.5 e.g. Nickel, 1973; Chou.and Wollast, 1985; Holdren and Speyer, 1985
except for anorthite for which � is approximatelyŽ .1.0 Busenberg and Clemency, 1976 . Values for
most phyllosilicates are slightly higher than forŽfeldspars e.g. 0.6 for montmorillionite; 0.7 for
Žamphibole, chlorite and vermiculite Sverdrup,.1990 . On the basis of this data, � was set to 0.5
for sandy soils in the Netherlands in which alkalifeldspars are the predominant minerals and 0.6for non-sandy soil in which the weathering of clayminerals contributes significantly to the observedweathering rates. The use of a lumped value foralpha is acceptable, regarding the large overalluncertainty in weathering rate and the limitedimpact of this uncertainty on the calculated criti-cal loads. For example a 50% increase or de-crease in weathering rate led to a change in
Ž .critical loads of 6�20% Van der Salm, 1999The introduction of a pH dependency of the
weathering fluxes makes the critical load calcula-tion more complicated because the calculatedcritical H concentration and the weathering rates
� Ž . Ž .�are interdependent cf. Eqs. 5 and 7 . Thecritical load can thus only be calculated with an
iterative procedure, starting with the weatheringrates at the current pH and recalculating theweathering rates until the critical pH and the pHused in the weathering flux calculation are equal.
3.2.3. Al dissolution equilibriaUp to now, critical H leaching fluxes have been
calculated using the gibbsite equilibrium, basedon the assumption that Al concentrations in thesoil solution at the bottom of the root zone are inequilibrium with gibbsite. Field data from a num-ber of sites indicate that soil solutions at thisdepth are close to equilibrium with a gibbsite like
Žphase Johnson et al., 1981; Dahlgren et al., 1989;.Matzner and Prenzel, 1992 . However, undersatu-
ration with respect to gibbsite has been reportedfor a large number of sites, in particular in or-ganic rich soils, at shallow depth or during
Žepisodes of high flow Seip et al., 1989; Matzner,.1992; Mulder and Stein, 1994 . Moreover, recent
experiments on the dissolution of solid phase Alpools show that Al concentrations in the soilsolution are strongly influenced by reactions withorganic pools and by the kinetically constraineddissolution of Al hydroxides and silicatesŽDahlgren and Walker, 1993; Berggren and
.Mulder, 1995; Van der Salm et al., 2000 . Toincorporate this knowledge into the SMB modelempirical based equilibrium relations between Aland H concentrations might be considered as analternative for the gibbsite equilibrium.
To construct empirical relations between Aland H concentrations, data on soil solution con-centrations, measured at four different depth in200 forested sites on sandy soils, 38 on non-calcareous clay soils, 40 on loess soils and 30 peat
Žsoils have been used Leeters et al., 1994; Klap et. 3�al., 1998 . For these sites Al activities were
calculated from the total concentration of Al andŽ .dissolved organic carbon DOC using the specia-Žtion program MINEQL� Schecher and McAvoy,
.1994 , combined with a triprotic organic acidmodel in which complexation of Al by DOC is
Ž .taken into account Santore et al., 1995 . In thelatter model, the total concentration of organicacids is first calculated as a function of DOCaccording to:

( )C. �an der Salm, W. de Vries � The Science of the Total En�ironment 271 2001 11�25 17
Ž .A �M DOC 9T D
where A is the total concentration of organicTŽ �1 .functional groups mol l , M is the site den-D
Žsity of naturally occurring organic solutes mol�1 . Žmol and DOC is the DOC concentration mol
�1 .l . In this model the various organic functionalgroups are represented as a triprotic organic acid.Al in solution can thus be complexed to A3�,HA2� and HA�. A test for soil solutions from anumber of column experiments on Dutch sandysoils showed that the calculated concentrations of
Žorganically complexed Al were comparable �. Ž10% to measured concentrations Van der Salm,.1999
To obtain information on chemical equilibria,relations between Al activities and pH have to beused. However, the SMB model calculates H con-centrations as a function of Al concentrationsinstead of Al activities. Therefore, the relations
Ž Ž ..between pAl �log Al and pH of the soil solu-tion were calculated for both activities and con-centrations. Results showed that differences incorrelation coefficients between relationshipsbased on activities and concentrations were negli-
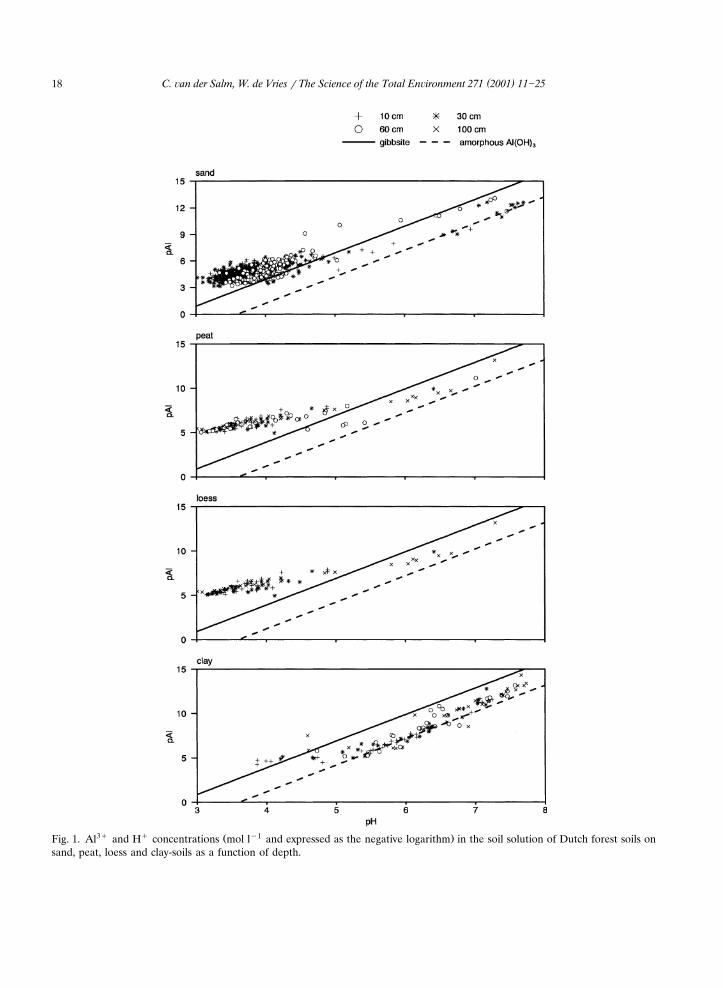
Ž .gible Table 1 . Soil solutions were mostly under-saturated with gibbsite in the sand, peat and loess
Ž .soils Fig. 1 . The slope of the pAl�pH relation-ship ranged from 1.0 in the uppermost soil com-partments to values of 2.5 in the subsoil of the
Ž .sandy soils Table 1 . In the clay soils, solutionsŽwere generally oversaturated with gibbsite pK
.8.1; May et al., 1979 and close to saturation withŽamorphous Al hydroxides pK 10.8; Stumm and
.Morgan, 1981 . The slope of the regression linebetween pH and pAl was 2.6.
Al activities, in particular in the topsoil, can beinfluenced by complexation of Al to organic mat-
Ž .ter Cronan et al., 1986; Mulder and Stein, 1994 .The binding of Al to organic sites can be de-scribed by the following equation:
Ž 3� . Ž 3�x .Al RAl Ž .�K 10x� Ž .RHŽ .H x
Ž 3�. Ž �.where Al and H are the Al and H activi-ties, x is the reaction stoichiometry, K the equi-
Ž 3�x . Ž .librium constant and RAl and RH thexoccupation of the complexation sites by Al and H.The occupation of the complexation sites with Alcan be estimated from extractions with Na-pyro-phosphate and RH can be estimated from thex
Ž .organic matter content Wesselink et al., 1996 .� Ž .�Eq. 10 can then be rewritten to:
Ž 3 .Al C�Al p� Ž .K � 11x�Ž .H
where C is the organic matter content and Al ispthe pyrophosphate extractable Al content of thesamples. Unfortunately data on Na-pyrophos-phate extractable Al were not available for theexamined sites. In A horizons the amount of
Table 1Relationship between pAl and pH in the soil solution of Dutch soils based on activities and concentrations
Soil type Depth RelationshipŽ .cm Based on activities Based on concentrations
2 2Constant Slope R Constant Slope R nadj adj
Sandy soils 10 0.81 1.15 55.7 0.56 1.7 56.1 19530 �2.55 1.87 84.6 �2.37 1.88 82.8 348
�60 �5.52 2.54 85.8 �5.20 2.51 86.3 172a30 �4.32 1.92 81.6 �4.03 1.90 81.9 148
Peat All 0.85 1.30 80.0 1.06 1.31 81.2 116Clay All �7.97 2.63 87.6 �7.88 2.65 87.3 116Loess 10 0.27 1.05 64.2 0.48 1.06 64.1 39
30 �3.44 1.88 88.0 �3.29 1.90 87.9 39100 �4.57 2.11 90.7 �4.55 2.17 92.4 39
a Ž � .Relation between p Al C�Al and pH.org
( )C. �an der Salm, W. de Vries � The Science of the Total En�ironment 271 2001 11�2518
3� � Ž �1 .Fig. 1. Al and H concentrations mol l and expressed as the negative logarithm in the soil solution of Dutch forest soils onsand, peat, loess and clay-soils as a function of depth.
( )C. �an der Salm, W. de Vries � The Science of the Total En�ironment 271 2001 11�25 19
inorganic Al is often negligible and accordinglythe amount of pyrophosphate extractable Al iscomparable to the amount of Al that can beextracted by NH -oxalate. Data for oxalate ex-4tractable Al were available for part of the topsoil
Ž .samples 0�30 cm and were used to estimate theoccupation of organic sites with Al. Resultsshowed that the relationship between pAl and pH
Ž .in the topsoil 30 cm of the sandy soils hardlychanged by taking into account the occupation ofthe organic matter with Al. The slope of thepAl�pH relationship and R2 were almost theadjsame and also the solubility was comparableŽ Ž .�2.47 for coarse poor sandy soils and �2.34
.for finer textured sandy soils when using themean C�Al for the two distinguished soil groups.o
3.2.4. Uncertainties in the critical limitsCritical loads for acidity are calculated using
critical limits for the Al�BC ratios in the soilsolution, to avoid impact on fine roots, and anegligible depletion in Al hydroxides and basesaturation to guarantee the long-term sustainabil-ity of forest ecosystems. The critical Al�BC ratiosare based on an extensive literature review of potexperiments with seedlings and young treesŽ .Sverdrup and Warfvinge, 1993 . These authors
Žplotted the reduction in biomass growth stem.and�or root growth as a function of the molar
ratio of BC�Al. The data were fitted using sev-Žeral cation exchange mechanisms e.g. valence
.unspecific, Vanselow, Gapon or Gaines Thomasassuming that ion exchange at the root surface isthe step preceding uptake. For most tree speciesŽ .see Table 2 , included in the SMB model, thebest results were found using a Vanselow ex-change mechanism:
K fBC � gr red Ž .� 12ž / (Al Ž .Ž .BC 1� fcrit gr red
Ž .where BC�Al is the critical BC�Al ratio; Kcrit �Ž .is the Vanselow selectivity coefficient, BC is the
Ž �1 .Base cation concentration mol l and f isgr redthe accepted growth reduction fraction.
For Norway Spruce the best results were foundusing a valence unspecific response according to:
f KBC gr red us Ž .� 13ž /Al Ž .1� fcrit gr red
where K is the unspecific selectivity coeffi-uscient.
Critical Al�BC ratios were calculated using the
Table 2Critical limits for the Al�BC ratios
Tree species Reaction type K value Al�BCa bOriginal Dutch sandy soils
�5 Ž .Scots Pine Vanselow 210 0.8 3.0 0.24c eNorway Spruce Unspecific 0.35 0.8 2.5
c �5 Ž .Douglas Fir Vanselow 410 3.3 5.3 0.45d �6 Ž .Oak Vanselow 410 1.7 5.2 0.43
d �6 Ž .Beech Vanselow 410 1.7 3.8 0.23dHeather Unspecific 0.2 1.3 3.3dGrassland Unspecific 0.13 2.0 5.0
a Ž . �1Values given by Sverdrup and Warfvinge 1993 , using a BC concentration of 0.05 mmol .b Ž �1 . Ž .Values calculated using the median BC concentration mmol in the upper part 0�30 cm of the root zone of Dutch sandyŽ .soils values in brackets .
c The SMB model considers the tree class Spruce consisting of Norway Spruce and Douglas fir, critical Al�BC limits are taken asthe average of the values found for Norway Spruce and Douglas Fir.
d The SMB model considers the tree class Deciduous trees mainly consisting of Oak and Beech, critical Al�BC limits are takenas the average of the values found for Oak and Beech.
e This value is based on the range in measured critical Al�BC ratios at a growth reduction of 80%.
( )C. �an der Salm, W. de Vries � The Science of the Total En�ironment 271 2001 11�2520
fitted equations and tolerating a 20% reduction inŽ .biomass growth Table 2 . For those tree species
where the Vanselow mechanism was used, Al�BCratios depend on the BC concentration in the soilsolution. Up to now critical Al�BC ratios havebeen calculated using very low values for the BC
Ž �1 .concentrations 0.05 mmol to protect treeŽspecies on even the poorest soils Sverdrup and
.Warfvinge, 1993 . The use of such low concentra-tions is questionable because it requires an ex-trapolation of the fitted equations outside therange of measurements. Moreover, actual con-centrations in the soil solution are often muchhigher. For example, base cation concentrations
Ž .in the root zone 0�60 cm in the Netherlands areŽapproximately 10 times higher Leeters et al.,
.1994 , giving rise to substantially higher Al�BCratios than used in the original SMB modelŽ .Table 2 .
The large scatter in observed critical Al�BCratios and the low BC concentrations used tocalculate critical ratios indicate that critical levelsas used in SMB are probably too strict. In thisstudy we calculated critical loads using both theoriginal strict critical Al�BC levels and less strictcritical Al�BC ratios using concentration mea-surements in 150 Dutch forest stands. To protecttrees on both base poor and rich site we used the20 percentile of the measured base cation con-centrations instead of the median value. For Nor-way spruce, heather and grassland, which showed
Ž .an unspecific response, alternative less strictcritical Al�BC ratios were derived from the rangein measured critical Al�BC ratios.
4. Impacts of model improvements on calculatedcritical loads
4.1. Root protection
The improvements of the SMB model led toconsiderably higher critical loads for root protec-
Ž .tion Fig. 2 . The median critical load for Dutchforest soils increased from 2670 mol ha�1 year�1
cto 3950 mol ha�1 year�1. This increase is mainlyccaused by an increased acidity leaching, due tothe use of Al�H relationships that are based oncurrent soil solution concentrations instead of a
Ž .gibbsite equilibrium Table 3 . The largest in-crease in critical loads was found for heather andgrassland, which have a rooting depth of only 30cm. The soil solution at this depth is strongly
Žundersaturated with respect to gibbsite cf. Table.1 and accordingly the improved version of the
SMB model calculated much higher proton leach-ing fluxes at a given critical Al�BC ratio com-pared to the original model. For the trees, whichhave a rooting depth of 60 cm or more, theimpact of using actual Al�H relationships was
Ž .much smaller Table 3 because soil solutions atthis depth are closer to equilibrium with gibbsite.The strongest increase in calculated critical loadswas found for spruce and deciduous forests,whereas the differences were relatively small forpine forest. This is partly due to the lower criticalAl�BC ratios for Pine compared to the other treespecies.
Differences are also determined by differences
Table 3Median critical loads, critical acidity leaching and base cation weathering fluxes for root protection as calculated by the original andthe improved version of the SMB model
Species CL Update Ac Update BC Updatele weoriginal original original
Deciduous 3435 4080 2035 2684 223 445Spruce 3335 4046 2381 3005 199 293Pine 1787 2085 1059 1320 201 217Heather 1987 3977 1277 3295 102 342Grassland 3429 7035 1981 5321 227 327All 2670 3947 1548 2944 211 339
( )C. �an der Salm, W. de Vries � The Science of the Total En�ironment 271 2001 11�25 21
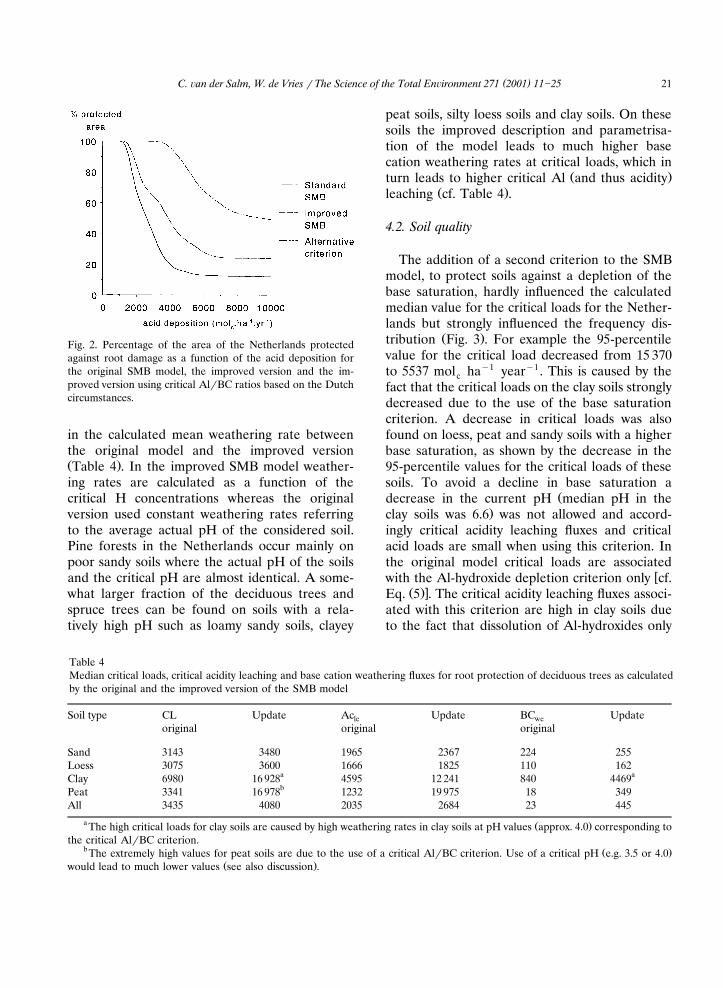
Fig. 2. Percentage of the area of the Netherlands protectedagainst root damage as a function of the acid deposition forthe original SMB model, the improved version and the im-proved version using critical Al�BC ratios based on the Dutchcircumstances.
in the calculated mean weathering rate betweenthe original model and the improved versionŽ .Table 4 . In the improved SMB model weather-ing rates are calculated as a function of thecritical H concentrations whereas the originalversion used constant weathering rates referringto the average actual pH of the considered soil.Pine forests in the Netherlands occur mainly onpoor sandy soils where the actual pH of the soilsand the critical pH are almost identical. A some-what larger fraction of the deciduous trees andspruce trees can be found on soils with a rela-tively high pH such as loamy sandy soils, clayey
peat soils, silty loess soils and clay soils. On thesesoils the improved description and parametrisa-tion of the model leads to much higher basecation weathering rates at critical loads, which in
Ž .turn leads to higher critical Al and thus acidityŽ .leaching cf. Table 4 .
4.2. Soil quality
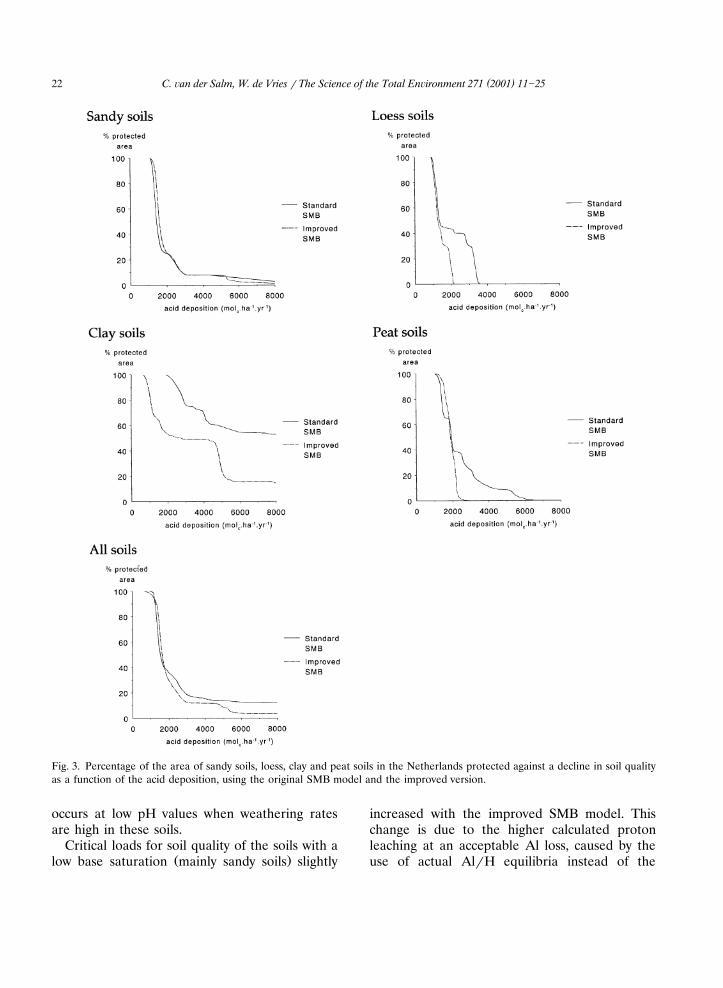
The addition of a second criterion to the SMBmodel, to protect soils against a depletion of thebase saturation, hardly influenced the calculatedmedian value for the critical loads for the Nether-lands but strongly influenced the frequency dis-
Ž .tribution Fig. 3 . For example the 95-percentilevalue for the critical load decreased from 15 370to 5537 mol ha�1 year�1. This is caused by thecfact that the critical loads on the clay soils stronglydecreased due to the use of the base saturationcriterion. A decrease in critical loads was alsofound on loess, peat and sandy soils with a higherbase saturation, as shown by the decrease in the95-percentile values for the critical loads of thesesoils. To avoid a decline in base saturation a
Ždecrease in the current pH median pH in the.clay soils was 6.6 was not allowed and accord-
ingly critical acidity leaching fluxes and criticalacid loads are small when using this criterion. Inthe original model critical loads are associated
�with the Al-hydroxide depletion criterion only cf.Ž .�Eq. 5 . The critical acidity leaching fluxes associ-
ated with this criterion are high in clay soils dueto the fact that dissolution of Al-hydroxides only
Table 4Median critical loads, critical acidity leaching and base cation weathering fluxes for root protection of deciduous trees as calculatedby the original and the improved version of the SMB model
Soil type CL Update Ac Update BC Updatele weoriginal original original
Sand 3143 3480 1965 2367 224 255Loess 3075 3600 1666 1825 110 162
a aClay 6980 16 928 4595 12 241 840 4469bPeat 3341 16 978 1232 19 975 18 349
All 3435 4080 2035 2684 23 445
a Ž .The high critical loads for clay soils are caused by high weathering rates in clay soils at pH values approx. 4.0 corresponding tothe critical Al�BC criterion.
b Ž .The extremely high values for peat soils are due to the use of a critical Al�BC criterion. Use of a critical pH e.g. 3.5 or 4.0Ž .would lead to much lower values see also discussion .
( )C. �an der Salm, W. de Vries � The Science of the Total En�ironment 271 2001 11�2522
Fig. 3. Percentage of the area of sandy soils, loess, clay and peat soils in the Netherlands protected against a decline in soil qualityas a function of the acid deposition, using the original SMB model and the improved version.
occurs at low pH values when weathering ratesare high in these soils.
Critical loads for soil quality of the soils with aŽ .low base saturation mainly sandy soils slightly
increased with the improved SMB model. Thischange is due to the higher calculated protonleaching at an acceptable Al loss, caused by theuse of actual Al�H equilibria instead of the
( )C. �an der Salm, W. de Vries � The Science of the Total En�ironment 271 2001 11�25 23
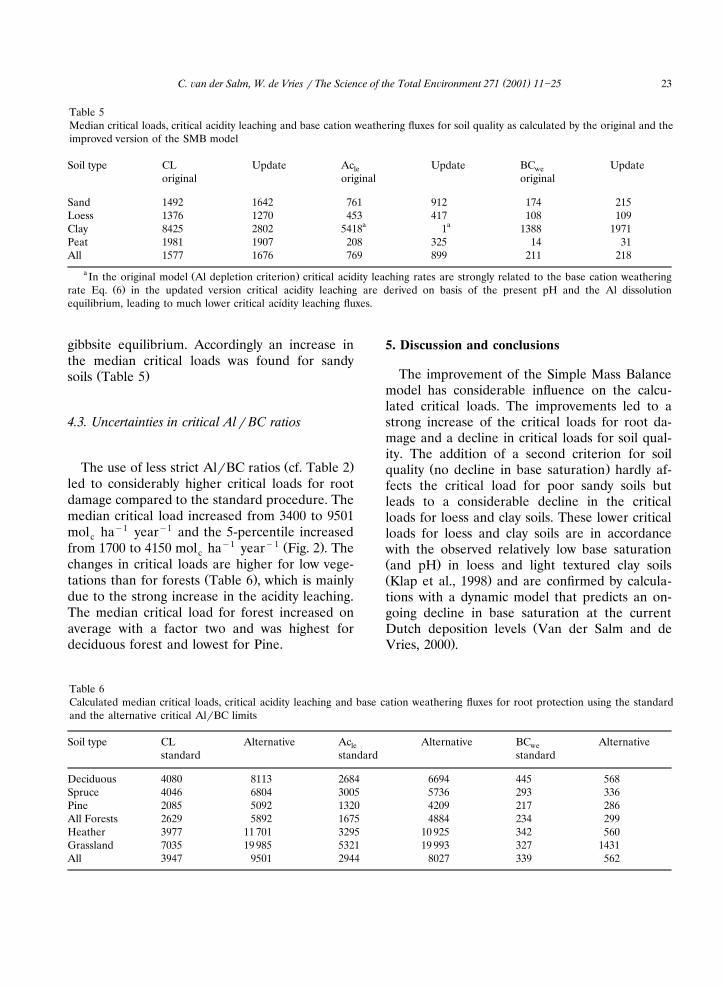
Table 5Median critical loads, critical acidity leaching and base cation weathering fluxes for soil quality as calculated by the original and theimproved version of the SMB model
Soil type CL Update Ac Update BC Updatele weoriginal original original
Sand 1492 1642 761 912 174 215Loess 1376 1270 453 417 108 109
a aClay 8425 2802 5418 1 1388 1971Peat 1981 1907 208 325 14 31All 1577 1676 769 899 211 218
a Ž .In the original model Al depletion criterion critical acidity leaching rates are strongly related to the base cation weatheringŽ .rate Eq. 6 in the updated version critical acidity leaching are derived on basis of the present pH and the Al dissolution
equilibrium, leading to much lower critical acidity leaching fluxes.
gibbsite equilibrium. Accordingly an increase inthe median critical loads was found for sandy
Ž .soils Table 5
4.3. Uncertainties in critical Al�BC ratios
Ž .The use of less strict Al�BC ratios cf. Table 2led to considerably higher critical loads for rootdamage compared to the standard procedure. Themedian critical load increased from 3400 to 9501mol ha�1 year�1 and the 5-percentile increasedc
�1 �1 Ž .from 1700 to 4150 mol ha year Fig. 2 . Thecchanges in critical loads are higher for low vege-
Ž .tations than for forests Table 6 , which is mainlydue to the strong increase in the acidity leaching.The median critical load for forest increased onaverage with a factor two and was highest fordeciduous forest and lowest for Pine.
5. Discussion and conclusions
The improvement of the Simple Mass Balancemodel has considerable influence on the calcu-lated critical loads. The improvements led to astrong increase of the critical loads for root da-mage and a decline in critical loads for soil qual-ity. The addition of a second criterion for soil
Ž .quality no decline in base saturation hardly af-fects the critical load for poor sandy soils butleads to a considerable decline in the criticalloads for loess and clay soils. These lower criticalloads for loess and clay soils are in accordancewith the observed relatively low base saturationŽ .and pH in loess and light textured clay soilsŽ .Klap et al., 1998 and are confirmed by calcula-tions with a dynamic model that predicts an on-going decline in base saturation at the current
ŽDutch deposition levels Van der Salm and de.Vries, 2000 .
Table 6Calculated median critical loads, critical acidity leaching and base cation weathering fluxes for root protection using the standardand the alternative critical Al�BC limits
Soil type CL Alternative Ac Alternative BC Alternativele westandard standard standard
Deciduous 4080 8113 2684 6694 445 568Spruce 4046 6804 3005 5736 293 336Pine 2085 5092 1320 4209 217 286All Forests 2629 5892 1675 4884 234 299Heather 3977 11 701 3295 10 925 342 560Grassland 7035 19 985 5321 19 993 327 1431All 3947 9501 2944 8027 339 562
( )C. �an der Salm, W. de Vries � The Science of the Total En�ironment 271 2001 11�2524
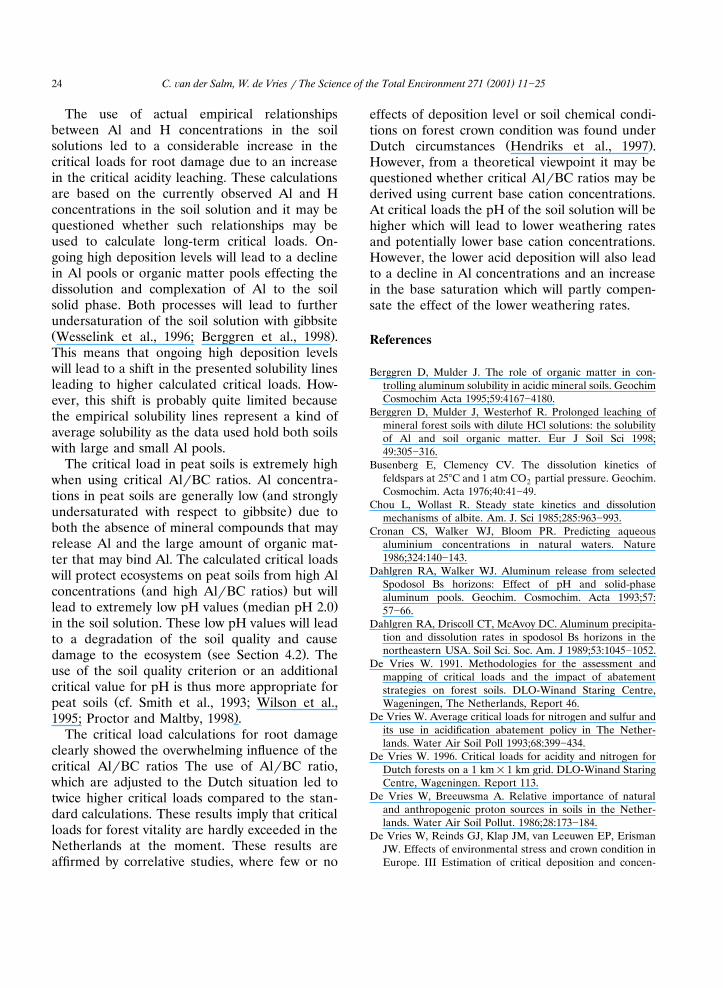
The use of actual empirical relationshipsbetween Al and H concentrations in the soilsolutions led to a considerable increase in thecritical loads for root damage due to an increasein the critical acidity leaching. These calculationsare based on the currently observed Al and Hconcentrations in the soil solution and it may bequestioned whether such relationships may beused to calculate long-term critical loads. On-going high deposition levels will lead to a declinein Al pools or organic matter pools effecting thedissolution and complexation of Al to the soilsolid phase. Both processes will lead to furtherundersaturation of the soil solution with gibbsiteŽ .Wesselink et al., 1996; Berggren et al., 1998 .This means that ongoing high deposition levelswill lead to a shift in the presented solubility linesleading to higher calculated critical loads. How-ever, this shift is probably quite limited becausethe empirical solubility lines represent a kind ofaverage solubility as the data used hold both soilswith large and small Al pools.
The critical load in peat soils is extremely highwhen using critical Al�BC ratios. Al concentra-
Žtions in peat soils are generally low and strongly.undersaturated with respect to gibbsite due to
both the absence of mineral compounds that mayrelease Al and the large amount of organic mat-ter that may bind Al. The calculated critical loadswill protect ecosystems on peat soils from high Al
Ž .concentrations and high Al�BC ratios but willŽ .lead to extremely low pH values median pH 2.0
in the soil solution. These low pH values will leadto a degradation of the soil quality and cause
Ž .damage to the ecosystem see Section 4.2 . Theuse of the soil quality criterion or an additionalcritical value for pH is thus more appropriate for
Žpeat soils cf. Smith et al., 1993; Wilson et al.,.1995; Proctor and Maltby, 1998 .
The critical load calculations for root damageclearly showed the overwhelming influence of thecritical Al�BC ratios The use of Al�BC ratio,which are adjusted to the Dutch situation led totwice higher critical loads compared to the stan-dard calculations. These results imply that criticalloads for forest vitality are hardly exceeded in theNetherlands at the moment. These results areaffirmed by correlative studies, where few or no
effects of deposition level or soil chemical condi-tions on forest crown condition was found under
Ž .Dutch circumstances Hendriks et al., 1997 .However, from a theoretical viewpoint it may bequestioned whether critical Al�BC ratios may bederived using current base cation concentrations.At critical loads the pH of the soil solution will behigher which will lead to lower weathering ratesand potentially lower base cation concentrations.However, the lower acid deposition will also leadto a decline in Al concentrations and an increasein the base saturation which will partly compen-sate the effect of the lower weathering rates.
References
Berggren D, Mulder J. The role of organic matter in con-trolling aluminum solubility in acidic mineral soils. GeochimCosmochim Acta 1995;59:4167�4180.
Berggren D, Mulder J, Westerhof R. Prolonged leaching ofmineral forest soils with dilute HCl solutions: the solubilityof Al and soil organic matter. Eur J Soil Sci 1998;49:305�316.
Busenberg E, Clemency CV. The dissolution kinetics offeldspars at 25�C and 1 atm CO partial pressure. Geochim.2Cosmochim. Acta 1976;40:41�49.
Chou L, Wollast R. Steady state kinetics and dissolutionmechanisms of albite. Am. J. Sci 1985;285:963�993.
Cronan CS, Walker WJ, Bloom PR. Predicting aqueousaluminium concentrations in natural waters. Nature1986;324:140�143.
Dahlgren RA, Walker WJ. Aluminum release from selectedSpodosol Bs horizons: Effect of pH and solid-phasealuminum pools. Geochim. Cosmochim. Acta 1993;57:57�66.
Dahlgren RA, Driscoll CT, McAvoy DC. Aluminum precipita-tion and dissolution rates in spodosol Bs horizons in thenortheastern USA. Soil Sci. Soc. Am. J 1989;53:1045�1052.
De Vries W. 1991. Methodologies for the assessment andmapping of critical loads and the impact of abatementstrategies on forest soils. DLO-Winand Staring Centre,Wageningen, The Netherlands, Report 46.
De Vries W. Average critical loads for nitrogen and sulfur andits use in acidification abatement policy in The Nether-lands. Water Air Soil Poll 1993;68:399�434.
De Vries W. 1996. Critical loads for acidity and nitrogen forDutch forests on a 1 km�1 km grid. DLO-Winand StaringCentre, Wageningen. Report 113.
De Vries W, Breeuwsma A. Relative importance of naturaland anthropogenic proton sources in soils in the Nether-lands. Water Air Soil Pollut. 1986;28:173�184.
De Vries W, Reinds GJ, Klap JM, van Leeuwen EP, ErismanJW. Effects of environmental stress and crown condition inEurope. III Estimation of critical deposition and concen-
( )C. �an der Salm, W. de Vries � The Science of the Total En�ironment 271 2001 11�25 25
tration levels and their exceedances. Water Air Soil Pollut.2000;119:363�386.
Hendriks CMA, van den Burg J, Oude Voshaar JH, vanLeeuwen E.P. Relationships between forest condition andstress factors in the Netherlands in 1995. DLO-WinandStaring Centre, Wageningen, the Netherlands, Report 148,1997.
Holdren GR, Speyer PM. pH dependent changes in the ratesand stoichiometry of dissolution of an alkali feldspar atroom temperature. Am. J. Sci 1985;285:994�1026.
Johnson NM, Driscoll CT, Eaton JS, Likens GE, McDowellWH. Acid rain, dissolved aluminum and chemical weather-ing at the Hubbard Brook experimental forest, New Hamp-shire. Geochim. Cosmochim. Acta 1981;45:1421�1437.
Klap JM, de Vries W, Leeters EEJM. 1998. Effects of acidatmospheric deposition on the chemical composition ofloess, clay and peat soils under forest in the Netherlands.DLO-Winand Staring Centre, Wageningen. Report 97.
Klap JM, Oude Voshaar JH, De Vries W, Erisman JW.Effects of envrionmental stress on forest condition in Eu-rope. IV. Statistical analysis of relationships. Water Air SoilPollut 2000;119:387�420.
Leeters EEJM, Hartholt JG, de Vries W, Boumans LJM.Effects of acid deposition on 150 forest stands in theNetherlands. IV. Assesment of the chemical compositionsof foliage, soil, groundwater on a national scale. Report69.4. DLO-Winand Staring Centre, Wageningen, TheNetherlands, 1994.
Løkke H, Bak J, Falkengrunn-Grerup U, Finlay RD, Ilves-niemi H, Nygaard PH, Starr M. Critical loads of acidicdeposition for forest soils: Is the current approach ade-quate? Ambio 1996;25:510�516.
Matzner E. Factors controlling Al-activity in soil solutions inan acid forest soil of the German Solling area. Z.Pflanzenernahr. Bodenk 1992;155:331�338.¨
Matzner E, Prenzel J. Acid deposition in the German SollingArea: Effects on soil solution chemistry and Al mobiliza-tion. Water Air Soil Pollut 1992;61:221�234.
May HM, Helmke PA, Jackson ML. Gibbsite solubility andthermodynamic properties of hydroxy-aluminium ions inaqueous solution at 25�C. Geochim Cosmochim Acta1979;43:861�868.
Mulder J, Stein A. The solubility of aluminum in acidic forestsoils: long-term changes due to acid deposition. GeochimCosmochim Acta 1994;58:85�94.
Nickel E. Experimental dissolution of light and heavy mineralsin comparison with weathering and intrastitial solution.Contr. Sedimentol 1973;1:1�68.
Nilsson J. Grennfelt P., editors. Critical loads for sulfur andnitrogen: Report from a workshop held at Skokloster, Swe-den, 19�24 March 1988. Miljø rapport 1988:15. NordicCouncil of Ministers, København, 1998:343 pp.
Posch M, de Smet PAM, Hettelingh JP, Downing RJ. 1998.Calculation and mapping of critical thresholds in Europe,
Status report 1998. Coordination Center for Effects, Natio-nal Institute of Public Health and the Environment,Bilthoven, the Netherlands, Rep 259101008, 1998.
Proctor MCF, Maltby E. Relations between acid atmosphericdeposition ans the surface pH of some ombrotrophic bogsin Britain. J. Ecol. 1998;86:329�340.
Santore RC, Driscoll CT, Aloi M. A model of soil organicmatter and its function in temperate forest soil develop-ment. In: McFee WW, Kelly JM, editors. Carbon forms andfunctions in forest soils. Madison, Wisconsin: Soil Sci Socof America, 1995:275�298.
Schecher WD, McAvoy DC. 1994. MINEQL� , User’s Man-ual. Environmental Research Software, Hallowell, Maine.
Schneider T, Bresser AHM. 1988. Dutch Priority Programmeon Acidification. Bilthoven, The Netherlands, Report00�06, 190 pp.
Seip HM, Andersen DO, Christophersen N, Sullivan TJ, VogtRD. Variations in concentrations of aqueous aluminiumand other chemical species during hydrological episodes atBirkenes, southernmost Norway. J. Hydrol 1989;108:387�405.
Smith CMS MSCresser, Mitchell RDJ. Sensitivity to aciddeposition of dystrophic peat in Great Britain. Ambio1993;22:22�26.
Stumm W, Morgan JJ. Aquatic Chemistry. New York: Wiley,1981. 780 pp.
Sverdrup H. The kinetics of base cation release due to chemi-cal weathering. England: Lund University Press, Swedenand Chatwell-Bratt Ltd, 1990. 246 pp.
Sverdrup H, Warfvinge P. 1993. The effect of soil acidificationon the growth of trees, grass and herbs as expressed by theŽ .Ca�Mg�K �Al ratio. Reports in ecology and environ-mental engineering 1993:2. Dep. Chem. Eng II, Lund Uni-versity.
Sverdrup H, de Vries W, Henriksen A. 1991. Mapping criticalloads. A guidance to the criteria, calculations, data collec-tion and mapping of critical loads. Miljørapport 1990:14.Nordic council of ministers. Copenhagen 1990.
Van der Salm C. 1999. Weathering in forest soils. Ph.DThesis, University of Amsterdam, 288 pp.
Van der Salm C, de Vries W. Soil acidification in loess andclay soils in the Netherlands. Water Air Soil Pollut.2000;120:139�167.
Van der Salm C, Westerveld JW, Verstraten JM. Releaserates of aluminum from inorganic and organic compoundsin a sandy podzol. Geoderma 2000;96:173�189.
Wesselink LG, Van Breemen N, Mulder J, Janssen PH. Asimple model of soil organic matter complexation to predictthe solubility in acid forest soils. Eur J Soil Sci 1996;47:373�384.
Wilson EJ, Skeffington RA, Maltby E, Immirzi P, Swanson C,Proctor M. Towards a new method of setting critical loadof acidity for ombrotrophic peat. Water Air Soil Poll1995;85:2491�2496.
Related Documents