International Journal of Database Theory and Application Vol.9, No.1 (2016), pp.77-86 http://dx.doi.org/10.14257/ijdta.2016.9.1.07 ISSN: 2005-4270 IJDTA Copyright ⓒ 2016 SERSC A Review of Sentiment Analysis in Twitter Data Using Hadoop L.Jaba Sheela Panimalar Engineering College, Chennai, India. [email protected] Abstract Twitter is an online social networking site which contains rich amount of data that can be a structured, semi-structured and un-structured data. In this work, a method which performs classification of tweet sentiment in Twitter is discussed. To improve its scalability and efficiency, it is proposed to implement the work on Hadoop Ecosystem, a widely-adopted distributed processing platform using the Map Reduce parallel processing paradigm. Finally, extensive experiments will be conducted on real-world data sets, with an expectation to achieve comparable or greater accuracy than the proposed techniques in literature. Keywords: Twitter, Sentiment Analysis, Hadoop, Map reduce, HDFS 1. Introduction We live in a society where the textual data on the Internet is growing at a rapid pace and many companies are trying to use this deluge of data to extract people’s views towards their products. Online social network platforms, with their large-scale repositories of user-generated content, can provide unique opportunities to gain insights into the emotional “pulse of the nation”, and indeed the global community. A great source of unstructured text information is included in social networks, where it is unfeasible to manually analyze such amounts of data. There is a large number of social networks websites that enable users to contribute, modify and grade the content, as well as to express their personal opinions about specific topics. Some examples include blogs, forums, product reviews sites, and social networks, like Twitter (http://twitter.com/). Twitter (San Francisco, CA, USA) is a micro blogging site that offers the opportunity for the analysis of expressed mood, and previous studies have shown that geographical, diurnal, weekly, and seasonal patterns of positive and negative affect can be observed. Micro blogging and more particularly Twitter is used for the following reasons: • Micro blogging platforms are used by different people to express their opinion about different topics, thus it is a valuable source of people’s opinions. • Twitter contains an enormous number of text posts and it grows every day. The collected corpus can be arbitrarily large. • Twitter’s audience varies from regular users to celebrities, company representatives, politicians, and even country presidents. Therefore, it is possible to collect text posts of users from different social and interests groups. • Twitter’s audience is represented by users from many countries As the audience of micro blogging platforms and services grows every day, data from these sources can be used in opinion mining and sentiment analysis tasks. For example, manufacturing companies may be interested in the following questions: 2. Problem Definition The project focuses on using Twitter, the most popular micro blogging platform, for the task of sentiment analysis. The tweets are important for analysis because data arrive at

Welcome message from author
This document is posted to help you gain knowledge. Please leave a comment to let me know what you think about it! Share it to your friends and learn new things together.
Transcript
International Journal of Database Theory and Application
Vol.9, No.1 (2016), pp.77-86
http://dx.doi.org/10.14257/ijdta.2016.9.1.07
ISSN: 2005-4270 IJDTA
Copyright ⓒ 2016 SERSC
A Review of Sentiment Analysis in Twitter Data Using Hadoop
L.Jaba Sheela
Panimalar Engineering College, Chennai, India.
Abstract
Twitter is an online social networking site which contains rich amount of data that can
be a structured, semi-structured and un-structured data. In this work, a method which
performs classification of tweet sentiment in Twitter is discussed. To improve its
scalability and efficiency, it is proposed to implement the work on Hadoop Ecosystem, a
widely-adopted distributed processing platform using the Map Reduce parallel
processing paradigm. Finally, extensive experiments will be conducted on real-world
data sets, with an expectation to achieve comparable or greater accuracy than the
proposed techniques in literature.
Keywords: Twitter, Sentiment Analysis, Hadoop, Map reduce, HDFS
1. Introduction
We live in a society where the textual data on the Internet is growing at a rapid pace
and many companies are trying to use this deluge of data to extract people’s views
towards their products. Online social network platforms, with their large-scale
repositories of user-generated content, can provide unique opportunities to gain insights
into the emotional “pulse of the nation”, and indeed the global community. A great source
of unstructured text information is included in social networks, where it is unfeasible to
manually analyze such amounts of data. There is a large number of social networks
websites that enable users to contribute, modify and grade the content, as well as to
express their personal opinions about specific topics. Some examples include blogs,
forums, product reviews sites, and social networks, like Twitter (http://twitter.com/).
Twitter (San Francisco, CA, USA) is a micro blogging site that offers the opportunity for
the analysis of expressed mood, and previous studies have shown that geographical,
diurnal, weekly, and seasonal patterns of positive and negative affect can be observed.
Micro blogging and more particularly Twitter is used for the following reasons:
• Micro blogging platforms are used by different people to express their opinion
about different topics, thus it is a valuable source of people’s opinions.
• Twitter contains an enormous number of text posts and it grows every day. The
collected corpus can be arbitrarily large.
• Twitter’s audience varies from regular users to celebrities, company
representatives, politicians, and even country presidents. Therefore, it is possible
to collect text posts of users from different social and interests groups.
• Twitter’s audience is represented by users from many countries
As the audience of micro blogging platforms and services grows every day, data from
these sources can be used in opinion mining and sentiment analysis tasks. For example,
manufacturing companies may be interested in the following questions:
2. Problem Definition
The project focuses on using Twitter, the most popular micro blogging platform, for
the task of sentiment analysis. The tweets are important for analysis because data arrive at
International Journal of Database Theory and Application
Vol.9, No.1 (2016)
78 Copyright ⓒ 2016 SERSC
a high frequency and algorithms that process them must do so under very strict constraints
of storage and time. It will be shown how to automatically collect a corpus for sentiment
analysis and opinion mining purposes and then perform linguistic analysis of the collected
corpus. All public tweets posted on twitter are freely available through a set of APIs
provided by Twitter. Using the corpus, a sentiment classifier, is constructed that is able to
determine positive, negative and neutral sentiments.
3. Literature Review
In the past years, many works has been released in sentiment analysis. Implementation
of sentiment analysis has been carried out for a variety of applications over a wide range
of classification algorithms and for varying data size. There exist many possible variants;
some of them are discussed in following section.
3.1 Lin, Jimmy, and Alek Kolcz. "Large-Scale Machine Learning at Twitter." In
Proceedings of the 2012 ACM SIGMOD International Conference on Management
of Data, pp. 793-804. ACM, 2012. [3]
This paper presents a case study of Twitter’s integration of machine learning tools into
its existing Hadoop-based, Pig-centric analytics platform. The core of this work lies in
recent Pig extensions to provide predictive analytics capabilities that incorporate machine
learning, focused specifically on supervised classification. In particular, the authors have
identified stochastic gradient descent techniques for online learning and ensemble
methods as being highly amenable to scaling out to large amounts of data.
In contrast to other linguistic approaches the authors adopt a knowledge-poor, data-
driven approach. It provides a base-line for classification accuracy from content, given
only large amounts of data.
The data set involves a test set consisting of one million English tweets with emoticons
from Sept. 1, 2015, at least 20 characters in length. The test set was selected to contain an
equal number of positive and negative examples. For training, they have prepared three
separate datasets containing 1 million, 10 million, and 100 million English training
examples from tweets before Sept. 1, 2015 (also containing an equal number of positive
and negative examples). In preparing both the training and test sets, emoticons are
removed.
Their experiments used a simple logistic regression classifier learned using online
stochastic gradient descent, using hashed byte 4-grams as features.
Their machine learning framework consists of two components: a core Java library and
a layer of lightweight wrappers that expose functionalities in Pig. A Pig script was written
for training binary sentiment polarity classifiers. The script processes tweets, separately
filtering out those containing positive and negative emoticons, which are unioned together
to generate the final training set. The learner in the training module is SGD logistic
regression which is embedded inside the Pig store function, such that the learned model is
written directly to HDFS.
For model training, the core Java library is integrated into Pig as follows: feature
vectors in Java are exposed as maps in Pig, which are treated as a set of feature id (int) to
feature value (oat) mappings. Thus, a training instance in Pig has the following schema:
(label: int, features: map[ ])
The authors have developed wrappers that use the classifiers directly in Pig. For each
classifier in our core Java library, there is a corresponding Pig UDF. The UDF is
initialized with the model, and then can be invoked like any other UDF.
Results of the polarity classification experiments showed accuracy in the range 77% to
82% with varying data set size.
International Journal of Database Theory and Application
Vol.9, No.1 (2016)
Copyright ⓒ 2016 SERSC 79
3.2 Bian, Jiang, Umit Topaloglu, and Fan Yu. "Towards Large-Scale Twitter Mining
for Drug-Related Adverse Events" In Proceedings of the 2012 international
workshop on Smart health and wellbeing, pp. 25-32. ACM, 2012. [4]
In this paper, the authors describe an approach to find drug users and potential adverse
events by analyzing the content of twitter messages utilizing Natural Language Processing
(NLP) and to build Support Vector Machine (SVM) classifiers. Due to the size nature of
the dataset (i.e., 2 billion Tweets), the experiments were conducted on a High
Performance Computing (HPC) platform using Map Reduce, which exhibits the trend of
big data analytics. The results suggest that daily-life social networking data could help
early detection of important patient safety issues
The data set used is a collection of over 2 billion Tweets collected from May 2009 to
October 2010, from which they try to identify potential adverse events caused by drugs of
interest. The collected stream of Tweets was organized by a timeline. The raw Twitter
messages were crawled using the Twitter’s user timeline API that contains information
about the specific Tweet and the user. The work is indexed only with the following four
fields for each Tweet:
1) Tweet id that uniquely identifies each Tweet;
2) User identifier associated with each Tweet;
3) Timestamp of the Tweet; and 4) the Tweet text.
They utilized the Amazon Elastic Compute Cloud (EC2) to run the Twitter indexers on
15 separate EC2 instances, 34.2 GB of memory, and 13 EC2 Compute Units) in parallel,
which were able to parse and index all 2 billion Tweets within two days. The size of the
Lucene indexes is 896 GB.
To mine Twitter messages for AEs, the process can be separated into two parts:
1) Identifying potential users of the drug;
2) Finding possible side effects mentioned in the users’ Twitter timeline that might be
caused by the use of the drug concerned.
Both processes involve building and training classification models based on features
extracted from the users’ Twitter messages. Two-sets of features (i.e., textual and
semantic features) are extracted from Twitter users’ timeline for both classification
models.
Textual features such as the bag-of-words (BoWs) model are derived based our
analysis of the actual Twitter messages. Semantic features are derived from the Unified
Medical Language System (UMLS) Metathesaurus concept codes extracted from the
Tweets using Metamap developed at the National Library of Medicine (NLM). Two-class
Support Vector Machine (SVM) was used for the purpose of classification.
Evaluation of the SVM was done using parameters such as, the Area under the Curve
(AUC) value, and the Receiver operating characteristic (ROC) curve. The ROC curve
using the mean values of the 1000 iterations was drawn. The prediction accuracy on
average over the 1000 iterations was evaluated to 0.74 and the mean AUC value is 0.82.
3.3 Liu, Bingwei, Erik Blasch, Yu Chen, Dan Shen, and Genshe Chen. "Scalable
Sentiment Classification for Big Data Analysis Using Naive Bayes Classifier" In Big
Data, 2013 IEEE International Conference on, pp. 99-104. IEEE, 2013. [5]
Machine learning technologies are widely used in sentiment classification because of
their ability to “learn” from the training dataset to predict or support decision making with
relatively high accuracy. However, when the dataset is large, some algorithms might not
scale up well. In this paper, the authors evaluate the scalability of Naive Bayes classifier
(NBC) in large-scale datasets. They have presented a simple and complete system for
sentiment mining on large datasets using a Naive Bayes classifier with the Hadoop
framework. Instead of using Mahout Library, they implemented NBC to achieve fine-
grain control of the analysis procedure for a Hadoop implementation. They have

International Journal of Database Theory and Application
Vol.9, No.1 (2016)
80 Copyright ⓒ 2016 SERSC
demonstrated that NBC is able to scale up to analyze the sentiment of millions movie
reviews with increasing throughput.
The raw data comes from large sets of movie reviews collected by research
communities. In their experiments, they use two datasets: the Cornell University movie
review dataset3 and Stanford SNAP Amazon movie review dataset4. The Cornell dataset
has 1000 positive and 1000 negative reviews. The Amazon movie review dataset is
organized into eight lines for each review, with additional information such product
identification (ID), user ID, profile Name, score, summary etc.
They have used only unigrams for the Naive Bayes classifier. The classification task is
divided into three sequential jobs as follows.
1) Training job - All training reviews are fed into this job to produce a model for all
unique words with their frequency in positive and negative review documents
respectively.
2) Combining job - In this job, the model and the test reviews are combined to a
intermediate table with all necessary information for the final classification.
3) Classify job - This job classifies all reviews simultaneously and writes the
classification results to HDFS.
The experimental setup consists of a Virtual Hadoop cluster of seven nodes. It is a fast
and easy way to test a Hadoop program in the Cloud, although the performance might be
weaker compared to a physical Hadoop cluster. The cloud infrastructure is built on a Dell
server with 12 Intel Xeon E5- 2630 2.3GHz cores and 32G memories.
They tested their code on Cornell dataset and resulted in a 80.85% average accuracy.
Without changing the Hadoop code, the program was able to classify different subsets of
Amazon movie review dataset with comparable accuracy. To test the scalability of Naive
Bayes classifier, the size of dataset in their experiment varies from one thousand to one
million reviews in each class.
3.4 ÁlvaroCuesta, David F., and María D. R-Moreno. "A Framework for Massive
Twitter Data Extraction and Analysis", In Malaysian Journal of Computer Science,
pp 50-67 (2014):1. [6]
The authors propose an open framework to automatically collect and analyze data from
Twitter’s public streams. This is a customizable and extensible framework, so researchers
can use it to test new techniques. The framework is complemented with a language-
agnostic sentiment analysis module, which provides a set of tools to perform sentiment
analysis of the collected tweets.
The capabilities of this platform are illustrated with two study cases in Spanish, one
related to a high impact event (the Boston Terror Attack), and another one related to
regular political activity on Twitter. The first case study involves the activity on Twitter
around a high impact event, the Boston Terror Attacks. In this case, they tracked a hash
tag. The second case study was focused on regular Twitter usage, tracking the activity
around well-known Spanish political actors, i.e. politicians, political parties, journalists
and activist organizations as well. The authors have selected controversial accounts to
have a good foundation for sentiment analysis.
There are several layers of processing and these modules need to interchange data
among them, using open data formats such as JSON. Most tools in the framework are
implemented in Python, but the Classifier and Tester web interfaces run on NodeJS and
are programmed in CoffeeScript (a language which can be pre-processed into JavaScript).
The chosen backend database is MongoDB, which is a good fit for our purposes since its
atomic representation is JSON, just like tweets The implementation was based on the
Natural Language Toolkit (NLTK) framework
A complete procedure of data extraction and sentiment analysis is divided into three
separate steps: data acquisition, training for sentiment analysis and report generation. The
first step is, gathering data from Twitter with the Miner. Then the classifier is trained and

International Journal of Database Theory and Application
Vol.9, No.1 (2016)
Copyright ⓒ 2016 SERSC 81
the sentiment analysis carried out. Finally, the platform generates a set of reports,
including the sentiment analysis if it is enabled. Classification was done according to
three classes, “positive”, “negative” and “neutral”. Several Naïve Bayes classifiers using a
set of ngrams in order to select the one with the best performance. In particular, they have
tried {1}, {2}, {3}, {1, 2}, {1, 3} and {2, 3} ngrams and minimum score of 0, 1, 2, 3, 4,
5, 6 and 10.
All these different options were tried using ten-fold cross-validation to avoid biases
induced by the partition of the training set. The parameters such as accuracy mean and
variance, precision, recall and fmeasure mean and variance were used for evaluation. The
conclusion is that the best trainers had 1-grams included and a minimum score between 2
and 4.
3.5 Skuza, Michal, and Andrzej Romanowski. "Sentiment analysis of Twitter Data
within Big Data Distributed Environment for Stock Prediction" In Computer
Science and Information Systems (FedCSIS), 2015 Federated Conference on, pp.
1349-1354. IEEE, 2015. [7]
This paper discusses a possibility of making prediction of stock market basing on
classification of data coming from Twitter micro blogging platform.
Twitter messages are retrieved in real time using Twitter Streaming API. Tweets were
collected over 3 month’s period from 2nd January 2013 to 31st March 2013. It was
specified in the query that tweets have to contain name of the company or hashtag of that
name. Predictions were made for Apple Inc. in order to ensure that sufficiently large
datasets would be retrieved
Only tweets in English are used in this research work. Reposted messages are
redundant for classification and were deleted. After pre-processing each message was
saved as bag of words model – a standard technique of simplified information
representation used in information retrieval.
System design consists of four components: Retrieving Twitter data, pre-processing
and saving to database (1), stock data retrieval (2), model building (3) and predicting
future stock prices (4).
Polarity mining is a part of sentiment in which input is classified either as positive or
negative. Automatic sentiment detection of messages was achieved by employing
SentiWordNet. Prediction of future stock prices is performed in this work by combining
results of sentiment classification of tweets and stock prices from a past interval.
Taking into consideration large volumes of data to be classified and the fact they are
textual, Naïve Bayes method was chosen due to its fast training process even with large
volumes of training data and the fact that is it is incremental. Considered large volumes of
data resulted also in decision to apply a map reduce version of Naïve Bayes algorithm.
3.6 Tare, Mohit, Indrajit Gohokar, Jayant Sable, Devendra Paratwar, and Rakhi
Wajgi. "Multi-Class Tweet Categorization Using Map Reduce Paradigm" In
International Journal of Computer Trends and Technology. pp 78 - 81 (2014) [8]
The authors have proposed strategy that uses Apache Hadoop framework, an open
source java framework, which relies on Map – Reduce paradigm and a Hadoop
Distributed File System (HDFS) to process data. The proposed Map – Reduce strategy for
classification of tweets using Naïve Bayes classifier relies on two Map-Reduce passes.
We have used the Twitter4j library to gather tweets which internally uses twitter REST
API. The Twitter4j library requires OAuth support to access the API. Twitter uses OAuth
to provide authorized access to its API.
The final step after preprocessing of tweets is the labeling of tweets based on
categories namely politics, sports and technology.
International Journal of Database Theory and Application
Vol.9, No.1 (2016)
82 Copyright ⓒ 2016 SERSC
In the first Map-Reduce pass, the mapper takes the labeled tweets from the training
data and outputs category and word as key value pair. The Reducer then sums up all
instances of the words for each category and outputs category and word-count pair as key-
value. The Map-Reduce thus deals with formation of model for the classifier. The next
Map-Reduce pass does the classification by calculating conditional probability of each
word (i.e. feature) and outputs category and conditional probability of each word as key-
value pair. Then final reducer calculates the final probability of each category to which
the tweet may belong to and outputs the predicted category and its probability value as
key-value pair
3.7 Comparitive Analysis
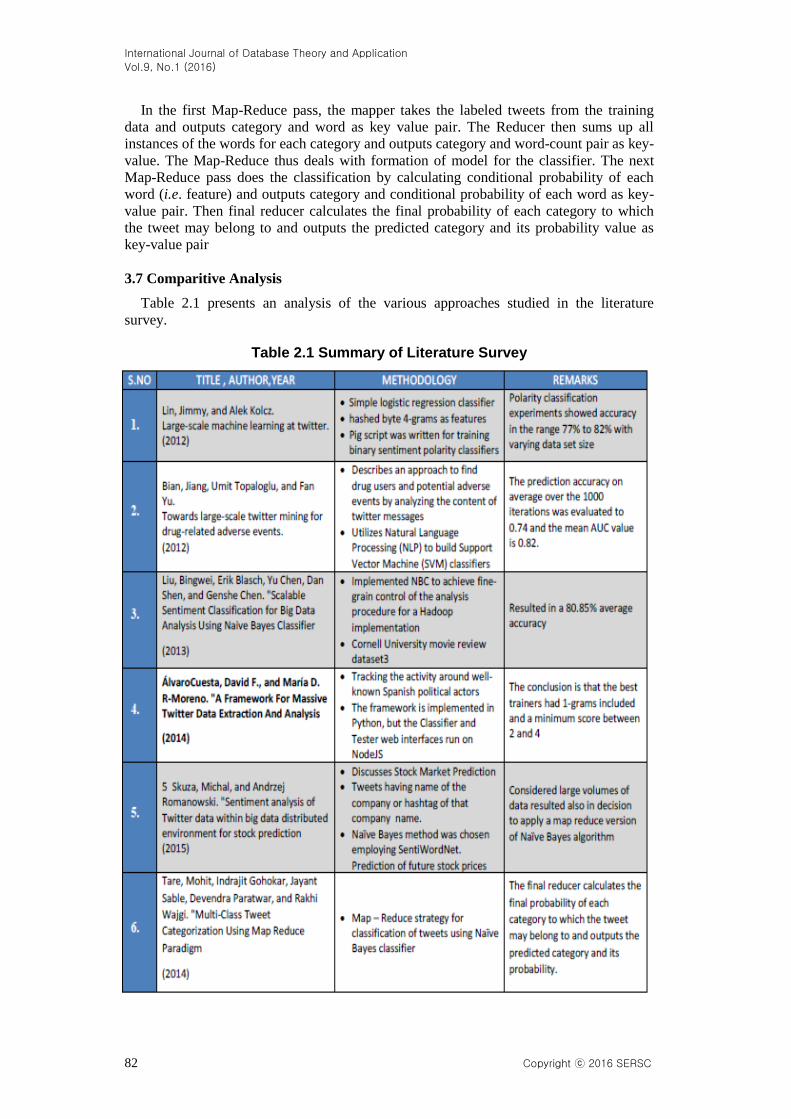
Table 2.1 presents an analysis of the various approaches studied in the literature
survey.
Table 2.1 Summary of Literature Survey
International Journal of Database Theory and Application
Vol.9, No.1 (2016)
Copyright ⓒ 2016 SERSC 83
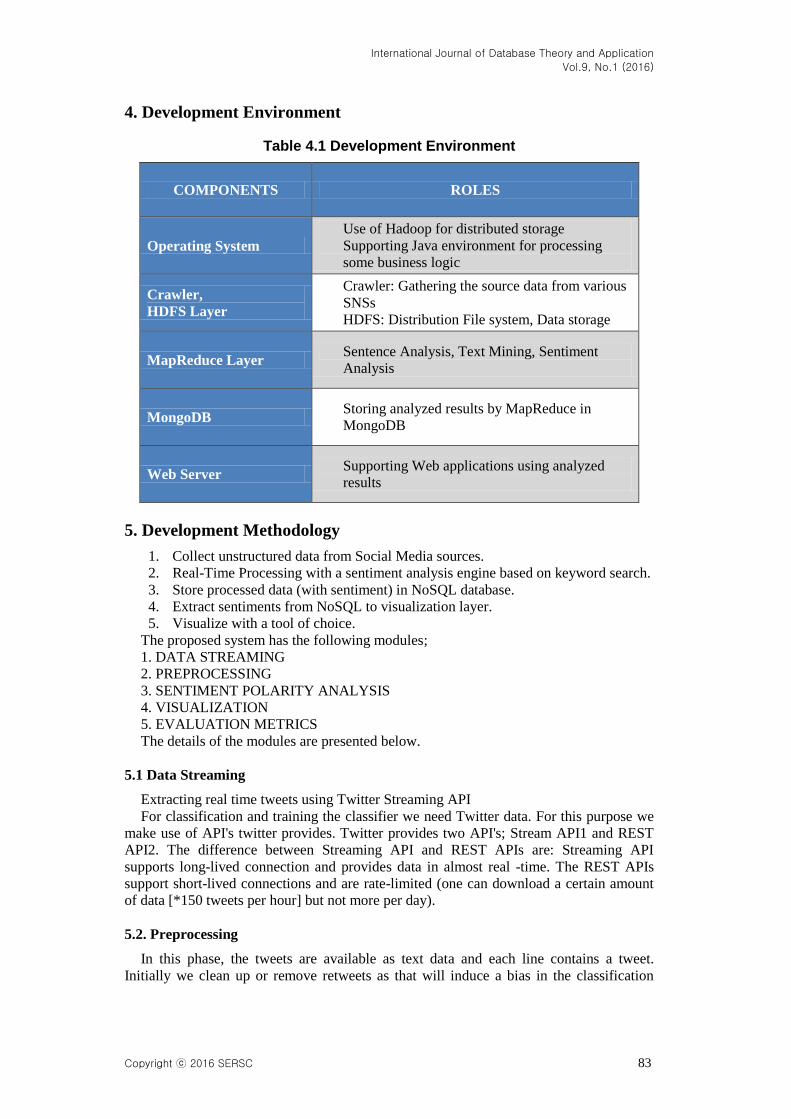
4. Development Environment
Table 4.1 Development Environment
COMPONENTS ROLES
Operating System
Use of Hadoop for distributed storage
Supporting Java environment for processing
some business logic
Crawler,
HDFS Layer
Crawler: Gathering the source data from various
SNSs
HDFS: Distribution File system, Data storage
MapReduce Layer Sentence Analysis, Text Mining, Sentiment
Analysis
MongoDB Storing analyzed results by MapReduce in
MongoDB
Web Server Supporting Web applications using analyzed
results
5. Development Methodology
1. Collect unstructured data from Social Media sources.
2. Real-Time Processing with a sentiment analysis engine based on keyword search.
3. Store processed data (with sentiment) in NoSQL database.
4. Extract sentiments from NoSQL to visualization layer.
5. Visualize with a tool of choice.
The proposed system has the following modules;
1. DATA STREAMING
2. PREPROCESSING
3. SENTIMENT POLARITY ANALYSIS
4. VISUALIZATION
5. EVALUATION METRICS
The details of the modules are presented below.
5.1 Data Streaming
Extracting real time tweets using Twitter Streaming API
For classification and training the classifier we need Twitter data. For this purpose we
make use of API's twitter provides. Twitter provides two API's; Stream API1 and REST
API2. The difference between Streaming API and REST APIs are: Streaming API
supports long-lived connection and provides data in almost real -time. The REST APIs
support short-lived connections and are rate-limited (one can download a certain amount
of data [*150 tweets per hour] but not more per day).
5.2. Preprocessing
In this phase, the tweets are available as text data and each line contains a tweet.
Initially we clean up or remove retweets as that will induce a bias in the classification
International Journal of Database Theory and Application
Vol.9, No.1 (2016)
84 Copyright ⓒ 2016 SERSC
process. We need to remove the punctuations and other symbols that doesn’t make any
sense as it may result in inefficiencies and may affect the accuracy of the overall process
5.3 Sentiment Polarity Analysis
MapReduce is a new parallel programming model, hence the classical Naive Bayes
based sentiment analysis algorithm is adjusted to fit into Map Reduce model. we choose
to employ a Naive Bayes classifier and empower it with an English lexical dictionary
SentiWordNet
5.4 Visualization
Tweets are presented using several different visualization techniques. Each technique is
designed to highlight different aspects of the tweets and their sentiment.
5.4.1 Heatmap
The heatmap visualizes the number of tweets within different sentiment regions. It
highlights "hot" red regions with many tweets, and "cold" blue regions with only a few
tweets.
5.4.2 Tag Cloud
The tag cloud visualizes the most frequently occurring terms in four emotional regions:
upset in the upper-left, happy in the upper-right, relaxed in the lower-right, and unhappy
in the lower-left. A term's size shows how often it occurs over all the tweets in the given
emotional region. Larger terms occur more frequently.
5.4.3 Timeline
The timeline visualizes when tweets were posted. Pleasant tweets are shown in green
above the horizontal axis, and unpleasant tweets in blue below the axis.
5.4.4 Map
The map shows where tweets were posted. Twitter uses an "opt-in" system for
reporting location: users must explicitly choose to allow their location to be posted before
their tweets are geotagged.
5.4.5 Affinity
The affinity graph visualizes frequent tweets, people, hashtags, and URLs, together
with relationships or affinities between these elements.
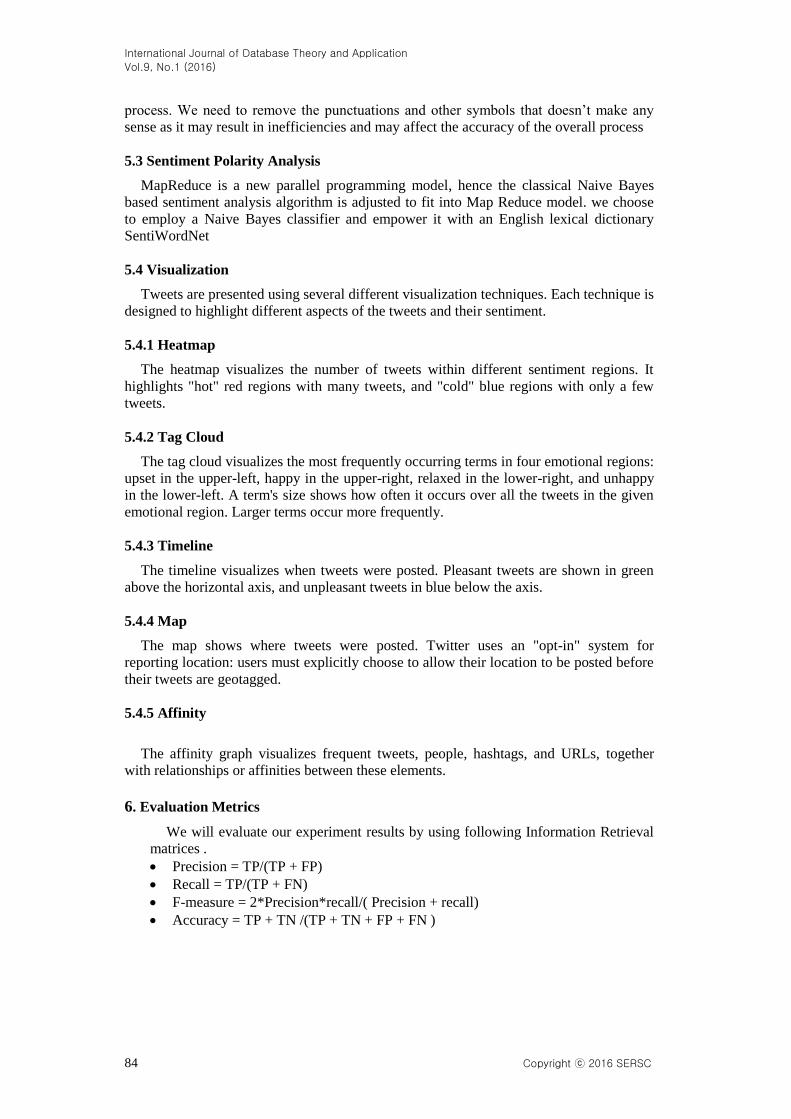
6. Evaluation Metrics
We will evaluate our experiment results by using following Information Retrieval
matrices .
Precision = TP/(TP + FP)
Recall = TP/(TP + FN)
F-measure = 2*Precision*recall/( Precision + recall)
Accuracy = TP + TN /(TP + TN + FP + FN )
International Journal of Database Theory and Application
Vol.9, No.1 (2016)
Copyright ⓒ 2016 SERSC 85
7. Conclusion
It is proposed to stream real time live tweets from twitter using Twitter API, and the
large volume of data makes the application suitable for Big Data Analytics. A method to
predict or deduct the location of a tweet based on the tweet’s information and the user’s
information should be found in the future.
References
[1] T. Wilson, J. Wiebe and P. Hoffmann, “Recognizing contextual polarity in phrase-level sentiment
analysis,” in Proceedings of HLT and EMNLP. ACL, (2005), pp. 347–354
[2] C. C. Tao, S. K. Kim, Y. A. Lin, Y. Y. Yu, G. Bradski, A. Y. Ng and Kunle Olukotun, “Map-reduce for
machine learning on multicore”, In NIPS, vol. 6, (2006), pp. 281-288.
[3] L. Jimmy, and A. Kolcz, “Large-scale machine learning at twitter”, In Proceedings of the 2012 ACM
SIGMOD International Conference on Management of Data, ACM, (2012), pp. 793-804.
[4] B. Jiang, U. Topaloglu and F. Yu, “Towards large-scale twitter mining for drug-related adverse events”,
In Proceedings of the 2012 international workshop on Smart health and wellbeing, ACM, (2012), pp.
25-32.
[5] L. Bingwei, E. Blasch, Y. Chen, D. Shen and G. Chen, “Scalable Sentiment Classification for Big Data
Analysis Using Naive Bayes Classifier”, In Big Data, 2013 IEEE International Conference on, IEEE,
(2013), pp. 99-104.
[6] Á. Cuesta, David F. and María D. R-Moreno, “A Framework for Massive Twitter Data Extraction and
Analysis”, In Malaysian Journal of Computer Science, (2014), pp. 50-67.
[7] S. Michal and A. Romanowski, “Sentiment analysis of Twitter data within big data distributed
environment for stock prediction”, In Computer Science and Information Systems (FedCSIS), 2015
Federated Conference on, IEEE, (2015), pp. 1349-1354.
[8] T. Mohit, I. Gohokar, J. Sable, D. Paratwar and R. Wajgi, “Multi-Class Tweet Categorization Using
Map Reduce Paradigm”, In International Journal of Computer Trends and Technology. (2014), pp. 78-
81.
[9] D. Jeffrey and S. Ghemawat, “MapReduce: simplified data processing on large clusters”,
Communications of the ACM 51.1, (2008), pp. 107-113.
[10] B. Yingyi, “HaLoop: Efficient iterative data processing on large clusters”, Proceedings of the VLDB
Endowment 3.1-2, (2010), pp. 285-296.
[11] T. Maite, “Lexicon-based methods for sentiment analysis”, Computational linguistics 37.2, (2011), pp.
267-307.
[12] R. Tushar and S. Srivastava, “Analyzing stock market movements using twitter sentiment analysis”,
Proceedings of the 2012 International Conference on Advances in Social Networks Analysis and Mining
(ASONAM 2012). IEEE Computer Society, (2012).
[13] D. Pessemier and Martens “MovieTweetings: A Movie Rating Dataset Collected From Twitter”, Ghent
University, Ghent, Belgium, (2013).
[14] Twitter. Twitter Search API, available at https://dev.twitter.com/rest/public/search.
[15] V. D. Katkar, S. V. Kulkarni, “A Novel Parallel implementation of Naive Bayesian classifier for Big
Data”, International Conference on Green Computing, Communication and Conservation of Energy,
978-1-4673-6126-2/2013 IEEE, pp. 847-852.
[16] S. Kumar, F. Morstatter and H. Liu, “Twitter Data Analytics”, Springer Science & Business Media,
(2013).
[17] B. Vishal, “Data Mining in Dynamic Social Networks and Fuzzy Systems”, IGI Global, (2013).
[18] G. Elmer, G. Langlois and J. Redden, “Compromised Data: From Social Media to Big Data”,
Bloomsbury Publishing USA, (2015).
[19] Nalini K. and L. J. Sheela, “Classification of Tweets Using Text Classifier to Detect Cyber Bullying”, In
Emerging ICT for Bridging the Future-Proceedings of the 49th Annual Convention of the Computer
Society of India CSI, Springer International Publishing, vol. 2, (2015), pp. 637-645.
[20] Jaba S. L. and Dr V. Shanthi, “An Approach for Discretization and Feature Selection Of Continuous-
Valued Attributes in Medical Images for Classification Learning”, International Journal of Computer
Theory and Engineering, vol. 1, no. 2, pp. 154.
[21] T. White, “Hadoop: The Definitive Guide”, Third Edition, O'Reilley, (2012).
[22] L. George, “HBase: The Definitive Guide”, O'Reilley, (2011).
[23] E. Hewitt, “Cassandra: The Definitive Guide”, O'Reilley, (2010).
[24] A. Gates, “Programming Pig”, O'Reilley, (2011).

International Journal of Database Theory and Application
Vol.9, No.1 (2016)
86 Copyright ⓒ 2016 SERSC
Author
L. Jaba Sheela, She received the PhD degree in 2010. She is
currently working as Professor & HOD in department of Master of
Computer Applications, of Panimalar Engineering College, Chennai.
She is also a team member of research projects sponsored by AICTE,
New Delhi. She is a member of CSI and ICAST. Her areas of interest
are Data Mining, Big Data Analytics, Software Quality Management,
Operating Systems, Image Processing, and Networking.
Related Documents


