A Review of Logging Fatalities Investigated by the Occupational Safety and Health Administration in FY 1996 and FY 1997 Part 1 of 2

Welcome message from author
This document is posted to help you gain knowledge. Please leave a comment to let me know what you think about it! Share it to your friends and learn new things together.
Transcript

A Review of Logging Fatalities Investigatedby the Occupational Safety and Health
Administration in FY 1996 and FY 1997
Part 1 of 2

October 2000OSHA Logging Report, Part 1 of 2
OSHA/IT/OSTAT/ELVancei
A Review of Logging Fatalities Investigatedby the Occupational Safety and Health Administration in
FY 1996 and FY 1997
Part 1 of 2
Charles N. JeffressAssistant Secretary of Labor
Occupational Safety and Health Administration
Cheryle GreenaughDirector
Directorate of Information Technology
Joe DuBoisDirector, Office of Statistics
.........................
.........................
Prepared by Edna L. VanceOffice of Statistics
Technical AdvisorPaul Cyr
Directorate of Compliance Programs
Special thanks to the Division of Data Analysis, Office of Statistics, fortechnical and data support, to Tom Ford, a Logging Safety Specialist withthe Washington Occupational Safety and Health Program, for his technicalreview and valuable input, to Linda Harrell of the Office of Statistics,without whose assistance this report could not have been completed, and toJacqueline Gilmore and Shirley Lashley of the Office of Statistics, whofound time among their many other duties and responsibilities to provideassistance in the collation and review of data.

October 2000OSHA Logging Report, Part 1 of 2
OSHA/IT/OSTAT/ELVanceii
A Review of Logging Fatalities Investigatedby the Occupational Safety and Health Administration in
FY 1996 and FY 1997
Part 1 of 2
Table of Contents
Page
I INTRODUCTION ................................................................................... 1
II HIGHLIGHTS ................................................................................... 3
III OBSERVATIONS ................................................................................... 7
IV DATA ISSUES ................................................................................... 9
V DATA REVIEW ................................................................................... 11
VI LOGGING REPORT ................................................................................... 12
A. Logging Fatality Trends .......................................................................B. Logging Fatalities Investigated by Federal Region and State .................C. Logging Fatalities Investigated by Forest Region ..................................D. Logging Fatalities Investigated by Month of Year ................................E. Logging Fatalities Investigated by Time of Death .................................F. Logging Fatalities Investigated by Age of Victims ................................G. Logging Fatalities Investigated and Identified Violations ......................H. Logging Fatalities Investigated and Assessed Penalties .........................I. Logging Fatalities Investigated and Establishment Size .........................J. Rate of Logging Fatalities Investigated .................................................
12151819192021232426
VII DATA TABLES .............................................................................................. 27
APPENDIX
ADDENDUM
REPORT EVALUATION FORM
1 29 CFR Part 1904.8 as revised April 1, 1994.
October 2000OSHA Logging Report, Part 1 of 2
OSHA/IT/OSTAT/ELVance
A Review of Logging Fatalities Investigatedby the Occupational Safety and Health Administration in
FY 1996 and FY 1997
Part 1 of 2
Background. In calendar year (CY) 1996, logging was the second most dangerousoccupation in the United States based on fatality rates published by the Bureau of LaborStatistics (BLS), U. S. Department of Labor. In CY 1997, logging was the mostdangerous occupation, surpassing commercial fishing. In fiscal year (FY) 1997, OSHAtargeted logging for special attention to reduce the incidence of injuries in the industry.
I. INTRODUCTION � �
Section 8 of the Occupational Safety and Health Act (the Act) requires employers to
maintain records of work-related deaths and gives the Secretary of Labor authority to
regulate reporting. In 29 CFR (Code of Federal Regulation), Part 1904.8, the
Occupational Safety and Health Administration (OSHA) provides specific instructions
governing when and where reports shall be made.1 This regulation provides that within
eight (8) hours after the death of an employee from a work-related incident, the employer
of the affected employee(s) shall orally report the fatality to the nearest OSHA Area
Office. Each report shall relate the establishment name, location of the incident, time of
the incident, number of fatalities and a brief description of the incident.
This report is a review of information OSHA collected during its investigations of
fatalities at logging facilities classified under the Standard Industrial Classification (SIC)
2411 in FY 1996 and FY 1997. This two-year review is limited to data in OSHA’s
Integrated Management Information System (IMIS) related to each OSHA logging fatality

October 2000OSHA Logging Report, Part 1 of 2
OSHA/IT/OSTAT/ELVance-2-
investigation (e.g., number of fatalities, date of fatal incidents, age of victims, number of
violations identified, dollar amounts of assessed penalties, etc.). A review of the more
subjective information in each investigative file (e.g., the employee’s work location at the
time of death, the victim’s activity at the time of the fatal action, the type of fatal incident,
etc.) will be addressed in Part 2 of this report. The relationship of the results of this
review to OSHA program policy, standards, and other related procedures and
requirements are addressed, as appropriate.
Of the 107 logging fatality investigations covered in this report, 51 of the investigations
were conducted by states operating comprehensive OSHA-approved safety and health
programs, and 56 were conducted by OSHA in states under Federal jurisdiction.
Throughout this report, the acronym OSHA is used to collectively refer to activities of the
21 State Plan States with comprehensive State Plans and the activities of OSHA in 29
Federal jurisdiction states.
The 107 logging fatality cases of this review (FY 1996 and FY 1997) represent 15% of
the 696 logging deaths investigated by OSHA over the past 10 years (FY 1988 -
FY 1997).
This review is a continuation of the OSHA fatality reports produced by the Office of
Statistics from 1976-1995. The focus and format have been modified to improve the
report’s utility and benefit to OSHA field staff and other users, and to support the
Agency’s goal to produce more user-friendly documents. Previous reviews reflected
select fatality investigations covering 7-10 years of OSHA activity.
The purpose of this 2-year review is to provide OSHA and other users with updated
information that may be useful in evaluating the nature and extent of more recent fatal
occupational logging injuries at facilities classified as SIC 2411. OSHA National and

A logger.Photo Credit: OSHA SLC Lab
October 2000OSHA Logging Report, Part 1 of 2
OSHA/IT/OSTAT/ELVance-3-
Regional Offices may find this information useful in monitoring industry changes and
evaluating the content and focus of enforcement activities, as well as, onsite and offsite
training and assistance activities, and standards’ proposals. These data reflect typical
industry situations and activities and, therefore, provide a standard for future reference.
2 Only 107 of the 117 fatalities investigated by OSHA in FY 1996 and FY 1997 are reviewed in this report. Ten (10) case files were eliminated because of incompleteness, misclassification or jurisdictional issues.
October 2000OSHA Logging Report, Part 1 of 2
OSHA/IT/OSTAT/ELVance-4-
II. HIGHLIGHTS � �
This section highlights the results of the review of 107 case files of logging fatalities
investigated by OSHA in FY 1996 and FY 1997. The complete review is provided in
section VI, Logging Report, pages 12-47, the Appendix and the Addendum. The
summary statements that follow reflect the results of the review of seven groups of data
or information: (1) the number of OSHA-investigated fatalities, (2) the location of the
fatalities, (3) the time frames of the fatal incidents, (4) the age of the victims, (5) the
number and classification of identified violations, (6) the assessed penalty amounts, and
(7) the size of the establishments of the fatal incidents and the rate of fatalities.
A. The number of onsite logging fatalities investigated by OSHA declined from
FY 1996 to FY 1997, the scope of this review. This decline (22%), from 66
fatalities in FY 1996 to 51 fatalities in FY 1997, was the same when looking at
investigations over a 10-year period (FY 1988 - FY 1997).2 See page 12.
B. The number of fatal occupational logging injuries reported by the Bureau of Labor
Statistics (BLS) also declined, from 156 fatal incidents in CY 1996 to 136 in CY
1997, a 13% change. Overall industry employment also declined, going from
85,892 employees in CY 1996, to 83,473 employees in CY 1997, a 3 percent
change. See page13.
C. Based on data represented in an American Pulpwood Association report, the
number of fatal logging incidents in the United States increased 2 percent from
CY 1996 (126 deaths) to CY 1997 (129 deaths). See page 13.
October 2000OSHA Logging Report, Part 1 of 2
OSHA/IT/OSTAT/ELVance-5-
D. Of the 107 logging fatalities investigated by OSHA in FY 1996 and FY 1997,
72% were in three (3) of the 10 Federal regions -- Regions III, IV and X. These
three regions also accounted for 62% of all logging establishments, and 68% of all
logging employees. See page 15.
E. Almost half of the 50 States (48%) reported no logging fatality investigations in
FY 1996 or FY 1997, although all states, except North Dakota, experienced some
level of logging activity over this two-year period. These 24 states represented
11% of all logging establishments, and 9% of all logging employees. See page 16.
F. Of the 107 logging fatalities investigated by OSHA in FY 1996 and FY 1997,
52% were in Federal states and represented 53% of the establishments and 53% of
the employees, and 48% were in State Plan states and represented 46% of the
establishments and 47% of the employees. Of these 26 states with fatalities, 10 were
implementing Local Emphasis Programs on logging in one or both years. See page 16.
G. Of the 107 logging fatalities investigated by OSHA in FY 1996 and FY 1997,
almost half (49%) were in one of the eight Forest Regions, the southern region.
This region also accounted for 45% of the logging establishments and 49% of the
logging employees. See page 18.
H. Of the 107 logging fatalities investigated by OSHA in FY 1996 and FY 1997,
more than half (59%) occurred over five months -- October, December, April,
July and August. See page 19.
I. Of the 107 logging fatalities investigated by OSHA in FY 1996 and FY 1997,
where the time of day of the fatal incidents was indicated (33 case files), 73% of
the victims died between the hours of 7:30 a.m. and 12:00 p.m. See page 19.
October 2000OSHA Logging Report, Part 1 of 2
OSHA/IT/OSTAT/ELVance-6-
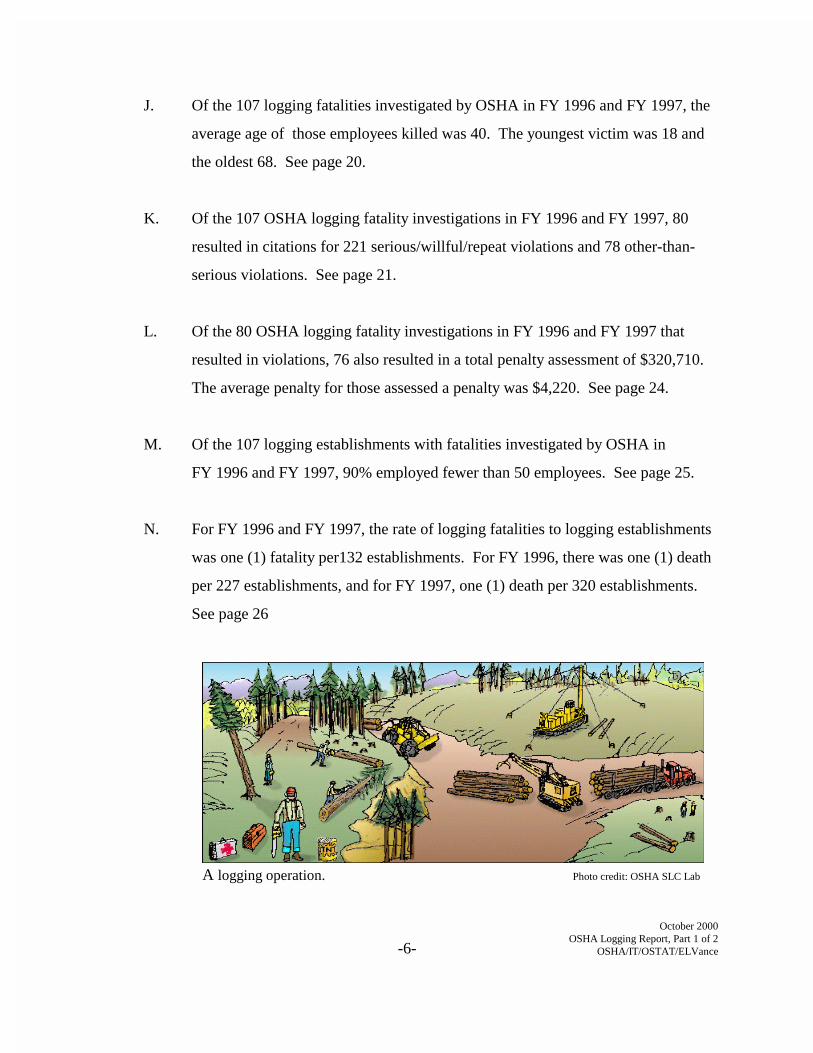
A logging operation. Photo credit: OSHA SLC Lab
J. Of the 107 logging fatalities investigated by OSHA in FY 1996 and FY 1997, the
average age of those employees killed was 40. The youngest victim was 18 and
the oldest 68. See page 20.
K. Of the 107 OSHA logging fatality investigations in FY 1996 and FY 1997, 80
resulted in citations for 221 serious/willful/repeat violations and 78 other-than-
serious violations. See page 21.
L. Of the 80 OSHA logging fatality investigations in FY 1996 and FY 1997 that
resulted in violations, 76 also resulted in a total penalty assessment of $320,710.
The average penalty for those assessed a penalty was $4,220. See page 24.
M. Of the 107 logging establishments with fatalities investigated by OSHA in
FY 1996 and FY 1997, 90% employed fewer than 50 employees. See page 25.
N. For FY 1996 and FY 1997, the rate of logging fatalities to logging establishments
was one (1) fatality per132 establishments. For FY 1996, there was one (1) death
per 227 establishments, and for FY 1997, one (1) death per 320 establishments.
See page 26

October 2000OSHA Logging Report, Part 1 of 2
OSHA/IT/OSTAT/ELVance-7-
BLANK
3 The number of logging fatalities investigated by OSHA was totaled for FY 1996 and FY 1997. Source: OSHA’s Integrated Management Information System (IMIS). The number of logging establishments was averaged for CY 1996 and CY 1997. Source: County Business Pattern reports.
October 2000OSHA Logging Report, Part 1 of 2
OSHA/IT/OSTAT/ELVance-8-
III. OBSERVATIONS � �
A. Of the 50 states with logging activity in FY 1996 and FY 1997, almost half (24
states or 48% of all states) reported no OSHA-investigated logging fatalities.
These 24 states represented 11% of all logging establishments, and 9% of all
logging employees.3 Of these 24 states, four (4) had significant numbers of
logging establishments, between 111 and 418. Two (2) states (Maine and
Wisconsin) had a significant number of logging establishments, 497 and 450
respectively, and only one (1) fatality each. See Table 1, page 29
Observation. Could the number of fatal logging incidents in the United States be
influenced by identifying and promoting, nationwide, practices, regulations and
procedures that have worked in those states with significant logging activity but
no fatalities or a low number of fatalities?
B. Of the 26 states with OSHA-investigated logging fatalities in FY 1996 and
FY 1997, almost half (11 states or 42%) accounted for more than three fourths of
all fatalities (80 or 75%). The rate of logging fatalities among the states was also
noteworthy. While Utah reported one (1) fatality investigation for every nine (9)
establishments, Maine and Wisconsin reported one (1) for every 497 and 450
establishments, respectively. See Tables 1 and 12, pages 29 and 44.
Observation. Could the number of logging fatalities in the United States be
influenced by focusing efforts more strategically in those states that accounted for
most of the deaths in FY 1996 and FY 1997? Special attention could also be

October 2000OSHA Logging Report, Part 1 of 2
OSHA/IT/OSTAT/ELVance-9-
A logger.Photo Credit: OSHA SLC Lab
given to those states with the highest rate of OSHA-investigated fatalities, e.g.,
Utah, Illinois, Virginia, Vermont, West Virginia and New York. See Tables 1
and 12, pages 29 and 44.
C. Of the 107 logging employees killed at OSHA-investigated sites in FY 1996 and
FY 1997, 5 percent were 18 and 19 years old, 22% were 20-29 years old, 23%
each were 30-39 and 40-49 years old, 20% were 50-59 years old and 7 percent
were 60 years old or older. See Table 6, page 36.
Observation. Generally, older workers are thought to be more knowledgeable and
experienced in their occupation and, therefore, suffer fewer on-the-job injuries.
Such an inference, however, cannot be proven without establishing the age
distribution in the industry. Nonetheless, when looking at age alone for those
killed in fatal logging incidents investigated by OSHA in FY 1996 and FY 1997,
the older workers suffered about the same number of fatal injuries as the younger
workers.
Could the rate of logging deaths in all age groups be
influenced by reevaluating the impact that
experience and training has had on injuries, illnesses
and fatalities in the industry, and, as appropriate,
providing additional training and information to
employers and employees in accident and injury
prevention?
October 2000OSHA Logging Report, Part 1 of 2
OSHA/IT/OSTAT/ELVance-10-
IV. DATA ISSUES � �
A. Of the 107 OSHA logging fatality case files reviewed for this report, 63 were for
FY 1996 and 44 for FY 1997. Ten (10) case files were eliminated from this
review because they were incomplete, represented fatalities that occurred away
from the logging site (e.g., on the highway en route to or from the logging site),
were sole proprietorships, or the facilities were misclassified as SIC 2411
(logging). Three (3) of the 10 eliminated cases were in FY 1996 and seven (7)
were in FY 1997. Only OSHA-investigated logging fatalities are included in this
review.
B. The logging fatality case files reviewed for this report were obtained from the
OSHA Internet Web site (April - June 1998). No effort was made to validate the
accuracy of the translation of these data from OSHA's Integrated Management
Information System (IMIS) nor to establish the accuracy of the data that resides in
the IMIS.
C. Except as noted, the number of OSHA-investigated logging fatalities was totaled
for FY 1996 and FY 1997 to add more value and meaning to the findings.
Information from County Business Pattern (CBP) reports (i.e., number of logging
establishments and the number of logging employees) was used to add perspective
to the findings for the logging industry as a whole and to increase confidence in
the inferences drawn. These data were averaged for CY 1996 and CY 1997,
except where noted. The number of logging fatalities reported by the Bureau of
Labor Statistics is compared to the number of logging fatalities investigated by
OSHA. Data are also referenced from an American Pulpwood Association (APA)
report. The APA is now known as the Forest Resources Association, Inc.
October 2000OSHA Logging Report, Part 1 of 2
OSHA/IT/OSTAT/ELVance-11-
D. For the 107 OSHA logging fatality cases reviewed, each represents one fatality
and a single establishment, with one exception. In FY 1997, one employer in
Utah experienced two (2) fatalities investigated by OSHA. However, to minimize
confusion in the presentation of information, these two fatalities are represented as
occurring at different establishments.
E. In the discussion of violations, no distinction is made between alleged violations
and final violations. In representing penalty amounts, “current” penalties are
used.
F. The number of employees controlled at each establishment where an OSHA
fatality inspection occurred was based on information obtained from the
employer. The number of employees controlled may be the employer’s best
estimate at the time and, therefore, less accurate than other information provided
to OSHA, e.g., the number of employees at the employer’s immediate work site.
G. States with logging fatality investigations in FY 1996 and/or FY 1997 and Local
Emphasis Programs (LEP’s) on logging in place, are noted. No conclusions are
drawn as to the impact of these programs in reducing the incidence of fatal
injuries. LEP’s are OSHA Regional plans that focus attention and resources in
industries, establishments or specific geographic areas with unique safety and/or
health problems (e.g., high injury/illness/ fatality rates) at the local level.
Generally, the impacts of these programs start during the planning phase and
continue years after completion.
H. All numbers represent data available at the time. Where numbers are rounded, the
calculation results may equal more or less than 100%.
October 2000OSHA Logging Report, Part 1 of 2
OSHA/IT/OSTAT/ELVance-12-
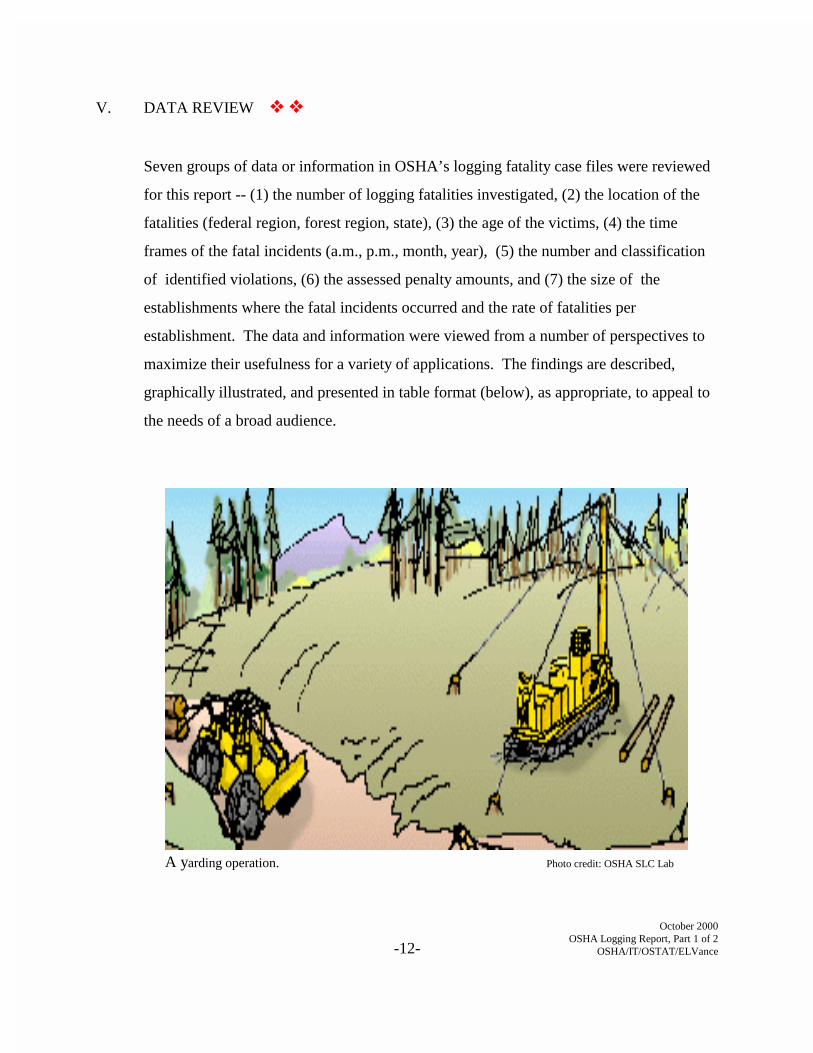
A yarding operation. Photo credit: OSHA SLC Lab
V. DATA REVIEW � �
Seven groups of data or information in OSHA’s logging fatality case files were reviewed
for this report -- (1) the number of logging fatalities investigated, (2) the location of the
fatalities (federal region, forest region, state), (3) the age of the victims, (4) the time
frames of the fatal incidents (a.m., p.m., month, year), (5) the number and classification
of identified violations, (6) the assessed penalty amounts, and (7) the size of the
establishments where the fatal incidents occurred and the rate of fatalities per
establishment. The data and information were viewed from a number of perspectives to
maximize their usefulness for a variety of applications. The findings are described,
graphically illustrated, and presented in table format (below), as appropriate, to appeal to
the needs of a broad audience.

4 The number of fatalities represents a count of the number of OSHA fatality inspections in establishments classified as SIC 2411.
5 Ten (10) case files were eliminated from this review because of incompleteness, misclassification or jurisdictional issues, three (3) in FY 1996 and seven (7) in FY 1997.
October 2000OSHA Logging Report, Part 1 of 2
OSHA/IT/OSTAT/ELVance-13-
Figure 1
VI. LOGGING REPORT � �
A. When looking at different sources of data, the trend of logging fatalities was mixed.
1. The number of onsite logging fatalities investigated by OSHA declined from
FY 1996 to FY 1997, the scope of this review.4 This decline, from 66 to 51
fatalities (-15 fatalities or a 22% change), was part of a decrease from 91 to 51
fatalities over an 8-year period (FY 1990 to FY 1997).5 Figure 1 shows the
downward trend in fatalities over the past 10 years. In 1988 and 1989, not all
State Plan states contributed data to OSHA’s Integrated Management Information
System (IMIS). See Figure 1, page 12.
Logging Fatality Trends � �
6 In 1992, the Bureau of Labor Statistics (BLS), U.S. Department of Labor, began collecting data on fatal occupational injuries. The results are published annually in the Bureau of Labor Statistics’ Census of Fatal Occupational Injuries (CFOI).
October 2000OSHA Logging Report, Part 1 of 2
OSHA/IT/OSTAT/ELVance-14-
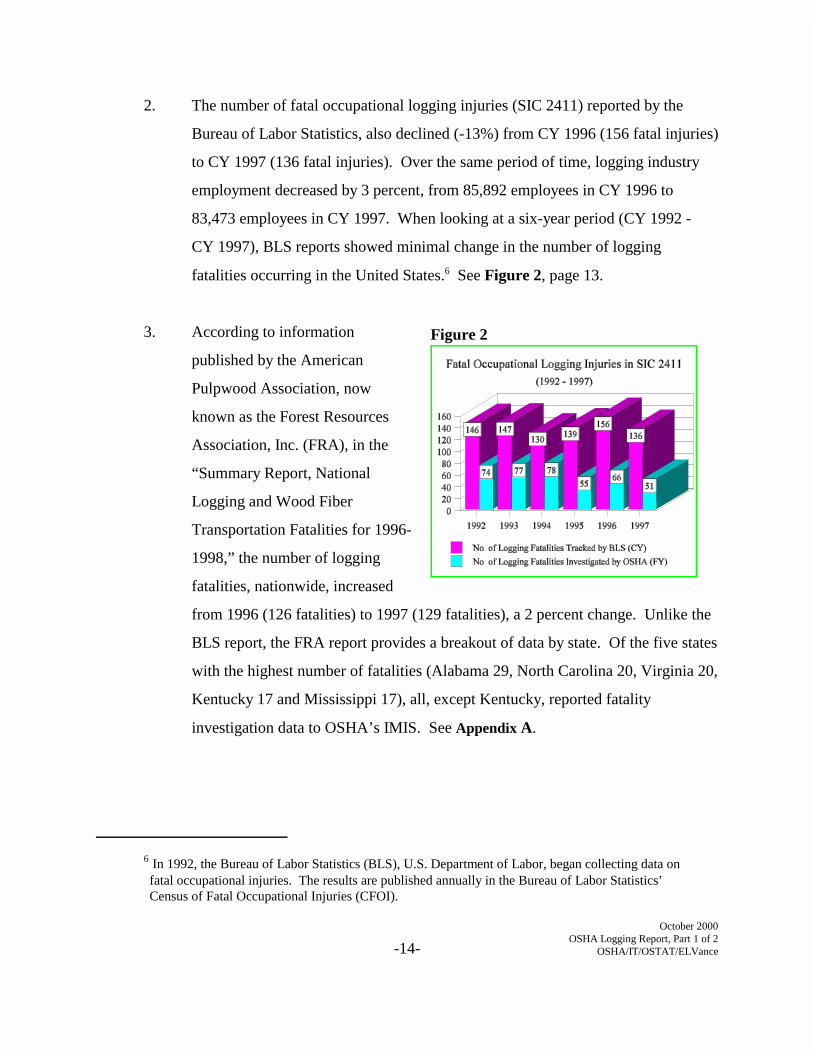
Figure 2
2. The number of fatal occupational logging injuries (SIC 2411) reported by the
Bureau of Labor Statistics, also declined (-13%) from CY 1996 (156 fatal injuries)
to CY 1997 (136 fatal injuries). Over the same period of time, logging industry
employment decreased by 3 percent, from 85,892 employees in CY 1996 to
83,473 employees in CY 1997. When looking at a six-year period (CY 1992 -
CY 1997), BLS reports showed minimal change in the number of logging
fatalities occurring in the United States.6 See Figure 2, page 13.
3. According to information
published by the American
Pulpwood Association, now
known as the Forest Resources
Association, Inc. (FRA), in the
“Summary Report, National
Logging and Wood Fiber
Transportation Fatalities for 1996-
1998,” the number of logging
fatalities, nationwide, increased
from 1996 (126 fatalities) to 1997 (129 fatalities), a 2 percent change. Unlike the
BLS report, the FRA report provides a breakout of data by state. Of the five states
with the highest number of fatalities (Alabama 29, North Carolina 20, Virginia 20,
Kentucky 17 and Mississippi 17), all, except Kentucky, reported fatality
investigation data to OSHA’s IMIS. See Appendix A.
October 2000OSHA Logging Report, Part 1 of 2
OSHA/IT/OSTAT/ELVance-15-
4. When comparing the number of logging fatalities reported by the BLS to those
investigated by OSHA over a similar period of time (CY 1996 and CY 1997 to
FY 1996 and FY 1997), the differences range from 54 to 88 more fatalities
reported by the BLS than investigated by OSHA. A number of factors may
account for these differences.
a. Some logging fatalities tracked by the BLS do not fall within OSHA’s
jurisdiction (e.g., the self-employed, which accounted for, on average,
30% of the BLS annual report of logging fatalities, and deaths resulting
from health-related diseases, such as, heart attacks and strokes). Of the
156 and 136 logging-related deaths reported by the BLS for CY 1996 and
CY 1997, 30 and 55 respectively, of those fatally injured were identified as
self-employed.
b. The time frames of the BLS and OSHA data and the manner in which
these data are defined may also account for some differences in the
numbers. The BLS reports data by calendar year (January - December),
and represents fatalities based on the date of death, while OSHA reports
information by Federal fiscal year (October - September), and tracks
fatalities based on the date of injury. Examples include fatality cases
where the employee’s injury and subsequent death occur in different
calendar years, and cases where death occurred several weeks or months
after injury. The latter cases are less likely to be investigated by OSHA
because of the difficulty in reconstructing the scene. In the former
example, BLS would record the injury and death in different calendar
years, OSHA would record both injury and death in the same fiscal year.
October 2000OSHA Logging Report, Part 1 of 2
OSHA/IT/OSTAT/ELVance-16-
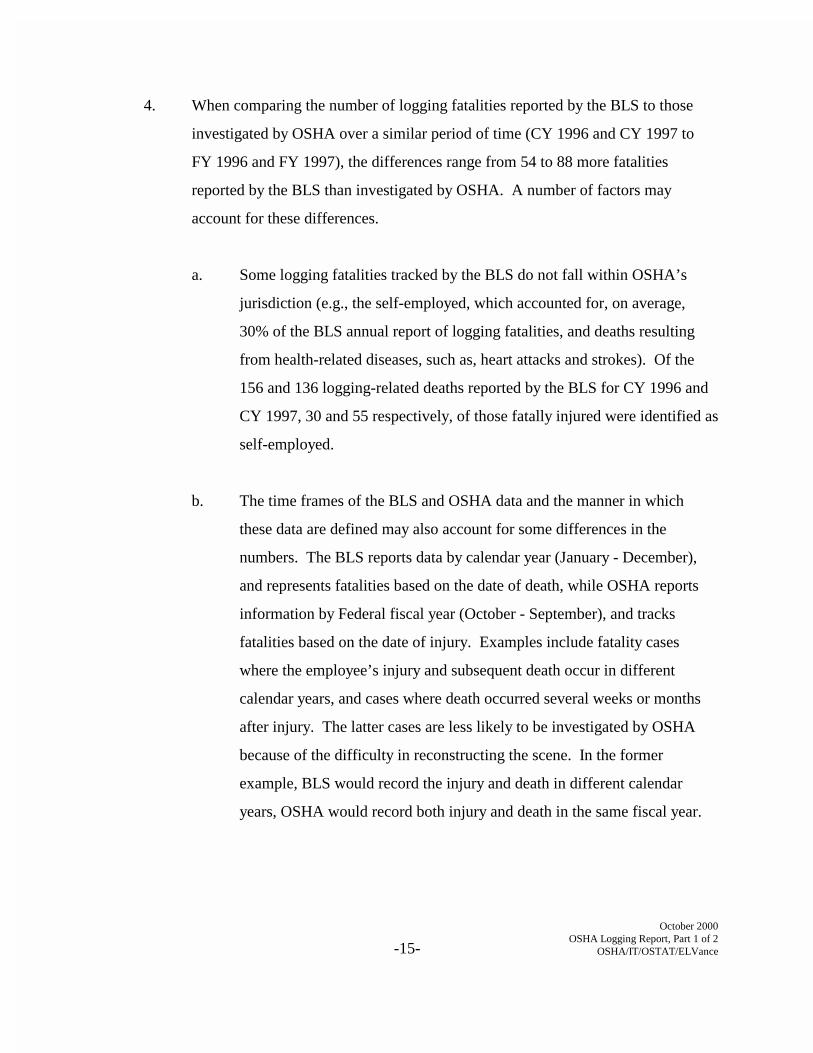
Figure 3
c. Additionally, the widening gap between the number of logging fatalities
reported by the BLS and the number of logging fatalities investigated by
the Agency suggest that OSHA intervention, e.g., enforcement
inspections, consultation visits, training, safety and health standards, etc.,
may be having a positive impact on workplace hazards that cause fatal
injuries in those establishments covered by OSHA. This needs further
study.
B. Almost three fourths of the logging Fatalities in FY 1996 and FY 1997 (107 fatal
incidents), were focused in three areas.
1. Of the 10 Federal Regions, three (3) Regions (Regions IV, X and III) accounted
for 72% (77) of the 107 OSHA-investigated logging fatalities in FY 1996 and FY
1997. Over a similar period of time (CY 1996 and CY 1997), these same regions
accounted for 62% (8,781) of all
logging establishments in the
United States, and 68% (57,559)
of all logging employees. Region
IV had the highest number of
deaths, 31 fatalities or 29% of all
fatal incidents, followed by
Region X with 25 deaths or 23%
of all fatalities, and Region III
with 21 fatalities or 20% of all
fatal incidents. See Figures 3
and 4, pages 15 and 16, and Table 1, page 29.
Logging Fatalities Investigated by Federal Region and State � �

7 Logging establishments, County Business Pattern reports, CY 1996 and CY 1997.
October 2000OSHA Logging Report, Part 1 of 2
OSHA/IT/OSTAT/ELVance-17-
Figure 4United States Federal Regions
2. While Regions III, VI, VIII and IX experienced an increase in logging fatality
investigations from FY 1996 to FY 1997, Regions I, II, IV, V and X experienced
decreases. Region III had the greatest increase, going from nine (9) fatality
investigations in FY 1996 to twelve (12) in FY 1997. See Table 1, page 29.
3. Not all Regions and states reported logging fatality investigations in FY 1996 and
FY 1997. Region VII reported no investigations over these two years. When
looking at the states, only 26 of the 50 states reported logging fatality
investigations. This means that almost half (24 states or 48%) reported no logging
fatality investigations in FY 1996 and FY 1997, representing 11% (1,581) of all
logging establishments, and 9% (7,551) of all logging employees. These 24 states
had no fatalities even though all, except North Dakota, had some level of logging
activity, i.e., the presence of logging establishments in FY 1996 and FY 1997. In
fact, four (4) of these states had more than 100 logging establishments --
Michigan, Minnesota, Kentucky and Missouri.7 See Tables 1 and 2, pages 29,
and 32, and the Addendum, pages 2-4.

October 2000OSHA Logging Report, Part 1 of 2
OSHA/IT/OSTAT/ELVance-18-
Number of Logging Establishments in Federal States(Number of Establishments Averaged for CY 1996 and CY 1997, County Business Pattern)
(Number of Establishments With OSHA-Investigated Fatalities, Totaled for FY 1996 and FY 1997, IMIS)
0
100
200
300
400
500
600
700
800
900
1000
1100
1200
No. Estabs 1083 678 60 15 9 353 764 451 44 6 523 497 35 746 111 288 12 155 10 272 0 160 53 370 1 22 445 341 450
No. With Fats 12 4 0 0 0 2 3 4 1 0 3 1 0 7 0 2 0 1 0 4 0 1 0 2 0 0 2 6 1
AL AR CO CT DE FL GA ID IL KS LA ME MA MS MO MT NE NH NJ NY ND OH OK PA RI SD TX WV WI
Figure 5
Number of Logging Establishments in State Plan States(Number of Establishments Averaged for CY 1996 and CY 1997, County Business Pattern)
(Number of Establishments With OSHA-Investigated Fatalities, Totaled for FY 1996 and FY 1997, IMIS)
0100200300400500600700800900
10001100120013001400
No. Estabs 67 38 519 3 95 36 213 70 418 218 5 22 769 1185 514 254 28 113 560 1036 67
No.With Fats 0 0 5 0 0 0 0 0 0 0 0 0 4 10 2 1 3 2 13 11 0
AK AZ CA HI IN IA KT MD MI MN NV NM NC OR SC TN UT VT VA WA WY
Figure 6
4. Virginia, Alabama, Washington and Oregon led all States with double digit
fatality investigations for the 24-month period covered by this report (FY 1996
and FY 1997), 13, 12, 11 and 10 fatal incidents, respectively. Virginia,
Alabama and Washington had logging LEP’s during both fiscal years (FY 1996
and FY 1997). Oregon had a logging LEP in FY 1996. See Figures 5 and 6, page
17, Table 2, page 32, and the Addendum, pages 2-4.
October 2000OSHA Logging Report, Part 1 of 2
OSHA/IT/OSTAT/ELVance-19-
Figure 7
5. Of the 107 logging fatalities investigated by OSHA in FY 1996 and FY 1997, 56
(52%) were in Federal states and represented 53% (7,706) of the logging
establishments and 53% (44,910) of the employees. Fifty-one (51 or 48%) were
in State Plan states and represented 46% (6,511) of all logging establishments and
47% (39,879) of all logging employees. Ten (10) of the states with fatalities were
implementing logging LEP’s during one or both years, five (5) each in Federal
and State Plan states. See Tables 1 or 2, pages 29 and 32.
6. Of the 21 State Plan states with logging activity in FY 1996 and FY 1997, 57%
(12) reported no fatality investigations, compared to 41% (12) of the 29 Federal
states. These 24 Federal and State Plan states with no fatality investigations
represented almost half of the 50 states, 11% of all logging establishments and 9%
of logging employees. See Table 2, page 32.
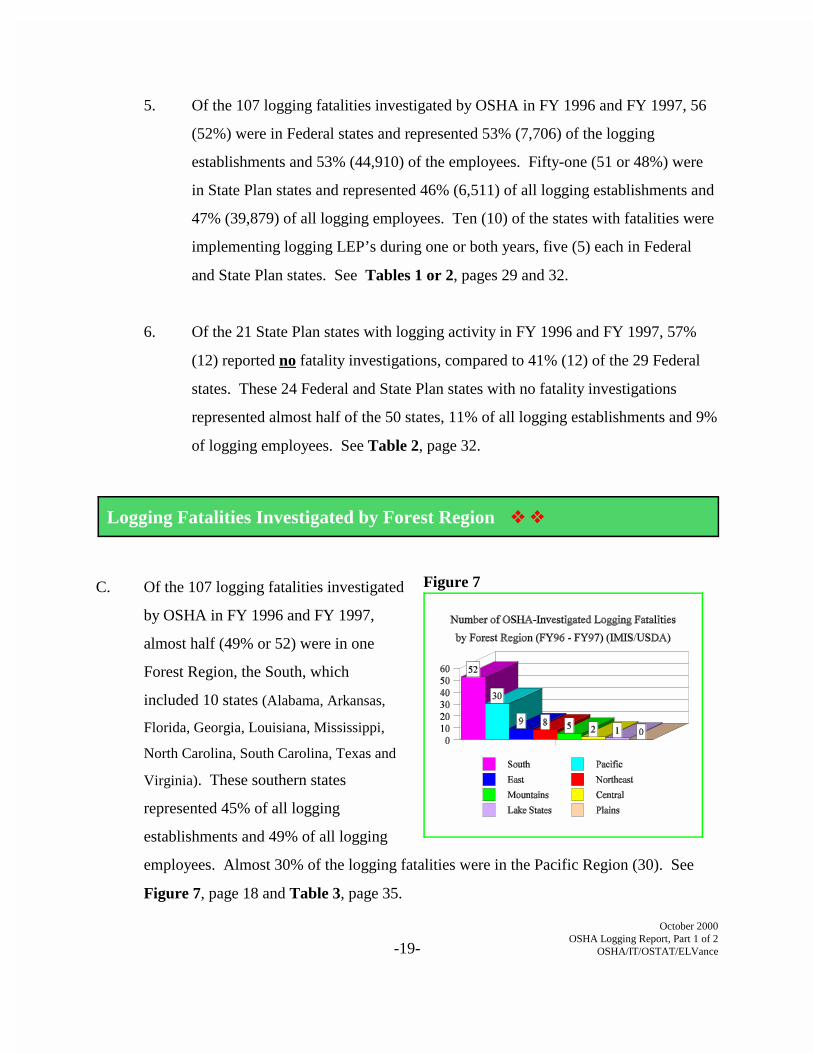
C. Of the 107 logging fatalities investigated
by OSHA in FY 1996 and FY 1997,
almost half (49% or 52) were in one
Forest Region, the South, which
included 10 states (Alabama, Arkansas,
Florida, Georgia, Louisiana, Mississippi,
North Carolina, South Carolina, Texas and
Virginia). These southern states
represented 45% of all logging
establishments and 49% of all logging
employees. Almost 30% of the logging fatalities were in the Pacific Region (30). See
Figure 7, page 18 and Table 3, page 35.
Logging Fatalities Investigated by Forest Region � �
8 Federal Quarters. Quarter One: October, November and December; Quarter Two: January, February and March; Quarter Three: April, May and June; and, Quarter Four: July, August and September.
October 2000OSHA Logging Report, Part 1 of 2
OSHA/IT/OSTAT/ELVance-20-
Figure 8
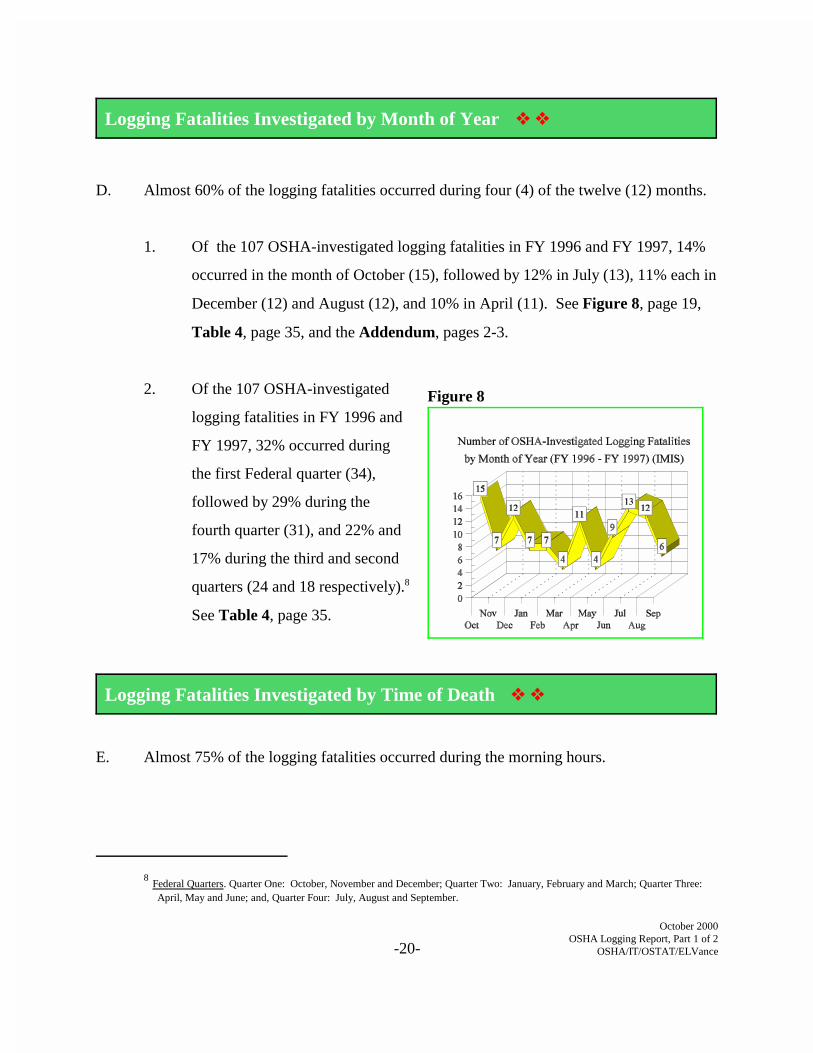
D. Almost 60% of the logging fatalities occurred during four (4) of the twelve (12) months.
1. Of the 107 OSHA-investigated logging fatalities in FY 1996 and FY 1997, 14%
occurred in the month of October (15), followed by 12% in July (13), 11% each in
December (12) and August (12), and 10% in April (11). See Figure 8, page 19,
Table 4, page 35, and the Addendum, pages 2-3.
2. Of the 107 OSHA-investigated
logging fatalities in FY 1996 and
FY 1997, 32% occurred during
the first Federal quarter (34),
followed by 29% during the
fourth quarter (31), and 22% and
17% during the third and second
quarters (24 and 18 respectively).8
See Table 4, page 35.
E. Almost 75% of the logging fatalities occurred during the morning hours.
Logging Fatalities Investigated by Month of Year � �
Logging Fatalities Investigated by Time of Death � �

October 2000OSHA Logging Report, Part 1 of 2
OSHA/IT/OSTAT/ELVance-21-
Figure 9
1. Of the 107 logging fatalities investigated by OSHA in FY 1996 and FY 1997, the
time of day of the fatal incidents was indicated in 33 of the case files reviewed.
Of these 33 cases, 24 of the fatal incidents (73%) occurred between the hours of
7:30 a.m. and 12:00 p.m., compared to four (4 or 12%) between 12:01 p.m. and
3:00 p.m., and five (5 or 15%) between 3:01 p.m. and 7:00 p.m. It is not known
whether the 7:30 a.m. to 7:00 p.m.
time frame represents one or two
work shifts. Many logging
employee work schedules are
longer than eight (8) hours. See
Figure 9, page 20.
2. In FY 1996, for those 22 case files
where time was indicated, 18
fatalities (82%) occurred between
7:30 a.m. and 12:00 p.m.,
compared to six (6 or 55%) of the 11 killed in FY 1997. See Table 5, page 36.
F. Older workers suffered fatal logging injuries at about the same rate as younger workers.
1. For the 107 logging employees killed in FY 1996 and FY 1997, the average age
was 40 (39 in FY 1996, 41 in FY 1997). In FY 1996 and FY 1997, the youngest
victims were 18 and 19, and the oldest, 62 and 68, respectively. See Table 6,
page 36, and the Addendum, pages 5 and 6.
Logging Fatalities Investigated by Age of Victims � �

October 2000OSHA Logging Report, Part 1 of 2
OSHA/IT/OSTAT/ELVance-22-
Figure 10
2. The average age of those killed in October, December, February, June, July and
August, was over 40. For FY 1996 and FY 1997, Region I had the highest aver-
age age, 50. The average age of victims in New Hampshire, Vermont and
Mississippi was also over 50. See Table 7, page37, and the Addendum pages 5-6.
3. The number of employees killed that were 50 years old or older (28), was almost
the same as the number killed that were 18-29 years old (29). See Figure 10,
page 21 and Tables 6 and 7,
pages 36 and 37.
4. While New York, California,
Georgia, Ohio and Texas had the
youngest victims, less than 20
years of age, Alabama,
Mississippi, Louisiana, Georgia
and Washington reported victims
sixty years old or older. See the
Addendum, pages 5-7.
G. Most OSHA-investigated logging fatalities resulted in the identification of violations of
agency standards and regulations.
1. Of the 107 logging fatalities investigated in FY 1996 and FY 1997, 80 resulted in
violations. Of the 299 violations resulting from the 80 investigations, 221 were
serious violations, including one (1) willful and three (3) repeat violations, and 78
Logging Fatalities Investigated and Identified Violations � �

9 All types of violations, i.e., serious, including willful and repeat, and other-than-serious violations, are represented together except as otherwise noted. No distinction is made between alleged violations and final violations.
October 2000OSHA Logging Report, Part 1 of 2
OSHA/IT/OSTAT/ELVance-23-
Figure 11
were other-than-serious violations.9 See Figure 11, page 22 and Table 8, page
38. For the 80 investigations, the average number of violations was four (4). The
average number of serious violations was three (3).
2. Of the 63 logging fatality
investigations in FY 1996, 49
investigations (78%) resulted in
violations, compared to 32 or 73%
of the 44 investigations in FY
1997. Of the 49 fatality
investigations that resulted in 196
violations in FY 1996, the average
number of serious violations was
three (3), and for other-than-
serious, one (1). Of the 32 fatality investigations that resulted in 103 violations in
FY 1997, the average number of serious violations was two (2), and for other-
than-serious, less than one (1).
3. In FY 1996, the highest number of serious violations for a single establishment
was issued by North Carolina (17), Virginia (11 and 8), Mississippi (8), and New
York (7). In FY 1997, New York and Mississippi led all states in issuing seven
(7) serious violations each for a single establishment, followed by Montana with
six (6) and Virginia with six (6) and five (5), respectively. For both years, three
(3) repeat violations were issued, all in Virginia. See the Addendum, pages 8-10.
October 2000OSHA Logging Report, Part 1 of 2
OSHA/IT/OSTAT/ELVance-24-
4. Some OSHA logging fatality investigations found employers in compliance. Of
the 63 fatalities investigated in FY 1996, 14 (22%) resulted in no violations of
OSHA standards or regulations, and 18 resulted in no serious violations (29%). In
FY 1997, 12 of the 44 investigations (27%) resulted in no violations, and 15
resulted in no serious violations (34%). See Table 8, page 38.
5. Ten (10) states identified no violations during their investigation of one or more
logging establishments with a fatality in FY 1996 -- Arkansas, North Carolina,
Texas, West Virginia, Idaho, New Hampshire, Oregon, South Carolina, Utah and
Washington. All of Arkansas’ investigations in FY 1996 (2), found employers in
compliance. In FY 1997, the picture was similar. Nine (9) States found no
violations during their investigation of one or more logging fatalities -- California,
Idaho, North Carolina, Oregon, Pennsylvania, Utah, Virginia, Vermont and West
Virginia. Of the10 investigations conducted by Oregon in FY 1996 and FY 1997,
six (6) employers were found to be in compliance. See Table 8, page 38.
6. The scope of an investigation, partial or complete, could impact the number and
classification of violations identified. Of the 80 logging fatality investigations
that resulted in the identification of violations of OSHA standards and regulations,
72 were partial inspections of the work site, e.g., inspections limited to the
immediate area of the fatal incident, and 35 were inspections of the entire work
site. The average number of violations for partial inspections was two (2),
compared to four (4) for complete inspections. See Table 9, page 40. Part 2 of
the logging report discusses the relationship of these violations to the fatal
incidents.

10 Penalty amounts are totaled or averaged for FY 1996 and FY 1997, except where otherwise noted. “Current” penalty amounts are used.
October 2000OSHA Logging Report, Part 1 of 2
OSHA/IT/OSTAT/ELVance-25-
H. Almost all of the logging fatality investigations that resulted in citations for violations of
OSHA standards and regulations, also resulted in the assessment of penalty.
1. Of the 80 logging fatalities investigated in FY 1996 and FY 1997 that resulted in
violations, the average penalty for those assessed a penalty was $4,220 ($4,830 in
FY 1996 and $2,777 in FY 1997). The total penalty assessments were $231,845
(FY 1996), $88,865 (FY 1997) and $320,710 for both years. See Table 8,
page 38.
2. The highest penalty amount for a single establishment in FY 1996 was assessed
by North Carolina ($35,025), Oregon ($30,000, $6,350 and $5,000), Virginia
($15,900 and $7,750), Alabama ($9,500), Texas ($8,400), and Maine, New York
and Vermont ($7,625, $7,630, and $7,600, respectively).10 The highest penalty
amount for a single establishment in FY 1997 was assessed by Virginia ($16,250
and $12,100), Montana and West Virginia ($6,000 each) and Florida and
California ($5,000 and $5,715, respectively). When comparing the states with the
largest penalty amounts for a single establishment to those with the greatest
number of violations for a single establishment, those with the highest number of
violations did not always issue the largest total penalty amounts. See page 21
above and the Addendum, pages 11-13.
Logging Fatalities Investigated and Assessed Penalties � �

11 The size of the establishments with fatalities is based on the number of employees the employer indicated that he or she had control over. This number is often the employer’s best estimate and may be less accurate than other information provided by the employer, e.g., the number of employees at the work site.
12 The number of logging establishments was averaged for CY 1996 and CY 1997. Source: County Business Patterns. The number of fatalities investigated by OSHA was totaled for FY 1996 and FY 1997. Source: OSHA’s Integrated Management Information System (IMIS).
October 2000OSHA Logging Report, Part 1 of 2
OSHA/IT/OSTAT/ELVance-26-
Figure 12
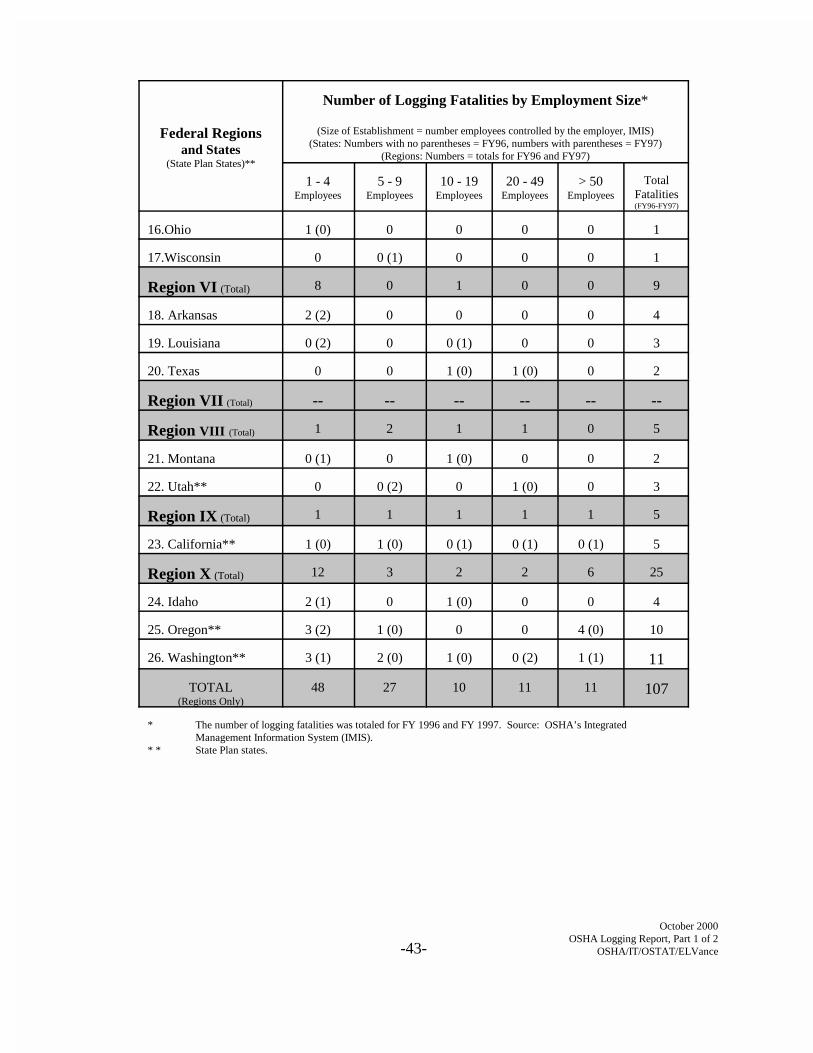
I. With few exceptions, the fatal logging incidents investigated by OSHA in FY 1996 and
FY 1997 occurred in small establishments.
1. Of the 107 logging establishments with OSHA-investigated fatalities in FY 1996
and FY 1997, 43% employed between one and four employees, 25% employed
5-9 employees, 10%, 10-19 employees, 11%, 20-49 employees, and 10%, 50 or
more employees. See Figure 12, page 25, and Table 10, page 42.11
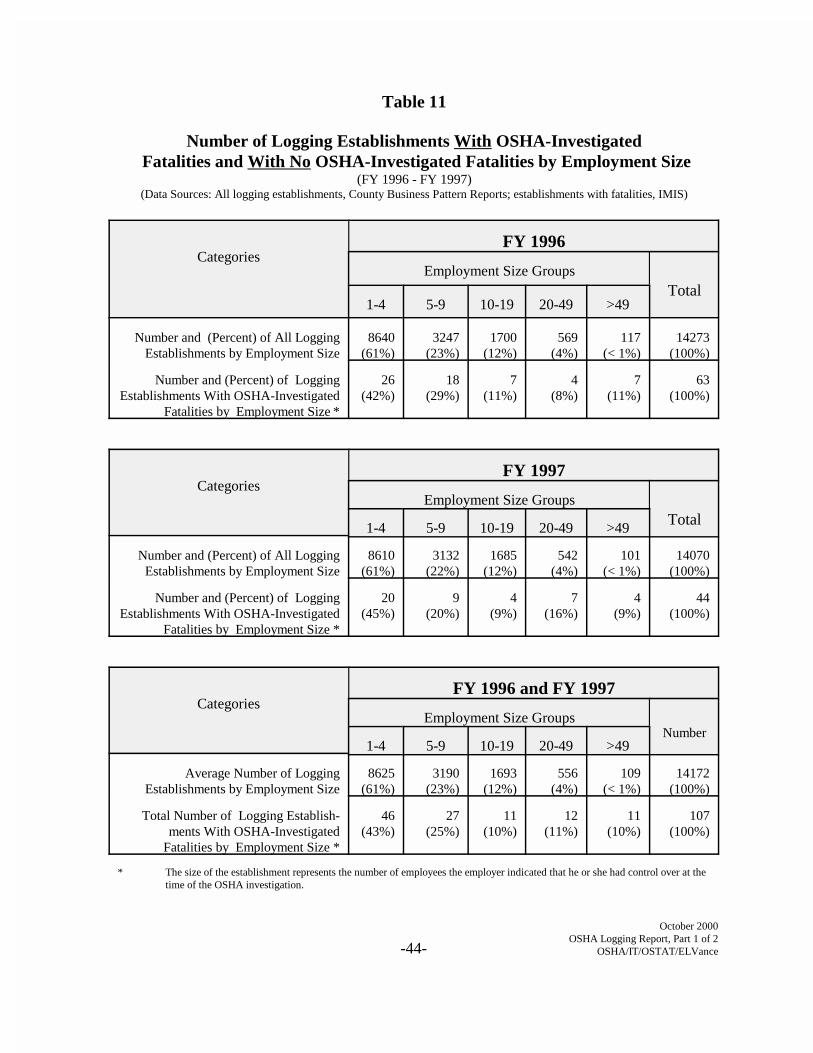
2. When reviewing data for all
logging establishments in the
United States, 61% of the 14,172
logging establishments identified
in County Business Pattern (CBP)
report, employed between one
and four employees, 23%
employed 5-9 employees, 12%
employed 10-19 employees, 4
percent employed 20-49
employees, and less than 1
percent employed 50 or more employees.12 See Table 11, page 44.
Logging Fatalities Investigated and Establishment Size � �

October 2000OSHA Logging Report, Part 1 of 2
OSHA/IT/OSTAT/ELVance-27-
3. When relating the number of logging establishments with fatalities by
employment size, to all logging establishments in the United States by
employment size, 10% of the logging establishments with OSHA-investigated
fatalities and 50 or more employees, represented less than 1 percent (<1%) of all
logging establishments in the United States with 50 or more employees. Eleven
percent (11%) of the logging establishments with OSHA-investigated fatalities
and 20-49 employees, represented about 4% of all logging establishments in this
employment size group as reported by the CBP. See Table 11, page 44.
J. The logging fatalities investigated in FY 1996 and FY 1997 affected less than 1 percent
(1%) of the logging establishments in the United States.
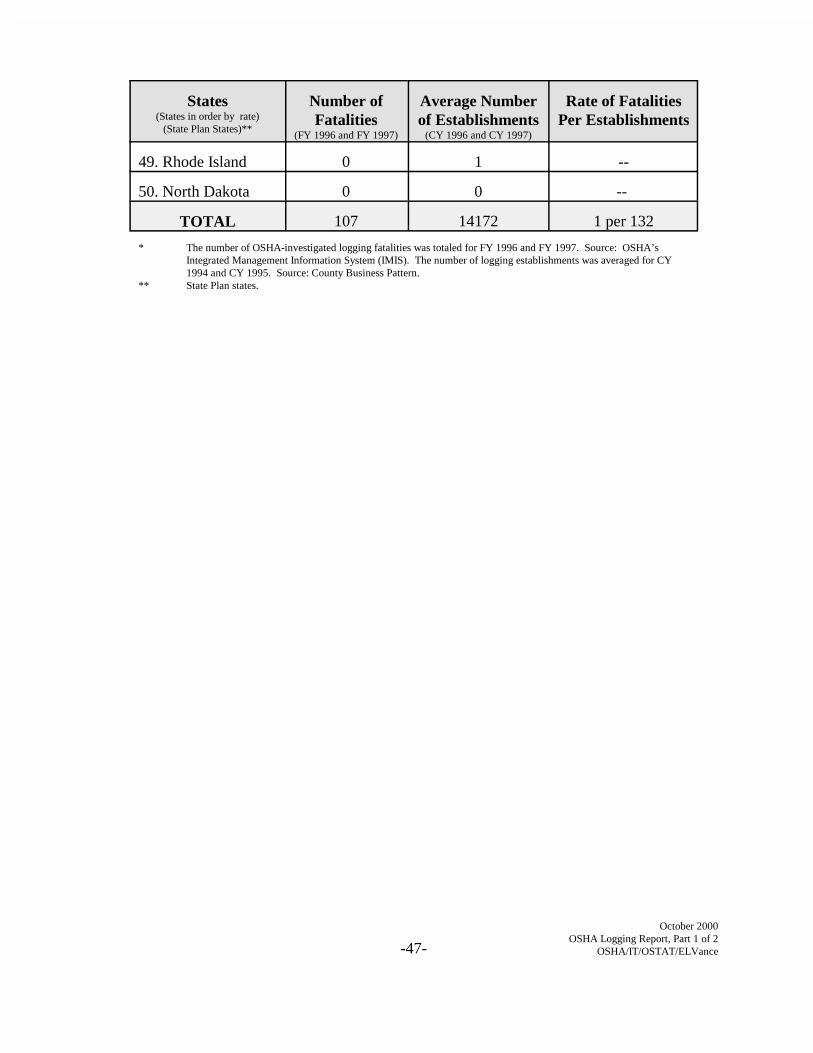
1. When looking at the number of logging fatalities investigated by OSHA (107) and
the number of logging establishments in the United States (14,172), the rate of
fatalities per establishment was one fatality for every 132 logging establishments
(1 per 227 in FY 1996 and 1 per 320 in FY 1997). Almost half of the 50 states (24
states or 48% of all states) reported no logging fatality investigations in FY 1996
and FY 1997, even though all states, except North Dakota, had some level of log-
ging activity, i.e., the presence of logging establishments. See Table 12, page 45.
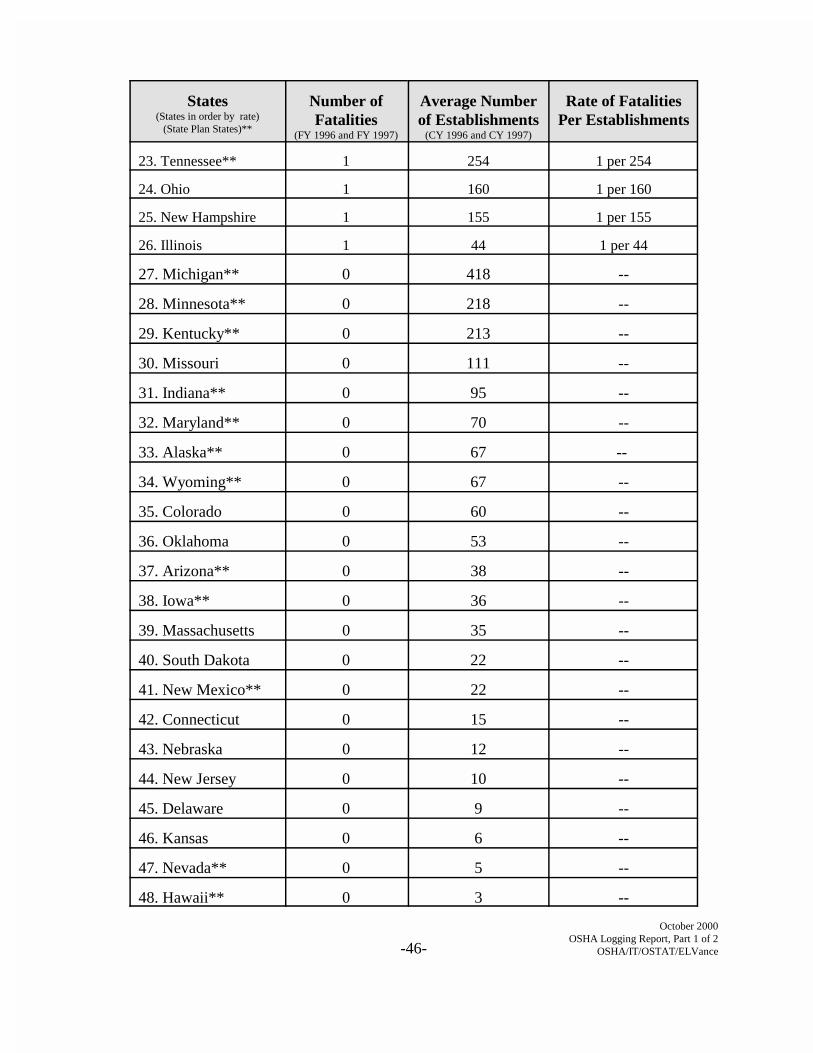
2. Of the 26 states with logging establishments and logging fatality investigations,
Utah had the highest rate of fatality investigations per establishment, one fatality
investigation for every nine (9) establishments, and Maine had the lowest, one
investigation for every 497 establishments. Virginia, with the highest number of
deaths (13), reported one fatality investigation for every 43 establishments, while
Oregon, with the greatest number of establishments (1,185), reported one fatality
investigation for every 118 establishments. See Table 12, page 45.
Rate of Logging Fatalities Investigated � �

October 2000OSHA Logging Report, Part 1 of 2
OSHA/IT/OSTAT/ELVance-28-
VII. Data Tables

October 2000OSHA Logging Report, Part 1 of 2
OSHA/IT/OSTAT/ELVance-29-
A Review of Logging Fatalities Investigatedby the Occupational Safety and Health Administration
in FY 1996 and FY 1997
Part 1 of 2
List of Data Tables
Table 1: Number of OSHA-Investigated Logging Fatalities and Number of LoggingEstablishments by Federal Region (FY 1996 and FY 1997)
Table 2: Number of OSHA-Investigated Logging Fatalities and Number of LoggingEstablishments by State (FY 1996 and FY 1997)
Table 3: Number of OSHA-Investigated Logging Fatalities by Forest Region (FY 1996 and FY 1997)
Table 4: Number of OSHA Investigated Logging Fatalities by Month of Year and FederalQuarter (FY 1996 and FY 1997)
Table 5: Number of OSHA-Investigated Logging Fatalities by Time of Day (FY 1996 and FY 1997)
Table 6: Number of OSHA-Investigated Logging Fatalities by Age of Victim (FY 1996 and FY 1997)
Table 7: Average Age of Victims of OSHA-Investigated Logging Fatalities by Region (FY 1996 and FY 1997)
Table 8: Number of Violations and Penalty Amounts Resulting From OSHA-InvestigatedLogging Fatalities by Federal Region (FY 1996 and FY 1997)
Table 9: Number of OSHA-Investigated Logging Fatalities by Scope of Inspection byFederal Region (FY 1996 and FY 1997)
Table 10: Number of OSHA-Investigated Logging Fatalities by Employment Size andFederal Region (FY 1996 and FY 1997)
Table 11: Number of Logging Establishments With OSHA-Investigated Fatalities and WithNo OSHA-Investigated Fatalities by Employment Size (FY 1996 and FY 1997)
Table 12: Rate of OSHA-Investigated Logging Fatalities Per Establishments by State(FY 1996 and FY 1997)

October 2000OSHA Logging Report, Part 1 of 2
OSHA/IT/OSTAT/ELVance-30-
Table 1
Number of OSHA-Investigated Logging Fatalitiesand Number of Logging Establishments by Federal Region*
(FY 1996 - FY 1997) (Data Source: IMIS)
Federal Regions and States(In order by Region)
(States with LEPs Indicated)
Total Number LoggingFatalities
Average NumberLogging
Establishments(CY 1996 and CY 1997)FY96 FY97 Total
Region I (Total) 3 1 4 815
1. Connecticut 0 0 0 15
2. Maine (LEP ‘96) 1 0 1 497
3. Massachusetts 0 0 0 35
4. New Hampshire 1 0 1 155
5. Rhode Island 0 0 0 1
6. Vermont** 1 1 2 113
Region II (Total) 3 1 4 282
7. New Jersey 0 0 0 10
8. New York 3 1 4 272
Region III (Total) 9 12 21 1349
9. Delaware 0 0 0 9
10. Maryland** 0 0 0 70
11. Pennsylvania 1 1 2 370
12. Virginia** (LEP ‘96 +’97) 5 8 13 560
13. West Virginia (LEP ’97) 3 3 6 341
Region IV (Total) 20 11 31 4694
14. Alabama (LEP ‘96 +’97) 8 4 12 1083
15. Florida 1 1 2 353
16. Georgia 2 1 3 764
Federal Regions and States(In order by Region)
(States with LEPs Indicated)
Total Number LoggingFatalities
Average NumberLogging
Establishments(CY 1996 and CY 1997)FY96 FY97 Total
October 2000OSHA Logging Report, Part 1 of 2
OSHA/IT/OSTAT/ELVance-31-
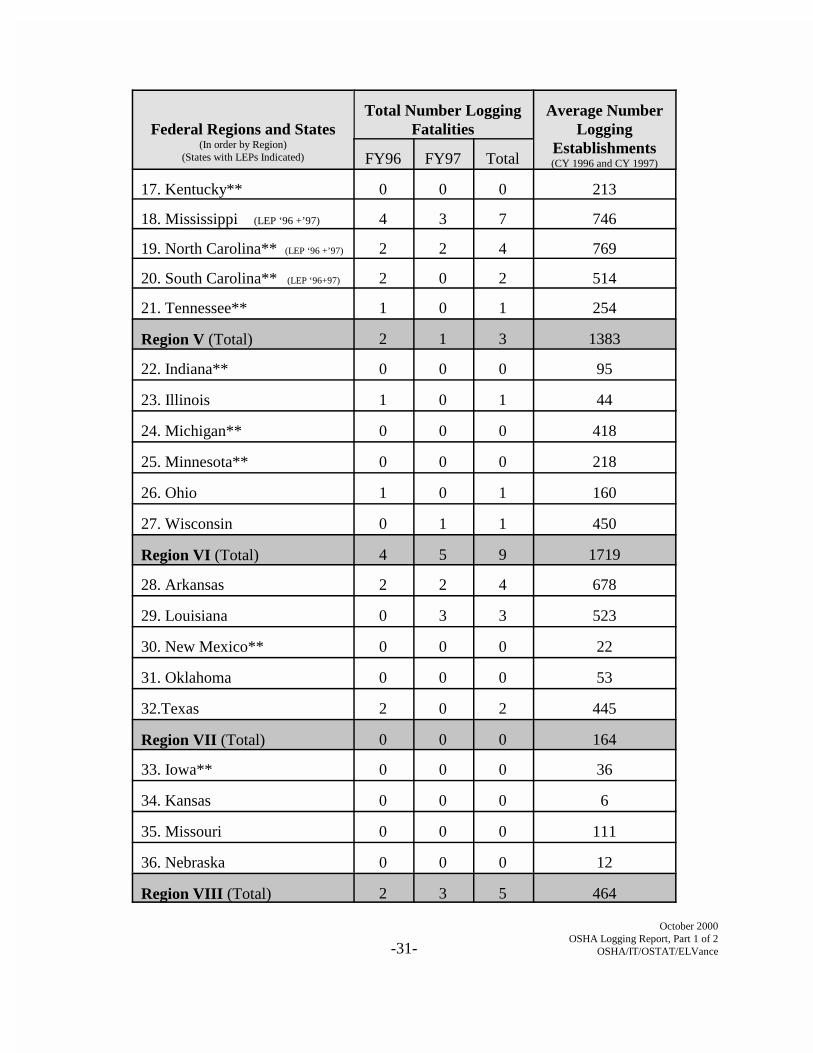
17. Kentucky** 0 0 0 213
18. Mississippi (LEP ‘96 +’97) 4 3 7 746
19. North Carolina** (LEP ‘96 +’97) 2 2 4 769
20. South Carolina** (LEP ‘96+97) 2 0 2 514
21. Tennessee** 1 0 1 254
Region V (Total) 2 1 3 1383
22. Indiana** 0 0 0 95
23. Illinois 1 0 1 44
24. Michigan** 0 0 0 418
25. Minnesota** 0 0 0 218
26. Ohio 1 0 1 160
27. Wisconsin 0 1 1 450
Region VI (Total) 4 5 9 1719
28. Arkansas 2 2 4 678
29. Louisiana 0 3 3 523
30. New Mexico** 0 0 0 22
31. Oklahoma 0 0 0 53
32.Texas 2 0 2 445
Region VII (Total) 0 0 0 164
33. Iowa** 0 0 0 36
34. Kansas 0 0 0 6
35. Missouri 0 0 0 111
36. Nebraska 0 0 0 12
Region VIII (Total) 2 3 5 464

Federal Regions and States(In order by Region)
(States with LEPs Indicated)
Total Number LoggingFatalities
Average NumberLogging
Establishments(CY 1996 and CY 1997)FY96 FY97 Total
October 2000OSHA Logging Report, Part 1 of 2
OSHA/IT/OSTAT/ELVance-32-
37. Colorado 0 0 0 60
38. Montana (LEP ’97) 1 1 2 288
39. North Dakota 0 0 0 0
40. South Dakota 0 0 0 22
41. Utah** 1 2 3 28
42. Wyoming** 0 0 0 67
Region IX (Total) 2 3 5 565
43. Arizona** 0 0 0 38
44. California** 2 3 5 519
45. Hawaii** 0 0 0 3
46. Nevada** 0 0 0 5
Region X (Total) 18 7 25 2738
47. Alaska** 0 0 0 67
48. Idaho (LEP ‘96 +’97) 3 1 4 451
49. Oregon** 8 2 10 1185
50. Washington** (LEP ‘96 +’97) 7 4 11 1036
TOTAL(Regions Only)
63 44 107 14,172
* The number of OSHA-investigated logging fatalities was totaled for FY 1996 and FY 1997. Source: OSHA’sIntegrated Management Information System (IMIS). The number of logging establishments was averaged forCY 1996 and CY 1997. Source: County Business Pattern reports.
* * State Plan states.Note: Local Emphasis Programs (LEP’s) are OSHA Regional plans that focus attention and resources in industries,
establishments or specific geographic areas with unique safety and/or health problems, e.g., high injury, illnessor fatality rates, at the local level. States with logging LEP’s were determined from information provided inone or more logging fatality case file.

October 2000OSHA Logging Report, Part 1 of 2
OSHA/IT/OSTAT/ELVance-33-
Table 2
Number of OSHA-Investigated Logging Fatalitiesand Number of Logging Establishments by State*
(FY 1996 - FY 1997) (Data Source: IMIS)
States(In order by number of fatalities)(Bold Italic = States with LEPs,
FY96 and/or FY97)
Total Number LoggingFatalities
Average NumberLogging
Establishments(CY 1996 and CY 1997)FY96 FY97 Total
1. Virginia** 5 8 13 560
2. Alabama 8 4 12 1083
3. Washington** 7 4 11 1036
4. Oregon** 8 2 10 1185
5. Mississippi 4 3 7 746
6. West Virginia 3 3 6 341
7. California** 2 3 5 519
8. North Carolina** 2 2 4 769
9. Idaho 3 1 4 451
10. Arkansas 2 2 4 678
11. New York 3 1 4 272
12. Louisiana 0 3 3 523
13. Utah** 1 2 3 28
14. Georgia 2 1 3 764
15. Florida 1 1 2 353
16. Pennsylvania 1 1 2 370
17. Vermont** 1 1 2 113
18. Texas 2 0 2 445
19. Montana 1 1 2 288
20. South Carolina** 2 0 2 514
21. Maine 1 0 1 497
States(In order by number of fatalities)(Bold Italic = States with LEPs,
FY96 and/or FY97)
Total Number LoggingFatalities
Average NumberLogging
Establishments(CY 1996 and CY 1997)FY96 FY97 Total
October 2000OSHA Logging Report, Part 1 of 2
OSHA/IT/OSTAT/ELVance-34-
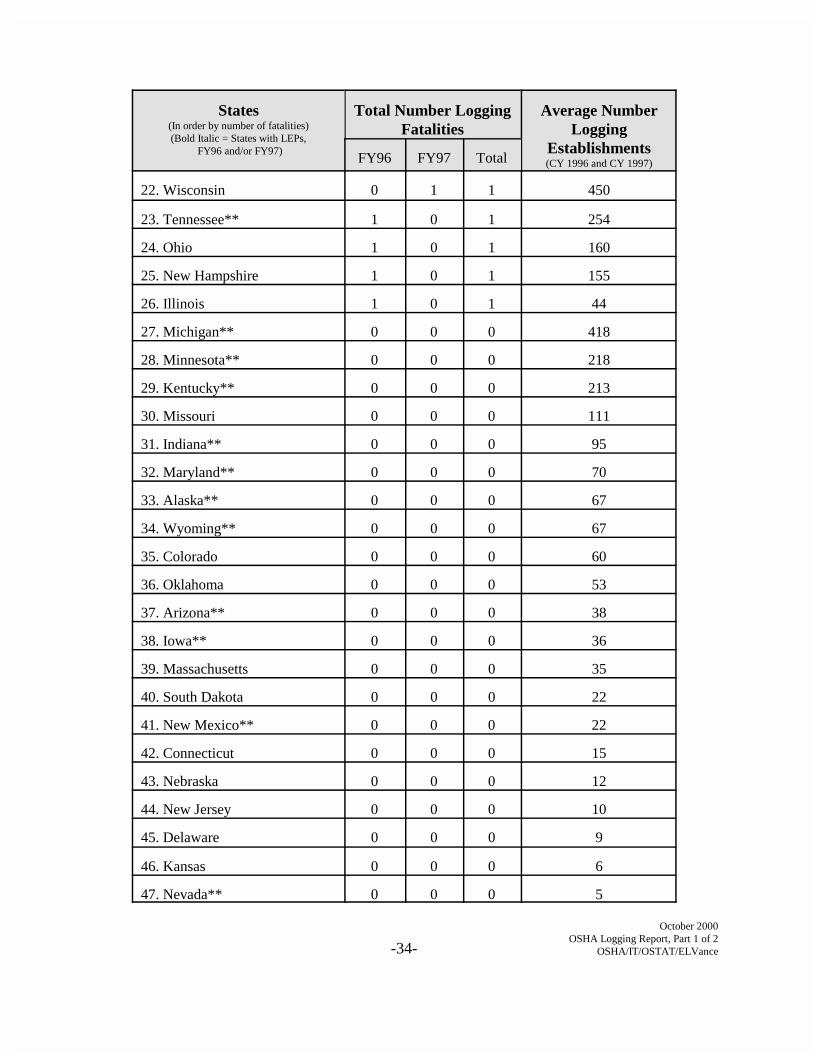
22. Wisconsin 0 1 1 450
23. Tennessee** 1 0 1 254
24. Ohio 1 0 1 160
25. New Hampshire 1 0 1 155
26. Illinois 1 0 1 44
27. Michigan** 0 0 0 418
28. Minnesota** 0 0 0 218
29. Kentucky** 0 0 0 213
30. Missouri 0 0 0 111
31. Indiana** 0 0 0 95
32. Maryland** 0 0 0 70
33. Alaska** 0 0 0 67
34. Wyoming** 0 0 0 67
35. Colorado 0 0 0 60
36. Oklahoma 0 0 0 53
37. Arizona** 0 0 0 38
38. Iowa** 0 0 0 36
39. Massachusetts 0 0 0 35
40. South Dakota 0 0 0 22
41. New Mexico** 0 0 0 22
42. Connecticut 0 0 0 15
43. Nebraska 0 0 0 12
44. New Jersey 0 0 0 10
45. Delaware 0 0 0 9
46. Kansas 0 0 0 6
47. Nevada** 0 0 0 5
States(In order by number of fatalities)(Bold Italic = States with LEPs,
FY96 and/or FY97)
Total Number LoggingFatalities
Average NumberLogging
Establishments(CY 1996 and CY 1997)FY96 FY97 Total
October 2000OSHA Logging Report, Part 1 of 2
OSHA/IT/OSTAT/ELVance-35-
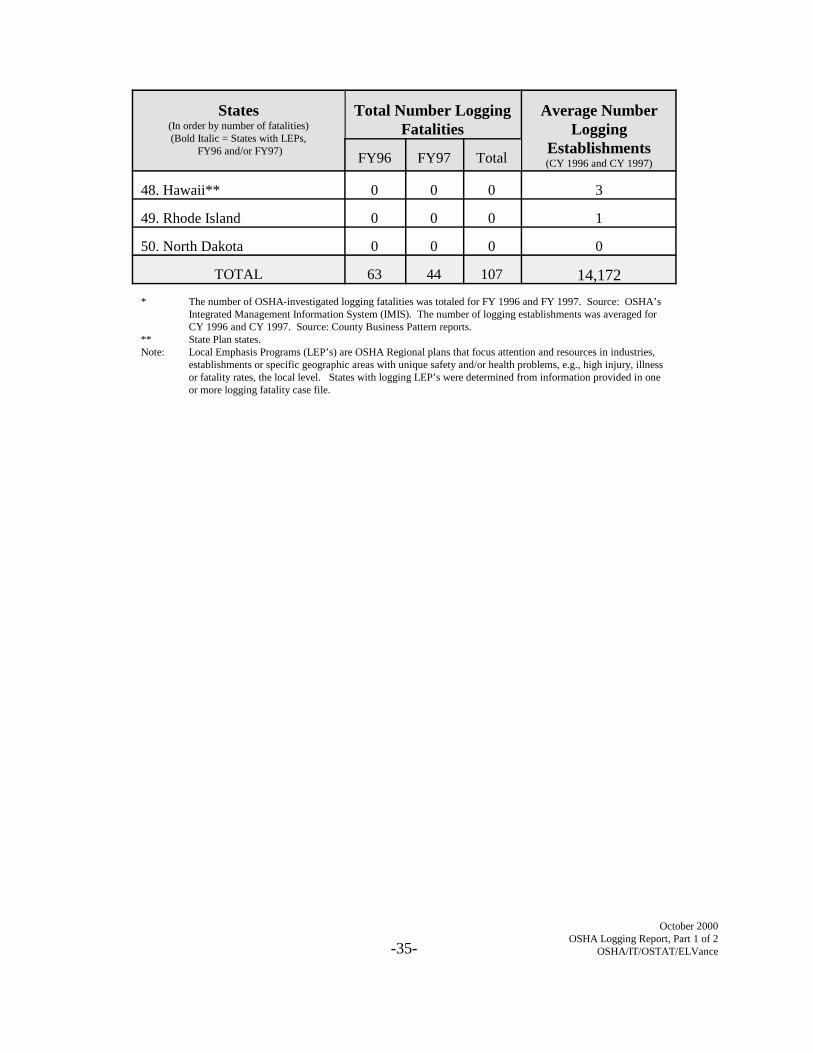
48. Hawaii** 0 0 0 3
49. Rhode Island 0 0 0 1
50. North Dakota 0 0 0 0
TOTAL 63 44 107 14,172
* The number of OSHA-investigated logging fatalities was totaled for FY 1996 and FY 1997. Source: OSHA’sIntegrated Management Information System (IMIS). The number of logging establishments was averaged for CY 1996 and CY 1997. Source: County Business Pattern reports.
** State Plan states.Note: Local Emphasis Programs (LEP’s) are OSHA Regional plans that focus attention and resources in industries,
establishments or specific geographic areas with unique safety and/or health problems, e.g., high injury, illnessor fatality rates, the local level. States with logging LEP’s were determined from information provided in oneor more logging fatality case file.

October 2000OSHA Logging Report, Part 1 of 2
OSHA/IT/OSTAT/ELVance-36-
Table 3
Number of OSHA-Investigated Logging Fatalities by Forest Region(FY 1996 - FY 1997)
ForestRegions
Number LoggingFatalities*
(FY 1996 and FY 1997)States in Forest Regions**
South 52 Alabama, Arkansas, Florida, Georgia, Louisiana, Mississippi,North Carolina, South Carolina, Texas, Virginia
Pacific 30 California, Idaho, Oregon, Washington, Wyoming
East 9 Delaware, Kentucky, Maryland, New Jersey, Pennsylvania,Tennessee, West Virginia
Northeast 8 Connecticut, Maine, Massachusetts, New Hampshire, New York,Rhode Island, Vermont
Mountains 5 Alaska, Arizona, Colorado, Montana, Nevada, New Mexico, Utah
Central 2 Illinois, Indiana, Missouri, Ohio
Lake States 1 Michigan, Minnesota, Wisconsin
Plains 0 Iowa, Kansas, Nebraska, North Dakota, Oklahoma, South Dakota
* The number of OSHA-investigated logging fatalities was totaled for FY 1996 and FY 1997. Source: OSHA’s IntegratedManagement Information System (IMIS).
** Hawaii was not assigned to a Forest Region. Source: U. S. Department of Agriculture.
Table 4
Number of OSHA-Investigated Logging Fatalities by Month and Federal Quarter(FY 1996 and FY 1997) (Data Source: IMIS)
Year
Number of Fatalities
Total(All)
Quarter 1 Quarter 2 Quarter 3 Quarter 4
Oct
ober
Nov
embe
r
Dec
embe
r
Tot
al
Janu
ary
Febr
uary
Mar
ch
Tot
al
Apr
il
May
June T
otal
July
Aug
ust
Sept
embe
r
Tot
al
FY 1996 6 4 6 16 4 4 4 12 7 3 4 14 10 8 3 21 63
FY 1997 9 3 6 18 3 3 0 6 4 1 5 10 3 4 3 10 44
Total 15 7 12 34 7 7 4 18 11 4 9 24 13 12 6 31 107

October 2000OSHA Logging Report, Part 1 of 2
OSHA/IT/OSTAT/ELVance-37-
Table 5
Number of OSHA-Investigated Logging Fatalities by Time of Day*(FY 1996 - FY 1997) (Data Source: IMIS)
Time of DayNumber of Fatalities
FY 1996 FY 1997 Total (%)
7:30 a.m. - 12:00 p.m. 18 6 24 (73%)
12:01 p.m. - 3:00 p.m. 3 1 4 (12%)
3:01 p.m.. - 7:00 p.m. 1 4 5 (15%)
* This table reflects only fatality investigations where the time of the fatal incident was indicated inthe case file. Source: IMIS.
Table 6
Number of OSHA-Investigated Logging Fatalities by Age ofVictim
(FY 1996 and FY 1997) (Data Source: IMIS)
AgeGroups
Number of Victims Percent ofFatalities
by Age Group*FY 1996 FY 1997 Total
18-19 4 1 5 5%
20-29 13 11 24 22%
30-39 18 7 25 23%
40-49 12 13 25 23%
50-59 12 9 21 20%
60+ 4 3 7 7%
* Due to rounding, the total may not equal 100%. Data source: IMIS.

October 2000OSHA Logging Report, Part 1 of 2
OSHA/IT/OSTAT/ELVance-38-
Table 7Average Age of Victims of OSHA-Investigated
Logging Fatalities by Region(FY 1996 and FY 1997) (Data Source: IMIS)
FederalRegion
Number ofVictims
Average Age of Victims
FY 1996 FY 1997 FY 1996 - FY 1997
Region I 4 50 57 52
Region II 4 43 18 37
Region III 21 41 40 41
Region IV 31 43 43 43
Region V 3 27 44 32
Region VI 9 41 32 36
Region VII 0 0 0 0
Region VIII 5 28 39 34
Region IX 5 23 31 28
Region X 25 36 50 40
Total/Average 107 39 41 40

October 2000OSHA Logging Report, Part 1 of 2
OSHA/IT/OSTAT/ELVance-39-
Table 8
Number of Violations and Penalty Amounts Resulting From OSHA-Investigated Logging Fatalities by Federal Region
(FY 1996 - FY 1997) (Data Source: IMIS)
Federal Regionsand States
(State Plan States)*
Investigations(FY 1996 and FY 1997)
No. Violations**(FY 1996 and FY 1997)
TotalPenaltyAmount
($) ***
Average PenaltyAmount
($) ***TotalNo.
No. With S/W/R O-T-S Total
Violat’s Penalty
Region I (Total) 4 2 2 8 0 8 15225.00 7613.00
1. Maine 1 1 1 2 0 2 7625.00 7625.00
2. New Hampshire 1 0 0 0 0 0 0 0
3. Vermont* 2 1 1 6 0 6 7600.00 7600.00
Region II (Total) 4 4 3 19 4 23 16580.00 5526.00
4. New York 4 4 3 19 4 23 16580.00 5526.00
Region III (Total) 21 15 15 60 28 88 98605.00 6574.00
5. Pennsylvania 2 1 1 1 0 1 1575.00 1575.00
6. Virginia* 13 11 11 52 21 73 87430.00 7948.00
7. West Virginia 6 3 3 7 7 14 9600.00 3200.00
Region IV (Total) 31 28 27 80 25 105 91775.00 3399.00
8. Alabama 12 12 12 21 10 31 24875.00 2073.00
9. Florida 2 2 2 5 0 5 9800.00 4900.00
10. Georgia 3 3 2 3 4 7 7500.00 3750.00
11. Mississippi 7 7 7 31 2 33 13100.00 1871.00
12. North Carolina* 4 2 2 18 7 25 35725.00 17863.00
13. South Carolina* 2 1 1 1 2 3 375.00 375.00
14. Tennessee* 1 1 1 1 0 1 400.00 400.00
Region V (Total) 3 3 2 5 7 12 3050.00 1525.00
Federal Regionsand States
(State Plan States)*
Investigations(FY 1996 and FY 1997)
No. Violations**(FY 1996 and FY 1997)
TotalPenaltyAmount
($) ***
Average PenaltyAmount
($) ***TotalNo.
No. With S/W/R O-T-S Total
Violat’s Penalty
October 2000OSHA Logging Report, Part 1 of 2
OSHA/IT/OSTAT/ELVance-40-
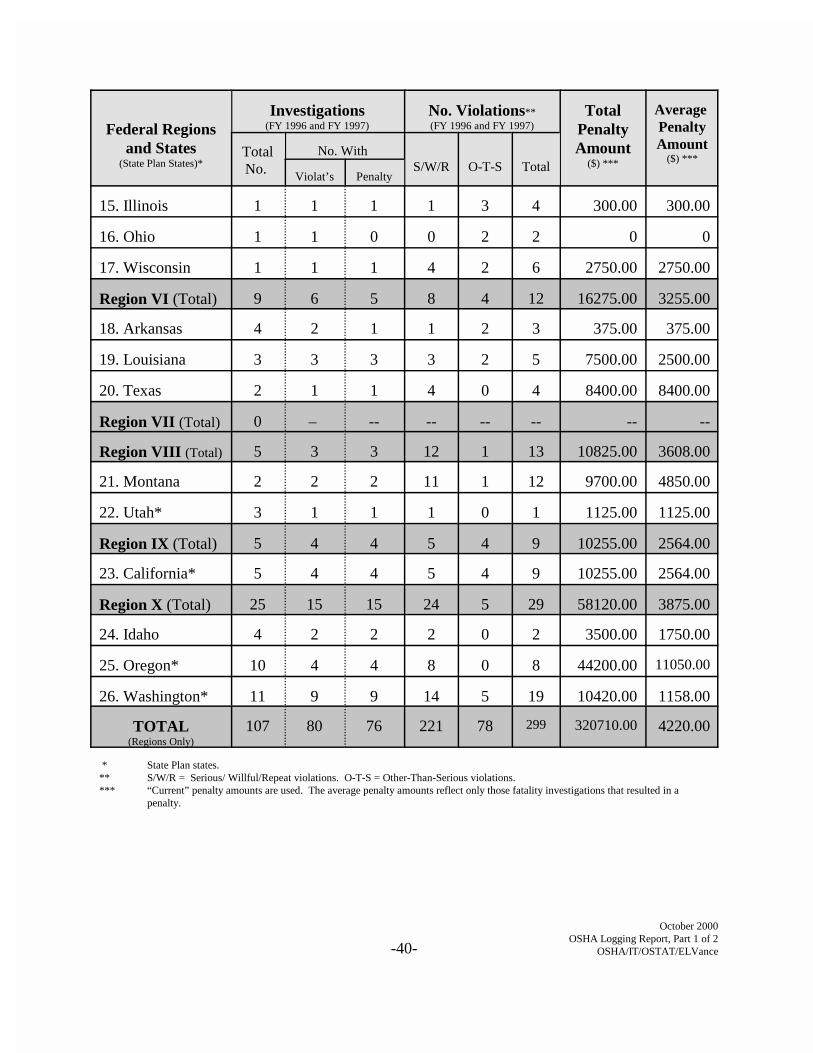
15. Illinois 1 1 1 1 3 4 300.00 300.00
16. Ohio 1 1 0 0 2 2 0 0
17. Wisconsin 1 1 1 4 2 6 2750.00 2750.00
Region VI (Total) 9 6 5 8 4 12 16275.00 3255.00
18. Arkansas 4 2 1 1 2 3 375.00 375.00
19. Louisiana 3 3 3 3 2 5 7500.00 2500.00
20. Texas 2 1 1 4 0 4 8400.00 8400.00
Region VII (Total) 0 – -- -- -- -- -- --
Region VIII (Total) 5 3 3 12 1 13 10825.00 3608.00
21. Montana 2 2 2 11 1 12 9700.00 4850.00
22. Utah* 3 1 1 1 0 1 1125.00 1125.00
Region IX (Total) 5 4 4 5 4 9 10255.00 2564.00
23. California* 5 4 4 5 4 9 10255.00 2564.00
Region X (Total) 25 15 15 24 5 29 58120.00 3875.00
24. Idaho 4 2 2 2 0 2 3500.00 1750.00
25. Oregon* 10 4 4 8 0 8 44200.00 11050.00
26. Washington* 11 9 9 14 5 19 10420.00 1158.00
TOTAL(Regions Only)
107 80 76 221 78 299 320710.00 4220.00
* State Plan states.** S/W/R = Serious/ Willful/Repeat violations. O-T-S = Other-Than-Serious violations.*** “Current” penalty amounts are used. The average penalty amounts reflect only those fatality investigations that resulted in a
penalty.

October 2000OSHA Logging Report, Part 1 of 2
OSHA/IT/OSTAT/ELVance-41-
Table 9Number of OSHA-Investigated Logging Fatalities
by the Scope of the Inspection and Federal Region*(FY 1996 and FY 1997) (Data Source: IMIS)
FederalRegion
Number of Inspections/Investigations by Scope
Average Number Violations by Scope ofInspection/Investigation
(FY 1996 and FY 1997)FY 1996** FY 1997**
C-Insp.
P-Insp.
C-Insp.
P-Insp.
NumberComplete
Investigations
Tot./Avg.Number
Violations
NumberPartial
Investigations
Tot./Avg.Number
Violations
Region I 1 2 1 0 2 6 3 2 2 1
Region II 0 3 1 0 1 7 7 3 16 5
Region III 4 5 5 7 9 37 4 12 51 4
Region IV 7 13 5 6 12 63 5 19 33 2
Region V 1 1 1 0 2 10 5 1 2 2
Region VI 0 4 2 3 2 3 2 7 9 1
Region VII - - - - - - - - - -
Region VIII 1 1 1 2 2 12 6 3 1 0
Region IX 2 0 0 3 2 4 2 3 5 2
Region X 2 16 1 6 3 2 0 22 27 1
Total/Avg. 18 45 17 27 35 144 4 72 146 2
* Partial OSHA inspections or investigations are usually limited to a particular work area or process of an employer’s establishment. Complete OSHA inspections or investigations usually cover all work areas of an employer’s establishment.
** C = Complete Inspections/Investigations; P = Partial Inspections/Investigations.
October 2000OSHA Logging Report, Part 1 of 2
OSHA/IT/OSTAT/ELVance-42-
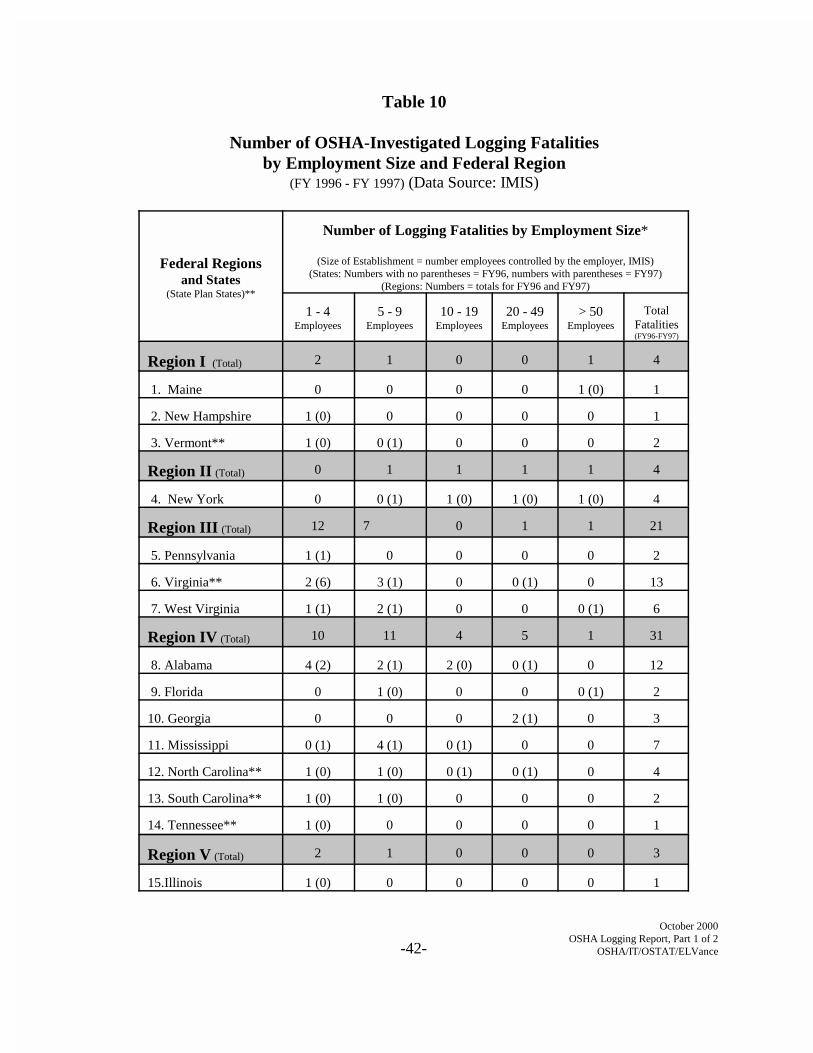
Table 10
Number of OSHA-Investigated Logging Fatalitiesby Employment Size and Federal Region
(FY 1996 - FY 1997) (Data Source: IMIS)
Federal Regionsand States
(State Plan States)**
Number of Logging Fatalities by Employment Size*
(Size of Establishment = number employees controlled by the employer, IMIS)(States: Numbers with no parentheses = FY96, numbers with parentheses = FY97)
(Regions: Numbers = totals for FY96 and FY97)
1 - 4Employees
5 - 9Employees
10 - 19Employees
20 - 49Employees
> 50Employees
TotalFatalities(FY96-FY97)
Region I (Total) 2 1 0 0 1 4
1. Maine 0 0 0 0 1 (0) 1
2. New Hampshire 1 (0) 0 0 0 0 1
3. Vermont** 1 (0) 0 (1) 0 0 0 2
Region II (Total) 0 1 1 1 1 4
4. New York 0 0 (1) 1 (0) 1 (0) 1 (0) 4
Region III (Total) 12 7 0 1 1 21
5. Pennsylvania 1 (1) 0 0 0 0 2
6. Virginia** 2 (6) 3 (1) 0 0 (1) 0 13
7. West Virginia 1 (1) 2 (1) 0 0 0 (1) 6
Region IV (Total) 10 11 4 5 1 31
8. Alabama 4 (2) 2 (1) 2 (0) 0 (1) 0 12
9. Florida 0 1 (0) 0 0 0 (1) 2
10. Georgia 0 0 0 2 (1) 0 3
11. Mississippi 0 (1) 4 (1) 0 (1) 0 0 7
12. North Carolina** 1 (0) 1 (0) 0 (1) 0 (1) 0 4
13. South Carolina** 1 (0) 1 (0) 0 0 0 2
14. Tennessee** 1 (0) 0 0 0 0 1
Region V (Total) 2 1 0 0 0 3
15.Illinois 1 (0) 0 0 0 0 1
Federal Regionsand States
(State Plan States)**
Number of Logging Fatalities by Employment Size*
(Size of Establishment = number employees controlled by the employer, IMIS)(States: Numbers with no parentheses = FY96, numbers with parentheses = FY97)
(Regions: Numbers = totals for FY96 and FY97)
1 - 4Employees
5 - 9Employees
10 - 19Employees
20 - 49Employees
> 50Employees
TotalFatalities(FY96-FY97)
October 2000OSHA Logging Report, Part 1 of 2
OSHA/IT/OSTAT/ELVance-43-
16.Ohio 1 (0) 0 0 0 0 1
17.Wisconsin 0 0 (1) 0 0 0 1
Region VI (Total) 8 0 1 0 0 9
18. Arkansas 2 (2) 0 0 0 0 4
19. Louisiana 0 (2) 0 0 (1) 0 0 3
20. Texas 0 0 1 (0) 1 (0) 0 2
Region VII (Total) -- -- -- -- -- --
Region VIII (Total) 1 2 1 1 0 5
21. Montana 0 (1) 0 1 (0) 0 0 2
22. Utah** 0 0 (2) 0 1 (0) 0 3
Region IX (Total) 1 1 1 1 1 5
23. California** 1 (0) 1 (0) 0 (1) 0 (1) 0 (1) 5
Region X (Total) 12 3 2 2 6 25
24. Idaho 2 (1) 0 1 (0) 0 0 4
25. Oregon** 3 (2) 1 (0) 0 0 4 (0) 10
26. Washington** 3 (1) 2 (0) 1 (0) 0 (2) 1 (1) 11
TOTAL(Regions Only)
48 27 10 11 11 107
* The number of logging fatalities was totaled for FY 1996 and FY 1997. Source: OSHA’s IntegratedManagement Information System (IMIS).
* * State Plan states.
October 2000OSHA Logging Report, Part 1 of 2
OSHA/IT/OSTAT/ELVance-44-
Table 11
Number of Logging Establishments With OSHA-Investigated Fatalities and With No OSHA-Investigated Fatalities by Employment Size
(FY 1996 - FY 1997)(Data Sources: All logging establishments, County Business Pattern Reports; establishments with fatalities, IMIS)
CategoriesFY 1996
Employment Size GroupsTotal
1-4 5-9 10-19 20-49 >49
Number and (Percent) of All LoggingEstablishments by Employment Size
8640(61%)
3247(23%)
1700(12%)
569(4%)
117(< 1%)
14273(100%)
Number and (Percent) of LoggingEstablishments With OSHA-Investigated
Fatalities by Employment Size *
26(42%)
18(29%)
7(11%)
4(8%)
7(11%)
63(100%)
CategoriesFY 1997
Employment Size GroupsTotal1-4 5-9 10-19 20-49 >49
Number and (Percent) of All LoggingEstablishments by Employment Size
8610(61%)
3132(22%)
1685(12%)
542(4%)
101(< 1%)
14070(100%)
Number and (Percent) of LoggingEstablishments With OSHA-Investigated
Fatalities by Employment Size *
20(45%)
9(20%)
4(9%)
7(16%)
4(9%)
44(100%)
CategoriesFY 1996 and FY 1997
Employment Size GroupsNumber
1-4 5-9 10-19 20-49 >49
Average Number of LoggingEstablishments by Employment Size
8625(61%)
3190(23%)
1693(12%)
556(4%)
109(< 1%)
14172(100%)
Total Number of Logging Establish-ments With OSHA-Investigated
Fatalities by Employment Size *
46(43%)
27(25%)
11(10%)
12(11%)
11(10%)
107(100%)
* The size of the establishment represents the number of employees the employer indicated that he or she had control over at thetime of the OSHA investigation.

October 2000OSHA Logging Report, Part 1 of 2
OSHA/IT/OSTAT/ELVance-45-
Table 12
Rate of OSHA-Investigated Logging FatalitiesPer Logging Establishments by State*
(FY 1996 - FY 1997)
States(States in order by rate)
(State Plan States)**
Number ofFatalities
(FY 1996 and FY 1997)
Average Numberof Establishments
(CY 1996 and CY 1997)
Rate of FatalitiesPer Establishments
1. Virginia** 13 560 1 per 43
2. Alabama 12 1083 1 per 90
4. Washington** 11 1036 1 per 94
3. Oregon** 10 1185 1 per 118
5. Mississippi 7 746 1 per 106
6. West Virginia 6 341 1 per 56
7. California** 5 519 1 per 103
8. North Carolina** 4 769 1 per 192
9. Idaho 4 451 1 per 112
10. Arkansas 4 678 1 per 169
11. New York 4 272 1 per 68
12. Louisiana 3 523 1 per 174
13. Utah** 3 28 1 per 9
14. Georgia 3 764 1 per 254
15. Florida 2 353 1 per 176
16. Pennsylvania 2 370 1 per 185
17. Vermont** 2 113 1 per 56
18. Texas 2 445 1 per 222
19. Montana 2 288 1 per 144
20. South Carolina** 2 514 1 per 257
21. Maine 1 497 1 per 497
22. Wisconsin 1 450 1 per 450
States(States in order by rate)
(State Plan States)**
Number ofFatalities
(FY 1996 and FY 1997)
Average Numberof Establishments
(CY 1996 and CY 1997)
Rate of FatalitiesPer Establishments
October 2000OSHA Logging Report, Part 1 of 2
OSHA/IT/OSTAT/ELVance-46-
23. Tennessee** 1 254 1 per 254
24. Ohio 1 160 1 per 160
25. New Hampshire 1 155 1 per 155
26. Illinois 1 44 1 per 44
27. Michigan** 0 418 --
28. Minnesota** 0 218 --
29. Kentucky** 0 213 --
30. Missouri 0 111 --
31. Indiana** 0 95 --
32. Maryland** 0 70 --
33. Alaska** 0 67 --
34. Wyoming** 0 67 --
35. Colorado 0 60 --
36. Oklahoma 0 53 --
37. Arizona** 0 38 --
38. Iowa** 0 36 --
39. Massachusetts 0 35 --
40. South Dakota 0 22 --
41. New Mexico** 0 22 --
42. Connecticut 0 15 --
43. Nebraska 0 12 --
44. New Jersey 0 10 --
45. Delaware 0 9 --
46. Kansas 0 6 --
47. Nevada** 0 5 --
48. Hawaii** 0 3 --
States(States in order by rate)
(State Plan States)**
Number ofFatalities
(FY 1996 and FY 1997)
Average Numberof Establishments
(CY 1996 and CY 1997)
Rate of FatalitiesPer Establishments
October 2000OSHA Logging Report, Part 1 of 2
OSHA/IT/OSTAT/ELVance-47-
49. Rhode Island 0 1 --
50. North Dakota 0 0 --
TOTAL 107 14172 1 per 132
* The number of OSHA-investigated logging fatalities was totaled for FY 1996 and FY 1997. Source: OSHA’sIntegrated Management Information System (IMIS). The number of logging establishments was averaged for CY1994 and CY 1995. Source: County Business Pattern.
** State Plan states.

October 2000OSHA Logging Report, Part 1 of 2
OSHA/IT/OSTAT/ELVanceAppendix A
A Review of Logging Fatalities Investigated by the Occupational Safety and Health Administration
in FY 1996 and FY 1997
Part 1 of 2
APPENDIX
October 2000OSHA Logging Report, Part 1 of 2
OSHA/IT/OSTAT/ELVanceAppendix A, Page 1
Appendix A
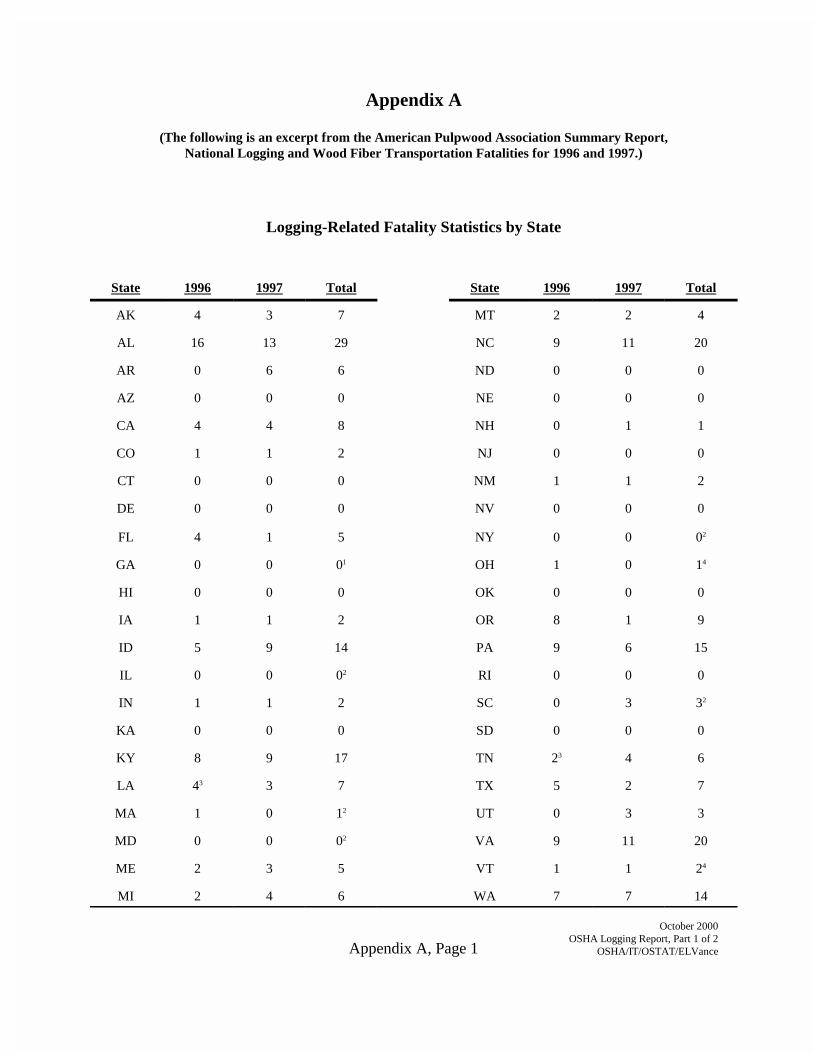
(The following is an excerpt from the American Pulpwood Association Summary Report,National Logging and Wood Fiber Transportation Fatalities for 1996 and 1997.)
Logging-Related Fatality Statistics by State
State 1996 1997 Total State 1996 1997 Total
AK 4 3 7 MT 2 2 4
AL 16 13 29 NC 9 11 20
AR 0 6 6 ND 0 0 0
AZ 0 0 0 NE 0 0 0
CA 4 4 8 NH 0 1 1
CO 1 1 2 NJ 0 0 0
CT 0 0 0 NM 1 1 2
DE 0 0 0 NV 0 0 0
FL 4 1 5 NY 0 0 02
GA 0 0 01 OH 1 0 14
HI 0 0 0 OK 0 0 0
IA 1 1 2 OR 8 1 9
ID 5 9 14 PA 9 6 15
IL 0 0 02 RI 0 0 0
IN 1 1 2 SC 0 3 32
KA 0 0 0 SD 0 0 0
KY 8 9 17 TN 23 4 6
LA 43 3 7 TX 5 2 7
MA 1 0 12 UT 0 3 3
MD 0 0 02 VA 9 11 20
ME 2 3 5 VT 1 1 24
MI 2 4 6 WA 7 7 14

October 2000OSHA Logging Report, Part 1 of 2
OSHA/IT/OSTAT/ELVanceAppendix A, Page 2
MN 0 0 0 WI 2 3 5
MO 5 2 7 WV 3 5 8
MS 9 8 17 WY 0 0 0
Totals 126 129 255
1 Fatality totals for Georgia were unable to be extrapolated from the state Census of fatal Occupational Injuries reports.2 Data are incomplete for a variety of reasons, generally due to the inability of state agencies to release information.3 Data reflect the greatest possible number of fatalities, according to information provided by the appropriate state government agency.4Data do not include loggers who are not employees (i.e. owner-operators) or self-insured loggers.

October 2000OSHA Logging Report, Part 1 of 2
OSHA/IT/OSTAT/ELVance
A Review of Logging Fatalities Investigated by the Occupational Safety and Health Administration in
FY 1996 and FY 1997
Part 1 of 2
ADDENDUM
This Addendum contains additional tables and graphics. The source of data wasOSHA’s Integrated Management Information System (IMIS)
The tables on pages 5, 6, 8, 9, 11, 12, 14 and 15 represent facts about eachfatality investigated by OSHA in FY 1996 and FY 1997. For those states withmore than one investigation a month, the data are represented in separatecolumns. For example, on page 5, to show the ages separately for two victims inOctober for Oregon and Washington, two columns are provided for October. One column is labeled ‘Oct’ and the other ‘Oc2.’
For the table on page 14, the number of employees controlled (10,000employees) at one establishment inspected by Washington in July 1996, is notrepresented because it skews the average number of employees controlled for allestablishments.
Addendum
October 2000OSHA Logging Report, Part 1 of 2
OSHA/IT/OSTAT/ELVance-2-
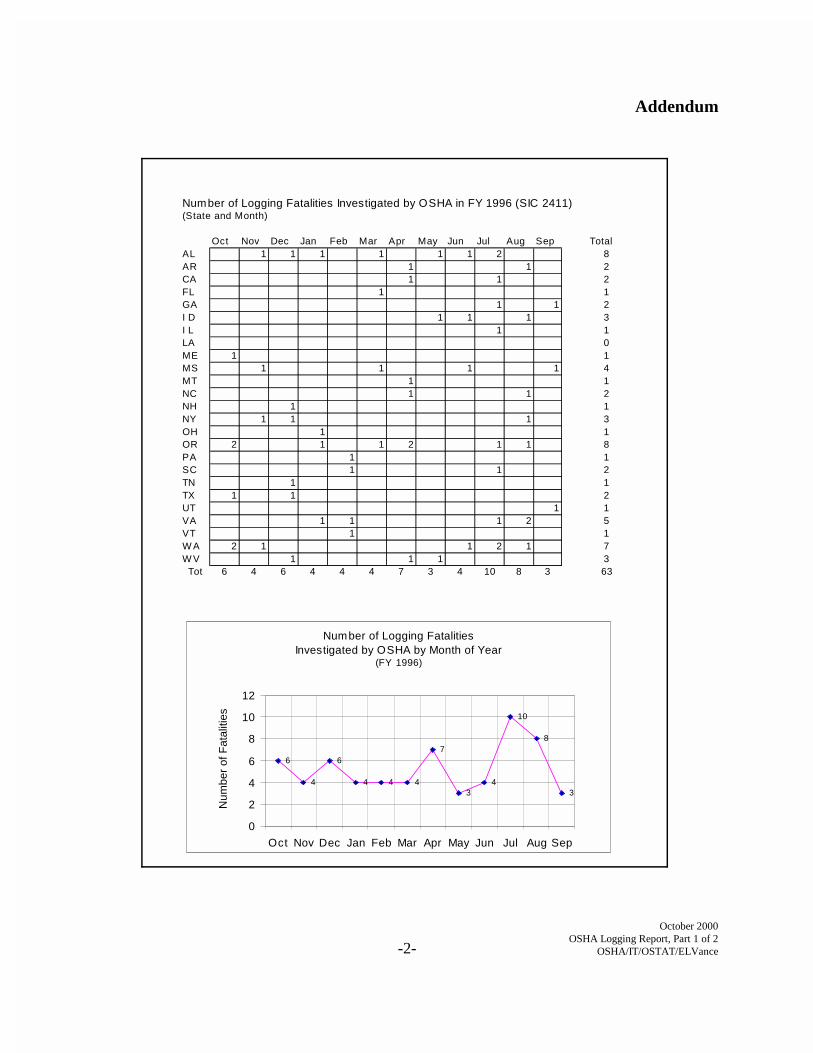
Number of Logging Fatalities Investigated by OSHA in FY 1996 (SIC 2411) (State and Month)
Oct Nov Dec Jan Feb Mar Apr May Jun Jul Aug Sep TotalAL 1 1 1 1 1 1 2 8AR 1 1 2CA 1 1 2FL 1 1GA 1 1 2I D 1 1 1 3I L 1 1LA 0ME 1 1MS 1 1 1 1 4MT 1 1NC 1 1 2NH 1 1NY 1 1 1 3OH 1 1OR 2 1 1 2 1 1 8PA 1 1SC 1 1 2TN 1 1TX 1 1 2UT 1 1VA 1 1 1 2 5VT 1 1W A 2 1 1 2 1 7W V 1 1 1 3
Tot 6 4 6 4 4 4 7 3 4 10 8 3 63
Number of Logging FatalitiesInvestigated by OSHA by Month of Year
(FY 1996)
6
4
6
4 4 4
7
34
10
8
3
0
2
4
6
8
10
12
Oct Nov Dec Jan Feb Mar Apr May Jun Jul Aug Sep
Num
ber
of F
atal
ities
Addendum
October 2000OSHA Logging Report, Part 1 of 2
OSHA/IT/OSTAT/ELVance-3-
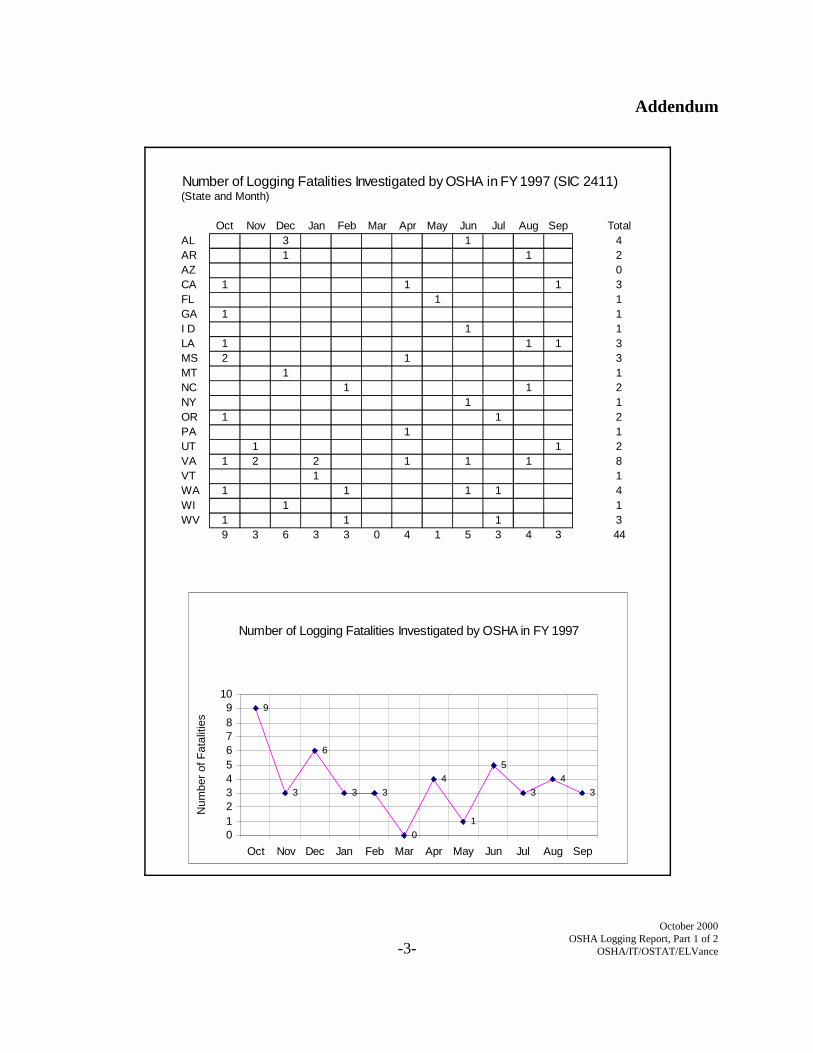
Number of Logging Fatalities Investigated by OSHA in FY 1997 (SIC 2411) (State and Month)
Oct Nov Dec Jan Feb Mar Apr May Jun Jul Aug Sep TotalAL 3 1 4AR 1 1 2AZ 0CA 1 1 1 3FL 1 1GA 1 1I D 1 1LA 1 1 1 3MS 2 1 3MT 1 1NC 1 1 2NY 1 1OR 1 1 2PA 1 1UT 1 1 2VA 1 2 2 1 1 1 8VT 1 1WA 1 1 1 1 4WI 1 1WV 1 1 1 3
9 3 6 3 3 0 4 1 5 3 4 3 44
Number of Logging Fatalities Investigated by OSHA in FY 1997
9
3
6
3 3
0
4
1
5
3
4
3
0123456789
10
Oct Nov Dec Jan Feb Mar Apr May Jun Jul Aug Sep
Num
ber
of F
atal
ities
Addendum
October 2000OSHA Logging Report, Part 1 of 2
OSHA/IT/OSTAT/ELVance-4-
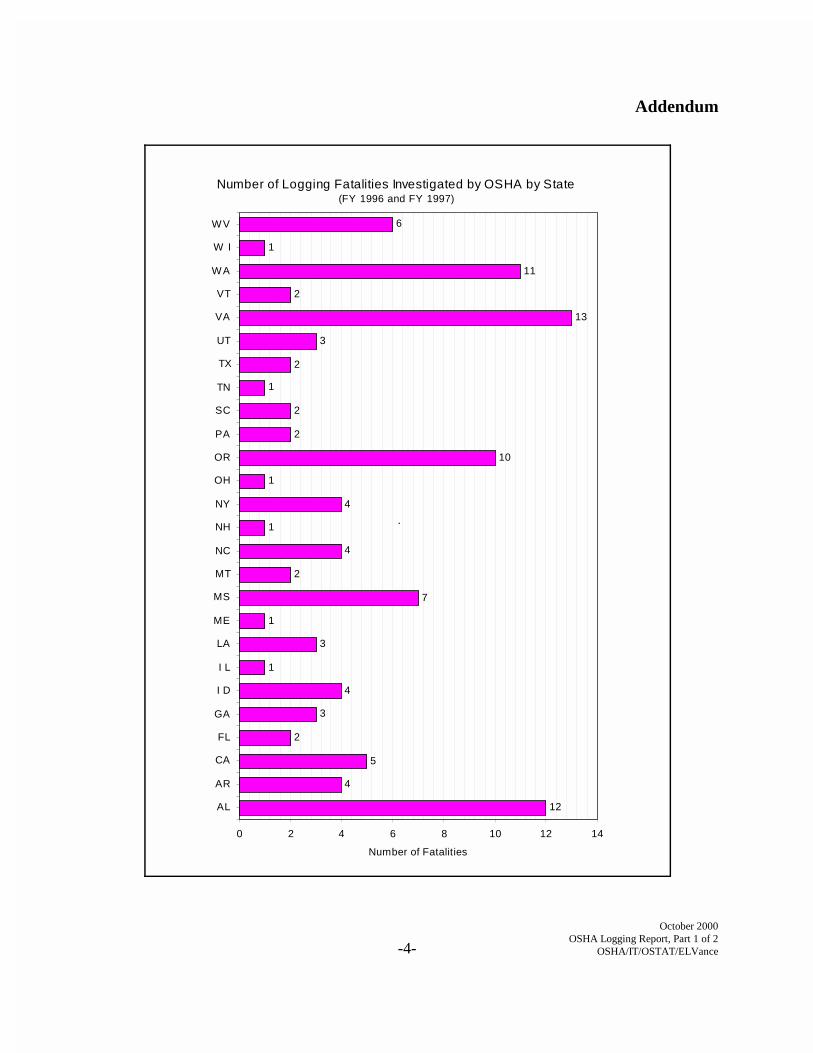
Number of Logging Fatalities Investigated by OSHA by State(FY 1996 and FY 1997)
12
4
5
2
3
4
1
3
1
7
2
4
1
4
1
10
2
2
1
2
3
13
2
11
1
6
0 2 4 6 8 10 12 14
AL
AR
CA
FL
GA
I D
I L
LA
ME
MS
MT
NC
NH
NY
OH
OR
PA
SC
TN
TX
UT
VA
VT
WA
W I
WV
Number of Fatalities
.
Addendum
October 2000OSHA Logging Report, Part 1 of 2
OSHA/IT/OSTAT/ELVance-5-
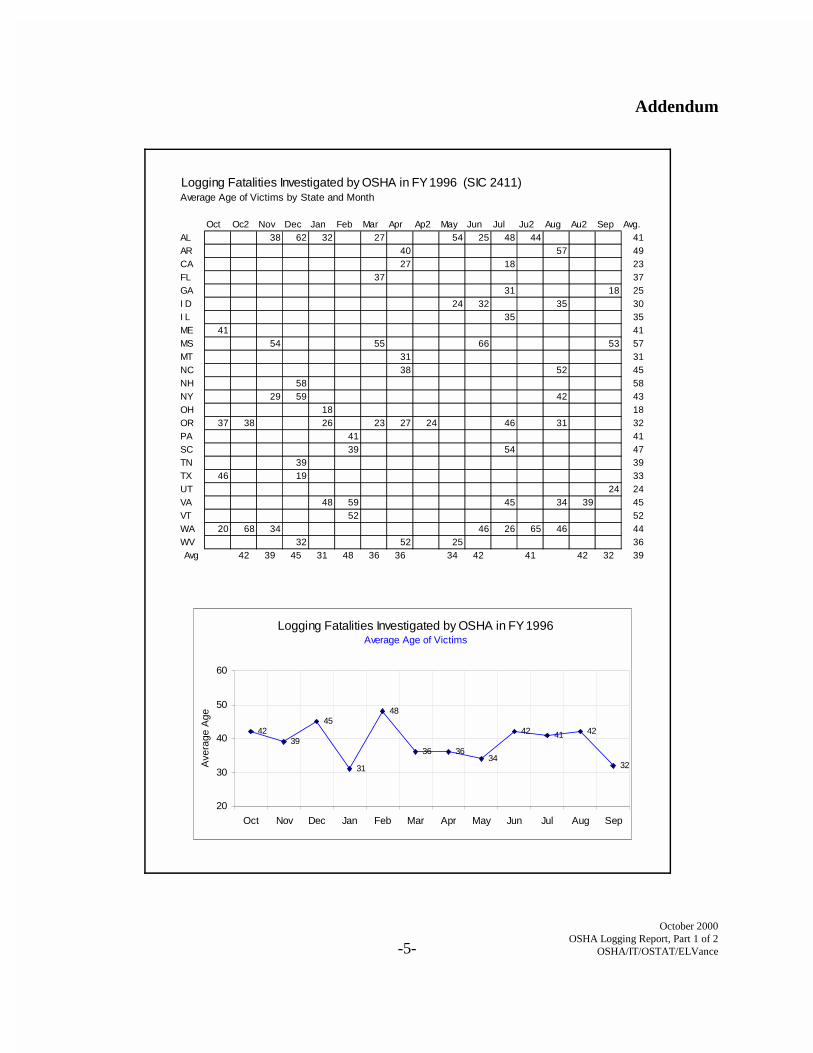
Logging Fatalities Investigated by OSHA in FY 1996 (SIC 2411) Average Age of Victims by State and Month
Oct Oc2 Nov Dec Jan Feb Mar Apr Ap2 May Jun Jul Ju2 Aug Au2 Sep Avg.AL 38 62 32 27 54 25 48 44 41AR 40 57 49CA 27 18 23FL 37 37GA 31 18 25I D 24 32 35 30I L 35 35ME 41 41MS 54 55 66 53 57MT 31 31NC 38 52 45NH 58 58NY 29 59 42 43OH 18 18OR 37 38 26 23 27 24 46 31 32PA 41 41SC 39 54 47TN 39 39TX 46 19 33UT 24 24VA 48 59 45 34 39 45VT 52 52WA 20 68 34 46 26 65 46 44WV 32 52 25 36Avg 42 39 45 31 48 36 36 34 42 41 42 32 39
Logging Fatalities Investigated by OSHA in FY 1996Average Age of Victims
4239
45
31
48
36 3634
42 41 42
32
20
30
40
50
60
Oct Nov Dec Jan Feb Mar Apr May Jun Jul Aug Sep
Ave
rage
Age

Addendum
October 2000OSHA Logging Report, Part 1 of 2
OSHA/IT/OSTAT/ELVance-6-
Logging Fatalities Investigated by OSHA in FY 1997 (SIC 2411)
Average Age of Victims by State and Month
Oct Oc2 Nov No2 Dec De2 De3 Jan Ja2 Feb Mar Apr May Jun Jul Aug Sep AvgAL 52 24 39 55 43AR 22 30 26CA 24 43 27 31FL 25 25GA 60 60I D 43 43LA 22 60 28 37MS 44 44 62 50MT 37 37NC 42 24 33NY 18 18OR 42 45 44PA 29 29UT 31 49 40VA 43 33 36 57 29 28 41 55 40VT 57 57WA 56 49 58 56 55W I 44 44WV 42 56 33 44Avg 42 33 36 48 49 0 41 25 43 45 42 35 41
Logging Fatalities Investigated in FY 1997Average Age of Victims
42
3336
48 49
0
41
25
4345
42
35
0
10
20
30
40
50
60
Oct Nov Dec Jan Feb Mar Apr May Jun Jul Aug Sep
Ave
rage
Age
Addendum
October 2000OSHA Logging Report, Part 1 of 2
OSHA/IT/OSTAT/ELVance-7-
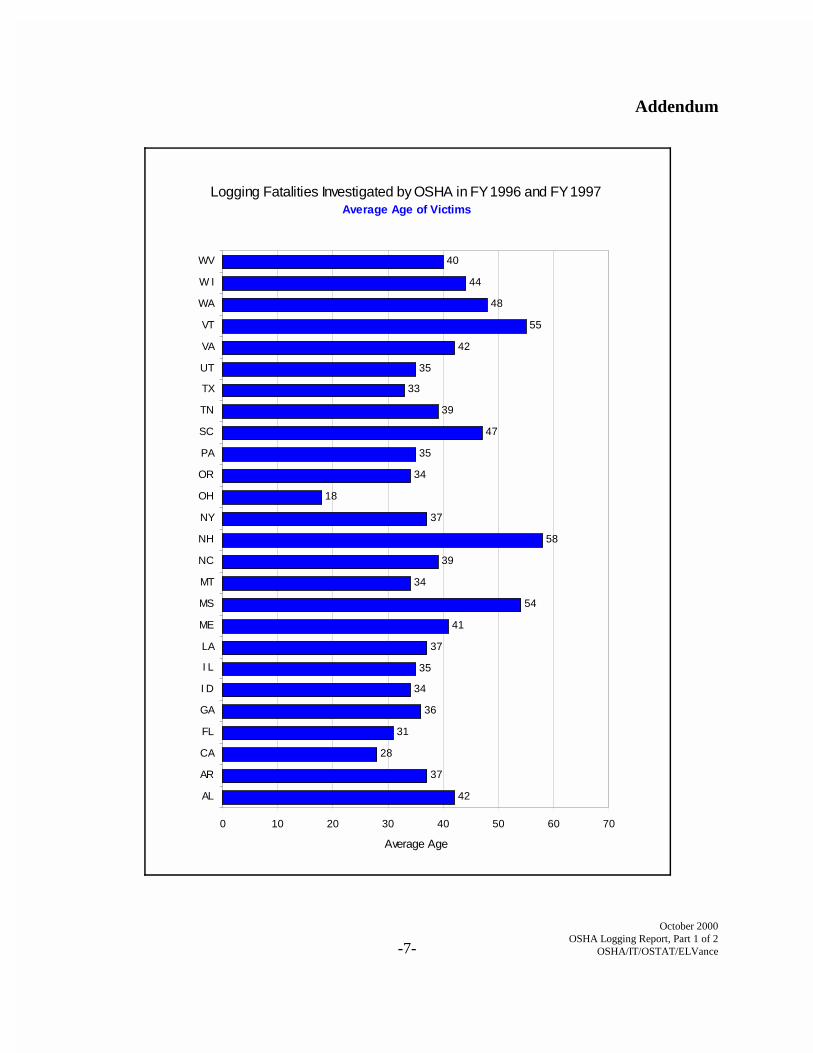
Logging Fatalities Investigated by OSHA in FY 1996 and FY 1997Average Age of Victims
42
37
28
31
36
34
35
37
41
54
34
39
58
37
18
34
35
47
39
33
35
42
55
48
44
40
0 10 20 30 40 50 60 70
AL
AR
CA
FL
GA
I D
I L
LA
ME
MS
MT
NC
NH
NY
OH
OR
PA
SC
TN
TX
UT
VA
VT
WA
W I
WV
Average Age

Addendum
October 2000OSHA Logging Report, Part 1 of 2
OSHA/IT/OSTAT/ELVance-8-
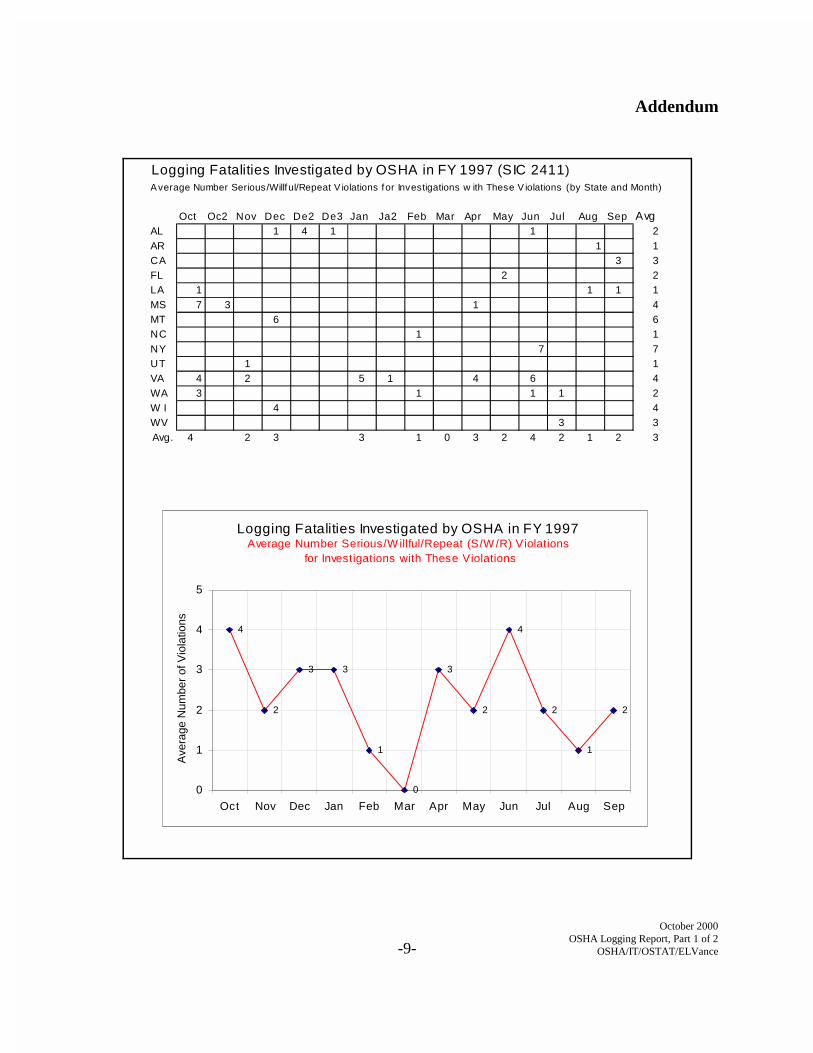
Logging Fatalities Investigated by OSHA in FY 1996 (SIC 2411) Average Number of Serious/Willful/Repeat Violations for Investigations with These Violations (by State and Month)
Oct Oc2 Nov Dec Jan Feb Mar Apr Ap2 May Jun Jul Ju2 Aug Au2 Sep Avg.AL 1 1 3 1 5 1 1 1 2CA 2 2FL 3 3GA 2 1 2I D 1 1 1I L 1 1ME 2 2MS 4 5 3 8 5MT 5 5NC 17 17NY 7 2 3 4OR 1 2 2 2 2PA 1 1SC 1 1TN 1 1TX 4 4VA 3 6 8 11 2 6VT 6 6WA 3 1 1 1 2 2WV 1 3 2Avg. 2 3 2 2 4 3 8 3 2 2 5 5 3
Logging Fatalities Investigated by OSHA in FY 1996Average Number of Serious/Willful/Repeat Violations
for Investigations with These Violations
2
3
2 2
4
3
8
3
2 2
5 5
0
2
4
6
8
10
Oct Nov Dec Jan Feb Mar Apr May Jun Jul Aug Sep
Ave
rage
Num
ber
of V
iola
tions
Addendum
October 2000OSHA Logging Report, Part 1 of 2
OSHA/IT/OSTAT/ELVance-9-
Logging Fatalities Investigated by OSHA in FY 1997 (SIC 2411) Average Number Serious/Willful/Repeat V iolations for Investigations w ith These V iolations (by State and Month)
Oct Oc2 Nov Dec De2 De3 Jan Ja2 Feb Mar Apr May Jun Jul Aug Sep AvgAL 1 4 1 1 2AR 1 1CA 3 3FL 2 2LA 1 1 1 1MS 7 3 1 4MT 6 6NC 1 1NY 7 7UT 1 1VA 4 2 5 1 4 6 4WA 3 1 1 1 2W I 4 4WV 3 3Avg. 4 2 3 3 1 0 3 2 4 2 1 2 3
Logging Fatalities Investigated by OSHA in FY 1997Average Number Serious/W illful/Repeat (S/W /R) Violations
for Investigations with These Violations
4
2
3 3
1
0
3
2
4
2
1
2
0
1
2
3
4
5
Oct Nov Dec Jan Feb Mar Apr May Jun Jul Aug Sep
Ave
rage
Num
ber
of V
iola
tions

Addendum
October 2000OSHA Logging Report, Part 1 of 2
OSHA/IT/OSTAT/ELVance-10-
Logging Fatalities Investigated by OSHA in FY 1996 and FY 1997Average Number of Serious/Willful/Repeat Violations
for Investigations with These Violations
2
1
3
3
2
1
1
2
4
6
9
5
2
1
1
1
5
6
2
4
3
0 1 2 3 4 5 6 7 8 9 10
AL
AR
CA
FL
GA
I D
I L
ME
MS
MT
NC
NY
OR
PA
SC
TN
VA
VT
WA
W I
WV
Average Number of Violations
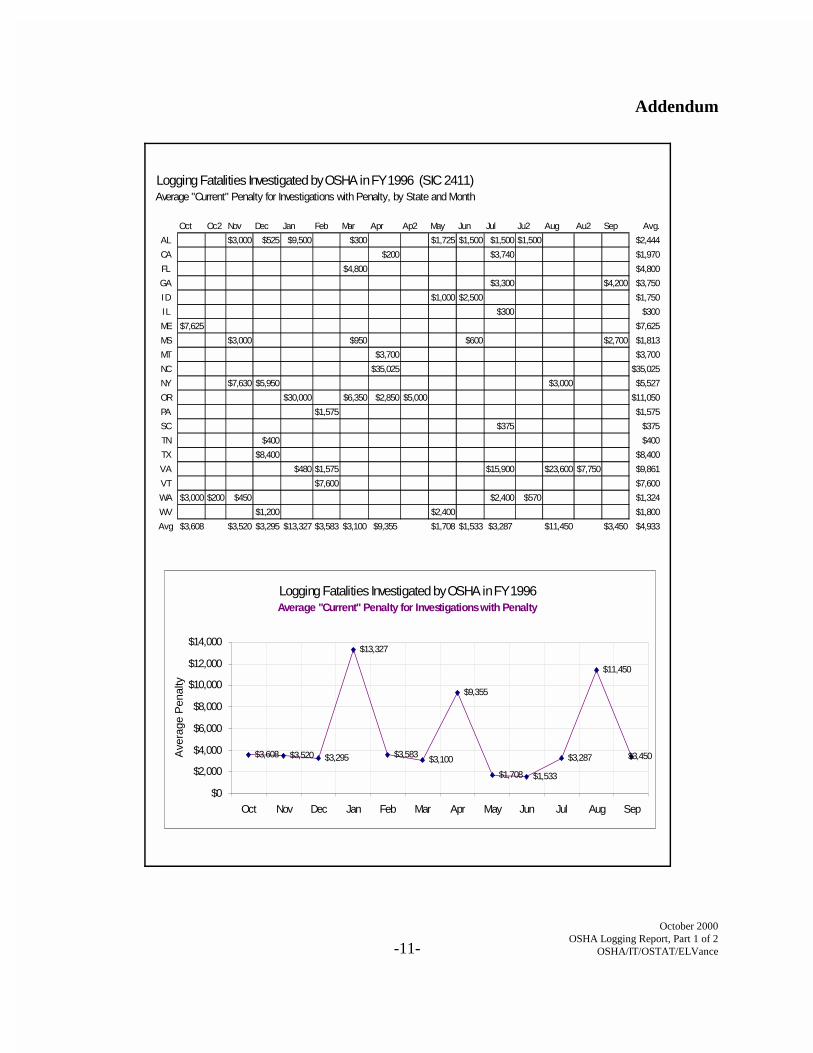
Addendum
October 2000OSHA Logging Report, Part 1 of 2
OSHA/IT/OSTAT/ELVance-11-
Logging Fatalities Investigated by OSHA in FY 1996 (SIC 2411) Average "Current" Penalty for Investigations with Penalty, by State and Month
Oct Oc2 Nov Dec Jan Feb Mar Apr Ap2 May Jun Jul Ju2 Aug Au2 Sep Avg.
AL $3,000 $525 $9,500 $300 $1,725 $1,500 $1,500 $1,500 $2,444
CA $200 $3,740 $1,970
FL $4,800 $4,800
GA $3,300 $4,200 $3,750
I D $1,000 $2,500 $1,750
I L $300 $300
ME $7,625 $7,625
MS $3,000 $950 $600 $2,700 $1,813
MT $3,700 $3,700
NC $35,025 $35,025
NY $7,630 $5,950 $3,000 $5,527
OR $30,000 $6,350 $2,850 $5,000 $11,050
PA $1,575 $1,575
SC $375 $375
TN $400 $400
TX $8,400 $8,400
VA $480 $1,575 $15,900 $23,600 $7,750 $9,861
VT $7,600 $7,600
WA $3,000 $200 $450 $2,400 $570 $1,324
WV $1,200 $2,400 $1,800
Avg $3,608 $3,520 $3,295 $13,327 $3,583 $3,100 $9,355 $1,708 $1,533 $3,287 $11,450 $3,450 $4,933
Logging Fatalities Investigated by OSHA in FY 1996Average "Current" Penalty for Investigations with Penalty
$3,608 $3,520 $3,295
$13,327
$3,583 $3,100
$9,355
$1,708 $1,533
$3,287
$11,450
$3,450
$0
$2,000
$4,000
$6,000
$8,000
$10,000
$12,000
$14,000
Oct Nov Dec Jan Feb Mar Apr May Jun Jul Aug Sep
Ave
rage
Pen
alty
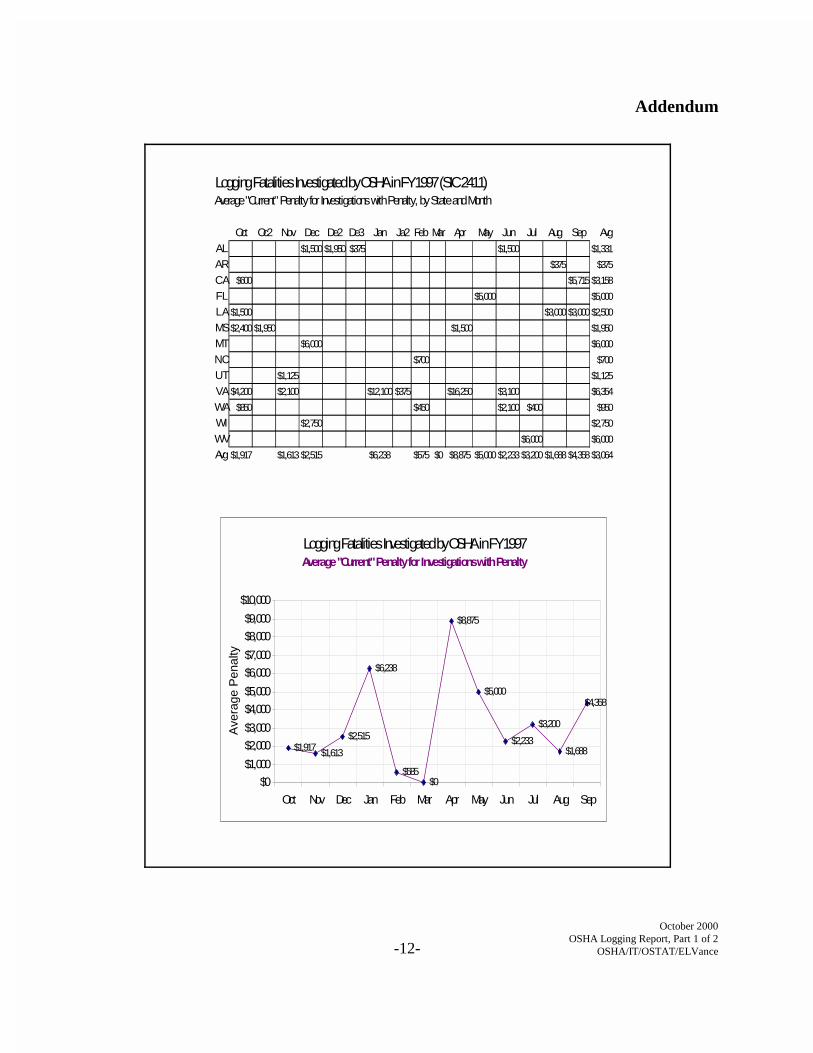
Addendum
October 2000OSHA Logging Report, Part 1 of 2
OSHA/IT/OSTAT/ELVance-12-
Logging Fatalities Investigated by OSHA in FY 1997 (SIC 2411) Average "Current" Penalty for Investigations with Penalty, by State and Month
Oct Oc2 Nov Dec De2 De3 Jan Ja2 Feb Mar Apr May Jun Jul Aug Sep AvgA L $1,500$1,950 $375 $1,500 $1,331
A R $375 $375
C A $600 $5,715$3,158
F L $5,000 $5,000
L A$1,500 $3,000$3,000$2,500
M S$2,400$1,950 $1,500 $1,950
M T $6,000 $6,000
N C $700 $700
U T $1,125 $1,125
V A$4,200 $2,100 $12,100 $375 $16,250 $3,100 $6,354
W A $850 $450 $2,100 $400 $950
W I $2,750 $2,750
W V $6,000 $6,000
Avg $1,917 $1,613$2,515 $6,238 $575 $0 $8,875 $5,000$2,233$3,200$1,688$4,358$3,064
Logging Fatalities Investigated by OSHA in FY 1997Average "Current" Penalty for Investigations with Penalty
$1,917 $1,613
$2,515
$6,238
$585$0
$8,875
$5,000
$2,233
$3,200
$1,688
$4,358
$0
$1,000
$2,000
$3,000
$4,000
$5,000
$6,000
$7,000
$8,000
$9,000
$10,000
Oct Nov Dec Jan Feb Mar Apr May Jun Jul Aug Sep
Ave
rage
Pen
alty
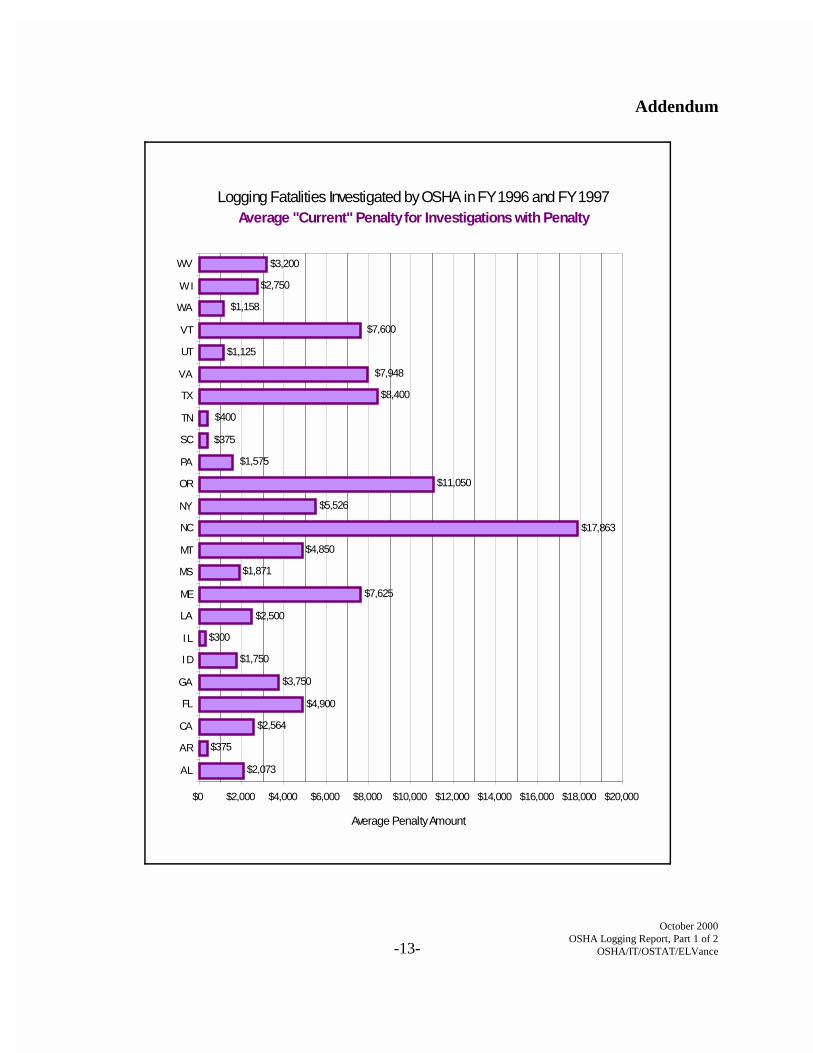
Addendum
October 2000OSHA Logging Report, Part 1 of 2
OSHA/IT/OSTAT/ELVance-13-
Logging Fatalities Investigated by OSHA in FY 1996 and FY 1997Average "Current" Penalty for Investigations with Penalty
$2,073
$375
$2,564
$4,900
$3,750
$1,750
$300
$2,500
$7,625
$1,871
$4,850
$17,863
$5,526
$11,050
$1,575
$375
$400
$8,400
$7,948
$1,125
$7,600
$1,158
$2,750
$3,200
$0 $2,000 $4,000 $6,000 $8,000 $10,000 $12,000 $14,000 $16,000 $18,000 $20,000
AL
AR
CA
FL
GA
I D
I L
LA
ME
MS
MT
NC
NY
OR
PA
SC
TN
TX
VA
UT
VT
WA
W I
WV
Average Penalty Amount

Addendum
October 2000OSHA Logging Report, Part 1 of 2
OSHA/IT/OSTAT/ELVance-14-
Logging Fatalities Investigated by OSHA in FY 1996 (SIC 2411) Average Number of Employees Controlled by the Employer by State and Month
Oct Oc2 Nov Dec Jan Feb Mar Apr Ap2 May Jun Jul Ju2 Aug Au2 Sep Avg.AL 10 4 4 4 17 8 2 6 7AR 1 1 1CA 5 2 4FL 7 7GA 25 31 28I D 3 3 19 8I L 4 4ME 61 61MS 5 7 7 5 6MT 12 12NC 4 5 5NH 1 1NY 75 38 10 41OH 1 1OR 120 2 89 6 4 2 60 76 45PA 4 4SC 6 3 5TN 4 4TX 30 12 21UT 28 28VA 8 4 7 6 4 6VT 1 1WA 19 3 4 6 8 3 7WV 7 3 6 5Avg. 39 24 11 26 4 6 4 9 6 13 16 21 15
Logging Fatalities Investigated by OSHA in FY 1996Average Number of Employees Controlled by the Employer
39
24
11
26
46
4
96
1316
21
0
5
10
15
20
25
30
35
40
45
Oct Nov Dec Jan Feb Mar Apr May Jun Jul Aug Sep
Ave
rage
Num
ber
Con
trol
led

Addendum
October 2000OSHA Logging Report, Part 1 of 2
OSHA/IT/OSTAT/ELVance-15-
Logging Fatalities Investigated by OSHA in FY 1997 (SIC 2411) Average Number of Employees Controlled by the Employer by State and Month
Oct Oc2 Nov No2 Dec De2 De3 Jan Ja2 Feb Mar Apr May Jun Jul Aug Sep AvgAL 20 4 4 5 8AR 2 4 3CA 600 13 35 216FL 75 75GA 25 25I D 4 4LA 4 4 13 7NY 5 5MS 4 5 14 8MT 2 2NC 24 12 18OR 1 1 1PA 2 2UT 8 8 8VA 4 2 3 5 20 4 2 3 5VT 5 5WA 1 43 200 20 66W I 9 9WV 7 2 56 22Avg 72 4 7 10 23 0 8 75 43 26 6 19 29
Logging Fatalities Investigated by OSHA in FY 1997Average Number Employees Controlled by the Employer
72
47
10
23
0
8
75
43
26
6
19
0
10
20
30
40
50
60
70
80
Oct Nov Dec Jan Feb Mar Apr May Jun Jul Aug Sep
Num
ber
Em
ploy
ees
Con
trol
led

Addendum
October 2000OSHA Logging Report, Part 1 of 2
OSHA/IT/OSTAT/ELVance-16-
Logging Fatalities Investigated by OSHA in FY 1996 & FY 1997Average Number of Employees Controlled by the Employer
7
2
131
41
27
7
4
7
61
7
7
11
1
32
1
40
3
5
4
21
15
6
3
31
9
14
0 20 40 60 80 100 120 140
AL
AR
CA
FL
GA
I D
I L
LA
ME
MS
MT
NC
NH
NY
OH
OR
PA
SC
TN
TX
UT
VA
VT
WA
W I
WV
Average Number of Employees Controlled
October 2000OSHA Logging Report, Part 1 of 2
OSHA/IT/OSTAT/ELVance
REPORT EVALUATION FORM

October 2000OSHA Logging Report, Part 1 of 2
OSHA/IT/OSTAT/ELVance-1-
A Review of Logging Fatalities Investigated by the Occupational Safety and Health Administration in FY 1996 and FY 1997
Part 1 of 2
This logging report (Part 1 of 2) is a continuation of fatality reports produced by theOccupational Safety and Health Administration (OSHA) from 1976 - 1995. The format has beenmodified to make the material more user-friendly, and to direct the focus of the material moretoward compliance activities. This report represents one of a number of reports that are beingproposed using information in OSHA’s Integrated Management Information System (IMIS). Theoverall goal is to develop more reports that are useful to you and to make them available in amore timely fashion.
The fatality reports are intended to be reference documents. For each Standard IndustrialClassification (SIC), the initial base report, with some exceptions, will cover multiple years ofcompliance information, and will be considered for updates every 3-10 years. As we formalizethis modified report format and process, we would appreciate your comments, because your inputis important to us. Please take a few minutes to respond to the following questions. (Foradditional space, use the last page.)
1. Is the report format user-friendly?
a. Yes: ___ No: ___ (Please check one answer.)
b. If your answer is no, please describe below how we can improve the user-friendlyformat.
_______________________________________________________________
_______________________________________________________________
2. Logging (SIC 2411) was chosen for this report because it represents one of the Agency’s5-year Strategic Plan targets, and because, rate of fatal incidents in this industrycontinues to be higher than most industry sectors or SIC’s. While the number offatalities occurring nationwide will continue to be one yard stick for determining whichSIC’s to report on, we would like to know other criteria you believe should be appliedand your suggestions of other SIC’s that should be reported on.
� � Report Evaluation Form

October 2000OSHA Logging Report, Part 1 of 2
OSHA/IT/OSTAT/ELVance-2-
a. Describe below your suggested criteria for determining which SIC’s to report on?
_______________________________________________________________
_______________________________________________________________
b. Applying your suggested criteria, identify below SIC’s that you recommend be reportedon, in order of priority?
_______________________________________________________________
3. In developing this logging report (Part 1 of 2), the broadest range of issues wasaddressed, e.g., month and year of the fatality, geographical location of the fatality, ageof the victim, etc. Did we miss any significant issues? Did we address issues of limitedvalue? Let us know below.
a. Does the report adequately address the significant issues?
Yes: ___ No: ___ (Please check one answer.)
b. If the answer is no, please describe below the significant issues you believe should beaddressed in future reports, and state why?
_______________________________________________________________
_______________________________________________________________
c. Please describe below issues addressed in this report that you believe have limited value,and state why?
_______________________________________________________________
_______________________________________________________________
d. Please describe below issues whose value could be significantly improved on ifrepresented differently, e.g., current penalty amounts represented as an average ratherthan a total, the weekday of the fatality rather than the time of day, etc., and state why?
_______________________________________________________________
_______________________________________________________________
4. Overall, how would you score the reports usefulness as a reference document?
a. Excellent: ____ b. Very Good: ____ c. Good: ____d. Fair: ____ e. Poor: ____

October 2000OSHA Logging Report, Part 1 of 2
OSHA/IT/OSTAT/ELVance-3-
5. Additional Comments.
(Please provide a reference for each comment provided below that relates to information in this report or to aquestion or request for information of this evaluation form.)
______________________________________________________________________
______________________________________________________________________
______________________________________________________________________
______________________________________________________________________
______________________________________________________________________
______________________________________________________________________
______________________________________________________________________
______________________________________________________________________
______________________________________________________________________
______________________________________________________________________
______________________________________________________________________
______________________________________________________________________
______________________________________________________________________
______________________________________________________________________
______________________________________________________________________
______________________________________________________________________
______________________________________________________________________
______________________________________________________________________
______________________________________________________________________
______________________________________________________________________
______________________________________________________________________
______________________________________________________________________
Related Documents