atmosphere Review A Review of Field Measurement Studies on Thermal Comfort, Indoor Air Quality and Virus Risk Christina Kakoulli 1 , Alexis Kyriacou 2 and Michalis P. Michaelides 1, * Citation: Kakoulli, C.; Kyriacou, A.; Michaelides, M.P. A Review of Field Measurement Studies on Thermal Comfort, Indoor Air Quality and Virus Risk. Atmosphere 2022, 13, 191. https://doi.org/10.3390/atmos 13020191 Academic Editors: Giorgio Ficco and Boris Igor Palella Received: 23 December 2021 Accepted: 18 January 2022 Published: 25 January 2022 Publisher’s Note: MDPI stays neutral with regard to jurisdictional claims in published maps and institutional affil- iations. Copyright: © 2022 by the authors. Licensee MDPI, Basel, Switzerland. This article is an open access article distributed under the terms and conditions of the Creative Commons Attribution (CC BY) license (https:// creativecommons.org/licenses/by/ 4.0/). 1 Department of Electrical Engineering, Computer Engineering and Informatics, Cyprus University of Technology, 3036 Limassol, Cyprus; [email protected] 2 Lelantus Innovations Ltd., 2107 Nicosia, Cyprus; [email protected] * Correspondence: [email protected] Abstract: People spend up to 90% of their time indoors where they continuously interact with the indoor environment. Indoor Environmental Quality (IEQ), and in particular thermal comfort, Indoor Air Quality (IAQ), and acoustic and visual comfort, have proven to be significant factors that influence the occupants’ health, comfort, productivity and general well-being. The ongoing COVID-19 pandemic has also highlighted the need for real-life experimental data acquired through field measurement studies to help us understand and potentially control the impact of IEQ on the occupants’ health. In this context, there was a significant increase over the past two decades of field measurement studies conducted all over the world that analyse the IEQ in various indoor environments. In this study, an overview of the most important factors that influence the IAQ, thermal comfort, and the risk of virus transmission is first presented, followed by a comprehensive review of selected field measurement studies from the last 20 years. The main objective is to provide a broad overview of the current status of field measurement studies, to identify key characteristics, common outcomes, correlations, insights, as well as gaps, and to serve as the starting point for conducting future field measurement studies. Keywords: indoor environmental quality; thermal comfort; indoor air quality; virus airborne trans- mission risk; field measurement studies; 1. Introduction According to recent studies, people nowadays spend most of their lifetime indoors [1]. Undoubtedly, the Indoor Air Quality (IAQ) is one of the key factors that influence the quality of the indoor environment, as well as the human health [2]. Various health problems have long been known to arise from poor IAQ, with the most severe ones to include lung cancer, carbon monoxide poisoning, pneumonia, asthma, and various allergies [3]. In fact, household air pollution was the main cause for 3.8 million deaths according to the World Health Organization (WHO), which corresponds to 7.7% of the worldwide mortality in 2016 [4]. Note that household fuel combustion is a key contributor for indoor air pollution, especially in developing countries, where the cooking and heating primarily rely on solid fuels including wood, charcoal, and crop waste [5]. The recent lock-downs due to the current COVID-19 pandemic forced most people to work remotely from their homes and has highlighted more than ever before the importance of Indoor Environmental Quality (IEQ) monitoring. All environmental aspects have a massive impact on the quality of people’s lives [6]. Inadequate ventilation and poor IAQ are the key contributors to the Sick Building Syn- drome (SBS) [7] which considerably influences the human health and workers productivity. In the United Kingdom and the United States, it is estimated that the State loses roughly 15 billion pounds and 38 billion dollars, respectively, due to reduced productivity of work- ers and illnesses caused by inadequate supply of fresh air alone [8]. In fact, a workplace with high IEQ obviously improves the workers’ health and mood, thereby increasing their Atmosphere 2022, 13, 191. https://doi.org/10.3390/atmos13020191 https://www.mdpi.com/journal/atmosphere

Welcome message from author
This document is posted to help you gain knowledge. Please leave a comment to let me know what you think about it! Share it to your friends and learn new things together.
Transcript
atmosphere
Review
A Review of Field Measurement Studies on Thermal Comfort,Indoor Air Quality and Virus RiskChristina Kakoulli 1, Alexis Kyriacou 2 and Michalis P. Michaelides 1,*
�����������������
Citation: Kakoulli, C.; Kyriacou, A.;
Michaelides, M.P. A Review of Field
Measurement Studies on Thermal
Comfort, Indoor Air Quality and
Virus Risk. Atmosphere 2022, 13, 191.
https://doi.org/10.3390/atmos
13020191
Academic Editors: Giorgio Ficco and
Boris Igor Palella
Received: 23 December 2021
Accepted: 18 January 2022
Published: 25 January 2022
Publisher’s Note: MDPI stays neutral
with regard to jurisdictional claims in
published maps and institutional affil-
iations.
Copyright: © 2022 by the authors.
Licensee MDPI, Basel, Switzerland.
This article is an open access article
distributed under the terms and
conditions of the Creative Commons
Attribution (CC BY) license (https://
creativecommons.org/licenses/by/
4.0/).
1 Department of Electrical Engineering, Computer Engineering and Informatics,Cyprus University of Technology, 3036 Limassol, Cyprus; [email protected]
2 Lelantus Innovations Ltd., 2107 Nicosia, Cyprus; [email protected]* Correspondence: [email protected]
Abstract: People spend up to 90% of their time indoors where they continuously interact withthe indoor environment. Indoor Environmental Quality (IEQ), and in particular thermal comfort,Indoor Air Quality (IAQ), and acoustic and visual comfort, have proven to be significant factorsthat influence the occupants’ health, comfort, productivity and general well-being. The ongoingCOVID-19 pandemic has also highlighted the need for real-life experimental data acquired throughfield measurement studies to help us understand and potentially control the impact of IEQ on theoccupants’ health. In this context, there was a significant increase over the past two decades offield measurement studies conducted all over the world that analyse the IEQ in various indoorenvironments. In this study, an overview of the most important factors that influence the IAQ,thermal comfort, and the risk of virus transmission is first presented, followed by a comprehensivereview of selected field measurement studies from the last 20 years. The main objective is to providea broad overview of the current status of field measurement studies, to identify key characteristics,common outcomes, correlations, insights, as well as gaps, and to serve as the starting point forconducting future field measurement studies.
Keywords: indoor environmental quality; thermal comfort; indoor air quality; virus airborne trans-mission risk; field measurement studies;
1. Introduction
According to recent studies, people nowadays spend most of their lifetime indoors [1].Undoubtedly, the Indoor Air Quality (IAQ) is one of the key factors that influence thequality of the indoor environment, as well as the human health [2]. Various health problemshave long been known to arise from poor IAQ, with the most severe ones to include lungcancer, carbon monoxide poisoning, pneumonia, asthma, and various allergies [3]. In fact,household air pollution was the main cause for 3.8 million deaths according to the WorldHealth Organization (WHO), which corresponds to 7.7% of the worldwide mortality in2016 [4]. Note that household fuel combustion is a key contributor for indoor air pollution,especially in developing countries, where the cooking and heating primarily rely on solidfuels including wood, charcoal, and crop waste [5]. The recent lock-downs due to thecurrent COVID-19 pandemic forced most people to work remotely from their homes andhas highlighted more than ever before the importance of Indoor Environmental Quality(IEQ) monitoring.
All environmental aspects have a massive impact on the quality of people’s lives [6].Inadequate ventilation and poor IAQ are the key contributors to the Sick Building Syn-drome (SBS) [7] which considerably influences the human health and workers productivity.In the United Kingdom and the United States, it is estimated that the State loses roughly15 billion pounds and 38 billion dollars, respectively, due to reduced productivity of work-ers and illnesses caused by inadequate supply of fresh air alone [8]. In fact, a workplacewith high IEQ obviously improves the workers’ health and mood, thereby increasing their
Atmosphere 2022, 13, 191. https://doi.org/10.3390/atmos13020191 https://www.mdpi.com/journal/atmosphere

Atmosphere 2022, 13, 191 2 of 43
productivity and plays a crucial role on the profitability of businesses. Generally, investingon improving IEQ in workplaces is characterized by a short pay back period and generatesadditional monetary returns thereafter [9]. Studies on the quality of IEQ among studentshave shown that inadequately set parameters can have a drastic impact on students’ cogni-tive abilities [10]. It should be noted that buildings being rated as “sustainable and green”do not truly guarantee their compliance with the desired IEQ level [11–14]. Hence, the strin-gent need to build NZEB (Nearly Zero Energy Buildings) [15–17], whose design requires aholistic approach based upon the principles of sustainability, should also focus on ensuringIEQ while designing new buildings, as well as when retrofitting old ones. The need toinclude IEQ in the building design has also been identified over the last two decades byvarious green building certification systems, such as the Building Research EstablishmentEnvironmental Assessment Method (BREEAM) from the UK, Green Star from Australia,and Leadership in Energy and Environmental Design (LEED) from the US [18–20].
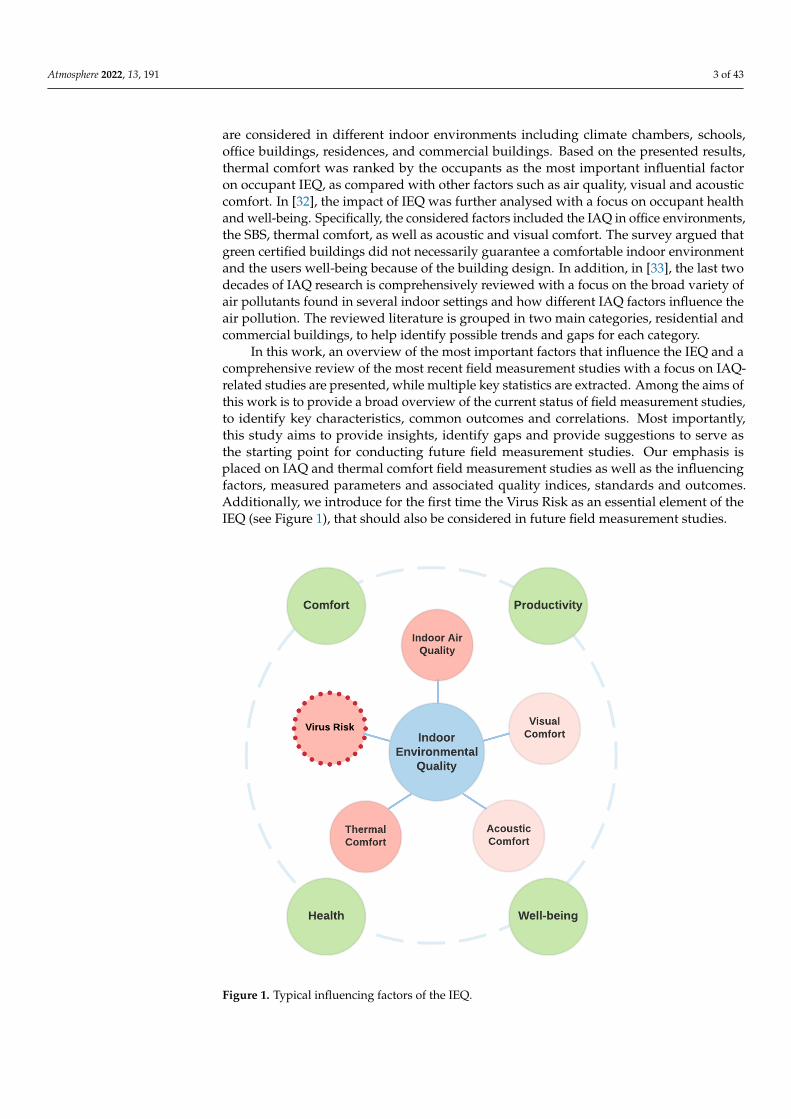
The quality of an indoor space in relation to the health, comfort, well-being, and pro-ductivity of occupants forms the IEQ. The concept of IEQ is very broad and depends onmany variables such as temperature, relative humidity, air velocity, air flow, occupancy,concentration of pollutants, noise and lighting. These are commonly grouped into fourmajor areas [21] that define the quality of the environment inside a space, namely: (i) IndoorAir Quality (IAQ) [22], (ii) Thermal Comfort [23], (iii) Acoustic Comfort [24–26], and (iv) Vi-sual Comfort [27,28], as depicted in Figure 1. As shown in the Figure, we additionallypropose that (v) Virus Risk, also becomes an essential IEQ pillar. The subject of airborneviruses has been extensively investigated by various research communities in the lasttwo decades. Experimental studies on the presence of virus in air samples are carried outmainly under controlled laboratory conditions. The impact of environmental parameters(e.g., temperature, humidity) on airborne viruses has been also explored, but it still notclear due to the complexities involved. Regarding the estimation of the probability ofvirus transmission indoors, a number of risk assessment models have been proposed forthis purpose. However, only a limited number of IEQ field measurement studies so farhave considered the use of real environmental measurements for computing the airbornevirus risk.
IEQ evaluation depends on numerous factors that can be subdivided into four cat-egories: external conditions (temperature, air pollution, noise, sun and natural lighting,green environment), building (enclosure, construction material, furniture), building ser-vices (HVAC systems, lighting) and human activities (HVAC use, cleaning, use of paints,varnishes, and glues) [29]. The assessment of IEQ is mainly performed by two approaches,Post-Occupancy Evaluations (POE) and field measurements [9]. In the case of POE, a sub-jective assessment of the IEQ is performed based on data collected using occupants’ ques-tionnaires. In the latter case, an objective assessment of IEQ is performed using datacollected by instruments (i.e., sensing devices, portable loggers or passive samplers). Dataacquired by both field measurements and occupants’ questionnaires can contribute towardsa more accurate and comprehensive analysis of the indoor environment as perceived bythe occupants. To achieve a complete and reliable characterization of thermal comfortand IAQ levels in the built environments and related energy needs, several challengingissues must be addressed with regard to properly designing measurement campaigns (notonly from technical and operational perspectives, but also by managing psychological andphysiological issues) and effectively elaborating huge amounts of field data.
A number of review studies have appeared in the recent literature covering differentaspects of IEQ [30–33]. Specifically, in [30] the influence of different IEQ factors on humanhealth and productivity is investigated for both residential and commercial settings, with anemphasis on IAQ, ventilation, and thermal, visual and acoustic comfort. Furthermore,various green building certifications (i.e., LEED, BGCA, and BREEAM) are reviewedtogether with their impact on IEQ. Similarly, in [31], IEQ is further investigated withthe addition of other influential parameters such as personal characteristics, building-related factors, outdoor climatic conditions and seasonal variation. Various case studies
Atmosphere 2022, 13, 191 3 of 43
are considered in different indoor environments including climate chambers, schools,office buildings, residences, and commercial buildings. Based on the presented results,thermal comfort was ranked by the occupants as the most important influential factoron occupant IEQ, as compared with other factors such as air quality, visual and acousticcomfort. In [32], the impact of IEQ was further analysed with a focus on occupant healthand well-being. Specifically, the considered factors included the IAQ in office environments,the SBS, thermal comfort, as well as acoustic and visual comfort. The survey argued thatgreen certified buildings did not necessarily guarantee a comfortable indoor environmentand the users well-being because of the building design. In addition, in [33], the last twodecades of IAQ research is comprehensively reviewed with a focus on the broad variety ofair pollutants found in several indoor settings and how different IAQ factors influence theair pollution. The reviewed literature is grouped in two main categories, residential andcommercial buildings, to help identify possible trends and gaps for each category.
In this work, an overview of the most important factors that influence the IEQ and acomprehensive review of the most recent field measurement studies with a focus on IAQ-related studies are presented, while multiple key statistics are extracted. Among the aims ofthis work is to provide a broad overview of the current status of field measurement studies,to identify key characteristics, common outcomes and correlations. Most importantly,this study aims to provide insights, identify gaps and provide suggestions to serve asthe starting point for conducting future field measurement studies. Our emphasis isplaced on IAQ and thermal comfort field measurement studies as well as the influencingfactors, measured parameters and associated quality indices, standards and outcomes.Additionally, we introduce for the first time the Virus Risk as an essential element of theIEQ (see Figure 1), that should also be considered in future field measurement studies.
Figure 1. Typical influencing factors of the IEQ.
Atmosphere 2022, 13, 191 4 of 43
The rest of the paper is organised as follows. In Section 2, the methodology forconducting the literature review is detailed and useful statistics are drawn with respectto the number, the years and the venues of the reviewed articles. Next, in Section 3,important background information on Thermal Comfort, Indoor Air Quality and Virus Riskis reviewed as related to the measured parameters and associated indices and standards.Section 4 includes the comprehensive review of the field measurement studies organised interms of the indoor environment into offices, educational facilities, residential, care centersand other. In Section 5, a critical evaluation of the field measurement studies is performedand useful insights are extracted together with guidelines for future research. The paperconcludes with Section 6.
2. Methodology
The purpose of the current literature review was to record the state-of-the-art literatureand present the main field case studies conducted for monitoring the IEQ in different indoorenvironments. Mainly peer review journal articles, but also surveys, conference articles,government publications, and guides on IEQ were used to shape this review. A systematicsearch was conducted on Google Scholar, ScienceDirect, and PubMed literature databasesbetween 2001 and 2021 using the keywords: indoor environmental quality, indoor airquality, thermal comfort, field case studies, field measurements, COVID-19 and air quality,environmental factors and airborne virus, virus risk assessment models. The topics covermultiple disciplines, including environmental science, engineering, and energy, as well asphysics and medicine.
The preliminary search, after screening the search results based on the articles’ titles,abstracts, keywords, number of citations and the year of publication, led to a total of morethan 150 publications. Subsequently, after carefully reading the entire articles, a filtrationprocedure was used to select the most relevant articles taking into account the followingselection criteria. An emphasis was placed on IAQ-related studies, thermal comfort andairborne virus transmission, while field measurement studies exclusively on acoustic andvisual comfort were not considered. Additionally, a significant effort was made to facilitateobjective comparisons between different field measurement studies in terms of test location,measured parameters, measurement methods, and measurement times, so a preferencewas given to large-scale studies containing this information. Finally, a filtration procedurewas used to remove duplicates.
Based on the above criteria, 41 field measurement studies were selected for the pur-poses of the review. For the selected studies, Figure 2 shows the number of publications peryear, while Figure 3 depicts the various publication venues. From the figures, it becomesevident that the number of publications has an increasing trend over the last 20 years, whileyear 2017 stands out with 8 publications. Furthermore, 93% of the publications appearedin journals with the highest number appearing in Building and Environment and IndoorAir with 6 and 4 publications, respectively.
Limitations of This Study
The limitations of this study stem primarily from the criteria used for selecting the41 field measurement studies that were included in the comparison. An emphasis wasplaced on IAQ-related studies over the last 20 years, thermal comfort and airborne virustransmission, while field measurement studies exclusively on acoustic and visual comfortwere not considered. Furthermore, this review primarily focuses on the quantitative com-parison (objective evaluation) of the field measurement studies in terms of the measuredparameters, the sensing equipment, and the data analysis performed. As a result, health-related studies and clinical trials, which use subjective evaluations and dosage responsemethods to establish the precise relationship between IAQ, human health and well-being,are beyond the scope of this work.

Atmosphere 2022, 13, 191 5 of 43
Figure 2. Year of publications.
Figure 3. Publication venues.
3. Background
In this section, we present important background information on Thermal Comfort,Indoor Air Quality and Virus Risk related to the measured parameters and associatedindices and standards. Figure 4 illustrates the associations with the measured parameters,while their recommended levels for various indoor spaces are provided in Table A1 inthe Appendix A.
3.1. Thermal Comfort
According to the American Society of Heating, Refrigerating and Air-ConditioningEngineers (ASHRAE), thermal comfort could be defined as ”that condition of mind whichexpresses satisfaction with the thermal environment and is assessed by subjective evalua-tion” (ASHRAE Standard 55) [23]. A thermally comfortable environment may be charac-terised as the environment in which a building’s user does not express any discomfort dueto the heat or cold.
3.1.1. Factors Influencing Thermal Comfort
The main factors influencing the human perception of thermal comfort could be cate-gorised into environmental and personal factors. The main four environmental parametersinclude air Temperature (T), Radiant Temperature (RT), air Velocity (V) and Relative Hu-midity (RH). RT is the measurement of infrared radiation that is emitted from the differentsurfaces in a room, such as walls, ceilings, and floors. The use of a Globe Thermometer is acommon practice for RT measurements [34]. The two personal factors include the ClothingInsulation (CI) and Metabolic Rate (MR). The MR describes the heat produced within the

Atmosphere 2022, 13, 191 6 of 43
body and it depends mainly on the physical activity (e.g., sleeping, standing, cooking).These personal factors are difficult to measure in field studies. This information is oftenobtained from questionnaires filled by occupants during surveys. For example, while theoccupants are asked by the surveyor to sit and relax for about 30 min to maintain the MRconstant, the value of MR is recorded as 1 met (58 W/m2) for sedentary activity.
3.1.2. Thermal Comfort Related Indices and Standards
Research on the field of thermal comfort over the last few decades, has led to two majorapproaches, the heat balance model and the adaptive model. The heat balance model alsoknown as thermo-physiological model has been developed in 1970 by P. Ole Fanger, whois considered one of the pioneers in the field. The main equation model is presented in ISO7730 [35], which can be used to determine two main thermal comfort indices, the PredictedMean Vote (PMV) and the Predicted Percentage Dissatisfaction (PPD). The PMV index isdetermined as the average response of a group of people on the thermal sensation thatthey feel in a given space. It considers both environmental and personal factors and can beexpressed in a 7-point thermal sensation scale as −3 (cold), −2 (cool), −1 (slightly cool), 0(neutral), +1 (slightly warm), +2 (warm), +3 (hot). PPD index is determined as the averagenumber of people likely to feel uncomfortable in an environment and it can be calculatedbased on the PMV index. Various researchers have developed software for PMV calculation.However, the majority of the software do not considered all six basic parameters of thermalcomfort [36]. There is also an adaptive version of the model that can evaluate thermalcomfort for a wider range of temperatures in a not fully conditioned indoor place (i.e.,naturally ventilated indoor places). In this model, the occupants are expected to interactwith their surrounding environment and adapt to it. Based on this approach, the thermalperception is defined in relation to both indoor and outdoor temperature. Both the heatbalance model and the adaptive model are based on current thermal standards, whichinclude ISO 7730 [35], ASHRAE Standard 55 [23] and EN 15251 [37].
3.2. Indoor Air Quality (IAQ)
The quality of indoor air has a very strong impact on the life quality of the occupantsin residential as well as commercial buildings. In fact, the percentage of time spent indoorsin the various micro-environments is significantly higher compared to outdoors [38].Furthermore, scientific evidence has demonstrated that indoor air pollution tends to behigher compared to outdoors [39–41]; a critical aspect, especially for vulnerable groups suchas elderly people, children, pregnant women, and people who have limited opportunityfor outdoor activities. Thus, it is extremely important to recognise, control, and maintainthe quality of indoor air [22]. The characteristics of each micro-environment differ greatly,based on the local outdoor conditions, the building structure characteristics, and thedifferent indoor activities. Based on this, and considering all the aforementioned factors,a comprehensive assessment of IAQ may not be a straightforward procedure.
3.2.1. Main Air Contaminants
Indoor environments are characterised by a mixture of indoor and outdoor contam-inants. Main categories of these contaminants include chemical, biological indoor aircontaminants and Particulate Matter (PM) [42]. Major chemical gases contain CarbonMonoxide (CO), Sulfur Dioxide (SO2), Nitrogen Dioxide (NO2), Ground Level Ozone(O3), as well as Volatile Organic Compounds (VOCs), Formaldehyde (HCHO), and Radon(Rn). On the other hand, biological agents, mainly include the presence of mould, bacteria,and viruses. In this work, we additionally consider Carbon Dioxide (CO2). Although nota pollutant, prolonged exposure in high concentrations of CO2 can cause dizziness andnausea. In the last two decades, CO2 measurements have been used as an indicator forindoor ventilation and risk of airborne virus transmission. Several studies conducted onschool settings showed that inadequate ventilation can be associated with the academicperformance of students. CO2 levels can also provide information on occupancy which

Atmosphere 2022, 13, 191 7 of 43
can be used for real time ventilation control. The recommended levels for many of thesecontaminants for various indoor spaces are provided in Table A1 in the Appendix A.
3.2.2. Factors Influencing IAQ
Poor IAQ is often the result of a combination of different factors. Indoor sourcesderived from occupant activities such as inefficient cooking and heating can be consideredone of the dominant contributor factors of indoor air pollution, especially in developingcountries. Various air pollutants are emitted in the air by the combustion of biomass fuels(e.g., wood, coal, agricultural residues), in traditional stoves [43]. These inefficient practicescan significantly impact the IAQ by releasing pollutants such as CO, PMs, and VOCs.
Another important factor is the outdoor presence of air pollutants, which enter theindoor environment through natural or mechanical ventilation, or even by infiltration.The vehicular traffic and local industrial activities are determined as the dominant outdoorpollution emission sources, which can impact the IAQ. According to the literature on IAQ-related studies, the relationship between indoor and outdoor concentrations is expressedwith the well-known Indoor to Outdoor (I/O) ratio [44]. In the case that the value of I/Oratio is higher than unity, this indicates that the indoor exceed the outdoor concentrations.On the other hand, if the value of I/O ratio is less than unity, the outdoor exceed theindoor concentrations. Both outdoor air temperature and RH can affect the indoor thermalconditions and furthermore the IAQ. In many epidemiological studies in the last few years,the link between air temperature, RH, and the transmission of viruses has been investigated.Existing evidence has shown that low outdoor temperature during winter season and lowindoor RH, can be positively associated with high weekly incidences of influenza [45].
Ventilation is another major influencing factor of IAQ. In simple words, ventilationis referred to the indoor air removal and replacement with clean ambient air. The mostcommon ventilation methods are the natural and mechanical ventilation. In Natural Venti-lation (NV), outdoor air directly enters through the building by the opening of windowsand/or doors. Mechanical Ventilation (MV) can be performed using any type of HeatingVentilation and Air Conditioning (HVAC) system. In one questionnaire survey among3485 adults in China the possible associations between indoor ventilation conditions,outdoor air pollution, meteorological factors and SBS symptoms were investigated [46].The results indicated that the frequent opening of windows and the use of exhaust fans inthe bathrooms could reduce the number of nose and dermal symptoms.
In recent years, new modern building construction practices involve the use of environ-mentally friendly building materials and energy-efficient processes in the design; aimingat more sustainable buildings and improving the occupant comfort and health. However,poor IAQ is still possible in the modern, green energy-efficient buildings. In fact, in somegreen practices the use of recycled products and waste-based materials may adverselyaffect the IAQ. These products can emit toxic compounds and as a result produce increasedlevels of air pollutants. In addition, energy efficient practices, such as the extensive use ofnatural ventilation in areas with elevated outdoor air pollution can significantly impact thequality of indoor air [13].
3.2.3. IAQ Related Indices and Standards
The negative impact of air pollution on human health and the environment in gen-eral, is a major reason for the development of legislative frameworks around the world.The development of such regulations aims both to improve, control and maintain airquality, as well as to prevent adverse effects on human health. Although there are specificguidelines, directives, and standards related to outdoor air quality in various countries,a legislative context is still missing for indoors. Currently, in Europe, there is still nospecific integrated directive legislative outline regarding the IAQ [47]. A harmonisedand global methodology is still absent. However, there is a growing number of pre-legislative initiatives, technical-scientific documents, guidelines, and recommendations.The WHO published IAQ guidelines on selected chemical pollutants which are often found

Atmosphere 2022, 13, 191 8 of 43
in indoor air in levels of concern to health [48]. These selected substances include ben-zene, CO, HCHO, naphthalene, NO2, Polycyclic Aromatic Hydrocarbons (PAHs), radon,trichloroethylene, and tetrachloroethylene.
Moreover, there are a number of custom made assessment systems and indices forIAQ developed by various companies and organisations around the world. An exampleof an IAQ index is the one developed by RESET Air for continuous real time informationof the quality of indoor air [49]. Levels of PM2.5, TVOCS, CO2 as well as T and RH arecollected by air quality sensors. The collected data can be viewed online based on aninternationally recognized standardization procedure through the RESET cloud database.Another commercial product, the Atmocube is an indoor environmental monitoring systemwhich is equipped with IEQ sensors for PM1, PM2.5, PM10, TVOC, HCHO, CO2 as wellas RH, T, atmospheric pressure, Illuminance (I), and Noise (N) levels [50]. This productoffers real-time monitoring for IAQ and environmental comfort parameters. The quality ofindoor air is expressed with a accumulative indicator, called Air Quality Score (AQS) whichis based on air pollutants concentrations. AQS’s indications range from 0 for severelypolluted air to 100 for very clean air.
Figure 4. Parameters linked with IAQ, thermal comfort and virus risk.
3.3. Airborne Virus Risk3.3.1. Factors Influencing Virus Risk
Existing evidence suggests that virus airborne transmission in indoor environmentscan be one of the main routes of disease transmission [51–53]. Research suggests thatthe rate of indoor transmission is directly connected with the IEQ conditions. In fact,the ongoing COVID-19 pandemic has highlighted the importance of IEQ monitoring andhas raised several questions about how atmospheric air pollution could be linked to viralinfections. Recent modelling studies have explored the relationship between air pollutionand COVID-19 confirmed cases [54–56] and they showed that the long-term exposure toharmful air pollutants present in the environment negatively influences both respiratoryand cardiovascular systems. Recent experiments have also validated the presence of thecurrent corona virus (SARS-CoV-2) on PM [57,58].
The risk of exposure to airborne viruses mainly in confined environments is notsomething new. As compared to previous airborne viruses such as MERS and SARS-CoV-1,the SARS-CoV-2 has spread more rapidly around the world due to increased adaptation ofthe virus in different indoor places. Several studies have investigated the effect of climatic

Atmosphere 2022, 13, 191 9 of 43
conditions on the survivability of various contagious viruses in aerosol form such as MERS,SARS-CoV-1, and SARS-CoV-2 [59–61]. The air temperature and RH are considered twoof the main influencing factors on the virus viability, survivability, and stability undercontrolled aerosolization procedures.
3.3.2. Virus Risk Related Indices
In the last few years, different types of mathematical models have been developed forinfection risk assessment, that can be useful in understanding the airborne transmissiondynamics of contagious diseases and in forecasting the risk of these diseases to the commu-nity. The two main methods are the dose-response model and the Wells–Riley model. Bothmodels aim at the quantification of the infection risk related to airborne transmission ofinfectious respiratory diseases, however the Wells–Riley method finds greater applicabilitysince the dose-response method requires the availability of experimental infectious dosedata. The Wells–Riley equation, on the other hand, evaluates the probability of a susceptibleperson to become infected, inhaling a randomly distributed amount of infectious airborneparticles into the air of a confined space [62] using the following equation:
PI =CS= 1 − e
(−Iqpt
Q
)(1)
where, PI is the probability of infection (−), C is the number of infectious cases (−), S isnumber of susceptibles (−), I is the number of infectors indoors (−), p is the averagepulmonary ventilation rate of susceptibles (m3/h), q is the quanta generation rate (i.e.,the amount of quanta produced by an infector) (quanta/h), t indicates the exposure timeinterval (h) and Q indicates the room’s ventilation rate (m3/h). It is important to note thatthe only IAQ related influencing factor on the probability of infection risk is the ventilationrate (Q). To complement some of the restrictions and increase the practicability of thismodel, different modifications and expansions have been developed by various scien-tists [63,64]. Beyond the use of the ventilation rate itself (Q), some researchers modelledthe CO2 concentrations indoors for the calculation of exhaled breath [65]. The idea wasthat the exhaled breath can act as the means for the release of infectious aerosols into theroom air.
The ongoing pandemic has attracted the interest of various researchers and engineersfrom different disciplines. An interesting initiative is the RESET Viral Index [66] thatcan provide real-time assessment of the probability of airborne viral transmission in anindoor environment. This index is scientifically founded on publications regarding virussurvivability, immune system health, and viral load and is able to also integrate real-timeinformation coming from sensors measuring PM2.5, RH, T, and CO2 as well as occupancylevels and ventilation. Another important result, is the virus risk indicator developed byAIRTHINGS [67] that uses a numerical scale 1–10 to quantify the risk of virus transmissionindoors by integrating other environmental factors and combining real time measurementsof CO2, T, RH, and PM. Recently, researchers from the Harvard T.H. Chan School of PublicHealth have developed a spreadsheet-based tool for estimating air ventilation rates inclassrooms using the steady state CO2 method [68]. In this tool, the users can insert theirtarget Air Changes per Hour (ACH) via ventilation and details about the studied classroom,and the tool returns to the user the estimated value of CO2 concentration based on a simpleguide developed for classrooms [69]. The purpose of this calculator is to provide to theusers an easy way to control the ventilation efficiency based on CO2 measurements inan effort to mitigate the risk of COVID-19 disease transmission. Also, the CoronaSenseProject [70] aims at the development of a 3D airborne transmission risk index for COVID-19 in the indoor environment based on CO2 measurements that also takes into accountenvironmental conditions (i.e., T and RH) and air pollution (i.e., PM).

Atmosphere 2022, 13, 191 10 of 43
4. Field Measurement Studies
In this section the selected field measurement studies are comprehensively reviewed,organised according to the building type in 5 categories: (i) Offices, (ii) Educational facilities,(iii) Residences, (iv) Care centers, and (v) Other. For each category, an attempt was made togroup together related studies according to the objectives and list large-scale studies first.The detailed characteristics of the measurement studies reviewed in this section can befound in Table A4 in the Appendix A.
4.1. Offices
Two large-scale field measurement studies were conducted in Europe and the US tostudy the IEQ for office environments. The European project OFFICAIR [71] investigatedthe IAQ in terms of seasonal variations in 148 offices from 37 buildings in Europe. Bothfield measurements and on-line questionnaires were used to examine the quality of indoorair. Field measurements were recorded by passive samplers for VOCs, aldehydes, O3,NO2, and PM2.5. Two sampling campaigns were conducted in the winter and the summerseason, respectively. The main results showed significant seasonal variations for all thestudied pollutants except for the xylenes. Specifically, the analysis results indicated higherindoor concentrations of almost all the target pollutants in the summer season comparedto the winter season. Another large-scale study presented in [72] explored the relation-ship between IEQ parameters and occupants’ satisfaction in 400 offices from 20 differentbuildings in the US. Both field measurements and questionnaires were used to assess theoccupants’ satisfaction levels. The measured parameters included temperature, RH, CO,CO2, particulates, and VOCs, as well as V, RT, noise, and illuminance levels. Data analysisshowed significant difference in thermal sensation between male and female workersduring the summer season. Specifically, female workers were significantly less satisfiedwith their thermal environment than male workers. According to the authors, the differentclothing insulation was the main factor for these observations.
A number of smaller field measurement studies concerning office environments havealso been reported from different parts of the world. A Wireless Sensor Network (WSN)monitoring system was developed for the exploration of influencing physical parameters ofthermal comfort in a building in Italy [73]. The sensor nodes were placed in different roomsfor the measurement of T, RH, RT, and air flow speed. The main findings showed that theair flow was almost constant in all studied rooms when the HVAC system was switchedoff. In addition, the penetration of sunlight through windows and the exchange of heatbetween the building and outdoor environment were the main influencing parameters ofthe temperature variations. A sharp change was also observed in both air flow directionand temperature the moment the windows were opened. In another study, the impact ofdifferent parameters of indoor air on the overall IEQ was investigated both indoors andoutdoors [74] for an office building in UK. Field measurements were conducted with acustom portable monitoring device for T, RH, PM2.5, PM10, VOCs, CO2, CO, as well as lightand sound levels. Short term experiments provided insights of the effects of the variationsof IEQ parameters and their impact on a custom IEQ indicator. The proposed IEQ indicatorwas based on the field measurements with a scoring system to compute a final overallpercentage of IEQ.
The effectiveness of the utilization of CO2 measurements for the activation of themechanical ventilation system in a high-rise office building in Hong Kong was analyzedin [75]. In this case study, a CO2-based controlled ventilation strategy was developed toimprove the building’s energy efficiency and maintain a high satisfaction rate related to IAQ.Deployed CO2 sensors in the Air Handling Units (AHUs) and in each individual buildingzone were used to test the proposed ventilation approach. Both field and simulation testsconducted to evaluate its performance, by comparing with the initial implemented fixedoutdoor air flow rate control approach.
In the Middle East Area, the frequent presence of dust storms episodes can significantlyaffect the IAQ of a building. In this context, a case study conducted in an office building in

Atmosphere 2022, 13, 191 11 of 43
Doha aimed to identify the influencing factors of indoor PM2.5 and PM10 concentrations [76].The results indicated that the HVAC’s system operation could considerably influence theindoor PM levels. On the other hand, when the HVAC system was not in operation,penetration of outdoor particles to the indoors was observed and attributed to cracks orother openings of the building. This study also observed that anthropogenic emissionsources and dust were the main contributors of PM composition.
4.2. Educational Facilities4.2.1. Academic Performance
Poor IAQ has been linked to reduced academic performance. Several field studiesconducted on school premises showed that inadequate ventilation associates with impairedcognitive function and decreased academic performance for students. In Scotland [77], fieldmeasurements of CO2 conducted at 60 naturally ventilated classrooms from 30 differentschools. The CO2 levels used as surrogate for the ventilation state. The outcomes showedthat the Time Weighted Average (TWA) of CO2 concentrations was negatively associatedwith the students’ school attendance. Specifically, an increase of 100 ppm in the averagedCO2 levels, was related to a decreased annual student attendance of 0.2%. In addition,the researchers noted that, an association between poor ventilation and various negativehealth effects was required for further exploration. In another study at a primary school inUK [78], the effects of CO2 concentrations on the cognitive function of students were inves-tigated by using computerised cognitive tests. The main results showed that the reactiontimes of students were prolonged when CO2 measurements were high (i.e., >2000 ppm).The elevated levels of CO2 showed a decrease of 5% in power of attention. Similar re-sults were also obtained from another study at 2 university classrooms in Malaysia [79].The study showed that the elevated levels of CO2 over time due to inadequate ventilationaffected the students’ concentration during the lecture hours. An association between fieldmeasurements of thermal comfort and human perception was performed for 28 classroomsfrom 7 schools in Italy [80]. It was found that CO2 levels were extremely high in 15 of thestudied classrooms due to insufficient ventilation and that students mostly complainedwith regards to thermal conditions in warm seasons and poor IAQ conditions.
4.2.2. Health Impact
Strong evidence exists that demonstrates the association between poor IAQ andinsufficient thermal conditions to multiple health problems. In this context, several fieldmeasurement studies have been published that consider educational environments and theimpact of various IEQ conditions on the children’s health.
A large-scale cross-sectional study was conducted in 319 classrooms from 115 schoolsin 23 European countries over a two-year study period [81]. The main findings showedthat indoor air pollution was associated with various health problems in children. Bothpositive and negative associations were observed between VOCs, PMs, and differentdiseases. In addition, significant associations were observed between CO2, T, RH, as well asventilation rate and symptoms of lower airways. In another large-scale study for 70 schoolsin the US, IEQ parameters including classroom ventilation rate, T, and cleanliness ofthe high contact surfaces, are found to have a significant effect on students’ health andacademic performance [82].
Limited field studies related to the infection risk of COVID-19 have been carriedout in educational indoor environments. In one study [83], in the Norwegian Universityof Science and Technology, the authors investigated the probability of infection risk ofCOVID-19 in a mechanically ventilated lecture hall. The measured parameters were T,RH, and CO2 levels. The measured CO2 concentrations in indoor air were used for thecalculation of the ventilation rate, which then applied in Wells–Riley equation for theestimation of the probability of infection.

Atmosphere 2022, 13, 191 12 of 43
4.2.3. Green Buildings
In relation to newly constructed green/sustainable buildings, it has been shown thatthe concentration of air pollutants is higher in comparison with conventional buildings.While outdoor conditions and contaminant concentrations affect the overall IEQ, it hasbeen found that user activities in combination with the increased air-tightness, especially inmodern green buildings, are among the top factors that influence indoor PM concentrationsin naturally ventilated school settings.
In a pilot study presented in [84], the impact of building and occupancy status on theIAQ within newly constructed (LEED-certified), retrofitted, and traditional buildings in acampus setting was evaluated for 3 educational buildings in the US. Field measurementswere conducted with a custom-built air sampling station for PM2.5, PM4, PM10, CO2, CO,NOx, NO2, NO, and HCHO, as well as T and RH. The main results showed that the averageoutdoor levels of PMs were significantly higher than the indoor levels in both classroomsand common areas. The average levels of PM2.5 were significantly differed between thedifferent building zones (classrooms/common areas/outdoors). No significant impact ofoccupancy status was observed on HCHO levels. In addition, both PM10 and PM2.5 levelswere observed to change significantly among different building types. The highest concen-trations were observed in the newly constructed buildings. In contrast, the building typeappeared to have no significant impact on PM4 levels. Among all building types, the aver-age levels of HCHO found to be highest in the newly constructed buildings. Accordingto the authors, in the case of newly constructed buildings the occupants’ intervention onventilation equipment (blocking of air vents) led to inadequate air flow in the buildings.
In another study in [85], field measurements were performed in 4 naturally ventilatedschool buildings in an effort to associate the ambient air pollution levels, IAQ, buildingdefects, and indoor activities. The measured parameters included PM2.5, PM10, CO2 andindoor temperature, and acquired using portable data loggers. According to the researchers,the improved building’s air tightness might reduce outdoor air particles’ infiltration andhelp to maintain a higher indoor temperature in winter. At the same time however,the improved air tightness might lead to an increase of indoor CO2 levels due to insufficientfresh air supply.
In Korea, a field study was performed to explore the different levels of indoor airpollutants within 55 school buildings of different academic grades [86]. The study focusedon exploring the correlation of the indoor pollutant levels in relation to the age of the build-ings. Considered parameters included CO, CO2, PM10, TVOCs, HCHO, Total MicrobialCount (TMC), as well as T and RH. After a statistical analysis, the results showed thatemissions of chemical compounds from building materials or furnishings and inadequateconditions of ventilation contributed to elevated indoor air pollution levels. Specifically,high concentrations of CO, TVOCs, and HCHO occurred at schools constructed within1 year. Furthermore, indoor TMC levels in all sampling sites were significantly higherduring the summer and the autumn seasons in comparison with the winter season. The I/Oratios of CO in all sampling sites were lower than unity, indicating that the main contributorof CO was an outdoor source. It was also observed that during the summer season theaverage indoor temperature and RH varied in the range of 23.6–33 ◦C and 30.1–84.6%,respectively, while during winter, the indoor environmental conditions were 14–28 ◦C and16.5–73%.
A subjective evaluation on IEQ was conducted in a University Campus in Italy [87].Questionnaires were administered to 562 engineering students of the campus. The ques-tions focused on IEQ-related subjects including thermal comfort, IAQ, acoustic and visualcomfort, as well as student perception of indoor spaces, aesthetics and orientation. Surveyresults showed a high percentage of dissatisfied students ( >40%) with thermal comfortand IAQ issues in classrooms. Specifically, the main students’ complaints were relatedto poor ventilation and thermal conditions, and the presence of stale air in classrooms.In addition, over 50% of students found it difficult to orient within the campus buildingfacilities. Beyond the subjective investigation, ideas were also proposed for the redevelop-

Atmosphere 2022, 13, 191 13 of 43
ment of a sustainable building environment, including topics such as the conformation ofplaces, building facades, classrooms without windows, and ways of signposting for betterorientation within the campus.
4.2.4. Ventilation Strategies
There is evidence that the ventilation strategies and type can significantly affectthe IEQ. In this context, in [88], the effects of different ventilation strategies on thermalcomfort, IAQ, and sound quality were investigated in 9 schools in England. The fieldmeasurements conducted with thermal comfort analysers, data loggers and sound levelanalysers during the heating season. The classrooms’ samples included natural ventilation,mechanical ventilation, and mixed mode ventilation conditions. The main results showedthat under both mechanically and mixed mode ventilation, problems arise with colddraughts coming from the ventilation systems which increased occupants’ discomfort.Moreover, it was observed that six naturally ventilated classrooms exceeded the dailyaverage of 1500 ppm of CO2 as determined by the Building Bulletin 101 standard (BB101).Interestingly, the openable area of windows in these classrooms was restricted for safetyreasons, resulting in low outdoor air supply rate and thus, elevated CO2 levels in theseclassrooms. In the Netherlands, an experimental study was conducted in 17 schools toassess the effects of different ventilation settings on the IAQ in the classrooms [89]. For thefield measurements, passive samplers and data loggers were used for CO2, PM2.5, PM10,and NO2 concentrations as well as endotoxin and β(1,3)-glucan levels while a mechanicalventilation device was used to change between different ventilation rates. The mainfindings of the study showed that the increased ventilation rate led to a significant reductionin endotoxin, β(1,3)-glucan, and PM10 levels. On the other side, no significant changeswere observed in the levels of PM2.5 and NO2.
4.2.5. IEQ Analysis
Investigation of IEQ conditions as compared to the recommended levels and stan-dards have also been reported by many educational facilities around the globe. In Turkey,a field study investigated the effects of outdoor air on the IAQ in four classrooms in Bat-man University [90]. On-site measurements were conducted both indoors and outdoorswith handheld air quality devices for temperature, relative humidity, CO2, Rn, and PMs.The main objective of this study was the comparison between the field measurements andvarious air quality standards. Overall, the average indoor CO2 and PMs concentrationswere significantly higher than the upper recommended limits of ASHRAE, EU, WHO andHong Kong. The dominant factors for elevated indoor concentrations were insufficientventilation and the outdoor air pollutant emissions by heavy traffic. Another case studypresented [91] investigated the IAQ in 32 mechanically ventilated classrooms in Qatar.Indoor and outdoor field measurements were conducted with portable data loggers andpassive samplers for temperature, RH, CO, CO2, and PMs. According to the authors,the increased number of pupils in small classroom volumes combined with insufficientventilation systems could increase the indoor CO2 concentrations. Furthermore, the infre-quent cleaning of surfaces and the direct penetration of outdoor PMs into the classroomscould contribute to elevated PMs concentrations indoors.
The exposure of children to indoor air pollutants, was investigated for 27 primaryschools coming from both urban and suburban areas in Belgium [92]. In situ measure-ments were conducted with passive samplers for PM2.5, NO2, SO2, O3, and BTEX (benzene,toluene, ethylbenzene and xylene) concentrations. The study outcomes showed that theaverage indoor PM2.5 levels were higher than outdoors in almost all schools during thesampling period. In addition, a significant difference in elemental composition betweenindoor and outdoor PMs was identified by a lab analysis. Specifically, elements relatedto the re-suspension of dust from carpets were identified in the indoor PMs. High con-centrations of benzene were also observed in classrooms located at lower levels. PoorIEQ conditions, especially with respect to issues relating to IAQ were also observed in
Atmosphere 2022, 13, 191 14 of 43
16 air conditioned schools in United Arab Emirates (UAE) as indicated from the fieldmeasurement study presented in [93]. The authors showed that the average levels ofTVOCs, CO2, and PMs exceeded the Dubai municipality standards. In Cyprus, a fieldmeasurement campaign was conducted at 42 primary schools following “The 2021 SchoolTemperature and Environmental Pollutants (STEPS) Study [94]”. A variety of differentparameters were measured both indoors and outdoors using sensor instruments (T, RH,bVOCs, CO2, and PMs), as well as passive samplers (benzene, toluene, ethylbenzene,xylenes). There is an ongoing investigation to assess the results of this study in terms ofIAQ related standards and guidelines.
4.2.6. Wireless Custom-Built Solutions
Low cost Wireless Sensor Network (WSN)/IoT-based solutions have also been pro-posed for the IAQ assessment of educational facilities. The development of a low cost WSNmonitoring system for IAQ assessment in real time was presented in [95]. The custom-builtIAQ system consisted of sensors measuring temperature-RH, CO2, CO, and illuminance.To evaluate the system and prove its performance, field measurements were conducted intwo classrooms. In [96], the authors proposed a smart air device to collect measurementsrelated to the IAQ. The sensor array in the device consisted of PM, VOC, CO, and CO2sensors, as well as a temperature-humidity probe. The collected data can be transmittedin real time to a web server for processing, visualization, and further analysis. It is worthnoting that the Korean Ministry of Environment has approved this device using testingprotocols as reliable for IAQ monitoring.
4.3. Residences
Only a few field measurement studies exist for IEQ in residences, probably due tothe vast variations between the residences and the possible reluctance of homeowners toparticipate in such studies. The main studied parameters are VOCs and thermal comfortfor people living in tropical climate conditions.
One of them is a large-scale study presented in [97], where a large number of air sam-ples (N = 2242) was obtained from 622 flats in Germany. In this study, 60 different VOCswere measured using passive samplers. Two data analysis techniques were performed toidentify emission sources and patterns of VOC compounds. The main study results showedthat ventilation, occupant activities, furnishings, natural processes, and a combinationof these factors considerably influenced IAQ. In another large-scale study, the effect ofbuilding characteristics on indoor VOCs levels were investigated in 169 energy-efficient res-idences in Switzerland [98]. In situ measurements were conducted with passive samplersover one week for monitoring of VOCs and aldehydes in master bedrooms of the resi-dences. The main outcomes showed that interior renovation of residences and absence ofmechanical ventilation systems associated with increased indoor levels of HCHO, toluene,and butane. In almost all studied master bedrooms (90%) the levels of HCHO exceededthe chronic exposure limits. Residences with attached garages had higher concentration ofTVOC compared to other garage types.
In Indonesia, the thermal comfort perception and preference of occupants in 274naturally ventilated households were investigated and presented in [99]. A comprehensiveanalysis was performed using field measurements and questionnaires. Dry bulb tem-perature, RH, mean radiant temperature, and V as well as clothing and metabolic ratewere the main measured parameters. On-site measurements were performed by sensorprobes and data loggers, which were all mounted on a tripod. After a statistical analysis,the study resulted that that PMV index predicted warmer thermal perception comparedto what occupants actually felt. Occupants living in tropical regions with hot and humidclimatic conditions showed preference to cooler temperatures as compared to what theneutral (comfort) temperature showed. They also, seemed to prefer higher air movementby opening the windows to make their indoor environment more thermally comfortable.Similar results were also obtained by [100], who showed using both field measurements

Atmosphere 2022, 13, 191 15 of 43
and residents’ questionnaires that people living in tropical climates expected a coolerenvironment. In addition, the analysis of gender differences in terms of thermal comfortindicated that females were more sensitive to changes of air temperature than males.
In another study presented in [101], a characterisation of IAQ was performed for sixhouseholds in Hong Kong. The study showed that the average CO2 and PM10 concentra-tions were higher in almost all the kitchens in comparison with the living rooms. Furtherinvestigation showed that poor ventilation in the kitchens was the main contributor forthe elevated CO2. The major influencing factors of elevated PM10 were the infrequentcleaning, and the infiltration of outdoor air through the buildings. In addition, the cookingusing Liquified Petroleum Gas (LPG) had more significant impact on VOCs concentrationscompared to the use of natural gas.
A low-cost WSN system was developed to assess the IAQ in real time [102]. The sensornodes were installed in the bedroom, the living room, the office, and the kitchen to monitortemperature, RH, ammonia (NH3), CO2, NOx, and benzene. The results showed poor IAQin the kitchen due to the cooking activities.
4.4. Care Centers
A small number of field studies were conducted in care facilities for elderly people. InTaiwan, the effects of different IEQ parameters were investigated in 12 care centres [103].The field measurements conducted in the bedrooms space for sampling of CO2, CO,airborne dust, temperature, RH, air velocity as well as noise and illuminance levels. Noise,and RH level found to negatively impact occupants the most among all the studied physicalparameters. In China, the effects of different IEQ parameters were investigated in 15 roomsof a nursing home [104]. Both questionnaire surveys and physical measurements wereperformed to develop two machine learning predictive models for assessment of the IEQ.The physical measurements were conducted through a WSN system for monitoring of theT, the RH, the CO2, as well as noise and illuminance levels. Temperature was determinedas the most significant contributor on IEQ acceptance level. The characterisation of indoorenvironmental conditions was performed in three naturally ventilated social housingswith elderly people in Spain [105]. On-site measurements were conducted in the livingroom and bedroom of each studied apartment by two portable data loggers. Samplingdata included indoor temperature, RH, and CO2 concentration. The main results showedunhealthy indoor CO2 levels (i.e., >900 ppm) and very low indoor temperatures in allmonitored locations mainly due to the ventilation pattern of the building users. Decreasedlevels of CO2 were also obtained in the bedrooms with doors in open position duringsleeping periods.
4.5. Other
There are also some studies that include building types not belonging to the fouraforementioned categories or include comparisons between buildings from more than onecategory. A field study in Florida, US was conducted in both an educational office spaceand a residential apartment to compare multiple environmental factors [106]. A custom-built air quality monitoring system was used to log the field measurement, where multipleindividual sensor modules were integrated onto a low-cost Raspberry Pi 3B Plus board.The measured parameters were T, RH, PMs, NO2, SO2, CO2, CO, O3, and TVOC. Statisticaland correlation analysis were performed to examine the relationships between all airquality factors. The outcomes showed that the average indoor PMs concentration washigher in the residential apartment compared to the office place. The CO2 concentrationwas significantly higher in the residential apartment (i.e., 2195 µg/m3) than at the office(i.e., 423 µg/m3). The average O3 concentration was also higher (i.e., 12.1 ppb) in theapartment compared to the office (i.e., 2.37 ppb). Moreover, average indoor NO2, SO2 andTVOC levels were relatively similar at both sites. According to the correlation analysis, SO2was strongly correlated with PMs (i.e., R = 0.9) at both monitoring sites. The levels of RHwere significantly higher (i.e., 70.4%) in the office compared to the apartment (i.e., 45.5%).

Atmosphere 2022, 13, 191 16 of 43
In India, the IAQ in non-residential urban buildings was investigated within 2 officesand 1 educational building [107]. In situ measurements were mainly conducted withpassive samplers for CO2, PM2.5, and VOCs concentrations. The analysis of the measure-ments and main results of the study were obtained through statistical analysis. The mainresults showed that ductless air conditioning systems and inefficient air circulation werethe main contributors to the high levels of PM2.5 inside the studied buildings while averageindoor CO2 concentrations in the same floor might vary in different sampling locations.The authors also noted that large number of office equipment such as copier machinesand computers were important sources of VOCs. Moreover, the maximum Total HealthRatio Indicator (THRI) was observed in the building that had the highest air pollutantconcentrations compared to the other studied buildings.
The effects of outdoor air pollution on IAQ were investigated for a mechanicallyventilated shopping mall in Hong Kong, China [108]. Fixed and mobile indoor samplingwas conducted to capture the spatial heterogeneity of air pollutants. Both indoor andoutdoor measurements were performed for PM2.5, PM10, NO2, and CO. The quantificationof the effect of outdoor air pollution on IAQ was based on the estimation of the well-known Infiltration Factor (IF), which indicates an average fraction of outdoor pollutantsthat occur indoors over a time period. Regression analysis results showed an increasedeffect of outdoor air pollution on IAQ during the mall opening hours. In particular,75% of PM2.5, 53% of PM10, and 59% of NO2 were infiltrated into the mall. Considerablespatial variations were also observed for PMs and NO2 near the major entrances andthe dining area. The authors concluded that the large portion of unfiltered air infiltratedfrom outdoors and cooking activities, were the main factors for the accumulation of airpollutants at these locations.
One study [109] conducted experiments in 3 different indoor environments usinga WSN air quality monitoring system to assess the influencing factors on IAQ. On-sitemeasurements were conducted in a classroom, a living room, and a church. The authorsconcluded that many factors contribute to the IAQ such as location, airflow, the peopledensity, size of room, and different room materials. In another field measurement studypresented in [110], the relationship between indoor and outdoor PM2.5 concentrations andthe effectiveness of the ventilation systems and the air cleaners were explored. On-sitemeasurements were performed in 7 different mechanically ventilated public and residentialbuildings in Beijing including a stadium, a hotel, a shopping centre, a research centre,a commercial office, an apartment and a detached villa. The analysis results confirmedthe effectiveness of the ventilation systems and the air cleaners to lower approximately90% the PM2.5 concentrations in all sampling sites. A web-based monitoring system forindication of the IAQ parameters in real time is developed for 1 double-storey building inMalaysia [111]. A number of different parameters were monitored using a WSN includingT, RH, CO, CO2, VOC, CH4, and PM. A high concentration of VOCs was observed at thechemical lab due to the release of different chemical compounds into the room air.
5. Discussion
In this section, a critical analysis of the collected information is presented, with keystatistics and interesting observations. In addition, current challenges and existing gapsrelated to field measurement studies are also identified and discussed. The detailed charac-teristics of the measurement studies discussed in this section can be found in Tables A2–A4in the Appendix A.
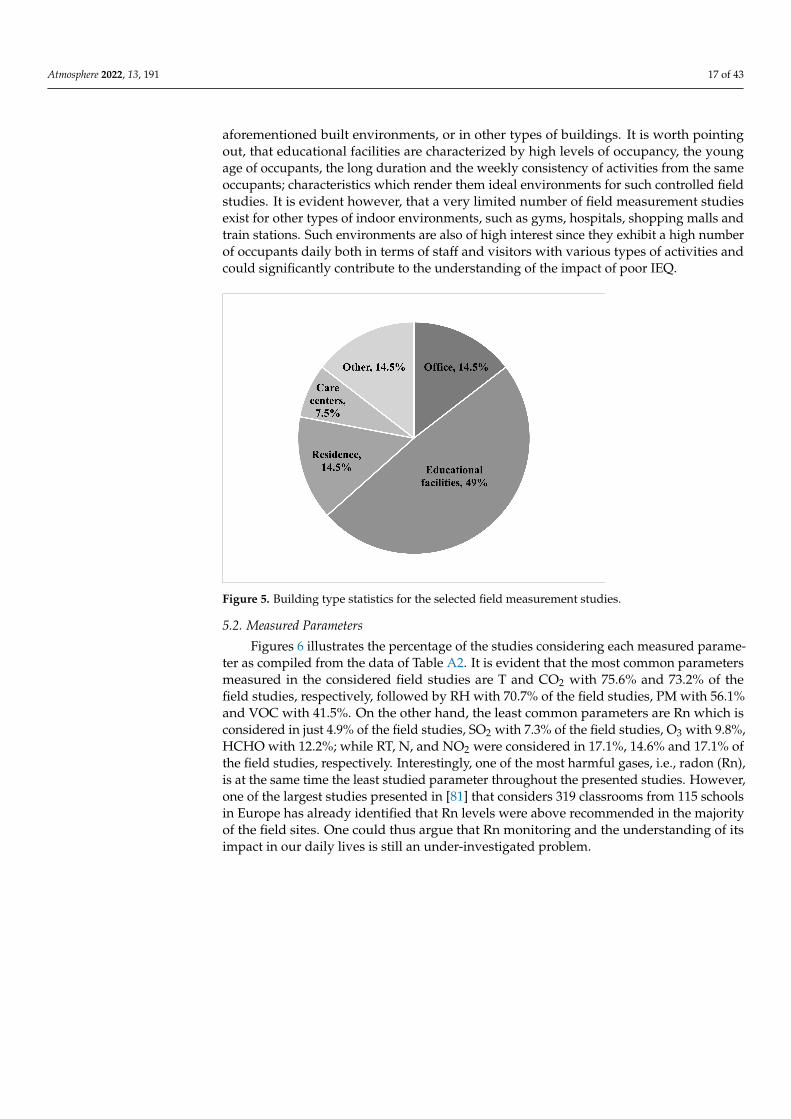
5.1. Building Type
Figure 5 illustrates statistics on the type of built environment for the 41 selected fieldmeasurement studies presented in Table A4. From the plot, it becomes evident that themajority of field studies were conducted in Educational facilities with a percentage ofapproximately 49%, followed by Offices and Residences, both with 14.5%, Care centerswith 7.5%, while the remaining 14.5% were either conducted in a combination of the
Atmosphere 2022, 13, 191 17 of 43
aforementioned built environments, or in other types of buildings. It is worth pointingout, that educational facilities are characterized by high levels of occupancy, the youngage of occupants, the long duration and the weekly consistency of activities from the sameoccupants; characteristics which render them ideal environments for such controlled fieldstudies. It is evident however, that a very limited number of field measurement studiesexist for other types of indoor environments, such as gyms, hospitals, shopping malls andtrain stations. Such environments are also of high interest since they exhibit a high numberof occupants daily both in terms of staff and visitors with various types of activities andcould significantly contribute to the understanding of the impact of poor IEQ.
Figure 5. Building type statistics for the selected field measurement studies.
5.2. Measured Parameters
Figures 6 illustrates the percentage of the studies considering each measured parame-ter as compiled from the data of Table A2. It is evident that the most common parametersmeasured in the considered field studies are T and CO2 with 75.6% and 73.2% of thefield studies, respectively, followed by RH with 70.7% of the field studies, PM with 56.1%and VOC with 41.5%. On the other hand, the least common parameters are Rn which isconsidered in just 4.9% of the field studies, SO2 with 7.3% of the field studies, O3 with 9.8%,HCHO with 12.2%; while RT, N, and NO2 were considered in 17.1%, 14.6% and 17.1% ofthe field studies, respectively. Interestingly, one of the most harmful gases, i.e., radon (Rn),is at the same time the least studied parameter throughout the presented studies. However,one of the largest studies presented in [81] that considers 319 classrooms from 115 schoolsin Europe has already identified that Rn levels were above recommended in the majorityof the field sites. One could thus argue that Rn monitoring and the understanding of itsimpact in our daily lives is still an under-investigated problem.

Atmosphere 2022, 13, 191 18 of 43
Figure 6. Measured parameter statistics for the selected field measurement studies.
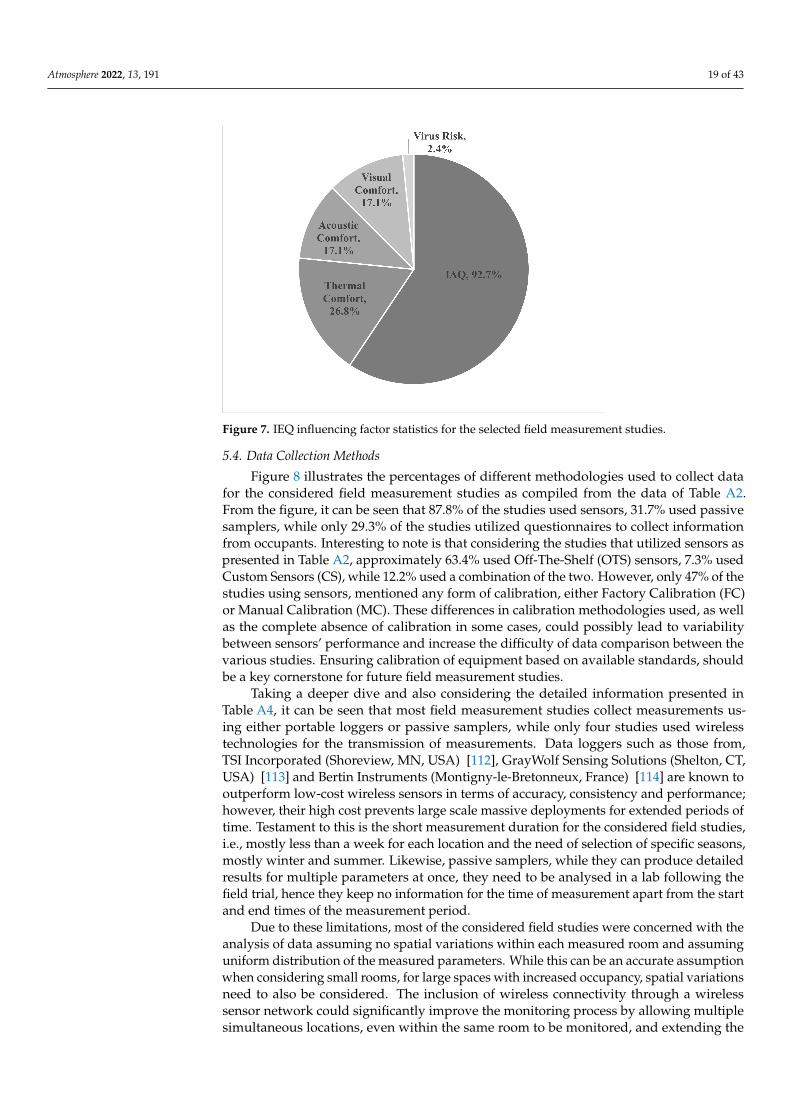
5.3. IEQ Influencing Factor
Figure 7 illustrates the IEQ influencing factor statistics compiled from the presenteddata in Table A3. As expected, the majority of the field measurement studies (i.e., 92.7%)are concerned with the analysis of IAQ while 26.8% consider thermal comfort, and acousticand visual comfort are considered in 17.1% each. In combination with the percentages ofconsidered parameters we deduce that most of the studies considering IAQ are focusedon the analysis of pollutants such as CO2, PM and VOC, while field studies consideringother harmful pollutants are less common. This can be mostly attributed to the availabilityand cost of sensors for specific pollutants, rather than more generic or cheaper sensorsmeasuring VOCs and CO2, for example. In addition, our review shows that studies whichconsider IAQ far surpass the percentage of studies conducted for thermal comfort, whichclearly indicates the increased concern over the last two decades for the health impactof various indoor pollutants. It should be noted that for this work special attention wasgiven to field measurement studies focusing on IAQ analysis. It is also worth pointing out,that even that most of the studies that consider IAQ are also collecting measurements fortemperature and RH, they are not considering thermal comfort. In fact, the combination ofthe IAQ measurements, specifically CO2 with measurements for temperature and humiditycould have also been used for analysing the virus transmission risk for these environments(e.g., through the use of the Wells–Riley Equation (1)). However, only a small percentage of2.4% of the considered field measurement studies are currently performing such an analysis.
Atmosphere 2022, 13, 191 19 of 43
Figure 7. IEQ influencing factor statistics for the selected field measurement studies.
5.4. Data Collection Methods
Figure 8 illustrates the percentages of different methodologies used to collect datafor the considered field measurement studies as compiled from the data of Table A2.From the figure, it can be seen that 87.8% of the studies used sensors, 31.7% used passivesamplers, while only 29.3% of the studies utilized questionnaires to collect informationfrom occupants. Interesting to note is that considering the studies that utilized sensors aspresented in Table A2, approximately 63.4% used Off-The-Shelf (OTS) sensors, 7.3% usedCustom Sensors (CS), while 12.2% used a combination of the two. However, only 47% of thestudies using sensors, mentioned any form of calibration, either Factory Calibration (FC)or Manual Calibration (MC). These differences in calibration methodologies used, as wellas the complete absence of calibration in some cases, could possibly lead to variabilitybetween sensors’ performance and increase the difficulty of data comparison between thevarious studies. Ensuring calibration of equipment based on available standards, shouldbe a key cornerstone for future field measurement studies.
Taking a deeper dive and also considering the detailed information presented inTable A4, it can be seen that most field measurement studies collect measurements us-ing either portable loggers or passive samplers, while only four studies used wirelesstechnologies for the transmission of measurements. Data loggers such as those from,TSI Incorporated (Shoreview, MN, USA) [112], GrayWolf Sensing Solutions (Shelton, CT,USA) [113] and Bertin Instruments (Montigny-le-Bretonneux, France) [114] are known tooutperform low-cost wireless sensors in terms of accuracy, consistency and performance;however, their high cost prevents large scale massive deployments for extended periods oftime. Testament to this is the short measurement duration for the considered field studies,i.e., mostly less than a week for each location and the need of selection of specific seasons,mostly winter and summer. Likewise, passive samplers, while they can produce detailedresults for multiple parameters at once, they need to be analysed in a lab following thefield trial, hence they keep no information for the time of measurement apart from the startand end times of the measurement period.
Due to these limitations, most of the considered field studies were concerned with theanalysis of data assuming no spatial variations within each measured room and assuminguniform distribution of the measured parameters. While this can be an accurate assumptionwhen considering small rooms, for large spaces with increased occupancy, spatial variationsneed to also be considered. The inclusion of wireless connectivity through a wirelesssensor network could significantly improve the monitoring process by allowing multiplesimultaneous locations, even within the same room to be monitored, and extending the
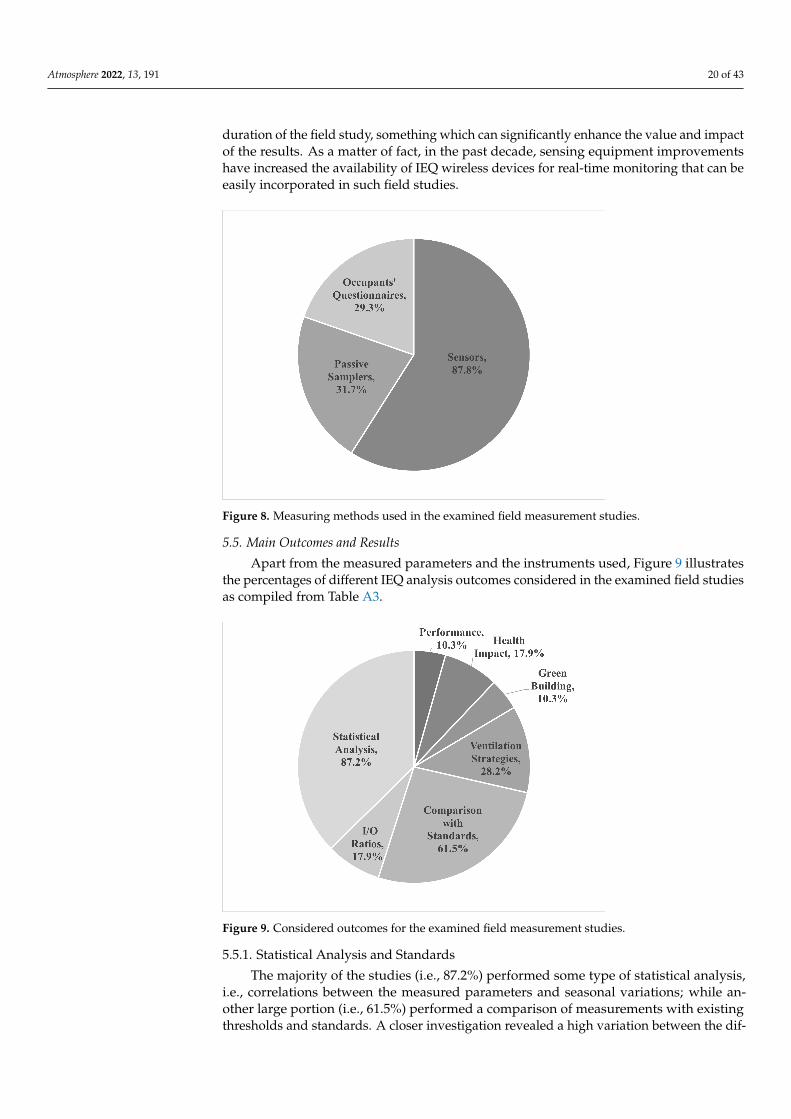
Atmosphere 2022, 13, 191 20 of 43
duration of the field study, something which can significantly enhance the value and impactof the results. As a matter of fact, in the past decade, sensing equipment improvementshave increased the availability of IEQ wireless devices for real-time monitoring that can beeasily incorporated in such field studies.
Figure 8. Measuring methods used in the examined field measurement studies.
5.5. Main Outcomes and Results
Apart from the measured parameters and the instruments used, Figure 9 illustratesthe percentages of different IEQ analysis outcomes considered in the examined field studiesas compiled from Table A3.
Figure 9. Considered outcomes for the examined field measurement studies.
5.5.1. Statistical Analysis and Standards
The majority of the studies (i.e., 87.2%) performed some type of statistical analysis,i.e., correlations between the measured parameters and seasonal variations; while an-other large portion (i.e., 61.5%) performed a comparison of measurements with existingthresholds and standards. A closer investigation revealed a high variation between the dif-

Atmosphere 2022, 13, 191 21 of 43
ferent thresholds and standards considered, which indicates the lack of widely acceptablerecommended values for the majority of IEQ parameters and highlights the necessity ofestablishing unified and comprehensive standards.
5.5.2. Ventilation
Ventilation influence and strategies were considered in 28.2% of the field studies thatconcluded that inadequate ventilation was the major reason for high levels of CO2, espe-cially in high occupancy environments such as educational facilities. Occupants perceptionfor IEQ was assessed through the use of questionnaires in 12.5% of studies. Interestingly,the results showed that high levels of CO2 resulted in increased complaints for low comfortand high temperature, which directly indicates the necessity of monitoring and controllingIAQ conditions apart from T and RH to achieve a comfortable indoor environment.
5.5.3. Health Impact & Performance
Health impact was investigated in 17.9% of the considered field studies. Interest-ingly, the virus risk has been found to be positively correlated with low IAQ conditions.In addition, 10.3% of the studies examined the effects of IEQ on productivity, performanceand cognitive capabilities, with a focus on high CO2 concentrations. While the majorityof studies considering thermal comfort investigate the differences between female andmale occupants in their perception of IEQ, no investigation was performed for possiblehealth impact, productivity or absence rate differences for the two groups. Moreover,statistics derived from these field studies could possibly be used for the generation ofquantifiable metrics for the health impact of various IAQ conditions that can be used forthe enhancement of monitoring and decision support systems.
5.5.4. Green Buildings
Comparison and assessment of IAQ in new green buildings in comparison witholder buildings were included in 10.3% of the investigated studies. It is clear, that thecurrent trends towards energy-efficient and green designs, as well as weatherproofingand passivity concepts, can have a negative impact on IAQ. Thus, there is an increasedneed for proper monitoring, control and assessment of new and retrofitted buildings,possibly by comparison with older buildings, for the emergence of new methods anddesign methodologies specifically addressing IAQ-related issues.
5.6. Real-Time Monitoring and Control
The considered field studies focused on the evaluation of IAQ, the comparison ofindoor to outdoor concentrations, the identification of sources of indoor pollution andthe correlations between the various pollutants. However, directions such as real-timemonitoring and control of the indoor environment (e.g., control of the ventilation rate,opening and closing doors and windows) through advanced analytic solutions and data-driven decision support tools are currently unavailable, especially for high-occupancy,high-impact indoor environments such as educational and healthcare facilities. Moreover,as previously mentioned for larger open spaces (e.g., malls, amphitheaters, airports andcruise ships), there is a need for real-time monitoring and control of the IEQ such thatproper measures can be taken when dangerous events take place, like the release of acontaminant due to an accident or even a terrorist attack. Under those conditions, itbecomes of vital importance to detect and isolate the contaminant source in order to takeappropriate measures and ensure the safety of the occupants. The only way to achieve this,is to monitor the IEQ levels in real-time at multiple points and to have in place appropriateintelligent algorithms that can process the sensor data in real time and take the necessartactions through the appropriate decision support systems [115]. Therefore, together withthe need for fine-grained real-time field measurement studies, there is also the need todevelop more advanced data analytic solutions for sensor placement and contaminantevent monitoring like the ones presented in [116–121].

Atmosphere 2022, 13, 191 22 of 43
5.7. Standardisation
Considering the presented field studies holistically, a considerable lack of uniformityand standards is revealed for the assessment and categorization of the different parametersfor the indoor environment, as well as a lack of consistency of methods used for calibrationof the utilized equipment. In addition, none of the studies compared their results withany green-buildings certifications standards (i.e., RESET, LEED etc.). These inconsistenciesare mainly attributed to the vast variability of conditions, locations, indoor environmentconsiderations, assumptions of each study, ventilation conditions and IEQ assessmentconsiderations involved in each study. As a result, the one-to-one comparison between thestudies is not possible. A wider adoption of standards using formal assessment methods,would ensure that the results of the studies become comparable and useful to the researchcommunity, thus adding to the vast amount of existing data and knowledge. New fastercommunication routes are also needed for conveying these results back to the policymakersresponsible for developing the new standards.
6. Conclusions
IEQ is a significant contributor to the occupants’ comfort, productivity and well-being. While multiple works exist that investigate or speculate the effects of variousindoor environmental conditions on occupants, field measurement studies in real workingenvironments are the only way to truly understand everyday problems, find possiblesolutions and define new avenues of exploration for future studies.
This paper provides a comprehensive review of selected field measurement studiesthat have been conducted in various indoor environments during the last two decades,with an emphasis on IAQ-related studies. Moreover, important background informationis presented related to the measured parameters and associated indices and standardsfor thermal comfort, IAQ and the airborne virus transmission risk, which we expect willbecome a vital component in future IEQ studies. For the considered field measurementstudies, insightful statistics are derived with respect to the influencing factors, locationselection, measurement acquisition process characteristics, sensing equipment and mainoutcomes. The derived statistics, along with the identified important research areas andgaps, can serve as an important reference for the designing of field measurement studies inthe future.
In particular, there is a need for standardisation and a holistic approach for design-ing future field measurement studies for the different types of built environments thattake into account all the influencing parameters, including the vast range of pollutants.Currently, there is limited information available for pollutants other than CO2, VOC, andPM. In particular, radon, a proven harmful pollutant at any level above zero, is rarelyconsidered. There is also a need to consider different types of built environments suchas hospitals, care centers, gyms, churches, shopping malls, amphitheaters, train stations,cruise ships, and other indoor spaces where people commonly gather in large numbersor for extended periods of time. For these large open spaces, there is a need to designlong-term campaigns with multiple sensing points in order to capture the complex indoorenvironment and the spatial variability. The use of low-cost wireless sensors and tech-nologies can be instrumental in achieving this, however their use remains limited, mainlydue to the absence of standards and calibration procedures for validating the collectedmeasurements. In particular, the establishment of universal standards and guidelines forconducting field measurement studies is the most important requirement for increasing theusefulness and facilitating the comparison between the vast amount of collected data. Onlythen, can useful results be extracted that will lead to corrective measures for improving theIEQ and ensuring the health, comfort, productivity and well-being of the occupants.
Author Contributions: All authors have contributed equally to this work. All authors have read andagreed to the published version of the manuscript.

Atmosphere 2022, 13, 191 23 of 43
Funding: This work was co-funded by the European Union and the Republic of Cyprus throughthe Research and Innovation Foundation (Project identification number: PRE-SEED/0719/0148 andSEED-COVID/0420/0026).
Conflicts of Interest: The authors declare no conflict of interest.
Appendix A. IAQ Recommended Levels and Field Measurement StudiesCollective Results
Table A1. Recommended Levels.
Parameter Recommended LevelsPhysical parameters
T ASHRAE 55 (residences): [122] , 19.5–27.8 ◦C
RH• EPA (residences) [123]: 30–60%• ASHRAE 62.1 (residences) [124]: ≤65%• ASHRAE (classrooms) [125]: 40–60% (prevention airborne virus transmission)
N
WHO [126]:
• Classrooms & Residences: 35 dBA• Bedrooms: 30 dBA
I EN 12464-1 (Classrooms & Offices)[28]: 500 lux
V
Harvard T.H. Chan (classrooms—(Classroom densities: 25 students/1000 ft2 for5–8 years-old)) [69]:
• Ideal: 6 ACH• Excellent: 5–6 ACH• Bare minimum: 3–4 ACH• Low: <3 ACH
Chemical parameters
PM
RESET Air Standard (PM2.5) [49]:
• Acceptable: <35 µg/m3
• High performance: <12 µg/m3
WHO (PM2.5) [127]:
• Annual mean: 5 µg/m3
• 24 h mean: 15 µg/m3
WHO (PM10) [127]:
• Annual mean: 15 µg/m3
• 24 h mean: 45 µg/m3
CO
WHO [127]:
• 24 h mean: 7 mg/m3
• 8 h mean: 10 µg/m3
• 1 h mean: 35 mg/m3
• 15 min mean: 100 mg/m3
ACGIH (workplaces) [128]:
• 8 h TWA: 25 ppm
CO2
RESET Air Standard [49]:
• Acceptable: <1000 ppm• High performance: <600 ppm
ECDC [129]:
• <800–1000 ppm to ensure sufficient ventilation (prevention airborne virustransmission)

Atmosphere 2022, 13, 191 24 of 43
Table A1. Cont.
Parameter Recommended Levels
SO2
WHO [127]
• 24 h mean: 40 µg/m3
• 10 min mean: 500 µg/m3
NO2
WHO [127]
• Annual mean: 10 µg/m3
• 24 h mean: 25 µg/m3
• 1 h mean: 200 µg/m3
O3
WHO [127]:
• 8 h mean (peak season): 60 µg/m3
• 8 h daily maximum: 100 µg/m3
VOC
WHO [48]:
• Benzene annual mean: 1.7 µg/m3
ACGIH (workplaces) [128]:
• Includes limit values for several chemical substances
RESET Air Standard [49]:
• Acceptable: <500 µg/m3
• High performance: <400 µg/m3
Rn
WHO [130]:
• Annual mean: 2.7–8 pCi/L
EU [131]:
• Annual mean: 8 pCi/L
EPA [132]:
• Annual mean: 4 pCi/L
ICRP [133,134]:
• Annual mean: 8 pCi/L

Atmosphere 2022, 13, 191 25 of 43
Table A2. Field measurement studies parameters and indices.
Ref. Selected Measured Parameters Measuring Methodology
T RH RT V N I PM CO CO2 SO2 NO2 O3 VOCs HCHO Rn Sensors Calibration Passive Samplers Occupants’Questionnaires
Offices[71] X X X X X X[72] X X X X X X X X X X OTS N/A X[73] X X X X OTS, CS N/A[74] X X X X X X X X OTS FC, MC[75] X OTS MC[76] X CS N/A X
Educational facilities[77] X X X OTS FC, MC[78] X X OTS N/A X[79] X X X OTS FC[80] X X X X X X OTS N/A X[81] X X X X X X X OTS FC X X[82] X X X OTS N/A[83] X X X N/A N/A[84] X X X X X X X OTS MC X[85] X X X OTS N/A[86] X X X X X X X OTS N/A X[87] X X X X CS N/A[88] X X X X X X OTS N/A[89] X X X OTS N/A X[90] X X X X X OTS N/A[91] X X X X X OTS FC X[92] X X X X X[93] X X X X X X X X X OTS N/A[94] X X X X OTS FC X[95] X X X X X OTS N/A[96] X X X X X X OTS FC, MC

Atmosphere 2022, 13, 191 26 of 43
Table A2. Cont.
Ref. Selected Measured Parameters Measuring Methodology
T RH RT V N I PM CO CO2 SO2 NO2 O3 VOCs HCHO Rn Sensors Calibration Passive Samplers Occupants’Questionnaires
Residences[97] X X X[98] X X X X[99] X X X X OTS FC X[100] X X X X OTS N/A X[101] X X X X OTS MC X[102] X X X X CS N/ACare centers[103] X X X X X X X X N/A N/A X[104] X X X X X OTS N/A X[105] X X X OTS N/A XOther[106] X X X X X X X X X OTS, CS FC[107] X X X OTS FC, MC X[108] X X X OTS, CS N/A X[109] X X X X X X X X X OTS, CS MC[110] X X X OTS MC[111] X X X X X X OTS, CS FC
Sensors: Off-The-Shelf (OTS), Custom Sensors (CS); Calibration: Factory Calibration (FC), Manual Calibration (MC), Not Available (N/A).
Table A3. IEQ Analysis and Influencing factors.
Ref. IEQ Analysis IEQ Influencing Factors
Performance HealthImpact
GreenBuilding
VentilationStrategies
Comparison withStandards I/O Ratios Statistical
Analysis IAQ ThermalComfort
AcousticComfort
VisualComfort
VirusRisk
Offices[71] X X[72] X X X X X X X[73] X X[74] X X X X X X[75] X X[76] X X X X
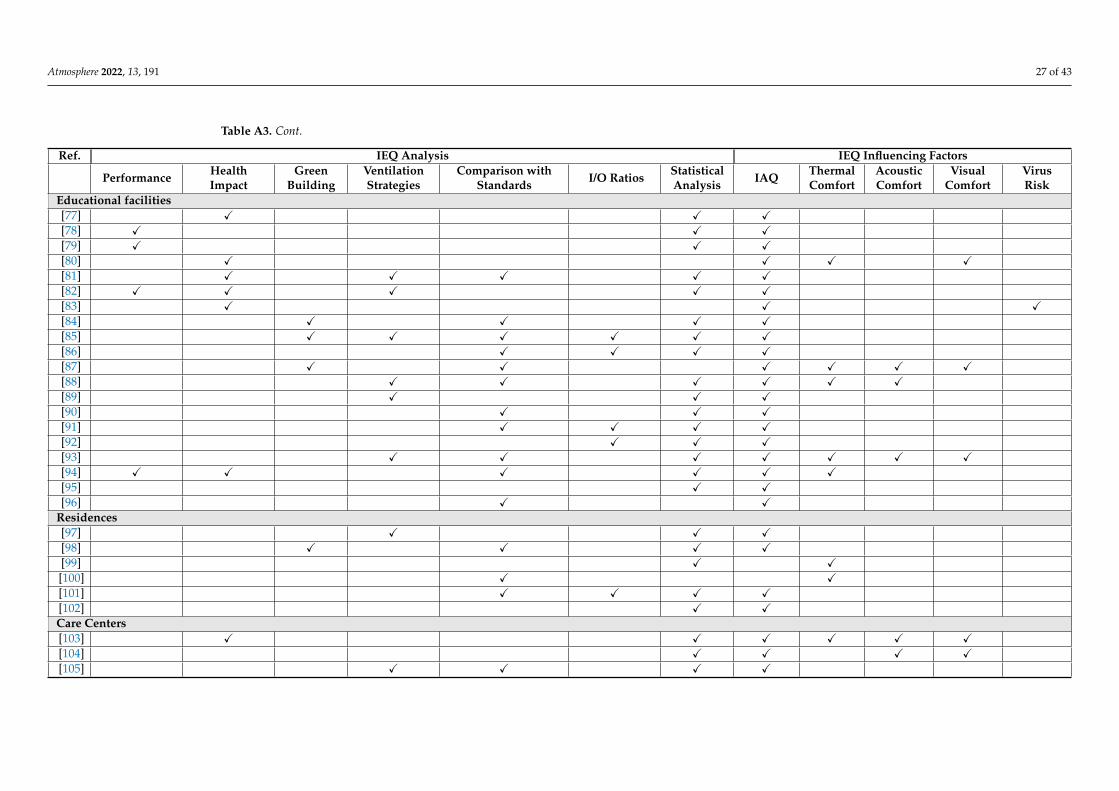
Atmosphere 2022, 13, 191 27 of 43
Table A3. Cont.
Ref. IEQ Analysis IEQ Influencing Factors
Performance HealthImpact
GreenBuilding
VentilationStrategies
Comparison withStandards I/O Ratios Statistical
Analysis IAQ ThermalComfort
AcousticComfort
VisualComfort
VirusRisk
Educational facilities[77] X X X[78] X X X[79] X X X[80] X X X X[81] X X X X X[82] X X X X X[83] X X X[84] X X X X[85] X X X X X X[86] X X X X[87] X X X X X X[88] X X X X X X[89] X X X[90] X X X[91] X X X X[92] X X X[93] X X X X X X X[94] X X X X X X[95] X X[96] X X
Residences[97] X X X[98] X X X X[99] X X[100] X X[101] X X X X[102] X XCare Centers[103] X X X X X X[104] X X X X[105] X X X X

Atmosphere 2022, 13, 191 28 of 43
Table A3. Cont.
Ref. IEQ Analysis IEQ Influencing Factors
Performance HealthImpact
GreenBuilding
VentilationStrategies
Comparison withStandards I/O Ratios Statistical
Analysis IAQ ThermalComfort
AcousticComfort
VisualComfort
VirusRisk
Other[106] X X X[107] X X X[108] X X[110] X X X X X[109] X X X[111] X X X
Table A4. Field measurement studies information.
Ref. Location Info(Ventilation)
Measurement Period,Duration, Resolution Sensing Equipment (Measured Parameters) Remarks
[71]148 offices from 37
buildings (MV),Europe
2012 and 2013 (summerand winter seasons),
5 days, N/A
Passive samplers:
• Radiello diffusion tubes (VOCs, aldehydes, O3)• Gradko diffusion tubes (NO2)• Low-volume aerosol sampler with quartz fiber
filters (PM)
• Assessment of indoor air pollutants in terms of seasonal variation• Significant seasonal variations observed for all the studied pollutants except
for the xylenes
[72] 400 offices from 20buildings, U.S.
2005–2008 (winter andsummer season), 10 min,
15 s
National environmental assessment toolkit (CO2,CO, PM, VOCs, T, RH) with hand-held sensors (V,RT, N, and I levels)
• Data collection using field measurements and questionnaires• Examine gender differences and relationship between IEQ parameters and
occupants’ satisfaction• Significant difference in thermal sensation found between male and female
workers during summer season• Higher air velocity (air flow rates) contributed to lower CO2 levels
[73]
Premises ofOptoelettronicaItalia S.r.l., FarSystems S.p.A.,
R&D Systems S.r.l.(MV), Italy
July 2013, 3 days, 5 s
Wireless Sensor Network:
• SHT25 Sensirion (T, RH)• Thermopile detector T11262-01 Hamamatsu
(RT)• Thermal Mass Flow (TMF) sensor (V)
• Custom WSN monitoring system for studying thermal comfort• Almost constant air flow observed when the HVAC system was switched off
during the weekend• Temperature variations due to sunlight penetration through windows and
the exchange of heat with outdoors• Sharp change observed in both air flow direction and temperature when
windows opened

Atmosphere 2022, 13, 191 29 of 43
Table A4. Cont.
Ref. Location Info(Ventilation)
Measurement Period,Duration, Resolution Sensing Equipment (Measured Parameters) Remarks
[74]1 office and an exitof a car-park (MV),
Coventry, UKN/A, N/A, 10 min
Custom portable IEQ monitoring device:
• SHT31 Sensirion (T, RH)• HPMA115S0 Honeywell (PM)• CCS811 AMS (VOCs)• IAQ-Core C AMS (VOCs)• MiCS-VZ-89TE SGX Sensortech (VOCs)• T6713 Amphenol (CO2)• LLC 110-102 SPEC Sensors (CO)• LLC 110-801 SPEC Sensors (IAQ)• TSL2561 TAOS (I)• Adafruit #1063 (N)
(Additional calibration—T, RH and CO2)
• Proposed portable IEQ monitoring device and custom IEQ indicator• Short term experiments showed the variations in IEQ parameters and their
impact on an overall IEQ indicator• Increased VOCs concentration due to the use of air cleaners and different
sensitivities between the various VOC sensors
[75]1 high-rise officebuilding (MV),
Hong Kong
Field tests in winterseason. Simulation testsfor summer and spring,
N/A, N/A
• Air flow meters• CO2 sensors (Calibration using an accurate CO2
sensor)• Fan power meters
• On-site operation and validation of a CO2-based controlled ventilation ap-proach
• Significant reduction in energy consumption and assurance of good IAQ
[76] 1 office building(MV), Doha, Qatar
April–June 2015 (springseason), 2 months, N/A
Low Volume Sampler LVS16, WB EngineeringGmbH (PM)
• Chemical characterisation of indoor and outdoor PMs• PMs concentrations exceeded the WHO and EU daily limit values in 100% of
the outdoor measurements• Strong positive correlation between PM2.5 and PM10 for both indoors and
outdoors• Anthropogenic emissions and dust were the main contributors of PM compo-
sition• Indoor to outdoor association significantly influenced by infiltration through
the HVAC system
[77]60 classrooms from
30 schools (NV),Scotland
May and June 2010,1 week, 6 min
Portable data loggers:
• Telaire 7001Di CO2 monitor Edinburgh Instru-ments Ltd (CO2) (Factory calibrated and One-point calibrations against CO2 atmospheric lev-els/week)
• HOBO H08-003-02 IAQ logging instrument On-set, Bourne, MA via Edinburgh Intruments Ltd(T, RH)
• Testing of the hypothesis that CO2 concentrations are negatively associatedto student school attendance and educational performance
• Time weighted average (TWA) CO2 concentrations negatively associatedwith student school attendance

Atmosphere 2022, 13, 191 30 of 43
Table A4. Cont.
Ref. Location Info(Ventilation)
Measurement Period,Duration, Resolution Sensing Equipment (Measured Parameters) Remarks
[78] 1 primary school(MV), Devon, UK
(summer season),random days/week,
N/APortable data logger, Telaire 7001 monitor (T, CO2) • Impact of low ventilation rate on cognitive function of students
• Elevated levels of CO2 showed a decrement of 5% in power of attention
[79]2 University
classrooms (MV),Malaysia
N/A, 2-h, 5 min
Wireless Sensor Network:
• DHT-11 sensor (T, RH)• MG-811 sensor (CO2)
• Exploration of the impact of environmental parameters on students’ concen-tration during the lectures
• Elevated levels of CO2 over time linked with lower students’ performance• Lower IQ tests results at the end of lectures compared to the results at the
beginning
[80]28 classrooms from
7 schools (NV),Venice, Italy
2009 and 2010, 1 day,N/A
• Indoor Climatic Analyser Brüel&Kjaer (T, RH,RT, V)
Portable data loggers:
• IAQ monitor AirBoxx (CO2)• Minolta CL200 lux-meter (I)
• Study of students’ personal impressions with regard to the indoor environ-mental conditions in the classrooms by use of questionnaires
• CO2 levels were extremely high in 15 studied classrooms due to insufficientventilation
• Students complained mostly with regard to thermal conditions in warmseasons and poor IAQ
[81]319 classrooms
from 115 schools(NV, MV), Europe
November 2011–March2012, 1 week, 30 min (CO)
• Radiello diffusive samplers (VOCs)• Gammadata RAPIDOS sampler (Rn)• MS&T area sampler Air Diagnostics and Engi-
neering Inc. (PM)• Neotronics Impulse XP (CO)• CaTec Klimabox data logger (T, RH, CO2)(Factory calibration/year)
• Association between indoor air pollution, insufficient thermal conditions andchildren health problems using field measurements and questionnaires
• Both positive and negative associations observed between VOCs, PMs,and different diseases
• PM2.5, Rn, and CO2 exceeded the air quality guidelines.• Significant association between CO2, temperature, RH, ventilation rate and
symptoms of lower airways• Strong negative association between temperature and both RH and CO2
[82] 70 schools (MV),U.S.
2008–2009 and 2009–2010,1 week/school, 5 min (T,
RH, CO2)
Portable data loggers:
• QTrak Monitor TSI Incorporated, Shoreview,USA (T, RH, CO2)
• Adenosine triphosphate (ATP) monitoring sys-tem
• Contact agar plates (RODAC) (bacteria)
• Exploration of different IEQ parameters and their effect on health and aca-demic performance of students
• Student’s performance associated with both indoor temperature and ventila-tion rate
• Health results associated with both ventilation and culturable bacteria
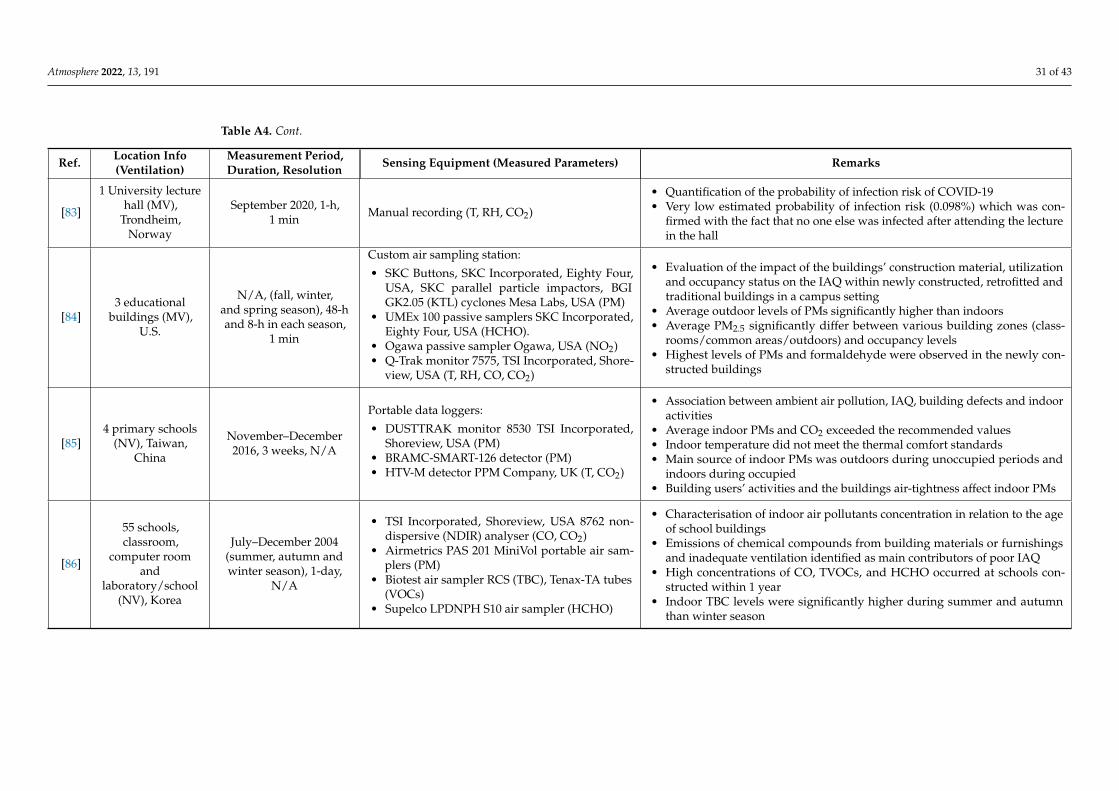
Atmosphere 2022, 13, 191 31 of 43
Table A4. Cont.
Ref. Location Info(Ventilation)
Measurement Period,Duration, Resolution Sensing Equipment (Measured Parameters) Remarks
[83]
1 University lecturehall (MV),
Trondheim,Norway
September 2020, 1-h,1 min Manual recording (T, RH, CO2)
• Quantification of the probability of infection risk of COVID-19• Very low estimated probability of infection risk (0.098%) which was con-
firmed with the fact that no one else was infected after attending the lecturein the hall
[84]3 educational
buildings (MV),U.S.
N/A, (fall, winter,and spring season), 48-hand 8-h in each season,
1 min
Custom air sampling station:
• SKC Buttons, SKC Incorporated, Eighty Four,USA, SKC parallel particle impactors, BGIGK2.05 (KTL) cyclones Mesa Labs, USA (PM)
• UMEx 100 passive samplers SKC Incorporated,Eighty Four, USA (HCHO).
• Ogawa passive sampler Ogawa, USA (NO2)• Q-Trak monitor 7575, TSI Incorporated, Shore-
view, USA (T, RH, CO, CO2)
• Evaluation of the impact of the buildings’ construction material, utilizationand occupancy status on the IAQ within newly constructed, retrofitted andtraditional buildings in a campus setting
• Average outdoor levels of PMs significantly higher than indoors• Average PM2.5 significantly differ between various building zones (class-
rooms/common areas/outdoors) and occupancy levels• Highest levels of PMs and formaldehyde were observed in the newly con-
structed buildings
[85]4 primary schools
(NV), Taiwan,China
November–December2016, 3 weeks, N/A
Portable data loggers:
• DUSTTRAK monitor 8530 TSI Incorporated,Shoreview, USA (PM)
• BRAMC-SMART-126 detector (PM)• HTV-M detector PPM Company, UK (T, CO2)
• Association between ambient air pollution, IAQ, building defects and indooractivities
• Average indoor PMs and CO2 exceeded the recommended values• Indoor temperature did not meet the thermal comfort standards• Main source of indoor PMs was outdoors during unoccupied periods and
indoors during occupied• Building users’ activities and the buildings air-tightness affect indoor PMs
[86]
55 schools,classroom,
computer roomand
laboratory/school(NV), Korea
July–December 2004(summer, autumn andwinter season), 1-day,
N/A
• TSI Incorporated, Shoreview, USA 8762 non-dispersive (NDIR) analyser (CO, CO2)
• Airmetrics PAS 201 MiniVol portable air sam-plers (PM)
• Biotest air sampler RCS (TBC), Tenax-TA tubes(VOCs)
• Supelco LPDNPH S10 air sampler (HCHO)
• Characterisation of indoor air pollutants concentration in relation to the ageof school buildings
• Emissions of chemical compounds from building materials or furnishingsand inadequate ventilation identified as main contributors of poor IAQ
• High concentrations of CO, TVOCs, and HCHO occurred at schools con-structed within 1 year
• Indoor TBC levels were significantly higher during summer and autumnthan winter season

Atmosphere 2022, 13, 191 32 of 43
Table A4. Cont.
Ref. Location Info(Ventilation)
Measurement Period,Duration, Resolution Sensing Equipment (Measured Parameters) Remarks
[87]
26 classrooms from1 University
Campus (MV),Salerno, Italy
May 2019, N/A, N/A N/A
• Data collection using questionnaires and subjective evaluation of the IEQand way-finding.
• Main students complaints were attributed to poor ventilation conditionsand the presence of stale air in classrooms while over 50% of students hadorientation difficulties within the campus.
[88]
18 classrooms,from 9 schools inurban, suburbanand rural areas
(NV, MV), England
2006 and 2007 (winterseason), 1 week, 5 min(CO2), 1 s (T, RH, V)
Portable data loggers:
• Quest Technologies AQ5001Pro monitors (T,RH)
• Telaire 7001 monitor (CO2)
Thermal comfort analysers:
• VAISALA capacitive sensor (RH)• DANTEC heated thermocouple sensor (V)
Sound level analyser:
• B&K 2260D Investigator with Qualifier type7830
• Omni Power sound source 4296
• Investigation of the effect of ventilation rates on IAQ, thermal comfort andsound quality in classrooms
• 6 naturally ventilated classrooms exceeded the daily CO2 average of 1500ppm
• Highest ventilation rates observed in the naturally ventilated classrooms• In most of the classrooms the PPD (thermal comfort) was lower than 15%• Cold draughts from the ventilation systems were observed in both the me-
chanical and mixed mode ventilated classrooms
[89]18 classrooms from
17 schools (NV),Netherland
2010–2012(2 winterseasons), 3 weeks, 4 min
Data logger:
• GRP-300 Pro or ATV-IAQ set ATAL B.V.,Purmerend, The Netherlands (CO2)
Portable passive sampler:
• Electrostatic dust collector (EDC) (endotoxin,β(1,3)-glucan)
• Harvard impactor Air Diagnostics and Engi-neering Inc, Harrison, ME, USA (PM)
• Ogawa passive sampler OGAWA & CompanyInc., Pompano Beach, FL, USA (NO2)
• Investigate the impact of increased ventilation on IAQ in classrooms• Increased ventilation led to a significant decrease in endotoxin, β(1,3)-glucan
and PM10 levels

Atmosphere 2022, 13, 191 33 of 43
Table A4. Cont.
Ref. Location Info(Ventilation)
Measurement Period,Duration, Resolution Sensing Equipment (Measured Parameters) Remarks
[90]4 University
classrooms (NV),Turkey
September–May 2018, 2days/week, 10 min
Portable data loggers:
• Extech portable IAQ CO2 meter• AlphaGUARD PQ 2000 PRO (Rn)• Lighthouse Handheld 3016 IAQ (T, RH, PM)
• Determination of IAQ and comparison with ASHRAE, EU, WHO and HongKong standards
• Average indoor CO2, PM2.5, and PM10 concentration were higher than stan-dards
• Average indoor temperature was slightly lower than standards• Average indoor Rn and RH levels were within acceptable limits
[91]32 classrooms from16 schools in urbanareas (MV), Qatar
December 2015 -March2016 (winter season),school-hours, 1 min
Portable data loggers:
• Q-Trak Indoor Air Quality monitor 7575-XTSI Incorporated, Shoreview, USA (T, RH, CO,CO2) (Factory calibrated)
Portable passive samplers:
• Marple PM2.5 and PM10 200 Personal Environ-mental Monitor (PEM) MSP Co., Minneapolis
• Investigation of IAQ• Indoor CO2 and PM concentration exceeded the ASHRAE, and US-EPA
standards• Main contributors of CO2 in classrooms were indoor sources• High indoor PM levels were observed and attributed mainly to outdoor
levels
[92]
27 schools in urbanand suburban areas
(NV), Antwerp,Belgium
December 2002 and Jun2003, 5 days, N/A
• MS&T Area Sampler Air Diagnostics and Engi-neering (PM)
• Radiello diffusion tubes (SO2, NO2, O3)
• Assessment of the exposure of children to indoor air pollutants• Average indoor PM2.5 levels were higher than outdoor in almost all schools• Different elemental composition of indoor PM2.5 than outdoor PM2.5• Re-suspension of dust from carpets was possibly the main contributor indoors• NO2, SO2, O3, and BTEX mainly from outdoor sources• High concentrations of benzene present for classrooms located at lower levels
[93]
16 schools in urbanand rural areas
(MV), Dubai andFujairah, UAE
April 2012–Feberary 2013,8-h daily, 30 s (PM), 15
min (T, RH, CO, CO2, O3,VOC)
Portable data loggers:
• TSI Optical Particle Sizer 3330 TSI Incorporated,Shoreview, USA (PM)
• GrayWolf Direct Sense IAQ-IQ probe 610 (T, RH,CO, CO2, O3, VOCs)
• SL 130G EXTECH Sound Level Alert withAlarm
• HD450 EXTECH Data logging Light Meter
• Investigation of IEQ in UAE classrooms in respect to IEQ standards• Average indoor values of TVOCs, CO2, and PMs exceeded the standards• High levels of PM10 observed during a sandstorm event• High occupancy level contributed to high indoor CO2 levels• Thermal conditions for T and RH met the recommended limits• Average indoor sound level and lighting levels greater than the recom-
mended limits

Atmosphere 2022, 13, 191 34 of 43
Table A4. Cont.
Ref. Location Info(Ventilation)
Measurement Period,Duration, Resolution Sensing Equipment (Measured Parameters) Remarks
[94]
42 schools (NV,MV), Nicosia,
Limassol, Larnaca,Pafos, Cyprus
May–July 2021, 2days/week, N/A
• PurpleAir sensors, Draper, Utah, USA, (PM)• Radiello passive samplers, Pavia, Italy (Benzene,
Toluene, Ethylbenzene, Xylenes)• mcf88 LoRaWAN Indoor Environmental Sensor
(T, RH, bVOCs)
• Investigation of indoor and outdoor air quality for primary schools in Cyprus• Data collection using field measurements and questionnaires
[95]
2 classrooms from 1Polytechnic
Institute, Guarda,Portugal
2015, 3 months, N/A
Wireless Sensor Network
• SHT10 sensor (T, RH)• MQ7 sensor (CO)• T6615 sensor (CO2)• LDR 5 mm sensor (I)
• Proposed WSN air quality monitoring system• System implementation and evaluation in an indoor environment• Low cost sensor modules and open-source technologies developed for IAQ
monitoring in real time
[96]
1 University, mainentrances of the
building,laboratories,
restroom (MV),Korea
2018, N/A, N/A
• Laser dust sensor PM2007 Cubic Optoelectron-ics Co.
• GSBT11-P110 sensor Ogam Technology (VOC)• GSET11-P110 sensor Ogam Technology (CO)• CM1103 sensor ( CO2)• DHT11 OSEPP Electronics (T, RH)
• A web-based IAQ monitoring platform• Additional calibration and reliability tests with certified devices• Tested and accredited as reliable for IAQ monitoring by the Korean Ministry
of Environment
[97]
622 flats, livingroom/flat (NV,MV), Leipzig,
Germany
(summer and winterseason), 16 months, N/A
Passive samplers:
• Organic Vapor Monitors 3M, OVM 3500 (VOCs)
• Identification of the sources and patterns that describe indoor VOCs• Large sample size (N = 2242)• Flats strongly influenced by ventilation occupant activities, furnishings, natu-
ral processes or a combination of these factors
[98]
169energy—efficientresidences, bed-room/residence
(NV), Switzerland
September 2015, 7 days,N/A
Passive samplers:
• Carbon molecular sieve, Anasorb 747 TOXproSA Switzerland (VOCs)
• 2.4—dinitrophenylhydrazine impregnated sil-ica gel TOXpro SA Switzerland (HCHO)
• Investigation the effect of building characteristics on indoor VOCs levels• Higher levels of TVOC at residences with attached garages• Increased levels of formaldehyde, toluene, and butane caused by interior
thermal renovation and absence of mechanical ventilation• Chronic exposure limits for formaldehyde exceeded for 90% of studied resi-
dences

Atmosphere 2022, 13, 191 35 of 43
Table A4. Cont.
Ref. Location Info(Ventilation)
Measurement Period,Duration, Resolution Sensing Equipment (Measured Parameters) Remarks
[99]274 households(NV), Jogjakarta,
Indonesia
April–June 2001 andNovember–January 2002
(summer and winterseason), one and a halfmonths (06:00-24:00),
N/A
Sensor probes and data loggers mounted on a tri-pod:
• Digital thermometer (T)• Electronic psychrometer (RH)• 150mm diameter black painted globe thermome-
ter (RT)• Omni directional hot wire anemometer (V)
• Investigation of thermal comfort for tropical regions• PMV index predicted warmer thermal perception compared to what occu-
pants actually felt• Occupants living in tropical regions showed preference to cooler tempera-
tures (26 ◦C) as compared to what the neutral (comfort) temperature (29.2◦C) showed
• They seemed to prefer higher air movement by opening the windows tomake their indoor environment more thermally comfortable
[100]1944 residences(NV), Hainan,
China
Mar.–April (spring andearly summer), 2 months,
10 min (outdoor)
Data loggers:
• HOBO U12-011 America Onset (Outdoor T, RH)• DT-321S Hygrometer & Thermometer China
Hua shengchang (Indoor T, RH)• AZ8778 Black-bulb thermometer Tai wan
hengxin,• TESTO 405-v1 Anemomeer German (V)
• Investigation of thermal comfort in tropical island areas• Analysis of gender differences in terms of thermal comfort• Data collection using field measurements and questionnaires• People living in tropical climates expected a cooler environment• Females were more sensitive to changes of air temperature than males
[101]
6 households,living room and
kitchen/household (NV,
MV), Hong Kong
July–October 1999, 8-h(CO2, PM), 1 day
(HCHO), 1 min (PM)
Portable data loggers:
• Q-Trak monitor 8551 TSI Incorporated, Shore-view, USA (CO2)
• DustTrak air monitor 8520 TSI Incorporated,Shoreview, USA (PM)
Passive samplers:
• SKC formaldehyde monitoring kit SKC Incorpo-rated, Eighty Four, USA, Mass flow controllerFC4104CV-G Autoflow Inc. (VOCs)
Bio-aerosol sampler:
• Burkard single stage impactor Burkard Manu-facturing Co. Ltd.
(Additional calibration)
• Investigation of IAQ and indoor emission sources at residential buildings• Higher average CO2 and PM10 concentrations observed in almost all kitchens
than living rooms• Insufficient ventilation in the kitchens was the main contributor for elevated
CO2• Average indoor airborne bacteria levels in kitchens higher than living rooms
and outdoors• Significant correlation between airborne bacteria and number of occupants
in both kitchens and living rooms• Elevated VOCs concentrations due to cooking with LPG fuel
[102]living room,
bedroom, office,and kitchen
Feb.–Mar 2016, 1 month,N/A
Wireless Sensor Network:
• Air quality sensor Winsen Electronics Technol-ogy Co., Ltd (CO2, NOx, NH3, C6H6)
• Winsen Electronics Technology Co., Ltd (RH)• LM 35 Sparkfun (T)
• Proposed WSN air quality monitoring system• System implementation and evaluation in an indoor environment• Poor IAQ observed in the kitchen due to the cooking activities
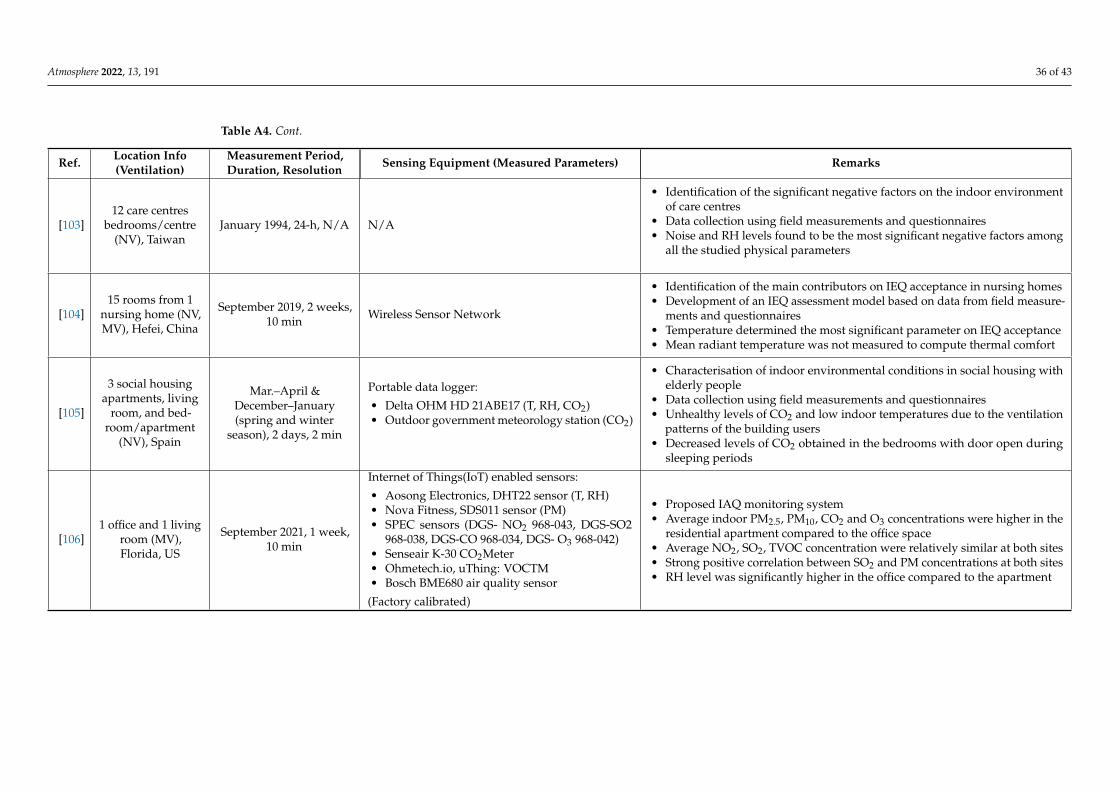
Atmosphere 2022, 13, 191 36 of 43
Table A4. Cont.
Ref. Location Info(Ventilation)
Measurement Period,Duration, Resolution Sensing Equipment (Measured Parameters) Remarks
[103]12 care centres
bedrooms/centre(NV), Taiwan
January 1994, 24-h, N/A N/A
• Identification of the significant negative factors on the indoor environmentof care centres
• Data collection using field measurements and questionnaires• Noise and RH levels found to be the most significant negative factors among
all the studied physical parameters
[104]15 rooms from 1
nursing home (NV,MV), Hefei, China
September 2019, 2 weeks,10 min Wireless Sensor Network
• Identification of the main contributors on IEQ acceptance in nursing homes• Development of an IEQ assessment model based on data from field measure-
ments and questionnaires• Temperature determined the most significant parameter on IEQ acceptance• Mean radiant temperature was not measured to compute thermal comfort
[105]
3 social housingapartments, living
room, and bed-room/apartment
(NV), Spain
Mar.–April &December–January(spring and winter
season), 2 days, 2 min
Portable data logger:
• Delta OHM HD 21ABE17 (T, RH, CO2)• Outdoor government meteorology station (CO2)
• Characterisation of indoor environmental conditions in social housing withelderly people
• Data collection using field measurements and questionnaires• Unhealthy levels of CO2 and low indoor temperatures due to the ventilation
patterns of the building users• Decreased levels of CO2 obtained in the bedrooms with door open during
sleeping periods
[106]1 office and 1 living
room (MV),Florida, US
September 2021, 1 week,10 min
Internet of Things(IoT) enabled sensors:
• Aosong Electronics, DHT22 sensor (T, RH)• Nova Fitness, SDS011 sensor (PM)• SPEC sensors (DGS- NO2 968-043, DGS-SO2
968-038, DGS-CO 968-034, DGS- O3 968-042)• Senseair K-30 CO2Meter• Ohmetech.io, uThing: VOCTM• Bosch BME680 air quality sensor
(Factory calibrated)
• Proposed IAQ monitoring system• Average indoor PM2.5, PM10, CO2 and O3 concentrations were higher in the
residential apartment compared to the office space• Average NO2, SO2, TVOC concentration were relatively similar at both sites• Strong positive correlation between SO2 and PM concentrations at both sites• RH level was significantly higher in the office compared to the apartment

Atmosphere 2022, 13, 191 37 of 43
Table A4. Cont.
Ref. Location Info(Ventilation)
Measurement Period,Duration, Resolution Sensing Equipment (Measured Parameters) Remarks
[107]
2 offices and1 educational
facility (MV), Delhi,India
June–July 2015, 8-h in adaily basis, 5 days/week,
5 min
Portable passive sampler:
• SKC Air pump 224-PCXR8 with PEM impactorSKC Incorporated, Eighty Four, USA (PM)
• UltraRAE3000 RAE Systems, USA(VOCs)(Factory calibrated)
Portable data logger:
• Q-Trak Indoor Air Quality monitor 7575 TSIIncorporated, Shoreview, USA (CO2)
(Additional calibration of all samplers by an elec-tronic calibrator)
• Investigation of IAQ in non-residential buildings and calculation of TotalHazard Ratio Indicator (THRI)
• Average indoor CO2 concentrations can vary due to sampling location, occu-pancy level or the proximity to a major pollutant outdoor source such as abusy road
• Elevated levels of PM2.5 due to ductless air conditioning systems and ineffi-cient air circulation
• Elevated VOCs due to large number of office equipment such as copiermachines and computers
[108]1 Shopping mall
(MV), Hong Kong,China
October 2017, 1 week,1 min
• Aerocet 831 Handheld Particle Counter andmodel 212 Ambient Particulate Profiler MetOne, Grants Pass, OR, USA (Outdoor, indoorPM)
• NO2-B4, CO-B4 Alphasense Ltd., Great Notley,UK (Outdoor, indoor NO2 and CO)
(Lab and field prerfomance tests)
• Quantification of the effect of outdoor air pollution on IAQ and investigationof the spatial heterogeneity of indoor air pollutants.
• Increased impact of outdoor air pollution on IAQ observed during mallopening hours. Specifically 75% of PM2.5, 53% of PM10, and 59% of NO2were estimated to had infiltrated into the mall.
• Increased concentrations of PM2.5 and CO were observed during the dinnerperiod.
• Considerable spatial variations were observed for PMs and NO2 near majorentrances and dining areas.
[109]
1 classroom,1 living room,
and 1 church (MV),Korea
(fall and winter season),N/A, N/A
Wireless Sensor Network
• DHT11 sensor (T, RH)• GP2Y1010AU0F, sensor(PM)• GSNT11 sensor (NO2)• SO2-AF sensor• T6613 sensor (CO2)• TGS5042 sensor (CO)• MiCS-2610 sensor (O3)• TGS2602 sensor (VOCs)
• Design and implementation of a WSN indoor air quality monitoring systembased on US-EPA standard
• Algorithms development in relation to smoothing, calibration and data ag-gregation
• On-site experiments for the assessment of the prototype system performancein 3 different indoor environments: living room, classroom, and church
• Possible influencing factors on IAQ were location, airflow, the people density,size of room, and different room materials
• Significant changes in temperature and RH led to the need for calibration

Atmosphere 2022, 13, 191 38 of 43
Table A4. Cont.
Ref. Location Info(Ventilation)
Measurement Period,Duration, Resolution Sensing Equipment (Measured Parameters) Remarks
[110]
Stadium, hotel,shopping centre,research centre,
commercial office,apartment,
detached villa(MV), Beijing,
China
Feb.–March 2014, 1 h,10 min
• TSI 8530 TSI Incorporated, Shoreview, USA(Outdoor, indoor PM)
• TSI 9545 TSI Incorporated, Shoreview, USA(Outdoor, indoor T, RH)
(Additional calibration—T, RH and PM)
• Comparison of indoor and outdoor concentrations of PM2.5• Study the effects of the ventilation systems and air cleaners on PM2.5 concen-
trations• Ventilation systems with air cleaning methods removed approximately 90%
of the outdoor PM2.5• Elevated indoor PM2.5 concentrations were observed in public buildings
compared to residential buildings• Outdoor PM2.5 concentrations were the main contributor of increased indoor
PM2.5 both in public and residential buildings
[111] One double storeybuilding, Malaysia N/A, N/A, 1 min
Wireless Sensor Network
• Figaro gas sensor (CO, CO2, VOC, CH4, chlo-rofluoro carbons, O2)
• GP2Y1010 optical dust sensor Sharp (PM)• HSM-20G sensor (T, RH)
• A web-based monitoring system for indication of IAQ parameters in realtime
• High concentration of VOCs observed at the chemical’s lab due to the releaseof different chemical compounds into the room air
Ventilation: Natural Ventilation (NV), Mechanical Ventilation (MV).

Atmosphere 2022, 13, 191 39 of 43
References1. Schweizer, C.; Edwards, R.D.; Bayer-Oglesby, L.; Gauderman, W.J.; Ilacqua, V.; Jantunen, M.J.; Lai, H.K.; Nieuwenhuijsen, M.;
Künzli, N. Indoor time–microenvironment–activity patterns in seven regions of Europe. J. Expo. Sci. Environ. Epidemiol. 2007,17, 170–181, doi:10.1038/sj.jes.7500490.
2. Cincinelli, A.; Martellini, T. Indoor air quality and health. Int. J. Environ. Res. Public Health 2017, 14, 1286, doi:10.3390/ijerph14111286.3. Persily, A.K.; Emmerich, S.J. Indoor air quality in sustainable, energy efficient buildings. Hvac&R Res. 2012, 18, 4–20.4. World Health Organization (WHO). Household Air Pollution. Available online: https://www.who.int/data/gho/data/themes/
topics/topic-details/GHO/household-air-pollution (accessed on 06 September 2021).5. Chafe, Z.A.; Brauer, M.; Klimont, Z.; Van Dingenen, R.; Mehta, S.; Rao, S.; Riahi, K.; Dentener, F.; Smith, K.R. Household
cooking with solid fuels contributes to ambient PM2. 5 air pollution and the burden of disease. Environ. Health Perspect. 2014,122, 1314–1320.
6. Woo, J.M.; Postolache, T.T. The impact of work environment on mood disorders and suicide: Evidence and implications. Int. J.Disabil. Hum. Dev. 2008, 7, 185–200, doi:10.1515/ijdhd.2008.7.2.185.
7. Burge, P.S. Sick building syndrome. Occup. Environ. Med. 2004, 61, 185–190, doi:10.1136/oem.2003.008813.8. Fisk, W.J.; Black, D.; Brunner, G. Changing ventilation rates in US offices: Implications for health, work performance, energy, and
associated economics. Build. Environ. 2012, 47, 368–372, doi:10.1016/j.buildenv.2011.07.001.9. Chapter Introductory Chapter: Indoor Environmental Quality. In Muhammad Abdul Mujeebu; Intech Open: London, UK, 2019;
pp. 1–13, doi:10.5772/intechopen.83612.10. Shan, X.; Melina, A.N.; Yang, E.H. Impact of indoor environmental quality on students’ wellbeing and performance in educational
building through life cycle costing perspective. J. Clean. Prod. 2018, 204, 298–309, doi:10.1016/j.jclepro.2018.09.002.11. Spengler, J.D.; Chen, Q. Indoor air quality factors in designing a healthy building. Annu. Rev. Energy Environ. 2000, 25, 567–600,
doi:10.1146/annurev.energy.25.1.567.12. Altomonte, S.; Saadouni, S.; Kent, M.G.; Schiavon, S. Satisfaction with indoor environmental quality in BREEAM and non-
BREEAM certified office buildings. Archit. Sci. Rev. 2017, 60, 343–355, doi:10.1080/00038628.2017.1336983.13. Steinemann, A.; Wargocki, P.; Rismanchi, B. Ten questions concerning green buildings and indoor air quality. Build. Environ.
2017, 112, 351–358, doi:10.1016/j.buildenv.2016.11.010.14. Holmgren, M.; Kabanshi, A.; Sörqvist, P. Occupant perception of “green” buildings: Distinguishing physical and psychological
factors. Build. Environ. 2017, 114, 140–147, doi:10.1016/j.buildenv.2016.12.017.15. Crawley, D.; Pless, S.; Torcellini, P. Getting to net zero. ASHRAE J. 2009, 51, 18.16. Becchio, C.; Bottero, M.; Corgnati, S.; Ghiglione, C. nZEB design: Challenging between energy and economic targets. Energy
Procedia 2015, 78, 2070–2075, doi:10.1016/j.egypro.2015.11.226.17. Chastas, P.; Theodosiou, T.; Bikas, D. Embodied energy in residential buildings-towards the nearly zero energy building:
A literature review. Build. Environ. 2016, 105, 267–282, doi:10.1016/j.buildenv.2016.05.040.18. BREEAM. BREEAM—Sustainability Assessment Method. Available online: https://www.breeam.com/ (accessed on 10
September 2021).19. LEED. LEED Rating System. Available online: https://www.usgbc.org/leed (accessed on 10 September 2021).20. GreenStar. Exploring Green Star. Available online: https://new.gbca.org.au/green-star/exploring-green-star/ (accessed on 10
September 2021).21. Franchimon, F.; Dijken, F.; Pernot, C.; van Bronswijk, J. Air-exchange rate under debate. In Proceedings of the 9th International
Conference and Exhibition—Healthy Buildings 2009, HB 2009, Syracuse, NY, USA, 13–17 September 2009.22. Tran, V.V.; Park, D.; Lee, Y.C. Indoor air pollution, related human diseases, and recent trends in the control and improvement of
indoor air quality. Int. J. Environ. Res. Public Health 2020, 17, 2927, doi:10.3390/ijerph17082927.23. ANSI/ASHRAE Standard 55-2020 Thermal Environmental Conditions for Human Occupancy. In American Society of Heating,
Refrigerating and Air-Conditioning Engineering (ASHRAE); ASHRAE: Atlanta, GA, USA, 2021.24. Astolfi, A.; Pellerey, F. Subjective and objective assessment of acoustical and overall environmental quality in secondary school
classrooms. J. Acoust. Soc. Am. 2008, 123, 163–173, doi:10.1121/1.2816563.25. Puglisi, G.; Cutiva, L.C.; Pavese, L.; Castellana, A.; Bona, M.; Fasolis, S.; Lorenzatti, V.; Carullo, A.; Burdorf, A.; Bronuzzi,
F.; et al. Acoustic comfort in high-school classrooms for students and teachers. Energy Procedia 2015, 78, 3096–3101,doi:10.1016/j.egypro.2015.11.763.
26. Montiel, I.; Mayoral, A.M.; Navarro Pedreño, J.; Maiques, S. Acoustic comfort in learning spaces: Moving towards sustainabledevelopment goals. Sustainability 2019, 11, 3573, doi:10.3390/su11133573.
27. Galasiu, A.D.; Veitch, J.A. Occupant preferences and satisfaction with the luminous environment and control systems in daylitoffices: A literature review. Energy Build. 2006, 38, 728–742, doi:10.1016/j.enbuild.2006.03.001.
28. British Standard Institution. BS EN 12464-1:2021 Light and Lighting. Lighting of Work Places Indoor Work Places. Available online:https://www.en-standard.eu/bs-en-12464-1-2021-light-and-lighting-lighting-of-work-places-indoor-work-places/ (accessedon 10 September 2021).

Atmosphere 2022, 13, 191 40 of 43
29. Almeida, R.M.; De Freitas, V.P.; Delgado, J.M. School Buildings Rehabilitation: Indoor Environmental Quality and Enclosure Optimiza-tion; Springer: Berlin/Heidelberg, Germany, 2015.
30. Mujan, I.; Andelkovic, A.S.; Muncan, V.; Kljajic, M.; Ružic, D. Influence of indoor environmental quality on human health andproductivity-A review. J. Clean. Prod. 2019, 217, 646–657, doi:10.1016/j.jclepro.2019.01.307.
31. Frontczak, M.; Wargocki, P. Literature survey on how different factors influence human comfort in indoor environments. Build.Environ. 2011, 46, 922–937, doi:10.1016/j.buildenv.2010.10.021.
32. Arif, M.; Katafygiotou, M.; Mazroei, A.; Kaushik, A.; Elsarrag, E. Impact of indoor environmental quality on occupant well-beingand comfort: A review of the literature. Int. J. Sustain. Built Environ. 2016, 5, 1–11, doi:10.1016/j.ijsbe.2016.03.006.
33. Mannan, M.; Al-Ghamdi, S.G. Indoor Air Quality in Buildings: A Comprehensive Review on the Factors Influencing Air Pollutionin Residential and Commercial Structure. Int. J. Environ. Res. Public Health 2021, 18, 3276, doi:10.3390/ijerph18063276.
34. d’Ambrosio Alfano, F.R.; Ficco, G.; Frattolillo, A.; Palella, B.I.; Riccio, G. Mean Radiant Temperature Measurements throughSmall Black Globes under Forced Convection Conditions. Atmosphere 2021, 12, 621, doi:10.3390/atmos12050621.
35. British Standard Institution. BS EN ISO 7730:2005 Ergonomics of the Thermal Environment—Analytical Determination and Interpretationof Thermal Comfort Using Calculation of the PMV and PPD Indices and Local Thermal Comfort Criteria; British Standard Institution:London, UK, 2005.
36. d’Ambrosio Alfano, F.R.; Olesen, B.W.; Palella, B.I.; Pepe, D.; Riccio, G. Fifty years of PMV model: Reliability, implementationand design of software for its calculation. Atmosphere 2020, 11, 49.
37. British Standard Institution. Bs en 15251:2007 Indoor Environmental Input Parameters for Design and Assessment of Energy Performanceof Buildings Addressing Indoor Air Quality, Thermal Environment,Lighting and Acoustics; British Standard Institution: London, UK,2008.
38. Klepeis, N.E.; Nelson, W.C.; Ott, W.R.; Robinson, J.P.; Tsang, A.M.; Switzer, P.; Behar, J.V.; Hern, S.C.; Engelmann, W.H. TheNational Human Activity Pattern Survey (NHAPS): A resource for assessing exposure to environmental pollutants. J. Expo. Sci.Environ. Epidemiol. 2001, 11, 231–252, doi:10.1038/sj.jea.7500165.
39. Adgate, J.L.; Church, T.R.; Ryan, A.D.; Ramachandran, G.; Fredrickson, A.L.; Stock, T.H.; Morandi, M.T.; Sexton, K. Outdoor,indoor, and personal exposure to VOCs in children. Environ. Health Perspect. 2004, 112, 1386–1392, doi:10.1289/ehp.7107.
40. Rodes, C.E.; Lawless, P.A.; Thornburg, J.W.; Williams, R.W.; Croghan, C.W. DEARS particulate matter relationshipsfor personal, indoor, outdoor, and central site settings for a general population. Atmos. Environ. 2010, 44, 1386–1399,doi:10.1016/j.atmosenv.2010.02.002.
41. Meng, Q.Y.; Spector, D.; Colome, S.; Turpin, B. Determinants of indoor and personal exposure to PM2.5 of indoor and outdoororigin during the RIOPA study. Atmos. Environ. 2009, 43, 5750–5758, doi:10.1016/j.atmosenv.2009.07.066.
42. Levin, H. Indoor air pollutants. Part 1: General description of pollutants, levels and standards. Vent. Inf. Pap. 2003, 2, 12.43. Parajuli, I.; Lee, H.; Shrestha, K.R. Indoor air quality and ventilation assessment of rural mountainous households of Nepal. Int.
J. Sustain. Built Environ. 2016, 5, 301–311, doi:10.1016/j.ijsbe.2016.08.003.44. Freijer, J.I.; Bloemen, H.J.T. Modeling relationships between indoor and outdoor air quality. J. Air Waste Manag. Assoc. 2000,
50, 292–300, doi:10.1080/10473289.2000.10464007.45. Sundell, N.; Andersson, L.M.; Brittain-Long, R.; Lindh, M.; Westin, J. A four year seasonal survey of the relationship between
outdoor climate and epidemiology of viral respiratory tract infections in a temperate climate. J. Clin. Virol. 2016, 84, 59–63,doi:10.1016/j.jcv.2016.10.005.
46. Lu, C.; Deng, Q.; Li, Y.; Sundell, J.; Norbäck, D. Outdoor air pollution, meteorological conditions and indoor factors indwellings in relation to Sick Building Syndrome (SBS) among adults in China. Sci. Total Environ. 2016, 560, 186–196,doi:10.1016/j.scitotenv.2016.04.033.
47. Settimo, G.; Manigrasso, M.; Avino, P. Indoor air quality: A focus on the European legislation and state-of-the-art research inItaly. Atmosphere 2020, 11, 370, doi:10.3390/atmos11040370.
48. World Health Organization. WHO Guidelines for Indoor Air Quality: Selected Pollutants; World Health Organization, RegionalOffice for Europe: Copenhagen, Denmark, 2010.
49. RESET® Air. Available online: https://www.reset.build/standard/air (accessed on 22 July 2021).50. Atmo Indoor Environmental Monitoring. Available online: https://atmotube.de/pages/atmocube?view=en (accessed on 22 July
2021).51. Lu, J.; Gu, J.; Li, K.; Xu, C.; Su, W.; Lai, Z.; Zhou, D.; Yu, C.; Xu, B.; Yang, Z. COVID-19 Outbreak Associated with Air Conditioning
in Restaurant, Guangzhou, China, 2020. Emerg. Infect. Dis. 2020, 26, 1628–1631, doi:10.3201/eid2607.200764.52. Hamner, L. High SARS-CoV-2 attack rate following exposure at a choir practice—Skagit County, Washington, March 2020.
MMWR. Morb. Mortal. Wkly. Rep. 2020, 69, 606–610, doi:10.15585/mmwr.mm6919e6.53. Günther, T.; Czech-Sioli, M.; Indenbirken, D.; Robitaille, A.; Tenhaken, P.; Exner, M.; Ottinger, M.; Fischer, N.; Grundhoff, A.;
Brinkmann, M.M. SARS-CoV-2 outbreak investigation in a German meat processing plant. EMBO Mol. Med. 2020, 12, e13296,doi:10.15252/emmm.202013296.
54. Yao, Y.; Pan, J.; Wang, W.; Liu, Z.; Kan, H.; Qiu, Y.; Meng, X.; Wang, W. Association of particulate matter pollution and casefatality rate of COVID-19 in 49 chinese cities. Sci. Total Environ. 2020, 741, 140396, doi:10.1016/j.scitotenv.2020.140396.
55. Zhu, Y.; Xie, J.; Huang, F.; Cao, L. Association between short-term exposure to air pollution and COVID-19 infection: Evidencefrom China. Sci. Total Environ. 2020, 727, 138704, doi:10.1016/j.scitotenv.2020.138704.

Atmosphere 2022, 13, 191 41 of 43
56. Li, H.; Xu, X.L.; Dai, D.W.; Huang, Z.Y.; Ma, Z.; Guan, Y.J. Air pollution and temperature are associated with increased COVID-19incidence: A time series study. Int. J. Infect. Dis. 2020, 97, 278–282, doi:10.1016/j.ijid.2020.05.076.
57. Setti, L.; Passarini, F.; De Gennaro, G.; Barbieri, P.; Perrone, M.G.; Borelli, M.; Palmisani, J.; Di Gilio, A.; Torboli, V.; Fontana, F.; etal. SARS-Cov-2RNA found on particulate matter of Bergamo in Northern Italy: First evidence. Environ. Res. 2020, 188, 109754,doi:10.1016/j.envres.2020.109754.
58. Setti, L.; Passarini, F.; De Gennaro, G.; Barbieri, P.; Pallavicini, A.; Ruscio, M.; Piscitelli, P.; Colao, A.; Miani, A. Searching forSARS-COV-2 on particulate matter: A possible early indicator of COVID-19 epidemic recurrence. Int. J. Environ. Res. Public Health2020, 17, 2986, doi:10.3390/ijerph17092986.
59. Van Doremalen, N.; Bushmaker, T.; Munster, V. Stability of Middle East respiratory syndrome coronavirus (MERS-CoV) underdifferent environmental conditions. Eurosurveillance 2013, 18, 20590, doi:10.2807/1560-7917.es2013.18.38.20590.
60. Pyankov, O.V.; Bodnev, S.A.; Pyankova, O.G.; Agranovski, I.E. Survival of aerosolized coronavirus in the ambient air. J. AerosolSci. 2018, 115, 158–163, doi:10.1016/j.jaerosci.2017.09.009.
61. Van Doremalen, N.; Bushmaker, T.; Morris, D.H.; Holbrook, M.G.; Gamble, A.; Williamson, B.N.; Tamin, A.; Harcourt, J.L.;Thornburg, N.J.; Gerber, S.I.; others. Aerosol and surface stability of SARS-CoV-2 as compared with SARS-CoV-1. N. Engl. J. Med.2020, 382, 1564–1567, doi:10.1056/nejmc2004973.
62. Riley, E.; Murphy, G.; Riley, R. Airborne spread of measles in a suburban elementary school. Am. J. Epidemiol. 1978, 107, 421–432.63. Fennelly, K.P.; Nardell, E.A. The relative efficacy of respirators and room ventilation in preventing occupational tuberculosis.
Infect. Control Hosp. Epidemiol. 1998, 19, 754–759.64. Dai, H.; Zhao, B. Association of the infection probability of COVID-19 with ventilation rates in confined spaces. In Building
Simulation; Springer: Berlin/Heidelberg, Germany, 2020; Volume 13, pp. 1321–1327, doi:10.1007/s12273-020-0703-5.65. Rudnick, S.; Milton, D. Risk of indoor airborne infection transmission estimated from carbon dioxide concentration. Indoor Air
2003, 13, 237–245.66. RESET. Initiative RESET® Viral Index. Available online: https://reset.build/programs/initiatives/RESETViralIndex (accessed
on 22 July 2021).67. AIRTHINGS. Virus Risk Indicator. Available online: https://www.airthings.com/business/virus-risk (accessed on 17 March
2021).68. Harvard Healthy Buildings ACH-CO2 Tool. Available online: https://docs.google.com/spreadsheets/d/1wG0dO0Su7
5iBuUCmY5WpfYtQlTKbQ1UzJOeBVbDxJks/edit?usp=sharing (accessed on 06 May 2021).69. 5-step guide to checking ventilation rates in classrooms. Harvard Healthy Buildings Program. Available online: https://schools.
forhealth.org/ventilation-guide/ (accessed on 23 December 2021).70. CoronaSense Project (SEED-COVID/0420/0026): Indoor Air Quality Monitoring for COVID-19. Available online: https:
//lelantusinnovations.com/lelantus-project/coronasense/ (accessed on 01 February 2021).71. Mandin, C.; Trantallidi, M.; Cattaneo, A.; Canha, N.; Mihucz, V.G.; Szigeti, T.; Mabilia, R.; Perreca, E.; Spinazzè, A.; Fossati, S.; et
al. Assessment of indoor air quality in office buildings across Europe–The OFFICAIR study. Sci. Total Environ. 2017, 579, 169–178,doi:10.1016/j.scitotenv.2016.10.238.
72. Choi, J.H.; Loftness, V.; Aziz, A. Post-occupancy evaluation of 20 office buildings as basis for future IEQ standards and guidelines.Energy Build. 2012, 46, 167–175, doi:10.1016/j.enbuild.2011.08.009.
73. Torresani, W.; Battisti, N.; Maglione, A.; Brunelli, D.; Macii, D. A multi-sensor wireless solution for indoor thermal comfortmonitoring. In Proceedings of the 2013 IEEE Workshop on Environmental Energy and Structural Monitoring Systems, Trento,Italy; 11–12 September 2013; pp. 1–6, doi:10.1109/eesms.2013.6661697.
74. Tiele, A.; Esfahani, S.; Covington, J. Design and development of a low-cost, portable monitoring device for indoor environmentquality. J. Sensor. 2018, 2018, 5353816, doi:10.1155/2018/5353816.
75. Sun, Z.; Wang, S.; Ma, Z. In situ implementation and validation of a CO2-based adaptive demand-controlled ventilation strategyin a multi-zone office building. Build. Environ. 2011, 46, 124–133, doi:10.1016/j.buildenv.2010.07.008.
76. Saraga, D.; Maggos, T.; Sadoun, E.; Fthenou, E.; Hassan, H.; Tsiouri, V.; Karavoltsos, S.; Sakellari, A.; Vasilakos, C.; Kakosimos, K.Chemical characterization of indoor and outdoor particulate matter (PM2.5, PM10) in Doha, Qatar. Aerosol Air Qual. Res 2017,17, 1156–1168, doi:10.4209/aaqr.2016.05.0198.
77. Gaihre, S.; Semple, S.; Miller, J.; Fielding, S.; Turner, S. Classroom carbon dioxide concentration, school attendance, andeducational attainment. J. Sch. Health 2014, 84, 569–574, doi:10.1111/josh.12183.
78. Coley, D.A.; Greeves, R.; Saxby, B.K. The effect of low ventilation rates on the cognitive function of a primary school class. Int. J.Vent. 2007, 6, 107–112, doi:10.1080/14733315.2007.11683770.
79. Wang, S.; Chew, S.; Jusoh, M.T.; Khairunissa, A.; Leong, K.Y.; Azid, A. WSN based indoor air quality monitoring in class-rooms. In Proceedings of the AIP Conference Proceedings, Penang, Malaysia, 16–18 November 2015; Volume 1808, p. 020063,doi:10.1063/1.4975296.
80. De Giuli, V.; Da Pos, O.; De Carli, M. Indoor environmental quality and pupil perception in Italian primary schools. Build.Environ. 2012, 56, 335–345, doi:10.1016/j.buildenv.2012.03.024.
81. Baloch, R.M.; Maesano, C.N.; Christoffersen, J.; Banerjee, S.; Gabriel, M.; Csobod, É.; de Oliveira Fernandes, E.; Annesi-Maesano,I.; Szuppinger, P.; Prokai, R.; et al. Indoor air pollution, physical and comfort parameters related to schoolchildren’s health: Datafrom the European SINPHONIE study. Sci. Total Environ. 2020, 739, 139870, doi:10.1016/j.scitotenv.2020.139870.
https://docs.google.com/spreadsheets/d/1wG0dO0Su75iBuUCmY5WpfYtQlTKbQ1UzJOeBVbDxJks/edit?usp=sharing

Atmosphere 2022, 13, 191 42 of 43
82. Haverinen-Shaughnessy, U.; Shaughnessy, R.J.; Cole, E.C.; Toyinbo, O.; Moschandreas, D.J. An assessment of indoorenvironmental quality in schools and its association with health and performance. Build. Environ. 2015, 93, 35–40,doi:10.1016/j.buildenv.2015.03.006.
83. Cao, G. Infection probability of COVID-19 in a large lecture room with mechanical ventilation. REHVA Eur. HVAC J. 2021,58, 51–54.
84. Erlandson, G.; Magzamen, S.; Carter, E.; Sharp, J.L.; Reynolds, S.J.; Schaeffer, J.W. Characterization of indoor air quality on acollege campus: A pilot study. Int. J. Environ. Res. Public Health 2019, 16, 2721, doi:10.3390/ijerph16152721.
85. Peng, Z.; Deng, W.; Tenorio, R. Investigation of indoor air quality and the identification of influential factors at primary schoolsin the North of China. Sustainability 2017, 9, 1180, doi:10.3390/su9071180.
86. Yang, W.; Sohn, J.; Kim, J.; Son, B.; Park, J. Indoor air quality investigation according to age of the school buildings in Korea. J.Environ. Manag. 2009, 90, 348–354, doi:10.1016/j.jenvman.2007.10.003.
87. Attaianese, E.; d’Ambrosio Alfano, F.R.; Palella, B.I.; Pepe, D.; Vanacore, R. An Integrated Methodology of Subjective Investigationfor a Sustainable Indoor Built Environment. The Case Study of a University Campus in Italy. Atmosphere 2021, 12, 1272,doi:10.3390/atmos12101272.
88. Mumovic, D.; Palmer, J.; Davies, M.; Orme, M.; Ridley, I.; Oreszczyn, T.; Judd, C.; Critchlow, R.; Medina, H.; Pilmoor, G.; et al.Winter indoor air quality, thermal comfort and acoustic performance of newly built secondary schools in England. Build. Environ.2009, 44, 1466–1477, doi:10.1016/j.buildenv.2008.06.014.
89. Rosbach, J.; Krop, E.; Vonk, M.; van Ginkel, J.; Meliefste, C.; de Wind, S.; Gehring, U.; Brunekreef, B. Classroom ventilation andindoor air quality—results from the FRESH intervention study. Indoor Air 2015, 26, 538–545, doi:10.1111/ina.12231.
90. Argunhan, Z.; Avci, A.S. Statistical evaluation of indoor air quality parameters in classrooms of a university. Adv. Meteorol. 2018,2018, doi:10.1155/2018/4391579.
91. Abdel-Salam, M.M. Investigation of indoor air quality at urban schools in Qatar. Indoor Built Environ. 2019, 28, 278–288.92. Stranger, M.; Potgieter-Vermaak, S.; Van Grieken, R. Characterization of indoor air quality in primary schools in Antwerp,
Belgium. Indoor Air 2008, 18, 454–463, doi:10.1111/j.1600-0668.2008.00545.x.93. Fadeyi, M.O.; Alkhaja, K.; Sulayem, M.B.; Abu-Hijleh, B. Evaluation of indoor environmental quality conditions in elementary
schools classrooms in the United Arab Emirates. Front. Archit. Res. 2014, 3, 166–177, doi:10.1016/j.foar.2014.03.001.94. Konstantinou, C.; Constantinou, A.; Kleovoulou, E.; Kyriacou, A.; Milis, G.; Kakoulli, C.; Andrianou, X.; Michaelides, M.; Makris,
K. Assessment of Indoor and Outdoor Air Quality in Primary Schools of Cyprus during the 2021 COVID-19 Pandemic Measures; TechnicalReport; Cyprus International Institute for Environmental and Public Health (CII), Cyprus University of Technology: Limassol,Cyprus, 2021.
95. Pitarma, R.; Marques, G.; Ferreira, B.R. Monitoring indoor air quality for enhanced occupational health. J. Med. Syst. 2017,41, 1–8, doi:10.1007/s10916-016-0667-2.
96. Jo, J.; Jo, B.; Kim, J.; Kim, S.; Han, W. Development of an IoT-based indoor air quality monitoring platform. J. Sensors 2020, 2020,doi:10.1155/2020/8749764.
97. Rösch, C.; Kohajda, T.; Röder, S.; von Bergen, M.; Schlink, U. Relationship between sources and patterns of VOCs in indoor air.Atmos. Pollut. Res. 2014, 5, 129–137, doi:10.5094/apr.2014.016.
98. Yang, S.; Perret, V.; Hager Jörin, C.; Niculita-Hirzel, H.; Goyette Pernot, J.; Licina, D. Volatile organic compounds in 169energy-efficient dwellings in Switzerland. Indoor Air 2020, 30, 481–491, doi:10.1111/ina.12667.
99. Feriadi, H.; Wong, N.H. Thermal comfort for naturally ventilated houses in Indonesia. Energy Build. 2004, 36, 614–626,doi:10.1016/j.enbuild.2004.01.011.
100. Lu, S.; Pang, B.; Qi, Y.; Fang, K. Field study of thermal comfort in non-air-conditioned buildings in a tropical island climate. Appl.Ergon. 2018, 66, 89–97, doi:10.1016/j.apergo.2017.08.008.
101. Lee, S.C.; Li, W.M.; Ao, C.H. Investigation of indoor air quality at residential homes in Hong Kong–case study. Atmos. Environ.2002, 36, 225–237, doi:10.1016/s1352-2310(01)00435-6.
102. Alhmiedat, T.; Samara, G. A low cost ZigBee sensor network architecture for indoor air quality monitoring. Int. J. Comput. Sci.Inf. Secur. (IJCSIS) 2017, 15, 140–144.
103. Chiang, C.M.; Chou, P.C.; Lai, C.M.; Li, Y.Y. A methodology to assess the indoor environment in care centers for senior citizens.Build. Environ. 2001, 36, 561–568, doi:10.1016/s0360-1323(00)00024-x.
104. Zhan, H.; Yu, J.; Yu, R. Assessment of older adults’ acceptance of IEQ in nursing homes using both subjective and objectivemethods. Build. Environ. 2021, 108063, doi:10.1016/j.buildenv.2021.108063.
105. Serrano-Jiménez, A.; Lizana, J.; Molina-Huelva, M.; Barrios-Padura, Á. Indoor environmental quality in social housing with elderlyoccupants in Spain: Measurement results and retrofit opportunities. J. Build. Eng. 2020, 30, 101264, doi:10.1016/j.jobe.2020.101264.
106. Zhang, H.; Srinivasan, R.; Ganesan, V. Low cost, multi-pollutant sensing system using raspberry pi for indoor air qualitymonitoring. Sustainability 2021, 13, 370, doi:10.3390/su13010370.
107. Datta, A.; Suresh, R.; Gupta, A.; Singh, D.; Kulshrestha, P. Indoor air quality of non-residential urban buildings in Delhi, India.Int. J. Sustain. Built Environ. 2017, 6, 412–420, doi:10.1016/j.ijsbe.2017.07.005.
108. Li, A.T.Y.; Che, W.; Song, Y.; Tong, J.C.K.; Lau, A.K.H. Exposure to Particles and Gases in a Shopping Mall: Spatial Heterogeneityand Outdoor Infiltration. Atmosphere 2021, 12, 1313, doi:10.3390/atmos12101313.

Atmosphere 2022, 13, 191 43 of 43
109. Kim, J.Y.; Chu, C.H.; Shin, S.M. ISSAQ: An integrated sensing systems for real-time indoor air quality monitoring. IEEE Sensor. J.2014, 14, 4230–4244, doi:10.1109/jsen.2014.2359832.
110. Deng, G.; Li, Z.; Wang, Z.; Gao, J.; Xu, Z.; Li, J.; Wang, Z. Indoor/outdoor relationship of PM2.5 concentration in typical buildingswith and without air cleaning in Beijing. Indoor Built Environ. 2017, 26, 60–68, doi:10.1177/1420326X15604349.
111. Saad, S.M.; Saad, A.R.M.; Kamarudin, A.M.Y.; Zakaria, A.; Shakaff, A.Y.M. Indoor air quality monitoring system using WirelessSensor Network (WSN) with web interface. In Proceedings of the 2013 International Conference on Electrical, Electronics andSystem Engineering (ICEESE), Piscataway, NJ, USA, 4–5 December 2013; pp. 60–64, doi:10.1109/iceese.2013.6895043.
112. TSI Incorporated, Shoreview, USA. Available online: https://tsi.com/home/ (accessed on 30 August 2021).113. GrayWolf Sensing Solutions. Available online: https://graywolfsensing.com/ (accessed on 30 August 2021).114. Bertin Instruments. Available online: https://www.bertin-instruments.com/ (accessed on 30 August 2021).115. Hadi-Vencheh, A.; Tan, Y.; Wanke, P.; Loghmanian, S.M. Air Pollution Assessment in China: A Novel Group Multiple Criteria
Decision Making Model under Uncertain Information. Sustainability 2021, 13, 1686, doi:10.3390/su13041686.116. Eliades, D.; Michaelides, M.; Panayiotou, C.; Polycarpou, M. Security-oriented sensor placement in intelligent buildings. Build.
Environ. 2013, 63, 114–121, doi:10.1016/j.buildenv.2013.02.006.117. Michaelides, M.; Reppa, V.; Christodoulou, M.; Panayiotou, C.; Polycarpou, M. Contaminant event monitoring in multi-zone
buildings using the state-space method. Build. Environ. 2014, 71, 140–152, doi:10.1016/j.buildenv.2013.09.019.118. Kyriacou, A.; Timotheou, S.; Michaelides, M.; Panayiotou, C.; Polycarpou, M. Partitioning of intelligent buildings for distributed
contaminant detection and isolation. IEEE Trans. Emerg. Top. Comput. Intell. 2017, 1, 72–86.119. Kyriacou, A.; Michaelides, M.P.; Reppa, V.; Timotheou, S.; Panayiotou, C.G.; Polycarpou, M.M. Distributed contaminant detection
and isolation for intelligent buildings. IEEE Trans. Control Syst. Technol. 2017, 26, 1925–1941.120. Boracchi, G.; Michaelides, M.; Roveri, M. A Cognitive Monitoring System for Detecting and Isolating Contaminants and Faults in
Intelligent Buildings. IEEE Trans. Syst. Man, Cybern. Syst. 2018, 48, 433–447, doi:10.1109/TSMC.2016.2608419.121. Kyriacou, A.; Michaelides, M.P.; Eliades, D.G.; Panayiotou, C.G.; Polycarpou, M.M. COMOB: A MATLAB toolbox for sensor
placement and contaminant event monitoring in multi-zone buildings. Build. Environ. 2019, 154, 348–361.122. ANSI/ASHRAE Standard 55-2017 Thermal Environmental Conditions for Human Occupancy. In American Society of Heating,
Refrigerating and Air-Conditioning Engineering (ASHRAE); ASHRAE: Atlanta, GA, USA, 2020.123. United States Environmental Protection Agency (EPA). Available online: https://www.epa.gov/mold/mold-course-chapter-2#
Chapter2Lesson3 (accessed on 22 September 2021).124. ANSI/ASHRAE Standard 62.1-2019 Ventilation for Acceptable Indoor Air Quality. In American Society of Heating, Refrigerating
and Air-Conditioning Engineering (ASHRAE); ASHRAE: Atlanta, GA, USA, 2019.125. American Society of Heating, Refrigerating and Air-Conditioning Engineering (ASHRAE). ASHRAE Epidemic Task Force:
Schools & Universities. Available online: https://www.ashrae.org/filelibrary/technicalresources/covid-19/ashrae-reopening-schools-and-universities-c19-guidance.pdf (accessed on 06 May 2021).
126. Berglund, B.; Lindvall, T.; Schwela, D.H. New WHO guidelines for community noise. Noise Vib. Worldw. 2000, 31, 24–29,doi:10.1260/0957456001497535.
127. World Health Organization. WHO Global Air Quality Guidelines: Particulate Matter (PM2.5 and PM10), Ozone, Nitrogen Dioxide,Sulfur Dioxide and Carbon Monoxide; World Health Organization, Regional Office for Europe: Bonn, Germany, 2021.
128. American Conference of Governmental Industrial Hygienists (ACGIH). TLVs ® and BEIs ®: Threshold Limit Values for ChemicalSubstances and Biological Exposure Indices; ACGIH: Cincinnati, OH, USA; 2005.
129. European Centre for Disease Prevention and Control (ECDC). Heating, Ventilation and Air-Conditioning Systems in the Context ofCOVID-19; Technical Report; ECDC: Stockholm, Sweden; 2020.
130. World Health Organization (WHO). WHO Handbook on Indoor Radon: A Public Health Perspective; WHO: Geneva, Switzerland,2009.
131. European Union Council. COUNCIL DIRECTIVE 2013/59/EURATOM. In Official Journal of the European Union; European UnionCouncil: Brussels, Belgium, 2014.
132. United States Environmental Protection Agency (EPA). What is EPA’s Action Level for Radon and What Does It Mean? Availableonline: https://www.epa.gov/radon/what-epas-action-level-radon-and-what-does-it-mean (accessed on 22 September 2021).
133. International Commission on Radiological Protection (ICRP). Summary of ICRP Recommendations on Radon. Available online:http://www.icrpaedia.org/images/f/fd/ICRPRadonSummary.pdf (accessed on 06 September 2021).
134. Harrison, J.; Marsh, J. ICRP recommendations on radon. Ann. ICRP 2020, 49, 68–76, doi:10.1177/0146645320931974.
Related Documents