A Review of developments in The Global & Indian Steel Industry Monthly edition Issue No. 40 July 2019 (Covering June 2019) Compiled on behalf of Indian Steel Association, By Mr. Anup Kashyap, Deputy Manager-Technical Strictly for Internal circulation

Welcome message from author
This document is posted to help you gain knowledge. Please leave a comment to let me know what you think about it! Share it to your friends and learn new things together.
Transcript

A Review of developments in
The Global & Indian Steel Industry
Monthly edition
Issue No. 40
July 2019 (Covering June 2019)
Compiled on behalf of Indian Steel Association,
By Mr. Anup Kashyap,
Deputy Manager-Technical
Strictly for Internal circulation

About the Report
❑ The Indian Steel Association introduced a monthly report titled ‘A REVIEW
OF DEVELOPMENTS IN GLOBAL & INDIAN STEEL INDUSTRY’, from August
2016.
❑ The report provides general background information reviewing the status
of the developments in the global and Indian steel industry, pertaining to
raw material, production & consumption, trade, shipping, pricing &
forecasts, country reportage, policy developments, economic parameters
etc.
❑ The consistent format of the report provides an insight into the relevant
aspects of steel scenario globally and domestically .
❑ The information has been sourced from independent third party databases,
knowledge sources and news reports, and the authenticity of the same has
not been independently verified by ISA.
❑ The report is issued in the last week of each month to the members of
Indian Steel Association , various ministries / departments / institutions.

Contents of the Report
SI.
No
Title Page
Number
1. Global Economic Development 04 - 06
2. Global Steel Development 07 - 13
3. Domestic Steel Development 14 - 18
4. Indian Economic Development 19 - 22
5. About ISA 23 - 29

GLOBAL ECONOMIC DEVELOPMENTS
4
Source: Global Forecasting Service
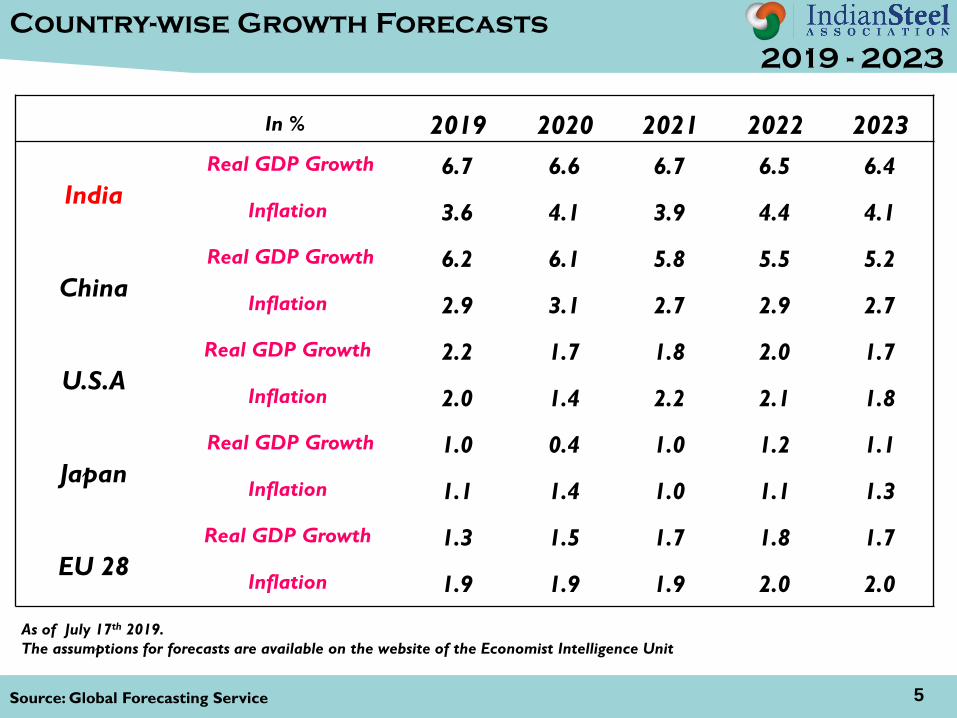
Country-wise Growth Forecasts
2019 - 2023
As of July 17th 2019.
The assumptions for forecasts are available on the website of the Economist Intelligence Unit
In % 2019 2020 2021 2022 2023
India
Real GDP Growth 6.7 6.6 6.7 6.5 6.4
Inflation 3.6 4.1 3.9 4.4 4.1
China
Real GDP Growth 6.2 6.1 5.8 5.5 5.2
Inflation 2.9 3.1 2.7 2.9 2.7
U.S.A
Real GDP Growth 2.2 1.7 1.8 2.0 1.7
Inflation 2.0 1.4 2.2 2.1 1.8
Japan
Real GDP Growth 1.0 0.4 1.0 1.2 1.1
Inflation 1.1 1.4 1.0 1.1 1.3
EU 28
Real GDP Growth 1.3 1.5 1.7 1.8 1.7
Inflation 1.9 1.9 1.9 2.0 2.0
5
Source: Interntional Monetary Fund-Report published in July 2019 6
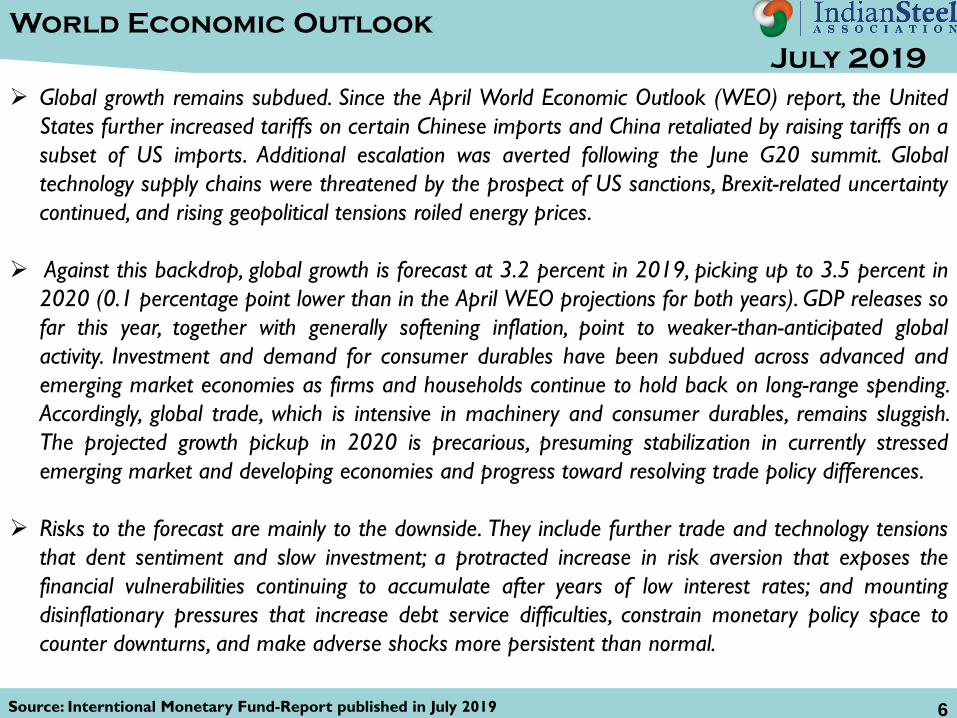
World Economic Outlook
July 2019
➢ Global growth remains subdued. Since the April World Economic Outlook (WEO) report, the United
States further increased tariffs on certain Chinese imports and China retaliated by raising tariffs on a
subset of US imports. Additional escalation was averted following the June G20 summit. Global
technology supply chains were threatened by the prospect of US sanctions, Brexit-related uncertainty
continued, and rising geopolitical tensions roiled energy prices.
➢ Against this backdrop, global growth is forecast at 3.2 percent in 2019, picking up to 3.5 percent in
2020 (0.1 percentage point lower than in the April WEO projections for both years). GDP releases so
far this year, together with generally softening inflation, point to weaker-than-anticipated global
activity. Investment and demand for consumer durables have been subdued across advanced and
emerging market economies as firms and households continue to hold back on long-range spending.
Accordingly, global trade, which is intensive in machinery and consumer durables, remains sluggish.
The projected growth pickup in 2020 is precarious, presuming stabilization in currently stressed
emerging market and developing economies and progress toward resolving trade policy differences.
➢ Risks to the forecast are mainly to the downside. They include further trade and technology tensions
that dent sentiment and slow investment; a protracted increase in risk aversion that exposes the
financial vulnerabilities continuing to accumulate after years of low interest rates; and mounting
disinflationary pressures that increase debt service difficulties, constrain monetary policy space to
counter downturns, and make adverse shocks more persistent than normal.

GLOBAL STEEL DEVELOPMENTS
7

Source: World Steel Association 8
Global Steel Outlook
June 2019
▪ World crude steel production was 925.1 Mt in the first six months of 2019, up by
4.9% compared to the same period in 2018.
▪ World crude steel production for the 64 countries reporting to the World Steel
Association (world steel) was 159.0 million tonnes (Mt) in June 2019, a 4.6%
increase compared to June 2018.
▪ Asia produced 660.2 Mt of crude steel, an increase of 7.4% over the first half of
2018.
▪ The EU produced 84.7 Mt of crude steel in the first half of 2019, down by 2.5%
compared to the same period of 2018.
▪ North America’s crude steel production in the first six months of 2019 was 60.1
Mt, an increase of 1.4% compared to the first half of 2018.
▪ The C.I.S. produced 50.5 Mt of crude steel in the first six months of 2019, the
same as in the first six months of 2018.

Source: World Steel Association
➢ Total Crude steel production from January to June-2019 was 925 MT.
➢ The region wise crude steel production is provided in chart below.
RegionJan –June 2019 in
(MT)
Jan- June 2018 in
(MT)
% Change
EU-28 84.74 86.93 -2.5
CIS 50.49 50.47 0.0
N. America 60.12 59.32 1.4
S. America 21.49 22.16 -3.0
Africa 7.72 7.18 7.6
Middle East 18.31 17.55 4.3
Asia 660.17 614.54 7.4
Oceania 3.054 3.250 -6.0
World 925 882 4.9
Region wise Crude Steel Production
June 2019
➢ Year onYear this reflects an increase of crude steel production over Jan-June 2018 of 4.9%.
9

Source: World Steel Association 10
Nation Jan-Jun’19 Jan-Jun’18
China 492.16 447.8
India 56.95 54.20
Japan 51.08 52.94
United States 44.34 42.04
Russia 35.75 35.98
South Korea 36.89 36.03
Germany 20.71 21.79
Turkey 16.99 18.89
Brazil 16.68 17.15
Top Crude Steel Producing nation
As Per World Steel Association –Jan-June 2019

Source: International Trade Administration , Deptt. Of Commerce-USA 11
USA Steel Industry Outlook
➢ From March 2019 to April 2019, U.S. imports of steel mill products increased 47.6% to 3.0
million metric tons from 2.1 million metric tons.
➢ In April, capacity utilization was estimated at 81.3%, a decrease of 0.9 percentage points
from 82.2% in March 2019.
➢ According to data from the World Steel Association, U.S. steel production decreased by 4%
to 7.4 million metric tons in April 2019 from 7.7 million metric tons in March.
➢ After a recent peak in Q3 2018, benchmark domestic steel prices have been trending
downwards since Q4 of 2018.
• U.S. domestic prices for hot-rolled band decreased to $633 per metric ton in June 2019,
and compared to one year ago, the price for hot-rolled band was down 36.7%.
• Cold-rolled coil prices decreased to $785 per metric ton in June 2019 from $830 per
metric ton in May and were down 29.6% from last year. Standard plate prices decreased to
$959 per metric ton in June, down from $987 per metric ton in May, and were down by
10.3% from a year ago.
Source: Steel mint Research 12
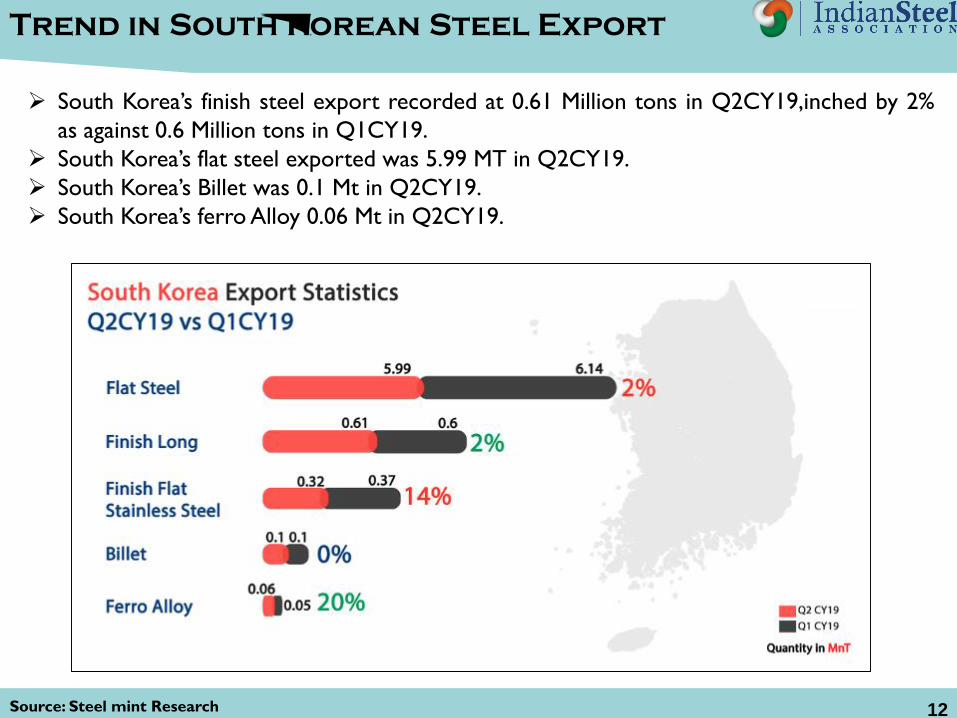
Trend in South Korean Steel Export
➢ South Korea’s finish steel export recorded at 0.61 Million tons in Q2CY19,inched by 2%
as against 0.6 Million tons in Q1CY19.
➢ South Korea’s flat steel exported was 5.99 MT in Q2CY19.
➢ South Korea’s Billet was 0.1 Mt in Q2CY19.
➢ South Korea’s ferro Alloy 0.06 Mt in Q2CY19.

Source: Coal Mint Research 13
Australian Coking Coal Price

DOMESTIC STEEL DEVELOPMENTS
14

Source: Joint Plant Committee,MT- Million tons 15
Performance of Indian Steel Industry
Items
Indian Steel Scene(Million Tons)
April-June 2019*
(Prov.)
April-June 2018
(Final)
% Change
(Prov.)
Crude Steel
Production27.90 26.82 4.0
Hot Metal Production 18.18 18.16 3.6
Pig Iron Production 1.591 1.545 3.0
Sponge Iron 9.270 8.665 7.0
Total Finished Steel ( Alloy + Non Alloy)
Production 26.44 24.53 7.8
Import 1.724 1.897 -9.1
Export 1.014 1.397 -27.4
Consumption 25.19 23.57 6.9

Source:Steel Mint research 16
➢ NMDC kept iron ore prices
unchanged in Chhattisgarh
Odisha’s Essel Mining lowered iron
ore lump prices by INR 200/MT,
however, offers from other miners
remain unchanged.
➢ Domestic iron ore prices are less
likely to decline amid upcoming
monsoons.
➢ Domestic pellet prices in India
declined amid weak P-DRI and
limited trades. The export market
remains strong amid high prices.
➢ Indian pellet market expected to
remain supported on high export
realizations and preference during
monsoon.
Trend in Iron ore price & Pellet price

Source: Odisha Government 17
➢ Odisha-India’s largest iron ore producing state recorded production at 11.73 MT stable on
monthly basis according to Odisha Government. The figures includes-fines, lumps and
concentrated iron ore.
➢ Odisha merchant miners kept iron ore prices unchanged in June 2019 after receiving
decent bookings at the beginning of June 2019.On the other hand side ,India’s domestic
sponge and billet pries plunged amid weak market fundamentals.
Odisha-Trend in Iron Ore Production
Source:Steel mint 18
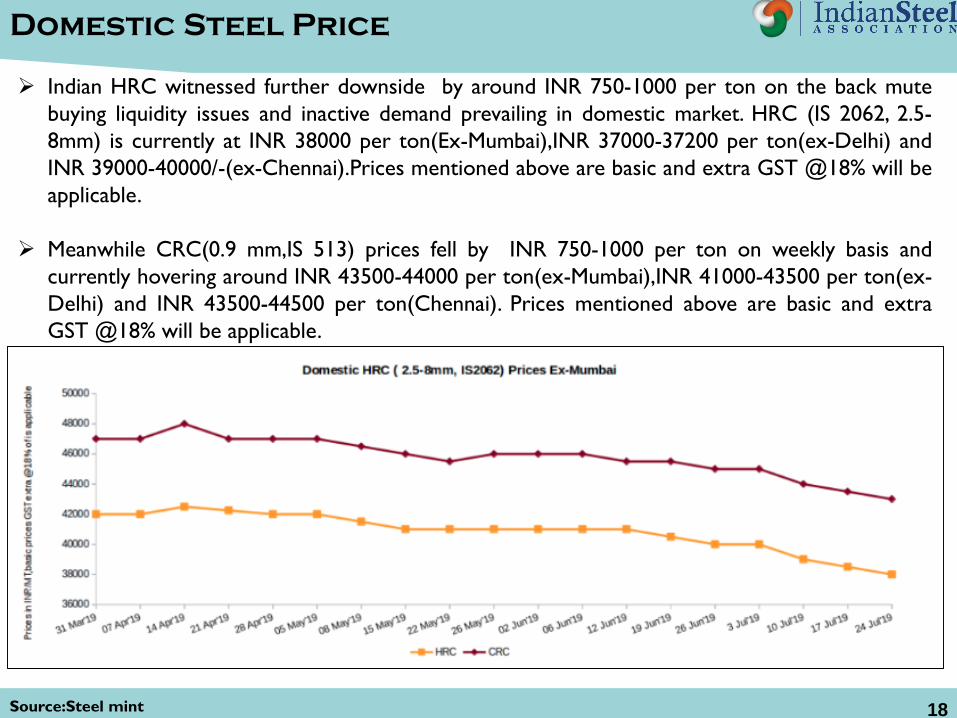
➢ Indian HRC witnessed further downside by around INR 750-1000 per ton on the back mute
buying liquidity issues and inactive demand prevailing in domestic market. HRC (IS 2062, 2.5-
8mm) is currently at INR 38000 per ton(Ex-Mumbai),INR 37000-37200 per ton(ex-Delhi) and
INR 39000-40000/-(ex-Chennai).Prices mentioned above are basic and extra GST @18% will be
applicable.
➢ Meanwhile CRC(0.9 mm,IS 513) prices fell by INR 750-1000 per ton on weekly basis and
currently hovering around INR 43500-44000 per ton(ex-Mumbai),INR 41000-43500 per ton(ex-
Delhi) and INR 43500-44500 per ton(Chennai). Prices mentioned above are basic and extra
GST @18% will be applicable.
Domestic Steel Price

INDIAN ECONOMIC DEVELOPMENT
19
Source: Ministry of finance 20
Indian Economic Highlights
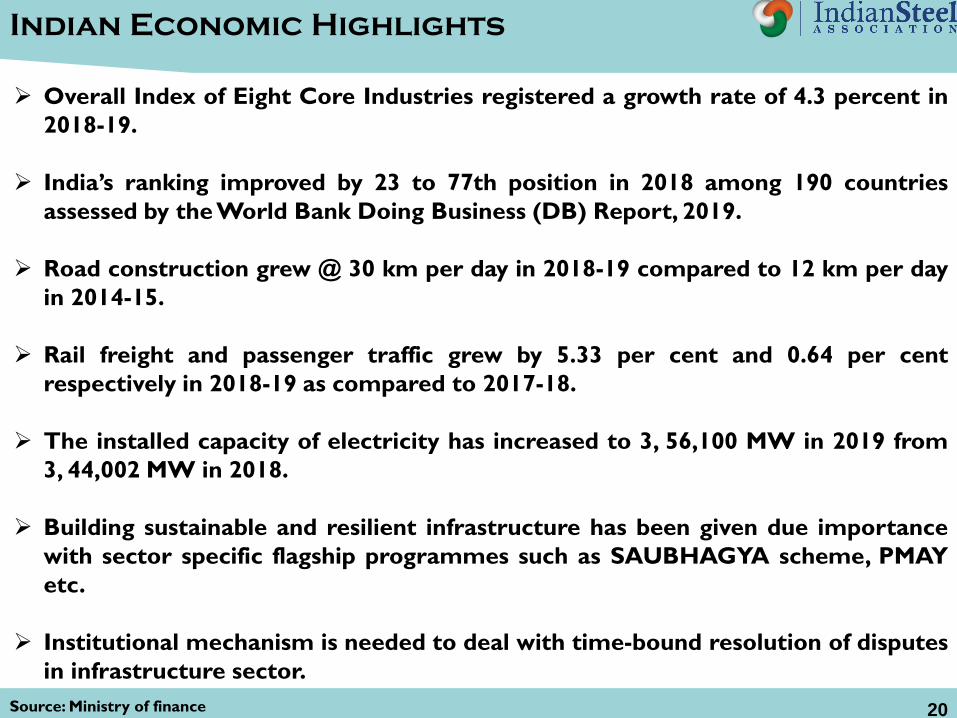
➢ Overall Index of Eight Core Industries registered a growth rate of 4.3 percent in
2018-19.
➢ India’s ranking improved by 23 to 77th position in 2018 among 190 countries
assessed by the World Bank Doing Business (DB) Report, 2019.
➢ Road construction grew @ 30 km per day in 2018-19 compared to 12 km per day
in 2014-15.
➢ Rail freight and passenger traffic grew by 5.33 per cent and 0.64 per cent
respectively in 2018-19 as compared to 2017-18.
➢ The installed capacity of electricity has increased to 3, 56,100 MW in 2019 from
3, 44,002 MW in 2018.
➢ Building sustainable and resilient infrastructure has been given due importance
with sector specific flagship programmes such as SAUBHAGYA scheme, PMAY
etc.
➢ Institutional mechanism is needed to deal with time-bound resolution of disputes
in infrastructure sector.
Source:- Ministry of finance 21
Indian Economic Highlights
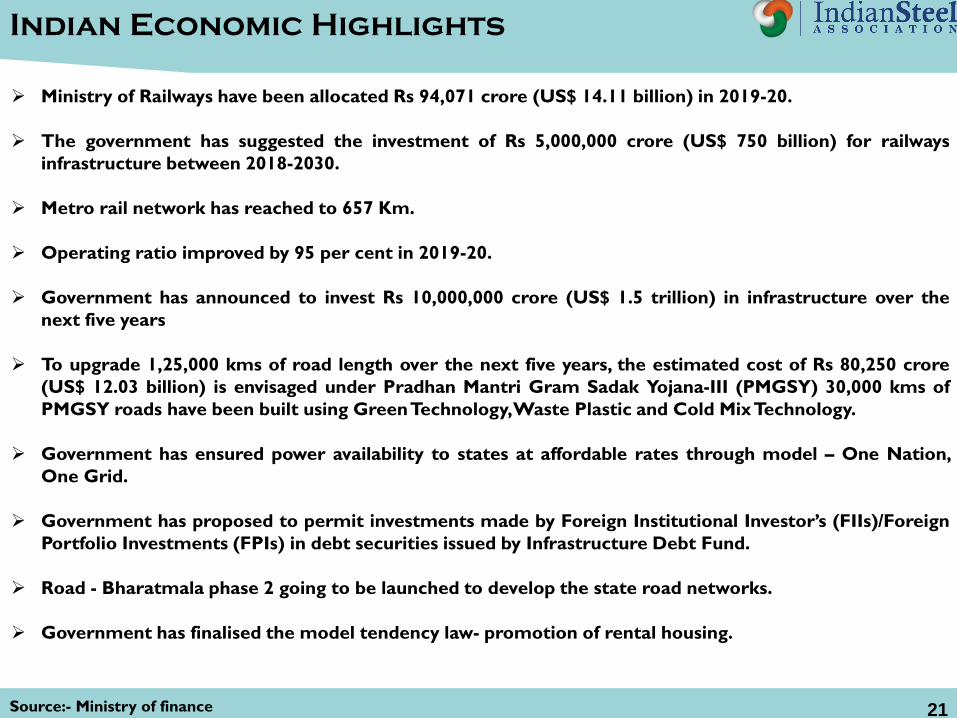
➢ Ministry of Railways have been allocated Rs 94,071 crore (US$ 14.11 billion) in 2019-20.
➢ The government has suggested the investment of Rs 5,000,000 crore (US$ 750 billion) for railways
infrastructure between 2018-2030.
➢ Metro rail network has reached to 657 Km.
➢ Operating ratio improved by 95 per cent in 2019-20.
➢ Government has announced to invest Rs 10,000,000 crore (US$ 1.5 trillion) in infrastructure over the
next five years
➢ To upgrade 1,25,000 kms of road length over the next five years, the estimated cost of Rs 80,250 crore
(US$ 12.03 billion) is envisaged under Pradhan Mantri Gram Sadak Yojana-III (PMGSY) 30,000 kms of
PMGSY roads have been built using GreenTechnology,Waste Plastic and Cold MixTechnology.
➢ Government has ensured power availability to states at affordable rates through model – One Nation,
One Grid.
➢ Government has proposed to permit investments made by Foreign Institutional Investor’s (FIIs)/Foreign
Portfolio Investments (FPIs) in debt securities issued by Infrastructure Debt Fund.
➢ Road - Bharatmala phase 2 going to be launched to develop the state road networks.
➢ Government has finalised the model tendency law- promotion of rental housing.
Source: Reserve Bank of India
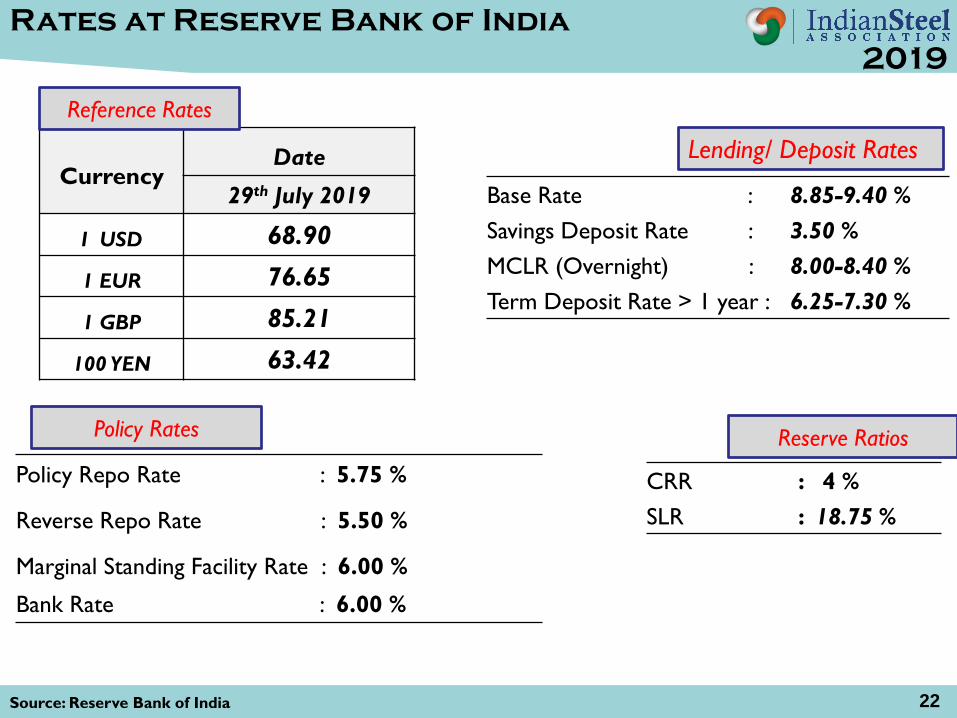
CurrencyDate
29th July 2019
I USD 68.90
1 EUR 76.65
1 GBP 85.21
100 YEN 63.42
Base Rate : 8.85-9.40 %
Savings Deposit Rate : 3.50 %
MCLR (Overnight) : 8.00-8.40 %
Term Deposit Rate > 1 year : 6.25-7.30 %
Policy Repo Rate : 5.75 %
Reverse Repo Rate : 5.50 %
Marginal Standing Facility Rate : 6.00 %
Bank Rate : 6.00 %
CRR : 4 %
SLR : 18.75 %
Reference Rates
Lending/ Deposit Rates
Reserve RatiosPolicy Rates
Rates at Reserve Bank of India
2019
22
ABOUT ISA
23

About ISA
➢ The Indian Steel Association (ISA) is the voice of the Indian Steel Industry,
in both domestic and global forums. It is at the forefront of all
deliberations pertaining to matters of public & regulatory policy, raw
materials, international trade, logistics, environmental concerns,
technology and other aspects of steel-making. The Indian Steel Industry
looks at ISA to further its critical agenda of sustained growth, both in
steel production and in generating domestic demand.
➢ ISA was formed in 2014 and has 15 members – eight full members and
seven affiliates. The list of full members includes –Steel Authority of India
(SAIL) and Rashtriya Ispat Nigam Ltd (RINL) – while heavyweights from
the private sector include JSW Steel Ltd, Tata Steel Ltd, Jindal Steel and
Power Ltd, Essar Steel India Ltd, Bhushan Power and Steel Ltd and Tata
Steel BSL Ltd. ISA, an affiliate member of World Steel Association (WSA),
regularly collaborates with WSA on the organisation of events, as well as
taking part in other key meetings with global partners.
24

Our eight Full Members are:
• Tata Steel Ltd
• Steel Authority of India Ltd.
• JSW Steel Ltd.
• Rashtriya Ispat Nigam Ltd.
• Essar Steel Ltd.
• Jindal Steel & Power Ltd.
• Tata Steel BSL Ltd.
• Bhushan Power & Steel Ltd.
Our Seven Affiliate Members are Monnet
Ispat & Energy Ltd., INSDAG (Institute
for Steel Development and Growth),
KISMA (Karnataka Iron and Steel
Manufacturer’s Association), Arjas Steel,
Jindal Stainless, Electrosteel Steels and
Orissa Metalliks Pvt. Ltd
Members of Indian Steel Association
25

Vision and Objectives of ISA
➢Vision of ISA-
To work towards transforming the Indian Steel Industry as a
global leader acclaimed for its Quality, Productivity and
Competitiveness, with a focus on health, safety and
environment, along with a growing thrust on innovation through
R&D, adopting an inclusive and collective approach.
➢ Objectives of ISA-
▪ Promoting steel by raising awareness about the numerous
advantages of good quality steel
▪ Collaborating with international steel organizations to
tackle issues of mutual interest.
▪Working with the government on matters affecting the
steel industry.
26

Important Ministries/Department/Organization
Ministry of Steel
Name of the person Designation Contact Details
Shri Binoy Kumar Secretary [email protected]
Shri Saraswati Prasad Special Secretary & Financial Adviser [email protected]
Smt. Rasika Chaube Additional Secretary [email protected]
Smt. Ruchika Chaudhry Govil Joint Secretary [email protected]
Shri Puneet kansal Joint Secretary [email protected]
Ministry of Mines
Name of the person Designation Contact Details
Shri Anil Gopishankar Mukim Secretary [email protected]
Dr. K. Rajeswara Rao Additional secretary [email protected]
Ministry of Commerce
Name of the person Designation Contact Details
Shri Anup Wadhawan Secretary [email protected]
Shri Shudhanshu Pandey Additional Secretary [email protected]
Shri Alok Vardhan Chaturvedi DGFT [email protected]
Dr. K.C.Rout Additional Secretary-DGFT [email protected]
Ministry of Environment, Forest and Climate Change
Name of the person Designation Contact Details
Shri C K Mishra Secretary [email protected]
Control Pollution Central Board
Name of the person Designation Contact Details
Shri S.P. Singh Parihar Chairman [email protected]
Dr. Prashant Gargava Member Secretary [email protected]
Ministry of FinanceName of the person Designation Contact Details
Shri Rajiv Kumar Joint Secretary [email protected]
27
Contact Us for data related issues
Address:207-208, 2nd Floor
Kailash Building
New Delhi -110-001
India
Tel: +011 4266 8811
Fax: +011 4266 8805
E-mail: [email protected]
Website: http://indsteel.org/28
THANK YOU
DISCLAIMER
The material in this presentation has been prepared by Indian Steel Association (ISA) and is a general background information reviewing the
status of the developments in the global and Indian steel industry as at the date of this presentation. This presentation is strictly for internal use
of all the member companies of ISA, whose names have been stated in the presentation.
Information is given in summary form and does not purport to be complete or all inclusive. The information has been sourced from independent
third party databases, knowledge sources and news reports, and the authenticity of the same has not been independently verified by ISA.
Additionally, any third party forecasts on financial or economic parameters, projections or estimates should not be construed as an investment
advice or a recommendation to any ISA member. Recipients of this presentation from member companies of the ISA should each make their own
evaluation of the contents and adequacy of the information contained in the presentation.
ISA does not undertake any obligation to publicly release any changes to any revisions, modifications or forward looking statements in the
subsequent editions of this bi-monthly presentation. Unless otherwise specified, all information is for the period July 2019 or prior.
29
Related Documents


![Developments in Steel Cathodes1[1] ISA](https://static.cupdf.com/doc/110x72/5525ef344a7959b6488b4dac/developments-in-steel-cathodes11-isa.jpg)