Journal of Management 1994, Vol. 20, No. 2,439-464 A Review of Current Practices for Evaluating Causal Models in Organizational Behavior and Human Resources Management Research Gina J. Medsker University of Miami Larry J. Williams Purdue University Patricia J. Holahan Stevens Institute of Technology This paper reviews the literature on structural model evaluation. It discusses the use offit indices, the influential work of James, Mulaik, and Brett (19821, with emphasis on their prescriptions for model assessment, and recent developments in model evaluation presented since James et al. It then analyzes current modeling practices to determine how well evaluation techniques are being applied. Although modeling practices have improved since an earlier review (James & James, 19891, several problems remain. Suggestions are made for improving model evaluation. Structural equation models are becoming increasingly popular in organizational research and the social sciences. Full information estimation methods such as those provided by the computer packages LISREL (Joreskog & Sorbom, 1989) and EQS (Bentler, 1985) give researchers a powerful tool for testing theoretical models. It has been suggested that the development of covariance structure analysis is “perhaps the most important and influential statistical revolution to have occurred in the social sciences” (Cliff, 1983, p. 115). An important characteristic of this methodology is that it allows for the simultaneous estimation of both a measurement model, which specifies relationships between the observed (measured, manifest) variables and unobserved latent variables (factors), and a structural model, which specifies relationships between the latent exogenous and endogenous variables and among the latent endogenous variables. In addition to accounting for biasing effects of random measurement errors, latent variable methodology has several other important advantages that Direct all correspondence to: Gina J. Medsker, University of Miami, School of Business Admnistration, Coral Gables, FL 33124. Copyright @ 1994 by JAI Press Inc. 01492063 439

Welcome message from author
This document is posted to help you gain knowledge. Please leave a comment to let me know what you think about it! Share it to your friends and learn new things together.
Transcript
Journal of Management 1994, Vol. 20, No. 2,439-464
A Review of Current Practices for Evaluating Causal Models
in Organizational Behavior and Human Resources Management Research
Gina J. Medsker University of Miami
Larry J. Williams Purdue University
Patricia J. Holahan Stevens Institute of Technology
This paper reviews the literature on structural model evaluation. It discusses the use offit indices, the influential work of James, Mulaik, and Brett (19821, with emphasis on their prescriptions for model assessment, and recent developments in model evaluation presented since James et al. It then analyzes current modeling practices to determine how well evaluation techniques are being applied. Although modeling practices have improved since an earlier review (James & James, 19891, several problems remain. Suggestions are made for improving model evaluation.
Structural equation models are becoming increasingly popular in organizational research and the social sciences. Full information estimation methods such as those provided by the computer packages LISREL (Joreskog & Sorbom, 1989) and EQS (Bentler, 1985) give researchers a powerful tool for testing theoretical models. It has been suggested that the development of covariance structure analysis is “perhaps the most important and influential statistical revolution to have occurred in the social sciences” (Cliff, 1983, p. 115). An important characteristic of this methodology is that it allows for the simultaneous estimation of both a measurement model, which specifies relationships between the observed (measured, manifest) variables and unobserved latent variables (factors), and a structural model, which specifies relationships between the latent exogenous and endogenous variables and among the latent endogenous variables. In addition to accounting for biasing effects of random measurement errors, latent variable methodology has several other important advantages that
Direct all correspondence to: Gina J. Medsker, University of Miami, School of Business Admnistration, Coral Gables, FL 33124.
Copyright @ 1994 by JAI Press Inc. 01492063
439

440 MEDSKER, WILLIAMS, AND HOLAHAN
have led to its increased use in many research contexts (e.g., James & Brett, 1984; Williams, Cote & Buckley, 1989; Williams & Podsakoff, 1989).
Within the field of Organizational Behavior and Human Resources Management (OBHRM), there has been increasing use of this methodology in a variety of areas. Applications have included studies of turnover (e.g., Horn & Griffeth, 1991), goal-setting (e.g., Earley & Lituchy, 1991) and role stress (e.g., Podsakoff, Williams & Todor, 1986). Additional areas in which this methodology has been used include selection (e.g., Wise, McHenry & Campbell, 1990), performance appraisal (e.g., Farh & Dobbins, 1989), compensation (e.g., Miceli, Jung, Near & Greenberger, 1991), and recruitment (e.g., Graves & Powell, 1988), among others. One particular reason for the quick integration of latent variable techniques into OBHRM was a book sponsored by Division 14 of the American Psychological Association. Causal Analysis, by James, Mulaik and Brett (1982), was part of a project aimed at fostering innovations in methodology for organizational research. Most importantly, James et al. provided recommendations for conducting modeling, evaluating model fit, and comparing competing models that have had a strong impact on OBHRM research.
Recently, many new statistical developments have been presented which are also of relevance to OBHRM researchers using modeling. The purposes of the present paper are to review current practices used in OBHRM research for evaluating causal models and discuss new statistical developments in the area. Specifically, the objectives are to: (1) provide background information for those with limited knowledge of this methodology so they can understand applications of causal modeling, and (2) update more experienced users to make them aware of current critical issues. The focus of these objectives is related to what is perhaps the most difficult aspect of understanding this methodology, the process of evaluating the adequacy of models. In order to understand current applications of causal modeling, researchers need knowledge of both the basics of James et al,, as well as of newly developed analysis strategies which have not previously been presented in a readily accessible format. In order to provide a background for subsequent discussion in this paper, first, indices for evaluating model fit will be described. Next, an overview of model comparison strategies recommended by James et al. and others will be provided. Third, a review of current practices used by OBHRM researchers applying covariance structure methodology will be presented to assess which practices are being used and how well they are being applied. Finally, suggestions will be made as to how to improve structural model evaluation and incorporate new modeling developments in future research.
Indices and Methods for Evaluating Causal Models
Diagnostics Provided by LISREL Used in the OBHRM Literature
One set of indices and methods for evaluating model fit which have been used by OBHRM researchers are those which are included in LISREL output (Joreskog & Sorbom, 1989). The chi-square statistic (x2), goodness of fit index
JOURNAL OF MANAGEMENT, VOL. 20, NO. 2, 1994
STRUCTURAL MODEL EVALUATION 441
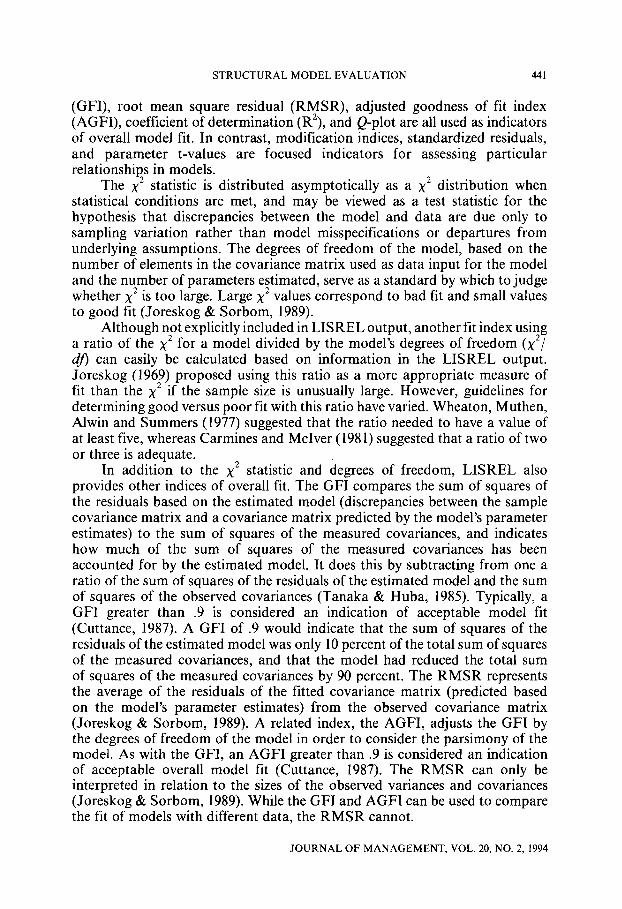
(GFI), root mean square residual (RMSR), adjusted goodness of fit index (AGFI), coefficient of determination (R’), and Q-plot are all used as indicators of overall model fit. In contrast, modification indices, standardized residuals, and parameter t-values are focused indicators for assessing particular relationships in models.
The x2 statistic is distributed asymptotically as a x2 distribution when statistical conditions are met, and may be viewed as a test statistic for the hypothesis that discrepancies between the model and data are due only to sampling variation rather than model misspecifications or departures from underlying assumptions. The degrees of freedom of the model, based on the number of elements in the covariance matrix used as data input for the model and the number of parameters estimated, serve as a standard by which to judge whether x2 is too large. Large x2 values correspond to bad fit and small values to good fit (Joreskog & Sorbom, 1989).
Although not explicitly included in LISREL output, another fit index using a ratio of the x2 for a model divided by the model’s degrees of freedom (x2/ d! can easily be calculated based on information in the LISREL output. Joreskog (1969) proposed using this ratio as a more appropriate measure of fit than the x2 if the sample size is unusually large. However, guidelines for determining good versus poor fit with this ratio have varied. Wheaton, Muthen, Alwin and Summers (1977) suggested that the ratio needed to have a value of at least five, whereas Carmines and McIver (198 1) suggested that a ratio of two or three is adequate.
In addition to the x2 statistic and degrees of freedom, LISREL also provides other indices of overall fit. The GFI compares the sum of squares of the residuals based on the estimated model (discrepancies between the sample covariance matrix and a covariance matrix predicted by the model’s parameter estimates) to the sum of squares of the measured covariances, and indicates how much of the sum of squares of the measured covariances has been accounted for by the estimated model. It does this by subtracting from one a ratio of the sum of squares of the residuals of the estimated model and the sum of squares of the observed covariances (Tanaka & Huba, 1985). Typically, a GFI greater than .9 is considered an indication of acceptable model fit (Cuttance, 1987). A GFI of .9 would indicate that the sum of squares of the residuals of the estimated model was only 10 percent of the total sum of squares of the measured covariances, and that the model had reduced the total sum of squares of the measured covariances by 90 percent. The RMSR represents the average of the residuals of the fitted covariance matrix (predicted based on the model’s parameter estimates) from the observed covariance matrix (Joreskog & Sorbom, 1989). A related index, the AGFI, adjusts the GFI by the degrees of freedom of the model in order to consider the parsimony of the model. As with the GFI, an AGFI greater than .9 is considered an indication of acceptable overall model fit (Cuttance, 1987). The RMSR can only be interpreted in relation to the sizes of the observed variances and covariances (Joreskog & Sorbom, 1989). While the GFI and AGFI can be used to compare the fit of models with different data, the RMSR cannot.
JOURNAL OF MANAGEMENT, VOL. 20, NO. 2, 1994
442 MEDSKER, WILLIAMS, AND HOLAHAN
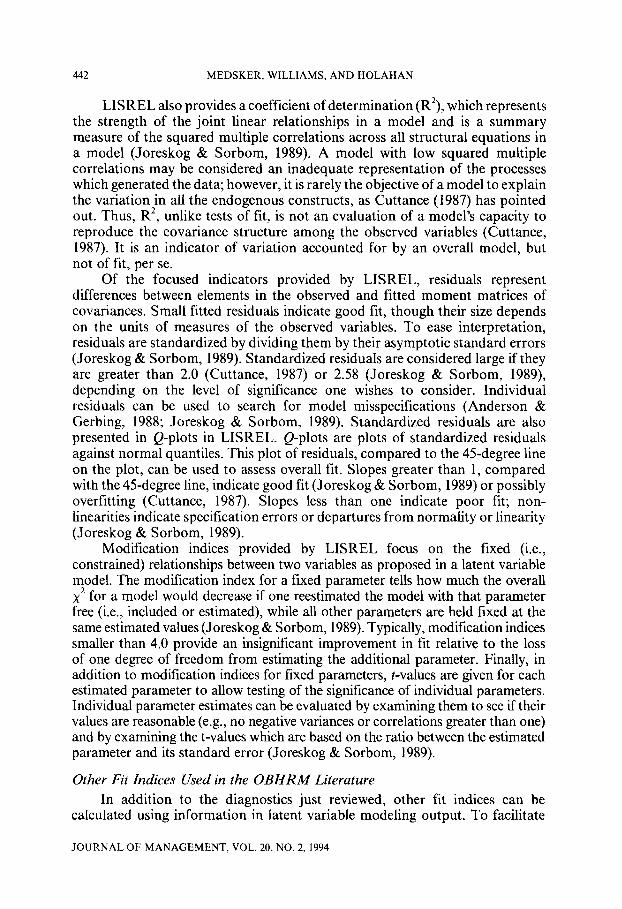
LISREL also provides a coefficient of determination (R2), which represents the strength of the joint linear relationships in a model and is a summary measure of the squared multiple correlations across all structural equations in a model (Joreskog & Sorbom, 1989). A model with low squared multiple correlations may be considered an inadequate representation of the processes which generated the data; however, it is rarely the objective of a model to explain the variation in all the endogenous constructs, as Cuttance (1987) has pointed out. Thus, R2, unlike tests of lit, is not an evaluation of a model’s capacity to reproduce the covariance structure among the observed variables (Cuttance, 1987). It is an indicator of variation accounted for by an overall model, but not of fit, per se.
Of the focused indicators provided by LISREL, residuals represent differences between elements in the observed and fitted moment matrices of covariances. Small fitted residuals indicate good fit, though their size depends on the units of measures of the observed variables. To ease interpretation, residuals are standardized by dividing them by their asymptotic standard errors (Joreskog & Sorbom, 1989). Standardized residuals are considered large if they are greater than 2.0 (Cuttance, 1987) or 2.58 (Joreskog & Sorbom, 1989), depending on the level of significance one wishes to consider. Individual residuals can be used to search for model misspecifications (Anderson & Gerbing, 1988; Joreskog & Sorbom, 1989). Standardized residuals are also presented in Q-plots in LISREL. Q-plots are plots of standardized residuals against normal quantiles. This plot of residuals, compared to the 45degree line on the plot, can be used to assess overall fit. Slopes greater than 1, compared with the 45degree line, indicate good fit (Joreskog & Sorbom, 1989) or possibly overfitting (Cuttance, 1987). Slopes less than one indicate poor fit; non- linearities indicate specification errors or departures from normality or linearity (Joreskog & Sorbom, 1989).
Modification indices provided by LISREL focus on the fixed (i.e., constrained) relationships between two variables as proposed in a latent variable model. The modification index for a fixed parameter tells how much the overall x2 for a model would decrease if one reestimated the model with that parameter free (i.e., included or estimated), while all other parameters are held fixed at the same estimated values (Joreskog & Sorbom, 1989). Typically, modification indices smaller than 4.0 provide an insignificant improvement in fit relative to the loss of one degree of freedom from estimating the additional parameter. Finally, in addition to modification indices for fixed parameters, t-values are given for each estimated parameter to allow testing of the significance of individual parameters. Individual parameter estimates can be evaluated by examining them to see if their values are reasonable (e.g., no negative variances or correlations greater than one) and by examining the t-values which are based on the ratio between the estimated parameter and its standard error (Joreskog & Sorbom, 1989).
Other Fit Indices Used in the OBHRM Literature
In addition to the diagnostics just reviewed, other fit indices can be calculated using information in latent variable modeling output. To facilitate
JOURNAL OF MANAGEMENT, VOL. 20, NO. 2, 1994
STRUCTURAL MODEL EVALUATION
Table 1. Equations for Fit Indices
443
1) Composite Reliability =
2) Variance Extracted Estimates = 2 A$ + i Var (ei) i= I i=l
3) df,.v dfr
TLI = NNFI = _ ‘
XAN
df,N-’ 2 2
XAN-XT
4) NFI = ^ 1
XAN
5) p
I _ dfT _ 2dfT
dfaw k(k-I)
6) PFI = NFI X P,
2 2 XAN-XT
7) NF12 = x jN -dfr
8)
9) ” =
2dfr
k(k + 1)
10) PGFI = GFI X P2
PNFI2 = NF12 X PI
2 2 XUF- XT
11) RNFI = 2 x “F - x SS ’ - (dfr - dfss)
dfr - dfss 12) RP =
dfw - dfss
13) RPFI = RNFI X RP
14) CFI = 1 - \ I
max da, - dfa,v x2 - df=
” ---,O ) n
(x:N --dfAN) - (X ; - dfr) 15) RN1 =
(X ;N - df&
Note; 5 = factor loadings from model estimated; x2 = chi-square value for model; df = degrees of freedom for model, MAN = absolute null model; MT = theoretical model of interest; MSS = saturated model; k = number of manifest indicators; 9 = number of estimated parameters.
JOURNAL OF MANAGEMENT, VOL. 20, NO. 2, 1994
444 MEDSKER, WILLIAMS, AND HOLAHAN
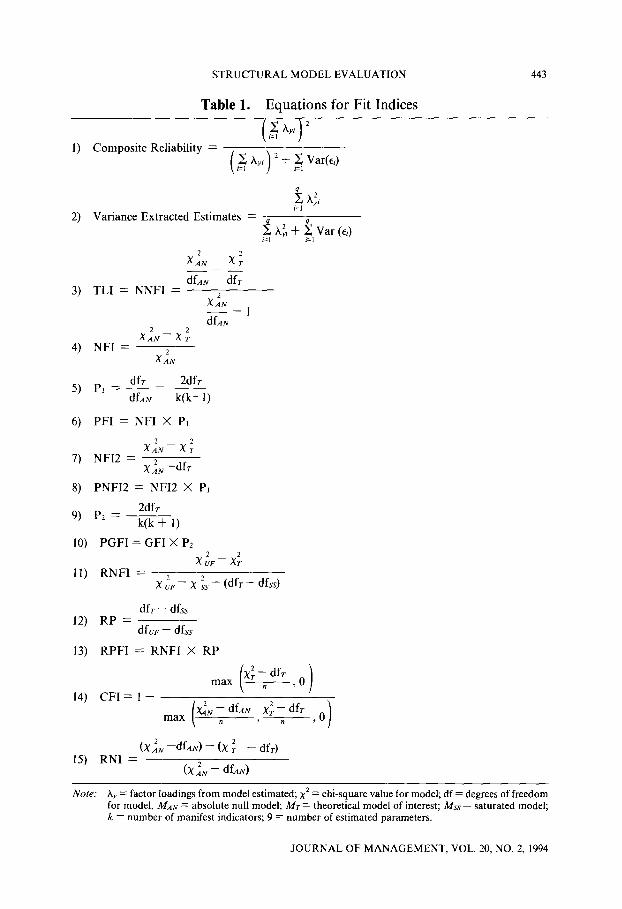
understanding of these indices, their equations are presented in Table 1. Two types of focused indices (shown in Equations 1 and 2) have been presented in the literature for assessing scales in the measurement model: composite reliability and variance extracted estimates. Composite reliability assesses the internal consistency of the indicators and is analogous to coefficient alpha. Variance extracted estimates measure the amount of variance that is captured by a construct in relation to the amount of variance due to measurement error (Fornell & Larcker, 1981).
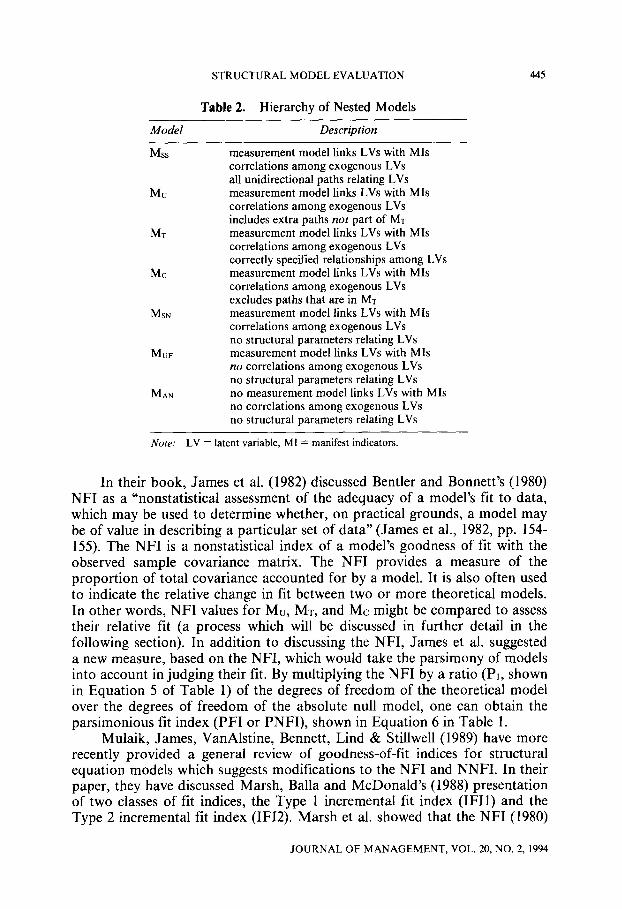
Several other fit indices have been presented in the literature. All involve the use of model comparisons and evaluation of more than one nested model for determining the fit of a model relative to other models. To facilitate discussion of this and other topics in this paper, reference will be made to Table 2. This table describes several hierarchically nested models, where nested means that one or more paths which are free in the first model are restricted in the second model, one or more paths which are free in the second model are additionally restricted in the third model, and so on. The nested models include: (1) Mss-a saturated structural model in which all unidirectional paths relating all constructs to one another are estimated; (2) Mu-an overfit model similar to the theoretical model (described next) except it contains one or more additional structural parameters; (3) MT-the theoretical model of interest which may allow for covariances among exogenous constructs and regression parameters among endogenous constructs; (4) MC-an underfit model similar to the theoretical model except it contains one or more fewer structural parameters; (5) MsN-a structural null model which restricts remaining regression parameters to zero; (6) Mur+an uncorrelated factors model which additionally constrains covariances relating the exogenous constructs to each other to zero; and (7) MAN-the absolute null model which proposes that all measured variables of indicators are uncorrelated and each indicator loads separately on its own factor. It should also be noted that MSS is often referred to as the measurement model, since the measurement model is a confirmatory factor model which allows for all latent factors to be correlated and thus has a x2 and degrees of freedom equal to those for the MSS.
Among the earliest fit indices proposed which involved comparing a model’s fit relative to other nested models is the Tucker-Lewis Index (TLI, Tucker & Lewis, 1973, Equation 3 in Table 1). The TLI uses the MAN as a baseline model against which to compare the MT. Several years after the presentation of the TLI, Bentler and Bonnett (1980) presented two fit indices derived from the TLI: the nonnormed fit index (NNFI or rho) and the normed fit index (NFI or delta). Bentler and Bonnett presented these indices as generalizations of the TLI, which had been developed to deal specifically with exploratory factor analytic models. Thus, the NNFI is an extension applicable to more general models for covariance structures and represents the increment in fit obtained by comparing any two nested models. The NNFI’s equation is equivalent to that of the TLI. The NFI, shown in Equation 4 in Table 1, is referred to as normed because, unlike the NNFI, its values fall between 0 and 1. Bentler and Bonnett suggested that models with NNFI’s or NFI’s less than .9 can usually be substantially improved.
JOURNAL OF MANAGEMENT, VOL. 20, NO. 2, 1994
STRUCTURAL MODEL EVALUATION 445
Table 2. Hierarchy of Nested Models
Model Description
MSS
MU
MT
MC
MSN
MUF
MAN
measurement model links LVs with MIS correlations among exogenous LVs all unidirectional paths relating LVs measurement model links LVs with MIS correlations among exogenous LVs includes extra paths not part of MT measurement model links LVs with MIS correlations among exogenous LVs correctly specified relationships among LVs measurement model links LVs with MIS correlations among exogenous LVs excludes paths that are in MT measurement model links LVs with MIS correlations among exogenous LVs no structural parameters relating LVs measurement model links LVs with MIS no correlations among exogenous LVs no structural parameters relating LVs no measurement model links LVs with MIS no correlations among exogenous LVs no structural parameters relating LVs
Note: LV = latent variable, MI = manifest indicators.
In their book, James et al. (1982) discussed Bentler and Bonnett’s (1980) NFI as a “nonstatistical assessment of the adequacy of a model’s fit to data, which may be used to determine whether, on practical grounds, a model may be of value in describing a particular set of data” (James et al., 1982, pp. 154- 155). The NFI is a nonstatistical index of a model’s goodness of fit with the observed sample covariance matrix. The NFI provides a measure of the proportion of total covariance accounted for by a model. It is also often used to indicate the relative change in fit between two or more theoretical models. In other words, NFI values for MU, MT, and MC might be compared to assess their relative fit (a process which will be discussed in further detail in the following section). In addition to discussing the NFI, James et al. suggested a new measure, based on the NFI, which would take the parsimony of models into account in judging their fit. By multiplying the NFI by a ratio (PI, shown in Equation 5 of Table 1) of the degrees of freedom of the theoretical model over the degrees of freedom of the absolute null model, one can obtain the parsimonious fit index (PFI or PNFI), shown in Equation 6 in Table 1.
Mulaik, James, VanAlstine, Bennett, Lind & Stillwell (1989) have more recently provided a general review of goodness-of-fit indices for structural equation models which suggests modifications to the NFI and NNFI. In their paper, they have discussed Marsh, Balla and McDonald’s (1988) presentation of two classes of fit indices, the Type 1 incremental fit index (IFII) and the Type 2 incremental fit index (IF12). Marsh et al. showed that the NFI (1980)
JOURNAL OF MANAGEMENT, VOL. 20, NO. 2, 1994

446 MEDSKER, WILLIAMS, AND HOLAHAN
belongs to the IF11 class and the TLI (1973) belongs to the IF12 class of indices. Because a Type 2 incremental fit index is less biased as an estimator of the asymptotic value, the Type 2 indicator is seen as a superior estimator by Mulaik et al. (1989). Thus, they presented the formulas for two fit measures of the IF12 class which are conceptually similar to the NFI and PFI (which are both of the IF11 class) and can be interpreted in the same way. These new measures, referred to as NF12 and PNF12, are shown in Equations 7 and 8 in Table 1, respectively. From these equations it can be seen that the NFI2 (equivalent to the AZ of Bollen, 1989) is identical to the NFI, except that the degrees of freedom of MT are subtracted in the denominator. It is also shown that the PNF12 is obtained by multiplying the NFI2 by the ratio Pi. In addition, Mulaik et al. have shown that a parsimonious version of Joreskog and Sorbom’s GFI, the PGFI, can be calculated in a similar way to the PFI. This PGFI is formed by multiplying the GFI by the ratio PZ (Equation 9 and Equation IO). The parsimony index for the PGFI differs because the degrees of freedom for the GFI equal the number of independent elements in the diagonal and off-diagonal (k(k+l)/2) rather than the number of distinct off-diagonal elements (k(k-l)/ 2) as in the degrees of freedom for the NFI or NF12 in PI (Mulaik et al., 1989).
In their paper, Mulaik et al. (1989) have also recommended the Relative Normed Fit Index (RNFI; Equation 11) as a measure which avoids the influence of the measurement model on the model assessment process. With this measure, the relative improvement in fit due to the latent model can be assessed separately from the fit of the measurement model. In the RNFI, the x2 difference between MUF and MT is interpreted relative to the difference in fit between MUF and Mss. As a result, this controls for the influence of the measurement model on goodness of fit. Mulaik et al. (1989) also have reported the Relative Parsimony ratio (RP; Equation 12). As seen in this equation, the RP is based on the difference in degrees of freedom between MT and Mss relative to the degrees of freedom available, as represented by the difference in degrees of freedom between MUF and MSS. In effect, this ratio eliminates the influence of the degrees of freedom associated with the measurement model. Thus, RP is an improvement over the parsimony ratio (Pi) which is used to compute the PFI. Mulaik et al. have recommended multiplying the RNFI and RP values to obtain the Relative Parsimonious Fit Index (RPFI; Equation 13) which describes how well the model explains all possible relations among latent variables. While the RPFI is conceptually similar to the PFI developed by James et al. (1982), it does not contain the confounding influence of the measurement model. As discussed above, this influence is controlled for in both the RNFI and the RP.
Finally, the most recent development in goodness-of-fit measures relevant for OBHRM researchers involves noncentrality parameter-based indices. Both Bentler (1990) and McDonald and Marsh (1990) have discussed the problem that prior indices are not associated with specific population parameters and the difficulties associated with sample size effects. As an improvement, they have developed indices analogous to the NFI which overcome these limitations. Bentler (1990) labeled his index the “comparative fit index” (CFI), while McDonald and Marsh used the term “relative noncentrality index” (RNI). As
JOURNAL OF MANAGEMENT, VOL. 20, NO. 2, 1994

STRUCTURAL MODEL EVALUATION 447
shown in Equation 14, the RN1 subtracts the relevant degrees of freedom from each x2 value used in the original NFL The CFI (Equation 15) is similar to the RN1 except that the CFI is normed so that negative values are not allowed in the numerator or denominator. These two indices are equivalent in most cases. When the RN1 is between 0 and 1, inclusive, the CFI equals the RNI. However, when the RN1 is less than 0, the CFI is greater than the RNI, and when the RN1 is greater than 1, the CFI is less than the RNI. Thus, the CFI truncates the distribution of the RN1 to allow values only within the 0 to 1 range, inclusive. The CFI exhibits a slight relation to sample size (Gerbing & Anderson, 1992), and, in special cases when the RN1 and CFI are not equal, the RN1 is preferable for comparing models (Goffin, 1993).
In summary, over the years several fit indices have been utilized. Most incorporate x2 values and degrees of freedom for theoretical and null models. The discussion thus far has focused on their use in evaluating a specific individual model. However, these indices have also been widely used to evaluate competing theoretical models nested between MAN and MS This part of the model evaluation process will now be discussed.
Model Comparison Strategies
OBHRM researchers who use causal modeling face the challenge of directly comparing competing theoretical models. This ability to compare theoretical models is an important capability provided by this statistical methodology. Two general strategies have been used in the literature for comparing such models. First, an important contribution of James et al. (1982) is the discussion of model comparisons and two tests required for empirical confirmation of a latent variable model. The first test examines predictions that paths hypothesized by the theoretical model (MT) to be different from zero are in fact nonzero, and can be accomplished by comparing MT with a nested model which restricts all structural paths to zero (MsN) through examinination of the statistical significance of a x2 difference test. This test is based on the difference in x2 values between MT and MSN, with the critical x2 value for significance being based on the difference in degrees of freedom for the two models. It would be hypothesized that this latter model with restricted paths would be rejected. As with all the model comparisons which will be discussed, if the obtained x2 difference exceeds the critical value associated with the difference in degrees of freedom for the two models being compared, the more restrictive model (in this case MEN) is rejected, the less restrictive model (in this case MT) is considered confirmed, and the model testing process stops. James et al. refers to this type of test as providing evidence relevant to Condition 9 of a set of conditions necessary for confirmatory analysis. Additional information related to the first test can also be attained by examining individual paths’ statistical significance using parameter t-values.
The second test addresses predictions that paths hypothesized by MT to be zero are, in fact, nonsignificant. James et al. (1982) further elaborated that this latter test could be conducted using model comparisons or by assessing the fit of the model to the data, since the overall goodness of fit is determined
JOURNAL OF MANAGEMENT, VOL. 20, NO. 2, 1994
448 MEDSKER, WILLIAMS, AND HOLAHAN
by the parameters constrained (to zero) rather than the freely estimated parameters predicted to be different from zero. With respect to the model comparison, this Condition 10 test is based on the comparison of an MT with Mss, and a nonsignificant x2 difference is predicted by the theory. As stated by James et al., “the strongest case for confirmation/disconfirmation is made if both tests (Conditions 9 and 10 ) are conducted” (1982, p. 94). These two tests are mentioned here to serve as an overview of what needs to be accomplished with the model evaluation process. As noted above, fit indices have been used to supplement the interpretation of the x2 difference tests.
The Wald (W) and Lagrange Multiplier (LM) tests have been proposed by Bentler and Chou (1987) to compare nested models without requiring the estimation of more than one model. The W test assesses a hypothesis about a subset of free parameters in a model. Thus, it analyzes whether a set of parameters present in an MT, but not present in an Mc, are needed. The W test is used to determine whether a set of free parameters in a model are simultaneously zero. The LM test starts with a more restricted model, MC, and tests a null hypothesis concerning whether or not a set of constrained parameters should be freed. This test is used to determine whether additional free parameters need to be added to a model to improve the model’s fit. Thus, Bentler and Chou’s (1987) LM statistic is a test of Condition 9, and their W statistic is a test of Condition 10. Chou and Bentler (1990) recommended these statistics as simpler to implement than x2 difference tests because they require estimation of only a single model rather than estimation of two models, and because the statistics have mathematically performed equivalently to the x2 difference test.
James et al. (1982) also provided guidance for two other aspects of the model evaluation process. First, they described the procedures to be used in assessing the measurement portion of a latent variable model. According to James et al., the process begins with a test of the constraints imposed on the factor loadings and correlations to specify the measurement model. This test is based on the x2 value for Mss, since a completely saturated model with zero x2 and degrees of freedom is the comparison model. Thus, the x2 value for the Mss is the same as the x2 difference for the comparison between the Mss and a completely saturated model in which all paths are estimated (Mcs). Second, James et al. proposed a sequence of model comparisons for testing alternative theoretical models (in this case MU and MC) and achieving the two tests required for confirmation of a model. The sequence is based on sequential x2 difference tests of models in their hierarchical order. If the more restrictive model is not rejected, however, the sequence of tests is continued in which constraints are imposed on some or all of the relationships among the latent variables. With the models given in Table 2, the relevant model comparisons would include MSS vs. MU, Mu vs. MT, MT vs. MC, MC vs. MSN, MSN vs. MUF, and MUF vs. MAN, and the process continues until a significant x2 difference is found.
More recently, Anderson and Gerbing (1988) have proposed a second specific methodology for comparing structural equation models which expands upon James et al.3 strategies (1982). Their recommended two-step approach
JOURNAL OF MANAGEMENT, VOL. 20, NO. 2, 1994
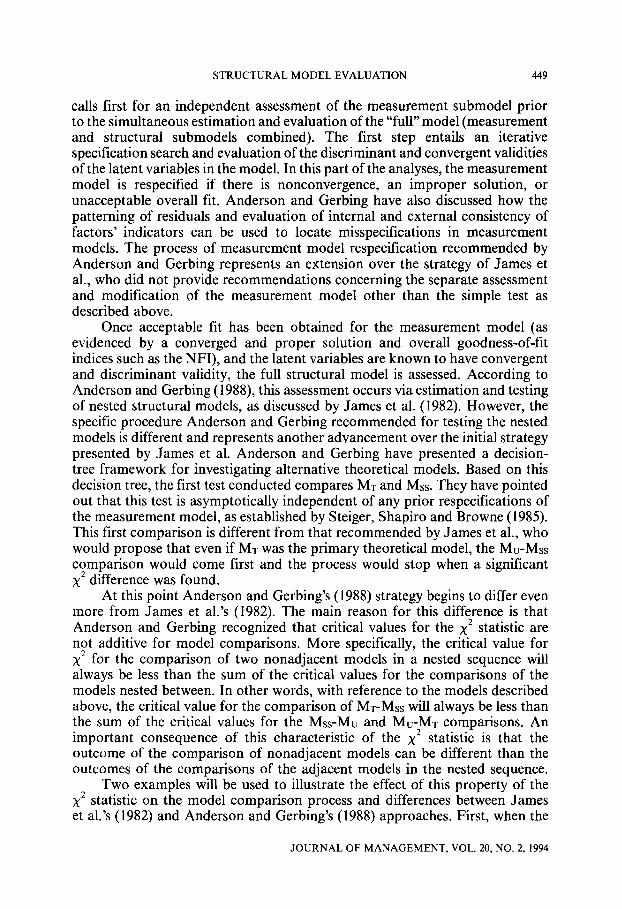
STRUCTURAL MODEL EVALUATION 449
calls first for an independent assessment of the measurement submodel prior to the simultaneous estimation and evaluation of the “full”mode1 (measurement and structural submodels combined). The first step entails an iterative specification search and evaluation of the discriminant and convergent validities of the latent variables in the model. In this part of the analyses, the measurement model is respecified if there is nonconvergence, an improper solution, or unacceptable overall fit. Anderson and Gerbing have also discussed how the patterning of residuals and evaluation of internal and external consistency of factors’ indicators can be used to locate misspecifications in measurement models. The process of measurement model respecification recommended by Anderson and Gerbing represents an extension over the strategy of James et al., who did not provide recommendations concerning the separate assessment and modification of the measurement model other than the simple test as described above.
Once acceptable fit has been obtained for the measurement model (as evidenced by a converged and proper solution and overall goodness-of-fit indices such as the NFI), and the latent variables are known to have convergent and discriminant validity, the full structural model is assessed. According to Anderson and Gerbing (1988), this assessment occurs via estimation and testing of nested structural models, as discussed by James et al. (1982). However, the specific procedure Anderson and Gerbing recommended for testing the nested models is different and represents another advancement over the initial strategy presented by James et al. Anderson and Gerbing have presented a decision- tree framework for investigating alternative theoretical models. Based on this decision tree, the first test conducted compares Mr and Mss. They have pointed out that this test is asymptotically independent of any prior respecifications of the measurement model, as established by Steiger, Shapiro and Browne (1985). This first comparison is different from that recommended by James et al., who would propose that even if MT was the primary theoretical model, the Mu-MSS comparison would come first and the process would stop when a significant x2 difference was found.
At this point Anderson and Gerbing’s (1988) strategy begins to differ even more from James et al.3 (1982). The main reason for this difference is that Anderson and Gerbing recognized that critical values for the x2 statistic are not additive for model comparisons. More specifically, the critical value for x2 for the comparison of two nonadjacent models in a nested sequence will always be less than the sum of the critical values for the comparisons of the models nested between. In other words, with reference to the models described above, the critical value for the comparison of MrMss will always be less than the sum of the critical values for the Mss-MU and MU-MT comparisons. An important consequence of this characteristic of the x2 statistic is that the outcome of the comparison of nonadjacent models can be different than the outcomes of the comparisons of the adjacent models in the nested sequence.
Two examples will be used to illustrate the effect of this property of the x2 statistic on the model comparison process and differences between James et al’s (1982) and Anderson and Gerbing’s (1988) approaches. First, when the
JOURNAL OF MANAGEMENT, VOL. 20, NO. 2, 1994
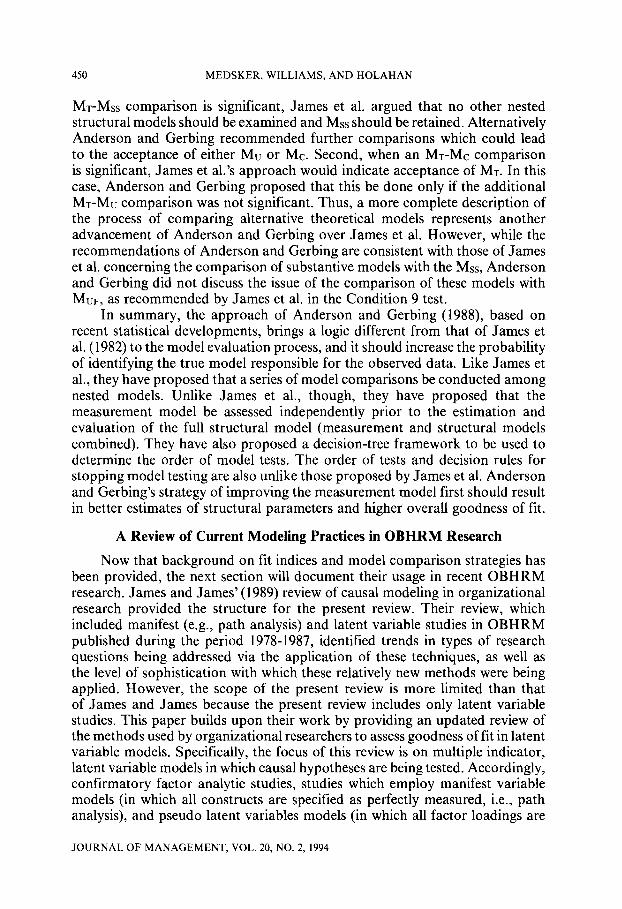
450 MEDSKER, WILLIAMS, AND HOLAHAN
MT-MS comparison is significant, James et al. argued that no other nested structural models should be examined and Mss should be retained. Alternatively Anderson and Gerbing recommended further comparisons which could lead to the acceptance of either Mu or MC. Second, when an MT-Mc comparison is significant, James et al.‘s approach would indicate acceptance of MT. In this case, Anderson and Gerbing proposed that this be done only if the additional MT-MU comparison was not significant. Thus, a more complete description of the process of comparing alternative theoretical models represents another advancement of Anderson and Gerbing over James et al. However, while the recommendations of Anderson and Gerbing are consistent with those of James et al. concerning the comparison of substantive models with the Mss, Anderson and Gerbing did not discuss the issue of the comparison of these models with MUF, as recommended by James et al. in the Condition 9 test.
In summary, the approach of Anderson and Gerbing (1988), based on recent statistical developments, brings a logic different from that of James et al. (1982) to the model evaluation process, and it should increase the probability of identifying the true model responsible for the observed data. Like James et al., they have proposed that a series of model comparisons be conducted among nested models. Unlike James et al., though, they have proposed that the measurement model be assessed independently prior to the estimation and evaluation of the full structural model (measurement and structural models combined). They have also proposed a decision-tree framework to be used to determine the order of model tests. The order of tests and decision rules for stopping model testing are also unlike those proposed by James et al, Anderson and Gerbing’s strategy of improving the measurement model first should result in better estimates of structural parameters and higher overall goodness of fit.
A Review of Current Modeling Practices in OBHRM Research
Now that background on fit indices and model comparison strategies has been provided, the next section will document their usage in recent OBHRM research. James and James’ (1989) review of causal modeling in organizational research provided the structure for the present review. Their review, which included manifest (e.g., path analysis) and latent variable studies in OBHRM published during the period 1978-1987, identified trends in types of research questions being addressed via the application of these techniques, as well as the level of sophistication with which these relatively new methods were being applied. However, the scope of the present review is more limited than that of James and James because the present review includes only latent variable studies. This paper builds upon their work by providing an updated review of the methods used by organizational researchers to assess goodness of fit in latent variable models. Specifically, the focus of this review is on multiple indicator, latent variable models in which causal hypotheses are being tested. Accordingly, confirmatory factor analytic studies, studies which employ manifest variable models (in which all constructs are specified as perfectly measured, i.e., path analysis), and pseudo latent variables models (in which all factor loadings are
JOURNAL OF MANAGEMENT, VOL. 20, NO. 2, 1994
STRUCTURAL MODEL EVALUATION 451
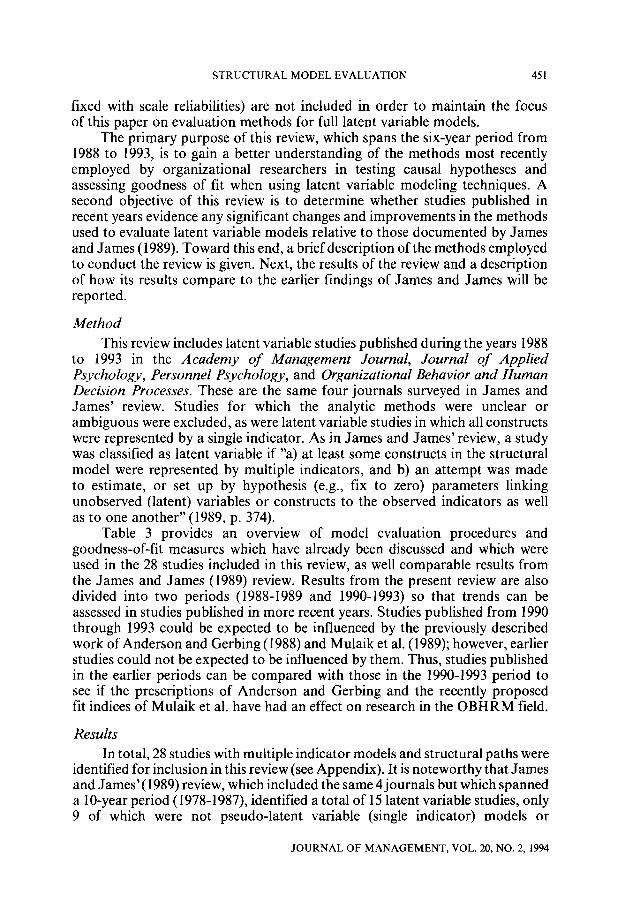
fixed with scale reliabilities) are not included in order to maintain the focus of this paper on evaluation methods for full latent variable models.
The primary purpose of this review, which spans the six-year period from 1988 to 1993, is to gain a better understanding of the methods most recently employed by organizational researchers in testing causal hypotheses and assessing goodness of fit when using latent variable modeling techniques. A second objective of this review is to determine whether studies published in recent years evidence any significant changes and improvements in the methods used to evaluate latent variable models relative to those documented by James and James (1989). Toward this end, a brief description of the methods employed to conduct the review is given. Next, the results of the review and a description of how its results compare to the earlier findings of James and James will be reported.
Method This review includes latent variable studies published during the years 1988
to 1993 in the Academy of Management Journal, Journal of Applied Psychology, Personnel Psychology, and Organizational Behavior and Human Decision Processes. These are the same four journals surveyed in James and James’ review. Studies for which the analytic methods were unclear or ambiguous were excluded, as were latent variable studies in which all constructs were represented by a single indicator, As in James and James’ review, a study was classified as latent variable if “a) at least some constructs in the structural model were represented by multiple indicators, and b) an attempt was made to estimate, or set up by hypothesis (e.g., fix to zero) parameters linking unobserved (latent) variables or constructs to the observed indicators as well as to one another” (1989, p. 374).
Table 3 provides an overview of model evaluation procedures and goodness-of-fit measures which have already been discussed and which were used in the 28 studies included in this review, as well comparable results from the James and James (1989) review. Results from the present review are also divided into two periods (1988-1989 and 1990-1993) so that trends can be assessed in studies published in more recent years. Studies published from 1990 through 1993 could be expected to be influenced by the previously described work of Anderson and Gerbing (1988) and Mulaik et al. (1989); however, earlier studies could not be expected to be influenced by them. Thus, studies published in the earlier periods can be compared with those in the 1990-1993 period to see if the prescriptions of Anderson and Gerbing and the recently proposed fit indices of Mulaik et al, have had an effect on research in the OBHRM field.
Results In total, 28 studies with multiple indicator models and structural paths were
identified for inclusion in this review (see Appendix). It is noteworthy that James and James’( 1989) review, which included the same 4 journals but which spanned a IO-year period (1978-1987), identified a total of 15 latent variable studies, only 9 of which were not pseudo-latent variable (single indicator) models or
JOURNAL OF MANAGEMENT, VOL. 20, NO. 2, 1994
452 MEDSKER, WILLIAMS, AND HOLAHAN
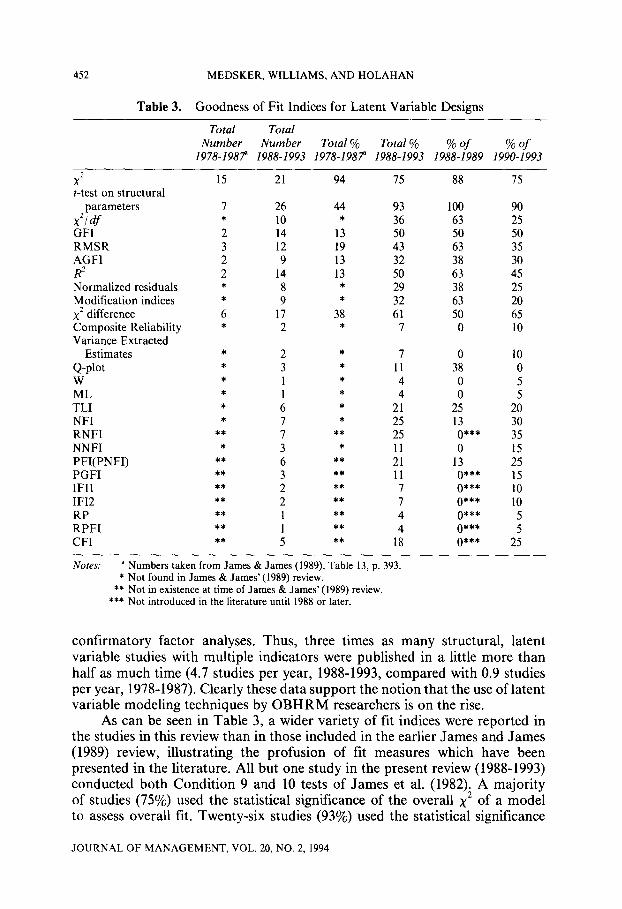
Table 3. Goodness of Fit Indices for Latent Variable Designs
Total Total Number Number Total % Total % % of % of
1978-1987” 1988-1993 1978-1987” 1988-1993 1988-1989 1990-1993
X2 t-test on structural
parameters
x21df GFI RMSR AGFI R’ Normalized residuals Modification indices x2 difference Composite Reliability Variance Extracted
Estimates Q-plot W ML TLI NFI RNFI NNFI PFI(PNF1) PGFI IF11 IF12 RP RPFI CFI
15
*
6 *
* 2 * 7 0 10 * 3 * 11 38 0 * 1 * 4 0 5 * 1 * 4 0 5 * 6 * 21 25 20 * 7 * 25 13 30
** 7 ** 25 0*** 35 * 3 * 11 0 15
** 6 ** 21 13 25 ** 3 ** 11 0*** 15 ** 2 ** 7 0*** 10 ** 2 ** 7 0*** 10 ** 1 ** 4 0*** 5 ** 1 ** 4 0*** 5 ** 5 ** 18 0*** 25
21 94 75 88 75
26 44 93 100 90 10 * 36 63 25 14 13 50 50 50 12 19 43 63 35 9 13 32 38 30
14 13 50 63 45 8 * 29 38 25 9 * 32 63 20
17 38 61 50 65 2 * 7 0 10
Notes: a Numbers taken from James & James (1989), Table 13, p. 393. * Not found in James & James’ (1989) review.
** Not in existence at time of James & James’ (1989) review. *** Not introduced in the literature until 1988 or later.
confirmatory factor analyses. Thus, three times as many structural, latent variable studies with multiple indicators were published in a little more than half as much time (4.7 studies per year, 1988-1993, compared with 0.9 studies per year, 1978-1987). Clearly these data support the notion that the use of latent variable modeling techniques by OBHRM researchers is on the rise.
As can be seen in Table 3, a wider variety of fit indices were reported in the studies in this review than in those included in the earlier James and James (1989) review, illustrating the profusion of fit measures which have been presented in the literature. All but one study in the present review (1988-1993) conducted both Condition 9 and 10 tests of James et al. (1982). A majority of studies (75%) used the statistical significance of the overall x2 of a model to assess overall fit. Twenty-six studies (93%) used the statistical significance
JOURNAL OF MANAGEMENT, VOL. 20, NO. 2, 1994
STRUCTURAL MODEL EVALUATION 453
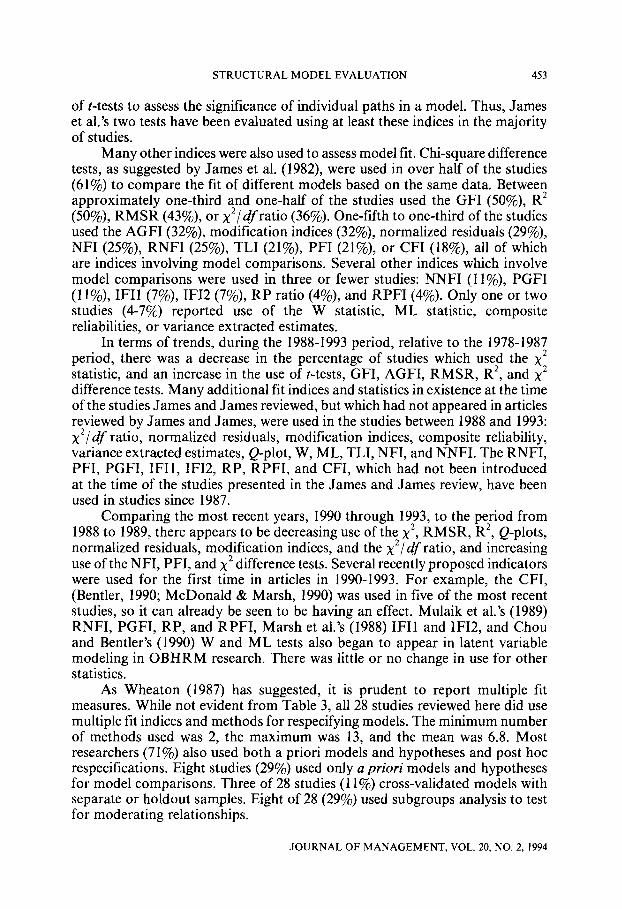
of t-tests to assess the significance of individual paths in a model. Thus, James et al.‘s two tests have been evaluated using at least these indices in the majority of studies.
Many other indices were also used to assess model fit. Chi-square difference tests, as suggested by James et al. (1982), were used in over half of the studies (61%) to compare the fit of different models based on the same data. Between approximately one-third and one-half of the studies used the GFI (50%), R* (50%), RMSR (43%), or X2/dfratio (36%). One-fifth to one-third of the studies used the AGFI (32Y) 0 , modification indices (32%), normalized residuals (29%>, NFI (25%), RNFI (25%), TLI (21%), PFI (21%) or CFI (18%), ail of which are indices involving model comparisons. Several other indices which involve model comparisons were used in three or fewer studies: NNFI (1 lye), PGFI (1 I%), IF11 (7%), IF12 (7%) RP ratio (4%), and RPFI (4%). Only one or two studies (4-7%) reported use of the W statistic, ML statistic, composite reliabilities, or variance extracted estimates.
In terms of trends, during the 1988-1993 period, relative to the 1978-1987 period, there was a decrease in the percentage of studies which used the x2 statistic, and an increase in the use of t-tests, GFI, AGFI, RMSR, R*, and x2 difference tests. Many additional fit indices and statistics in existence at the time of the studies James and James reviewed, but which had not appeared in articles reviewed by James and James, were used in the studies between 1988 and 1993: x2/ df ratio, normalized residuals, modification indices, composite reliability, variance extracted estimates, Q-plot, W, ML, TLI, NFI, and NNFI. The RNFI, PFI, PGFI, IFIl, IF12, RP, RPFI, and CFI, which had not been introduced at the time of the studies presented in the James and James review, have been used in studies since 1987.
Comparing the most recent years, 1990 through 1993, to the period from 1988 to 1989, there appears to be decreasing use of the x2, RMSR, R2, Q-plots, normalized residuals, modification indices, and the x*/df ratio, and increasing use of the NFI, PFI, and x2 difference tests. Several recently proposed indicators were used for the first time in articles in 1990-1993. For example, the CFI, (Bentler, 1990; McDonald & Marsh, 1990) was used in five of the most recent studies, so it can already be seen to be having an effect. Mulaik et al.‘s (1989) RNFI, PGFI, RP, and RPFI, Marsh et al’s (1988) IF11 and IF12, and Chou and Bentler’s (1990) W and ML tests also began to appear in latent variable modeling in OBHRM research. There was little or no change in use for other statistics.
As Wheaton (1987) has suggested, it is prudent to report multiple fit measures. While not evident from Table 3, all 28 studies reviewed here did use multiple lit indices and methods for respecifying models. The minimum number of methods used was 2, the maximum was 13, and the mean was 6.8. Most researchers (71%) also used both a priori models and hypotheses and post hoc respecilications. Eight studies (29%) used only a priori models and hypotheses for model comparisons. Three of 28 studies (11%) cross-validated models with separate or holdout samples. Eight of 28 (29%) used subgroups analysis to test for moderating relationships.
JOURNAL OF MANAGEMENT, VOL. 20, NO. 2, 1994
454 MEDSKER, WILLIAMS, AND HOLAHAN
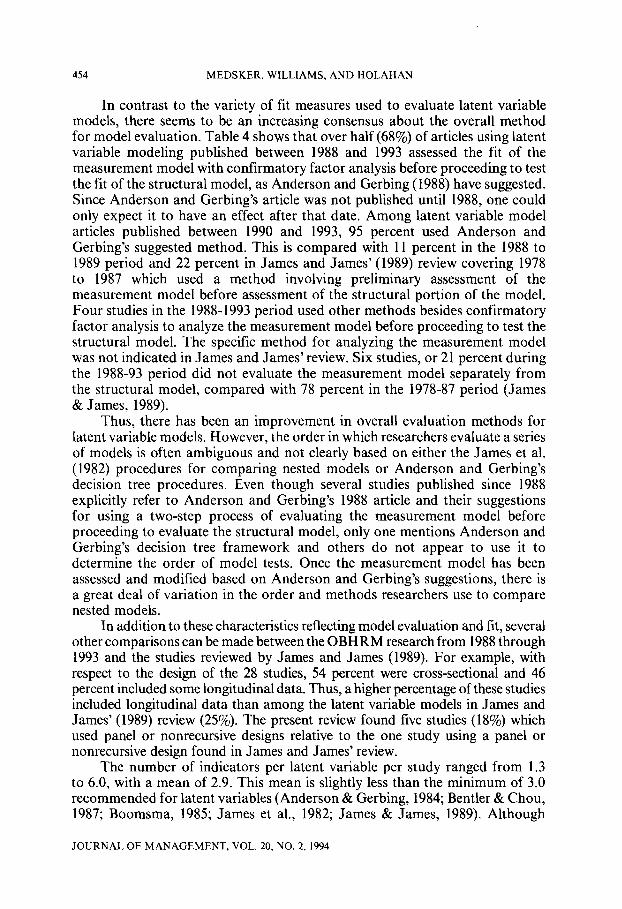
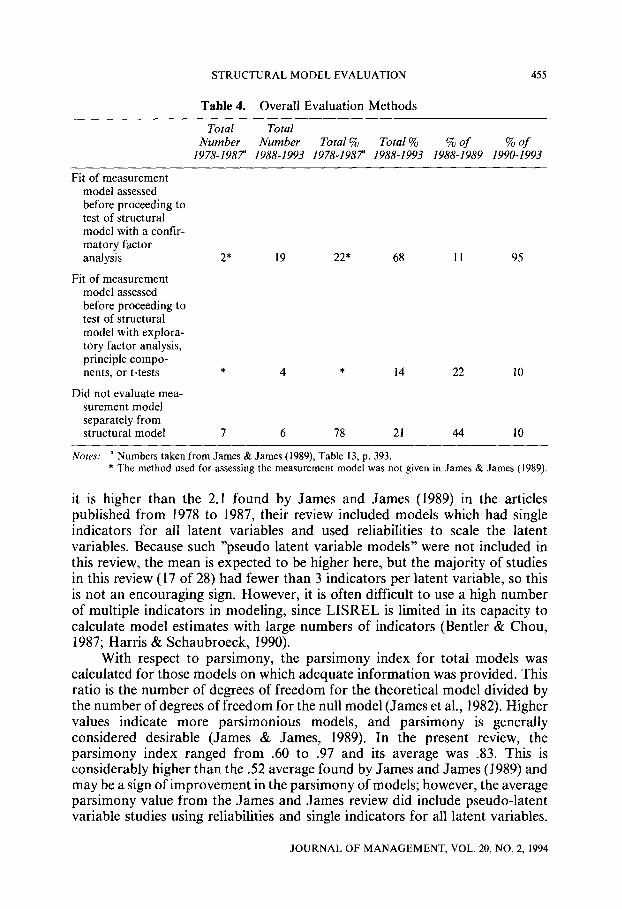
In contrast to the variety of fit measures used to evaluate latent variable models, there seems to be an increasing consensus about the overall method for model evaluation. Table 4 shows that over half (68%) of articles using latent variable modeling published between 1988 and 1993 assessed the fit of the measurement model with confirmatory factor analysis before proceeding to test the fit of the structural model, as Anderson and Gerbing (1988) have suggested. Since Anderson and Gerbing’s article was not published until 1988, one could only expect it to have an effect after that date. Among latent variable model articles published between 1990 and 1993, 95 percent used Anderson and Gerbing’s suggested method. This is compared with 11 percent in the 1988 to 1989 period and 22 percent in James and James’ (1989) review covering 1978 to 1987 which used a method involving preliminary assessment of the measurement model before assessment of the structural portion of the model. Four studies in the 1988-1993 period used other methods besides confirmatory factor analysis to analyze the measurement model before proceeding to test the structural model. The specific method for analyzing the measurement model was not indicated in James and James’ review. Six studies, or 21 percent during the 1988-93 period did not evaluate the measurement model separately from the structural model, compared with 78 percent in the 1978-87 period (James & James, 1989).
Thus, there has been an improvement in overall evaluation methods for latent variable models. However, the order in which researchers evaluate a series of models is often ambiguous and not clearly based on either the James et al. (1982) procedures for comparing nested models or Anderson and Gerbing’s decision tree procedures. Even though several studies published since 1988 explicitly refer to Anderson and Gerbing’s 1988 article and their suggestions for using a two-step process of evaluating the measurement model before proceeding to evaluate the structural model, only one mentions Anderson and Gerbing’s decision tree framework and others do not appear to use it to determine the order of model tests. Once the measurement model has been assessed and modified based on Anderson and Gerbing’s suggestions, there is a great deal of variation in the order and methods researchers use to compare nested models.
In addition to these characteristics reflecting model evaluation and fit, several other comparisons can be made between the OBHRM research from 1988 through 1993 and the studies reviewed by James and James (1989). For example, with respect to the design of the 28 studies, 54 percent were cross-sectional and 46 percent included some longitudinal data. Thus, a higher percentage of these studies included longitudinal data than among the latent variable models in James and James’ (1989) review (25%). The present review found five studies (18%) which used panel or nonrecursive designs relative to the one study using a panel or nonrecursive design found in James and James’ review.
The number of indicators per latent variable per study ranged from 1.3 to 6.0, with a mean of 2.9. This mean is slightly less than the minimum of 3.0 recommended for latent variables (Anderson & Gerbing, 1984; Bentler & Chou, 1987; Boomsma, 1985; James et al., 1982; James & James, 1989). Although
JOURNAL OF MANAGEMENT, VOL. 20, NO. 2, 1994
STRUCTURAL MODEL EVALUATION
Table 4. Overall Evaluation Methods
455
Total Total Number Number Total % Total % % of % of
1978-1987” 1988-1993 1978-1987” 1988-1993 1988-1989 1990-1993
Fit of measurement model assessed before proceeding to test of structural model with a confir- matory factor analysis
Fit of measurement
2* 19 22* 68 11 95
model assessed before proceeding to test of structural model with explora- tory factor analysis, principle compo- nents, or t-tests * 4 * 14 22 10
Did not evaluate mea- surement model separately from structural model 7 6 78 21 44 10
Notes: a Numbers taken from James &James (1989), Table 13, p. 393. * The method used for assessing the measurement model was not given in James & James (1989).
it is higher than the 2.1 found by James and James (1989) in the articles published from 1978 to 1987, their review included models which had single indicators for all latent variables and used reliabilities to scale the latent variables. Because such “pseudo latent variable models” were not included in this review, the mean is expected to be higher here, but the majority of studies in this review (17 of 28) had fewer than 3 indicators per latent variable, so this is not an encouraging sign. However, it is often difficult to use a high number of multiple indicators in modeling, since LISREL is limited in its capacity to calculate model estimates with large numbers of indicators (Bentler & Chou, 1987; Harris & Schaubroeck, 1990).
With respect to parsimony, the parsimony index for total models was calculated for those models on which adequate information was provided. This ratio is the number of degrees of freedom for the theoretical model divided by the number of degrees of freedom for the null model (James et al., 1982). Higher values indicate more parsimonious models, and parsimony is generally considered desirable (James & James, 1989). In the present review, the parsimony index ranged from .60 to .97 and its average was .83. This is considerably higher than the .52 average found by James and James (1989) and may be a sign of improvement in the parsimony of models; however, the average parsimony value from the James and James review did include pseudo-latent variable studies using reliabilities and single indicators for all latent variables.
JOURNAL OF MANAGEMENT, VOL. 20, NO. 2, 1994
456 MEDSKER, WILLIAMS, AND HOLAHAN
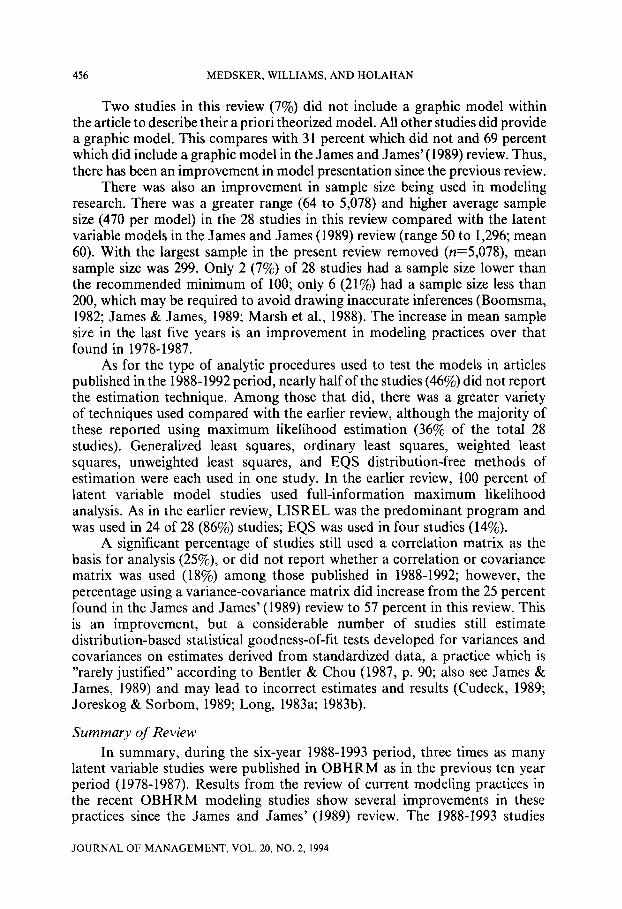
Two studies in this review (7%) did not include a graphic model within the article to describe their a priori theorized model. All other studies did provide a graphic model. This compares with 31 percent which did not and 69 percent which did include a graphic model in the James and James’ (1989) review. Thus, there has been an improvement in model presentation since the previous review.
There was also an improvement in sample size being used in modeling research. There was a greater range (64 to 5,078) and higher average sample size (470 per model) in the 28 studies in this review compared with the latent variable models in the James and James (1989) review (range 50 to 1,296; mean 60). With the largest sample in the present review removed (n=5,078), mean sample size was 299. Only 2 (7%) of 28 studies had a sample size lower than the recommended minimum of 100; only 6 (21%) had a sample size less than 200, which may be required to avoid drawing inaccurate inferences (Boomsma, 1982; James & James, 1989; Marsh et al., 1988). The increase in mean sample size in the last five years is an improvement in modeling practices over that found in 1978-1987.
As for the type of analytic procedures used to test the models in articles published in the 1988-1992 period, nearly half of the studies (46%) did not report the estimation technique. Among those that did, there was a greater variety of techniques used compared with the earlier review, although the majority of these reported using maximum likelihood estimation (36% of the total 28 studies). Generalized least squares, ordinary least squares, weighted least squares, unweighted least squares, and EQS distribution-free methods of estimation were each used in one study. In the earlier review, 100 percent of latent variable model studies used full-information maximum likelihood analysis. As in the earlier review, LISREL was the predominant program and was used in 24 of 28 (86%) studies; EQS was used in four studies (14%).
A significant percentage of studies still used a correlation matrix as the basis for analysis (25%), or did not report whether a correlation or covariance matrix was used (18%) among those published in 1988-1992; however, the percentage using a variance-covariance matrix did increase from the 25 percent found in the James and James’ (1989) review to 57 percent in this review. This is an improvement, but a considerable number of studies still estimate distribution-based statistical goodness-of-fit tests developed for variances and covariances on estimates derived from standardized data, a practice which is “rarely justified” according to Bentler & Chou (1987, p. 90; also see James & James, 1989) and may lead to incorrect estimates and results (Cudeck, 1989; Joreskog & Sorbom, 1989; Long, 1983a; 1983b).
Summary of Review
In summary, during the six-year 1988-1993 period, three times as many latent variable studies were published in OBHRM as in the previous ten year period (1978-1987). Results from the review of current modeling practices in the recent OBHRM modeling studies show several improvements in these practices since the James and James’ (1989) review. The 1988-1993 studies
JOURNAL OF MANAGEMENT, VOL. 20, NO. 2, 1994
STRUCTURAL MODEL EVALUATION 457
included a higher percentage which involved longitudinal data, a higher average parsimony ratio across studies, a higher percentage of articles which included a graphic model to describe the a priori theoretical model, a higher average sample size, and a higher percentage of studies basing estimation on the variance-covariance matrix, rather than a correlation matrix. All but one study used methods to evaluate that paths predicted to be nonzero were in fact significant, and to evaluate that paths predicted to be zero were in fact nonsignificant, as suggested by James et al. (1982). All studies used multiple fit measures, as suggested by Wheaton (1987). A higher percentage of studies used a two-step process to evaluate models, in which the measurement model was assessed prior to evaluation of the full model, than in the review of studies published from 1978 to 1987 (James & James, 1989). Thus, in general, many improvements have been made in the evaluation and testing of latent variable models in OBHRM research published in the last five years, compared with those published in the previous ten years.
Recommendations for Future Modeling
Based on this review of the literature on latent variable model evaluation, several recommendations can be made for improving modeling practices. First, there needs to be more consistency in OBHRM studies regarding the sequencing of model comparisons and the assessment of measurement models. We recommend the strategy proposed by Anderson and Gerbing (1988) and the specific ordering of nested model comparisons presented in their decision-tree framework. As noted previously, this strategy deals with the non-additive characteristic of the x2 statistic as related to nested models, and it also satisfies the need for the Condition 10 test as described by James et al. (1982). However, we also suggest that researchers conclude their model evaluation process by comparing the chosen substantive model with the MSN, thus achieving the Condition 9 test as recommended by James et al. (1982).
Modelers should also adopt Anderson and Gerbing’s suggested two-step process of evaluating the measurement model prior to evaluation of the structural portion of a model. Specifically, the examination of residual patterns and the internal and external consistency of latent variables’ indicators can be used to locate measurement model misspecification, as described by Anderson and Gerbing. We recommend supplementing these measurement model diagnostics with the use of the composite reliability and variance extracted estimates as presented in prior sections of this paper. Also, researchers should not forget that there is a role for exploratory factor analysis in assessing measurement models prior to the use of confirmatory factor analysis as discussed in this paper. The eigenvalues and associated complete set of factor loadings resulting from exploratory factor analysis can give useful information regarding the adequacy of items and scales used as indicators in structural equation modeling. In summary, as shown in the review in the present paper, approximately one-fourth of the studies examined did not evaluate the measurement model prior to examining substantive models. In the absence of
JOURNAL OF MANAGEMENT, VOL. 20, NO. 2, 1994
458 MEDSKER, WILLIAMS, AND HOLAHAN
this information, it is impossible to know how much of the poor fit of any theoretical model is due to the measurement model upon which it is based.
With respect to measurement model issues, we also recommend that OBHRM researchers examine their data for evidence of method variance effects. Data analysis strategies exist that allow for the integration of method variance concerns into the latent variable structural equation models. For example, Williams and Anderson (1994) have described how measured method effect variables, such as social desirability and negative affectivity, can be examined with latent variables using the all-Y specification of LISREL. A comparable approach to acquiescent response bias using structural equation modeling techniques has been provided by Watson (1992). Additionally, Williams, Anderson and Williams (1992) have demonstrated how reverse- coding effects can be accommodated in latent variable models through the use of correlated uniquenesses (random error variances) associated with reverse- worded exogenous and endogenous indicators. Finally, while it has not been described in the literature, it should also be possible to extend the correlated uniqueness approach now being recommended with Multitrait-Multimethod (MTMM) studies (e.g., Marsh, 1989; Marsh & Bailey, 1991) to those organizational contexts involving the use of multiple informants (e.g., Kumar & Dillon, 1990) to measure exogenous and endogenous constructs.
A final concern regarding measurement issues and latent variable models with OBHRM studies involves assumptions made about the link between latent factors and their indicators. Cohen, Cohen, Teresi, Marchi and Velez (1990) have contrasted two measurement perspectives in which observed indicators are either consequences of underlying latent variables (as typically assumed), or are in fact causes of the latent variables. In essence, this latter perspective involves reversing the direction of the arrows between latent variables and their indicators. Most importantly, Cohen et al. warn that the underlying theory may often be more consistent with the second perspective, and they discuss the implications of this type of misspecification on parameter estimates representing relationships among latent variables. This issue is also discussed by Bollen and Lennox (199 1) and MacCallum and Browne (1993). Based on these concerns, OBHRM researchers would be advised to insure that the causal processes presumed to generate scores on observed indicators are consistent with the common latent variable approach in which these scores are assumed to be consequences of underlying factors.
A second set of recommendations involves the need for the development of a priori theoretical models. Of the 28 studies in the present review, only 29 percent used only a priori models and hypotheses for model comparisons, and only 11 percent cross-validated their models with separate samples. This need for greater development of a priori theoretical models was noted in the prior review by James and James (1989) and has also been emphasized by Bentler and Chou (1987). More recently, MacCallum, Roznowski and Necowitz (1992) have noted that researchers generally ignore cautions and warnings regarding model modification and proceed with many model changes without cross- validation and with too small of sample sizes. They further note that although
JOURNAL OF MANAGEMENT, VOL. 20, NO. 2, 1994
STRUCTURAL MODEL EVALUATION 459
many model modifications are highly interpretable, researchers should have represented these possible alternative models with their initial model. In the absence of a priori specification, these modified models will likely be greatly influenced by chance.
Nevertheless, for those cases in which post hoc modifications based on an examination of data are made, two recommendations can be offered. First, when used alone, modification indices have been found to be unreliable indicators of the location of specification errors in simulations, to lead to misleading results, and to suggest freeing substantively implausible parameters (Kaplan, 1988; MacCallum, 1986). We suggest these indices be used in conjunction with the Standardized Expected Parameter Change statistic (SEPC; Kaplan, 1989). The SEPC indicates the approximate size of a parameter which would be freed based on its modification index from a model in which the parameter is assumed to be zero. This index helped identify substantively interesting parameters in several examples (Kaplan, 1989). Kaplan (1990) has described a strategy for model modification based on combined use of modification indices and SEPCs. Second, for cases in which model modifications are made, we recommend two single-sample cross-validation indices and a parallel specification search procedure (MacCallum et al., 1992).
A final issue regarding model specification involves assumptions made about residuals of structural equations. Although it was not documented in the previous review, in nearly all of the OBHRM studies examined it was assumed that these residuals were uncorrelated. This practice occurred in spite of the fact that this assumption was often not necessary, which is to say that it may have been possible to estimate the correlations among some or all of the residuals in these studies. Existing OBHRM theories often lead to the conclusion that such residual correlations are appropriate. For example, Anderson and Williams (1992) have examined the case of employee attitudes and found considerable overlap in the range of predictor variables associated with job satisfaction and organizational commitment. They argued that if any of these predictors were not included in a study of these attitudes, the assumption of uncorrelated residuals for the satisfaction and commitment equations was inappropriate. Most importantly, in a reanalysis of two data sets they found conclusions reached about the substantive relationships between satisfaction and commitment were greatly influenced by assumptions about residual correlations. In summary, OBHRM researchers using theoretically specified a priori models with appropriate consideration given to assumptions about residuals and unmeasured variables, and who make model modifications based on the above techniques, are more likely to achieve success in their model search and identify correct and replicable models.
Third, many fit measures used by OBHRM researchers, as shown in the present review, are now known to have problems. Specifically, the x2 statistic (Bearden, Sharma & Teel, 1982; Bentler & Bonnett, 1980; Gerbing & Anderson, 1992; LaDu & Tanaka, 1989; Marsh & Hocevar, 1985; Marsh et al., 1988; Mulaik et al., 1989), X2/dfratio (Marsh et al., 1988), NFI (Bearden et al., 1982; Bollen, 1990; LaDu & Tanaka, 1989; Marsh et al., 1988; McDonald & Marsh,
JOURNAL OF MANAGEMENT, VOL. 20, NO. 2, 1994
460 MEDSKER, WILLIAMS, AND HOLAHAN
1990; Mulaik et al., 1989), GFI (Anderson & Gerbing, 1984; Bollen, 1990; Gerbing & Anderson, 1992; Marsh et al., 1988; McDonald & Marsh, 1990; Mulaik et al., 1989), AGFI (Anderson & Gerbing, 1984; Gerbing & Anderson, 1992; Marsh et al., 1988; McDonald & Marsh, 1990; Mulaik et al., 1989), RMSR (Anderson & Gerbing, 1984; Gerbing & Anderson, 1992; Marsh et al., 1988), and IF11 (class I indices, Marsh et al., 1988) have all been reported to be sensitive to sample size differences, as well as to have various other problems (e.g., most fit indices do not estimate any known population parameters, Bentler, 1990; some indices indicate poorer fit as the number of indicators per latent variable increase, Gerbing & Anderson, 1992).
At this stage, it seems best to recommend use of the RN1 (McDonald & Marsh, 1990) and CFI (Bentler, 1990) as measures of fit, since they correspond to a population parameter. These indices have also been recommended by Goffin (1993) and Gerbing and Anderson (1992). The CFI is recommended as being the best approximation of the population value for a single model, but the RN1 is recommended as more informative in those cases involving model comparison when the RF1 and CFI are not equal (due to the fact that the CFI is normed, or restricted to the range of 0 to I). In many cases it will be desirable to isolate effects associated with the measurement model, and the use of the RNFI of Mulaik et al. (1989) may be recommended. However, it should be noted that Williams and Holahan (In press) have developed a noncentrality parameter-based variation of this index which may have advantages over the index of Mulaik et al. For those settings in which a parsimony-type index is needed to account for the number of estimated parameters in a model, the TLI (or NNFI), PNF12, and RPFI are possibilities. Alternatively, Williams and Holahan (1994) also evaluated two additional parsimony indices of potential interest to OBHRM researchers, the Akaike Information Criteria (AIC; Akaike, 1987) and the Root Mean Square Standardized Effect index described by Steiger (RMS, 1990). Williams and Holahan recommend careful use of parsimony indices, in which authors are sensitive to effects due to the number of indicators in their models and whether they are using such indices to support models with empirically demonstrated misspecifications. As suggested by Wheaton (1987), multiple fit indices should be reported to represent different aspects of model fit (e.g., overall model fit, separate evaluation of structural and measurement models, nested model comparisons, fit relative to model parsimony). As Gerbing and Anderson (1992, p. 134) point out, there is not one best fit index and, “there may never be a single index that should always be used to the exclusion of others.” Finally, it should be noted that the area of fit indices is one of continuing developments, and OBHRM researchers are encouraged to follow these changes and incorporate them into their own work.
Two other minor issues identified in the review warrant comment. First, a fourth of the studies examined were based on the analysis of correlation matrices. This practice has been known to be problematic for several years, and the recent discussion of Cudeck (1989) offers further clarification on specific consequences of this practice, such as its effects on test statistics and standard errors of estimates. Future modeling analyses should be based on the analysis
JOURNAL OF MANAGEMENT, VOL. 20, NO. 2, 1994
STRUCTURAL MODEL EVALUATION 461
of covariance structures. Second, there are many deficiencies with respect to information included in OBHRM articles using latent variable methodology. For example, nearly half of the reviewed studies did not report the type of estimation technique used. Future articles should report this information, as well as other technical aspects of model fitting. Steiger (1988) can be used as a guide to determine what should be included.
Appendix
Latent Variable Studies Included in the Review
Ashforth, B. E. (1989). The experience of powerlessness in organizations. Organizational Behavior and Human Decision Processes, 43: 207-242.
Carter, N. M. (1990). Small firm adaptation: Responses of physicians’ organizations to regulatory and competitive uncertainty. Academy of Management Journal, 33: 307-333.
Davy, J. A. & Shipper, F. (1993). Voter behavior in union certification elections: A longitudinal study. Academy of Management Journal, 36: 187-I 99.
Farh, J. L. & Dobbins, G. H. (1989). Effects of self esteem on leniency bias in self-reports of performance: A structural equation model analysis. Personnel Psychology, 42: l-15.
Graves, L. M. & Powell, G. N. (1988). An investigation of sex discrimination in recruiters’ evaluations of actual applicants. Journal of Applied Psychology, 73: 20-29.
Horn, P. W. & Griffeth, R. W. (1991). Structural equations modeling test of a turnover theory: Cross-sectional and longitudinal analysis. Journal of Applied Psychology, 76: 350-366.
Jaros, S. J., Jermier, J. M., Koehler, J. W. & Sincich, T. (1993). Effects of continuance, affective, and moral commitment on the withdrawal process: An evaluation of eight structural equation models. Academy of Management Journal, 36: 95 l-995.
Judge, T. A. & Locke, E. A. (1993). Effect of dysfunctional thought processes on subjective well-being and job satisfaction. Journal of Applied Psychology, 78: 475-490.
Keats, B. W. & Hitt, M. A. (1988). A causal model of linkages among environmental dimensions, macro organizational characteristics, and performance. Academy of Management Journal, 31: 570-598.
Kulik, C. T., Oldham, G. R. Rc Langner, P. H. (1988). Measurement of job characteristics: Comparison of the original and the revised job diagnostic survey. Journal of Applied Psychology, 73; 462-466.
MacKenzie, S. B., Podsakoff, P. M. & Fetter, R. (1991). Organizational citizenship behavior and objective productivity as determinants of managerial evaluations of salespersons’ performance. Organizational Behavior and Human Decision Processes: 50, 123- 150.
Mathieu, J.E. (1991). A cross-level nonrecursive model of the antecedents of organizational commitment and satisfaction. Journal of Applied Psychology, 76: 607-618.
Mathieu, J. E., Hofmann, D. A., & Farr, J. L. (1993). Job perception-job satisfaction relations: An empirical comparison of three competing theories. Organizational Behavior and Human Decision Processes, 56: 370-387.
Meyer, J. P., Allen, N. J. & Gellatly, I. R. (1990). Affective and continuance commitment to the organization: Evaluation of measures and analysis of concurrent and time-lagged relations. Journal of Applied Psychology, 75: 710-720.
Miceli, M. P., Jung, I., Near, J. P. & Greenberger, D. B. (1991). Predictors and outcomes of reactions to pay-for-performance plans, Journal of Applied Psychology, 76: 508-52 1.
Miller, D., Droge, C. & Toulouse, J. (1988). Strategic process and content as mediators between organizational context and structure. Academy of Management Journal, 31: 544-569.
Moorman, R.H. (1991). Relationship between organizationaljustice and organizational citizenship behaviors: Do fairness perceptions influence employee citizenship? Journal of Applied Psychology, 76: 845-855.
Mumford, M. D., Weeks, J. L., Harding, F. D. & Fleishman, E. A. (1988). Relations between student characteristics, course content, and training outcomes: An integrative modeling effort. Journal of Applied Psychology, 73: 443456.
Netemeyer, R. Cl., Johnston, M. W. & Burton, S. (1990). Analysis of role conflict and role ambiguity in a structural equations framework. Journal of Applied Psychology, 75: 148-157.
Prussia, G. E., Kinicki, A. J. & Bracker, J. S. (1993). Psychological and behavioral consequences of job loss: A covariance structure analysis using Weiner’s (1985) attribution model. Journal of Applied Psychology, 78: 382-394.
JOURNAL OF MANAGEMENT, VOL. 20, NO. 2, 1994
462 MEDSKER, WILLIAMS, AND HOLAHAN
Sawyer, J. E. (1992). Goal and process clarity: Specification of multiple constructs of role ambiguity and a structural equational model of their antecedents and consequences. Journal ofApplied Psychology, 77: 130-142.
Schaubroeck, J., Ganster, D. C. & Fox, M. L. (1992). Dispositional affect and work-related stress. Journal of Applied Psychology, 77: 322-335.
Stacy, A. W., MacKinnon, D. P. & Pentz, M. A. (1993). Generality and specificity in health behavior: Application to warning label and social influence expectancies. Journal of Apphed Psychology, 78: 61 l-627.
Stein, J. A., Smith, G. M., Guy, S. M. & Bentler, P. M. (1993). Consequences of adolescent drug use on young adult job behavior and job satisfaction. Journal of Applied Psychology, 78: 463474.
Vance, R. J., Coovert, M. D., MacCallum, R. C. & Hedge, J.W. (1989). Construct models of task performance. Journal of Applied Psychology, 74: 447-455.
Vandenberg, R. J. & Scarpello, V. (1990). The matching model: An examination of the processes underlying realistic job previews. Journal of Applied Psychology, 75: 60-67.
Woehr, D. J. & Feldman, J. (1993). Processing objective and question order effects on the causal relation between memory and judgment in performance appraisal: The tip of the iceberg. Journal of Applied Psychology, 78: 232-24 1.
References
Akaike, H. (1987). Factor analysis and AIC. Psychotnetrika, 52: 3 17-332. Anderson, J. C. & Gerbing, D. W. (1984). The effect of sampling error on convergence, improper solutions,
and goodness-of-fit indices for maximum likelihood confirmatory factor analysis. Psychonzetrika, 49: 155-173.
Anderson, J. C. & Gerbing, D. W. (1988). Structural equation modeling in practice: A review and recommended two-step approach. Psychological Bulierin, 103: 41 l-423.
Anderson, S. E. & Williams, L. J. (1992). Assumptions about unmeasured variables with studies of reciprocal relationships: The case of employee attitudes. Journal of Applied Psychology, 77:638-650.
Bearden, W. O., Sharma, S. & Teel, J. E. (1982). Sample size effects on chi-square and other statistics used in evaluating causal models. Journal of Marketing Research, 19: 425430.
Bentler, P. M. (1985). Theory and implementation of EQS: A strucrural equations program. Los Angeles: BMDP Statistical Software.
___. (1989). E&S sfructural equations program manual. Los Angeles: BMDP Statistical Software. ~. (1990). Comparative fit indexes in structural models. Psychological Bulletin, 207: 238-246. Bentler, P. M. & Bonnett, D. G. (1980). Significance tests and goodness of lit in the analysis of covariance
structures. Psychological Bulletin, 88: 588-606. Bentler, P. M. & Chou, C. (1987). Practical issues in structural modeling. SociologicalMethodsand Research,
16: 78-l 17. Bollen, K. A. (1989). A new incremental tit index for general structural equation models. Sociological Methods
and Research, 17: 303-316. ___. (1990). Overall fit in covariance structure models: Two types of sample size effects. Psychological
Bulletin, 107: 256-259. Bollen, K. & Lennox, R. (1991). Conventional wisdom on measurement: A structural equation perspective.
Psychological Bulletin, 110: 305-3 14. Boomsma, A. (1982). The robustness of LISREL against small sample sizes in factor analysis models. Pp.
149-173 in K. G. Joreskog & H. Wold (Eds.), Systems under indirect observation: Causality, structure, prediction, Part 1. Amsterdam: North-Holland Publishing.
___. (1985). Nonconvergence, improper solutions, and starting values in LISREL maximum likelihood estimation. Psychometrika, 50: 229-242.
Carmines, E. G. & Mclver, J. P. (1981). Analyzing models with unobservable variables. Pp. 65-l 15 in G. W. Bohrnstedt & E. F. Borgatta (Eds.), Social measurement: Current issues. Beverly Hills: Sage.
Chou, C.-P. & Bentler, P. M. (1990). Model modification in covariance structure modeling: A comparison among likelihood ratio, Lagrange Multiplier, and Wald tests. Muhivariate Behavioral Research, 25: 115-136.
Cliff, N. (1983). Some cautions concerning the application of causal modeling methods. Muhivariate Behavioral Research, 18: 115-l 26.
Cohen, P., Cohen, J., Teresi, J., Marchi, M. & Velez, C. N. (1990). Problems in the measurement of latent variables in structural equations causal models. Apphed Psychological Measuremew 14: 183-196.
Cudeck, R. (1989). Analysis of correlation matrices using covariance structure models. Psychological Bulletin, 105: 317-327.
JOURNAL OF MANAGEMENT, VOL. 20, NO. 2, 1994
STRUCTURAL MODEL EVALUATION 463
Cuttance, P. (1987). Issues and problems in the application of structural equation models. In P. Cuttance & R. Ecob (Eds.), Structural modeling by example. New York: Cambridge University Press.
Earley, P. C. & Lituchy, T. R. (1991). Delineating goal and efficacy effects: A test of three models. Journal of Applied Psychology, 76: 81-98.
Farh, J. L. & Dobbins, Cl. H. (1989). Effects of self-esteem on leniency bias in self-reports of performance: A structural equation model analysis. Personnel Psychology, 42: 835-850.
Fornell, C. & Larcker, D. F. (1981). Evaluating structural equation models with observable variables and measurement error. Journal of Marketing Research, 18: 39-50.
Gerbing, D. W. & Anderson, J. C. (1992). Monte Carlo evaluations of goodness of fit indices for structural equation models. Sociological Methods and Research, 21: 132-160.
Coffin, R. D. (1993). A comparison of two new indices for the assessment of fit of structural equation models. Multivariate Behavioral Research, 28: 205-214.
Graves, L. M. & Powell, Cl. N. (1988). An investigation of sex discrimination in recruiters’ evaluations of actual applicants. Journal of Applied Psychology, 73: 20-29.
Harris, M. M. & Schaubroeck, J. (1990). Confirmatory modeling in organizational behavior/ human resource management: Issues and applications. Journal of Management, 16: 337-360.
Horn, P. W. & Griffeth, R. W. (1991). Structural equations modeling test of a turnover theory: Cross-sectional and longitudinal analysis. Journal of Applied Psychology, 76: 350-366.
James, L. R. & Brett, J. M. (1984). Mediators, moderators, and tests for mediation. Journal of Applied Psychology, 69: 307-321.
James, L. R. &James, L. A. (1989). Causal modeling in organizational research. Pp. 371-404 in C. L. Cooper & I. Robertson (Eds.): International review of industrial and organizationalpsychology. New York: John Wiley.
James, L. R., Mulaik, S. A. & Brett, J. M. (1982). Causal analysis: Assumptions, models, and data. Beverly Hills: Sage.
Joreskog, K. G. (1969). A general approach to confirmatory maximum likelihood factor analysis. Psychometrika, 34: 183-202.
Joreskog, K. G. & Sorbom, D. (I 989). Lisrel7: A guide to the program and applications, 2nd ed. Chicago: SPSS.
Kaplan, D. (1988). The impact of specification error on the estimation, testing, and improvement of structural equation models. Multivariate Behavioral Research, 23: 69-86.
___. (1989). Model modification in covariance structure analysis: Application of the expected parameter change statistic. Mulfivariafe Behavioral Research, 24: 285-305.
___. (1990). Evaluating and modifying covariance structure models: A review and recommendation. Multivariate Behavioral Research, 25: 137-155.
Kumar, A. & Dillon, W. R. (1990). On the use of confirmatory measurement models in the analysis of multiple- informant reports. Journal of Marketing Research, 27: 102-I I 1.
La Du, T. J. & Tanaka, J. S. (1989). Influence of sample size, estimation method, and model specification on goodness-of-fit assessments in structural equation models. Journalof Applied Psychology, 74: 625- 635.
Long, J. S. (1983a). Confirmatory factor analysis: A preface to LISREL. Beverly Hills: Sage. ___. (1983b). Covariance structure models: An introduction fo LZSREL. Beverly Hills: Sage. Mac&hum, R. C. (1986). Specification searches in covariance structure modeling. Psychological Bulletin,
100: 107-120. MacCallum, R. C. & Browne, M. W. (1993). The use of causal indicators in covariance structure models:
Some practical issues. Psychological Bulletin, 114: 533-541, MacCallum, R. C., Roznowski, M. & Necowitz, L. B. (1992). Model modifications in covariance structure
analysis: The problem of capitalization on chance. Psychological Bulletin, 111: 490-504. Marsh, H. W. (1989). Confirmatory factor analyses. In J.P. Keeves (Ed.), Educationalresearch methodology,
measurement, and evaluation: An international handbook. Oxford: Pergamon Press. Marsh, H. W. & Bailey, M. (1991). Confirmatory factor analyses of multritrait-multimethod data: A
comparison of alternative models. Applied Psychological Measurement, IS: 47-70. Marsh, H. W., Balla, J. R. & McDonald, R. P. (1988). Goodness-of-fit indices in confirmatory factor analysis:
The effect of sample size. Psychological Bulletin, 103: 391410. Marsh. H. W. & Hocevar. D. (1985). Auolications of confirmatorv factor analvsis to the studv of self-conceot:
First-and higher order factor models and their invariance across groups. Psychological Bulletin, 97: 562-582.
McDonald, R. P. & Marsh, H. W. (1990). Choosing a multivariate model: Noncentrality and goodness of fit. Psychological Bulletin, 107: 247-255.
Miceli, M. P., Jung, I., Near, J. P. & Greenberger, D. B. (1991). Predictors and outcomes of reactions to pay-for-performance plans. Journal of Applied Psychology, 76: 508521.
JOURNAL OF MANAGEMENT, VOL. 20, NO. 2, 1994

464 MEDSKER, WILLIAMS, AND HOLAHAN
Mulaik, S. A., James, L. R., Van Alstine, J., Bennett, N., Lind, S. & Stillwell, C. D. (1989). An evaluation of goodness-of-fit indices for structural equation models. Psychological Bulletin, 105: 430445.
Podsakoff, P. M., Williams, L. J. & Todor, W. D. (1986). Effects of organizational formalization on alienation among professionals and nonprofessionals. Academy of Manugemenr Journal, 29: 820-83 1.
Steiger, J. H. (1988). Aspects of person-machine communication in structural modeling of correlations and covariances. Multivariate Behavioral Research, 23: 281-290.
___. (1990). Structural mode1 evaluation and modification: An interval estimation approach. Multivariate Behavioral Research. 25: 173-180.
Steiger, J. H., Shapiro, A. & Browne, M. W. (1985). On the multivariate asymptotic distribution of sequential chi-square statistics. Psychometrika, 50: 253-264.
Tanaka, J. S. & Huba, G. J. (1985). A fit index for covariance structure models under arbitrary GLS estimation. British Journal of Mathematical and Statistical Psychology, 38: 197-201.
Tucker, L. & Lewis, C. (1973). A reliability coefficient for maximum likelihood factor analysis. Psychometrika, 38: l-10.
Watson, D. (1992). Correcting for acquiescent response bias in the absence of a balanced scale. Sociological Methods and Research, 21: 52-88.
Wheaton, B. (1987). Assessment of tit in overidentified models with latent variables. Sociological Methods and Research, 16: 118-154.
Wheaton, B., Muthen, B., Alwin, D. & Summers, G. (1977). Assessing reliability and stability in pane1 models. In D.R. Heise (Ed.), Sociological methodology 1977. San Francisco: Jossey-Bass.
Williams, L. J. & Anderson, S. E. (1994). An alternative approach to method effects using latent variable models: Applications in organizational behavior research. Journal of Applied Psychology, 79:
Williams, L. J., Anderson, S. E. & Williams, M. L. (1992). A comparison of two approaches to reverse coding effects with role stress measures. West Lafayette, IN: Krannert Graduate School of Management, Purdue University.
Williams, L. J., Cote, J. A. & Buckley, M. R. (1989). Lack of method variance in self-reported affect and perceptions at work: Reality or artifact? Journal of Applied Psychology, 74: 462-468.
Williams, L. J. & Holahan, P. J. In press. Parsimony fit indices for multiple indicator regression models: Do they work? Structural Equation Modeling: A Multidisciplinary Journal.
Williams, L. J. & James, L. R. In press. Causal models in organizational behavior research: From path analysis to LISREL and beyond. In J. Greenberg (Ed.), Organizational behavior: Z’he state of the science. Hillsdale, NJ: Lawrence Erlbaum Associates.
Williams, L. J. & Podsakoff, P. M. (1989). Longitudinal field methods for studying reciprocal relationships in organizational behavior research: Toward improved causal analysis. Pp. 247-292 in L.L Cummings & B.M. Staw (Eds.), Research in organizarionai behavior, Vol. 11: Greenwich, CT: JAI Press. -
Wise, L. L., McHenry, J. & Campbell, J.P. (1990). Identifying optimal predictor composites and testing for generalizability across jobs and performance factors. Personnel Psychology, 43: 355366.
JOURNAL OF MANAGEMENT, VOL. 20, NO. 2, 1994
Related Documents