Address. 700 19 th Street, N.W., Washington D.C. 20431, U.S.A. Telephone. +1 202 623 7312 Fax. +1 202 623 9990 Email. [email protected] Website. www.ieo-imf.org BP/14/12 A Review of Crisis Management Programs Supported by IMF Stand-By Arrangements, 2008–11 Shinji Takagi, Carlos De Resende, Jerome Prieur, Franz Loyola, and Tam Nguyen

Welcome message from author
This document is posted to help you gain knowledge. Please leave a comment to let me know what you think about it! Share it to your friends and learn new things together.
Transcript

Address. 700 19th Street, N.W., Washington D.C. 20431, U.S.A. Telephone. +1 202 623 7312 Fax. +1 202 623 9990 Email. [email protected] Website. www.ieo-imf.org
BP/14/12
A Review of Crisis Management Programs Supported by IMF Stand-By Arrangements, 2008–11 Shinji Takagi, Carlos De Resende, Jerome Prieur, Franz Loyola, and Tam Nguyen

© 2014 International Monetary Fund BP/14/12
IEO Background Paper Independent Evaluation Office
of the International Monetary Fund
A Review of Crisis Management Programs Supported by IMF Stand-By Arrangements, 2008–11
Prepared by Shinji Takagi, Carlos De Resende, Jerome Prieur,
Franz Loyola, and Tam Nguyen
October 8, 2014
The views expressed in this Background Paper are those of the authors and do not necessarily represent those of the IEO, the IMF or IMF policy. Background Papers report analyses related to the work of the IEO and are published to elicit comments and to further debate. The authors acknowledge useful inputs from Luca Barbone, Alexander Chubrik, Marek Dabrowski, Peter Mihalyi, and Marko Skreb.
JEL Classification Numbers: E65, F53, F55, F62
Keywords: IMF, Global Financial and Economic Crisis, IMF programs, IMF Stand-By
Arrangements, IMF financing
Authors’ E-mail Addresses: [email protected]; [email protected]; [email protected]; [email protected]

iii
Contents Page
Abbreviations .................................................................................................................................. iv
Executive Summary ......................................................................................................................... v
I. Introduction .................................................................................................................................. 1
II. The Evaluation Framework ......................................................................................................... 5
III. Financing ................................................................................................................................... 6
IV. Program Design ....................................................................................................................... 14
V. Modalities of Engagement ........................................................................................................ 33
VI. Assessing the Effectiveness of SBA-Supported Programs ...................................................... 38
Box 1. The Vienna Initiative ......................................................................................................... 14
Figures 1. Size and Length of IMF Stand-By Arrangements, 2008–11 ....................................................... 7 2. First Actual or Potential Disbursements Under IMF Stand-By Arrangements
Approved, 2008–11 ................................................................................................................ 9 3. Optimism in Growth Projections ............................................................................................... 15 4. Revision of Growth Forecasts at First Review .......................................................................... 16 5. Current Account Forecasts for T+1 ........................................................................................... 17 6. Current Account Forecasts for T+2 ........................................................................................... 18 7. Programmed or Projected vs. Actual Fiscal Balances, from T (program year) to T+3 ............. 20 8. Actual, Cyclically Adjusted and Counterfactual Fiscal Balances in Romania .......................... 25 9. Structural Conditionality in IMF Stand-By Arrangements, 1997–2000 vs. 2008–11 ............... 27 10. Breakdown of Prior Actions by Sector, 2008–11 .................................................................... 28 11. References in the IMF’s Public Communications ................................................................... 37 12. IMF Stand-By Arrangements: Resources Committed and Disbursed, 2008–11 ..................... 40
Tables 1. IMF Stand-By Arrangements Approved, September 2008–July 2011: Main Features ............... 3 2. The IMF’s Collaboration with Public and Private Sector Partners at Program Design Stage ... 12 3. Fiscal Policy Background and Strategy in SBA-Supported Programs ...................................... 21 4. Programmed or Projected vs. Actual Fiscal Balances, from T (program year) to T+3 ............. 23 5. Actual vs. Counterfactual Fiscal Balances in 14 Countries ....................................................... 24 6. External Sector Policies ............................................................................................................. 30 7. IMF Stand-By Arrangements Approved, September 2008–July 2011: Program Negotiations, Reviews, and Drawings ................................................................... 34
References ...................................................................................................................................... 42
Annexes 1. Adjustments in Fiscal Targets ................................................................................................... 44 2. Technical Note on Statistical Analyses ..................................................................................... 46

iv
ABBREVIATIONS
ADB Asian Development Bank AfDB African Development Bank CPI Consumer price index EBCI European Bank Coordination Initiative EBRD European Bank for Reconstruction and Development ECB European Central Bank ECF Extended Credit Facility (IMF) ECCU East Caribbean Currency Union ECOFIN Economic and Financial Affairs Council (EU) EFF Extended Fund Facility (IMF) EIB European Investment Bank EPA Ex Post Assessment (IMF) EPE Ex Post Evaluation (IMF) ESF-HAC Exogenous Shock Facility – High Access Component (IMF) EU European Union GDP Gross domestic product IDB Inter-American Development Bank IEO Independent Evaluation Office (IMF) IFC International Finance Corporation IFI International financial institution IMF International Monetary Fund IT Inflation targeting MONA Monitoring of Fund Arrangements (IMF) NPV Net present value OECD Organization for Economic Cooperation and Development PA Prior action (IMF) PC Performance criterion (IMF) PRGF Poverty Reduction and Growth Facility (IMF) PRGT Poverty Reduction and Growth Trust (IMF) RCF Rapid Credit Facility (IMF) REER Real effective exchange rate S&P Standard & Poor’s SB Structural benchmark (IMF) SBA Stand-By Arrangement (IMF) SCF Stand-By Credit Facility (IMF) SPC Structural performance criterion (IMF) VAT Value added tax VIX Chicago Board Options Exchange Market Volatility Index WEO World Economic Outlook

v
EXECUTIVE SUMMARY
A review of crisis management programs supported by IMF Stand-By Arrangements (SBAs) approved between 2008 and 2011 indicates that, on average, access was large and disbursements highly frontloaded. The IMF was rapid in response, especially during the early phase, and flexible in allowing resources to be channeled directly as budget support. It collaborated, especially in early European programs, with multilateral and bilateral donors in a transparent manner. It sought private sector involvement proactively while attempting to build investor confidence and public support for these programs through public communications efforts.
Programs generally targeted a gradual reduction in the fiscal deficit. Actual outturns were looser than programmed as the targets were relaxed when the crisis proved to be more severe than originally forecast. Programs allowed fiscal automatic stabilizers to operate when output collapsed, but IMF financing generally does not appear to have accommodated the full extent of the fiscal shortfall.
Considerable learning had taken place since the emerging market crises of the late 1990s and early 2000s. In responding to the 2008 crisis, structural conditionality was more streamlined and more focused on the IMF’s core areas of competence. About half the programs called for greater exchange rate flexibility, but the IMF cautioned against too rapid a depreciation as having an adverse balance sheet effect. Less than 65 percent of committed resources were actually drawn, indicating that financing was sufficiently large to restore investor confidence. Program documents explicitly recognized risks, though the presentation was too pro forma to add value. For the most part, however, staff did their due diligence in contingency planning.
The IMF-supported programs likely helped avert deeper contractions of output and a financial meltdown. While the average GDP growth of SBA countries in 2009 was lower by 2.7 percentage points than that of their non-program peers, the difference narrowed in 2010 to 1.6 percentage points. Though attribution is difficult, especially given the substantial and contemporaneous global easing of macroeconomic policies, IMF program financing seems to have been a factor contributing to this relatively quick turnaround.
In a number of countries, especially in high access cases, structural reforms did not progress much or were reversed after the program engagement ended, raising a question about the appropriateness of crisis programs as a vehicle for catalyzing difficult structural changes. Also, about half the countries left the program engagement without completing reviews, raising questions about the extent of demand for SBA-type program engagements in calmer times.


I. INTRODUCTION
1. This paper presents a review of crisis management programs supported by IMF Stand-By Arrangements (SBAs) approved between the Fall of 2008 and the end of 2011. Following the collapse of Lehman Brothers on September 15, 2008, the world economy became engulfed in a financial and economic crisis of historic proportions. As country after country experienced a reversal of capital inflows, tighter funding constraints, or deterioration of the external environment (IMF, 2009), the IMF successively provided financial support to more than 30 countries under various facilities. Of these, this paper focuses on SBAs approved for 25 countries (Table 1). SBAs remain the IMF’s principal vehicle (“workhorse”) of providing financial support quickly to member countries experiencing an adverse balance of payments pressure.1 As such, the programs reviewed herein constituted a central element of the IMF’s response to the 2008 financial and economic crisis.2
2. To be sure, the extent to which the SBA represented a direct response to the 2008 global crisis differs from country to country. The Georgia SBA, approved by the IMF Executive Board on September 15, 2008, was not conceived as a response to the crisis,3 though it took on a crisis management character in August 2009 when the Board approved an extension and augmentation of the arrangement. The Kosovo SBA, approved in July 2010, was designed to help the IMF’s newest member achieve macroeconomic and financial stability,4 as the country had been little affected by the global crisis (Bakker and Klingen, 2008). Yet, the global crisis was the background against which all SBA-supported programs were designed, and most of them explicitly noted the impact of the global crisis-precipitated recession.
3. Nevertheless, the crisis management focus of an SBA can be said to have diminished with the passage of time (earlier programs tended to have a stronger focus on crisis management). It is with this perspective in mind that SBA-supported programs are chronologically presented in tables and figures throughout the paper. A systematic examination of all SBA-supported programs enables us not only to highlight what, if anything, was unique about the IMF’s early crisis response but also to identify the common elements of program
1 http://www.imf.org/external/np/exr/facts/sba.htm.
2 This review does not cover program engagements under other facilities, such as the Extended Fund Facility (EFF) and the Poverty Reduction and Growth Facility (PRGF)—or its successor facilities (Extended Credit Facility [ECF], Stand-By Credit Facility [SCF], and Rapid Credit Facility [RCF]) under the Poverty Reduction and Growth Trust (PRGT) after July 2009—because of their longer-term and low-income country focus, respectively. It also excludes the 2008 SBA with Seychelles (for which the discussion was initiated earlier in the year) and the 2010 SBA with Greece (which will be the subject of a separate IEO evaluation).
3 Georgia’s IMF-supported program was initially designed to deal with the impact of the August 2008 armed conflict on investor confidence—a large loss of international reserves, a fall in bank deposits, and a decline in net private inflows.
4 Kosovo became the IMF’s 186th member in June 2009.

2
design during the post-crisis period. For this reason, comparisons are made between earlier and later programs; specific references are made to early “European” programs (Ukraine, Hungary, Iceland, Latvia, Belarus, Serbia, Armenia, and Romania),5 arguably the most crisis-driven of all SBA-supported programs. All case studies are drawn from these countries. To highlight the crisis management aspect of the IMF’s response, moreover, the paper focuses on the first arrangement when a country had multiple arrangements with the IMF over the period.6
4. The rest of the paper is organized as follows. Section II explains the evaluation framework, including the methodological approaches employed (along with some of the questions they address) and the sources of evidence. Section III reviews the financing aspects of SBA-supported programs, including access, frontloading, coordination with bilateral and multilateral donors, and private sector involvement. Section IV discusses program design issues, including macroeconomic (growth and current account) forecasts, fiscal policy, structural conditionality, exchange rate policy, and assessment of risks. Section V considers the modality of the IMF’s crisis response, especially how quickly and flexibly the IMF responded to member country requests for financial support and the IMF’s public communications strategy in disseminating the logic of SBA-supported programs. Section VI presents a summary assessment of the effectiveness of SBA-supported crisis management programs. Finally, Annexes 1 and 2 provide a supplementary table on how fiscal targets were adjusted at each review and the technical details of the statistical analyses reported in the text.
5 Armenia is in fact classified as part of Asia by the United Nations and is covered by the Middle East and Central Asia Department within the IMF.
6 El Salvador had two successive SBAs, in January 2009 and March 2010, both of which were treated as precautionary. Ukraine’s 2008 SBA was canceled and succeeded by a new arrangement in July 2010. For Serbia, the augmented arrangement (approved in May 2009) is considered, as the authorities had treated the original arrangement as precautionary.

3
Table 1. IMF Stand-By Arrangements Approved, September 2008–July 2011: Main Features1
Country Month of Board approval
Month of expiration or cancellation
Length of arrangement (in months)
Access (*indicates exceptional access)2 Budget support?
Remarks
In millions of SDRs Percent of quota
1. Georgia3 September 2008 June 2011 18 (extended to 33 in August 2009)
477 (augmented to 747)
317 (augmented to 497)*
Yes
2. Ukraine November 2008 July 2010 24 11,000 802* Yes Succeeded by new arrangement
3. Hungary November 2008 October 2010 17 (extended to 23 in September 2009)
10,500 1,015* Yes
4. Iceland November 2008 August 2011 24 (extended to 33 in April 2010)
1,400 1,190* Initially extended to 30 in October 2009
5. Pakistan3 November 2008 September 2011 23 (extended to 26 in August 2009 and to 35 in December 2010)
5,169 (augmented to 7,236 in August 2009)
500 (augmented to 700)*
Yes
6. Latvia December 2008 December 2011 27 (extended to 36 in February 2010)
1,522 1,200* Yes Precautionary after July 2010
7. Belarus January 2009 March 2010 15 1,618 (augmented to 2,270 in June 2009)
419 (augmented to 587)*
8. Serbia January 2009 April 2011 15 (extended to 27 in May 2009)
2,619 (initial program 233.9)
560* (initial program 75)
Initially treated as precautionary
9. El Salvador January 2009 March 2010 15 514 300* Precautionary; succeeded by new arrangement
10. Armenia3 March 2009 June 2010 28 368 (augmented to 534 in July 2009)
400* (augmented to 580)
Yes Succeeded by ECF/EFF arrangement
11. Mongolia3 April 2009 October 2010 18 153 300*
12. Costa Rica April 2009 July 2010 15 492 300* Precautionary

4
13. Guatemala April 2009 October 2010 18 631 300* Precautionary
14. Romania May 2009 March 2011 24 11,443 1,111 * Yes
15. Bosnia and Herzegovina
July 2009 July 2012 36 1,015 600 Yes
16. Sri Lanka3 July 2009 July 2012 20 1,650 400* Extended twice
17. Dominican Republic
November 2009 March 2012 28 1,095 500 Yes
18. Angola3 November 2009 March 2012 27 859 300
19. Maldives3 December 2009 December 2012 36 49 (57 combined; see remarks)
600 (700 combined; see remarks)
Blended with 24-month ESF-HAC arrangement
20. Jamaica February 2010 March 2012 27 821 300
21. Iraq February 2010 February 2013 24 (extended to 29 in March 2011)
2,377 200 Yes Precautionary in case of favorable oil developments
22. Antigua and Barbuda
June 2010 June 2013 36 81 600
23. Kosovo July 2010 January 2012 18 93 157 Yes
24. Honduras3 October 2010 March 2012 18 65 (130 combined; see remarks)
50 (100 combined; see remarks)
Precautionary; blended with SCF arrangement, 50 percent of quota
25. St. Kitts and Nevis
July 2011 July 2014 36 53 590*
Sources: IMF staff reports for program requests and Article IV consultations, supplemented by internal documents, 2008–14. 1 Includes the first arrangement only when a country had successor arrangements; excludes Seychelles and Greece (see footnote 2 in the text). 2 On March 24, 2009, the Executive Board adopted a decision to double normal access limits from 100 percent to 200 percent of quota annually and from 300 percent to 600 percent of quota cumulatively. The prior policy would have rendered all arrangements as exceptional access, except for Honduras. 3 Country eligible for concessional lending under the PRGF (or the PRGT) at the time the arrangement was approved.

5
II. THE EVALUATION FRAMEWORK
Methodological approaches
5. Three complementary approaches are used to evaluate SBA-supported programs during 2008–11. First, the programs are assessed for their key features. For example:
How large was the size of access, and how was the financing disbursed? What considerations may have determined these decisions?
Was fiscal policy countercyclical or procyclical? What considerations may have determined the programmed fiscal stance?
Did the IMF coordinate with bilateral and multilateral partners in designing programs? If so, how effectively?
How did the IMF communicate the logic of programs to the public?
6. Second, the IMF’s program design is evaluated against widely accepted standards of good practice. For example:
How flexible was the IMF in accommodating the needs of member countries, taking account of country-specific factors, and responding to unexpected economic developments?
How accurate were the IMF’s macroeconomic forecasts?
How candid was the IMF’s assessment of risks and uncertainty?
7. Third, where feasible, assessment is made against the benchmarks provided by pre-global crisis programs. For example:
Was the access under post-crisis programs larger than that under a representative pre-crisis program? Was the external adjustment larger or smaller than that observed under a representative pre-crisis program?
Was structural conditionality under post-crisis programs more streamlined and focused, in the light of what we know about a representative pre-crisis program?
Sources of evidence
8. In exploring these questions, we rely on the following sources of evidence:
Staff reports (both published and confidential), public information notices, press releases for all SBA-supported programs approved by the Executive Board between the Fall of 2008 and the end of 2011.

6
Ex post evaluations (both published and confidential) for 13 SBA-supported exceptional access programs approved by the Executive Board after the Fall of 2008; ex post assessments of the IMF’s longer-term program engagement with two countries; other reviews by IMF staff of recent crisis management programs, particularly IMF (2009), Roaf (2012), and Bakker and Klingen (2012).
Confidential internal memoranda, draft and final briefing papers/policy notes, back-to-office reports, and department and management comments thereon for program negotiation and first review missions.
Interviews with senior staff, former and current members of the Executive Board, and former and current officials of member countries and multilateral organizations.7 In particular, formal visits were made to five case study countries in order to receive views of authorities and experts: Armenia, Bosnia and Herzegovina, Iceland, Latvia, and Romania. Additional interviews were held in Brussels, Budapest, Minsk, Stockholm, and Washington, as well as over the telephone.
III. FINANCING
Access
9. In relation to quota, almost all arrangements entailed large access (see Table 1, columns 5 and 6). These collectively amounted to SDR 56.06 billion in total available resources.8 In terms of the IMF’s access policy, 16 arrangements were exceptional access cases. In March 2009, the Executive Board adopted a decision to double normal access limits, from 100 percent to 200 percent of quota annually and from 300 percent to 600 percent cumulatively.9 The prior policy would have rendered all arrangements, except for Honduras, exceptional access cases. On the other hand, even if the revised policy had been in effect from September 2008, all programs approved prior to the March 2009 Board decision would have entailed exceptional access. This suggests that the old access policy did not unduly constrain the size of financing: the IMF provided, irrespective of the access policy, whatever it saw was appropriate in each country in the light of the perceived external financing gap. 7 Interviews were conducted with more than forty current and former officials of countries that had SBA-supported programs.
8 Arrangements with Armenia, Georgia, Pakistan, and Serbia were subsequently augmented, while additional resources were made available for Honduras and Maldives under non-SBA facilities, namely SCF and ESF-HAC, respectively. The amount of IMF financial assistance comes to SDR 59.29 billion when these additions are considered.
9 Decision No. 14284-(09/29), adopted on March 24, 2009, states: “The overall access by members to the Fund’s general resources shall be subject to (i) an annual limit of 200 percent of quota; and (ii) a cumulative limit of 600 percent of quota, net of scheduled purchases.” This decision was made pending the agreed upon doubling of quotas.

7
10. The average size of access for all programs was 520.4 percent of quota, with an average length of 23.9 months. Access tended to be larger during the early part of the crisis period (through the arrangement for Romania in May 2009), while arrangements showed a tendency to lengthen (Figure 1). On average, access was 622.4 percent of quota for the first group of countries as opposed to 401.5 percent for the second group; the average length of arrangements was 20.9 months and 27.5 months, respectively. A formal econometric test indicates that post-crisis SBAs had a significantly larger access than their pre-crisis counterparts, by as much as 3.2-6 percentage points of GDP, which is a more objective benchmark than quota for comparing the size of access across time (see Section B in Annex 2).10
Figure 1. Size and Length of IMF Stand-By Arrangements, 2008–111
Sources: IMF staff reports for program requests and Article IV consultations, supplemented by internal documents, 2008–14. 1 Initial arrangements only, except for Serbia, for which an augmented program approved in May 2009 is included.
11. Four arrangements, with Costa Rica, El Salvador, Guatemala, and Honduras, were treated as precautionary, while the Latvian authorities treated their arrangement as precautionary after the third review. Two were blended arrangements, under which additional resources were made available concurrently under non-SBA facilities: the Exogenous Shock Facility-High Access Component (ESF-HAC) arrangement for Maldives (14 percent of quota) and the Stand-By Credit Facility (SCF) arrangement for Honduras (50 percent of quota).
10 Because we exclude outliers (defined in terms of several influence statistics) from the sample, our post-crisis vs. pre-crisis comparisons are not subject to the presence of a few countries with exceptionally large values. See Appendix 2 in Annex 2 for the procedure used to identify outliers.
0
5
10
15
20
25
30
35
40
0
200
400
600
800
1000
1200
1400
Size of arrangement (percent of quota; left scale) Length of arrangements (months; right scale)

8
12. As IMF staff observed in their initial review of crisis programs (IMF, 2009), the first wave of post-crisis SBAs had larger access than programs in previous crises.11 This reflected the much larger access accorded to early European programs in relation to quota than in previous crises programs. The average access of eight European programs was 881 percent of quota, with four of them exceeding 1,000 percent. When the first four European programs in 2008 (Ukraine, Hungary, Iceland, and Latvia) are compared to the three major Asian programs in 1997 (Thailand, Indonesia, and Korea), they were as much as three to five times larger in relation to GDP; they were particularly large in relation to the previous year’s current account deficits (Takagi, 2010).
13. The large access of European programs could be explained by the high financial openness of these countries. For example, gross financing needs in some countries (e.g., Ukraine, Hungary, and Romania) were as large as 40 percent of GDP. Program financing needed to be large enough to be credible with international creditors. Reducing the risk of contagion was another important consideration, given the high degree of regional financial integration. In some countries, such as Latvia and Bosnia and Herzegovina, the programs were designed to preserve exchange rate pegs. Part of the financing was therefore intended to build official reserves in these and other countries (Bakker and Klingen, 2012).
Frontloading
14. Not only was access large, but disbursements (actual or, in the case of precautionary arrangements, potential) were heavily frontloaded in most arrangements, with 35 percent on average of total financing made available upon Board approval; in relation to quota, the first actual or potential drawing on average amounted to 176 percent (Figure 2). The comparable figures for the eight European programs were 32.2 percent and 293 percent, respectively. The large average frontloading factor in part reflects the inclusion of precautionary arrangements, for which frontloading was particularly large.12 When the precautionary arrangements are excluded, the average frontloading factor for 2008–11 was 29.5 percent. Even so, this was 13.4 percentage points larger than the average for pre-2008 SBAs.13 Focusing on the first 15 SBA-supported programs, IMF (2009) states that the degree of frontloading was higher than previous crisis cases, despite larger initial reserve buffers, and attributes this to “the role of financing in mitigating crisis effects.”
11 Previous capital account cases include Mexico (1994), Indonesia (1997), Korea (1997), the Philippines (1997), Thailand (1997), Brazil (1998), Ecuador (1998), Russia (1998), Turkey (2000), Argentina (2001), and Uruguay (2001).
12 The frontloading factor was as much as 66.67 percent for El Salvador, Costa Rica, and Guatemala.
13 Here again, outliners are removed from the sample (see Annex 2, Appendix 2 for the methodology). Notably, the arrangements for Maldives and Sri Lanka had a flat purchase schedule and involved no frontloading. The arrangement for Iraq was frontloaded, but larger purchases were made available upon completion of the first and second reviews.

9
15. The size of frontloading was significantly larger (i) for a precautionary arrangement, as noted, (ii) for a twin (capital account and banking) crisis, and (iii) if the fiscal deficit was larger in relation to GDP. On the other hand, frontloading was smaller (i) for a successor arrangement, (ii) if the size of access was larger in terms of quota, and (iii) if the country had larger official foreign exchange reserves as a percent of GDP (see Section C in Annex 2). According to staff, there were other factors as well, such as ownership concerns or the past track record. The ex post evaluation (EPE) for the 2008 Ukraine SBA, for example, states that its smaller frontloading factor, compared with other programs, reflected the high implementation risk.
Figure 2. First Actual or Potential Disbursements Under IMF Stand-By Arrangements Approved, 2008–111
Sources: IMF staff reports for program requests and Article IV consultations, supplemented by internal documents, 2008–14. 1 Initial arrangements only, except for Serbia, for which the augmented arrangement approved in May 2009 is included.
Collaboration with other donors
16. To varying degrees, the IMF collaborated with other multilateral institutions and bilateral donors in designing the financial packages for at least 17 SBAs, including seven of the eight European programs (see Table 2, column 2). The program for Hungary represented the first case of IMF-European Union (EU) collaboration, which set a precedent for future requests for financial support by EU members. Although the EU Treaty required Hungary to consult with the EU Economic and Financial Committee before seeking assistance from the IMF, the EU agreed to joint consultations with the Fund under accelerated procedures. Likewise, the program for Latvia was part of a coordinated international effort, in which the European Commission actively participated, along with representatives from the European Central Bank (ECB), the World Bank, and Nordic countries. The EU’s financial support was not confined to EU members—it was part of six financing packages, while the World Bank participated in 15 packages. IMF staff enumerated these additional sources of financing in a
0
50
100
150
200
250
300
350
400
450
500
0
10
20
30
40
50
60
70
80
Percent of total (left scale) Percent of quota (right scale)

10
transparent way. When the amount was less than certain (e.g., Angola and Mongolia), they clearly stated that the amount needed to be reassessed at a subsequent review.
17. Takagi (2010) argues that the transparent manner in which the IMF collaborated with official donors contributed to the effectiveness of SBA-supported programs in building investor confidence. In particular, when total official (as distinct from IMF) financing is considered, total access was as much as 14.5–35.7 percent of GDP for the 2008 European programs but only 6.7–12.6 percent of GDP for the 1997 Asian crisis programs. Moreover, the European programs did not have the credibility problem that had affected the Asian crisis programs, where the total amount of available financing appeared to be too small relative to the financing need or the conditions under which these funds were to be made available were not specified. This caused market participants in Asia to question not only their availability but also the credibility of the official financial packages (IEO, 2003).14 In contrast, Europe’s official financing packages appeared to have more substance, with a clear backing for the numbers. Even so, it often took the EU and other multilateral institutions more time than the Fund to disburse their funds, making IMF financing the sole first line of defense.15
18. The EPEs almost unanimously give high marks to the IMF’s collaboration with other multilateral institutions and bilateral donors. The IEO’s own interviews with those involved generally confirm these positive assessments. There was a learning curve, however. At least initially, the absence of an established modus operandi created friction between the IMF and the EU, especially after the European Commission, initially hampered by lack of expertise in crisis management, began to upgrade its capability. In Latvia, this led to a major disagreement on fiscal policy in the summer of 2009, when the IMF was unwilling to complete the program review on account of lingering doubts on fiscal targets; but the EU made a decision (at the heads of state level) to release the second tranche as it increasingly became concerned that a delay would precipitate a run on the lat (European Commission, 2009). The IMF mission felt that its negotiating position had been weakened by the EU action.
19. Likewise, the IMF’s relationship with bilateral donors was complicated to manage in a few instances. In Armenia, for example, coordination with Russia (that had promised a loan
14 In Thailand, total official financing of $17.2 billion was less than half the amount of short-term external liabilities ($38 billion at the end of May 1997), when the foreign exchange reserves were nearly depleted and the monetary authorities had a forward contract to sell $23.4 billion over the coming months. In Indonesia and Korea, though the World Bank and the Asian Development Bank agreed to provide financing, the amount included the funds that had already been committed before the crisis; bilateral financing ($17 billion for Indonesia and $20 billion for Korea) was designated as the second line of defense, and was to be activated only when financing from all other sources proved insufficient, but the conditions for activation were not specified. See IEO (2003).
15 For example, in Bosnia and Herzegovina, whereas the IMF money was disbursed in June 2009 immediately upon Board approval, the EU money was disbursed only in 2011 (by which time the economy had already been stabilized and the IMF-supported program was essentially off track because of upcoming parliamentary elections).

11
of $500 million) was difficult because, according to those interviewed for this evaluation, the country did not share the same approach to crisis management as the IMF. In Iceland, the active involvement of (at least some) Nordic countries served to delay the first review by several months because, according to some interviewed, they were reportedly pressured by their European partners not to provide financing assurances in an attempt to influence the outcome of the ongoing discussion on the extent of deposit guarantees for Icesave, an online savings scheme operated by an Icelandic bank that had gone bankrupt.16
Private sector involvement
20. In response to the 2008 global financial and economic crisis, the IMF sought some form of private sector involvement (PSI) from the outset.17 This represented another case of learning from previous emerging market crises. In Korea, for example, PSI was tried and contributed to resolving the crisis quickly, but only after the initial program had failed. In this latest crisis, most instances of PSI were voluntary schemes under which foreign creditors made commitments to maintain exposure to countries (see Table 2, column 3). In Iceland, however, the government took “unilateral action” (Truman, 2013) and did not socialize the foreign debts of major banks.18
21. The large presence of foreign-owned banks, especially in several European countries, made PSI especially necessary. The small number of large players, moreover, enhanced its feasibility. In Hungary, the IMF organized a meeting of public entities and the strategic owners of six large banks immediately after starting to negotiate a program. In the event, foreign parent banks injected capital into their Hungarian subsidiaries in the range of €2–3 billion and many times more in the form of loans. According to the central bank governor’s parliamentary testimony, the loans to the Hungarian banking sector were larger than the combined amount of IMF-EU tranches utilized (€14 billion). Following the termination of the IMF-supported program, funds started flowing back from Hungary to parent banks.19
16 Disbursements from bilateral program financing from four Nordic countries were linked to resolution of the dispute over Icesave.
17 The term private sector involvement is used within the IMF to refer more narrowly to the need to involve the private sector in the restructuring of sovereign debt. Here, it is used more broadly to mean bailing-in of private investors in the resolution of a capital account crisis.
18 This was in line with the stated program objective of limiting “socialization of losses in the collapsed banks.”
19 See http://hvg.hu/gazdasag/20130225_Simor_Az_orszag_erdeke_volt_az_adatok_ata.

12
Table 2. The IMF’s Collaboration with Public and Private Sector Partners at Program Design Stage
Multilateral Institutions and Bilateral Donors Banks and Other Private Sector Investors
1. Georgia In 2008, SBA covers $350 million of $550 financing gap, with World Bank contributing $30 million and United States remaining $170 million; details of how 2009 financing gap is closed are to be provided at first program review
N.A.
2. Ukraine N.A. N.A.
3. Hungary Financing gap of €20 billion is filled by European Union (€6.5 billion), World Bank (€1 billion) and IMF (€12.5 billion)
Government is seeking agreement with commercial banks on private debt resolution strategy if asset quality deteriorates significantly; parent banks of all foreign subsidiaries affirmed their willingness to support their clients’ forint and foreign exchange needs
4. Iceland Other official institutions are assessing size, timing and modalities of their contributions, with assurances expected by Board meeting
Retention of existing capital and exchange controls
5. Pakistan World Bank and ADB participated in program design N.A.
6. Latvia EU provides €3.1 billion, Nordic countries up to €1.8 billion, Czech Republic, Poland and Estonia €0.2 billion, €0.1 billion and €0.1 billion, respectively; World Bank and EBRD provide €0.4 and €0.1 billion
Program includes private debt restructuring and commitments from foreign banks to maintain presence; Nordic parent banks issued public statements of support
7. Belarus EU and World Bank may provide additional financing though not prepared to make firm commitments
N.A.
8. Serbia (Original program) N.A.
(Revised program) Access takes into account prospective additional contributions from EU and World Bank in 2009-10
(Original program) N.A.
(Revised program) Foreign parent banks requested to maintain exposure, which is monitored bi-weekly
9. El Salvador N.A. N.A.
10. Armenia World Bank signaled additional package of $525 million, followed by possible financing from Russia, EU and ADB; domestic adjustment and funding from other donors needed
N.A.

13
11. Mongolia ADB, World Bank, and Japan together agreed to provide US$160 million with staff to reassess additional donor financing at first review
N.A.
12. Costa Rica Contingent financing envisaged from World Bank and IDB N.A.
13. Guatemala N.A. N.A.
14. Romania Program incorporates €5 billion from EU, €1 billion from World Bank, and roughly €1 billion from EBRD, EIB, and IFC
Foreign parent banks pledged support for subsidiaries, committing to maintain exposure, which is monitored by central bank and home country supervisors
15. Bosnia and Herzegovina
Commitments of €189 million from World Bank and €100 million from EU
Foreign parent banks encouraged to maintain exposure to subsidiaries under Vienna Initiative
16. Sri Lanka Donor financing envisaged from World Bank, ADB, and Japan N.A.
17. Dominican Republic N.A. N.A.
18. Angola Prospect of support from World Bank, AfDB, Brazil, and Portugal, with staff reassessing at first review
N.A.
19. Maldives Financing assurances secured from World Bank and ADB for $59 million, with further pledges from regional and bilateral sources sought at donor meeting
N.A.
20. Jamaica Government is requesting $2.4 billion from multilaterals, with the IMF contributing about $1.3 billion and $1 billion coming from World Bank, IDB, and Caribbean Development Bank
Government is engaged in par-neutral debt exchange with creditors to cut interest bill by 3 percent of GDP and NPV by 20 percent
21. Iraq N.A. N.A.
22. Antigua and Barbuda Financing requirement to be filled by IMF and Caribbean Development Bank, with residual through debt restructuring
Government negotiated a voluntary debt restructuring with commercial banks and a major foreign investor
23. Kosovo N.A. N.A.
24. Honduras N.A. N.A.
25. St. Kitts and Nevis N.A. Public debt restructuring involving collateralized debt of St. Kitts Sugar Manufacturing Corporation through debt-land swap
Sources: IMF staff reports for program requests and Article IV consultations, supplemented by internal documents, 2008–14.
14
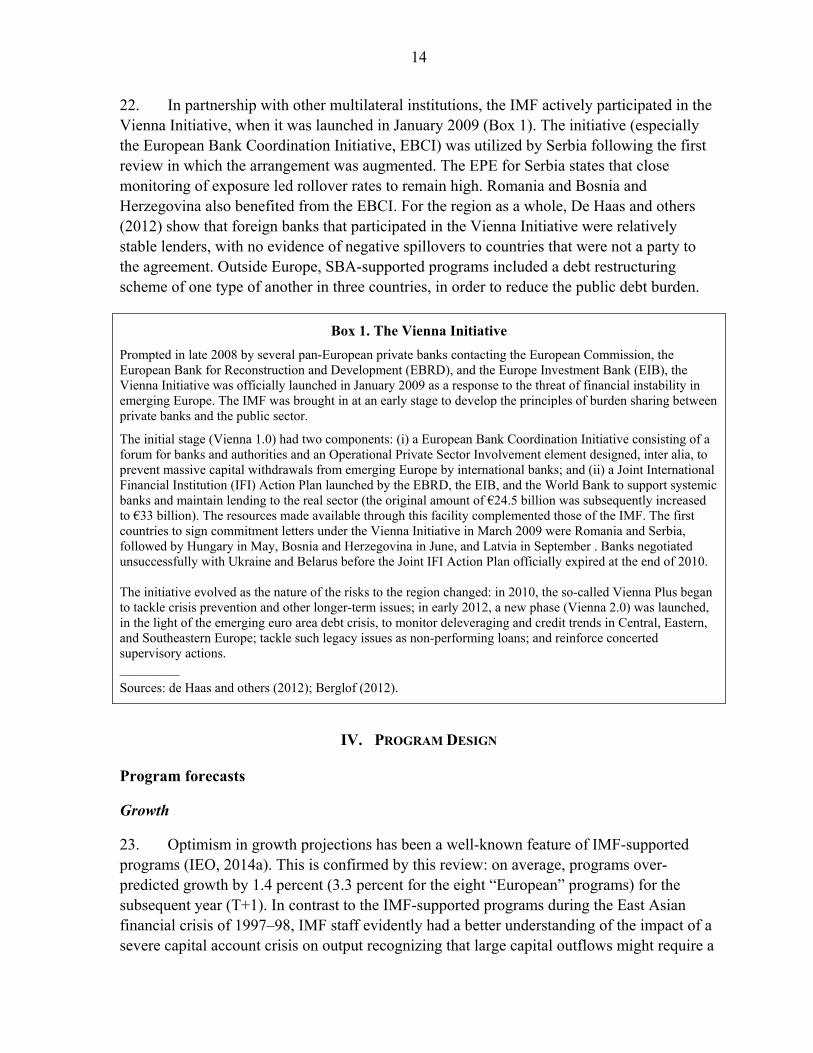
22. In partnership with other multilateral institutions, the IMF actively participated in the Vienna Initiative, when it was launched in January 2009 (Box 1). The initiative (especially the European Bank Coordination Initiative, EBCI) was utilized by Serbia following the first review in which the arrangement was augmented. The EPE for Serbia states that close monitoring of exposure led rollover rates to remain high. Romania and Bosnia and Herzegovina also benefited from the EBCI. For the region as a whole, De Haas and others (2012) show that foreign banks that participated in the Vienna Initiative were relatively stable lenders, with no evidence of negative spillovers to countries that were not a party to the agreement. Outside Europe, SBA-supported programs included a debt restructuring scheme of one type of another in three countries, in order to reduce the public debt burden.
Box 1. The Vienna Initiative
Prompted in late 2008 by several pan-European private banks contacting the European Commission, the European Bank for Reconstruction and Development (EBRD), and the Europe Investment Bank (EIB), the Vienna Initiative was officially launched in January 2009 as a response to the threat of financial instability in emerging Europe. The IMF was brought in at an early stage to develop the principles of burden sharing between private banks and the public sector.
The initial stage (Vienna 1.0) had two components: (i) a European Bank Coordination Initiative consisting of a forum for banks and authorities and an Operational Private Sector Involvement element designed, inter alia, to prevent massive capital withdrawals from emerging Europe by international banks; and (ii) a Joint International Financial Institution (IFI) Action Plan launched by the EBRD, the EIB, and the World Bank to support systemic banks and maintain lending to the real sector (the original amount of €24.5 billion was subsequently increased to €33 billion). The resources made available through this facility complemented those of the IMF. The first countries to sign commitment letters under the Vienna Initiative in March 2009 were Romania and Serbia, followed by Hungary in May, Bosnia and Herzegovina in June, and Latvia in September . Banks negotiated unsuccessfully with Ukraine and Belarus before the Joint IFI Action Plan officially expired at the end of 2010.
The initiative evolved as the nature of the risks to the region changed: in 2010, the so-called Vienna Plus began to tackle crisis prevention and other longer-term issues; in early 2012, a new phase (Vienna 2.0) was launched, in the light of the emerging euro area debt crisis, to monitor deleveraging and credit trends in Central, Eastern, and Southeastern Europe; tackle such legacy issues as non-performing loans; and reinforce concerted supervisory actions. _________
Sources: de Haas and others (2012); Berglof (2012).
IV. PROGRAM DESIGN
Program forecasts
Growth
23. Optimism in growth projections has been a well-known feature of IMF-supported programs (IEO, 2014a). This is confirmed by this review: on average, programs over-predicted growth by 1.4 percent (3.3 percent for the eight “European” programs) for the subsequent year (T+1). In contrast to the IMF-supported programs during the East Asian financial crisis of 1997–98, IMF staff evidently had a better understanding of the impact of a severe capital account crisis on output recognizing that large capital outflows might require a

15
decline in output to compress imports sufficiently to achieve an external payments adjustment.20 The early European programs (Ukraine, Hungary, Iceland, and Latvia) all forecast negative growth for T+1 but, with the exception of Iceland, the actual growth outcomes turned out to be worse.21 Part of the over-optimism resulted from the higher assessment of economic growth for the year of program approval (T), which exceeded the actual by 1.9 percent (and 2.1 percent for the eight “European” programs).
24. To be sure, the contractionary impact of the global financial and economic crisis was unprecedented. As it took the IMF (and much of the world) time to fully grasp the magnitude of the impact, early optimism is understandable. In October 2008, the IMF’s World Economic Outlook (WEO) was projecting positive growth of 3 percent for the world economy in 2009 whereas actual growth turned out to be negative (-0.4 percent); for the euro area, the forecast (0.18 percent) far exceeded what would ultimately turn out (-4.4 percent). The WEO revised its growth forecasts for 2009 downward by the spring of 2009 (from 0.18 percent to -4.23 percent for the euro area, and from 3 percent to -1.32 percent for the world). This may explain why later programs did not display the growth optimism of the early programs, at least to the same extent (Figure 3).22
Figure 3. Optimism in Growth Projections (Forecast or preliminary less actual, in percent)
Sources: IMF staff reports for program requests and Article IV consultations, supplemented by internal documents, 2008–14.
20 In contrast, IMF-supported programs in East Asia had forecast positive growth for all countries: 3.0 percent for Indonesia, 2.5 percent for Korea, and 3.5 percent for Thailand.
21 In Iceland, the growth outcome (-6.8 percent) was better than forecast (-9.6 percent).
22 An exception is in Armenia, where the IMF, judging that the country’s integration with the world economy was limited, underestimated the adverse macroeconomic impact of the global crisis.
-15
-10
-5
0
5
10
15
Program year Following year (T+1) T+2 T+3

16
25. Optimism in most programs was largely corrected by the first review. The downward revision at the first review was sizable, on average -1.7 percent for the current year and -0.8 percent for the following year (Figure 4). The revisions were especially large for the first 10 (mostly European) programs: -3.3 percent (for T) and -2.8 percent (for T+1). Forecasts for some small economies and commodity exporters were exceptions: the SBA-supported programs for many of these countries displayed growth pessimism. Macroeconomic variables in small open economies are known to display greater volatility than for larger and hence more diversified economies, and forecasting them would therefore be difficult. For commodity exporters, such as Mongolia and Iraq, IMF staff underestimated the rapidity with which copper and crude oil prices would recover. In Mongolia, the program’s original growth forecast of 6 percent in T+1 fell short of the actual growth rate by as much as 11.5 percent. In the case of Iraq, the pessimism of the initial forecast was corrected by an upward revision of 3.6 percent for T+1 at the first review. The officials of two small open economies interviewed for this evaluation stated that IMF staff had a characteristic tendency to be pessimistic about their economies.
Figure 4. Revision of Growth Forecasts at First Review (Revised less original, in percent)
Sources: IMF staff reports for program requests and Article IV consultations, supplemented by internal documents, 2008–14.
The current account
26. The current account is an endogenous variable that depends on, among other variables, economic growth and net private inflows. This makes it particularly challenging to make an accurate forecast. Current account outturns are also difficult to interpret. For example, an improvement in the current account could mean a compression of imports associated with slower growth, a forced adjustment resulting from a reduction in net capital inflows, or an increase in net exports arising from a terms of trade improvement or real
-14
-12
-10
-8
-6
-4
-2
0
2
4
6
Program year Following year

17
exchange rate depreciation. The IMF’s program forecasts were often way off the mark, but the reasons must be sought in factors specific to each country.
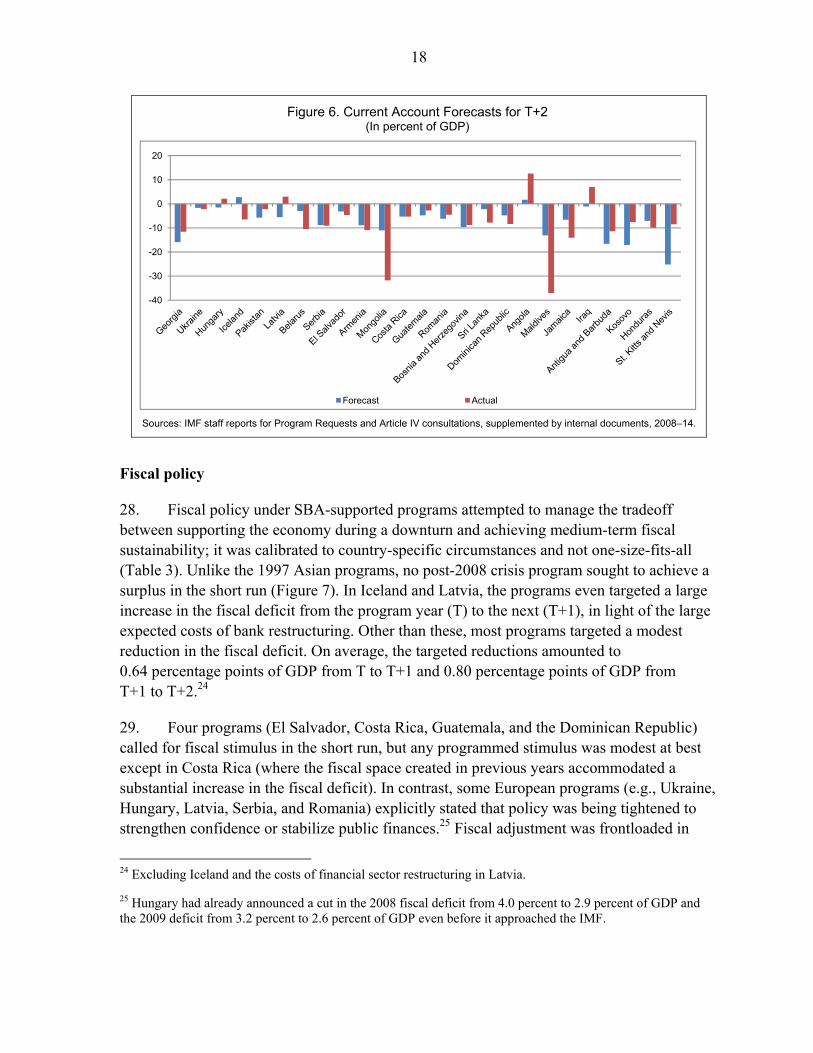
27. On average, the forecasts made by SBA-supported programs missed the actual current account adjustment by 5.6 percentage points of GDP in T+1 (Figure 5) and 6.4 percentage points of GDP in T+2, in absolute value (Figure 6). The variance of forecast errors was large. In Iceland, Belarus, Armenia, Mongolia, and Maldives, for instance, current account deficits were larger than forecast in T+1 and T+2; in the latter two countries, the error was greater than 20 percent of GDP. In contrast, IMF staff under-predicted the current account adjustment that would be observed in Latvia, Angola, and Iraq. It was the massive output loss in Latvia that led to a quick turnaround in the current account, from a deficit of over 22 percent of GDP in 2007 to a surplus equivalent to 8.7 percent of GDP in 2009, as imports of goods and services collapsed by a third.23 Likewise, the turnaround for Iraq was large, as oil prices recovered; the forecast error for T+1 was as much as 18 percent of GDP. In general, forecasts were poorer for small open economies or commodity exporters, indicating the undiversified nature of their economies or the difficulty of forecasting commodity prices.
Figure 5. Current Account Forecasts for T+1 (In percent of GDP)
Sources: IMF staff reports for Program Requests and Article IV consultations, supplemented by internal documents, 2008–14.
23 This turnaround contributed to a quick restoration of external viability for Latvia, making the bulk of external financial support unnecessary.
-35
-30
-25
-20
-15
-10
-5
0
5
10
15
Forecast Actual
18
Figure 6. Current Account Forecasts for T+2 (In percent of GDP)
Sources: IMF staff reports for Program Requests and Article IV consultations, supplemented by internal documents, 2008–14.
Fiscal policy
28. Fiscal policy under SBA-supported programs attempted to manage the tradeoff between supporting the economy during a downturn and achieving medium-term fiscal sustainability; it was calibrated to country-specific circumstances and not one-size-fits-all (Table 3). Unlike the 1997 Asian programs, no post-2008 crisis program sought to achieve a surplus in the short run (Figure 7). In Iceland and Latvia, the programs even targeted a large increase in the fiscal deficit from the program year (T) to the next (T+1), in light of the large expected costs of bank restructuring. Other than these, most programs targeted a modest reduction in the fiscal deficit. On average, the targeted reductions amounted to 0.64 percentage points of GDP from T to T+1 and 0.80 percentage points of GDP from T+1 to T+2.24
29. Four programs (El Salvador, Costa Rica, Guatemala, and the Dominican Republic) called for fiscal stimulus in the short run, but any programmed stimulus was modest at best except in Costa Rica (where the fiscal space created in previous years accommodated a substantial increase in the fiscal deficit). In contrast, some European programs (e.g., Ukraine, Hungary, Latvia, Serbia, and Romania) explicitly stated that policy was being tightened to strengthen confidence or stabilize public finances.25 Fiscal adjustment was frontloaded in
24 Excluding Iceland and the costs of financial sector restructuring in Latvia.
25 Hungary had already announced a cut in the 2008 fiscal deficit from 4.0 percent to 2.9 percent of GDP and the 2009 deficit from 3.2 percent to 2.6 percent of GDP even before it approached the IMF.
-40
-30
-20
-10
0
10
20
Forecast Actual
19
some cases, in order to create fiscal space for countercyclical purposes when needed (e.g., Serbia) or for a political economy reason (e.g., Latvia)26 (see Aslund and Dombrovskis, 2011; Bakker and Klingen, 2012). In Romania, the authorities were determined to meet their commitments under the EU’s excessive deficit procedure. In practice, however, the rhetoric of fiscal consolidation was tougher than actually programmed.27
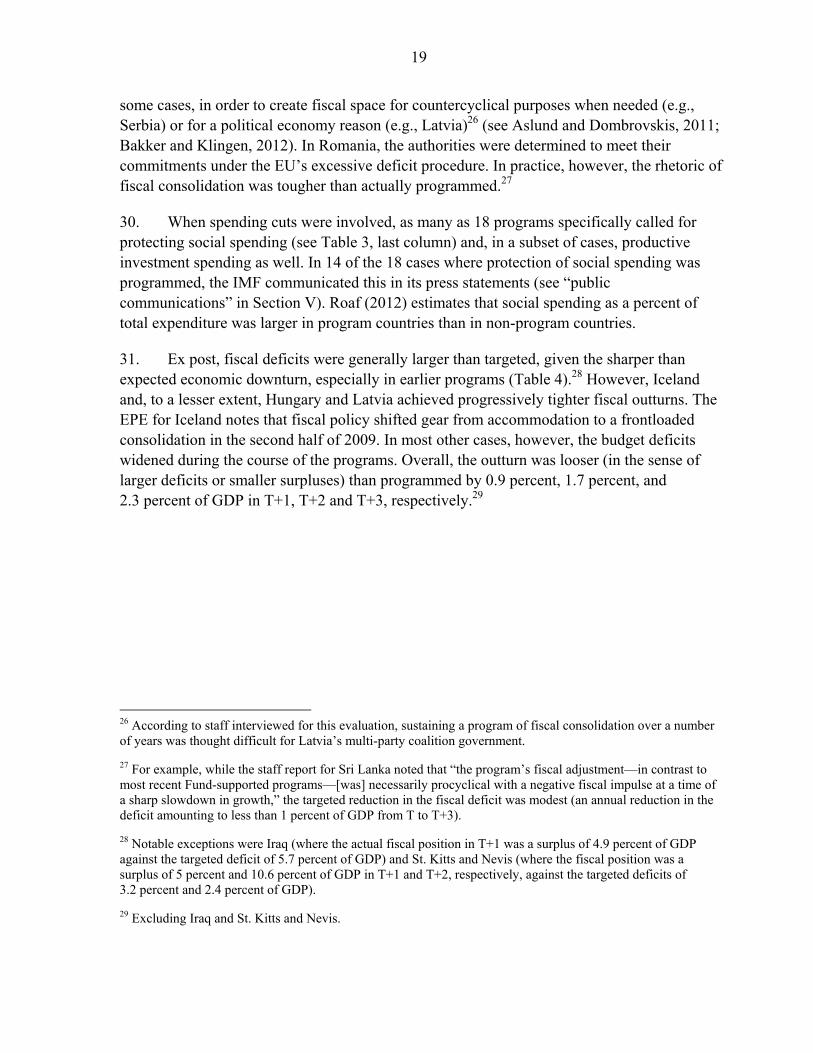
30. When spending cuts were involved, as many as 18 programs specifically called for protecting social spending (see Table 3, last column) and, in a subset of cases, productive investment spending as well. In 14 of the 18 cases where protection of social spending was programmed, the IMF communicated this in its press statements (see “public communications” in Section V). Roaf (2012) estimates that social spending as a percent of total expenditure was larger in program countries than in non-program countries.
31. Ex post, fiscal deficits were generally larger than targeted, given the sharper than expected economic downturn, especially in earlier programs (Table 4).28 However, Iceland and, to a lesser extent, Hungary and Latvia achieved progressively tighter fiscal outturns. The EPE for Iceland notes that fiscal policy shifted gear from accommodation to a frontloaded consolidation in the second half of 2009. In most other cases, however, the budget deficits widened during the course of the programs. Overall, the outturn was looser (in the sense of larger deficits or smaller surpluses) than programmed by 0.9 percent, 1.7 percent, and 2.3 percent of GDP in T+1, T+2 and T+3, respectively.29
26 According to staff interviewed for this evaluation, sustaining a program of fiscal consolidation over a number of years was thought difficult for Latvia’s multi-party coalition government.
27 For example, while the staff report for Sri Lanka noted that “the program’s fiscal adjustment—in contrast to most recent Fund-supported programs—[was] necessarily procyclical with a negative fiscal impulse at a time of a sharp slowdown in growth,” the targeted reduction in the fiscal deficit was modest (an annual reduction in the deficit amounting to less than 1 percent of GDP from T to T+3).
28 Notable exceptions were Iraq (where the actual fiscal position in T+1 was a surplus of 4.9 percent of GDP against the targeted deficit of 5.7 percent of GDP) and St. Kitts and Nevis (where the fiscal position was a surplus of 5 percent and 10.6 percent of GDP in T+1 and T+2, respectively, against the targeted deficits of 3.2 percent and 2.4 percent of GDP).
29 Excluding Iraq and St. Kitts and Nevis.

20
Figure 7. Programmed or Projected vs. Actual Fiscal Balances, from T (program year) to T+3 (In percent of GDP)
Sources: IEO calculations based on IMF staff reports for program requests and Article IV consultations, supplemented by internal documents, 2008–14.
Notes: Dotted lines indicate a target; a positive (negative) range indicates a fiscal surplus (deficit).
Ge
org
ia
Ge
org
ia
Ge
org
ia
Ge
org
ia
Ukr
ain
e
Ukr
ain
e
Ukr
ain
e
Ukr
ain
e
Hu
nga
ry
Hu
nga
ry
Hu
nga
ry Hu
nga
ry
Ice
lan
d
Ice
lan
d
Ice
lan
d
Ice
lan
d
Pak
ista
n
Pa
kist
an
Pa
kist
an
Pak
ista
n
La
tvia
La
tvia
La
tvia
La
tvia
Bel
aru
s
Bel
aru
s
Bel
aru
s
Bel
aru
s
Se
rbia
Se
rbia
Se
rbia
Se
rbia
El S
alv
ad
or
I
El S
alv
ad
or
I
El S
alv
ad
or
I
El S
alv
ad
or
I
Arm
en
ia
Arm
en
ia
Arm
en
ia
Arm
en
ia
Mo
ngo
lia
Mo
ngo
lia
Mo
ngo
lia
Mo
ngo
lia
Co
sta
Ric
a
Co
sta
Ric
a
Co
sta
Ric
a
Co
sta
Ric
a*
Gu
ate
ma
la
Gu
ate
ma
la
Gu
ate
ma
la
Gu
ate
ma
la
Ro
ma
nia
Ro
ma
nia
Ro
ma
nia
Ro
ma
nia
*
Bo
snia
an
d H
erz
ego
vin
a
Bo
snia
an
d H
erz
ego
vin
a
Bo
snia
an
d H
erz
ego
vin
a
Bo
snia
an
dH
erz
ego
vin
a
Sri
La
nka
Sri
La
nka
Sri
La
nka
Sri
La
nka
Do
min
ica
n R
ep
ub
lic
Do
min
ica
n R
ep
ub
lic
Do
min
ica
n R
ep
ub
lic
Do
min
ica
n R
ep
ub
lic
An
gola
An
gola
An
gola
An
gola
Ma
ldiv
es
Ma
ldiv
es
Ma
ldiv
es
Ma
ldiv
es
Jam
aic
a
Jam
aic
a
Jam
aic
a
Jam
aic
a
Ira
q
Ira
q
Ira
q
Ira
q*
An
tigu
a &
Ba
rbu
da
An
tigu
a &
Ba
rbu
da
An
tigu
a &
Ba
rbu
da
An
tigu
a &
Ba
rbu
da
Ko
sovo
Ko
sovo
Ko
sovo
Ko
sovo
Ho
nd
ura
s
Ho
nd
ura
s
Ho
nd
ura
s
Ho
nd
ura
s
St.
Kitt
s &
Nev
is
St.
Kitt
s &
Nev
is
St.
Kitt
s &
Nev
is
St.
Kitt
s &
Nev
is
-30
-25
-20
-15
-10
-5
0
5
10
15
-30
-25
-20
-15
-10
-5
0
5
10
15
T T+1 T+2 T+3
Actual Target

21
Table 3. Fiscal Policy Background and Strategy in SBA-Supported Programs
Country Background Strategy Measures/targets Selected structural fiscal
reforms
Protection of social
spending?
1. Georgia Improving fiscal balance eroded by elections spending and armed conflict
Limit financing need and refocus spending priorities on reconstruction
Cut current spending but allow temporary deficit increase, with medium-term discipline
Organic budget system law to ensure fiscal discipline (SPC)
2. Ukraine Procyclical policy with deteriorating balance
Prudent fiscal stance, in light of constraints and uncertainties
Phasing of fiscal tightening, with increase in social spending
Phasing out of energy sector price subsidy
Yes
3. Hungary Large deficit, with debt at 66 percent of GDP
Fiscal adjustment to ensure declining financing needs
Aims for structural fiscal adjustment of 2.5 percent of GDP
Fiscal responsibility law (SB)
4. Iceland Financial sector restructuring set to increase gross (net) debt by 83 (55) percent of GDP
Medium-term sustainability while allowing for fiscal need
Automatic stabilizers allowed to work in full before strong medium-term consolidation
Medium-term fiscal framework (SB)
5. Pakistan Inflation caused by monetization of increasing deficit
Tighten fiscal and monetary policies while protecting social stability
Cut deficit through reforms; eliminate subsidies but more development and social spending
Single treasury account, and tax and administration reform (SBs)
Yes
6. Latvia Procyclical fiscal policy contributing to boom, followed by collapsing tax revenue
Fiscal tightening to meet Maastricht criteria and to generate real depreciation
Cut deficit while protecting productive investment
Fiscal responsibility law and strategy for debt restructuring (SBs)
Yes
7. Belarus Prudent policy, with low debt, amid overheating economy
Contain domestic demand while strengthening social safety net
Maintain headline zero deficit, but cut directed lending
N.A. Yes
8. Serbia Procyclical fiscal policy, with large structural deficits
Fiscal restraint as “cornerstone of the program”
Fiscal tightening to achieve deficit targets
N.A.
9. El Salvador Fiscal consolidation, with falling debt, set back by global crisis
Moderate countercyclical policy, with more social and infrastructure spending
Ease nonfinancial sector budget deficit target somewhat in short run
N.A. Yes
10. Armenia Prudent fiscal policy, with falling public debt/GDP ratio
Reduce non-priority spending and raise revenue while increasing social spending
Limit deficit, excluding non-programmed externally financed investment projects
Tax policy and administration reform
Yes
11. Mongolia Procyclical policy before crisis, which adversely affected key mineral exports
Substantial fiscal adjustment while rationalizing social spending to target poorest
Achieve deficit target through cutting capital spending
Fiscal responsibility legislation to reduce procyclicality (SB)
Yes
12. Costa Rica Fiscal surplus amid robust growth
Use fiscal policy to mitigate drop in private demand while preserving social cohesion
Allow temporary deficit increase, with more spending on education and labor-intensive infrastructure
N.A. Yes
22
13. Guatemala Substantial fiscal consolidation, but limited fiscal room
Moderate stimulus, with focus on social and labor-intensive public works spending
Deficit allowed to increase, with shift toward external financing, before shifting to tightening
Improved tax policy and administration
Yes
14. Romania Procylical policy, with rising deficit, limited fiscal space
Strong action while protecting social and capital spending
Progressively cut deficit to meet targets
Draft fiscal responsibility law (SB)
Yes
15. Bosnia & Herzegovina
Economy collapsed, causing deficit to emerge
Consolidate finances and protect public investment and poor
Progressively cut deficit to meet targets
N.A. Yes
16. Sri Lanka Lax fiscal policy, with gross debt at 80 percent of GDP
Restore fiscal discipline while protecting most vulnerable and reconstruction spending
Reducing deficit progressively while increasing social sector spending
N.A. Yes
17. Dominican Republic
Improving policy; following crisis, policy eased initially before tightened
Countercyclical policy with focus on social and capital spending
Countercyclical policy before addressing debt and fiscal sustainability
Tax administration reform (SB)
Yes
18. Angola Procyclical policy amid booming oil exports
Determined fiscal effort, while protecting social and infrastructure spending
Achieve surplus by cutting expenditure while maintaining social spending at 30 percent
Tax system reform; consideration of sovereign wealth fund (SBs)
Yes
19. Maldives Crisis hit when fiscal policy was already unsustainable
Restore sustainability while protecting social spending
Progressively cut deficit to meet targets
N.A. Yes
20. Jamaica Decades of low growth and high debt dynamics, leaving limited fiscal space
Fiscal consolidation while increasing social safety net spending
Progressively cut deficit to meet targets while increasing social assistance spending
Par-neutral debt exchange involving 20 percent NPV reduction (PA)
Yes
21. Iraq Drop in oil caused growth to half and deficit to increase
Contain current spending while increasing investment spending
Progressively achieve budget surplus
Financial management and transparency reform (SB)
22. Antigua & Barbuda
Crisis aggravated unsustainable fiscal policy, with arrears emerging
Restore debt sustainability while protecting social outlays
Strong action entailing primary surplus
Revenue, social security, and other reforms (SB); debt restructuring
Yes
23. Kosovo Prudent fiscal policy disrupted by global crisis, with large deficit emerging
Restore fiscal sustainability through expenditure restraint and revenue measures
Deficit, excluding highway spending, to narrow
N.A.
24. Honduras Weak public sector position against fall in output
Consolidation to create space for social and investment spending
Halt fiscal deterioration, with further progress in consolidation
Pension reform; subsidy cut (SBs)
Yes
25. St. Kitts & Nevis
Collapse of tourism caused deficit to widen, with arrears developing; large public debt
Achieve sustainability, through medium-term fiscal consolidation and debt restructuring
Achieve increasing primary surplus
Debt restructuring; civil service, social security, and other reforms
Yes
Sources: IMF staff reports for program requests and Article IV consultations, supplemented by internal documents, 2008–14.
Notes: N.A.= Not applicable; PA=Prior Action; SPC=Structural Performance Criteria; SB=Structural Benchmark.

23
Table 4. Programmed or Projected vs. Actual Fiscal Balances, from T (program year) to T+3 (Simple averages for each group; in percent of GDP)
T T+1 T+2 T+3
All programs Programmed or projected -5.3 -4.3 -2.5 -2.0 Actual -5.5 -4.1 -3.3 -3.5
Earlier programs (though Romania)
Programmed or projected -3.0 -3.4 -2.8 -2.1 Actual -4.3 -5.2 -4.4 -3.4
Later programs (from Bosnia and Herzegovina)
Programmed or projected -8.3 -5.4 -2.1 -1.8 Actual -7.1 -2.7 -1.9 -3.5
Off-track programs Programmed or projected -5.8 -3.7 -2.1 -2.3 Actual -6.0 -2.9 -2.7 -3.1
Completed programs Programmed or projected -5.1 -4.5 -2.7 -1.8 Actual -5.3 -4.6 -3.6 -3.7
Sources: IMF staff reports for program requests and Article IV consultations, supplemented by internal documents, 2008–2014.
32. What enabled the accommodation of larger deficits was the large degree of flexibility incorporated into fiscal conditionality in many programs. Of the 51 program reviews for which fiscal targets were adjusted, 39 were in the direction of relaxation (see Annex 1). Romania was a typical case. The EPE states that as the growth forecast was adjusted in the first review (from -4.1 percent to -8.5 percent), the fiscal deficit targets were revised upward from 4.6 percent to 7.3 percent of GDP for 2009 and from 3.6 percent to 5.9 percent for 2010; the 2010 deficit target was again revised up to 6.8 percent of GDP at the fourth review. The EPE for the 2008 Ukraine program noted that, as financing constraints emerged on the back of revenue shortfalls, automatic stabilizers were allowed to work. In Mongolia, flexibility in conditionality was demonstrated in the setting of an indicative target, rather than explicit performance criteria, for fiscal deficit targets, which according to staff reflected the great uncertainties facing the economy.
33. The extent to which fiscal policy played a countercyclical role is difficult to measure, because such an estimate would be sensitive to the assumptions we make about potential GDP and the income elasticities of revenue and expenditure (Bornhorst and others, 2011). For a set of reasonable assumptions about the income elasticities of revenue and expenditure, it appears that the actual deficit was smaller than the deficit that would have prevailed in the absence of the fiscal measures introduced under the program in about half the cases for which IMF staff has estimated potential GDP (Table 5). In such cases, IMF financing allowed fiscal automatic stabilizers to operate but did not accommodate the full extent of the fiscal shortfall associated with a downturn.30 This type of result is more likely if the assumed
30 The correlation between the cyclically adjusted fiscal balance and the output gap was negative for the 14 countries, suggesting that the stance of fiscal policy under IMF-supported programs (from T to T+2) on average had a procyclical tendency.

24
elasticity of government expenditure becomes smaller—most certainly if the elasticity is negative such that expenditure rises during downturn.
Table 5. Actual vs. Counterfactual Fiscal Balances in 14 Countries (Number of countries whose actual deficit was smaller than counterfactual) 1, 2
Period Expenditure Elasticity = -0.5 Expenditure Elasticity = 0.5
Revenue Elasticity = 0.75
Revenue Elasticity = 1.25
Revenue Elasticity = 0.75
Revenue Elasticity = 1.25
T 6 6 5 5
T+1 8 8 6 5
T+2 7 8 6 6
Source: IEO staff estimates based on WEO database. 1 The 14 countries are those in our sample for which IMF staff has estimated potential GDP: Ukraine, Hungary, Iceland, Latvia, El Salvador, Costa Rica, Guatemala, Romania, Bosnia and Herzegovina, Dominican Republic, Jamaica, Antigua and Barbuda, Honduras, and St. Kitts and Nevis. 2 The counterfactual balance was obtained by applying the assumed income elasticities of expenditure and revenue to actual GDP relative to GDP at T-1.
34. The case of Romania is instructive in this context. If one assumes the revenue elasticity to be 1.25 or 0.75 and the expenditure elasticity to be -0.5, one would observe that the actual fiscal deficit of Romania was above the counterfactual (that is, the balance that would have prevailed in the absence of the fiscal measures introduced under the program), from T to T+2 (Figure 8, left two graphs).31 In 2010 (T+1), the Romanian government introduced revenue-enhancing measures as it faced the prospect of a widening fiscal deficit amid a collapsing economy.32 This was done to contain the adverse impact of the recession on the fiscal position. The increasing divergence between the actual and the counterfactual fiscal balance from T to T+2 may reflect the impact of such fiscal measures. Such a fiscal stance was similar to other program cases, including Hungary. The EPE for Hungary states: “[the f]iscal stance was less contractionary than in past crises, but tighter than non-program countries with room for countercyclical policies.”
31 The cyclically adjusted fiscal balance was obtained for each country by applying the assumed income elasticities of expenditure and revenue to output gap. Likewise, the counterfactual balance was obtained by applying the elasticities to actual GDP (relative to GDP in T-1). See Bornhorst and others (2011).
32 Specifically, the government introduced a 25 percent cut in public wages, an over 15 percent cut in public employment, and a VAT increase of 5 percentage points to 24 percent.

25
Figure 8. Actual, Cyclically Adjusted and Counterfactual Fiscal Balances in Romania (in percent of GDP)
Expenditure Elasticity: -0.5 Expenditure Elasticity: 0.5 R
even
ue E
last
icit
y: 0
.75
Rev
enue
Ela
stic
ity:
1.2
5
Source: IEO staff estimates based on WEO database.
35. Roaf (2012) notes two phases of fiscal policy. In early programs, there was some fiscal accommodation as output fell, though automatic stabilizers were partially offset by fiscal measures, as we noted above. In later programs, there was little fiscal accommodation to begin with; Roaf (2012) estimates that fiscal policy was tighter than past crisis cases in cyclically adjusted terms. Noting that the initially tight fiscal policy was subsequently eased in Asia, Truman (2013) argues that fiscal policy prescriptions in Europe were tighter than those in Asia.33 In Latvia, the IMF consistently underestimated the vigor with which the authorities would subsequently tighten fiscal policy.34 The Latvian authorities later complained that the staff’s excessive pessimism had reflected their limited knowledge of the country’s legal and administrative peculiarities and of European institutions.
33 Truman (2013)’s analysis covers, in addition to six euro area countries, Hungary, Iceland, Latvia, and Romania.
34 The revised 2009 budget included measures adding up to 7 percent of GDP; after the new government was installed, fiscal consolidation in 2009 is estimated to have been about 8 percent of GDP (Blanchard and others, 2013).
‐14%
-12%
-10%
-8%
-6%
-4%
-2%
0%
T-1 T T+1 T+2-12%
-10%
-8%
-6%
-4%
-2%
0%
T-1 T T+1 T+2
-16%
-14%
-12%
-10%
-8%
-6%
-4%
-2%
0%
T-1 T T+1 T+2
-12%
-10%
-8%
-6%
-4%
-2%
0%
T-1 T T+1 T+2
Actual Cyclically Adjusted Counterfactual

26
Structural conditionality
36. The need to streamline structural conditionality, especially in crisis management programs, was one of the lessons learned from the Asian crisis. Particularly in Indonesia and Korea, structural conditionality had gone far beyond addressing the critical problems of the financial sector. The Indonesia program included a large number of additional structural reforms related to cronyism and corruption, while the Korea program included trade liberalization, capital account liberalization, corporate governance, and labor market reform. This not only weakened national ownership and the investor confidence that conditionality would be met, but also diverted attention from addressing the more critical issues in a crisis situation. The IMF’s 2002 conditionality guidelines highlighted the need to focus conditionality on areas critical to achieving the macroeconomic goals of the program.
37. Shortly after the onset of the global crisis, in March 2009, the IMF Executive Board adopted a decision to terminate structural performance criteria (SPCs) in all IMF financing arrangements. Following this decision, some of the existing SPCs were converted to structural benchmarks (SBs), as in Armenia. Some subsequent reviews utilized prior actions (PAs) to make disbursements conditional on progress in structural reforms. The EPE for the 2008 Ukraine SBA observes that, as SPCs were eliminated in line with the new policy, the number of PAs had grown from four to seven and SBs from three to eight by the first review.
38. The discontinuation of SPCs makes it difficult to compare structural conditionality between post-crisis and pre-crisis programs. If we simply use the sum of SPCs, SBs and PAs as a measure of intensity, structural conditionality under post-crisis SBAs was considerably lighter than that observed in the late 1990s (Figure 9).35 The lighter conditionality of the earlier post-crisis programs, especially in Europe, reflected the view prevailing within the IMF that “programs supported by emergency SBAs should focus on preserving stability” (EPE for Serbia). The number of structural conditions, however, tended to increase as the immediate impact of the crisis dissipated: the average number rose from 5.2 per year for programs approved in 2008 to 8.5 per year for those approved in 2010 (the corresponding number was 15.3 per year for programs approved in 1997). The EPE for Serbia states that when it became clear that a financial meltdown had been averted, the program incorporated additional structural conditionality to achieve fiscal sustainability.
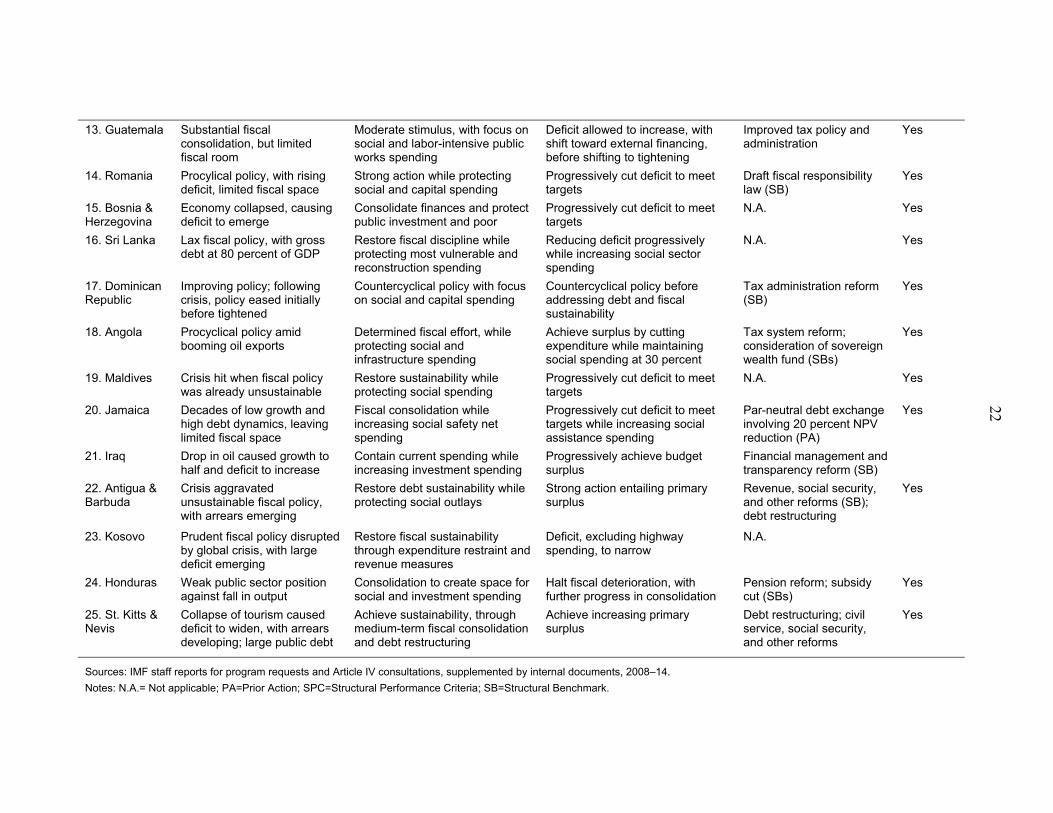
35 The number of structural conditions for 2008–11 reported in Figure 9 is based on program review documents and is somewhat greater than the number reported in the IMF’s MONA database.

27
Figure 9. Structural Conditionality in IMF Stand-By Arrangements, 1997–2000 vs. 2008–11
(Number of conditions per program per year)
Sources: IEO (2007) for 1997–2000; IEO staff estimates for 2008–11.
39. IEO (2007) observed that the focus of structural conditionality had been shifting from non-core areas (e.g., privatization, SOE reform and trade policy) towards areas of the IMF’s core competency. This observation holds for the post-crisis SBA-supported programs, though the focus tended to weaken over time. In our sample of 25 SBA-supported programs, the share of structural conditions that fell on the core areas declined from 87 percent for programs approved in 2008 to 68 percent for those approved in 2011.36 Even so, many of the non-core conditions, such as those related to public sector, pension, and labor market reforms, related closely to public finances and competitiveness.
40. The 2008 SBA with Latvia was a special case. The program had the aim of preserving the country’s peg to the euro and therefore included strong structural conditionality outside areas of the IMF’s core competence, designed to improve competitiveness and achieve internal devaluation. In particular, the Latvia SBA included three PAs, 46 SBs and one SPC over the course of its program, supplemented by 183 conditions agreed with the EU. Latvia’s export competitiveness did improve, but Blanchard and others (2013) estimate that it was brought about more by increased productivity than by declines in internal costs.
41. Most programs rightly included measures to strengthen the financial sector. Truman (2013) observes that while banking sector stabilization was prominent in European crisis countries, they did not see the kind of comprehensive financial sector restructuring observed in East Asia. This may be due to the fact that action was prompt and well-planned, thereby sparing the need for comprehensive restructuring in the aftermath of a financial
36 The core areas of competency are defined to include central bank, exchange systems and restrictions (current and capital), and financial sector.
0
5
10
15
20
25
1997 1998 1999 2000 2008 2009 2010 2011
Structural Benchmark Structural Performance Criteria Prior Actions
28
meltdown (the collapse of the banking sector in Iceland was a fait accompli when the country approached the IMF). This too represented learning from the Asian crisis.
42. In our sample of 25 SBA-supported programs, a formal statistical test indicates that three characteristics played a vital role in determining the number of structural conditions (see Section C in Annex 2). First, programs supported by precautionary arrangements (Serbia, 2009; El Salvador, 2009; Costa Rica, 2009; Guatemala, 2009; and Honduras, 2009) had a significantly smaller number of structural conditions. Second, a program tended to have a greater number of structural conditions if it had more frontloading (as percent of total financing). Third, though statistical significance is lower, the number of conditions was smaller for a program that took a longer time to negotiate. The last result may explain why early European programs, perceived as emergency programs, had light structural conditionality, except in the case of Latvia, as noted above.
43. The otherwise light conditionality of early European programs, however, was counterbalanced by a greater number of PAs, most of which were related to financial sector restructuring, fiscal reforms, and exchange rate systems. According to the EPE for the 2008 Ukraine SBA, the use of a large number of prior actions was meant to ensure critical policy implementation when the political environment had become polarized. Among the European programs, the Hungary SBA was the only program without a PA. In one European country interviewees recalled requesting additional PAs because, in their view, that was the only way to get reforms done. Overall, few PAs related to non-core areas. The IMF’s MONA database identifies 135 PAs, of which 86 percent were in the IMF’s core areas of competency (Figure 10).
Figure 10. Breakdown of Prior Actions by Sector, 2008–11 (In percent of total)
Source: IMF MONA database.
General Government,
45%
Central Bank, 13%Civil
Service, 5%
Pension and Social Sector,
3%
Public Enterprise, 5%
Financial Sector, 21%
Exchange Systems, 7%

29
Exchange rate and other external sector policies
44. About half the programs (13 programs) called for exchange rate flexibility, with eight of them calling in addition for inflation targeting (IT) over the medium term (Table 6). IMF staff was well aware of the potentially adverse balance sheet effect in countries with large foreign currency debt, if the exchange rate was allowed to depreciate too much (they noted this risk at least in 13 countries). This was particularly true with relatively more advanced European countries, where cross-border financial integration was high. Six programs in European countries noted the balance sheet vulnerabilities, and four of these accommodated temporary use of exchange controls. In Hungary and Ukraine, monetary policy was tightened to limit further depreciation (Bakker and Klingen, 2012).
45. Considerable learning had taken place within the IMF since the East Asian crisis of the late 1990s concerning the adverse impact of balance sheet effects arising from currency and maturity mismatches. Even outside Europe, some programs calling for exchange rate flexibility cautioned against moving too quickly. The program for the Dominican Republic, for instance, observed the need for greater exchange rate flexibility “as balance of payments pressure eases.” Five programs included maintaining or shifting to a pegged exchange rate regime of one type or another. In Belarus, for example, the program called for a 20 percent step devaluation followed by repegging the ruble to a basket of currencies within a band of ±5 percent (replacing a peg to the US dollar within a band of ±2 percent).
46. The decision to support Latvia’s decision to maintain the peg was a controversial one, even within the IMF, especially given the history of its engagement with the country. That the IMF viewed the lat to be overvalued was public knowledge. Although the IMF ultimately supported the authorities’ strongly owned strategy, especially in view of the risk of contagion to other currency pegs in the region if the lat were to be devalued (Purfield and Rosenberg, 2010; Blanchard and others, 2013), internal documents suggest that staff continued to maintain a contingency plan involving a series of options for devaluation. According to some officials interviewed, this irritated the national authorities and at times made the IMF’s relationship with Latvia less than smooth.
47. Another controversial decision involved the inclusion of capital controls in the design of Iceland’s 2008 SBA (approved in November 2008), which had been introduced by the authorities in early October. According to the Icelandic authorities interviewed for this evaluation, this reflected the recognition that alternatives were few and not palatable. There was agreement that, in the absence of controls, the currency could depreciate beyond the 40 percent that had already occurred in the early stages of the crisis. Exchange controls, including Latvia’s partial freeze on deposit withdrawals, were more widely employed (often before the IMF was called in) and IMF staff agreed to have them removed in stages. In Ukraine and Pakistan, however, staff encouraged timely elimination of controls as they believed they were contrary to the objective of encouraging greater exchange rate flexibility (IMF, 2009).

30
Table 6. External Sector Policies
Background Exchange rate policy Capital controls Exchange controls
1. Georgia High dollarization; sustained real appreciation, followed by temporary pegging
Greater flexibility as banking system stabilizes, with IT over medium term
N.A. N.A.
2. Ukraine Weak private sector balance sheets, with borrowing in foreign currency
Flexible exchange rate (PA), with transition to IT, while avoiding disorderly market developments
N.A. Exchange controls to be assessed at first review
3. Hungary Buildup of foreign currency liabilities by private sector
Flexible exchange rate with inflation targeting, with limited intervention
N.A. N.A.
4. Iceland Large foreign exchange-linked debt in corporate and household balance sheets; adverse impact of banking sector collapse on confidence
Preventing further sharp depreciation to reduce adverse balance sheet effect
Capital controls to be maintained for time being
Temporary exchange controls to be removed during program period
5. Pakistan N.A. Flexible exchange rate policy, with limited intervention
N.A. Exchange controls to be removed
6. Latvia Market concerns over sustainability of peg, given large external debt
Maintaining peg, given strong ownership and adverse balance sheet effect of devaluation
N.A. Partial deposit freeze to be removed as conditions stabilize
7. Belarus Peg under pressure; rise in foreign currency borrowing
Initial devaluation (PA), followed by peg to basket with band
N.A. Exchange controls to be assessed at first review
8. Serbia Large external indebtedness, coupled with high euroization
Managed floating, with interventions limiting balance sheet effect
Capital account relatively closed
N.A.
9. El Salvador Official dollarization N.A. N.A. N.A.
10. Armenia Devaluation may trigger deposit withdrawal and re-dollarization
Devaluation followed by flexible exchange rate with IT over time
Capital account relatively closed
N.A.
11. Mongolia Large foreign currency lending Exchange rate flexibility to limit reserve loss
N.A. Exchange restrictions to be removed
12. Costa Rica REER broadly in equilibrium Greater exchange rate flexibility and monetary tightening, with transition to IT
N.A. N.A.
13. Guatemala Large currency risk in private sector, substantially covered by official reserves
Flexible exchange rate while strengthening IT framework
N.A. N.A.

31
14. Romania Depreciation against euro with adverse balance sheet effect
Commitment to floating exchange rate with IT
N.A. N.A.
15. Bosnia and Herzegovina
No strong evidence of significant misalignment
Safeguard currency board considered strongest institution
N.A. N.A.
16. Sri Lanka Overvaluation with de facto peg; high foreign currency lending
Avoid disorderly devaluation while allowing greater flexibility
N.A. Exchange controls to be removed (PA)
17. Dominican Republic
Exchange rate in line with fundamentals following modest depreciation
Greater exchange rate flexibility as balance of payments pressure eases
N.A. N.A.
18. Angola Reserve loss as exchange rate defended; high dollarization
Orderly exchange rate adjustment backed by tight monetary policy
N.A. N.A.
19. Maldives Peg appropriate, with devaluation potentially counterproductive
Retain peg through fiscal and monetary tightening
N.A. Foreign exchange rationing introduced
20. Jamaica Exchange rate in line with fundamentals, following depreciation
Exchange rate flexibility with limited intervention, given high dollarization
N.A. N.A.
21. Iraq Dollar exchange rate stable following appreciation
Reduce dollarization through exchange rate and price stability
N.A. Eliminate all restrictions under IMF jurisdiction
22. Antigua and Barbuda
ECCU member; exchange rate consistent with fundamentals
N.A. N.A. N.A.
23. Kosovo Euroized economy N.A. N.A. N.A.
24. Honduras High degree of dollarization Replace de facto fixed exchange rate with crawling band
N.A. N.A.
25. St. Kitts and Nevis
ECCU member N.A. N.A. N.A.
Sources: IMF staff reports for program requests and Article IV consultations, supplemented by internal documents, 2008–14.
Notes: N.A.=Not applicable; PA=Prior Action
32
48. Post-crisis SBA countries generally experienced smaller currency depreciation against the US dollar than their pre-crisis peers. As Takagi (2010) notes, the exchange rates of early European crisis countries stabilized under the program, in contrast to the experience of Asian crisis countries in 1997.37 For example, while the Icelandic krona had depreciated against the US dollar by nearly 70 percent by the time the government approached the IMF, it even appreciated slightly over subsequent months once the program was approved.38 Roaf (2012) notes, moreover, that later program countries saw very little exchange rate movement, as confirmed by our own analysis (see Table A2.2 in Annex 2). It is possible that not only larger access but also the judicious use of exchange and capital controls contributed to the generally more limited exchange rate depreciation observed under the post-crisis SBAs.
Risks and uncertainty
49. While lack of candor in spelling out risks and uncertainty in IMF-supported programs has been a recurring weakness identified by the IEO (IEO, 2014b), especially in the case of the IMF’s programs in the late 1990s and early 2000s (IEO, 2003 and IEO, 2004), this observation does not apply to the 25 programs in this review. In line with the 2002 Conditionality Guidelines and subsequent revisions in 2008 and 2010, the program documents spelled out risks to implementation and the economic outlook. For example, the staff report for Romania’s program request noted that there were “exceptional uncertainties and risks,” while that for Maldives observed that there were “substantial risks,” including political resistance to fiscal adjustment, given the lack of a parliamentary majority.
50. The conclusion in each case, however, was the same: despite downside risks, the program was deemed to have a good prospect of success and was deserving of IMF support. The fact that a staff report is submitted to the Executive Board is an indication of staff and management support for the program, and therefore the conclusion, however predictable, is what one should expect. Explicit recognition of program risks is a step in the right direction, but the exercise appears to have become too pro forma to add value. Internal documents are more explicit in exploring alternative assumptions, indicating that staff exercised their due diligence in contingency planning. Given the sensitivity, how to involve the Board in contingency planning in IMF-supported programs remains an unresolved issue.
37 The currencies of the three crisis Asian countries continued to fall against the dollar even after the IMF-supported programs had been approved.
38 Because the countries had already experienced significant currency depreciation before approaching the IMF, annual data fail to show that their overall depreciation was smaller than their pre-crisis peers. See Section A in Annex 2.
33
V. MODALITIES OF ENGAGEMENT
Response
51. The IMF was quick in responding to the needs of the membership for financial support. The average time the IMF took to approve an SBA-supported program (meaning the time from request or initial discussion to Board approval) was 12.2 weeks, with the average time for the first 14 programs (though March 2009) 6.2 weeks (Table 7, column 4). Ukraine’s 2008 program took less than 4 weeks from request to Board approval, and remains one of the fastest programs to be approved in IMF history. All this happened during the middle of a major downsizing of the staff. This must be judged to be a major achievement of the IMF.
52. As the immediate impact of the crisis dissipated, however, the length of time the IMF took to approve a program tended to lengthen. The EPE for the Costa Rica SBA (approved in April 2009) states that the program discussion dragged on for about three months before agreement was reached on the appropriate fiscal stance. The SBA for Sri Lanka took over 21 weeks to approve (in July 2009) because several shareholders, including one of the largest, reportedly politicized the manner in which the Sri Lankan government was ending its 30-year long civil conflict. Contrary to what the authorities had hoped, moreover, the disbursement of funds was not frontloaded.39 Fortunately, the much-feared crisis was averted, as it appears that the end of the civil conflict—coupled with IMF engagement itself—worked favorably on investor confidence.
53. It was the excellent preparedness of IMF staff that enabled a quick response to the crisis. For example, the European Department already had a contingency plan in place for several countries by the time of the Lehman failure. The mission to Ukraine, moreover, was headed by someone experienced in financial sector issues. Though the program itself cannot be judged to be an astounding success (largely because of a divided government about which the IMF could do little), at a minimum the banking crisis was quickly contained before the program went off track. The IMF’s rapid response can be contrasted with those of other partners. In Latvia, for instance, whereas the IMF Board took a decision to provide immediate emergency financing on December 23, 2008, the EU’s ECOFIN Council took a decision (Decision 5255/09) only on January 20, 2009 to provide Community medium-term financial assistance and the first tranche was not released until March 2009.
39 The authorities lodged a complaint on this matter in their statement in the EPE.

34
Table 7. IMF Stand-By Arrangements Approved, September 2008–July 2011: Program Negotiations, Reviews, and Drawings
Country
Date of request or first program discussion
Date of Board approval
Time elapsed (in weeks)
Number of reviews
scheduled
Number of reviews
completed
Amount committed (in
millions of SDRs)
Amount drawn (in millions of SDRs;
percent of commitment in parentheses)
1. Georgia August 23, 2008 September 15,
2008 3.3 9 9 747.10 577.10 (77.2)
2. Ukraine October 16, 2008 November 5, 2008 2.9 7 2 11,000.00 4,000.00 (36.4)
3. Hungary October 10, 2008 November 6, 2008 3.9 7 5 10,537.50 7,637.00 (72.5)
4. Iceland Mid October, 2008 November 19, 2008 About 5 6 6 1,400.00 1,400.00 (100.0)
5. Pakistan Mid October, 2008 November 24, 2008 About 6 6 4 7,235.90 2,868.63 (39.6)
6. Latvia November 21, 2008 December 23, 2008 4.6 5 5 1,521.63 982.24 (64.6)
7. Belarus November 8, 2008 January 12, 2009 9.3 4 4 2,269.52 1,751.71 (77.2)
8. Serbia October 29, 2008 January 16, 2009 11.3 8 7 2,619.12 1,367.74 (52.2)
9. El Salvador December 15, 2008 January 16, 2009 4.6 4 0 513.90 0.00 (0.0)
10. Armenia February 4, 2009 March 6, 2009 4.3 9 3 533.60 350.42 (65.7)
11. Mongolia November 1, 2008 April 1, 2009 5.7 6 6 153.30 122.64 (80.0)
12. Costa Rica January 15, 2009 April 10, 2009 12.1 4 3 492.30 0.00 (0.0)
13. Guatemala March 17, 2009 April 22, 2009 5.1 5 4 630.60 0.00 (0.0)
14. Romania March 2, 2009 May 4, 2009 9.0 8 8 11,443.00 10,569.00 (92.4)
15. Bosnia and Herzegovina April 14, 2009 July 8, 2009 12.1 10 3 1,014.60 338.20 (33.3)
16. Sri Lanka February 26, 2009 July 24, 2009 21.1 8 8 1,653.60 1,653.60 (100.0)

35
17. Dominican Republic August 24, 2009 November 9, 2009 11.0 8 6 1,094.50 766.15 (70.0)
18. Angola September 23, 2009 November 23, 2009 8.7 6 6 858.90 858.90 (100.0)
19. Maldives August 10, 2009 December 4, 2009 16.6 11 1 57.40 10.25 (17.9)
20. Jamaica May 30, 2009 February 4, 2010 35.7 8 3 820.50 541.8 (66.0)
21. Iraq July 13, 2009 February 24, 2010 32.3 5 2 2,376.80 1,069.56 (45.0)
22. Antigua and Barbuda August 26, 2009 June 8, 2010 40.9 10 10 67.50 67.50 (100.0)
23. Kosovo February 18, 2010 July 21, 2010 21.9 5 5 92.66 18.76 (20.2)
24. Honduras August 2, 2010 October 1, 2010 8.6 5 5 129.50 0.00 (0.0)
25. St. Kitts and Nevis May 16, 2011 July 27, 2011 10.3 10 8 52.51 47.36 (90.2)
Total (*average) N/A N/A 12.2* 7* 4.9* 59,315.93 36,998.59 (62.4)
Source: IMF staff reports for program requests and Article IV consultations, supplemented by internal documents, 2008–14.

36
54. Against this overall positive assessment, the case of Armenia should be noted. In September 2008, the IMF and Armenia reached agreement on a program to be supported by a low-access PRGF arrangement (10 percent of quota), which was approved by the Board in October. This, however, proved to be insufficient. Once the IMF realized that the crisis was much more severe than initially thought, it was quick to put in place a larger access SBA (initially 400 percent of quota and then increased to 580 percent at the first review); but the question remains about how the IMF could be so wrong in its initial diagnosis. It can be noted that Armenia was at the time considered to be a star performer and a role model for transition economies. This perception, reinforced by the observation that the country had been relatively immune to earlier external shocks, may in part explain why the discussion for an SBA did not start until February 2009.
Budget support
55. The IMF was flexible in allowing balance of payments support to be channeled as direct budget support in 11 countries, including 8 “European” countries: Georgia, Ukraine, Hungary, Pakistan, Latvia, Armenia, Romania, Bosnia and Herzegovina, the Dominican Republic, Iraq, and Kosovo (see Table 1, column 7).40 Although there had been a number of precedents in the past, use of resources for direct budgetary financing was not a normal practice of the IMF.41 Such practice became more widespread after 2008, not only because of the crisis, which significantly tightened public sector funding conditions, but also because of the move to greater central bank independence, which made it difficult to provide financing to member countries though the central bank. No clear IMF guidelines existed until March 2010, when a Staff Guidance Note was issued to clarify the legal framework for use of Fund resources for budget support and to provide guidance on such use (IMF, 2010). Several senior officials in Europe interviewed for this evaluation indicated that the prospect of direct budgetary support raised the attractiveness, and helped overcome the stigma, of IMF financing at a critical time.
Public communications
56. In line with the strategy established in 2007, the aim of the IMF’s public communications was to “build understanding and support” for its policies during the global financial and economic crisis.42 Because one of the primary goals of an IMF-supported
40 Of these Armenia and Georgia are covered by the Middle East and Central Asia Department within the IMF.
41 In reviewing an earlier version of this paper, the Legal Department noted that according to the IMF Articles of Agreement, a purchase in the General Resources Account could only be made if “the member represents that it has a need to make the purchase because of its balance of payments or its reserve position or developments in its reserves” (Article V, Section 3(b)). However, a member receiving IMF financing for addressing its balance of payments problems can use the domestic counterpart of such financing for budgetary support purposes.
42 The Acting Chair’s Summing Up, “The IMF’s Communications Strategy,” BUFF/07/92, June 18, 2007.

37
program in capital account cases is to restore investor confidence (IEO, 2003), the IMF sought to present financing packages as credible. Here again, considerable learning had taken place since the East Asian crisis, where investors questioned the national ownership of IMF-supported programs and failed to believe that the financing packages were credible. In some early European programs in 2008, a staff member from the External Relations Department accompanied program missions. Outreach efforts by staff were frequent, explaining the programs to opposition politicians, business and labor leaders, journalists, academics, and market participants.
57. The IMF’s public communication efforts stressed not only national ownership but also the logic of the programs in a way calculated to restore investor confidence (Figure 11). For example, the press releases or public information notices for 22 programs expressed the idea that the IMF was supporting the authorities’ program, and sometimes program documents were explicit about national ownership, e.g., in Romania the program was referred to as “an economic program designed by the Romanian authorities.”
Figure 11. References in the IMF’s Public Communications (In percent of 25 programs)
Source: IMF press releases and public information notices.
58. In the same spirit, the press documents for 16 programs made an explicit reference to investor confidence, while those for 15 programs highlighted the collaborative nature of IMF-supported programs, by noting the financial and program contributions from the World Bank, the European Union, other multilateral and regional institutions, and bilateral donors. Likewise, to build public support for the programs, the IMF’s public communications highlighted protection of social spending (targeted at the poor or the most vulnerable), with such emphasis contained in the press statements for 14 programs. A few included an exposition of exactly how the financing gap was going to be filled.
0
20
40
60
80
100
Acc
ess
Nat
iona
l ow
ners
hip
Mar
ket c
onfid
ence
Inte
rnat
iona
l co
llabo
ratio
n
Soc
ial p
rote
ctio
n
Fin
anci
ng g
ap

38
VI. ASSESSING THE EFFECTIVENESS OF SBA-SUPPORTED PROGRAMS
59. This paper has reviewed 25 programs supported by IMF Stand-By Arrangements approved between 2008 and 2011, to highlight what was unique about the IMF’s early crisis response and to identify the common elements of program design during the post-crisis period. The review found that the IMF responded quickly to the evolving needs of member countries by providing large access and highly frontloaded disbursements, especially during the early part of the crisis. The IMF was flexible in allowing resources to be channeled directly as budget support. A number of officials interviewed for this evaluation praised the IMF for the extraordinary flexibility it displayed in response to the global crisis.
60. The IMF cooperated, especially in European programs, with multilateral and bilateral donors; it also sought private sector involvement proactively when helpful and feasible; and in a few instances it even accommodated temporary use of capital and exchange controls. To varying but substantial degrees, the IMF communicated the logic of the program in a way designed to help build investor confidence and support among the public.
61. In program design, the IMF was optimistic on growth forecasts, especially in early (mostly European) programs. In most instances, however, growth optimism was largely corrected by the first review, suggesting that much of the forecast error came from underestimating the adverse impact of the global crisis on output. Errors in forecasting current account developments had a large variance, indicating the inherent difficulty of forecasting a highly endogenous variable.
62. Programs generally targeted a gradual reduction in the fiscal deficit, though the actual outturns were looser than programmed as the targets were relaxed when the crisis proved more severe than forecast. Fiscal automatic stabilizers were allowed to operate when output collapsed, but in about half the cases for which data are available IMF financing did not appear to accommodate the full extent of fiscal shortfalls. There is no objective basis either to endorse or to question the way these programs attempted to manage the tradeoff between supporting the economy against a large adverse shock and ensuring medium-term fiscal sustainability.
63. Considerable learning had taken place within the IMF since the emerging market crises of the late 1990s and early 2000s. Structural conditionality was more streamlined and more focused on the core areas of the IMF’s competence. About half the programs called for greater exchange rate flexibility, but the IMF cautioned against too rapid a depreciation as having an adverse balance sheet effect. Post-crisis SBA countries thus experienced generally smaller currency depreciation under the programs than their counterparts during 1997–99. Program documents spelled out risks to implementation and the economic outlook, albeit in a pro-forma manner. Staff, however, did contingency planning on how to address these and other risks. Given the sensitivity, how to involve the Board in contingency planning in IMF-supported programs remains an unresolved issue.

39
64. The main conclusion of our analysis is that SBA-supported programs likely helped prevent deeper contractions of output. What’s more, there was a relatively quick turnaround in economic activity. If corrected for the impact of global factors, the average output loss of post-crisis SBA countries, which was greater by 2.7 percentage points of GDP than their non-program peers in 2009, had narrowed to 1.6 percentage points of GDP by 2010. Though attribution is difficult, especially given the contemporaneous global easing of macroeconomic policies, IMF financing must have been a contributing factor. While a deep recession could not be avoided in Latvia, it nonetheless successfully achieved the primary objective of defending the peg, allowing the country to adopt the euro on January 1, 2014. Unlike previous emerging market crises, a widely-feared financial meltdown was avoided except in Iceland (where the collapse of the banking sector was a fait accompli when the country approached the Fund). There were a limited number of bank failures (e.g., Ukraine and Latvia), but even there the fiscal costs were contained.43
65. Against this overall positive assessment, a few reflections are in order. First, the completion rate of SBA-supported programs was rather low: only 14 of the 25 programs were completed; and only 62.4 percent of the committed resources were drawn (Table 7, columns 5–8; Figure 12).44 A number of officials and experts interviewed for this evaluation stated that, in their view, what ex post proved to be over-financing had contributed to the credibility of IMF-supported programs. Management of a capital account crisis requires large, frontloaded financing in order to build investor confidence that the program is fully funded. In this respect, the fact that not all committed resources were needed could be a reflection of the effectiveness of SBA-supported programs.45 Even so, a number of countries withdrew from the program engagement as soon as the economy came out of the woods, raising questions about the extent of demand for SBA-type arrangements in calmer times.46
43 The fiscal costs were 2.5 percent in Latvia and 4.8 percent of GDP in Ukraine, smaller than in earlier crisis cases.
44 The comparable figure would be 64.3 percent if the four precautionary arrangements (El Salvador, Costa Rica, Guatemala, and Honduras) were excluded.
45 The utilization rate was larger for EU funds, possibly reflecting the IMF’s higher exceptional access charges. In Latvia, for example, the utilization rate was 93.5 percent for EU resources and 64.7 percent for IMF resources. Likewise, the rates were 84.6 percent and 72.5 percent, respectively, for Hungary; and 100.0 percent and 92.4 percent, respectively, for Romania.
46 This is not to suggest that it was an unusual move on the part of a country not to make a full drawing of the committed resources. In fact, the utilization rate of early European programs (with the notable exception of Iceland, ranging from 52 percent to 77 percent) does not markedly differ from the experience in previous acute capital account cases (though the engagement was shorter): 62 percent in Indonesia, 1997–99; 93 percent in Korea, 1997–99; and 83 percent in Brazil, 1998-2002. An important issue is whether large frontloading played a role in diminishing the prospect of a longer engagement by meeting the country’s financial needs quickly.

40
Figure 12. IMF Stand-By Arrangements: Resources Committed and Disbursed, 2008–11 (In millions of SDRs)
Source: Finance Department, IMF.
66. Second, in this context, IMF staff’s own assessment, as contained in the EPEs and EPAs of recent crisis programs, maintain that, while programs succeeded in restoring macroeconomic and financial stability, vulnerabilities were insufficiently addressed, even in otherwise strong programs. Moreover, many of the reforms and fiscal consolidation efforts were withdrawn once the program relationships ended. For example, in Belarus, fiscal policy was relaxed and quasi-fiscal activities expanded (their containment had been the program’s key objective). In Hungary, although substantial fiscal consolidation had been accomplished, some of the achievements were reversed and most reforms withdrawn. Likewise, the otherwise strong Guatemala program, as the EPE notes, left important vulnerabilities in banking supervision and budgetary control.47 Romania may be a relatively successful case, where the country completed all program reviews by achieving fiscal adjustment and substantial structural reforms. But even there, SOE arrears remained large at the end of the program. These and other recent experiences highlight the perennial issue of whether structural and long-term fiscal issues can be effectively tackled by conditionality during a crisis—or more practically how to design reforms that will be sustained beyond the program relationship with the IMF.
67. Finally, another important question concerns how to design expansionary fiscal measures that will not become permanent but reverse themselves once the economy begins to recover. This is often difficult to do during the middle of a crisis, given the understandable
47 Staff, considering it difficult to built consensus on comprehensive tax reforms during the short duration of the program, placed no conditionality on revenue-generating measures. The EPE concludes: “Attaching conditionality to a few critical and politically feasible elements of a more comprehensive reform could have strengthened the SBA.”
0
2,000
4,000
6,000
8,000
10,000
12,000
14,000
Amount agreed Amount drawn
41
preoccupation with containing its immediate fallout. Staff was aware of the need to reduce the procyclicality of fiscal policy in a number of programs, and even used prior actions and structural benchmarks in some cases to that end. The outcome, however, has not been fully satisfactory. In Costa Rica, for example, the fiscal position was weaker at the end of the program because the countercyclical expenditure measures adopted turned out to be permanent. In Mongolia, IMF staff decided not to set quantitative PCs on the primary deficit or non-mineral deficit out of concerns about downside risks. As a result, with the strong recovery in copper prices, the Fiscal Responsibility Law was watered down, leaving the pro-cyclicality of government budgeting.

42
REFERENCES
Aslund, Anders, 2010, The Last Shall Be the First: The East European Financial Crisis, Washington: Peterson Institute for International Economics.
Aslund, Anders and Valdis Dombrovskis, 2011, How Latvia Came through the Financial Crisis, Washington: Peterson Institute for International Economics.
Bakker, Bas B. and Christoph Klingen (eds.), 2012, How Emerging Europe Came Through the 2008/09 Crisis: An Account by the Staff of the IMF’s European Department, Washington: International Monetary Fund.
Berglof, Erik, 2012, “Filling the Gaps: The Vienna Initiative and the Role of International Financial Institutions in Crisis Management and Resolution,” Franklin Allen, Masahiko Aoki, Jean-Paul Fitoussi, Nobuhiro Kiyotaki, Roger Gordon, and Joseph E. Stiglitz (eds), The Global Macro Economy and Finance, New York: Palgrave Macmillan, 211-223.
Blanchard, Olivier J., Mark Griffiths, and Bertrand Gruss, 2013, “Boom, Bust, Recovery: Forensics of the Latvia Crisis,” Brookings Papers on Economic Activity, Fall, 325-371.
Bornhorst, Fabian, Gabriela Dobrescu, Annalisa Fedelino, Jan Gottschalk, and Taisuke Nakata, 2011, “When and How to Adjust Beyond the Business Cycle? A Guide to Structural Fiscal Balances,” Technical Notes and Manuals, Fiscal Affairs Department, International Monetary Fund.
de Haas, Ralph, Yevgeniya Korniyenko, Elena Loukoianova, Alexander Pivovarsky, 2012, “Foreign Banks and Vienna Initiative: Turning Sinners into Saints?” IMF Working Paper 12/117, May 1.
European Commission, 2009, “Community Balance of Payments Assistance—Latvia—First Review Linked to the Second Installment,” Brussels, June 24.
Independent Evaluation Office (IEO), 2003, “The IMF and Recent Capital Account Crises: Indonesia, Korea, Brazil” (Washington: International Monetary Fund).
—————, 2004, “The IMF and Argentina, 1991–2001” (Washington: International Monetary Fund).
—————, 2007, “Structural Conditionality in IMF-Supported Programs” (Washington: International Monetary Fund).
—————, 2014a, “IMF Forecasts: Process, Quality, and Country Perspectives” (Washington: International Monetary Fund).

43
—————, 2014b, “Recurring Issues from a Decade of Evaluation: Lessons for the IMF” (Washington: International Monetary Fund).
International Monetary Fund, 2009, “Review of Recent Crisis Programs,” September 14 (Washington).
—————, Strategy, Policy and Review Department, 2010, “Staff Guidance Note on the Use of Fund Resources for Budget Support,” May 23 (Washington).
Purfield, Catriona and Christoph B. Rosenberg, 2010, “Adjustment under a Currency Peg: Estonia, Latvia and Lithuania during the Global Financial Crisis 2008-09,” Working Paper 10/213, International Monetary Fund.
Roaf, James, 2012, “Crisis Programs Review,” presentation to the IMF Executive Board, July 2 (Washington).
Takagi, Shinji, 2010, “Applying the Lessons of Asia: The IMF’s Crisis Management Strategy in 2008,” Working Paper No. 206, Asian Development Bank Institute.
Truman, Edwin M., 2013, “Evolution of the Asian and European Financial Crises: Role of the International Monetary Fund,” Changyong Rhee and Adam S. Rosen (eds), Responding to Financial Crisis: Lessons from Asia Then, the United States and Europe Now, Asian Development Bank and Peterson Institute for International Economics, 179-212.
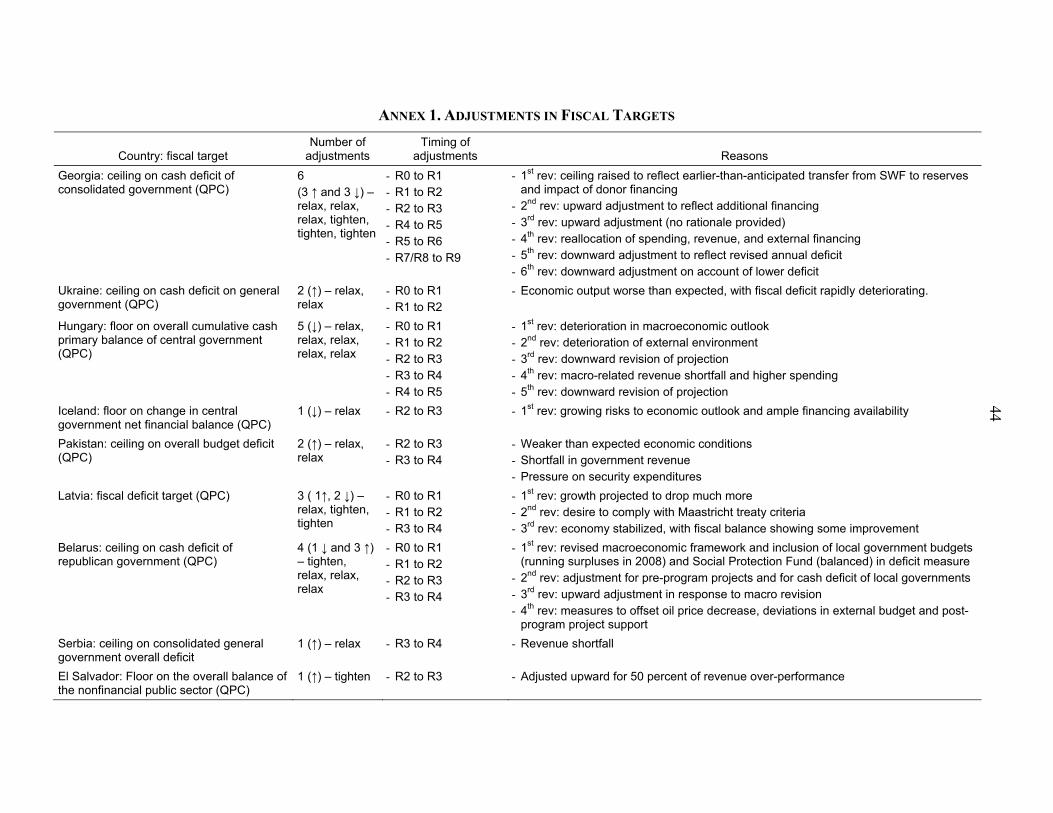
44
ANNEX 1. ADJUSTMENTS IN FISCAL TARGETS
Country: fiscal target Number of
adjustments Timing of
adjustments Reasons
Georgia: ceiling on cash deficit of consolidated government (QPC)
6 (3 ↑ and 3 ↓) – relax, relax, relax, tighten, tighten, tighten
- R0 to R1 - R1 to R2 - R2 to R3 - R4 to R5 - R5 to R6 - R7/R8 to R9
- 1st rev: ceiling raised to reflect earlier-than-anticipated transfer from SWF to reserves and impact of donor financing
- 2nd rev: upward adjustment to reflect additional financing - 3rd rev: upward adjustment (no rationale provided) - 4th rev: reallocation of spending, revenue, and external financing - 5th rev: downward adjustment to reflect revised annual deficit - 6th rev: downward adjustment on account of lower deficit
Ukraine: ceiling on cash deficit on general government (QPC)
2 (↑) – relax, relax
- R0 to R1 - R1 to R2
- Economic output worse than expected, with fiscal deficit rapidly deteriorating.
Hungary: floor on overall cumulative cash primary balance of central government (QPC)
5 (↓) – relax, relax, relax, relax, relax
- R0 to R1 - R1 to R2 - R2 to R3 - R3 to R4 - R4 to R5
- 1st rev: deterioration in macroeconomic outlook - 2nd rev: deterioration of external environment - 3rd rev: downward revision of projection - 4th rev: macro-related revenue shortfall and higher spending - 5th rev: downward revision of projection
Iceland: floor on change in central government net financial balance (QPC)
1 (↓) – relax - R2 to R3 - 1st rev: growing risks to economic outlook and ample financing availability
Pakistan: ceiling on overall budget deficit (QPC)
2 (↑) – relax, relax
- R2 to R3 - R3 to R4
- Weaker than expected economic conditions - Shortfall in government revenue - Pressure on security expenditures
Latvia: fiscal deficit target (QPC) 3 ( 1↑, 2 ↓) – relax, tighten, tighten
- R0 to R1 - R1 to R2 - R3 to R4
- 1st rev: growth projected to drop much more - 2nd rev: desire to comply with Maastricht treaty criteria - 3rd rev: economy stabilized, with fiscal balance showing some improvement
Belarus: ceiling on cash deficit of republican government (QPC)
4 (1 ↓ and 3 ↑) – tighten, relax, relax, relax
- R0 to R1 - R1 to R2 - R2 to R3 - R3 to R4
- 1st rev: revised macroeconomic framework and inclusion of local government budgets (running surpluses in 2008) and Social Protection Fund (balanced) in deficit measure
- 2nd rev: adjustment for pre-program projects and for cash deficit of local governments - 3rd rev: upward adjustment in response to macro revision - 4th rev: measures to offset oil price decrease, deviations in external budget and post-
program project support
Serbia: ceiling on consolidated general government overall deficit
1 (↑) – relax - R3 to R4 - Revenue shortfall
El Salvador: Floor on the overall balance of the nonfinancial public sector (QPC)
1 (↑) – tighten - R2 to R3 - Adjusted upward for 50 percent of revenue over-performance

45
Armenia: Floor on overall fiscal balance on a cash basis (QPC)
3 (2 ↓ and 1 ↑) – relax, relax, tighten
- R0 to R1 - R1 to R2 - R2 to R3
- 1st rev: downward revision to maintain spending as revenue fell - 2nd rev: Revised macro framework - 3rd rev: improved outlook and need to rein-in deficit
Mongolia: ceiling on general government fiscal deficit (QPC)
3 (↑) – relax, relax, relax
- R1 to R2 - R2 to R3 - R3 to R4
- 1st rev: economic recovery somewhat slower than foreseen - 2nd rev: boosting construction by providing subsidized mortgages to civil servants;
financing to fund increase in universal social transfers - 3rd rev: no reasons provided (possibly to offset increase in universal transfers)
Costa Rica: floor on cash balance of central government (QPC)
1 (↓) – relax - R0 to R1 - To acknowledge lower than expected fiscal revenue
Guatemala: overall balance of central government (QPC)
2 (↑) – relax, relax
- R0 to R1 - R1 to R2
- 1st rev: counter-cyclical policy and sharper-than-planned drop in revenue - 2nd rev: upward revision to provide room for front-loaded spending in 2010
Romania: floor on overall general government balance (QPC)
2 (↓) – relax, relax
- R0 to R1 - R2/R3 to R4
- Significant deterioration of economy - Shortfall in revenue
Sri Lanka: ceiling on net domestic financing of central government (QPC)
3 (↑) – relax, relax, relax
- R0 to R1 - R1 to R2 - R6 to R7
- 1st rev: faster than anticipated execution of donor-financed projects - 2nd rev: tax reform delay due to war reconstruction and elections - 3rd rev: higher spending on externally financed capital projects
Dominican Republic: floor on overall balance of central administration (QPC)
1 (↓) – tighten - R0 to R1 - To signal commitment to program
Maldives: ceiling on total financing of central government budget deficit (QPC)
1 (↓) – tighten - R0 to R1 - Economic developments better than expected
Jamaica: floor on primary balance of central administration (QPC)
2 (↓) – relax, relax
- R0 to R1 - R2 to R3
- 1st rev: lower than expected withholding income tax receipts - 2nd rev: mounting spending pressures and delays in fiscal reform programs
Iraq: ceiling on central government fiscal deficit (QPC)
1 (↑) – relax - R1 t oR2 - To accommodate increase in investment in public services, oil infrastructure, additional social safety net, and security outlays
Antigua and Barbuda: ceiling on central government overall deficit including grants (QPC)
4 (4↑) – relax, relax, relax, relax
- R0 to R1 - R1 to R2R3 - R2/R3 to R4/R5/R6 - R7 to R8/R9
- 1st rev: lower-than-expected disbursement of grants - 2nd rev: upward revision to reflect grant shortfall - 3rd rev: upward revision to include bank recapitalization - 4th rev: upward revision to reflect a shortfall in grants
St. Kitts and Nevis: floor on central government overall balance (QPC)
3 (↓,↑↑) – relax, tighten, tighten
- R0 to R1 - R3 to R4
- 1st rev: external debt service payments made by central government on behalf of public enterprises included in current transfers
- 2nd & 3rd rev: fiscal balance exceeded program targets; improved tourism and construction activities

46
ANNEX 2. TECHNICAL NOTE ON STATISTICAL ANALYSES
This annex describes the statistical and econometric procedures whose results are referred to in the main text. Sections A and B discuss the procedures used to estimate the differences between post-crisis SBAs and their pre-crisis peers in terms of key macroeconomic variables and access size, respectively.1 Section C, focusing on our sample of 25 post-crisis SBA-supported programs, identifies the determinants of frontloading and structural conditionality.
A. Post-Crisis vs. Pre-Crisis SBAs in Terms of Key Macroeconomic Variables
This section examines the question of how the behavior of three key macroeconomic variables might be different between post-crisis and pre-crisis SBAs: real GDP growth (in percent change), nominal exchange rate depreciation (in percent change), and current account balance adjustment (in percent of GDP). For this purpose, we use a panel dataset consisting of annual time series from 1989 2013 of 113 countries that had IMF-supported programs between 1997 and 2013—covering 308 programs (see Appendix 1 for the list of countries with their arrangements). In what follows, we denote each of the three variables of interest for county i at year t by . To minimize the effect of extreme values on the results, influential observations (i.e., outliers) of were excluded from the sample (see Appendix 2 for the methodology of identifying outliers).
First stage regressions
To allow fair before-after comparisons using , it would be important first to isolate the effects of external factors not associated with IMF-supported programs. This was done by estimating the following fixed effect panel regression:
γK , (1)
where is a cross-country, time-invariant common factor, (scalar) is a country-specific parameter, K is a matrix of control variables included to capture the effects of external factors; γ is the vector of associated parameters, and represents an error term. The control variables used in equation (1) are the annual rate of GDP growth in globally important economies (OECD countries and China), US short-term interest rates, US CPI inflation,
1 The “start” of the 2008 global financial crisis was arbitrarily defined as the collapse of Lehman Brothers in September 2008. The sample includes all countries that had IMF financing arrangements at any time during 1989 2013, with a country that had an IMF-supported program for any part of a year is considered to be a program country for that year.

47
annual percent changes in oil and other commodity prices, and a measure of global market risk proxied by market volatility.2,3
The results from estimating equation (1) for each of the three variables are reported in Tables A2.1 3. In all cases, the regressors that were not found to be statistically significant at the 5 percent level were removed from the final specification.
Table A2.1. Estimation of Equation (1) – Real GDP Growth
Dependent Variable: Real GDP Growth (% per year) Method: Panel Least Squares Sample: 1989 2013, excluding outliers Periods included: 25 Cross-sections included: 113 Total panel (unbalanced) observations: 2560 Cross-section weights standard errors & covariance
Variable Coefficient Std. Error t-Statistic Prob.
Constant 2.2523 0.3516 6.4054 0.0000 GROWTHOECD 0.3287 0.0618 5.3205 0.0000 GROWTHCHINA 0.1112 0.0316 3.5173 0.0004 U.S. INT. RATES -0.1641 0.0482 -3.4072 0.0007 ∆% COMM. PRICES 0.0288 0.0094 3.0470 0.0023
Effects Specification
Cross-section fixed (dummy variables)
R-squared 0.2175 Mean dependent var 4.0505 Adjusted R-squared 0.1803 S.D. dependent var 3.7272 S.E. of regression 3.3745 Akaike info criterion 5.3150 Sum squared resid 27818.77 Schwarz criterion 5.5822 Log likelihood -6686.18 Hannan-Quinn criterion 5.4119 F-statistic 5.8525 Durbin-Watson stat 1.4283 Prob (F-statistic) 0.0000
Source: Authors' calculations using data from WEO.
For GDP growth, Table A2.1 shows that global growth and commodity price increases have positive impact, while US interest rates have the opposite effect. For exchange rate depreciation, Table A2.2 shows that it is positively associated with global economic growth, US interest rates, market volatility, and a fall in oil and other commodity prices. Finally, as to current account balance adjustment, Table A2.3 suggests that it is positively associated with US interest rates but negatively associated with global growth and US inflation.
2 We use the VIX index of the implied volatility of S&P 500 index options, published by the Chicago Board Options Exchange. Because the VIX is strongly correlated with US interest rates, the residuals from a least squares regression of the VIX on US interest rates are used as a control variable in equation (1).
3 Short-term interest rates refer to deposit or Treasury bill rates. The changes in oil and other commodity prices are obtained from indices constructed by IMF staff. The sources of all these variables are the WEO database.

48
Table A2.2. Estimation of Equation (1) – Nominal Exchange Rate Depreciation
Dependent Variable: Nominal Exchange Rate (% change) Method: Panel Least Squares Sample: 1989 2013, excluding outliers Periods included: 24 Cross-sections included: 113 Total panel (unbalanced) observations: 2466 Cross-section weights standard errors & covariance
Variable Coefficient Std. Error t-Statistic Prob.
Constant -0.9176 1.8160 -0.5053 0.6134 GROWTHOECD 0.4479 0.1754 2.5529 0.0107 U.S. INT. RATES 0.6928 0.1301 5.3238 0.0000 ∆% COMM. PRICES -0.2219 0.0219 -10.1250 0.0000 ∆% OIL PRICES -0.0298 0.0105 -2.8288 0.0047 VIXHAT 0.1381 0.0545 2.5361 0.0113 FIX -1.0363 0.5313 -1.9503 0.0513
Effects Specification
Cross-section fixed (dummy variables)
R-squared 0.2935 Mean dependent var 3.5631 Adjusted R-squared 0.2580 S.D. dependent var 10.1170 S.E. of regression 8.7149 Akaike info criterion 7.2150 Sum squared resid 178252.29 Schwarz criterion 7.4954 Log likelihood -8777.09 Hannan-Quinn criterion 7.3169 F-statistic 8.2627 Durbin-Watson stat 1.3476 Prob (F-statistic) 0.0000
Source: Authors' calculations using data from WEO.
Table A2.3. Estimation of Equation (1) – Change in Current Account Balances
Dependent Variable: Change in Current Account Balance (% GDP) Method: Panel Least Squares Sample: 1989 2013, excluding outliers Periods included: 24 Cross-sections included: 113 Total panel (unbalanced) observations: 2443 Cross-section weights standard errors & covariance
Variable Coefficient Std. Error t-Statistic Prob.
Constant 1.8368 0.3942 4.6599 0.0000 GROWTHOECD -0.1436 0.0627 -2.2887 0.0222 GROWTHCHINA -0.0831 0.0334 -2.4900 0.0128 U.S. INT. RATES 0.1517 0.0457 3.3160 0.0009 U.S. CPI INFLATION -0.2992 0.0826 -3.6231 0.0003
Effects Specification
Cross-section fixed (dummy variables)
R-squared 0.0399 Mean dependent var -0.0149 Adjusted R-squared -0.0080 S.D. dependent var 3.8153 S.E. of regression 3.8304 Akaike info criterion 5.5705 Sum squared resid 34127.61 Schwarz criterion 5.8484 Log likelihood -6687.42 Hannan-Quinn criterion 5.6715 F-statistic 0.8334 Durbin-Watson stat 2.1582 Prob (F-statistic) 0.8991
Source: Authors' calculations using data from WEO.

49
Using the estimated coefficient, , and residuals, , from equation (1), the transformed variable is constructed to represent an estimate of the level of that is orthogonal to the set of control variables. We refer to the set of as the adjusted data, from which the effects of external factors not associated with IMF-supported programs are removed. The cross-country averages for the three variables, using both the raw and adjusted data, are shown in Figures A2.1 A2.3.
Figure A2.1. Cross-Country Average Real GDP Growth (Percent per year)
Source: Authors’ calculations using the results in Table A2.1.
Figure A2.2. Cross-Country Average Nominal Exchange Rate Depreciation
(Percent per year)
Source: Authors’ calculations using the results in Table A2.2.
0
1
2
3
4
5
6
7
Raw Adjusted
-8
-6
-4
-2
0
2
4
6
8
10
12
Raw Adjusted

50
Figure A2.3. Cross-Country Average Current Account Adjustment
(Percent GDP)
Source: Authors’ calculations using the results in Table A2.3
Before-after comparisons
Next, after restricting the sample to 1997 2013—to avoid excessively biasing the “before” results towards programs in a more distant past—the following regressions of , on period dummy variables are estimated:
, (2)
, (3)
where the dummy variables take the value of one between years t0 and T, and zero otherwise, while the associated coefficients s indicate the cross-country average for the same period.
Equation (2) is used to compare the average of , between two subsamples—January 1997 to August 2008 and September 2008 to December 2013 (before and after the collapse of Lehman Brothers). Equation (3), on the other hand, splits the sample in four periods:
January 1997 December 1999, roughly corresponding to the 1997 Asian crisis period;
January 2000 August 2009, a period of relative stability in the global economy;
September 2008 December 2010, the first two years of the 2008 global financial crisis; and
January 2011 December 2013.
-3-2-2-1-10112233
Raw Adjusted

51
Table A2.4 reports the results from estimating equations (2) and (3) for each of the three variables—using both the raw and the “cleaned” data obtained from the first stage regression (1). In both upper and lower portions of the table, the second and third rows (shaded gray) correspond to the results for equation (2) and the fourth to seventh rows (shaded green) to equation (3). Wald tests are used to assess whether the coefficients (the means for the different periods) are significantly different. The first sub-periods are used as the reference (in bold black). The sub-period averages that are statistically different (at the 10 percent significance level) from the average for the reference period are reported in blue or red, depending on whether they are higher or lower, respectively.
Table A2.4. Selected Macroeconomic Variables—Before-after Comparisons
Raw Data
GDP Growth (Percent per year)
Exchange Rate (Percent change)
Current Account Balances (Change, percent GDP)
Full Sample
Program Years Non-Program
Years Full
Sample
Program Years Non-Program
Years Full
Sample
Program Years Non-Program
Years All SBA Non- SBA All SBA
Non-SBA All SBA
Non-SBA
1997–2013 4.3 4.3 3.3 4.7 4.3 2.7 3.0 2.9 3.0 2.5 0.0 0.0 0.0 0.0 -0.3
1997–Aug 2008 4.6 4.8 4.1 5.0 4.4 2.5 2.49 2.3 2.6 2.5 -0.3 0.0 0.0 0.0 -0.4
Sep 2008–13 3.7 3.2 1.6 3.9 4.0 3.2 4.07 4.2 4.0 2.3 0.4 0.8 1.1 0.7 0.1
1997–99 3.8 3.5 2.2 4.1 3.9 8.5 8.93 8.6 9.1 8.3 0.0 0.0 0.0 0.0 0.0
2000-Aug 2008 4.8 5.0 4.6 5.2 4.6 0.7 1.37 0.9 1.5 0.0 -0.4 0.0 0.0 -0.4 -0.6
Sep 2008–10 3.0 2.8 0.8 3.8 3.2 5.0 6.29 7.3 5.8 3.3 1.1 1.6 2.5 1.1 0.0
2011–13 4.1 3.6 2.5 4.0 4.5 1.9 2.06 0.7 2.6 1.8 0.0 0.0 0.0 0.0 0.0
# observations 1845 831 243 588 1014 1866 842 246 596 1024 1785 805 239 566 980
Cleaned Data
GDP Growth (Percent per year)
Exchange Rate (Percent change)
Current Account Balances (Change, percent GDP)
Full Sample
Program Years Non-Program
Years Full
Sample
Program Years Non-Program
Years Full
Sample
Program Years Non-Program
Years All SBA Non-SBA All SBA
Non-SBA All SBA
Non-SBA
1997–2013 2.4 2.4 1.8 2.7 2.4 -0.4 -0.5 0.0 -0.6 -0.4 1.7 1.9 2.2 1.8 1.5
1997–Aug 2008 2.6 2.7 2.5 2.7 2.5 -1.1 -1.5 -1.2 -1.6 -0.8 1.6 1.7 2.0 1.7 1.4
Sep 2008–13 2.0 1.8 0.3 2.5 2.2 1.1 1.66 1.9 1.6 0.6 2.0 2.4 2.7 2.2 1.7
1997-1999 2.5 2.3 1.2 2.9 2.5 0.4 0.56 1.4 0.1 0.0 1.5 1.8 1.5 1.9 1.3
2000–Aug 2008 2.6 2.7 2.7 2.7 2.6 -1.5 -1.8 -1.8 -1.8 -1.2 1.6 1.7 2.1 1.6 1.5
Sep 2008–10 1.7 1.6 -0.4 2.7 1.7 2.6 3.16 4.2 2.6 1.9 2.2 2.7 3.5 2.2 1.7
2011–13 2.3 2.0 0.9 2.4 2.4 0.1 0.31 -0.7 0.7 -0.1 1.8 2.1 1.9 2.2 1.6
# observations 1845 831 243 588 1014 1866 842 246 596 1024 1785 805 239 566 980
Source: Authors’ calculations.
Note: Bold blue and bold red indicate statistically higher and lower values relative to reference point (bold black), respectively.
Table A2.4 suggests the following conclusions:
Real GDP growth
Overall average real GDP growth was about 0.9 percentage points lower in the post-September 2008 period. When the data are disaggregated, however, SBA countries appear to have experienced a more substantial decline in growth (of as much as 2.5 percent); in non-program cases, no statistical difference was found between the two periods. These conclusions are robust to the adjustment of the data to account for the effect of exogenous, external factors.

52
When comparison is made using the 1997Asian crisis period as the reference point, a more nuanced picture emerges. Broadly, little statistical difference was found between the 1997 99 period and post-2008 period when the raw data are used. When the adjusted data are used, on the other hand, average growth rates are statistically lower during the 2008 10 period in both SBAs and their non-program peers.
Nominal exchange rate depreciation
Table A2.4 indicates that exchange rate depreciation was greater in the post-crisis period among non-SBA program countries. For SBA countries, no statistical difference was found using either raw or adjusted data.
Comparison of exchange rate depreciation between the recent crisis period and the Asian crisis period is generally sensitive to the adjustment of the data to exclude the effects of exogenous factors, but not with respect to SBA countries. For the most part, SBA countries experienced similar exchange rate depreciation during the first two years after the 2008 financial crisis. During 2011–13, however, SBA countries experienced smaller depreciation than their counterparts during 1997–99.
Current account balance adjustment
Table A2.4 seems to suggest that current account adjustment was greater in the post-September 2008 period, regardless of whether the raw or adjusted data were used. The same conclusion holds when comparing programs approved during 2008–10 with those approved during 1997–99.
B. Post-Crisis vs. Pre-Crisis SBAs in Terms of Access Size
This section organizes the data around 308 cross-sections, each representing a single IMF-supported program approved between 1997 and 2013. The following regression was estimated after outliers in the control variables are removed:
θK 0 , (4) where is the size of access provided by the IMF at the start of program j (as percent of
GDP); K 0 is a matrix of control variables measured at the beginning of the program—
either the year that the program started (T0)4 or the year before (T0-1)—to capture the effect
of factors that could have influenced the amount of financing for program j; and (scalars)
4 The date for the “start” of a program was adjusted backwards to take account of the length of program discussion. If the program was approved during the first three months of a year, the previous year is taken as the start date.

53
and θ (vector) are coefficients; is an error term. The control variables used in the
estimation of (7) are5:
CURBAL: current account balance (percent of GDP);
GROWTH: real GDP growth (annual percentage change);
Δ RES (% GDP): change in official international reserves (percent of GDP);
EXTDEBT: external debt (percent of GDP);
FBAL: fiscal balance (percent of GDP).6
The results from estimating equation (4) using the control variables measured both at T0 and T0-1 are reported in Tables A2.5 A2.6. The results when restricting the sample to only SBA-supported programs are shown in Tables A2.7 A2.8.
A positive estimate of provides a measure of the additional financing associated with arrangements approved after September 2008 relative to those approved before that date. Considering all types of IMF lending arrangements, Tables A2.5 A2.6 suggest that post-2008 arrangements typically committed more resources—by about 1 percent of GDP—compared with earlier ones. Of these, SBAs in the post-crisis period entailed additional financing amounting to 3.2 percent or 3.6 percent of GDP, depending on whether T0 or T0-1 was used for the control variables (Tables A2.7 A2.8).
5 Data come from the WEO database, except for those on official reserves which come from the International Financial Statistics database.
6 Data on fiscal balances for the consolidated government sector are typically not available for many of the countries in the sample. In these cases, central government net lending/borrowing was used as a proxy.

54
Table A2.5. Access Size of IMF Lending Arrangements – Before and After Sep 2008 (I)
Dependent Variable: Fin = Commitment Amount (% GDP) Method: Least Squares Sample: IMF programs in 1997–2013, excluding outliers Included observations: 159 IMF programs
White heteroskedasticity-consistent standard errors & covariance
Variable Coefficient Std. Error t-Statistic Prob.
Constant 0.6590 0.6772 0.9732 0.3320 CURBAL -0.1725 0.0733 -2.3520 0.0200 GROWTH -0.1835 0.0786 -2.3356 0.0208 ∆ RES (% GDP) -0.0193 0.1139 -0.1698 0.8654 EXTDEBT 0.0285 0.0068 4.2119 0.0000 FBAL (% GDP) -0.1534 0.0658 -2.3335 0.0209 DSep08 – 2013 1.1408 0.4196 2.7185 0.0073 R-squared 0.3540 Mean dependent var 2.6472 Adjusted R-squared 0.3285 S.D. dependent var 2.9427 S.E. of regression 2.4114 Akaike info criterion 4.6413 Sum squared resid 883.824 Schwarz criterion 4.7764 Log likelihood -361.982 Hannan-Quinn criter. 4.6961 F-statistic 13.8839 Durbin-Watson stat 1.8571 Prob (F-statistic) 0.0000
Source: Authors' calculations.
Table A2.6. Access Size of IMF Lending Arrangements – Before and After Sep 2008 (II)
Dependent Variable: Fin = Commitment Amount (% GDP) Method: Least Squares Sample: IMF programs in 1997–2013, excluding outliers Included observations: 159 IMF programs White heteroskedasticity-consistent standard errors & covariance
Variable Coefficient Std. Error t-Statistic Prob.
Constant 0.6475 0.5834 1.1098 0.2688 CURBAL (-1) 0.0105 0.0739 0.1421 0.8872 GROWTH (-1) -0.1505 0.0579 -2.5983 0.0103 ∆ RES(-1) (% GDP) -0.1041 0.0686 -1.5177 0.1312 EXTDEBT (-1) 0.0278 0.0067 4.1512 0.0001 FBAL(-1) (% GDP) -0.1124 0.0626 -1.7963 0.0744 DSep08 – 2013 1.1798 0.3834 3.0773 0.0025 R-squared 0.3307 Mean dependent var 2.5540 Adjusted R-squared 0.3042 S.D. dependent var 2.5677 S.E. of regression 2.1417 Akaike info criterion 4.4041 Sum squared resid 697.230 Schwarz criterion 4.5392 Log likelihood -343.129 Hannan-Quinn criter. 4.4590 F-statistic 12.5151 Durbin-Watson stat 1.7684 Prob (F-statistic) 0.0000
Source: Authors' calculations.

55
Table A2.7. Access Size of IMF Stand-By Arrangements – Before and After Sep 2008 (I)
Dependent Variable: Fin = Commitment Amount (% GDP) Method: Least Squares Sample: IMF programs in 1997–2013, excluding outliers Included observations: 48 SBA programs White heteroskedasticity-consistent standard errors & covariance
Variable Coefficient Std. Error t-Statistic Prob.
Constant -0.9074 1.3259 -0.6844 0.4976 CURBAL -0.2618 0.1298 -2.0169 0.0503 GROWTH -0.0248 0.2182 -0.1135 0.9102 ∆ RES (% GDP) 0.1932 0.2718 0.7110 0.4811 EXTDEBT 0.0580 0.0253 2.2964 0.0268 FBAL (% GDP) 0.0007 0.1850 0.0038 0.9970 DSep08 – 2013 3.2739 1.0145 3.2269 0.0025 R-squared 0.3594 Mean dependent var 2.9746 Adjusted R-squared 0.2657 S.D. dependent var 3.6276 S.E. of regression 3.1086 Akaike info criterion 5.2402 Sum squared resid 396.188 Schwarz criterion 5.5131 Log likelihood -118.766 Hannan-Quinn criter. 5.3434 F-statistic 3.8344 Durbin-Watson stat 2.2658 Prob (F-statistic) 0.0040
Source: Authors' calculations.
Table A2.8. Access Size of IMF Stand-By Arrangements – Before and After Sep 2008 (II)
Dependent Variable: Fin = Commitment Amount (% GDP) Method: Least Squares Sample: IMF programs in 1997–2013, excluding outliers Included observations: 52 SBA programs White heteroskedasticity-consistent standard errors & covariance
Variable Coefficient Std. Error t-Statistic Prob.
Constant -0.9157 1.2865 -0.7118 0.4803 CURBAL (-1) -0.2225 0.1168 -1.9055 0.0631 GROWTH (-1) 0.1437 0.1306 1.1005 0.2770 ∆ RES(-1) (% GDP) -0.1421 0.1175 -1.2093 0.2329 EXTDEBT (-1) 0.0371 0.0169 2.1910 0.0337 FBAL(-1) (% GDP) -0.1204 0.1272 -0.9470 0.3487 DSep08 – 2013 3.6083 0.8164 4.4199 0.0001 R-squared 0.5051 Mean dependent var 2.8589 Adjusted R-squared 0.4391 S.D. dependent var 2.9441 S.E. of regression 2.2049 Akaike info criterion 4.5439 Sum squared resid 218.765 Schwarz criterion 4.8065 Log likelihood -111.140 Hannan-Quinn criter. 4.6446 F-statistic 7.6547 Durbin-Watson stat 1.6134 Prob (F-statistic) 0.0000 7.0794
Source: Authors' calculations.
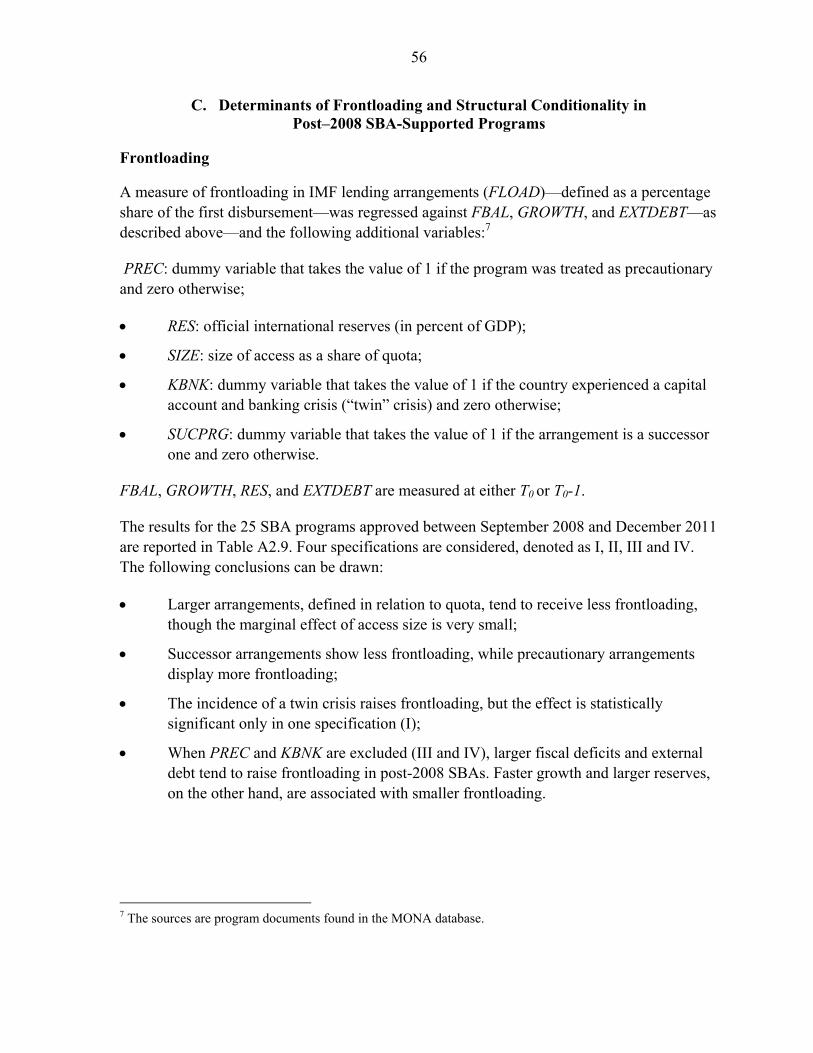
56
C. Determinants of Frontloading and Structural Conditionality in Post–2008 SBA-Supported Programs
Frontloading
A measure of frontloading in IMF lending arrangements (FLOAD)—defined as a percentage share of the first disbursement—was regressed against FBAL, GROWTH, and EXTDEBT—as described above—and the following additional variables:7
PREC: dummy variable that takes the value of 1 if the program was treated as precautionary and zero otherwise;
RES: official international reserves (in percent of GDP);
SIZE: size of access as a share of quota;
KBNK: dummy variable that takes the value of 1 if the country experienced a capital account and banking crisis (“twin” crisis) and zero otherwise;
SUCPRG: dummy variable that takes the value of 1 if the arrangement is a successor one and zero otherwise.
FBAL, GROWTH, RES, and EXTDEBT are measured at either T0 or T0-1.
The results for the 25 SBA programs approved between September 2008 and December 2011 are reported in Table A2.9. Four specifications are considered, denoted as I, II, III and IV. The following conclusions can be drawn:
Larger arrangements, defined in relation to quota, tend to receive less frontloading, though the marginal effect of access size is very small;
Successor arrangements show less frontloading, while precautionary arrangements display more frontloading;
The incidence of a twin crisis raises frontloading, but the effect is statistically significant only in one specification (I);
When PREC and KBNK are excluded (III and IV), larger fiscal deficits and external debt tend to raise frontloading in post-2008 SBAs. Faster growth and larger reserves, on the other hand, are associated with smaller frontloading.
7 The sources are program documents found in the MONA database.

57
Table A2.9. Determinants of Frontloading in Post-Crisis SBAs
Dependent variable: FLOAD Method: Least Squares Included observations: 25 SBA programs White heteroskedasticity-consistent standard errors & covariance
Variable (I) (II) (III) (IV)
Constant 40.31*** 44.80*** 69.01*** 72.69 *** FBAL(T0) 0.87 2.02*** GROWTH(T0) 0.11 -0.66 RES(T0) -0.82 -1.35*** EXTDEBT(T0) 0.37 0.55*** SIZE -0.03 -0.03*** -0.05*** -0.03 *** SUCPRG -22.41*** -30.36*** -19.27*** -36.20 ** PREC 24.90*** 23.70*** KBNK 10.99** 9.25 FBAL(T0-1) 0.91 2.08 *** GROWTH(T0-1) -0.62 -1.45 *** RES(T0-1) -0.83* -1.16 ** EXTDEBT(T0-1) 0.29* 0.32 * R-Squared 0.82 0.84 0.56 0.62
Note: (***), (**), and (*) indicate statistical significance at 1, 5, and 10 percent, respectively.
Source: Authors’ calculations.
Structural conditionality
A measure of the intensity of structural conditionality (STRUCOND)—defined as the sum of prior actions (PAs), structural performance criteria (SPCs) and structural benchmarks (SBs)— was regressed on PREC, GROWTH, KBNK, and FLOAD—defined as above—and the following additional variables:
COMM: amount committed (in billions of SDRs);
DUR: duration of the program (in months); and
NEG: duration of program negotiations (in weeks);
The results for the 25 SBA programs are reported in Table A2.10.

58
Table A2.10. Determinants of Structural Conditionality in Post-Crisis SBAs
Dependent Variable: STRUCOND Method: Least Squares Included observations: 25 SBA-supported programs White heteroskedasticity-consistent standard errors & covariance
Variable Coefficient Std. Error t-Statistic Prob.
Constant 7.1814 21.4436 0.3300 0.0615 KBNK -1.0545 5.1538 -0.2000 0.8400 PREC -26.3646 8.6482 -3.0500 0.0070 GROWTH (t-1) -0.0021 0.7616 0.0000 0.9980 COMM 0.6472 0.6963 0.9300 0.3660 FLOAD 0.3904 0.1835 2.1300 0.0480 DUR -0.0187 0.5233 -0.0400 0.9720 NEG 0.5317 0.3057 1.7400 0.1000
R-squared 0.4435 F-statistic 5.8500 Prob(F-statistic) 0.0014
Source: Authors' calculations.
PREC has a strong negative and statistically significant impact on the number of structural conditions, as do FLOAD and NEG. Other variables do not seem to have statistically significant impact on structural conditionality.

59
APPENDIX 1 TO ANNEX 2. LIST OF COUNTRIES AND ARRANGEMENTS
Country Arrangement Date Country Arrangement Date
Afghanistan 2006b, 2011b Lao People Dem. Rep. 2001b
Albania 1998b, 2002b, 2006a Latvia 1997c, 1999c, 2001c, 2008c
Angola 2009c Lesotho 2001b, 2010b
Antigua and Barbuda 2010c Liberia 2008b, 2012a
Argentina 1998a, 2000c, 2003c, 2003c Lithuania 2000c, 2001c
Armenia 2001b, 2005b, 2008b, 2009c, 2010b Macedonia, FYR 1997b, 2000a, 2003c, 2005c, 2011a
Azerbaijan 2001b Madagascar 2001b, 2006b
Bangladesh 2003b, 2012b Malawi 2000b, 2005b, 2008b, 2010b, 2012b
Belarus 2009c Maldives 2009b, 2009c
Benin 2000b, 2005b, 2010b Mali 1999b, 2004b, 2008b, 2011b, 2013b
Bolivia 1998b, 2003c Mauritania 1999b, 2003b, 2006b, 2010b
Bosnia and Herzegovina 1998c, 2002c, 2009c, 2012c Mexico
1999c, 2009a, 2010a, 2011a, 2012a
Brazil 1998c, 2001c, 2002c Moldova 2000b, 2006b, 2010a
Bulgaria 1997c, 1998a, 2002c, 2004c Mongolia 1997b, 2001b, 2009c
Burkina Faso 1999b, 2003b, 2007b, 2010b, 2013b Morocco 2012a
Burundi 2004b, 2008b, 2012b Mozambique 1999b, 2004b, 2009b
Cambodia 1999b Nepal 2003b
Cameroon 1997b, 2000b, 2005b Nicaragua 1998b, 2002b, 2007b
Cape Verde 1998c, 2002b Niger 2000b, 2005b, 2008b, 2012b
Central African Republic 1998b, 2006b, 2012b Nigeria 2000c
Chad 2000b, 2005b Pakistan 1997a, 1997b, 2000c, 2001b, 2008c, 2013c
Colombia 1999a, 2003c, 2005c, 2009a, 2010a, 2011a, 2013a Panama 1997a, 2000c
Comoros 2008b, 2009b Papua New Guinea 2000c
Congo, Dem. Rep. of 2002b, 2009b, 2009b Paraguay 2003c, 2006c
Congo, Republic of 2004b, 2008b Peru 1999a, 2001c, 2002c, 2004c, 2007c
Costa Rica 2009c Philippines 1998c
Cote d'Ivoire 1998b, 2002b, 2009b, 2011b Poland 2009a, 2010a, 2011a, 2013a
Croatia 1997a, 2001c, 2003c, 2004c Portugal 2011a
Cyprus 2013a Romania 1997c, 1999c, 2001c, 2004c, 2009c, 2011c, 2013c
Djibouti 1999b, 2008b Russian Federation 1999c
Dominica 2002c, 2003b Rwanda 1998b, 2002b, 2006b

60
Country Arrangement Date Country Arrangement Date
Dominican Republic 2003c, 2005c, 2009c Sao Tome & Principe 2000b, 2005b, 2009b, 2012b
Ecuador 2000c, 2003c Senegal 1998b, 2003b, 2008b
El Salvador 1997c, 1998c, 2009c, 2010c Serbia & Montenegro (Serbia) 2009c, 2011c, 2001c, 2002a
Estonia 1997c, 2000c Seychelles 2008c, 2009a
Ethiopia 2001b, 2009b, 2009b Sierra Leone 2001b, 2006b, 2010b, 2013b
Gabon 2000c, 2004c, 2007c Solomon Islands 2010b, 2011b, 2012b
Gambia, The 1998b, 2002b, 2007b, 2012b Sri Lanka 2001c, 2003a, 2009c
Georgia 2001b, 2004b, 2008c, 2012b St. Kitts and Nevis 2011c
Ghana 1999b, 2003b, 2009b St. Vincent and the Grenadines 2009b
Greece 2010c, 2012a Tajikistan 1998b, 2002b, 2009b
Grenada 2006b, 2010b Tanzania 2000b, 2003b, 2009b, 2012b
Guatemala 2002c, 2003c, 2009c Thailand 1997c
Guinea 1997b, 2001b, 2007b, 2012b Togo 2008b
Guinea-Bissau 2000b, 2010b Tunisia 2013c
Guyana 1998b, 2002b Turkey 1999c, 2002c, 2005c
Haiti 2006b, 2010b Uganda 1997b, 2002b
Honduras 1999b, 2004b, 2008c, 2010b Ukraine 1997c, 1998a, 2004c, 2008c, 2010c
Hungary 2008c Uruguay 1997c, 1999c, 2000c, 2002c, 2005c
Iceland 2008c Vietnam 2001b
Indonesia 1997c, 1998a, 2000a Yemen, Republic Of 1997b, 2010b
Iraq 2005c, 2007c, 2010c Zambia 1999b, 2004b, 2008b
Ireland 2010a Zimbabwe 1998c, 1999c
Jamaica 2010c, 2013a
Jordan 1999a, 2002c, 2012c
Kazakhstan 1999a
Kenya 2000b, 2003b, 2009b, 2011b
Korea 1997c
Kosovo 2010c, 2012c
Kyrgyz Republic 1998b, 2001b, 2005b, 2008b, 2011b
Notes: a = GRA (Non-SBA); b = PRGF/PRGT; c = SBA
Source: IMF MONA database.

61
APPENDIX 2 TO ANNEX 2. METHODOLOGY TO IDENTIFY OUTLIERS
This appendix to Annex 2 describes the methodology used to identify outliers. First, the following panel regression is estimated:
, (A1)
where is a constant and is an error term.
Next, based on the results from estimating equation (A1), five different “influence statistics”— which are measures of the difference that a single observation makes to the regression—were computed. More specifically:
1) The leverage value, , is the corresponding diagonal element of the “hat matrix” (or projection matrix), which maps the vector of observed values to the vector of fitted values.55 Absolute values of larger than 2 , ⁄ where is the number of observations, indicate the presence of outliers.
2) The “studentized residual,” which is the estimated residual at observation it divided by an estimate of its standard deviation:
1, (A2)
where is the original residual from equation (A1) for observation it, is the variance of the residuals that would have resulted had that observation not been included in the estimation, and is the leverage value. Absolute values of that are larger than 3 indicate outliers.56
3) The scaled studentized residual, where the scaling is done by dividing the difference by an estimate of the standard deviation of the regression fit:
1
/
. (A3)
Outliers are observations for which the absolute values of are larger than 2 1⁄ / .
55 In a regression of the type Y=XB+Σ —where Y is a ×1 vector containing n observations of the dependent variable, X is a × matrix of regressors (including a constant term), B is a ×1vector of coefficients, and Σ
is a ×1vector of regression errors—the vector of fitted values is given by Y=HY, where H=X (X'X)-1X' is the hat matrix.
56 The residual is numerically identical to the t-statistic that would result from including in the original equation a dummy variable that is equal to 1 on that particular observation and zero elsewhere. It can therefore be interpreted as a test for the significance of that observation.

62
4) The ratio of the determinant of the covariance matrix of the coefficients from the original equation to the determinant of the covariance matrix from an equation without that observation. This statistic measures the impact of each observation on the variances (and standard errors) of the regression coefficients and their covariance coefficients. Values lower than 1 3⁄ or greater than 1 3⁄ are considered associated with outliers.
5) The scaled difference in the estimated coefficients between the original equation and an equation estimated without that observation:
, (A4)
where is the estimated constant in equation (A1), is that coefficient’s estimate without observation it and is the variance of . This measure assesses how much an
observation has affected the estimated coefficient. Values that are larger than 2 √ ⁄ are considered associated with outliers.
Any observation that satisfies at least one of the five criteria described above was excluded from the relevant sample.
Related Documents