Connect with Vanguard > vanguard.com Executive summary. Within the investment community, a small (but vocal) segment has criticized the use of indexes constructed according to the traditional method of market-capitalization weighting, on the grounds that such indexes systematically overweight overvalued or “mispriced” stocks. Some critics have suggested that investors should abandon market-cap-weighted indexes in favor of alternative equity benchmarks that, for instance, weight individual stocks equally, or according to dividends, company fundamentals, or statistical properties. 1 This paper’s analysis supports market-cap-weighted indexes over these alternative equity benchmarks, both for their theoretical basis and their practicality. We first demonstrate the significance of the inherent bets for or against individual securities advocated by each alternative weighting methodology. We then show that after accounting for size and style exposures, these Vanguard research November 2011 1 This paper addresses equal-weighted, dividend-weighted, and fundamentally weighted indexes. There are, of course, other methodologies—including weighting a portfolio according to trailing volatility, correlations, or other statistical measures— which we expect to examine in a subsequent analysis. Our discussion here, however, makes clear that any strategy that reweights an existing market-cap-weighted index shifts risk exposure away from market beta and is synonymous with active risk. This is substantiated by industry research, which shows that low-volatility strategies demonstrate factor tilts similar to the other alternative strategies that we examine (Clarke, de Silva, and Thorley, 2006). A review of alternative approaches to equity indexing Authors Christopher B. Philips, CFA Francis M. Kinniry Jr., CFA David J. Walker, CFA Charles J. Thomas

Welcome message from author
This document is posted to help you gain knowledge. Please leave a comment to let me know what you think about it! Share it to your friends and learn new things together.
Transcript
Connect with Vanguard > vanguard.com
Executive summary. Within the investment community, a small (but vocal) segment has criticized the use of indexes constructed according to the traditional method of market-capitalization weighting, on the grounds that such indexes systematically overweight overvalued or “mispriced” stocks. Some critics have suggested that investors should abandon market-cap-weighted indexes in favor of alternative equity benchmarks that, for instance, weight individual stocks equally, or according to dividends, company fundamentals, or statistical properties.1 This paper’s analysis supports market-cap-weighted indexes over these alternative equity benchmarks, both for their theoretical basis and their practicality.
We first demonstrate the significance of the inherent bets for or against individual securities advocated by each alternative weighting methodology. We then show that after accounting for size and style exposures, these
Vanguard research November 2011
1 This paper addresses equal-weighted, dividend-weighted, and fundamentally weighted indexes. There are, of course, other methodologies—including weighting a portfolio according to trailing volatility, correlations, or other statistical measures—which we expect to examine in a subsequent analysis. Our discussion here, however, makes clear that any strategy that reweights an existing market-cap-weighted index shifts risk exposure away from market beta and is synonymous with active risk. This is substantiated by industry research, which shows that low-volatility strategies demonstrate factor tilts similar to the other alternative strategies that we examine (Clarke, de Silva, and Thorley, 2006).
A review of alternative approaches to equity indexing
Authors
Christopher B. Philips, CFA
Francis M. Kinniry Jr., CFA
David J. Walker, CFA
Charles J. Thomas

2
strategies have not consistently produced positive excess returns, or “alpha.” Finally, we demonstrate that such alternative weighting methodologies tend to produce a systematic “beta” exposure toward the smaller-cap and value stocks within the targeted benchmark. Ultimately, we conclude that should an investor desire such an exposure, market-cap-weighted portfolios focused on smaller-cap and value stocks represent a more cost-effective, more transparent, and statistically equivalent strategy.
A refresher on beta and indexing
Traditionally the term beta has been used to describe the risk-and-return attributes of a particular asset class. Accordingly, beta in the traditional sense is synonymous with “the market,” such as the stock or bond market. One challenge facing investors is that the investable options typically cast as market proxies do not always provide the most compre-hensive coverage. The MSCI EAFE Index, for example, has traditionally been a proxy for the global equity market outside of the United States. However, the MSCI EAFE Index excludes Canada, emerging-market countries, and small-cap stocks. As a result, a better proxy for “the market” for non-U.S. stocks would be the MSCI All Country World ex USA Investable Market Index. That said, the MSCI EAFE Index might not be considered an inferior index so long as an investor knowingly selects only the developed countries in Europe and the Pacific region as the target market.
The meaning of beta has evolved over time to include other identifiable risk factors such as size and style or even particular countries or market sectors. And, indexes have therefore been created with the intent of capturing these diverse betas. Given this evolution, an index could thus best be described as a group of securities, as defined by an index provider, that is intended to capture the beta of a market or market segment.
Although straightforward in theory, adding these betas to a portfolio is more complicated. First, index providers may define a given beta differently. MSCI, for example, defines global small-cap stocks as the smallest 15% of the investable market cap, while FTSE defines these stocks as the smallest 10%. Performance differences between the two indexes will thus be primarily driven by the stocks that are included in the MSCI index but excluded from the FTSE index. However, this doesn’t mean that the
Notes about risk and performance data: All investments are subject to market risk. Investments in bond funds are subject to interest rate, credit, and inflation risk. Foreign investing involves additional risks, including currency fluctuations and political uncertainty. Funds that concentrate on a relatively narrow market sector face the risk of higher share-price volatility. Prices of mid- and small-cap stocks often fluctuate more than those of large-company stocks. U.S. government backing of Treasury or agency securities applies only to the underlying securities and does not prevent share-price fluctuations. Diversification does not ensure a profit or protect against a loss in a declining market. Stocks of companies in emerging markets are generally more risky than stocks of companies in developed countries.
Performance data shown represent past performance, which is not a guarantee of future results. The performance of an index is not an exact representation of any particular investment, as you cannot invest directly in an index.

3
MSCI index is “better” than the FTSE index, unless the investor’s definition of global small- cap stocks is better captured by the constituents in the MSCI index.
Second, investors cannot invest directly in an index, and instead must rely on investable products that seek to track the index as closely as possible. An indexed investment strategy—via a mutual fund or an exchange-traded fund (ETF), for example—reflects implementation costs (transaction costs, operational expenses, trading frictions, and so on) and, therefore, should provide investors with the best proxy for achievable or investable beta. It is thus incumbent upon an investor seeking to capture beta to (1) ascertain which type of beta he or she is interested in; (2) determine which index most accurately represents that targeted beta; and (3) identify and then invest in an appropriate product that seeks to track that index.
Link between beta and market cap
Once the target market for an index has been defined, in order to represent the risk-and-return characteristics (or beta) of that market or market segment, the index must be weighted according to market capitalization (Sharpe, 1991). This concept is well-established in capital market theory and is easily explained by the formula for market capitalization:
Market capitalization = Shares outstanding x Price per share
Although a company controls the number of shares outstanding, the critical factor is the price per share, which is influenced solely by market participants.
Price reflects a powerful mechanism collectively used by market participants to establish and change views about a company’s future performance (including the issuance or retirement of shares). As a result, relevant information is continuously incorporated into stock prices through investor trading, which is then reflected in market capitalization. Market-cap-weighted indexes therefore always reflect the consensus investor estimate of each company’s relative value at every moment and of how the average investor has performed for a specific targeted beta. As a result, Vanguard believes the best index is not necessarily the one that provides the highest return over a given period, but the one that most accurately measures the collective asset-weighted capital that is invested within the market it is intended to track.
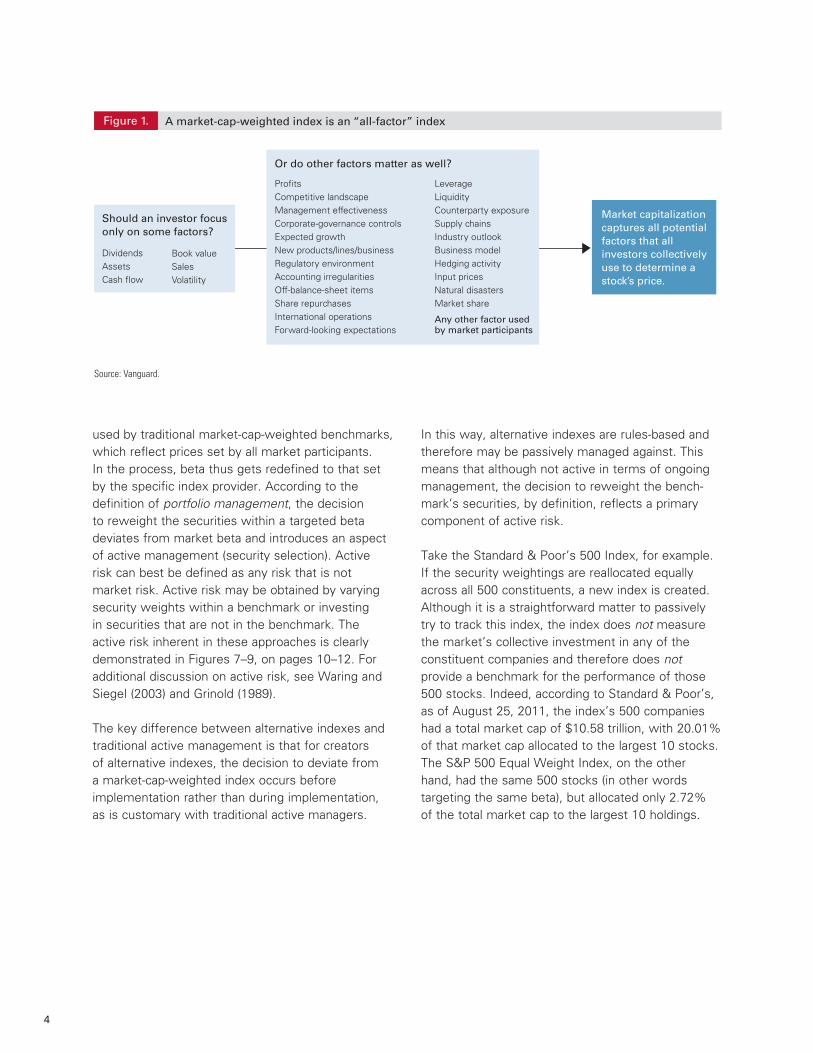
Because current price reflects every possible factor that is used by any investor to estimate a company’s value, a market-cap-weighted index also represents a true multifactor approach—indeed, an all-factor approach (Figure 1, on page 4)—to investing and an ex-ante (forward-looking) theoretically mean-variance-efficient portfolio.2 Any deviation from market-cap weighting within a targeted beta presumes that the collective valuation processes used by investors in that market are flawed.
This truism is based on the fact that investment performance can be deconstructed into three parts: the portions of return attributable to beta, to market-timing, and to security selection (Brinson, Hood, and Beebower, 1986, 1991). The latter two are specific to active management. Indexes using alternative weighting processes inherently presume that better risk-reward characteristics are available than those
2 It is important here to differentiate between an ex-ante (forward-looking) optimal portfolio and an ex-post (after-the-fact) optimal portfolio. Hindsight tells us we can construct any number of portfolios that would have been more efficient than the market portfolio over any particular period. This is because, in hindsight, we know with 100% certainty which stocks deviated from intrinsic value and which stocks did not. However, because forward-looking security prices are unpredictable and buyers must exactly offset sellers, the market-cap portfolio must be an ex-ante optimal portfolio. In an extreme example, should all investors execute a dividend-maximization strategy, not only would the prices of dividend stocks get bid up, thus driving yields down, but the market portfolio would become that very dividend-maximization portfolio.
4
used by traditional market-cap-weighted benchmarks, which reflect prices set by all market participants. In the process, beta thus gets redefined to that set by the specific index provider. According to the definition of portfolio management, the decision to reweight the securities within a targeted beta deviates from market beta and introduces an aspect of active management (security selection). Active risk can best be defined as any risk that is not market risk. Active risk may be obtained by varying security weights within a benchmark or investing in securities that are not in the benchmark. The active risk inherent in these approaches is clearly demonstrated in Figures 7–9, on pages 10–12. For additional discussion on active risk, see Waring and Siegel (2003) and Grinold (1989).
The key difference between alternative indexes and traditional active management is that for creators of alternative indexes, the decision to deviate from a market-cap-weighted index occurs before implementation rather than during implementation, as is customary with traditional active managers.
In this way, alternative indexes are rules-based and therefore may be passively managed against. This means that although not active in terms of ongoing management, the decision to reweight the bench-mark’s securities, by definition, reflects a primary component of active risk.
Take the Standard & Poor’s 500 Index, for example. If the security weightings are reallocated equally across all 500 constituents, a new index is created. Although it is a straightforward matter to passively try to track this index, the index does not measure the market’s collective investment in any of the constituent companies and therefore does not provide a benchmark for the performance of those 500 stocks. Indeed, according to Standard & Poor’s, as of August 25, 2011, the index’s 500 companies had a total market cap of $10.58 trillion, with 20.01% of that market cap allocated to the largest 10 stocks. The S&P 500 Equal Weight Index, on the other hand, had the same 500 stocks (in other words targeting the same beta), but allocated only 2.72% of the total market cap to the largest 10 holdings.
Figure 1.
Source: Vanguard.
A market-cap-weighted index is an “all-factor” index
DividendsAssetsCash �ow
Market capitalizationcaptures all potential factors that all investors collectively use to determine a stock’s price.
Should an investor focus only on some factors?
Book valueSalesVolatility
Pro�tsCompetitive landscapeManagement effectivenessCorporate-governance controlsExpected growthNew products/lines/businessRegulatory environmentAccounting irregularitiesOff-balance-sheet itemsShare repurchasesInternational operationsForward-looking expectations
Or do other factors matter as well?
LeverageLiquidityCounterparty exposureSupply chainsIndustry outlookBusiness modelHedging activityInput pricesNatural disastersMarket share
Any other factor used by market participants

5
In other words, $5.36 trillion in market cap of the largest 123 constituents was reallocated over the remaining 377 constituents. Such a strategy effectively assumes that market participants are collectively incorrect in their assessment of the value of both the larger and smaller stocks and that, by redistributing the allocations, this alternative index can provide a better solution.
This example of reweighting the constituent securities reflects a bias toward the smaller companies in the traditional benchmark and is synonymous with an active decision that any traditional active manager might make. However, despite targeting the same beta, the equal-weight index will provide risk-and-return characteristics markedly different from the market beta.3
Market capitalization and market efficiency
Although the current price of a stock represents an unbiased, forward-looking view of the collective wisdom of investors at that particular moment, it does not mean that the current price represents a stock’s true intrinsic value. Indeed, history tells us that stocks, sectors, styles, markets, and even countries can experience booms and busts based on market-clearing prices that, in hindsight, were well-divorced from true intrinsic value. The challenge for investors is that true intrinsic value is unknown by anyone beforehand. Only after the fact can we look back and identify a stock as over- or undervalued.4
This search for intrinsic value is the ultimate objective of active managers. However, a high hurdle is that the public capital markets are highly transparent and liquid, with new information being acted upon quickly by a large number of highly
sophisticated participants seeking to capitalize on perceived mispricings between current and future expected prices. As a result, correctly identifying a mispricing unobserved by other market participants is difficult and risky. This is because single stock risk, obtained by deviating from the market capitalization of a stock within a targeted benchmark, is also known as idiosyncratic, uncompensated, and diversifiable risk (Sharpe, 1991; Brinson et al., 1986; Waring and Siegel, 2003). Outperformance versus a benchmark is certainly possible and does occur, but investors should not assume that the market capitalization of a stock is some sort of free lunch to be exploited by anyone who underweights the largest stocks.
Hindsight may be perfect, but identifying over- valued stocks in real time is hard to do. For example, Figure 2, on page 6, shows the market capitalization of Apple Inc. as a percentage of the total U.S. stock market. Should Apple stock be eliminated from a portfolio or underweighted versus a benchmark owing to its size? For a strategy based on overvaluation of large companies to work, one must first identify when a company is considered overvalued and then also assume that all other market participants collectively view the same company as fairly valued. With Apple, for instance, was the stock overvalued in October 2005, when its price surpassed its previous high of 0.36% of the U.S. stock market? Or was it overvalued at 0.50% of the market, or at 1.00% of the market? Of course, there are plenty of reasons Apple may be fairly valued at 2% of the market, and, indeed, the company’s current price reflects all positions of both bulls and bears.
3 This concept is further outlined by Clifford Asness (2006).4 This truism is based on the efficient-market hypothesis (EMH), developed by Eugene Fama in the 1960s. Although there has been much debate regarding
the strength of the EMH, a core tenet still generally holds that investors are unable to consistently profit from any known market inefficiencies.

6
Appeal of portfolios using alternative strategies for structuring indexes
Proponents of strategies using alternative methodologies for constructing indexes believe that market-cap weighting inherently overweights overvalued stocks and underweights undervalued stocks, exposing investors to potentially lower returns with increased risk. If true that a stock’s price reflects pricing inefficiency (discussed later), it follows that overvalued stocks would represent a greater weight in a market-cap-weighted index relative to undervalued stocks. By focusing on market cap, traditional indexes are said to necessarily underperform strategies that focus on metrics other than company size (Siegel, 2006; Hsu, 2006). Indeed, as shown in Figure 4, on page 8, these alternative indexes would have significantly outperformed their traditional counterparts since January 2000, a period often referred to as the “lost decade,” in which large-cap stocks generally underperformed smaller-cap stocks, value stocks, and even other asset classes. This outperformance can be seen when we pair a given alternatively weighted index
with its market-cap-weighted peer. However, as we demonstrate in subsequent sections, these alternative strategies do not constitute better indexes. Instead of capturing inefficiencies, they simply restructure the systematic risk-factor exposures of existing benchmarks, capturing the effects of size and style that outperformed over this time period.
Are cap-weighted indexes inefficient?
If cap-weighted indexes were inefficient and easily bested by underweighting the largest companies, it should be simple to identify a majority of actively managed funds that consistently outperform, because active managers would only have to underweight or avoid the largest stocks in order to outperform their benchmark. However, when we inspected the data compiled from existing Vanguard research, we found this not to be the case (Figure 5, on page 8) (see Philips, 2010, 2011; Philips, Walker, and Kinniry, 2011; Molitor, Philips, and Cole, 2010; and Marshall, Bhatia, and Wallick, 2010).
Figure 2.
Notes: Total market represented by MSCI US Broad Market Index. Average market cap is computed as the average of each month's percentage of total market cap up to that point in time. For example, the first point represents the average over the previous 48 months, while the last point, as of May 31, 2011, represents the average percentage of total market cap over the entire period.
Source: Thomson Reuters Datastream. Data as of May 31, 2011.
Apple Inc. as percentage of total U.S. stock market
0
0.5
1.0
1.5
2.0
2.5%
Dec.1980
Dec.1982
Dec.1984
Dec.1986
Dec.1988
Dec.1990
Dec.1992
Dec.1994
Dec.1996
Dec.1998
Dec.2000
Dec.2002
Dec.2004
Dec.2006
Dec.2008
Dec.2010
Market cap as percentage of total market Average market cap as percentage of total market cap

7
A critical question regarding market-cap-based indexes is whether the largest stocks are generally overvalued while smaller stocks are generally undervalued. If this were true, by avoiding the largest stocks, an investor should theoretically be able to outperform the index. To test this argument, we turned to the historical constituents of the Russell 1000 Index. For this analysis we used the index constituents as of January 2003 and evaluated the performance of each stock relative to the index between January 2001 and June 2011. We started with the constituent list in 2003, owing to data limitations. Because the constituents change over time with the index’s annual rebalancing, we also tested the relationship using the constituent lists from both 2006 and 2010, with similar results.
Figure 3a shows that, across time, approxi-mately half of the stocks within the Russell 1000 Index underperformed the index in any given 12-month period. Figure 3b, using the same time frame, examines two subsets of the largest stocks within the Russell 1000 Index. Only about 49% of the top 50 companies and 46% of the top 200 companies underperformed the index over the entire time period. These numbers are very close to the 50% that would be expected to underperform if the relationship between size and performance were random, thus indicating that using market cap itself to predict returns was just as likely to lead to outperformance as underperformance. This fits with the concept of the zero-sum game, which states that the asset-weighted outperformance within a market must equal the asset-weighted underperformance in the market at all times (Sharpe, 1991).
Note: Data as of June 30, 2011.
Source: Thomson Reuters Datastream.
Figure 3. Relative performance of stocks in Russell 1000 Index
0
20
40
60
80
100%
Dec.2000
Dec.2002
Dec.2004
Dec.2008
Dec.2010
Dec.2006
0
20
40
60
80
100%
Dec.2000
Dec.2002
Dec.2004
Dec.2008
Dec.2010
Dec.2006
Largest 50 stocksLargest 200 stocks
a. Percentage of stocks in Russell 1000 Index that underperformed the index.
b. Percentage of largest stocks in Russell 1000 Index that underperformed the index.
Perc
enta
ge u
nder
perf
orm
ing;
ro
lling
12
mon
ths
Perc
enta
ge u
nder
perf
orm
ing;
ro
lling
12
mon
ths
Does avoiding largest names lead to outperformance?

8
The challenge facing active managers is that identifying true mispricings ex ante is extremely difficult. Even investors who have been successful historically find it difficult to retain that success across market cycles.5 Despite the poor relative performance of a variety of active equity funds shown in Figure 5, the core belief of the proponents of alternatively weighted strategies relates the outperformance shown in Figure 4 to securities being “mispriced.”
Both the logic and assumptions of the mispricing argument are subject to criticism. First, one must assume securities are indeed subject to systematic mispricing, and that those mispricings can be captured by generally avoiding large companies (see the text box on page 7). Second, even if stocks were systematically mispriced, proponents of such strategies are implicitly assuming that they have the tools to divine the securities’ correct value and thus benefit from the arbitrage opportunity.
5 For a comprehensive discussion of the challenges of active management, see Philips (2011).
Average Average Risk-adjusted Index annual return annual volatility return
S&P 500 Equal Weight Index 7.2% 18.8% 0.38%
S&P 500 Index 1.1% 16.2% 0.06%
Dow Jones U.S. Select Dividend Index 8.1% 17.1% 0.48%
Dow Jones U.S. Total Stock Market Index 1.7% 16.6% 0.10%
FTSE RAFI US 1000 Index 6.5% 17.8% 0.37%
Russell 1000 Index 1.6% 16.4% 0.10%
FTSE RAFI All-World 3000 Index 8.7% 18.1% 0.48%
FTSE All-World Index 2.9% 17.2% 0.17%
Note: Risk-adjusted returns represent the amount of return achieved for each percentage point of volatility. A risk-adjusted return of 1% could indicate identical values for both average return and average volatility.
Sources: Vanguard calculations, using data from Morningstar, Inc., and Thomson Reuters Datastream.
Performance during “lost decade”: December 31, 1999, through May 31, 2011Figure 4.
Percentage of managers underperforming market benchmark
United States 62%
United Kingdom 69
Canada 61
Europe 67
Australia 57
Notes: Returns are denominated in local currency and adjusted for survivorship bias. (Survivorship bias refers to the practice of removing dead funds from a database of all funds. Morningstar maintains the historical records of dead or closed funds; thus, we were able to include their performance in the analysis. Accounting for survivorship bias is important when evaluating the average performance of mutual funds because, as discussed by Brown and Goetzmann (1995), funds tend to disappear owing to poor performance. Further, as shown by Carhart et al. (2002), the performance impact of dead funds increases as the sample period increases.) We excluded sector funds, specialty funds, and funds focused on investments other than domestic equities for each identified domicile. We also tested alternate time periods (1-, 3-, and 5-year periods ended December 31, 2010), which provided similar results.
Sources: Morningstar, Inc. Benchmarks included the following: MSCI US Broad Market Index, FTSE All-Share Index, MSCI Canada Index, MSCI Europe Index, and MSCI Australia Index. For papers cited in the text in this connection, we updated data through 2010 for purposes of this figure.
Relative underperformance of active managers versus a market benchmark: Ten years ended December 2010
Figure 5.

9
Figure 6.
Alpha t-statistics from 36-month rolling three-factor model
Notes: Chart displays t-statistics for constants (style-adjusted alphas) from a 36-month rolling regression of the returns of each alternative index on the three Fama-French risk factors, as discussed in Fama and French (1993) and Carhart (1997). A value outside of the significance bands would indicate a regression constant (alpha) that is statistically different from 0 at that given significance level. Data as of May 31, 2011.
Sources: Vanguard, based on data from Morningstar, Inc., and website of Kenneth R. French: http://mba.tuck.dartmouth.edu/pages/faculty/ken.french/data_library.html.
After accounting for size and value tilts, any alpha disappears
T-st
atis
tic fo
r re
gres
sion
con
stan
t
–5
–4
–3
–2
–1
0
1
2
3
4
5
1988 1990 1992 1994 1996 1998 2000 2002 20062004 2008 2010
S&P 500 Equal Weight Index
FTSE RAFI US 1000 Index
Dow Jones U.S. Select Dividend Index
FTSE RAFI All-World 3000 Index
~ 0.01 signi�cance
~ 0.05 signi�cance
Finally, without knowing a security’s true, fair value (which is unknowable by anyone ex ante), it is unclear that a price-agnostic weighting strategy would benefit from any mispricing, as the noise in prices would cancel out across stocks and over time (Perold, 2007; and Kaplan, 2008).
A simple acid test for the claims of mispricing examines whether the returns of alternatively weighted index strategies can be explained by several common risk factors in the equity market. In Figure 6, we implement the basic three-risk- factor model from Fama and French (1993) and
Carhart (1997), displaying the t-statistics for the style-adjusted alphas on a 36-month rolling basis. These values can be interpreted as the return left over after accounting for the portfolio’s exposure to market, size, and value risk factors. None of the alternative strategies examined in this example produced style-adjusted alphas that were consistently and significantly different from 0, thus indicating that their outperformance relative to cap-weighted benchmarks can be explained by size and value tilts within the market, a point discussed in more detail in the next section.
Key term
T-statistic is a value resulting from a statistical test that represents the degree of confidence that an observed value is meaningfully different from zero.

10
Do alternative indexes form a better portfolio core?
Although alternative indexes are portrayed as a viable replacement for market-cap-weighted indexes to achieve market beta, according to the definitions of market beta and active risk, we can conclude that alternative indexes are rules-based strategies built on one or several active decisions occurring prior to the creation of the index. The active decisions are reflected in security weights that can be significantly different from the targeted bench mark. As an example, Figure 7 illustrates the security weightings of the PowerShares FTSE RAFI US 1000 Portfolio versus the Russell 1000 Index. If both the portfolio tracking the FTSE RAFI US 1000 Index and the Russell 1000 Index had the same weight in every company, all of the individual company weightings would plot along the diagonal line. However, clearly there are differences in the weightings, which are sometimes significant. Although these indexes are formed according to documented investment rules, as shown in Figure 7, these differences represent
a conscious, active risk exposure that will necessarily lead to tracking error relative to the market-cap-weighted benchmark and may or may not pay off in the form of higher returns (Waring and Siegel, 2003; Grinold, 1989).6
Security-weighting differences lead to sector tilts. As a result, sector exposure highlights another example of the additional risk of alternative weighting methodologies. Figure 8a shows the relative weightings of the S&P 500 Equal Weight Index versus the S&P 500 Index. As the figure shows, the weighting differences can be significant. The equal-weighted index is overweight in consumer discretionary, materials, and utilities, while under-weight in such sectors as energy, information technology, and consumer staples. Similarly, Figure 8b shows the relative weights of the FTSE RAFI US 1000 Index versus the Russell 1000 Index, with large differences in the financial and information technology sectors.
6 Company- or stock-specific risk is often referred to as diversifiable or uncompensated risk. In other words, absent true information regarding the real value of a security, deviations from the market consensus would not be expected to be compensated in the form of excess returns. This is perhaps one reason why the consistent generation of alpha over time is so difficult.
�
�
��
�
�
�
�
��
�� ���
� ��
��
���
�
�
�
��
���
�� �����
�
��� ������
�
�� ���
�����
�
���� ��
������ ���
���
�������
������������� ����
������
�
�� �
�
�
���
���� ��
��� ��
�����
�� ���
�
����������
�
������� ��
�
���
��
����
����
�
����
�
� ���
�
�
� �������
�
�� ���
�
������
����� �������
�� ���
����
���
� ������� ���
�
� ��
���������
��� �
�
� ���
�
�
�
����������� ��� ��
�
�
����
��� � ��� ����
�
�
�
�� ������
�
������
�
��
�
�
�
�����
� ���
�
�������������� �
�
����������
��
�
��
�
���
���
�
����
� ��
�
� �
�
�������
���
��� ������
��� ��
�
�� ��
�
�����
�
� ���
��
������
����
��� ���
��
�������� �� �����
��
�
��
�
�� ����� �
� �������
�
�
��������
�
�� ���
�
���������
�
�
�
���
�
�� ������� �� ��
�
��
�
�������� ����
��
����
�
� �����������
�
��
���
���� �����
�
�� ������
��
����
�
���� �
�
� � ���������
�
�
���
���
�
�
���
���
���������� ���� �����
�
��
���
�
�
���� ������
��� ����� ��
��� ����
�
�
�
��������
���
�
����� �
��� �����
��
�
�
���
� ��
��
��
�
�
�
�
�
��������
������ ���
� �����
��
�������
��
���
�
�
��
�
���� �����
��������
��� �����������
���
�����
�
����
�
� �����
� � ������
���
�
��
�
�
�
�����������
���
�
�
�
���������
��� ���
�
� ��������
���
�
������
����������
�
����������� ������ �������� ���
���
�
��������
���
���
�������������� �� ����
�
�������� �����
�
����
����� ��
��
�
�����
����
�
���
� ���
���� ���
�
���������������
���
�
������ �� ��������
������ ���� �
�
�����
�����
�
�
�
��
��
���������
�
�
�
��� �
�
��
�
�
�������
�
��
� ���
�
�
�����
���������� ��
�
�
�
������� �����
�
����
����� �
�
���
�
�
��� ����������������� ��
���
���
���
�
��
��
��
�� ��
Figure 7.
Note: Data as of May 31, 2011.
Source: Morningstar, Inc.
Individual company weights highlight active risk
Pow
erS
hare
s FT
SE
RA
FI
US
100
0 Po
rtfo
lio w
eigh
ting
0 0.5 1.0 1.5 2.0 2.5 3.0 3.5
0
0.5
1.0
1.5
2.0
2.5
3.0
3.5
Russell 1000 Index weighting
Weighting difference re�ects active risk

11
Figure 8.
Notes: Part a compares the S&P 500 Equal Weight Index to the S&P 500 Index as of May 31, 2011. Part b compares the FTSE RAFI US 1000 Index with the Russell 1000 Index as of May 31, 2011.
Source: Morningstar, Inc.
Alternative index-sector exposure versus market-cap weighting
Relative weight (%) Relative weight (%)
a. Equal-weighted index versus cap-weighted index b. Fundamentally weighted index versus cap-weighted index
–8 –6 –4 –2 0 2 4 6
Consumerdiscretionary
Consumerdiscretionary
Consumer staples Consumer staples
Energy Energy
Financials Financials
Health care Health care
Industrials Industrials
Materials Materials
Utilities Utilities
Telecommunicationservices
Telecommunicationservices
Informationtechnology
Informationtechnology
–8 –6 –4 –2 0 2 4 6
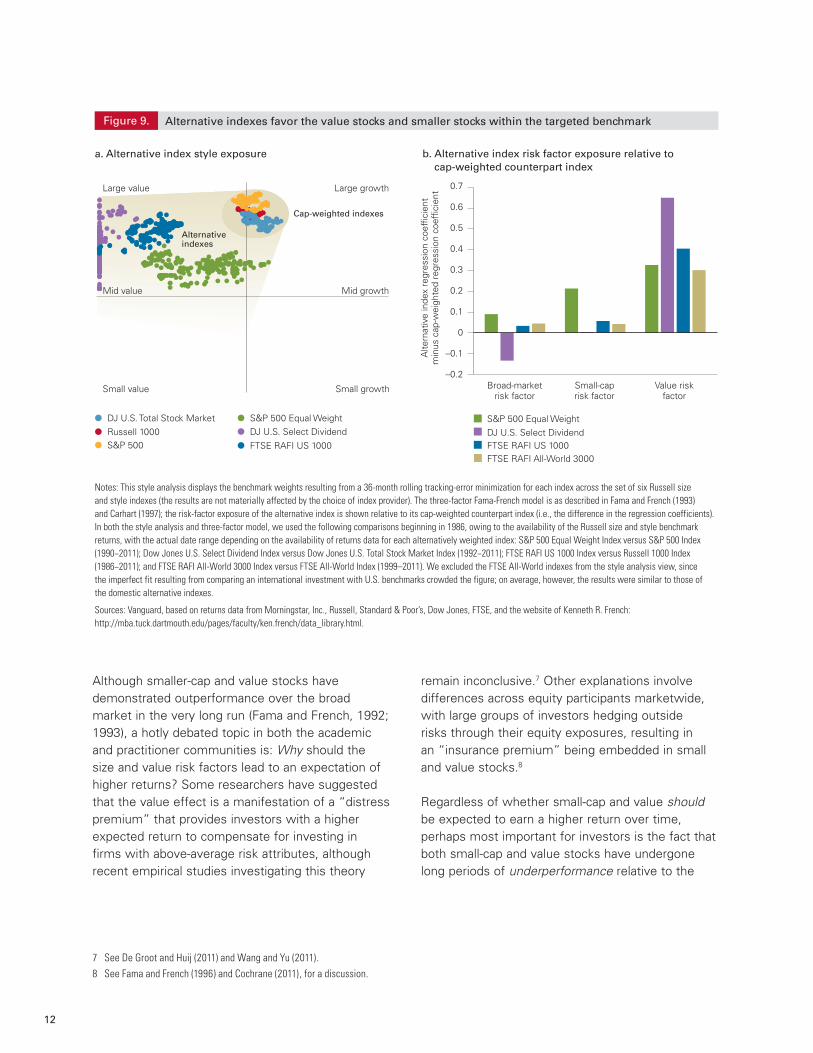
The net result of these security and sector weights has been a systematic bias toward the value stocks and smaller stocks within the targeted benchmarks for most (if not all) of these strategies. Figure 9, on page 12, shows two distinct methods for determining the average size and style of an equity fund, applied to the returns of several alternatively weighted indexes. Part a of the figure uses a returns-based style analysis on both alternatively weighted and cap-weighted indexes, to show their respective factor tilts across time. Part b of the figure shows the average size and style exposure of alternative indexes relative to their cap-weighted counterparts, again using the three-factor model of Fama and French (1993) and Carhart (1997).
Both methods result in similar findings: Relative to cap-weighted indexes, alternative weighting methodologies show a tilt toward value companies, and to a lesser extent, smaller or midsized
companies. These findings indicate that the performance of these weighting strategies will be driven by their size and style biases. Intuitively this means that when value stocks and/or smaller stocks outperform their large-cap growth counter-parts, alternatively weighted strategies will outperform cap-weighted indexes.
Do smaller stocks and value stocks outperform?
Our analysis thus far has demonstrated that the various rules adhered to by alternative strategies have led to a systematic tilt toward smaller-cap and value stocks. So long as these biases remain, the performance of these strategies relative to a cap-weighted index will be inherently driven by these market segments. It is reasonable, then, to ask whether one would also expect these segments to consistently outperform over time.
12
Although smaller-cap and value stocks have demonstrated outperformance over the broad market in the very long run (Fama and French, 1992; 1993), a hotly debated topic in both the academic and practitioner communities is: Why should the size and value risk factors lead to an expectation of higher returns? Some researchers have suggested that the value effect is a manifestation of a “distress premium” that provides investors with a higher expected return to compensate for investing in firms with above-average risk attributes, although recent empirical studies investigating this theory
remain inconclusive.7 Other explanations involve differences across equity participants marketwide, with large groups of investors hedging outside risks through their equity exposures, resulting in an “insurance premium” being embedded in small and value stocks.8
Regardless of whether small-cap and value should be expected to earn a higher return over time, perhaps most important for investors is the fact that both small-cap and value stocks have undergone long periods of underperformance relative to the
7 See De Groot and Huij (2011) and Wang and Yu (2011).8 See Fama and French (1996) and Cochrane (2011), for a discussion.
�������������������������������������������������������������������������������������������������������
����������������������������������������������������������������������
�������������������������������������������������������������������������������������������������
Figure 9.
a. Alternative index style exposure
Notes: This style analysis displays the benchmark weights resulting from a 36-month rolling tracking-error minimization for each index across the set of six Russell size and style indexes (the results are not materially affected by the choice of index provider). The three-factor Fama-French model is as described in Fama and French (1993) and Carhart (1997); the risk-factor exposure of the alternative index is shown relative to its cap-weighted counterpart index (i.e., the difference in the regression coefficients). In both the style analysis and three-factor model, we used the following comparisons beginning in 1986, owing to the availability of the Russell size and style benchmark returns, with the actual date range depending on the availability of returns data for each alternatively weighted index: S&P 500 Equal Weight Index versus S&P 500 Index (1990−2011); Dow Jones U.S. Select Dividend Index versus Dow Jones U.S. Total Stock Market Index (1992−2011); FTSE RAFI US 1000 Index versus Russell 1000 Index (1986−2011); and FTSE RAFI All-World 3000 Index versus FTSE All-World Index (1999–2011). We excluded the FTSE All-World indexes from the style analysis view, since the imperfect fit resulting from comparing an international investment with U.S. benchmarks crowded the figure; on average, however, the results were similar to those of the domestic alternative indexes.
Sources: Vanguard, based on returns data from Morningstar, Inc., Russell, Standard & Poor’s, Dow Jones, FTSE, and the website of Kenneth R. French: http://mba.tuck.dartmouth.edu/pages/faculty/ken.french/data_library.html.
Alternative indexes favor the value stocks and smaller stocks within the targeted benchmark
b. Alternative index risk factor exposure relative to cap-weighted counterpart index
��������������������������������������������������������
����������������������������
������������������������������������������
�������������������������������������������������������������������������������������������������
���������������������������������������������������������
�������������
��������������������������
�����
�������������������������������������������������������������������������������������������������
�����
������
�������������������������������������
�����������
��
���������
�
�������������
���������
����
����������
����������������
������
�����
��
������
���������
���
��������
�
�
�
��
�
����
��������������������������
Large value
Mid value
Small value
Large growth
Mid growth
Small growth
�����������������������������������
������������������������
���������
���
������������
��� ���������
�������������������������������������
������������������������
��������������
���������
� ����������������
����
�������
�����������������������������
������
��������
�������������������
�������������������� ��
����
���
��� ��
���� �� ��������
��������
�����
�������
������
������ ����
�������������������
���������
������
���
�����
����� ��� ����
���
� ���� �����������
����
������� �������
�����������
��� ����
���
���
������������������������
Cap-weighted indexes
Alternativeindexes
� DJ U.S. Total Stock Market� Russell 1000� S&P 500
� S&P 500 Equal Weight� DJ U.S. Select Dividend� FTSE RAFI US 1000
–0.2
–0.1
0
0.1
0.2
0.3
0.4
0.5
0.6
0.7
Alte
rnat
ive
inde
x re
gres
sion
coe
f�ci
ent
min
us c
ap-w
eigh
ted
regr
essi
on c
oef�
cien
t
Broad-marketrisk factor
Small-caprisk factor
Value riskfactor
S&P 500 Equal WeightDJ U.S. Select DividendFTSE RAFI US 1000FTSE RAFI All-World 3000

13
9 Previous Vanguard research has shown investors’ propensity to chase returns. First, returns captured by investors (also known as an internal rate of return, or IRR) have been shown to lag the returns of the funds in which they invest (also known as a fund’s time-weighted return) (Bruno and Donaldson, 2011). Second, cash flows into and out of broad asset classes have tended to follow periods of significant relative performance, where one asset class significantly out- or underperforms another asset class (Bennyhoff and Kinniry, 2010).
Figure 10.
a. Russell 2000 Value Index versus Russell 3000 Index
Note: Data reflect rolling cumulative return differentials as of December 31, 2010.
Sources: Russell, MSCI, and Vanguard.
Small-cap and value performance is time-period dependent
b. MSCI EAFE Small Cap Value Index versus MSCI EAFE Index
Diff
eren
tial (
perc
enta
ge p
oint
s)
–150
–100
–50
0
50
100
150%
1979 1987 1991 2003 2007 2010199919951983
12-month return differential 36-month return differential 60-month return differential
Small value outperforms
Broad market outperforms
Diff
eren
tial (
perc
enta
ge p
oint
s)
–150
–100
–50
0
50
100
150%
1995 1997 1999 2001 2003 2005 2007 2009
Small value outperforms
Broad market outperforms
2010
broad market, as shown in Figure 10. This is an example of the potential for alternative strategies’ embedded biases to work to the detriment of investors. That is, when a given segment of the equity market is expected to outperform over the very long run, but demonstrates consistent under-performance over many years, will investors actually remain committed to that strategy, or will they invest only after smaller and value stocks have outperformed?9
An alternative to systematic portfolio tilts
Although Vanguard believes investors are best served by gaining equity exposure in their portfolios through a broad-market-cap-weighted index, we realize that some investors may be attracted to the factor tilts that alternative weighting strategies
provide. If an investor is considering an alternative weighting strategy, we believe a more effective implementation method would be to utilize cap-weighted indexes that are aligned with the risk- factor exposures inherent to these alternative strategies. Figure 11, on page 14, presents an example. By simply adding a mid-cap value index to a large-cap blend index (it’s important to note that the Russell Midcap Value Index is represented within the Russell 1000 Index, reflecting a similar overweighting of mid-cap value stocks without adding new securities to the targeted benchmark), an investor would have been able to approximate the risk profile (R-squared and standard deviation) as well as the returns and risk-adjusted returns (the Sharpe ratio) of the FTSE RAFI US 1000 Index over the last ten years.

14
In addition to performance similarities and purer factor exposure, cap-weighted portfolios are generally cheaper than portfolios based on these alternative strategies (12 versus 36 basis points, respectively).10 Finally, if an investor wishes to implement a more dynamic approach to factor exposure (e.g., tactical or dynamic asset allocation), it is simpler and more transparent to utilize market-cap-weighted indexes, because this gives the investor direct control over the factor exposure through time.
Conclusion
An index is a group of securities chosen to represent an unbiased view of the risk-and-reward attributes of a market or a portion of a market. Vanguard believes that because of this, indexes should be constructed according to the market capitalization of the underlying constituents. Despite this, a small minority of the investment community has criticized the use of market-cap-weighted indexes based on perceived inefficiencies. This analysis has shown that these alternative strategies:
10 Sources: Asset-weighted average of all broad-market and S&P 500 Index funds and ETFs versus the average of the funds and ETFs shown in Figure A-1, on page 17; expense ratio data from Morningstar, Inc., as of September 30, 2011.
Name 1 year 3 years 5 years 10 years 15 years
R-squared versus FTSE RAFI US 1000 Index
FTSE RAFI US 1000 Index 100.00 100.00 100.00 100.00 100.00
Russell Midcap Value Index 98.20 95.20 94.20 93.20 91.50
50% Russell 1000 Index/50% Russell Midcap Value Index 99.10 95.60 95.20 95.80 94.90
Annualized total returns
FTSE RAFI US 1000 Index 18.43 7.30 3.91 5.27 9.80
Russell Midcap Value Index 20.60 5.50 3.39 8.08 10.40
50% Russell 1000 Index/50% Russell Midcap Value Index 20.65 4.48 3.15 5.63 8.77
Standard deviation
FTSE RAFI US 1000 Index 14.62 26.22 21.72 18.12 17.24
Russell Midcap Value Index 14.40 26.65 22.03 18.26 17.30
50% Russell 1000 Index/50% Russell Midcap Value Index 13.91 24.03 19.99 16.90 16.40
Sharpe ratio
FTSE RAFI US 1000 Index 1.22 0.39 0.21 0.26 0.46
Russell Midcap Value Index 1.37 0.33 0.19 0.41 0.49
50% Russell 1000 Index/50% Russell Midcap Value Index 1.41 0.29 0.17 0.29 0.41
Notes: Data through July 31, 2011. We also replicated this analysis using indexes from S&P (S&P 500 combined with S&P Midcap 400 Value) and MSCI (MSCI Prime Market 750 combined with MSCI Midcap 450 Value), with similar results. R-squared, or coefficient of determination, is a statistical measure used to describe how well the movements of one variable fit with the movements of another variable. A higher value indicates a better fit, with 100 being a perfect fit. The Sharpe ratio is a measure of return in excess of the risk-free rate relative to the risk (standard deviation) of the investment. The Sharpe ratio is used to evaluate how well the return of an investment compensates an investor for the risks undertaken to achieve that return.
Sources: Morningstar, Inc.
Using cap-weighted indexes can mimic the desired exposuresFigure 11.

15
(1) are best described as passive, rules-based investment strategies that focus on only a small number of factors; (2) have not successfully captured market inefficiencies consistently across time; and (3) as a result of sometimes significant weighting differences from market-cap-weighted indexes, have demonstrated systematic tilts over time toward smaller-cap stocks or value stocks, or both. The debate regarding the long-term merits of such tilts continues, but Vanguard believes that, if desired, investors can implement such tilts in a more cost-effective and risk-controlled fashion by using funds designed to track traditional market- cap-weighted indexes. Overall, we conclude that reweighting traditional market-cap-based indexes does not represent a new paradigm of investing and does not represent a better way to capture the performance of a targeted beta.
References
Arnott, Robert, 2006. An Overwrought Orthodoxy. Institutional Investor (December): 36−41.
Arnott, Robert, Jason Hsu, and Philip Moore, 2005. Fundamental Indexation. Financial Analysts Journal 61(2): 83–99.
Asness, Clifford, 2006. The Value of Fundamental Indexing. Institutional Investor (October): 94−99.
Bennyhoff, Donald G., and Francis M. Kinniry Jr., 2010. Advisor’s Alpha. Valley Forge, Pa.: The Vanguard Group.
Brinson, Gary P., L. Randolph Hood, Jr., and Gilbert L. Beebower, 1986. Determinants of Portfolio Performance. Financial Analysts Journal 42(4): 39–44 (reprint, 1995, Financial Analysts Journal 51(1): 133–38, 50th Anniversary Issue).
Brinson, Gary P., L. Randolph Hood, Jr., and Gilbert L. Beebower, 1991. Determinants of Portfolio Performance II: An Update. Financial Analysts Journal 47(3): 40–48.
Brown, Stephen J., and William N. Goetzmann, 1995. Performance Persistence. Journal of Finance 50: 679–98.
Bruno, Maria A., and Scott J. Donaldson, 2011. Single-Fund Investment Options: Portfolio Construction Simplified for Investors. Valley Forge, Pa.: The Vanguard Group.
Carhart, Mark M., 1997. On Persistence in Mutual Fund Performance. Journal of Finance 52(1): 57–82.
Carhart, Mark M., Jennifer N. Carpenter, Anthony W. Lynch, and David K. Musto, 2002. Mutual Fund Survivorship. Review of Financial Studies 15(5): 1439–63.
Clarke, Roger, Harindra de Silva, and Steven Thorley, 2006. Minimum-Variance Portfolios in the U.S. Equity Market. Journal of Portfolio Management 33(1): 10–24.
Cochrane, John, 2011. Discount Rates. Journal of Finance 33(4): 1047–1108.
De Groot, Wilma, and Joop Huij, 2011. Is the Value Premium Really a Compensation for Distress Risk? Available at SSRN: http://ssrn.com/abstract=1840551.
Fama, Eugene, 1970. Efficient Capital Markets: A Review of Theory and Empirical Work. Journal of Finance 25: 383–417.
Fama, Eugene, and Kenneth French, 1992. The Cross-Section of Expected Stock Returns. Journal of Finance 47(2): 427–65.
Fama, Eugene, and Kenneth French, 1993. Common Risk Factors in the Returns on Stocks and Bonds. Journal of Financial Economics 33(1): 3–56.
Fama, Eugene, and Kenneth French, 1996. Multifactor Explanations of Asset Pricing Anomalies. Journal of Finance 51(1): 55–84.
16
Grinold, Richard C,. 1989. The Fundamental Law of Active Management. Journal of Portfolio Management 15(3): 30–37.
Hsu, Jason, 2006. Cap-Weighted Portfolios Are Sub-Optimal Portfolios. Journal of Investment Management 4(3): 44–53.
Kaplan, Paul, 2008. Why Fundamental Indexation Might—Or Might Not—Work. Financial Analysts Journal 64(1): 32–39.
LaBarge, Karin Peterson, and Dean Hamilton, 2011. Lower Dividend Yields Today: Lower Stock Returns Tomorrow? Valley Forge, Pa.: The Vanguard Group.
Marshall, Jill, Neeraj Bhatia, and Daniel W. Wallick, 2010. The Case for Indexing: Theory and Practice in the Australian Market. Valley Forge, Pa.: The Vanguard Group.
Molitor, Jeffrey S., Christopher B. Philips, and C. William Cole, 2010. The Case for Index Fund Investing in the UK. Valley Forge, Pa.: The Vanguard Group.
Perold, André, 2007. Fundamentally Flawed Indexing. Financial Analysts Journal 63(6): 31–37.
Philips, Christopher B., 2010. The Case for Indexing: European- and Offshore-Domiciled Funds. Valley Forge, Pa.: The Vanguard Group.
Philips, Christopher, 2011. The Case for Indexing. Valley Forge, Pa.: The Vanguard Group.
Philips, Christopher B., David J. Walker, and Francis M. Kinniry Jr., 2011. The Case for Indexing: Canada. Valley Forge, Pa.: The Vanguard Group.
Sharpe, William F., 1991. The Arithmetic of Active Management. Financial Analysts Journal 47(1): 7–9.
Siegel, Jeremy, 2006. The “Noisy Market” Hypothesis. Wall Street Journal (June 14): A14.
Wang, Huijun, and Jianfeng Yu, 2011. An Empirical Assessment of Models of the Value Premium; available at SSRN: http://ssrn.com/abstract= 1866397.
Waring, M. Barton, and Laurence B. Siegel, 2003. The Dimensions of Active Management. Journal of Portfolio Management (Spring): 35–52.
Waring, M. Barton, and Laurence B. Siegel, 2005. Debunking Some Myths of Active Management. Journal of Investing (Summer): 20–28.
Williams, John Burr, 1938. The Theory of Investment Value. Cambridge, Mass.: Harvard University Press.
17
11 For details on this index, see the S&P website: http://www2.standardandpoors.com/spf/pdf/index/SP_Equal_Weight_Index_Methodology_Web.pdf.12 John Burr Williams, in the 1938 work The Theory of Investment Value, is widely credited with making mainstream the idea that a stock’s intrinsic value is
equal to the present value of all the dividends a company is expected to pay in the future.13 For details on this index, see the Dow Jones website: http://www.djindexes.com/mdsidx/downloads/meth_info/Dow_Jones_US_Select_Dividend_
Index_Methodology.pdf.
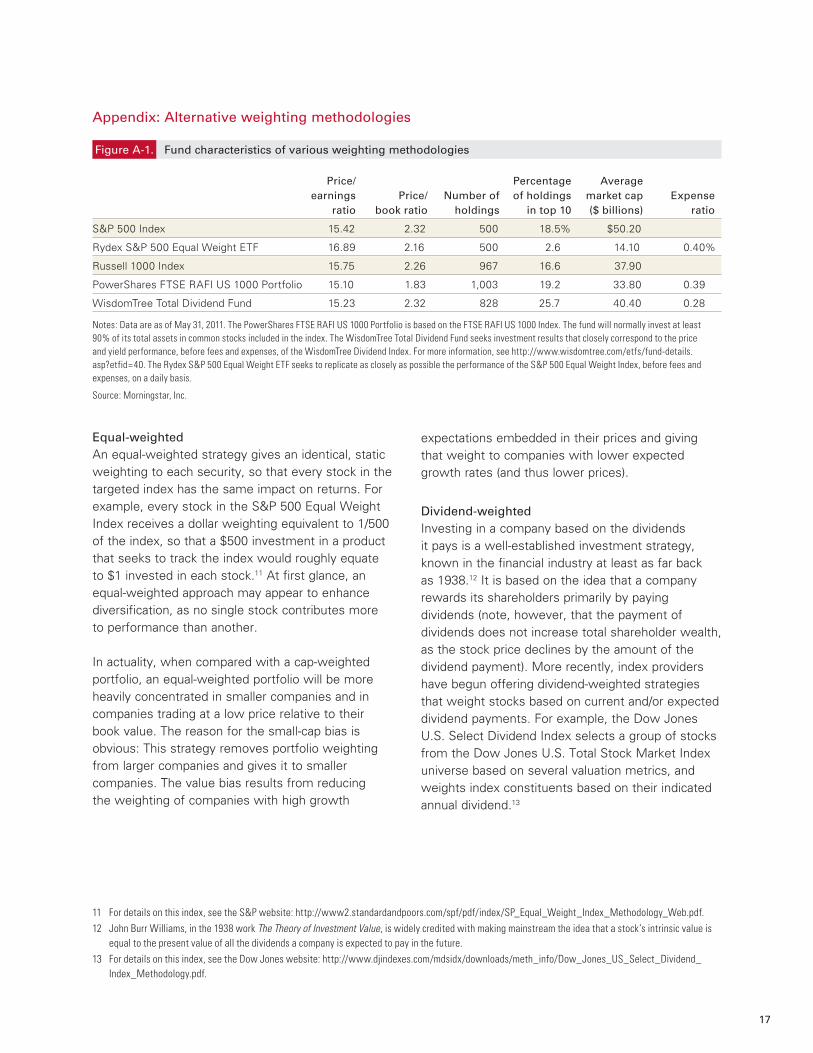
Equal-weightedAn equal-weighted strategy gives an identical, static weighting to each security, so that every stock in the targeted index has the same impact on returns. For example, every stock in the S&P 500 Equal Weight Index receives a dollar weighting equivalent to 1/500 of the index, so that a $500 investment in a product that seeks to track the index would roughly equate to $1 invested in each stock.11 At first glance, an equal-weighted approach may appear to enhance diversification, as no single stock contributes more to performance than another.
In actuality, when compared with a cap-weighted portfolio, an equal-weighted portfolio will be more heavily concentrated in smaller companies and in companies trading at a low price relative to their book value. The reason for the small-cap bias is obvious: This strategy removes portfolio weighting from larger companies and gives it to smaller companies. The value bias results from reducing the weighting of companies with high growth
expectations embedded in their prices and giving that weight to companies with lower expected growth rates (and thus lower prices).
Dividend-weighted Investing in a company based on the dividends it pays is a well-established investment strategy, known in the financial industry at least as far back as 1938.12 It is based on the idea that a company rewards its shareholders primarily by paying dividends (note, however, that the payment of dividends does not increase total shareholder wealth, as the stock price declines by the amount of the dividend payment). More recently, index providers have begun offering dividend-weighted strategies that weight stocks based on current and/or expected dividend payments. For example, the Dow Jones U.S. Select Dividend Index selects a group of stocks from the Dow Jones U.S. Total Stock Market Index universe based on several valuation metrics, and weights index constituents based on their indicated annual dividend.13
Price/ Percentage Average earnings Price/ Number of of holdings market cap Expense ratio book ratio holdings in top 10 ($ billions) ratio
S&P 500 Index 15.42 2.32 500 18.5% $50.20
Rydex S&P 500 Equal Weight ETF 16.89 2.16 500 2.6 14.10 0.40%
Russell 1000 Index 15.75 2.26 967 16.6 37.90
PowerShares FTSE RAFI US 1000 Portfolio 15.10 1.83 1,003 19.2 33.80 0.39
WisdomTree Total Dividend Fund 15.23 2.32 828 25.7 40.40 0.28
Notes: Data are as of May 31, 2011. The PowerShares FTSE RAFI US 1000 Portfolio is based on the FTSE RAFI US 1000 Index. The fund will normally invest at least 90% of its total assets in common stocks included in the index. The WisdomTree Total Dividend Fund seeks investment results that closely correspond to the price and yield performance, before fees and expenses, of the WisdomTree Dividend Index. For more information, see http://www.wisdomtree.com/etfs/fund-details.asp?etfid=40. The Rydex S&P 500 Equal Weight ETF seeks to replicate as closely as possible the performance of the S&P 500 Equal Weight Index, before fees and expenses, on a daily basis.
Source: Morningstar, Inc.
Fund characteristics of various weighting methodologiesFigure A-1.
Appendix: Alternative weighting methodologies

18
Although dividend-based investing may have theoretical merits, such a strategy can differ significantly from a market-weighted index. Not all stocks pay dividends, as many companies choose to reinvest their earnings to expand their business (in 2010, for example, 75% of the companies in the S&P 500—representing 80% of its market capitalization—paid dividends, according to Standard & Poor’s). In addition, over the past several decades, companies have increasingly displayed a tendency to engage in share repurchases as an alternative to paying dividends.14
A critical point is that dividends may not be the best measure of a stock’s potential for total return. Because of the mechanics of a dividend payment, it’s important to understand that a company’s prospects are not rosier because of the distribution of earnings. In addition, companies that do pay dividends tend to be larger and to have value traits: they typically have well-established businesses and are sufficiently mature that it is advantageous for them to return income to shareholders rather than to reinvest it in the company.
Strategies weighted on valuation metrics These strategies weight companies based on financial valuation metrics, such as earnings, revenue, assets, and book value of equity.15 Advocates of reweighting an index according to company fundamentals point to market mispricings and inefficiencies that operate to the detriment of cap-weighted indexes and to the benefit of fundamentals-weighted strategies. The performance attributes of these strategies demonstrate clear size and style tilts toward smaller-cap and value-oriented stocks. For example, if the index is weighted by earnings, it will overweight stocks with higher earnings yields (earnings per share divided by price) in comparison with stocks that have lower earnings yields. In this case, there will clearly be a bias toward value companies and relative to cap weighting.
14 For more on this topic, see LaBarge and Hamilton (2011).15 Although certainly not the first to use company fundamentals in evaluating and weighting securities, analysts at Research Affiliates popularized the idea
of using these metrics in a rules-based index framework in their study “Fundamental Indexation” (Arnott, Hsu, and Moore, 2005). The methodology behind this study was eventually implemented in FTSE’s RAFI series of indexes.


Vanguard research > Vanguard Center for Retirement Research Vanguard Investment Counseling & Research Vanguard Investment Strategy Group
E-mail > [email protected]
Investors should carefully consider the investment objectives, risks, charges and expenses of the WisdomTree Funds before investing. To obtain a prospectus containing this and other important information, please call 1-866-909-WISE (9473) or go to http://www.wisdomtree.com/library/regulatory-information.asp to view or download a prospectus online. Read the prospectus carefully before you invest. There are risks involved with investing including the possible loss of principal. Past performance does not guarantee future results.
An investor should consider the Invesco PowerShares Funds’ investment objectives, risks, charges and expenses carefully before investing. For this and more complete information about the Funds, call 800-983-0903 or visit invescopowershares.com for a prospectus. Please read the prospectus carefully before investing.
CFA® is a trademark owned by CFA Institute.
For more information about Vanguard funds, visit www.vanguard.com, or call 800-662-2739, to obtain a prospectus. Investment objectives, risks, charges, expenses, and other important information about a fund are contained in the prospectus; read and consider it carefully before investing.
For more complete information regarding Rydex SGI funds go to http://www.rydex-sgi.com/service/literature_andforms.shtml for a prospectus. Investors should consider the investment objectives, risks, charges and expenses of a fund carefully before investing. The fund’s prospectus contains this and other information about the fund. Read the prospectus carefully before you invest or send money.
P.O. Box 2600 Valley Forge, PA 19482-2600
© 2011 The Vanguard Group, Inc. All rights reserved. Vanguard Marketing Corporation, Distributor.
ICRCWI 112011
Connect with Vanguard® > vanguard.com
Related Documents