Citation: Anes, V.; Abreu, A.; Dias, A.; Calado, J. A Reputational-Risk-Based Match Selection Framework for Collaborative Networks in the Logistics Sector. Sustainability 2022, 14, 4329. https://doi.org/10.3390/ su14074329 Academic Editor: Guido Perboli Received: 21 February 2022 Accepted: 31 March 2022 Published: 6 April 2022 Publisher’s Note: MDPI stays neutral with regard to jurisdictional claims in published maps and institutional affil- iations. Copyright: © 2022 by the authors. Licensee MDPI, Basel, Switzerland. This article is an open access article distributed under the terms and conditions of the Creative Commons Attribution (CC BY) license (https:// creativecommons.org/licenses/by/ 4.0/). sustainability Article A Reputational-Risk-Based Match Selection Framework for Collaborative Networks in the Logistics Sector Vitor Anes 1,2,3, * , António Abreu 1,2,4 , Ana Dias 1,2 and João Calado 1,2,3 1 Instituto Superior de Engenharia de Lisboa, 1959-007 Lisboa, Portugal; [email protected] (A.A.); [email protected] (A.D.); [email protected] (J.C.) 2 Instituto Politécnico de Lisboa, 1549-020 Lisboa, Portugal 3 Instituto de Engenharia Mecânica (IDMEC), Instituto Superior Técnico, Universidade de Lisboa, 1049-001 Lisboa, Portugal 4 Centro de Tecnologias e Sistemas (CTS)–Uninova, Faculdade de Ciências e Tecnologia da Universidade Nova de Lisboa, 2825-149 Caparica, Portugal * Correspondence: [email protected] Abstract: Collaborative networks in the logistics sector have proven to be a solution that both meets environmental footprint reduction goals and addresses the impact of rising fuel prices on logistics companies, especially for small- and medium-sized enterprises. Despite these benefits, these collaborative networks have not received the desired amount of participation due to reputational risk. This paper develops a framework for assessing and managing reputational risk to encourage logistics companies’ participation in collaborative networks. To this end, customer satisfaction factors were correlated with logistics operations, and this correlation was then modeled using the Bowtie method, fault trees, event trees, reliability theory, and the Monte Carlo model. The results show that it is possible to implement a structured model that can be easily put into practice. Using an illustrative case study, it is also possible to prioritize three companies according to their reputational risk as assessed by the proposed model. The developed model can promote the sustainability of collaborative networks in the logistics industry by assessing and consistently reducing reputational risk, thus supporting the strengthening of the relationship between suppliers, logistics service providers, and end customers. Keywords: sustainability; collaborative networks; logistics; transportation sector; risk assessment and management; Monte Carlo method 1. Introduction Collaborative networks in the logistics sector have proven to be a solution that meets the goal of reducing both the environmental footprint and the impact of rising fuel prices on logistics companies, especially for small- and medium-sized enterprises. Despite these benefits, these networks have not received the desired amount of participation due to reputational risk. This fact has in some ways limited the capacity of these collaborative networks and reduced their effectiveness in contributing to the sustainability of societies. Sustainability can be described as a set of strategies to meet the present needs of society without compromising the ability of future generations to meet their own needs [1]. This concern for future generations has grown in recent years as a result of active societal awareness and regulatory initiatives aimed at promoting sustainability. The main fields of action for sustainable development are the reduction in the con- sumption of raw materials and products, the increase in the reusing and recycling of products, and the reduction in waste in the most diverse sectors of industry, especially from energy consumption, which improves natural resources’ sustainability and reduces the carbon footprint [2]. Sustainability 2022, 14, 4329. https://doi.org/10.3390/su14074329 https://www.mdpi.com/journal/sustainability

Welcome message from author
This document is posted to help you gain knowledge. Please leave a comment to let me know what you think about it! Share it to your friends and learn new things together.
Transcript

�����������������
Citation: Anes, V.; Abreu, A.; Dias, A.;
Calado, J. A Reputational-Risk-Based
Match Selection Framework for
Collaborative Networks in the
Logistics Sector. Sustainability 2022,
14, 4329. https://doi.org/10.3390/
su14074329
Academic Editor: Guido Perboli
Received: 21 February 2022
Accepted: 31 March 2022
Published: 6 April 2022
Publisher’s Note: MDPI stays neutral
with regard to jurisdictional claims in
published maps and institutional affil-
iations.
Copyright: © 2022 by the authors.
Licensee MDPI, Basel, Switzerland.
This article is an open access article
distributed under the terms and
conditions of the Creative Commons
Attribution (CC BY) license (https://
creativecommons.org/licenses/by/
4.0/).
sustainability
Article
A Reputational-Risk-Based Match Selection Framework forCollaborative Networks in the Logistics SectorVitor Anes 1,2,3,* , António Abreu 1,2,4 , Ana Dias 1,2 and João Calado 1,2,3
1 Instituto Superior de Engenharia de Lisboa, 1959-007 Lisboa, Portugal; [email protected] (A.A.);[email protected] (A.D.); [email protected] (J.C.)
2 Instituto Politécnico de Lisboa, 1549-020 Lisboa, Portugal3 Instituto de Engenharia Mecânica (IDMEC), Instituto Superior Técnico, Universidade de Lisboa,
1049-001 Lisboa, Portugal4 Centro de Tecnologias e Sistemas (CTS)–Uninova, Faculdade de Ciências e Tecnologia da Universidade Nova
de Lisboa, 2825-149 Caparica, Portugal* Correspondence: [email protected]
Abstract: Collaborative networks in the logistics sector have proven to be a solution that bothmeets environmental footprint reduction goals and addresses the impact of rising fuel prices onlogistics companies, especially for small- and medium-sized enterprises. Despite these benefits, thesecollaborative networks have not received the desired amount of participation due to reputational risk.This paper develops a framework for assessing and managing reputational risk to encourage logisticscompanies’ participation in collaborative networks. To this end, customer satisfaction factors werecorrelated with logistics operations, and this correlation was then modeled using the Bowtie method,fault trees, event trees, reliability theory, and the Monte Carlo model. The results show that it ispossible to implement a structured model that can be easily put into practice. Using an illustrativecase study, it is also possible to prioritize three companies according to their reputational risk asassessed by the proposed model. The developed model can promote the sustainability of collaborativenetworks in the logistics industry by assessing and consistently reducing reputational risk, thussupporting the strengthening of the relationship between suppliers, logistics service providers, andend customers.
Keywords: sustainability; collaborative networks; logistics; transportation sector; risk assessmentand management; Monte Carlo method
1. Introduction
Collaborative networks in the logistics sector have proven to be a solution that meetsthe goal of reducing both the environmental footprint and the impact of rising fuel priceson logistics companies, especially for small- and medium-sized enterprises. Despite thesebenefits, these networks have not received the desired amount of participation due toreputational risk. This fact has in some ways limited the capacity of these collaborativenetworks and reduced their effectiveness in contributing to the sustainability of societies.
Sustainability can be described as a set of strategies to meet the present needs ofsociety without compromising the ability of future generations to meet their own needs [1].This concern for future generations has grown in recent years as a result of active societalawareness and regulatory initiatives aimed at promoting sustainability.
The main fields of action for sustainable development are the reduction in the con-sumption of raw materials and products, the increase in the reusing and recycling ofproducts, and the reduction in waste in the most diverse sectors of industry, especiallyfrom energy consumption, which improves natural resources’ sustainability and reducesthe carbon footprint [2].
Sustainability 2022, 14, 4329. https://doi.org/10.3390/su14074329 https://www.mdpi.com/journal/sustainability

Sustainability 2022, 14, 4329 2 of 24
In fact, the negative impact of excessive energy consumption due to technologicaldevelopment and economic growth is the main cause that led to the creation of variousenvironmental initiatives around the world. These impacts range from global warming tothe environmental burdens of extracting and transporting fossil fuels [3].
To mitigate these impacts, regulators have established standards to reframe industrythinking and strategies, sometimes resulting in additional efforts for companies. Forexample, limiting emissions from internal combustion engines has challenged automakersto develop new, more fuel-efficient and environmentally friendly engines to replace enginemodels that are still in the early stages of their life cycle and have a high level of reliability.This fact has a negative impact on these companies, as the expected life cycle of theengines is shorter than estimated, which reduces the financial return on investment fromdevelopment and production [4].
Another example is taxes on fuels. The tax burden on fuels in Europe varies between50.8% and 66.5% depending on the country and the type of fuel, which are very hightaxes aimed at reducing fuel consumption in order to reduce CO2 emissions. However,these strategies have a negative economic impact on companies, end users, and society ingeneral, so alternative strategies are needed to mitigate or avoid these types of impacts as aresult of regulatory initiatives, especially for small- and medium-sized enterprises (SMEs).These companies play an important role in the economy of societies. In many countries,SMEs represent around 87% of companies, playing a key role in the economy, creatingjobs, promoting economic growth, and contributing significantly to gross domestic product(GDP). However, despite their important role in the economy, these companies have someweaknesses and are very sensitive to market fluctuations and regulatory adjustments. Inaddition to these external factors, SMEs have some internal weaknesses such as difficultiesaccessing financing, a lack of manpower, a lack of efficient management, inadequateinfrastructure, and obsolete technology, among others. Due to the limitations faced by SMEs,support and incentive programs have been created over the last few years to promote thegrowth of these companies by encouraging smart growth (industry 4.0), the implementationof sustainable strategic decisions, and the adoption of inclusive policies [5].
On the one hand, these incentives are intended to support SMEs, but on the otherhand, regulatory initiatives that aim to promote sustainable development create additionalchallenges for these companies. The solution is not to eliminate regulatory initiatives, butinstead to create solutions to overcome these additional challenges.
For example, the transport industry has a major impact on the ecological footprint,contributing heavily to the greenhouse effect, and due to this fact, it is directly affected byregulatory initiatives. The continuous increase in fuel prices and taxes on the acquisitionand maintenance of vehicles has reduced the profit margins of these companies. On theother hand, alternative vehicles powered by electricity or hydrogen still do not offer operatingconditions compatible with the operational needs of this industry. As a result, these companiesare under pressure to reduce their contribution to the ecological footprint, but the existingalternatives are not operationally viable, especially in the land freight sector.
Taking the case of Portugal as an example, small- and medium-sized companies inthe land transport sector represent around 1.6% of Portuguese SMEs with a pre-pandemicturnover of around 7.5 billion euros, according to a Bank of Portugal report published in2020 [6]. According to the same report, when comparing the financial autonomy of SMEs inthe transport sector with other SMEs in Portuguese industry, it can be seen that, over the lastdecade, the ability of these companies to meet their financial commitments through equity(financial autonomy) was always lower than that of SMEs from other sectors, indicatingthat this sector has lower profit margins compared to others.
However, from 2011 to 2017, SMEs in the freight transport sector followed the othersectors in a growing trend towards increased financial autonomy, despite still having alower degree of autonomy. After 2017, this trend diverged significantly; the other sectorscontinued to show a positive growth rate, and the transport sector started to show anegative growth rate. Between 2017 and 2020, the financial autonomy of these companies
Sustainability 2022, 14, 4329 3 of 24
was 29.4% in 2017, 28.6% in 2018, 27.19% in 2019, and 13.14% in 2020, respectively. Theresults for 2020 were the lowest values recorded in the decade 2010–2020. This decrease infinancial autonomy results from the change in the trend of the price of diesel in 2016; since2012, the annual trend in the price of this fuel had been decreasing, but in 2016, this trendwas reversed, moving to a positive price change rate [7].
In practice, the freight transport sector is very sensitive to changes in fuel prices, whichcan jeopardize the survival of small- and medium-sized companies in this sector. Despitethe importance of the freight transport sector for the proper functioning of the economy,government aid to these SMEs in the form of reduced taxes on fuels cannot directly solvethe problem, because, in this way, they would be promoting an increase in the ecologicalfootprint and going against the UN’s 2030 Agenda. This can be considered an industrialproblem with negative impacts both on the sustainability of the sector and on the growth ofthe economy in general. The development of sustainable solutions to eliminate or mitigatethese impacts is of the utmost importance [8].
To solve this logistical problem and reduce operating costs, researchers have proposednew management models based on collaborative approaches which meet one of the 17objectives of the UN, namely the development of partnerships in the implementation of theUN goals. The main objective of these models is to reduce waste in the transport of goods,also known as “empty running” [9,10].
According to the UK Department of Transport, capacity utilization between 2006 and2016 was 68%, and freight transport efficiency was 48%. The same report indicates that“empty running” waste has been gradually increasing. One of the reasons for this increase isthe concern of suppliers for final customer satisfaction. High levels of satisfaction promotecustomer loyalty, and in this sense, suppliers have pressured logistics operators for fasterdeliveries. This in turn promotes “empty running” waste because the time to guarantee the“full running” condition is increasingly reduced [11].
The development of collaborative models in logistics intends to face this problemthrough the creation of virtual companies that manage collaborative logistics networks.These companies aim to manage information related to the participants of the collaborativenetwork by evaluating the available transport space and respective routes, optimizing routeselection according to the logistics mission, and selecting the match between the missionand the logistics operator that results in the best performance of the network.
For these collaborative networks to be efficient, it is necessary that the network has asmany participants as possible, so that the size of the network’s resources has a dimensionthat allows for the sustainability of the network. The problem is that the participation inthese collaborative networks has been relatively low, making it difficult to create coalitions,particularly for small- and medium-sized enterprises, as they are relatively vulnerableto negative impacts; it is because of this that they tend not to adopt strategies of greatuncertainty [12]. These facts have been reinforced by the strong competition verified in thesector; therefore a strong strategy is necessary to promote trust between the participatingentities in the collaborative network, since for the correct functioning of these collaborativenetworks, it is necessary to share sensitive information such as costs, needs, and thecost/benefit ratio, among other information [13]. In this sense, the development of riskanalysis and management models that make it possible to assess and manage uncertaintyin the selection of the match between entities for a given mission is of great importance topromote trust between existing participating entities in the network and to promote theparticipation of new entities in the collaborative network.
This work fills the research gap on collaborative networks in the logistics sector,where reputational risk has negatively affected logistics companies’ participation in thesenetworks. To this end, a model of reputational risk was developed to encourage theparticipation of potential companies in collaborative logistics networks, with a focus onsmall- and medium-sized enterprises to increase the capacity of these networks. This modelaims to evaluate and manage the reliability of the decisions made in selecting the mostsuitable companies for a given task. The selection of the right partner within the network is

Sustainability 2022, 14, 4329 4 of 24
extremely important to minimize the risks for both the participants and the collaborativenetwork. This selection cannot be completed in the same way for all missions. A range ofevents must be considered that vary over time, such as political, social, economic, technical,and financial events. The proposed model is a quantitative model and is developed usingreliability theory along with the Monte Carlo model. The approach to developing themodel focuses on the key risk factors identified based on the typical business models thatare seen in collaborative logistics networks. To illustrate the application of the model, acase study was developed to analyze and discuss the robustness of the model.
2. Literature Review
In this section, a literature review is conducted on two knowledge areas. One focuseson collaborative networks, and the other on risk analysis and management tools. At theend, some risk factors related to collaborative networks are identified and analyzed to beused in the proposed reputational risk model.
2.1. Collaborative Networks
Collaborative networks are organizational systems capable of bringing together indi-viduals and institutions in a participatory manner for related purposes. They are flexiblestructures and are horizontally structured [14]. Originally, they were created with the aimof reducing uncertainty and risk and organizing economic activities through coordinationand cooperation between companies. The implementation of collaborative processes hasaccelerated in recent years due to new business challenges, rapid socioeconomic change,and new developments in information and communication technology [15].
There are different types of collaborative networks, the most common of which aresocial networks that focus on relationships between social entities; virtual organizations,which include a number of independent organizations that share resources and capabilitiesto achieve a common goal; virtual enterprises, which emerge from a temporary alliance oforganizations that share capabilities and resources to respond more efficiently to marketopportunities; agile enterprises, where the organization’s ability to continuously adapt inan environment of unpredictable change results from cooperative strategies; joint ventures,in which several companies temporarily combine into a single entity to jointly carry out aneconomic activity; and finally, the collaborative network of the cluster type, in which thereis a geographical concentration of interrelated companies operating in the same sector andsharing not only the location but also the responsibility for the development of productsand services [16].
For collaborative networks to be successful, they must meet a number of requirementsto ensure network sustainability. In particular, the companies that are part of the networkmust be willing to share information, make synchronized decisions, promote the fairsharing of profits, update and share their capacities, have integration policies, align theirgoals with those of the other companies in the network, plan strategies and objectivestogether, foster trusting relationships, and maintain open and fair communication. All ofthese requirements have a certain level of risk that may negatively affect the companiesthat participate in the network [17].
On the other hand, there are a number of factors that can hinder the effective func-tioning of collaborative networks or jeopardize their sustainability, namely, lack of trust,impersonal and poor relationships, inconsistent business strategies, a mentality limited toprocesses without considering a holistic view, inaccurate information, and poor communi-cation channels. Of these factors, a lack of trust has the greatest impact on the collaborationnetwork, as it strongly encourages network collaborators to leave the network. In the ma-jority of cases, this factor increases the sense of risk regarding the company’s participationin the network [18].
The benefits of membership in collaborative networks depend on the network’s areaof activity. However, there are some benefits that can be considered universal and inde-pendent of the area of activity. For example, belonging to a collaborative network can

Sustainability 2022, 14, 4329 5 of 24
increase the efficiency and effectiveness of the company, promote its expansion, improveits communication, increase the quality of its work processes, increase the reliability ofthe company’s operations, increase its creativity and productivity, and, most importantly,promote the financial profit of the company [19].
The literature is replete with work addressing the inherent risks of collaborative net-works in a variety of domains, such as works promoting sustainable systems related toinnovation in collaborative networks [20], modeling risks related to collaborative networksto determine the likelihood and impact of projects [21], modeling risks related to infor-mation sharing, information management, and knowledge [22], incorporating heuristicmodels to analyze and manage risks in collaborative networks [23], and identifying thebenefits of applying risk models in collaborative networks [24]. Despite the extensiveamount of work in the literature and to the best of the authors’ knowledge, no reputationalrisk model developed for collaborative networks in the logistics sector can be found inthe literature. In this sense, the work developed in this study is innovative and fills aknowledge gap in risk assessment and management of collaborative networks.
2.2. Risk Assessment and Management
According to the International Organization for Standardization’s 31000 standard(ISO 31000), organizations of all types and sizes face internal and external factors that canjeopardize the achievement of their goals and expectations. These factors always have anassociated level of uncertainty and impact, and their aggregate assessment represents theso-called risk that organizations face [25].
Risk assessment aims to support decision making in all activities of an organization.All activities involve a certain level of risk, and its management intends to control thislevel through logical and systematic treatment actions. Although the interpretation andmanagement of risk is an intrinsic human capacity, it is limited when several risk factorsare simultaneously involved in decision making, i.e., aggregate risk assessment requiresthe use of appropriate tools as well as a logical and systematic framework in order to makepossible the correct interpretation of decision making.
Organizations benefit greatly from the application of risk analysis and managementpractices in their most varied activities. For example, it increases the likelihood of achievingtheir objectives, improves the identification of opportunities and threats, improves gover-nance, increases confidence, minimizes losses, improves the efficiency of operations, andso on [26].
Despite the benefits inherent to risk analysis and management methods, their applica-tion to collaborative networks is somehow limited, especially for collaborative networks inlogistics. In the literature, one can find a reasonable number of works related to collabora-tive networks in logistics, but there are few works that include collaborative risk analysisand management as an integral part of their model proposals; in this sense, there is limitedknowledge in this area of investigation.
However, collaborative risk management has begun to gain a modest momentum inthe literature. According to [27], in a time window of 21 years, from 1996 to 2017, 53 articleson collaborative risk management were published outside the scope of supply chain andoperations management, and only 23 focused on this topic, demonstrating a modest growthtrend. The most important research topics covered have been on sharing information,standardization procedures, decision synchronization, incentive alignment, supply chainand process integration, and collaborative system performance.
According to the same authors, and despite the inherent advantages of collaborativerisk assessment and management, a clear and effective definition of collaborative riskmanagement as well as a clear demonstration of its respective advantages is lacking inmost of the works published in this time window; this fact may be at the origin of thetrend found.
Another possible reason could be the fact that collaborative networks are complexsystems whose risk is modeled through the selection of models that best suit the scenario,

Sustainability 2022, 14, 4329 6 of 24
or a tailor-made approach. In this sense, there is no “one-size-fits-all” solution to assess therisk inherent to systems, and this fact may also be at the origin of the aforementioned trend.
In the literature, a wide range of risk assessment and management models can befound alongside strong evidence of their acceptance in academia [28]. These models canbe divided into three broad categories, namely, quantitative models, qualitative models,and mixed models employing both qualitative and quantitative approaches. In practice,quantitative models are more appropriate for scenarios where it is not possible to havestatistical data, while quantitative models need statistical data to be used. Mixed modelstake advantage of the inherent advantages of both approaches. The analysis and riskmanagement of systems, due to its multidisciplinary nature, normally needs to use the threeapproaches to assess the aggregate risk, which increases the complexity of the problem [29].
The most well-known and used qualitative model in the industry is Failure Modeand Effects Analysis, or in short, FMEA. This model was developed by the US Army inthe decade following World War II, the 1950s, and was first developed as a structuredtechnique for failure analysis in order to increase the reliability of military equipment.Nowadays, its application is almost universal, verifying its applicability from the nuclearindustry to health care. Despite this great success, this risk management method has manylimitations inherent in its qualitative nature and inherent to its function of prioritizingfailure modes, also known as the Risk Priority Number (RPN). Its success is due to its easeof being learned and applied to real cases, and many of the limitations pointed out in theliterature are usually overcome through alternative methods [30–32].
On the opposite side, on the side of quantitative models, we have the Monte Carlomodel, which is derived from Buffon’s needle problem as stated in the 18th century. In 1940,Stanislaw Ulam developed the modern version of the Monte Carlo method that makesuse of random experiments to determine the parameters of the statistical distribution thatmodels a given event [33]. The method, like the FMEA, is well known in the industry,with practical applications from finance to the nuclear industry. It has a slower learningcurve and requires prior knowledge of statistics to be used, which is not the case withFMEA. However, this model makes it possible to assess the aggregate risk of a given system,regardless of its complexity.
Another quantitative model widely used in the assessment of aggregate risk is calledFailure Tree Analysis (FTA) [34], a method invented in 1961 at Bell Laboratories. This modelmakes use of the reliability block theory to assess the aggregated probability of systemsfailure. In a similar way, Event Tree Analysis (ETA) [35], another quantitative methodinvented in 1974 during the WASH-1400 nuclear power plant safety study, assesses theprobability of a given impact considering all possible paths that lead to that impact.
These models seem similar but have different paradigms: fault tree analysis charac-terizes the system from the perspective of preventing a given event from occurring, whileevent tree analysis characterizes the system from the perspective of avoiding impacts giventhat an event has already occurred.
In practice, these two methods have been used together as a way to assess the aggregaterisk of systems through the Bowtie model [36]. This model is a diagram that establishes arelationship between basic events and the impacts of the respective top event. It takes intoaccount prevention and mitigation barriers, and because of that, it is one of the most robustframeworks for risk assessment and management.
An example of a risk assessment and management tool that allows the assessmentof aggregate risk through a mixed approach (quantitative and qualitative) is the fuzzylogic method [37]. This method began to be studied in 1920 by the authors Lukassiewiczand Tarski and was later introduced in the literature in 1965 by Lotfi Zadeh. It uses thehuman interpretive paradigm to model the behavior of systems. It uses linguistic variables,membership functions, and rules of inference, evaluated qualitatively, to infer about thesystem’s outputs as a result of the aggregated contribution of each system component.It is a method that has proven itself in the most varied areas of industry, from artificialintelligence to medical decision making.

Sustainability 2022, 14, 4329 7 of 24
2.3. Risk Factors in Logistics
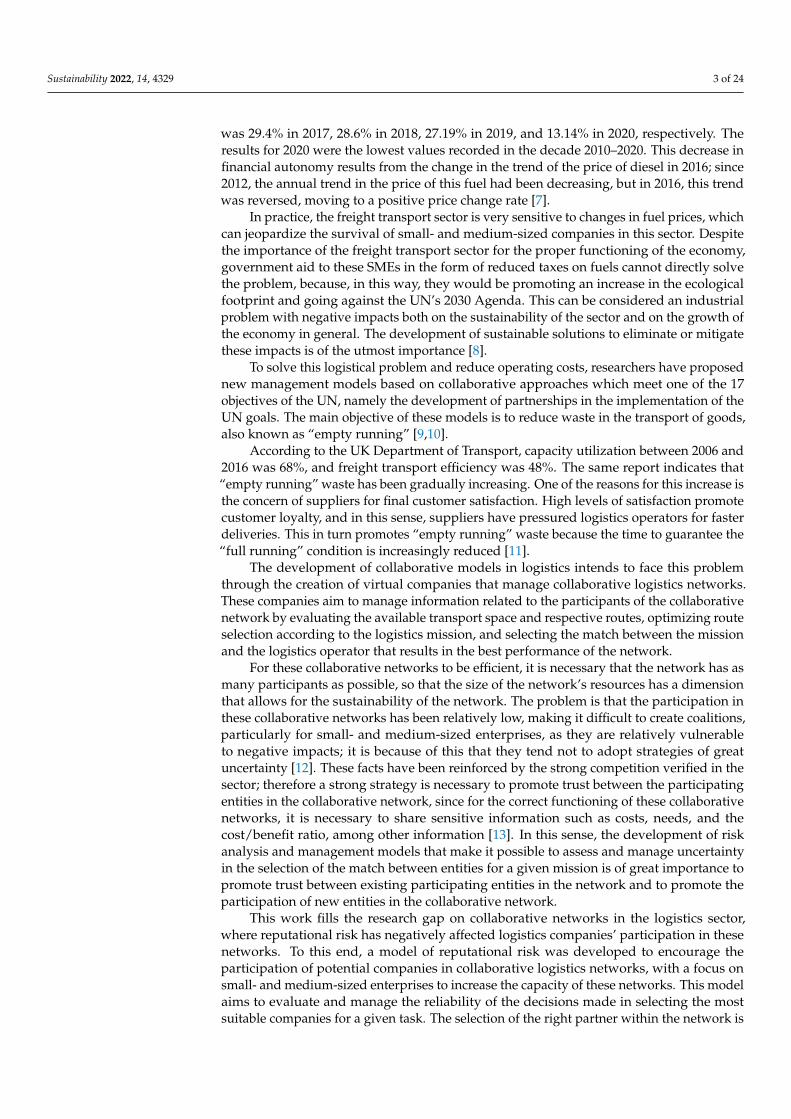
The literature mentions that participation in collaborative networks in the field oflogistics has had little appeal due to uncertainty about the quality of the services providedby network operators [38]. This uncertainty results, in part, from the lack of indicatorsshowing the quality level of operators. In collaborative networks, the choice of a particularoperator for a given logistical task is essentially based on operational parameters such ascost and time [39]. However, this strategy does not take into account the fundamentalconcerns of the companies that need the logistics service and of the companies that providethe logistics services. Figure 1 shows several factors that cause concern among logisticscompanies. These results show that reputational damage and third-party responsibility inthe provision of logistics services are two factors of real concern for companies and play animportant role in their decisions.
Sustainability 2022, 14, x FOR PEER REVIEW 7 of 25
It takes into account prevention and mitigation barriers, and because of that, it is one of the most robust frameworks for risk assessment and management.
An example of a risk assessment and management tool that allows the assessment of aggregate risk through a mixed approach (quantitative and qualitative) is the fuzzy logic method [37]. This method began to be studied in 1920 by the authors Lukassiewicz and Tarski and was later introduced in the literature in 1965 by Lotfi Zadeh. It uses the human interpretive paradigm to model the behavior of systems. It uses linguistic variables, membership functions, and rules of inference, evaluated qualitatively, to infer about the system’s outputs as a result of the aggregated contribution of each system component. It is a method that has proven itself in the most varied areas of industry, from artificial intelligence to medical decision making.
2.3. Risk Factors in Logistics The literature mentions that participation in collaborative networks in the field of
logistics has had little appeal due to uncertainty about the quality of the services provided by network operators [38]. This uncertainty results, in part, from the lack of indicators showing the quality level of operators. In collaborative networks, the choice of a particular operator for a given logistical task is essentially based on operational parameters such as cost and time [39]. However, this strategy does not take into account the fundamental concerns of the companies that need the logistics service and of the companies that provide the logistics services. Figure 1 shows several factors that cause concern among logistics companies. These results show that reputational damage and third-party responsibility in the provision of logistics services are two factors of real concern for companies and play an important role in their decisions.
Figure 1. Risk factors identified by logistics companies and their respective weightings, evaluated according to their impact on the companies’ objectives, with information gathered from [40].
In a sense, these two factors can be combined, because the lack of third-party liability affects the reputation of the company that contracts other companies. In this way, the sum of the liability factor and the reputational damage factor results in a factor with the highest weight among the factors shown in Figure 1.
The impact on reputation extends to very different areas of logistics, as Figure 2 summarizes. In this sense, the assessment of reputational risk becomes essential for the decision making of companies in their interactions with third-party companies and also for the assessment of the quality of the services provided by the company itself.
Figure 1. Risk factors identified by logistics companies and their respective weightings, evaluatedaccording to their impact on the companies’ objectives, with information gathered from [40].
In a sense, these two factors can be combined, because the lack of third-party liabilityaffects the reputation of the company that contracts other companies. In this way, the sumof the liability factor and the reputational damage factor results in a factor with the highestweight among the factors shown in Figure 1.
The impact on reputation extends to very different areas of logistics, as Figure 2summarizes. In this sense, the assessment of reputational risk becomes essential for thedecision making of companies in their interactions with third-party companies and also forthe assessment of the quality of the services provided by the company itself.
Sustainability 2022, 14, x FOR PEER REVIEW 8 of 25
Figure 2. Logistic risk areas.
In this sense, it is important to develop a model for assessing reputational risk in order to support decision making and to promote the participation of companies in collaborative networks. The benefits of such participation are widely discussed in the literature and have been shown to be positive in practice [41]. However, the participation of small- and medium-sized enterprises in collaborative logistics networks is low, despite the benefits that can result from such participation. In this work, we intend to develop a reputational risk assessment framework to reduce uncertainty in the participation of small- and medium-sized enterprises in collaborative logistics networks. The expected outcome of applying the framework is an increase in the number of participants in collaborative logistics networks as well as the further participation of companies that are already part of the network.
3. Research Methodology This section presents the step-by-step process for developing the proposed
reputational risk model.
3.1. Collaborative Networks in Logistics and Their Relationship with Reputational Risk Several business models for collaborative logistics networks have been proposed in
the literature [42]. Essentially, in its most general form, a network is managed by a virtual enterprise that manages the information provided by its participants. The virtual enterprise is responsible for ensuring the security and confidentiality of this information. It is also responsible for selecting the most appropriate network participant for a given logistics mission. Logistics missions can be brought to the network in two ways: first, by external customers who need the service; and second, by network participants who have a service order from their customers and offer this order to other network operators for execution. Figure 3 illustrates, in simplified form, the functional system of a collaborative network in logistics. The demand party asks the supplier to deliver goods via a logistics service provider selected by the virtual company responsible for managing the collaborative network.
Figure 2. Logistic risk areas.
In this sense, it is important to develop a model for assessing reputational risk in orderto support decision making and to promote the participation of companies in collaborative

Sustainability 2022, 14, 4329 8 of 24
networks. The benefits of such participation are widely discussed in the literature andhave been shown to be positive in practice [41]. However, the participation of small- andmedium-sized enterprises in collaborative logistics networks is low, despite the benefitsthat can result from such participation. In this work, we intend to develop a reputationalrisk assessment framework to reduce uncertainty in the participation of small- and medium-sized enterprises in collaborative logistics networks. The expected outcome of applying theframework is an increase in the number of participants in collaborative logistics networksas well as the further participation of companies that are already part of the network.
3. Research Methodology
This section presents the step-by-step process for developing the proposed reputationalrisk model.
3.1. Collaborative Networks in Logistics and Their Relationship with Reputational Risk
Several business models for collaborative logistics networks have been proposed inthe literature [42]. Essentially, in its most general form, a network is managed by a virtualenterprise that manages the information provided by its participants. The virtual enterpriseis responsible for ensuring the security and confidentiality of this information. It is alsoresponsible for selecting the most appropriate network participant for a given logistics mission.Logistics missions can be brought to the network in two ways: first, by external customerswho need the service; and second, by network participants who have a service order from theircustomers and offer this order to other network operators for execution. Figure 3 illustrates,in simplified form, the functional system of a collaborative network in logistics. The demandparty asks the supplier to deliver goods via a logistics service provider selected by the virtualcompany responsible for managing the collaborative network.
Sustainability 2022, 14, x FOR PEER REVIEW 9 of 25
Figure 3. Collaborative network in logistics.
The relationship between the customer and the company that supplies the goods is strongly influenced by a number of factors that may or may not promote the continuity of this relationship. The most important factors are customer satisfaction, the trust that the supplier conveys to the customer, the loyalty between the supplier and the customer, the communication of feedback, and the publicity that customers give about the supplier. In general, these factors can be negatively affected by the services offered by the collaborative network. For example, customer satisfaction can be affected by delivery delays or the loss of goods during the logistics mission. If the logistics company does not report delays efficiently and does not have alternative mechanisms to mitigate these delays, or does not quickly recover lost goods, the customer may decide to switch suppliers. Although the supplier is not to blame for the poor logistics service, the negative impact is ultimately attributed to the supplier. After all, the supplier is responsible for selecting the logistics company that will deliver the product, and it is also responsible for assessing the quality of the transportation and delivery service that it offers to its customers. In this way, the supplier is ultimately strongly influenced by the quality of the services provided by the logistics company.
On the other hand, logistics companies with a loyal customer portfolio based on a history of trust and a high level of satisfaction find it difficult to outsource logistics tasks to third parties whose quality level is uncertain. For these logistics companies, the impact of negative third-party performances could also negatively affect their customer portfolio and threaten their survival as a business. Indeed, reputational risk has a transversal scope, with implications for the suppliers’ and customers’ sides as well as the logistics companies’ side, and ultimately for the sustainability of the collaborative network. In this sense, the framework developed in this work to assess reputational risk responds to a real need that exists in the practice of managing collaborative networks in logistics.
3.2. Proposed Approach The approach taken in developing the reputational risk assessment framework
begins by identifying the key drivers of customer satisfaction with respect to logistics
Figure 3. Collaborative network in logistics.
The relationship between the customer and the company that supplies the goods isstrongly influenced by a number of factors that may or may not promote the continuity ofthis relationship. The most important factors are customer satisfaction, the trust that thesupplier conveys to the customer, the loyalty between the supplier and the customer, the

Sustainability 2022, 14, 4329 9 of 24
communication of feedback, and the publicity that customers give about the supplier. Ingeneral, these factors can be negatively affected by the services offered by the collaborativenetwork. For example, customer satisfaction can be affected by delivery delays or theloss of goods during the logistics mission. If the logistics company does not report delaysefficiently and does not have alternative mechanisms to mitigate these delays, or does notquickly recover lost goods, the customer may decide to switch suppliers. Although thesupplier is not to blame for the poor logistics service, the negative impact is ultimatelyattributed to the supplier. After all, the supplier is responsible for selecting the logisticscompany that will deliver the product, and it is also responsible for assessing the qualityof the transportation and delivery service that it offers to its customers. In this way, thesupplier is ultimately strongly influenced by the quality of the services provided by thelogistics company.
On the other hand, logistics companies with a loyal customer portfolio based on ahistory of trust and a high level of satisfaction find it difficult to outsource logistics tasksto third parties whose quality level is uncertain. For these logistics companies, the impactof negative third-party performances could also negatively affect their customer portfolioand threaten their survival as a business. Indeed, reputational risk has a transversal scope,with implications for the suppliers’ and customers’ sides as well as the logistics companies’side, and ultimately for the sustainability of the collaborative network. In this sense, theframework developed in this work to assess reputational risk responds to a real need thatexists in the practice of managing collaborative networks in logistics.
3.2. Proposed Approach
The approach taken in developing the reputational risk assessment framework beginsby identifying the key drivers of customer satisfaction with respect to logistics services. Itthen identifies the logistics operations that may negatively impact these factors in someway. The next step is to examine the causal relationship between the customer satisfactionfactors and logistics operations and determine the impact of each logistics operation oncustomer satisfaction. The causal relationship is modeled with the Bowtie method using thefault tree and event tree methods, and reliability theory is used to determine the aggregatereputational risk. Finally, the Monte Carlo method is used to prioritize companies basedon their reputational risk. Figure 4 shows the diagram illustrating the approach used indeveloping the framework.
Sustainability 2022, 14, x FOR PEER REVIEW 10 of 25
services. It then identifies the logistics operations that may negatively impact these factors in some way. The next step is to examine the causal relationship between the customer satisfaction factors and logistics operations and determine the impact of each logistics operation on customer satisfaction. The causal relationship is modeled with the Bowtie method using the fault tree and event tree methods, and reliability theory is used to determine the aggregate reputational risk. Finally, the Monte Carlo method is used to prioritize companies based on their reputational risk. Figure 4 shows the diagram illustrating the approach used in developing the framework.
Figure 4. Main steps of the implemented framework to prioritize logistics companies according to their reputational risk.
3.2.1. Framework Step 1—Identifying the Most Important Factors for Customer Satisfaction
The factors that have the greatest impact on customer satisfaction while still being sensitive to logistics operations were identified through a literature review [43–47]. Eleven factors were identified, which were divided into four categories, namely, information service, customer service, distribution service, and cross-border service. In the information service category, the factors of transparency, security, and customization of information were identified. These factors strengthen customer trust and loyalty.
In the distribution service category, the following factors were identified: accuracy, compliance with estimated delivery times, and the safety of transported goods (securing goods against theft). This category is directly related to the logistics services provided by the collaborative network and is sensitive to the level of quality in the provision of logistics services by the network collaborator. In the category of cross-border services, the factors international services and international relations were identified. This category refers to the ability of the logistics company to protect the interests of their customer.
Finally, in the customer service category, the factors of error correction, packaging (protecting goods against accidents), and value-added services were identified. This category refers to customer loyalty and customer recovery. Figure 5 shows the 4 categories mentioned above as well as the 11 factors distributed among the respective categories.
Figure 4. Main steps of the implemented framework to prioritize logistics companies according totheir reputational risk.
3.2.1. Framework Step 1—Identifying the Most Important Factors for Customer Satisfaction
The factors that have the greatest impact on customer satisfaction while still beingsensitive to logistics operations were identified through a literature review [43–47]. Elevenfactors were identified, which were divided into four categories, namely, informationservice, customer service, distribution service, and cross-border service. In the information

Sustainability 2022, 14, 4329 10 of 24
service category, the factors of transparency, security, and customization of informationwere identified. These factors strengthen customer trust and loyalty.
In the distribution service category, the following factors were identified: accuracy,compliance with estimated delivery times, and the safety of transported goods (securinggoods against theft). This category is directly related to the logistics services provided bythe collaborative network and is sensitive to the level of quality in the provision of logisticsservices by the network collaborator. In the category of cross-border services, the factorsinternational services and international relations were identified. This category refers tothe ability of the logistics company to protect the interests of their customer.
Finally, in the customer service category, the factors of error correction, packaging(protecting goods against accidents), and value-added services were identified. Thiscategory refers to customer loyalty and customer recovery. Figure 5 shows the 4 categoriesmentioned above as well as the 11 factors distributed among the respective categories.
Sustainability 2022, 14, x FOR PEER REVIEW 11 of 25
Figure 5. Customer satisfaction factors that may be affected by logistics services.
3.2.2. Framework Step 2—Identify the Logistics Operations That Impact Customer Satisfaction
Similar to the identification of customer satisfaction factors, bibliographic research was also conducted to identify the logistics operations that may negatively affect the customer. The identified operations were classified into three categories, namely, order processing, warehousing and transportation [43–47].
In the order processing category, order processing (the process or workflow that occurs after a customer places an order), management (the process of entering, tracking, and fulfilling customer orders), and post-processing (the management of customer information and services provided for a particular logistics mission) were identified. This category refers to the interaction with customers, i.e., the end customer and the supplier. In the warehousing category, the operations of storage, handling (the loading and unloading of cargo within the warehouse), picking, and packaging were identified. This category is related to the integrity of the transported products and the reliability of the logistics company. Finally, in the transport category, the operations for loading, transport, and delivery were identified. This category is related to the quality of transport and delivery services. Figure 6 shows a schematic representation of the three categories of logistics operations and their respective processes.
Figure 6. Logistic operations that may create negative impacts on customer satisfaction.
Figure 5. Customer satisfaction factors that may be affected by logistics services.
3.2.2. Framework Step 2—Identify the Logistics Operations That Impact Customer Satisfaction
Similar to the identification of customer satisfaction factors, bibliographic research wasalso conducted to identify the logistics operations that may negatively affect the customer.The identified operations were classified into three categories, namely, order processing,warehousing and transportation [43–47].
In the order processing category, order processing (the process or workflow that occursafter a customer places an order), management (the process of entering, tracking, andfulfilling customer orders), and post-processing (the management of customer informationand services provided for a particular logistics mission) were identified. This categoryrefers to the interaction with customers, i.e., the end customer and the supplier. In thewarehousing category, the operations of storage, handling (the loading and unloadingof cargo within the warehouse), picking, and packaging were identified. This categoryis related to the integrity of the transported products and the reliability of the logisticscompany. Finally, in the transport category, the operations for loading, transport, anddelivery were identified. This category is related to the quality of transport and deliveryservices. Figure 6 shows a schematic representation of the three categories of logisticsoperations and their respective processes.

Sustainability 2022, 14, 4329 11 of 24
Sustainability 2022, 14, x FOR PEER REVIEW 11 of 25
Figure 5. Customer satisfaction factors that may be affected by logistics services.
3.2.2. Framework Step 2—Identify the Logistics Operations That Impact Customer Satisfaction
Similar to the identification of customer satisfaction factors, bibliographic research was also conducted to identify the logistics operations that may negatively affect the customer. The identified operations were classified into three categories, namely, order processing, warehousing and transportation [43–47].
In the order processing category, order processing (the process or workflow that occurs after a customer places an order), management (the process of entering, tracking, and fulfilling customer orders), and post-processing (the management of customer information and services provided for a particular logistics mission) were identified. This category refers to the interaction with customers, i.e., the end customer and the supplier. In the warehousing category, the operations of storage, handling (the loading and unloading of cargo within the warehouse), picking, and packaging were identified. This category is related to the integrity of the transported products and the reliability of the logistics company. Finally, in the transport category, the operations for loading, transport, and delivery were identified. This category is related to the quality of transport and delivery services. Figure 6 shows a schematic representation of the three categories of logistics operations and their respective processes.
Figure 6. Logistic operations that may create negative impacts on customer satisfaction.
Figure 6. Logistic operations that may create negative impacts on customer satisfaction.
3.2.3. Framework Step 3—Identifying Causal Relationships between Customer Satisfactionand Logistics Operations
Having identified customer satisfaction factors and their associated logistics oper-ations, the next step is to determine the causal relationship between these factors andlogistics operations. Table 1 presents this relationship in the form of a matrix. The causalrelationship was determined through an inferential analysis, together with the logicalconclusions and appropriate consequences.
The service processing of logistics operations (OP1) can negatively impact customersatisfaction in the categories of service quality (SQ), distribution quality (SDQ), and cross-border service quality (CBSQ). It can have a negative impact on the transparency of infor-mation (SQ1), the correctness of operations (DSQ1), and also on the measures required forcross-border legal processing (CBSQ2).
Service order management in logistics (OP2) has a direct impact on the security ofcustomer information (SQ2), on the accuracy of logistics operations (DSQ1), on the timelydelivery of goods (DSQ3), and also on cross-border operations (CBSQ2). Poorly managedservice orders can lead to the disclosure of customer information and also cause delays inlogistics processes at home and abroad.
Post-processing (OP3) affects all factors in the SQ and CBSQ categories. It also affectsthe customer service (CSQ2) and value-added (CSQ3) factors.
When analyzing the storage category (WH), it was found that storage can negativelyaffect the accuracy of logistics services (DSQ1) and the safety of goods (DSQ2). Handlingcan also affect the safety of the goods (DSQ2). The process of selecting goods can negativelyaffect the factors of accuracy (DSQ1) and packaging (CSQ1). Finally, packaging logisticsmay affect the packaging satisfaction factor (CSQ1).
In the last category of logistics operations (T), shown in Table 1, it was found thatthe logistics operation of loading (T1) can negatively affect the accuracy of operations(DSQ1) and the safety of transported goods (DSQ2). On the other hand, the transportationoperation (T2) can negatively affect the timely delivery of the goods (DSQ3). Finally, thedelivery operation (T3) may negatively affect the safety of the delivered goods (DSQ2).

Sustainability 2022, 14, 4329 12 of 24
Table 1. Causal relationships in matrix form between customer satisfaction and logistics operations.
Service Quality (SQ) Distribution Service Quality (DSQ) Customer Service Quality (CSQ) Cross-Border Service Quality(CBSQ)
(SQ1)Information
Transparency
(SQ2)Consumer
InformationSecurity
(SQ3) Logisticsand Customs
Information Level(DSQ1)
Accuracy(DSQ2) Safety
of Goods(DSQ3)
On-TimeDeliveries
(CSQ1)“fedex”Packing
(CSQ2)Error
Handling
(CSQ3)Value-Added
Services
(CBSQ1)International
LogisticsServices
(CBSQ2)Policy andRegulatory
Level
Orderprocessing
(OP)
(OP1) OrderProcessing OP1-SQ1 OP1-DSQ1 OP1-CBSQ2
(OP2) OrderManagement OP2-SQ2 OP2-DSQ1 OP2-DSQ3 OP2-CBSQ2
(OP3) Postprocessing order
handlingOP3-SQ1 OP3-SQ2 OP3-SQ3 OP3-CSQ2 OP3-CSQ3 OP3-CBSQ1 OP3-CBSQ2
WareHousing(WH)
(WH1) Storage WH1-DSQ1 WH1-DSQ2(WH2) Handling WH2-DSQ2(WH3) Picking WH3-DSQ1 WH3-CSQ1
(WH4) Packaging WH4-CSQ1
Transport(T)
(T1) Loading T1-DSQ1 T1-DSQ2(T2) Transport T2-DSQ3(T3) Delivery T3-DSQ2

Sustainability 2022, 14, 4329 13 of 24
3.2.4. Framework Step 4—Impact Score of Individual Logistics Operations onCustomer Satisfaction
The basic definition of risk states that the magnitude of the impact of a given eventmust be determined and then related to its corresponding probability in order to evaluatethe risk of that event [25]. In this sense, Table 2 shows the degree of impact that eachlogistics operation has on the different categories of customer satisfaction. These valueswere assigned qualitatively on a scale of 1 to 3.
Table 2. Impact scores of individual logistics operations on customer satisfaction.
Area Item Score
CustomerSatisfaction
Information service qualityInformation Transparency 2
Consumer information security 3Logistics and customs information level 1
Distribution service qualityAccuracy 2
safety of goods 3on-time deliveries 3
Customer service qualityfedex packing 2Error handling 3
Value-added services 1
Cross-border service quality International logistics services 3Policy and regulatory level 2
3.2.5. Framework Step 5—Modeling Reputational Risk with Bowtie, Event Trees, FaultTrees, and Reliability Theory
In this step, the causal relationship shown in Table 1 is represented by Bowtie diagramsfor each of the 10 logistics operations listed in the second column of Table 1. Figures 7–9show the 10-operation bowtie schematically, considering the above causal relationship. Foreach bowtie, expressions of the risk associated with each logistics operation are generatedconsidering the impact values presented in Table 2 and the overall probability determinedby the methods of fault trees, event trees, and reliability theory.
Each bowtie starts with the probability of failure for a given logistics operation, andthen the probability of failure for the prevention barriers is considered. The purpose ofthese barriers is to prevent a failure in the logistics operation from leading to an eventwith a negative impact on customer satisfaction. The evaluation of the probability that anevent with a negative impact on customer satisfaction will occur is evaluated using thefault tree method and reliability theory. If the prevention barrier cannot prevent this eventfrom occurring, then the mitigation barriers can mitigate or even eliminate this impact.These barriers also have a probability of failure and must be included in the overall riskassessment of each bowtie, where the probability of the event occurring is considered alongwith the event tree method and reliability theory to assess the overall risk of each bowtie.
Equation (1) represents the aggregate risk of logistics operations in the order process-ing category (OP). This equation is made up of three components. The first componentrepresents the aggregate risk of logistics operation OP1, the second component representsthe aggregate risk of logistics operation OP2, and the last component represents the aggre-gate risk of logistics operation OP3. The aggregated risk of the category OP results fromthe sum of these three components.
OPrisk =
PFOP1 · PPB_OP1 ·(
PMB_SQ1 · ISQ1_score + PMB_DSQ1 · IDSQ1_score + PMB_CBSQ2 · ICBSQ2_score)
+PFOP2 · PPB_OP2 ·
(PMB_SQ2 · ISQ2_score + PMB_DSQ1 · IDSQ1_score + PMB_DSQ3 · IDSQ3_score + PMB_CBSQ2 · ICBSQ2_score
)+
PFOP3 · PPB_OP3 ·(
PMB_SQ1 · ISQ1_score + PMB_SQ2 · ISQ2_score + PMB_SQ3 · ISQ3_score + PMB_CSQ2 · ICSQ2_score+PMB_CSQ3 · ICSQ3_score + PMB_CBSQ1 · ICBSQ1_score + PMB_CBSQ2 · ICBSQ2_score
)(1)

Sustainability 2022, 14, 4329 14 of 24Sustainability 2022, 14, x FOR PEER REVIEW 15 of 25
Figure 7. Bowtie diagrams for the processing order category. PB stands for preventive barrier, and MB stands for mitigation barrier.
Equation (1) represents the aggregate risk of logistics operations in the order processing category (OP). This equation is made up of three components. The first component represents the aggregate risk of logistics operation OP1, the second component represents the aggregate risk of logistics operation OP2, and the last component represents the aggregate risk of logistics operation OP3. The aggregated risk of the category OP results from the sum of these three components.
Figure 7. Bowtie diagrams for the processing order category. PB stands for preventive barrier, andMB stands for mitigation barrier.
Figure 8 shows the four bowties developed for the warehouse category, and Equation (2)represents the overall risk for this category. Similar to what is described in Equation (1),Equation (2) is composed of four components that represent the aggregate risk of the fourbowties developed for this category. In this sense, the first component represents theaggregate risk of the storage operation, the second component represents the aggregaterisk of the handling operation, the third component represents the aggregate risk of thepicking operation, and finally, the fourth component represents the aggregate risk of thepackaging operation. The total risk of the warehouse category is also the result of addingtogether these four components.

Sustainability 2022, 14, 4329 15 of 24
Sustainability 2022, 14, x FOR PEER REVIEW 16 of 25
( )
( )
1 _ 1 _ 1 1_ _ 1 1_ _ 2 2 _
2 _ 2 _ 2 2 _ _ 1 1_ _ 3 3_ _ 2 2 _
3 _ 3 _
FOP PB OP MB SQ SQ score MB DSQ DSQ score MB CBSQ CBSQ score
FOP PB OP MB SQ SQ score MB DSQ DSQ score MB DSQ DSQ score MB CBSQ CBSQ score
risk
FOP PB OP MB
P P P I P I P I
P P P I P I P I P IOP
P P P
⋅ ⋅ ⋅ + ⋅ + ⋅
+
⋅ ⋅ ⋅ + ⋅ + ⋅ + ⋅=
+
⋅ ⋅ ()
1 1_ _ 2 2 _ _ 3 3_ _ 2 2 _
_ 3 3_ _ 1 1_ _ 2 2 _
SQ SQ score MB SQ SQ score MB SQ SQ score MB CSQ CSQ score
MB CSQ CSQ score MB CBSQ CBSQ score MB CBSQ CBSQ score
I P I P I P I
P I P I P I
⋅ + ⋅ + ⋅ + ⋅ +
+ ⋅ + ⋅ + ⋅
(1)
Figure 8 shows the four bowties developed for the warehouse category, and Equation (2) represents the overall risk for this category. Similar to what is described in Equation (1), Equation (2) is composed of four components that represent the aggregate risk of the four bowties developed for this category. In this sense, the first component represents the aggregate risk of the storage operation, the second component represents the aggregate risk of the handling operation, the third component represents the aggregate risk of the picking operation, and finally, the fourth component represents the aggregate risk of the packaging operation. The total risk of the warehouse category is also the result of adding together these four components.
Figure 8. Bowtie diagrams for the warehousing category. PB stands for preventive barrier, and MB stands for mitigation barrier.
Figure 8. Bowtie diagrams for the warehousing category. PB stands for preventive barrier, and MBstands for mitigation barrier.
Sustainability 2022, 14, x FOR PEER REVIEW 17 of 25
( )
( )
1 _ 1 _ 1 1_ _ 2 2 _
2 _ 2 _ 2 2 _
3 _ 3 _ 1 1_ _ 1 1_
4 _ 4 _ 1 1_
FWH PB WH MB DSQ DSQ score MB DSQ DSQ score
FWH PB WH MB DSQ DSQ score
risk
FWH PB WH MB DSQ DSQ score MB CSQ CSQ score
FWH PB WH MB CSQ CSQ score
P P P I P I
P P P IWH
P P P I P I
P P P I
⋅ ⋅ ⋅ + ⋅
+⋅ ⋅ ⋅
+=
⋅ ⋅ ⋅ + ⋅
+⋅ ⋅ ⋅
(2)
Figure 9 shows the bowtie schematically when referring to the transport category, and Equation (3) represents the aggregate risk of this category. Similar to the previous two categories, this equation is composed of three aggregate risk components: the first for loading logistics, the second for transportation, and the third for delivery. The aggregate risk of this category is the sum of these three components.
Figure 9. Bowtie diagrams for the transport category. PB stands for preventive barrier, and MB stands for mitigation barrier.
( )1 _ 1 _ 1 1_ _ 2 2 _
2 _ 2 _ 3 3_
3 _ 3 _ 2 2 _
FT PB T MB DSQ DSQ score MB DSQ DSQ score
risk FT PB T MB DSQ DSQ score
FT PB T MB DSQ DSQ score
P P P I P I
T P P P I
P P P I
⋅ ⋅ ⋅ + ⋅
+= ⋅ ⋅ ⋅
+⋅ ⋅ ⋅
(3)
The terms used in Expressions 1 through 3 are a combination of the terms listed in Table 1 and the terms “PB” and “MB”, which stand for preventive barrier and mitigating barrier, respectively. The combination of these terms can be found in Figures 7–9. These combinations of terms are presented in Equations (1)–(3) for two situations: first, to indicate the probability of failure of a particular logistics operation, and second, to indicate the impact defined in Table 2. For example, PFOP2 represents the failure probability of “(2) Order Management” (see Table 1), PPB_OP2 represents the failure probability of the preventive barriers of “(2) Order Management”, and ISQ2_score represents the corresponding impact specified in Table 2 for “(2) Consumer Information Security”.
After evaluating the aggregate risk of logistics operations according to each category, it is possible to evaluate the reputational risk of the company providing logistics services
Figure 9. Bowtie diagrams for the transport category. PB stands for preventive barrier, and MB standsfor mitigation barrier.
WHrisk =
PFWH1 · PPB_WH1 ·(
PMB_DSQ1 · IDSQ1_score + PMB_DSQ2 · IDSQ2_score)
+PFWH2 · PPB_WH2 · PMB_DSQ2 · IDSQ2_score
+PFWH3 · PPB_WH3 ·
(PMB_DSQ1 · IDSQ1_score + PMB_CSQ1 · ICSQ1_score
)+
PFWH4 · PPB_WH4 · PMB_CSQ1 · ICSQ1_score
(2)

Sustainability 2022, 14, 4329 16 of 24
Figure 9 shows the bowtie schematically when referring to the transport category,and Equation (3) represents the aggregate risk of this category. Similar to the previoustwo categories, this equation is composed of three aggregate risk components: the first forloading logistics, the second for transportation, and the third for delivery. The aggregaterisk of this category is the sum of these three components.
Trisk =
PFT1 · PPB_T1 ·(
PMB_DSQ1 · IDSQ1_score + PMB_DSQ2 · IDSQ2_score)
+PFT2 · PPB_T2 · PMB_DSQ3 · IDSQ3_score
+PFT3 · PPB_T3 · PMB_DSQ2 · IDSQ2_score
(3)
The terms used in Expressions 1 through 3 are a combination of the terms listed inTable 1 and the terms “PB” and “MB”, which stand for preventive barrier and mitigatingbarrier, respectively. The combination of these terms can be found in Figures 7–9. Thesecombinations of terms are presented in Equations (1)–(3) for two situations: first, to indicatethe probability of failure of a particular logistics operation, and second, to indicate theimpact defined in Table 2. For example, PFOP2 represents the failure probability of “(2) OrderManagement” (see Table 1), PPB_OP2 represents the failure probability of the preventivebarriers of “(2) Order Management”, and ISQ2_score represents the corresponding impactspecified in Table 2 for “(2) Consumer Information Security”.
After evaluating the aggregate risk of logistics operations according to each category,it is possible to evaluate the reputational risk of the company providing logistics servicesusing Equation (4). Here, the reputational risk is the sum of the aggregated risks for thecategories of order processing, warehousing, and transportation.
Riskreputation = OPrisk + WHrisk + Trisk (4)
3.2.6. Framework Step 6—Prioritization according to Reputational Risk Using the MonteCarlo Method
The previous steps presented the proposed framework for assessing reputational riskbased on customer satisfaction factors and logistics operations. For each of the operations,the overall risk was determined by the probabilities of failure for each logistics operation, sothe reputational risk evaluated by Equation (4) is highly dependent on these probabilities.
In practice, however, these probabilities may vary depending on the assumptionsused to evaluate these same probabilities. To account for these variations when assessingreputational risk, the failure probabilities of the logistics operations and the prevention andmitigation barriers are represented by their expected value (average value, µ) and theirrespective variance (σ).
To evaluate the reputational risk taking into account this variance, the Monte Carlomethod is used. In this method, the failure probabilities of the individual logistics oper-ations fluctuate randomly around their mean value, which corresponds to the effect ofthe respective variance in each simulation. In this sense, to evaluate reputational risk, alarge number of simulations are performed for Equation (4) to obtain the average value ofthe reputational risk and the corresponding variance. This result is later used to prioritizecompanies according to their reputational risk. This prioritization is performed by pairwisecomparison, considering the probability that the average value of reputational risk for onecompany is higher than the average value for the other company. After this comparisonis made between all the companies, the company with the lowest probability is selectedbecause it is the company with the lowest reputational risk.
4. Illustrative Case Study, Results and Discussion
To illustrate the applicability of the proposed model, the case study of three freighttransportation companies, Companies A, B, and C, operating within a collaborative logisticsnetwork was considered. The purpose of this case study is to evaluate the reputational risk

Sustainability 2022, 14, 4329 17 of 24
of each of these three companies and prioritize them according to this risk. The companywith the lowest risk in terms of customer satisfaction is selected as a candidate for thelogistics mission under study. In practice, this prioritization is taken into account whenselecting the company, along with other selection parameters such as the cost and timerequired for the logistics operation.
The first step in applying the model is to evaluate the probabilities of failure ineach company’s logistical processes. The initial values of these probabilities are obtainedthrough questionnaires given to the company by using fuzzy logic frameworks and arelater updated through satisfaction surveys of the collaborative network’s customers. Table 3shows the failure probabilities for the three companies according to the logistical processesalready identified. It also shows the failure probabilities of the prevention barriers thateach company has in each logistical process. These results are the first public results fromthe companies’ surveys. The value µ represents the average probability of failure and thestandard deviation σ represents the variance of this probability, which is used to account forthe uncertainty about the assumptions used to evaluate the average value of the probability.
Table 4 shows the probability of failure of the barriers designed to mitigate or eliminatenegative impacts on the elements indicated in the first column of Table 4. Similar tothe determination of the data in Table 3, these values come from questionnaires sent tocompanies and must then be updated using satisfaction surveys of the customers of thecooperation network.
Table 3. Mean and standard deviation of failure probabilities in logistics operations and prevention barriers.
Company A Company B Company C
NormalDistribution for
Failures in LogisticProcesses
NormalDistribution for
Failures inPreventive Barriers
NormalDistribution for
Failures in LogisticProcesses
NormalDistribution for
Failures inPreventive Barriers
NormalDistribution for
Failures in LogisticProcesses
NormalDistribution for
Failures inPreventive Barriers
µ σ µ σ µ σ µ σ µ σ µ σ
(1) Order Processing 0.4 0.1 0.3 0.1 0.3 0.2 0.4 0.2 0.2 0.1 0.6 0.1(2) Order Management 0.3 0.1 0.4 0.15 0.35 0.1 0.4 0.15 0.3 0.1 0.2 0.1
(3) Post processing 0.42 0.2 0.2 0.1 0.4 0.2 0.3 0.1 0.5 0.1 0.6 0.1
(1) Storage 0.3 0.2 0.4 0.2 0.3 0.1 0.5 0.2 0.2 0.1 0.4 0.1(2) Handling 0.4 0.15 0.5 0.1 0.35 0.15 0.6 0.2 0.6 0.1 0.5 0.1(3) Picking 0.35 0.1 0.4 0.2 0.6 0.1 0.3 0.2 0.4 0.2 0.5 0.2
(4) Packaging 0.4 0.2 0.4 0.1 0.4 0.2 0.4 0.2 0.3 0.1 0.4 0.1
(1) Loading 0.6 0.2 0.6 0.1 0.3 0.14 0.5 0.1 0.4 0.2 0.5 0.2(2) Transport 0.4 0.2 0.3 0.1 0.5 0.2 0.2 0.1 0.5 0.1 0.4 0.1(3) Delivery 0.2 0.1 0.5 0.2 0.3 0.1 0.3 0.1 0.3 0.1 0.5 0.1
Table 4. Mean and standard deviation of failure probabilities of mitigation barriers.
Company A Company B Company C
Normal Distribution forFailures in Mitigation Barriers
Normal Distribution forFailures in Mitigation Barriers
Normal Distribution forFailures in Mitigation Barriers
µ σ µ σ µ σ
(1) Information Transparency 0.2 0.1 0.5 0.1 0.6 0.2(2) Consumer information security 0.3 0.2 0.6 0.1 0.3 0.1
(3) Logistics and customs information level 0.4 0.1 0.3 0.1 0.3 0.1
(1) Accuracy 0.5 0.1 0.3 0.1 0.5 0.1(2) Safety of Goods 0.3 0.1 0.3 0.1 0.3 0.1
(3) On-Time Deliveries 0.5 0.1 0.4 0.1 0.3 0.1
(1) “fedex” packing 0.3 0.1 0.3 0.1 0.5 0.1(2) Error handling 0.2 0.1 0.4 0.2 0.3 0.1
(3)Value-Added Services 0.5 0.1 0.5 0.1 0.3 0.1
(1) International logistics services 0.3 0.1 0.6 0.1 0.5 0.1(2) Policy and regulatory level 0.2 0.1 0.5 0.1 0.3 0.2
The next step is the application of the Monte Carlo method. The objective is to evaluatethe reputational risk represented by Equation (4), taking into account the variation of theprobabilities presented in Tables 3 and 4. These probabilities may vary according to theoperational uncertainties that logistics companies face in their operations. With this in

Sustainability 2022, 14, 4329 18 of 24
mind, the variance of each mean value in Tables 3 and 4 is intended to account for theimpact of this uncertainty when evaluating the probability of failure.
Tables 5 and 6 show the failure probabilities calculated in simulation number 10,000of the Monte Carlo model implemented for this case study. In each simulation, the proba-bilities are evaluated for each element listed in the first column of Tables 3 and 4. Theseprobabilities are calculated using the mean values given in Tables 3 and 4 and taking intoaccount a random parameter that is used together with the variance to update the meanvalue in each simulation.
For each Monte Carlo simulation, the risk of each branch shown in Figures 6–8 isevaluated using Equations (1)–(3), where the first term of Equation (1) represents the riskof Branch 1, the second term represents the risk of Branch 2, and the third term representsthe risk of Branch 3. This reasoning also applies to the other two equations if we continuethe numbering of the branches up to branch number 10.
Table 7 shows the results for the risks calculated in Monte Carlo simulation number10,000 for branches 1 to 10. The last row of Table 7 shows the reputational risk assessed foreach company. This risk is evaluated using Equations (1)–(4).
The reputational risk assessed in each Monte Carlo simulation for each of the threecompanies is shown in Table 8. The mean value of each company’s reputational risk and itsrespective variance are determined by the respective values in each column of Table 8.
Table 9 shows the mean values and respective variance of reputational risk obtainedusing the data presented in Table 8.
It can be seen from Table 9 that the reputational risk of Company A is lower than therisk calculated for companies B and C. The risk value calculated for Company A is 2.731compared to 2.897 and 3.238 for Company B and C, respectively. Based on these values,it can be concluded in an initial analysis that Company A is the candidate that shouldbe selected.
However, the variance around the average value of reputational risk for these twocompanies (B and C) is high, 0.806 and 0.755, so the reputational risk for these two compa-nies might be lower compared to company A. Based on these results, it seems necessary tocalculate the probability that the risk of Company A is greater than the risk of the othertwo companies. Taking into account the mean values and the respective variance, Table 10shows the probabilities for the results obtained for each company as presented in Table 9.
This table is intended to show a comparison between the probability that the rep-utational risk of the company indicated vertically is greater than the reputational riskof the company indicated in the horizontally. In this sense, in the first row, we haveP (risk_reputation_A > risk_reputation_B) = 0.396 and P (risk_reputation_A > risk_ reputa-tion_C) = 0.209. In the second row, we have P (risk_reputation_B > risk_reputation_A) = 0.581and P (risk_reputation_B > risk_reputation_C) = 0.336, and in the third row, we haveP (risk_reputation_C > risk_reputation_A) = 0.749 and P (risk_reputation_C > risk_ repu-tation_B) = 0.674.
From these results and by inspection, it can be concluded that the probability ofreputational risk for Company A is lower than the probability of reputational risk forCompany B and Company C. It can also be concluded that the probability of reputationalrisk for Company C is higher than that for Company B. According to this logic, companiescan be prioritized by the probability of aggregate reputational risk, calculated as follows:
Aggregate_Risk_A = P (Reputation_Risk_A > Reputation_Risk_B) × P (Reputation_Risk_A > Reputation_Risk_C) = 0.083
Aggregate_Risk_B = P (Reputation_Risk_B > Reputation_Risk_A) ×P (Reputation_Risk_B > Reputation_Risk_C) = 0.195 (5)
Aggregate_Risk_C = P (Reputation_Risk_C > Reputation_Risk_A) × P (Reputation_Risk_C > Reputation_Risk_B) = 0.505

Sustainability 2022, 14, 4329 19 of 24
Table 5. Failure probabilities of logistics processes and preventive barriers evaluated in simulation number 10,000 of the implemented Monte Carlo method.
Company A Company B Company C
Probability of Failure inLogistic Processes
Probability of Failure inPreventive Barriers
Probability of Failure inLogistic Processes
Probability of Failure inPreventive Barriers
Probability of Failure inLogistic Processes
Probability of Failure inPreventive Barriers
Pf Random Pf Random Pf Random Pf Random Pf Random Pf Random
(1) Order Processing (OP1) 0.344615668 0.29 0.376417265 0.78 0.0644844 0.12 0.3581813 0.42 0.2513171 0.70 0.7276357 0.90(2) Order Management (OP2) 0.155990711 0.07 0.611259392 0.92 0.2041962 0.07 0.2845117 0.22 0.2575618 0.34 0.0995741 0.16
(3) Post processing (OP3) 0.043098423 0.03 0.235639856 0.64 0.1491934 0.10 0.1062841 0.03 0.4325563 0.25 0.5369719 0.26
(1) Storage (WH1) 0.308614987 0.52 0.523594187 0.73 0.146234 0.06 0.678595 0.81 0.2556922 0.71 0.4618898 0.73(2) Handling (WH2) 0.277570231 0.21 0.33906198 0.05 0.2418399 0.24 0.479767 0.27 0.7000912 0.84 0.4793787 0.42(3) Picking (WH3) 0.330215016 0.42 0.545198633 0.77 0.6208444 0.58 0.1370531 0.21 0.4516185 0.60 0.3902767 0.29
(4) Packaging (WH4) 0.280228629 0.27 0.363893422 0.36 0.2558729 0.24 0.0325492 0.03 0.1950374 0.15 0.4144188 0.56
(1) Loading (T1) 0.482233116 0.28 0.655091886 0.71 0.4125167 0.79 0.4552511 0.33 0.6399273 0.88 0.4378567 0.38(2) Transport (T2) 0.147400959 0.10 0.46014014 0.95 0.2941457 0.15 0.3755107 0.96 0.5399146 0.66 0.3574589 0.34(3) Delivery (T3) 0.300766436 0.84 0.635721378 0.75 0.2067216 0.18 0.4002937 0.84 0.2415594 0.28 0.614 0.87

Sustainability 2022, 14, 4329 20 of 24
Table 6. Failure probabilities of mitigation barriers evaluated in simulation number 10,000 of theimplemented Monte Carlo method.
Company A Company B Company C
Inpact ScoreNormal Distribution for
Failures inMitigation Barriers
Normal Distribution forFailures in
Mitigation Barriers
Normal Distribution forFailures in
Mitigation Barriers
Pf Random Pf Random Pf Random
(1) Information Transparency (SQ1) 2 0.228613 0.6126106 0.688431 0.9702385 0.6303423 0.5602928(2) Consumer information security (SQ2) 3 0.3831018 0.6611153 0.4563995 0.0755004 0.2808925 0.4242333
(3) Logistics and customs information level (SQ3) 1 0.4917024 0.8204349 0.1591936 0.0795561 0.3880568 0.8107242
(1) Accuracy (DSQ1) 2 0.4987228 0.4949049 0.1842884 0.1236124 0.454455 0.3243929(2) Safety of Goods (DSQ2) 3 0.3695459 0.756616 0.2839819 0.4363692 0.2738498 0.3968528
(3) On-Time Deliveries (DSQ3) 3 0.4542841 0.3237782 0.5387168 0.9173047 0.2529378 0.3189553
(1) “fedex” packing (CSQ1) 2 0.1013981 0.0235156 0.3713046 0.7620915 0.4327609 0.2506675(2) Error handling (CSQ2) 3 0.2201374 0.579797 0.6609285 0.9039927 0.1736329 0.103174
(3) Value-Added Services (CSQ3) 1 0.5060156 0.5239842 0.4262457 0.2303961 0.2811505 0.4252444
(1) International logistics services (CBSQ1) 3 0.1974268 0.1525089 0.8290865 0.9890144 0.5854613 0.8036172(2) Policy and regulatory level (CBSQ2) 2 0.169929 0.3818179 0.514267 0.5567245 0.485701 0.8234272
Table 7. Risk for each branch and reputational risk calculated in Monte Carlo simulationnumber 10,000.
Company A Company B Company C
Branch 1 0.18843846 0.653536678 0.010662227Branch 2 0.417734047 0.365805778 0.356160204Branch 3 0.319732967 1.768867134 1.471803733Branch 4 0.079837547 0.125222829 0.14111562Branch 5 0.232910332 0.076896356 0.394378903Branch 6 0.116797202 0.244482525 0.090480277Branch 7 0.02127848 0.043013081 0.105316925Branch 8 0.659170289 0.156031371 0.949581896Branch 9 0.229789095 0.295664854 0.144217832
Branch 10 0.190576907 0.149215438 0.131807603Risk_reputation_score 2.456265326 3.878736044 3.795525221
Table 8. Reputational risk per iteration and by company analyzed.
Simulation Number Company AReputational Risk
Company AReputational Risk
Company AReputational Risk
1 3.376473996 2.314079177 3.2773183292 1.815237859 2.860850945 5.0035614913 3.965828692 2.980162893 3.820033112~ ~ ~ ~
5000 2.456200257 2.546652487 4.667838910,000 2.08032168 1.48050689 4.26413586
~ ~ ~ ~100,000 2.66873863 2.868919556 3.679251406
Table 9. Reputational risk results for companies A, B and C.
Company A Reputational Risk Company B Reputational Risk Company C Reputational Risk
µ σ µ σ µ σ
2.7310085 0.6270645 2.8964258 0.8052228 3.237577 0.7553293
Based on these results, it is confirmed that Company A has the lowest reputationalrisk, followed by Company B and finally Company C. This prioritization of companiesaccording to their reputational risk in conjunction with other optimization parameters,namely, cost and time parameters, enables the selection of the transportation company thatminimizes reputational risk and maximizes financial return.

Sustainability 2022, 14, 4329 21 of 24
Table 10. Relative probabilities of reputational risk between companies.
> A B C
A 0 0.3959684 0.209591B 0.5813821 0 0.3359021C 0.7487812 0.6742426 0
In this way, the sustainability of collaborative networks in the field of logistics shouldbe promoted by creating trust among both collaborators and customers. This trust will alsoencourage the participation of new collaborators, as the collaborative approach has notattracted the desired number of collaborators due to the lack of trust in this type of approach.Attracting new collaborators and the continued participation of the current collaboratorsin the collaborative network are two fundamental factors for the growth of the network.This growth is extremely important to promote the sustainability of collaborative networksas well as their efficiency and optimization. On the other hand, the presence of a qualityindicator such as reputational risk, as proposed in this study, will motivate companiesto develop and implement quality programs to reduce reputational risk and, in this way,will increase their participation in collaborative network activities and, consequently, theirrevenue share.
The research limitations of this study are mainly related to the data acquisition ap-proach used in the illustrative case study, i.e., to obtain the primary data used in theproposed model, it is necessary to apply a structured approach to capture the probabilitiesof failure along with their respective variance, which was not performed in this research asit has been reserved for future work. In addition to supporting decision making, it is alsoenvisioned that the synergy of the proposed model with other supply chain models [48–51]can extend the applicability of the proposed model not only to partner selection, but also tosupplier selection.
5. Managerial Insights
The implementation of the proposed model will make it possible to define a series ofmeasures to evaluate the quality of the services provided by each company in the network.In this sense, it will be possible to identify points for continuous improvement. It will alsostrengthen the trust between suppliers, customers, and the collaborative network. It willalso encourage the participation of new collaborators in the network, increasing the size ofthe collaborative network, which in turn will promote its sustainability. Logistics companiescan thus lower their operating costs by reducing waste and increase customer satisfactionthrough shorter delivery times, which in turn strengthens the business relationship betweencustomers and suppliers.
6. Conclusions
In this paper, a new methodology has been developed to support decision makingwhen selecting operators in a collaborative network for the provision of logistics services.This methodology is based on a new reputational risk assessment model developed in thispaper, which, together with cost and time parameters, allows the selection of the mostsuitable logistics service provider for a given logistics contract. The developed reputationalrisk model takes into account the expectations of customers demanding logistics servicesand the potential risk factors associated with the activities of logistics companies.
In addition to the prioritization of logistics companies, the proposed model of reputa-tional risk also allows the creation of a quality index related to the services provided bylogistics companies in the collaborative network. It allows the evaluation of the qualitylevel of each operator in the most important areas and with regard to the impact on the cus-tomers of the collaborative network. This assessment is an important point of feedback thatlogistics companies can use to improve the quality assessment of their logistics operationsby implementing quality programs.

Sustainability 2022, 14, 4329 22 of 24
Along with the above benefits, the collaborative network also benefits from the imple-mentation of the proposed reputational risk model by increasing the trust of its customersand logistics service providers. The increase in trust promotes the continuity of the com-panies that are already part of the collaborative network and the participation of newcompanies, thus promoting the sustainability of the network. On the other hand, the sus-tainability of the network promotes the reduction of the sector’s environmental footprint,which is in line with the goals of the UN Agenda 2030.
As for future work, we propose to integrate the developed model into the multicriteriadecision making models commonly used in collaborative logistics networks. We alsopropose the development of a framework to evaluate the level of satisfaction of the endcustomers with the logistics service providers to update the failure probabilities after eachlogistics mission. It is also planned to correlate the proposed model with other models inreal case studies to identify operational problems, to and develop a structured approach toevaluate the failure probabilities in each logistics operation considered in the proposed model.
Author Contributions: Conceptualization, V.A. and A.A.; methodology, V.A.; software, V.A.; vali-dation, A.A., A.D. and J.C.; formal analysis, A.D.; investigation, V.A.; resources, J.C.; data curation,V.A.; writing—original draft preparation, V.A.; writing—review and editing, A.D.; visualization, V.A.;supervision, A.A.; project administration, V.A.; funding acquisition, J.C. All authors have read andagreed to the published version of the manuscript.
Funding: This research was funded by POLYTECHNIC INSTITUTE OF LISBON, grant numberIPL/2021/ReEdIA_ISEL.
Institutional Review Board Statement: Not applicable.
Informed Consent Statement: Not applicable.
Data Availability Statement: Not applicable.
Acknowledgments: This work was supported by the Polytechnic Institute of Lisbon through the Projectsfor Research, Development, Innovation and Artistic Creation (IDI&CA), within the framework of theproject ReEdIA—Risk Assessment and Management in Open Innovation, IPL/2021/ReEdIA_ISEL.
Conflicts of Interest: The authors declare no conflict of interest.
References1. Johnston, P.; Everard, M.; Santillo, D.; Robèrt, K.-H. Reclaiming the Definition of Sustainability. Environ. Sci. Pollut. Res. Int. 2007,
14, 60–66. [PubMed]2. Mikulcic, H.; Klemeš, J.J.; Vujanovic, M.; Urbaniec, K.; Duic, N. Reducing Greenhouse Gasses Emissions by Fostering the
Deployment of Alternative Raw Materials and Energy Sources in the Cleaner Cement Manufacturing Process. J. Clean. Prod. 2016,136, 119–132. [CrossRef]
3. Gaete-Morales, C.; Gallego-Schmid, A.; Stamford, L.; Azapagic, A. Life Cycle Environmental Impacts of Electricity from FossilFuels in Chile over a Ten-Year Period. J. Clean. Prod. 2019, 232, 1499–1512. [CrossRef]
4. De Souza, L.L.P.; Lora, E.E.S.; Palacio, J.C.E.; Rocha, M.H.; Renó, M.L.G.; Venturini, O.J. Comparative Environmental LifeCycle Assessment of Conventional Vehicles with Different Fuel Options, Plug-in Hybrid and Electric Vehicles for a SustainableTransportation System in Brazil. J. Clean. Prod. 2018, 203, 444–468. [CrossRef]
5. Zamfir, A.-M.; Mocanu, C.; Grigorescu, A. Circular Economy and Decision Models among European SMEs. Sustainability 2017, 9, 1507.[CrossRef]
6. Leão, J. Relatório de Estabilidade Financeira; Banco de Portugal: Lisbon, Portugal, 2020.7. Kpodar, K.; Imam, P.A. To Pass (or Not to Pass) through International Fuel Price Changes to Domestic Fuel Prices in Developing
Countries: What Are the Drivers? Energy Policy 2021, 149, 111999. [CrossRef]8. Mucowska, M. Trends of Environmentally Sustainable Solutions of Urban Last-Mile Deliveries on the E-Commerce Market—A
Literature Review. Sustainability 2021, 13, 5894. [CrossRef]9. Venegas Vallejos, M.; Matopoulos, A.; Greasley, A. Collaboration in Multi-Tier Supply Chains for Reducing Empty Running: A
Case Study in the UK Retail Sector. Int. J. Logist. Res. Appl. 2020, 1–13. [CrossRef]10. Hvolby, H.-H.; Steger-Jensen, K.; Neagoe, M.; Vestergaard, S.; Turner, P. Collaborative Exchange of Cargo Truck Loads: Approaches
to Reducing Empty Trucks in Logistics Chains. In Proceedings of the IFIP International Conference on Advances in ProductionManagement Systems, Austin, TX, USA, 1–5 September 2019; Springer: Cham, Switzerland, 2019; pp. 68–74.

Sustainability 2022, 14, 4329 23 of 24
11. Islam, S. Simulation of Truck Arrival Process at a Seaport: Evaluating Truck-Sharing Benefits for Empty Trips Reduction. Int. J.Logist. Res. Appl. 2018, 21, 94–112. [CrossRef]
12. Herczeg, G.; Akkerman, R.; Hauschild, M.Z. Supply Chain Collaboration in Industrial Symbiosis Networks. J. Clean. Prod. 2018,171, 1058–1067. [CrossRef]
13. Benhayoun, L.; Ayala, N.F.; Le Dain, M.-A. SMEs Innovating in Collaborative Networks: How Does Absorptive Capacity Matterfor Innovation Performance in Times of Good Partnership Quality? J. Manuf. Technol. Manag. 2021, 32, 1578–1598. [CrossRef]
14. Camarinha-Matos, L.M.; Afsarmanesh, H. Collaborative Networks: A New Scientific Discipline. J. Intell. Manuf. 2005, 16, 439–452.[CrossRef]
15. Durugbo, C. Collaborative Networks: A Systematic Review and Multi-Level Framework. Int. J. Prod. Res. 2016, 54, 3749–3776.[CrossRef]
16. Kamenskikh, M. Assessment of Cluster and Network Collaboration Influence on Regional Economy. J. Adv. Res. Law Econ. JARLE2018, 9, 510–515.
17. Asadifard, R.; Chookhachi Zadeh Moghadam, A.; Goodarzi, M. A Model for Classification and Study of Success Factors inInternational Collaborative Networks. Innov. Manag. J. 2023, 5, 129–150.
18. Li, J.; Bénaben, F.; Gou, J.; Mu, W. A Proposal for Risk Identification Approach in Collaborative Networks ConsideringSusceptibility to Danger. In Proceedings of the Working Conference on Virtual Enterprises, Cardiff, UK, 17–19 September 2018;Springer: Cham, Switzerland, 2018; pp. 74–84.
19. Mulyana, M.; Wasitowati, W. The Improvement of Collaborative Networks to Increase Small and Medium Enterprises (SMEs)Performance. Serb. J. Manag. 2021, 16, 213–229. [CrossRef]
20. Santos, R.; Abreu, A.; Dias, A.; Calado, J.M.; Anes, V.; Soares, J. A Framework for Risk Assessment in Collaborative Networks toPromote Sustainable Systems in Innovation Ecosystems. Sustainability 2020, 12, 6218. [CrossRef]
21. Nunes, M.; Dias, A.; Abreu, A.; Martins, J.D.M. A Predictive Risk Model Based on Social Network Analysis. In Proceedings of theModelling and Simulation 2020, Toulouse, France, 21–23 October 2020; pp. 82–88.
22. Abreu, A.; Calado, J.M. Risk Model to Support the Governance of Collaborative Ecosystems. IFAC-PapersOnLine 2017, 50,10544–10549. [CrossRef]
23. Nunes, M.; Bagnjuk, J.; Abreu, A.; Saraiva, C.; Nunes, E.; Viana, H. Achieving Competitive Sustainable Advantages (CSAs) byApplying a Heuristic-Collaborative Risk Model. Sustainability 2022, 14, 3234. [CrossRef]
24. Abreu, A.; Camarinha-Matos, L.M. A Benefit Analysis Model for Collaborative Networks. In Collaborative Networks: ReferenceModeling; Springer: Berlin, Germany, 2008; pp. 253–276.
25. Hutchins, G. ISO 31000: 2018 Enterprise Risk Management; CERM: Brussels, Belgium, 2018.26. Albery, S.; Borys, D.; Tepe, S. Advantages for Risk Assessment: Evaluating Learnings from Question Sets Inspired by the FRAM
and the Risk Matrix in a Manufacturing Environment. Saf. Sci. 2016, 89, 180–189. [CrossRef]27. Friday, D.; Ryan, S.; Sridharan, R.; Collins, D. Collaborative Risk Management: A Systematic Literature Review. Int. J. Phys.
Distrib. Logist. Manag. 2018, 48, 231–253. [CrossRef]28. Aven, T. Risk Assessment and Risk Management: Review of Recent Advances on Their Foundation. Eur. J. Oper. Res. 2016, 253,
1–13. [CrossRef]29. Hubbard, D.W. The Failure of Risk Management: Why It’s Broken and How to Fix It; John Wiley & Sons: Hoboken, NJ, USA, 2020.30. Huang, J.; Liu, H.-C.; Duan, C.-Y.; Song, M.-S. An Improved Reliability Model for FMEA Using Probabilistic Linguistic Term Sets
and TODIM Method. Ann. Oper. Res. 2019, 1–24. [CrossRef]31. Liu, H.-C. Improved FMEA Methods for Proactive Healthcare Risk Analysis; Springer: Berlin, Germany, 2019.32. Liu, H.-C.; Liu, L.; Liu, N. Risk Evaluation Approaches in Failure Mode and Effects Analysis: A Literature Review. Expert Syst.
Appl. 2013, 40, 828–838. [CrossRef]33. Rubinstein, R.Y.; Kroese, D.P. Simulation and the Monte Carlo Method; John Wiley & Sons: Hoboken, NJ, USA, 2016.34. Vesely, B. Fault Tree Analysis (FTA): Concepts and Applications; NASA HQ: Washington, DC, USA, 2002.35. Cepin, M. Event Tree Analysis. In Assessment of Power System Reliability: Methods and Applications; Cepin, M., Ed.; Springer:
London, UK, 2011; pp. 89–99. ISBN 978-0-85729-688-7.36. De Ruijter, A.; Guldenmund, F. The Bowtie Method: A Review. Saf. Sci. 2016, 88, 211–218. [CrossRef]37. Gajovic, V.; Kerkez, M.; Kocovic, J. Modeling and Simulation of Logistic Processes: Risk Assessment with a Fuzzy Logic Technique.
Simulation 2018, 94, 507–518. [CrossRef]38. Happonen, A.; Siljander, V. Gainsharing in Logistics Outsourcing: Trust Leads to Success in the Digital Era. Int. J. Collab. Enterp.
2020, 6, 150–175. [CrossRef]39. Vargas, A.; Fuster, C.; Corne, D. Towards Sustainable Collaborative Logistics Using Specialist Planning Algorithms and a
Gain-Sharing Business Model: A UK Case Study. Sustainability 2020, 12, 6627. [CrossRef]40. Aon Risk Solutions. Global Risk Management Survey; Aon Risk Solutions: Chicago, IL, USA, 2015.41. Dolati Neghabadi, P.; Evrard Samuel, K.; Espinouse, M.-L. Systematic Literature Review on City Logistics: Overview, Classification
and Analysis. Int. J. Prod. Res. 2019, 57, 865–887. [CrossRef]42. Tagarev, T.; Yanakiev, Y. Business Models of Collaborative Networked Organisations: Implications for Cybersecurity Collaboration.
In Proceedings of the 2020 IEEE 11th International Conference on Dependable Systems, Services and Technologies (DESSERT),Kyiv, Ukraine, 14–18 May 2020; pp. 431–438.

Sustainability 2022, 14, 4329 24 of 24
43. Meidute-Kavaliauskiene, I.; Aranskis, A.; Litvinenko, M. Consumer Satisfaction with the Quality of Logistics Services. Procedia-Soc.Behav. Sci. 2014, 110, 330–340. [CrossRef]
44. Fernandes, D.W.; Moori, R.G.; Vitorino Filho, V.A. Logistic Service Quality as a Mediator between Logistics Capabilities andCustomer Satisfaction. Rev. Gestão 2018, 25, 358–372. [CrossRef]
45. Choi, D.; Chung, C.Y.; Young, J. Sustainable Online Shopping Logistics for Customer Satisfaction and Repeat Purchasing Behavior:Evidence from China. Sustainability 2019, 11, 5626. [CrossRef]
46. Rong, J.; Zhong, D. Influence Factors of Customer Satisfaction in Cross-Border e-Commerce. J. Discrete Math. Sci. Cryptogr. 2018,21, 1281–1286. [CrossRef]
47. Wei, R. Analysis on Influencing Factors of Customer Satisfaction of Cross-Border e-Commerce Logistics Service. Int. Core J. Eng.2019, 5, 32–39.
48. Mahapatra, A.S.; Soni, H.N.; Mahapatra, M.S.; Sarkar, B.; Majumder, S. A Continuous Review Production-Inventory System witha Variable Preparation Time in a Fuzzy Random Environment. Mathematics 2021, 9, 747. [CrossRef]
49. Ullah, M.; Asghar, I.; Zahid, M.; Omair, M.; AlArjani, A.; Sarkar, B. Ramification of Remanufacturing in a Sustainable Three-Echelon Closed-Loop Supply Chain Management for Returnable Products. J. Clean. Prod. 2021, 290, 125609. [CrossRef]
50. Ahmed, W.; Moazzam, M.; Sarkar, B.; Ur Rehman, S. Synergic Effect of Reworking for Imperfect Quality Items with the Integrationof Multi-Period Delay-in-Payment and Partial Backordering in Global Supply Chains. Engineering 2021, 7, 260–271. [CrossRef]
51. Khan, I.; Sarkar, B. Transfer of Risk in Supply Chain Management with Joint Pricing and Inventory Decision ConsideringShortages. Mathematics 2021, 9, 638. [CrossRef]
Related Documents