0 A REPORT PREPARED FOR THE TEXAS CHARTER SCHOOL ASSOCIATION: COMPARATIVE ANALYSES OF REVENUES GENERATED FROM THE TEXAS FOUNDATION SCHOOL PROGRAM FOR INDEPENDENT SCHOOL DISTRICTS AND CHARTER SCHOOL DISTRICTS FEBRUARY 2011 BY: R. C. Wood & Associates 8711 SW 46th Lane Gainesville, Florida 32608-4137 Phone: 352-538-9600 Fax: 352-335-8158 Email: [email protected] Website: http://www.rcwoodassoc.com/

Welcome message from author
This document is posted to help you gain knowledge. Please leave a comment to let me know what you think about it! Share it to your friends and learn new things together.
Transcript
0
A REPORT PREPARED FOR THE TEXAS CHARTER SCHOOL ASSOCIATION:
COMPARATIVE ANALYSES OF REVENUES GENERATED FROM THE TEXAS FOUNDATION SCHOOL PROGRAM
FOR INDEPENDENT SCHOOL DISTRICTS AND CHARTER SCHOOL DISTRICTS
FEBRUARY 2011
BY:
R. C. Wood & Associates
8711 SW 46th Lane Gainesville, Florida 32608-4137
Phone: 352-538-9600 Fax: 352-335-8158 Email: [email protected]
Website: http://www.rcwoodassoc.com/

1
INTRODUCTION
Charter school districts (CSDs) are accredited and monitored by the Texas Education Agency
(TEA) utilizing the various components within the state accountability systems for both state and
federal requirements. Yet, CSDs are believed to operate with fewer regulatory restrictions on
administrative, instructional, and pedagogical methods. To be clear, just like traditional
independent school districts (ISDs) across the state, charter school districts are subject to all
TEA-required administrative, instructional, and pedagogical standards. Despite these
commonalities, to date, no independent fiscal analysis of ISD-CSD revenue distributions have
been conducted. As such, The Texas Charter Schools Association (TCSA) contracted with R.C.
Wood and Associates (http://www.rcwoodassoc.com/) to conduct comparative analyses of
revenues generated from the Texas Foundation School Program (FSP) for independent school
districts and charter school districts. Accordingly, Dr. Anthony Rolle (Principal Researcher) and
Dr. Craig Wood (Co-Principal Researcher) developed this policy monograph for TCSA detailing
the following:
A An explanation of the Texas public school district funding mechanism
B. A detailed description of methodological and data analysis techniques
C. An equity analysis of traditional and charter school district revenue distributions
D. A discussion of analytical conclusions
As part of this analysis, Texas funding formula components for ISDs and CSDs were analyzed to
assess and compare overall revenue generation levels, to assess and compare levels of equity
exhibited by revenue distributions, and to assess and compare demographic and financial data.
A. AN EXPLANATION OF THE TEXAS PUBLIC SCHOOL DISTRICT FUNDING MECHANISM 1
All public schools in Texas, both traditional independent school districts and charter school
districts, receive state revenue funds based on the average daily attendance (ADA) of students.
Specifically, the Texas school funding mechanism – called the Texas Foundation School
1 For a complete description of the Texas Foundation School Program, see: http://www.tea.state.tx.us/index2.aspx?id=7022

2
Program (FSP) (http://www.tea.state.tx.us/index2.aspx?id=410) – is the source of state funding
for all Texas school districts. And, in its current form, the FSP is meant to ensure that all school
districts, regardless of property wealth, receive "substantially equal access to similar revenue per
student at similar tax effort" (http://www.tea.state.tx.us/index2.aspx?id=7721&menu_id=645).
The major differences between ISDs and CSDs are that CSDs do not receive funds from local tax
revenue sources; and, CSDs do not have access to state facilities allotments.
Comprised of three funding sections, the funding formula originally was designed to generate
substantially equal revenues for school district daily maintenance and operation – not capital or
debt servicing – expenses. Tier I is structured as a basic foundation formula. Consisting of a
basic allotment per student and a series of weighted adjustments that account for differences in
student and district characteristics (e.g., population density or the percentage of bilingual or
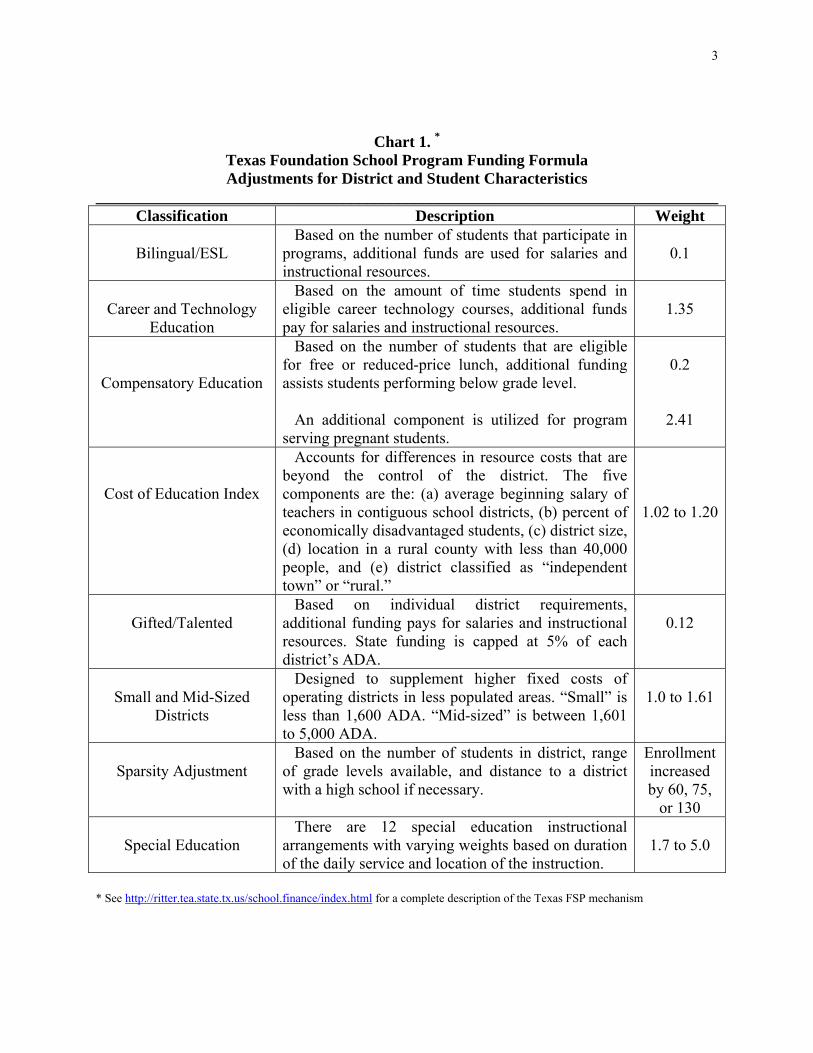
economically disadvantaged students within a district) (see Chart 1, p. 3). In addition, each
district also qualifies for transportation allotments based on the number of students riding buses
divided by the approved route miles. As such, the basic allotments plus the district, student, and
transportation adjustments sum to provide a district’s per student state allocation within Tier I.
This amount is adjusted by a district’s Local Fund Assignment (i.e., revenue generated through
local taxation at a specific rate). Consequently, adjusted state aid equals the Tier I Entitlement
minus the Local Fund Assignment.
Tier II operates as a guaranteed-yield funding mechanism. Unlike Tier I, Tier II state revenue
is generated based on the M&O tax rates set by local districts. For example, every cent of tax the
district levied is guaranteed to receive a specified dollar amount per weighted student (see Chart
2, p. 4). Under a third section for facilities, revenues for capital and debt services (i.e., Interest
and Sinking, or I & S, rates) are unadjusted formulaically. But, three state programs – Existing
Debt Allotment (EDA), Instructional Facilities Allotment (IFA), and New Instructional Facilities
Allotment (NIFA) – assist districts with these types of costs. As such, districts bear the primary
responsibility for facilities costs, which typically are funded through voter-approved property tax
assessments.
3
Chart 1. * Texas Foundation School Program Funding Formula Adjustments for District and Student Characteristics
______________________________________________________________________________ Classification Description Weight
Bilingual/ESL
Based on the number of students that participate in programs, additional funds are used for salaries and instructional resources.
0.1
Career and Technology
Education
Based on the amount of time students spend in eligible career technology courses, additional funds pay for salaries and instructional resources.
1.35
Compensatory Education
Based on the number of students that are eligible for free or reduced-price lunch, additional funding assists students performing below grade level. An additional component is utilized for program serving pregnant students.
0.2
2.41
Cost of Education Index
Accounts for differences in resource costs that are beyond the control of the district. The five components are the: (a) average beginning salary of teachers in contiguous school districts, (b) percent of economically disadvantaged students, (c) district size, (d) location in a rural county with less than 40,000 people, and (e) district classified as “independent town” or “rural.”
1.02 to 1.20
Gifted/Talented
Based on individual district requirements, additional funding pays for salaries and instructional resources. State funding is capped at 5% of each district’s ADA.
0.12
Small and Mid-Sized
Districts
Designed to supplement higher fixed costs of operating districts in less populated areas. “Small” is less than 1,600 ADA. “Mid-sized” is between 1,601 to 5,000 ADA.
1.0 to 1.61
Sparsity Adjustment
Based on the number of students in district, range of grade levels available, and distance to a district with a high school if necessary.
Enrollment increased by 60, 75,
or 130
Special Education There are 12 special education instructional arrangements with varying weights based on duration of the daily service and location of the instruction.
1.7 to 5.0
* See http://ritter.tea.state.tx.us/school.finance/index.html for a complete description of the Texas FSP mechanism

4
______________________________________________________________________________
Chart 2. Texas Foundation School Program Funding Formula
Outline of Tier I, Tier II, and Facilities Funding Characteristics ______________________________________________________________________________
TIER I: BASIC ALLOTMENT FUNDING
Local Fund Assignment: district revenue from property tax of $.0.86 per $100 of assessed value
Basic Allotment: $4,765 (for 2009-10) per ADA
Tier I Entitlement = Basic allotment + district level adjustments + student level adjustments +
transportation allotment
State aid to district = Tier I Entitlement – Local Fund Assignment
TIER II: GUARANTEED YIELD FUNDING
Level 1: Basic equalization
FY 2010 yield: $59.02 per WADA; or, the amount of district tax revenue per WADA per cent of tax effort generated for this level of guaranteed yield funding for the last school year
Equalization basis: property tax wealth per WADA in 88th percentile of all school districts
Subject to recapture: yes
Requires voter approval: no
Level 2: Above enrichment level
FY 2010 yield: $31.95 per penny of M&O tax above enrichment level (maximum M&O tax = $1.17)
Equalization basis: property tax wealth per WADA in 88th percentile of all school districts
Subject to recapture: yes
Requires voter approval: yes
FACILITIES FUNDING
FY 2010 Yield = Property Tax Rate * Assessed Property Value
5
While the preponderance of education revenues generated by the FSP are represented by this
three-part funding system, state revenues are affected by one more major feature of the funding
mechanism: Fiscal Recapture (known derogatorily as “Robin Hood”). The recapture provision of
Texas’s school finance program requires districts with property tax wealth per WADA above the
88th percentile (known as Chapter 41 Districts) to share their wealth by choosing one of five
options:
1. Consolidate with a poorer school district.
2. Detach property to another school district for taxation purposes.
3. Purchase average daily attendance credits from the state.
4. Contract for the education of non-resident students by partnering with a poorer district.
5. Consolidate the tax base with one or more other districts.
Most Chapter 41 districts (less than 15% of all districts) chose either the third or fourth option.
Revenue received by the state under Option 3 was counted as state revenue when state aid was
distributed to districts. FSP tiers, adjustments, and recapture provision enacted in 1993 to
enhance revenue equity across the state remain largely in place.
For charter school districts, on the other hand, the FSP calculates revenues based on an
average adjusted allotment – a value that is ubiquitous to all CSDs – not a specific district-based
adjusted allotment. Specifically, this statewide average adjusted allotment is applied to all
individual CSDs, regardless of school size, level of sparsity among students living in the district,
and cost of education differentials that vary by charter school district. Two more items are
important to note: a) Charter school districts do not receive I & S fund revenues; and contrary to
popular belief, b) Charter school districts may choose to receive transportation funding, though
not all choose to do so.2
2 ISDs and CSDs also receive Additional State Aid for Tax Reduction (ASATR) which provides additional funding for revenue decreases due to rate compression changes, teacher salary increases, high school allotment and increases to the minimum per weighted. ASATR revenue provides additional levels of funding to schools to provide relief for tax reduction in House Bill 3646 (2007). The amount of ASATR funding received is adjusted based upon the local revenue or tax collections for the schools and the per student guarantees set by the state. Again, the adjustments for CSDs are based on state averages.

6
B. A DETAILED DESCRIPTION OF METHODOLOGICAL AND DATA ANALYSIS TECHNIQUES 3
Data analyzed were obtained, defined, calculated, and reported from one primary source: The
Public Education Information Management System (PEIMS) managed by the Texas Education
Agency (TEA). The data elements are: a) Combined state-local revenues from general fund
sources (i.e., excludes all I & S revenues); b) Combined state-local revenues from all fund
sources (i.e., includes all I & S revenues); and, c) District and student characteristics defined by
specific components within the FSP (e.g., maintenance and operations taxing effort). Statistical
analyses will focus on these data elements because the Texas state funding mechanism is in place
to distribute resources equitably while reducing the influence of individual district wealth and
various student needs. Univariate and multivariate statistical analyses were conducted to examine
operationalized variables and equity relationships for Texas ISDs and CSDs during the 2005 to
2009 academic years. Univariate statistics – means, medians, standard deviations, ranges, and
percentiles – are used to provide general descriptions of individual variables. Standard equity
statistics – percentile ratios and coefficients of variation – are used to determine levels of
horizontal equity.4
C. AN EQUITY ANALYSIS OF TRADITIONAL AND CHARTER SCHOOL DISTRICT
REVENUE DISTRIBUTIONS
From 2005-2009, average combined state and local education revenue per weighted student
for all ISDs increased from $4779 to $5954 – an annual average gain of 5.7% over the five-year
period (see Table 1, p. 7). Median combined state and local education revenue per weighted
student experienced similar increases. While the standard deviation increased throughout the
period examined, the coefficient of variation also increased from 0.158 to 0.199 – an annual
3 Standardized regression coefficients are examined to discern levels of vertical equity present in Texas school districts. F-statistics are reported in lieu of R2 or adjusted-R2 because this research is concerned with the magnitude and direction of relationships – not determining the accuracy of any particular predictive model. 4 The coefficient of variation (CoV) is calculated by dividing the standard deviation by the mean; and, the values of the ratio range from 0 to +∞. As the CoV increases, inequities in revenue distributions increase.

7
Year 2005 2006 2007 2008 2009 Avg Annual 2005 2006 2007 2008 2009 Avg Annualn 1037 1033 1031 1031 1030 Pct. Change 1037 1033 1031 1031 1030 Pct. Change
Mean 4779 4934 5111 5731 5954 5.71 5209 5390 5595 6262 6602 6.16Median 4704 4787 4954 5407 5653 4.74 5115 5206 5425 5960 6270 5.26Std Dev 756 1003 928 1199 1185 13.31 897 1187 1078 1335 1542 15.62
CV 0.158 0.203 0.182 0.209 0.199 7.04 0.172 0.220 0.193 0.213 0.234 8.90
Percentile 95 5857 6336 6446 7781 7943 8.18 6809 7106 7280 8768 9024 7.5490 5304 5622 5811 6761 7060 7.53 6150 6431 6611 7597 8039 7.0375 4960 5059 5267 5912 6189 5.76 5505 5662 5869 6598 6919 5.9525 4454 4573 4747 5147 5379 4.85 4719 4844 5018 5546 5827 5.4610 4145 4239 4479 4927 4927 4.48 4364 4473 4736 5204 5510 6.035 3884 3995 4228 4748 4748 5.25 4044 4205 4457 4954 5233 6.69
Percentile 95/5 1.508 1.586 1.525 1.639 1.673 2.72 1.684 1.690 1.633 1.770 1.724 0.70Ratios 90/10 1.280 1.326 1.297 1.372 1.433 2.91 1.409 1.438 1.396 1.460 1.459 0.91
75/25 1.114 1.106 1.110 1.149 1.151 0.83 1.167 1.169 1.170 1.190 1.187 0.45
2005-2009Combined State and Local Education Revenue per Weighted Student
Horizontal Equity Statistics for All Texas Public School DistrictsTable 1.
General Fund Revenues All Funds Revenues
Year 2005 2006 2007 2008 2009 Avg Annual 2005 2006 2007 2008 2009 Avg Annualn 86 186 177 187 192 Pct. Change 86 186 177 187 192 Pct. Change
Mean 4474 4776 4471 4955 5269 4.38 4640 5023 4643 5155 5475 4.48Median 4307 4455 4455 4976 5285 5.34 4446 4624 4730 5198 5437 5.20Std Dev 1929 4491 985 872 875 10.90 1901 4583 1018 933 931 13.68
CV 0.431 0.940 0.220 0.176 0.166 3.94 0.410 0.912 0.219 0.181 0.170 5.81
Percentile 95 5992 5743 5777 6245 6323 1.45 6283 6611 5898 6564 6649 1.7690 5243 5275 5280 5866 5972 3.40 5510 5715 5433 6099 6335 3.7375 4723 4810 4890 5246 5532 4.06 4847 5015 5068 5517 6731 8.8525 3963 4146 4220 4708 5002 6.05 4055 4323 4394 4866 5172 6.3210 3512 3695 3888 4264 4607 7.04 3607 3789 4004 4348 4847 7.705 3130 3402 2928 3669 4138 8.21 3233 3457 3462 3711 4239 7.12
Percentile 95/5 1.914 1.688 1.973 1.702 1.528 -4.73 1.943 1.912 1.704 1.769 1.569 -5.00Ratios 90/10 1.493 1.428 1.358 1.376 1.296 -3.43 1.528 1.508 1.357 1.403 1.307 -3.69
75/25 1.192 1.160 1.159 1.114 1.106 -1.84 1.195 1.160 1.153 1.134 1.301 2.39
Table 2.Horizontal Equity Statistics for All Texas Charter School Districts
Combined State and Local Education Revenue per Weighted Student2005-2009
All Funds RevenuesGeneral Fund Revenues

8
average gain of 7.1%. Analyzing horizontal measures that examine percentile ratios, the 95th to
5th ratio showed an average annual increase of 2.7%; the 90th to 10th ratio showed an average
annual increase of 2.9%; and, the 75th to 25th ratio showed a slight average annual increase of
0.8%. And, even though statistical evidence shows slow degenerations in levels of equity, high
expenditure ISDs still spent as much as 1.6 times more than their low expenditure counterparts.
Therefore, even the though the average combined state and local education revenue per weighted
student increased in real terms during the five-year period examined, levels of inequity
increased.5 Examining revenues from all funds yielded similar results.
From 2005-2009, average combined state and local education revenue per weighted student
for all CSDs increased from $4474 to $5269 – an annual average gain of 4.4% over the five-year
period (see Table 2, p. 7). Median combined state and local education revenue per weighted
student experienced similar increases. While the standard deviation decreased throughout the
period examined, the coefficient of variation also decreased from 0.431 to 0.166.6 Analyzing
horizontal measures that examine percentile ratios, the 95th to 5th ratio showed an average annual
decrease of 4.7%; the 90th to 10th ratio showed an average annual decrease of 3.4%; and, the 75th
to 25th ratio showed a slight average annual decrease of 1.8%. Moreover, even though statistical
evidence shows slow improvements in levels of equity, high expenditure CSDs still spent as
much as 1.5 times more than their low expenditure counterparts. Therefore, as average combined
state and local education revenue per weighted student increased in real terms during the five-
year period examined, levels of equity increased slightly. Examining revenues from all funds
yielded similar results.
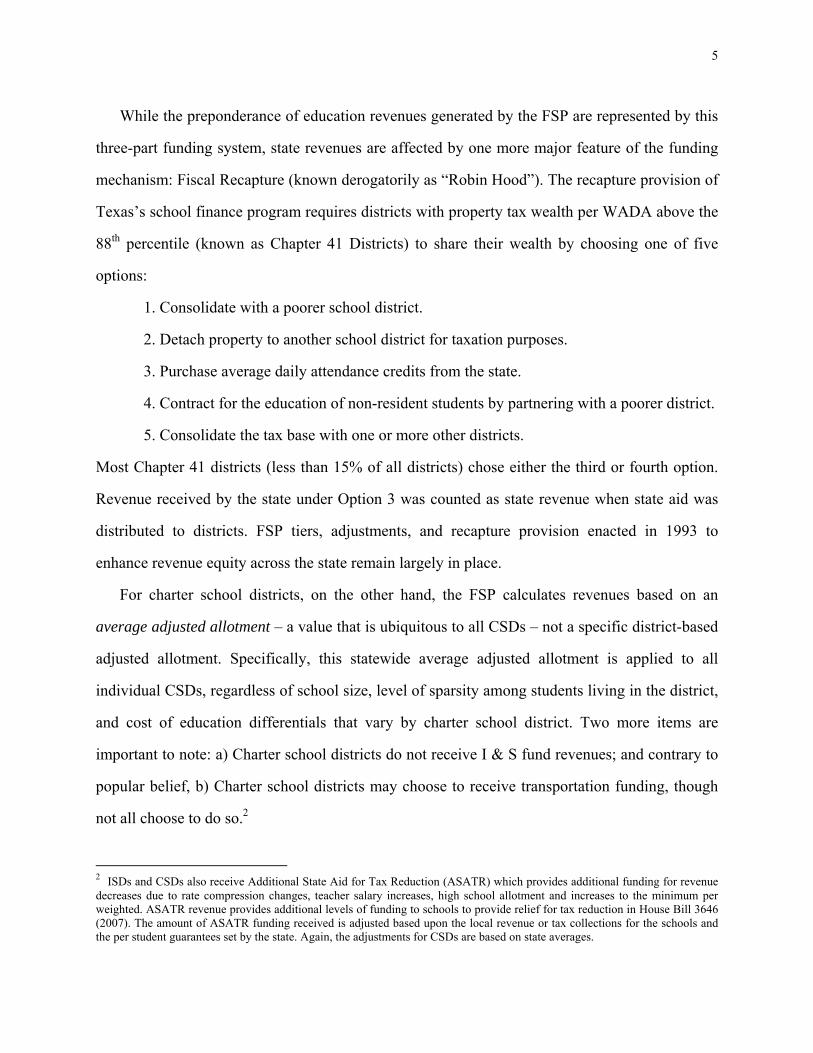
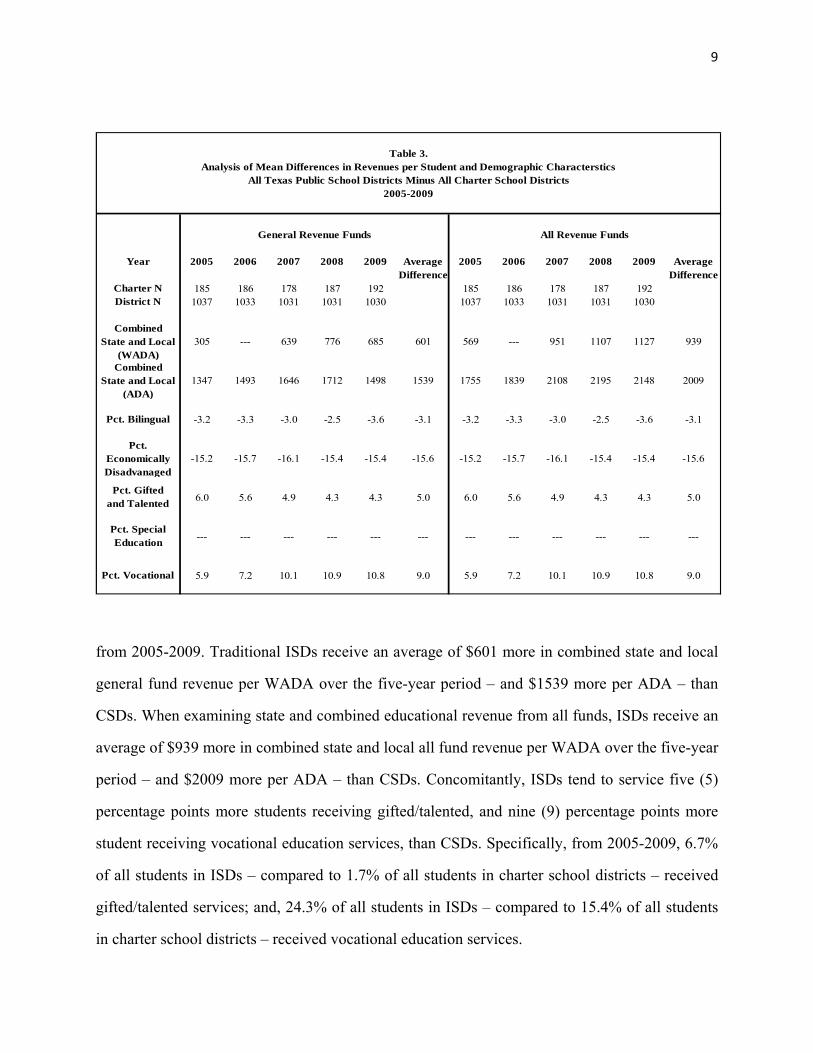
Table 3 (see p. 9) compares mean differences in combined state and local revenues per
student – as well as district and student demographic characteristics – between ISDs and CSDs
5 It is important to note that the majority of education finance and economic literature report equity analyses utilizing average daily attendance (ADA) not weighted average daily attendance (WADA). The usage of WADA is unique to Texas. As such, horizontal equity statistics also were calculated using ADA and showed similar results. Contact authors for details. 6 Previously, it was mentioned that state averages were used in the calculation of some specific CSD revenues. This reduction in the magnitude of the standard deviation most likely is due to said policy changes.
9
Year 2005 2006 2007 2008 2009 Average 2005 2006 2007 2008 2009 AverageDifference Difference
Charter N 185 186 178 187 192 185 186 178 187 192District N 1037 1033 1031 1031 1030 1037 1033 1031 1031 1030
Combined State and Local
(WADA)305 --- 639 776 685 601 569 --- 951 1107 1127 939
Combined State and Local
(ADA)1347 1493 1646 1712 1498 1539 1755 1839 2108 2195 2148 2009
Pct. Bilingual -3.2 -3.3 -3.0 -2.5 -3.6 -3.1 -3.2 -3.3 -3.0 -2.5 -3.6 -3.1
Pct. Economically Disadvanaged
-15.2 -15.7 -16.1 -15.4 -15.4 -15.6 -15.2 -15.7 -16.1 -15.4 -15.4 -15.6
Pct. Gifted and Talented
6.0 5.6 4.9 4.3 4.3 5.0 6.0 5.6 4.9 4.3 4.3 5.0
Pct. Special Education
--- --- --- --- --- --- --- --- --- --- --- ---
Pct. Vocational 5.9 7.2 10.1 10.9 10.8 9.0 5.9 7.2 10.1 10.9 10.8 9.0
Table 3.Analysis of Mean Differences in Revenues per Student and Demographic Characterstics
All Texas Public School Districts Minus All Charter School Districts2005-2009
General Revenue Funds All Revenue Funds
from 2005-2009. Traditional ISDs receive an average of $601 more in combined state and local
general fund revenue per WADA over the five-year period – and $1539 more per ADA – than
CSDs. When examining state and combined educational revenue from all funds, ISDs receive an
average of $939 more in combined state and local all fund revenue per WADA over the five-year
period – and $2009 more per ADA – than CSDs. Concomitantly, ISDs tend to service five (5)
percentage points more students receiving gifted/talented, and nine (9) percentage points more
student receiving vocational education services, than CSDs. Specifically, from 2005-2009, 6.7%
of all students in ISDs – compared to 1.7% of all students in charter school districts – received
gifted/talented services; and, 24.3% of all students in ISDs – compared to 15.4% of all students
in charter school districts – received vocational education services.

10
On the other hand, even while receiving less revenue, CSDs provide educational services to
equivalent percentages of students receiving special education services, three (3) percentage
points more students receiving bilingual educational services, and over fifteen (15) percentage
points more students classified as economically disadvantaged. Specifically, from 2005-2009,
12.0% of all students in CSDs – compared to 12.3% of all students in independent school
districts – received special education services; 10.3% of all students in CSDs – compared to
7.2% of all students in independent school districts – received bilingual education services; and,
68.6% of all students in CSDs – compared to 53.0% of all students in independent school
districts – received additional education services for economically disadvantaged students.
The analyses to this point compared all ISDs to all CSDs. Accordingly, these analyses also
would include high enrollment districts (e.g., Austin ISD, El Paso ISD, or Houston ISD) and
compare them to relatively low enrollment charter school districts. Understanding that certain
economies of scale may influence comparative analyses, supplemental analyses of “charter
equivalent” districts – that is, comparing only ISDs that have enrollment less than or equal to the
highest enrollment CSD – also were conducted to support or question the all-inclusive analytical
results. The analytical results presented for the “charter equivalent” districts mirror the results of
the all ISD and all CSD analyses.
From 2005-2009, among “charter size equivalent” ISDs, average combined state and local
education revenue per weighted student increased from $4733 to $6031 – an annual average gain
of 6.3% over the five-year period (see Table 4, p. 11). Median combined state and local
education revenue per weighted student experienced similar increases. While the standard
deviation increased throughout the period examined, the coefficient of variation also increased
from 0.186 to 0.224 – an annual average gain of almost 6.0%. Analyzing horizontal measures
that examine percentile ratios, the 95th to 5th ratio showed an average annual increase of 0.9%;
the 90th to 10th ratio showed an average annual increase of 1.2%; and, the 75th to 25th ratio
showed a slight average annual increase of 1.0%. And, even though statistical evidence shows

11
Year 2005 2006 2007 2008 2009 Avg Annual 2005 2006 2007 2008 2009 Avg Annualn 680 715 708 707 707 Pct. Change 680 715 708 707 707 Pct. Change
Mean 4733 4916 5119 5804 6031 6.32 5066 5278 5494 6218 6564 6.75Median 4638 4734 4921 5424 5704 5.35 4911 5044 5286 5824 6177 5.94Std Dev 881 1165 1066 1385 1353 12.84 982 1341 1193 1507 1744 16.89
CV 0.186 0.237 0.208 0.239 0.224 5.95 0.194 0.254 0.217 0.242 0.266 9.44
Percentile 95 6272 6756 6965 8399 8433 7.95 6933 7445 7504 9033 9348 8.0190 5502 5759 5997 7093 7297 7.49 5925 6330 6562 7799 8191 8.5975 4910 5030 5293 6037 6288 6.47 5327 5472 5726 6493 6877 6.6725 4351 4484 4665 5112 5362 5.39 4558 4696 4916 5446 5731 5.9310 3991 4130 4370 4831 5063 6.16 4193 4332 4632 5066 5378 6.445 3708 3870 4099 4633 4833 6.91 3935 4064 4333 4808 5079 6.62
Ratios 95/5 1.691 1.746 1.699 1.813 1.745 0.87 1.762 1.832 1.732 1.879 1.841 1.2490/10 1.379 1.394 1.372 1.468 1.441 1.18 1.413 1.461 1.417 1.539 1.523 1.9975/25 1.128 1.122 1.135 1.181 1.173 0.98 1.169 1.165 1.165 1.192 1.200 0.67
General Revenue Fund All Revenues Fund
Horizontal Equity Statistics for "Charter Size Equivalent" Texas Public School DistrictsCombined State and Local Education Revenue per Weighted Student
2005-2009
Table 4.
Year 2005 2006 2007 2008 2009 Average 2005 2006 2007 2008 2009 Average Difference Difference
Charter N 184 186 173 181 185 184 186 173 181 185District N 680 715 708 707 707 680 715 708 707 707
Combined State and Local
(WADA)--- --- 650 853 776 --- 426 --- 851 1067 1102 862
Combined State and Local
(ADA)1984 2101 2312 2517 2292 2241 2314 2368 2679 2901 2863 2625
Pct. Bilingual -4.8 -4.9 -4.6 -4.3 -5.5 -4.8 -4.8 -4.9 -4.6 -4.3 -5.5 -4.8
Pct. Economically Disadvanaged
-14.8 -15.4 -16.2 -15.6 -16.0 -15.6 -14.8 -15.4 -16.2 -15.6 -16.0 -15.6
Pct. Gifted and Talented
6.1 5.5 4.8 4.1 4.1 4.9 6.1 5.5 4.8 4.1 4.1 4.9
Pct. Special Education
--- --- --- --- --- --- --- --- --- --- --- ---
Pct. Vocational 6.8 8.1 11.5 12.2 12.2 10.2 6.8 8.1 11.5 12.2 12.2 10.2
General Fund Revenues All Funds Revenues
Analysis of Mean Differences in Revenues per Student and Demographic CharactersticsAll Similar Sized Public School Districts Minus Texas Charter School Districts
2005-2009
Table 5.

12
slow degenerations in levels of equity, high expenditure ISDs still spent as much as 1.7 times
more than their low expenditure counterparts. Therefore, even the though the average combined
state and local education revenue per weighted student increased in real terms during the five-
year period examined, levels of inequity increased. Examining revenues from all funds yielded
similar results.
Table 5 (p. 11) compares mean differences in combined state and local revenues per student
for “charter size equivalent” ISDs and CSDs – as well as district and student demographic
characteristics – from 2005-2009. Traditional ISDs receive an average of $760 more in combined
state and local general fund revenue per WADA over the five-year period – and $2241 more per
ADA – than CSDs. When examining state and combined educational revenue from all funds,
ISDs receive an average of $862 more in combined state and local all fund revenue per WADA
over the five-year period – and $2625 more per ADA – than CSDs. Concomitantly, ISDs tend to
service five (5) percentage points more students receiving gifted/talented, and ten (10)
percentage points more student receiving vocational services, than CSDs. Specifically, from
2005-2009, 6.6% of all students in ISDs – compared to 1.6% of all students in charter school
districts – received gifted/talented services; and, 25.6% of all students in ISDs – compared to
15.4% of all students in charter school districts – received vocational education services.
On the other hand, even while receiving less revenue, CSDs provide educational service to
equivalent percentages of students receiving special education services, five (5) percentage
points more students receiving bilingual educational services, and over fifteen (15) percentage
points more students classified as economically disadvantaged. Specifically, from 2005-2009,
12.8% of all students in CSDs – compared to 12.1% of all students in independent school
districts – received special education services; 10.2% of all students in CSDs – compared to
5.4% of all students in independent school districts – received bilingual education services; and,
68.6% of all students in CSDs – compared to 53.0% of all students in independent school
districts – received additional education services for economically disadvantaged students.

13
D. A DISCUSSION OF ANALYTICAL CONCLUSIONS
In this monograph, Texas funding formula components for ISDs and CSDs were analyzed to
assess and compare overall revenue generation levels, to assess and compare levels of equity
exhibited by revenue distributions, and to assess and compare demographic and financial data.
Univariate and multivariate statistical analyses were conducted to examine operationalized
variables and equity relationships for Texas ISDs and CSDs during the 2005 to 2009 academic
years. Univariate statistics – means, medians, standard deviations, ranges, and percentiles – are
used to provide general descriptions of individual variables. Standard equity statistics –
percentile ratios and coefficients of variation – are used to determine levels of horizontal equity.
Unfortunately, when examining combined local-state expenditures, levels of inequity remained
constant or worsened slightly depending on the measure analyzed. In fact, evidence examined
shows that disparities in per-student funding – and ultimately access to a variety of educational
services – are driven primarily by the ability of school districts to generate revenues from local
property wealth.
Additional analyses showed that traditional ISDs receive an average of $601 more in
combined state and local general fund revenue per WADA over the five-year period – and $1539
more per ADA – than CSDs. When examining state and combined educational revenue from all
funds, ISDs receive an average of $939 more in combined state and local all fund revenue per
WADA over the five-year period – and $2009 more per ADA – than CSDs. Concomitantly,
traditional ISDs tend to service five (5) percentage points more students receiving
gifted/talented, and nine (9) percentage points more student receiving vocational education
services, than CSDs. On the other hand, even while receiving less revenue, CSDs provide
educational services to equivalent percentages of students receiving special education services,
three (3) percentage points more students receiving bilingual educational services, and over
fifteen (15) percentage points more students classified as economically disadvantaged.
Consequently, if education finance equity and equality of educational opportunity between
traditional ISDs and CSDs is to remain a policy goal, the Texas school funding mechanism needs

14
to be reconceptualized and restructured around two primary policy areas to alleviate inequities
currently generated by:
1) Adjustments for fiscal capacity: The major differences between the ISD and CSD
funding structures is that: a) Charter school districts do not receive funds from local
tax revenue sources; and, b) Charter school districts do not receive facilities funding.
These two items currently are components of the Texas FSP mechanism. Yet, CSDs
are denied access to these revenue generation components.
2) Adjustments for community complexity: For charter school districts, the Texas FSP
mechanisms generates revenues based on an average adjusted allotment – a value that
is ubiquitous to all CSDs. Specifically, this average adjusted allotment is applied to
all individual CSDs, regardless of school size, level of sparsity among students living
in the district, and cost of education differentials that vary by charter school district.
The direct result of this averaging is a failure to alleviate negative – or reward
positive – community characteristics; as a result, school districts with differential
school climates – i.e., those CSDs that are not represented well by the average – are
being under-funded (or over-funded) by the state.
The ultimate goal of educational finance and economic research is to improve the quantity
and quality of educational opportunities provided to all children. As such, in both a
methodological and practical sense, additional comparative examinations of ISD and CSD
funding will be necessary to continuously improve academic opportunities for the children of
Texas.
15
SUPPLEMENTAL APPENDIX:
Multivariate statistical analyses were conducted to examine operationalized variables and
efficacy relationships for Texas school districts during the 2005 to 2009 academic years.
Standardized beta coefficients from ordinary least squares (OLS) regression analyses are used to
make inferences about the effects of various district characteristics on spending; and, their
influence on levels of combined state and local expenditures per student. Five findings are of
particular note: (a) The strongest predictor of combined state and local general fund revenue per
pupil is assessed valuation; (b) The FSP components representing percentages of students
receiving bilingual services is an insignificant predictor of expenditures per student; (c) The FSP
components representing percentages of students receiving gifted and talented services is an
insignificant predictor of expenditures per student; (d) The influence of maintenance and
operations taxing effort is a positive and negative predictor of expenditures per student; and, (e)
The influence of average teacher beginning teacher salary is a positive and negative predictor of
expenditures per student.
An Efficacy Analysis of FSP Components
From 2005-2009, the strongest predictor of combined state and local general fund revenue
per pupil is assessed valuation. The full model exhibited an adjusted R-square of 58.5% with
35.3 percentage points solely accounted for by assessed value and M&O rate (i.e., over 60% of
the explained variation shown in revenue is caused by changes in assessed valuation). The
standardized beta coefficient ranged from 0.450 up to 0.576; and, were statistically significant
for all years examined (see Appendix Chart 1, next page). The second strongest predictor – the
sparsity adjustment controlling for low enrollment ISDs – had coefficients ranging from 0.230 up
to 0.309; and, were statistically significant for all years examined. And, the third strongest
predictor – transportation costs – had coefficients ranging from 0.195 up to 0.277; and were
statistically significant for all years examined.

16
Year Tax RateAssessed
Value
Bilingual Education
Pct
Econ Disad Pct
Gifted-Talented Pct
Special Education
Pct
Vocational Education
Pct
Avg Beg. Teacher Salary
TranspoSmall-Mid
AdjustSparsity Adjust
F-ScoreAdj R2
Full Model
Adj R2 Property
and M&O
2005 0.096 0.454 0.065 0.077 --- 0.140 0.094 -0.150 0.225 0.085 0.309 115.357 0.573 0.291
2006 --- 0.483 --- 0.083 0.081 0.103 0.106 -0.116 0.195 0.077 0.254 93.413 0.522 0.318
2007 --- 0.450 --- --- --- 0.058 0.145 -0.061 0.277 0.124 0.244 107.080 0.556 0.323
2008 --- 0.576 0.068 --- --- 0.062 0.168 -0.140 0.204 0.102 0.240 169.391 0.665 0.444
2009 --- 0.507 --- --- --- --- 0.168 -0.082 0.267 0.121 0.230 130.774 0.610 0.389
Average LPP 0.494 LPP LPP LPP 0.091 0.136 -0.110 0.234 0.102 0.255 123.203 0.585 0.353
Year Tax RateAssessed
Value
Bilingual Education
Pct
Econ Disad Pct
Gifted-Talented Pct
Special Education
Pct
Vocational Education
Pct
Avg Beg. Teacher Salary
TranspoSmall-Mid
AdjustSparsity Adjust
F-Score Adj R2
Full Model
Adj R2 Property
and M&O
2005 0.058 0.472 0.075 --- 0.053 0.139 0.102 -0.074 0.216 0.068 0.037 105.588 0.551 0.332
2006 --- 0.533 --- --- 0.081 0.083 0.103 -0.083 0.183 --- 0.239 95.433 0.527 0.379
2007 0.056 0.501 --- --- --- 0.058 0.131 --- 0.273 0.100 0.224 110.678 0.564 0.380
2008 --- 0.614 0.090 --- --- 0.060 0.150 -0.099 0.201 0.083 0.218 164.055 0.657 0.493
2009 --- 0.528 --- --- --- --- 0.146 --- 0.265 0.076 0.179 103.419 0.552 0.406
Average LPP 0.530 LPP LPP LPP 0.085 0.126 LPP 0.228 0.082 0.179 115.835 0.570 0.398
All Funds Revenues
Standardized Regression Coefficients
Standardized Regression Coefficients
Appendix 1.Analysis of Texas FSP Components for All Texas Public School Districts in
Predicting Combined State and Local Revenues per Student2005-09
General Fund Revenues
Other significant predictors of combined state and local general fund revenue per pupil were
percentage of students receiving vocational education services, the small-mid-size adjustment
which also controls for low enrollment districts, and average beginning teacher salary. Here, it is
important to note, that average beginning teacher salary actually has an inverse relationship to
revenue. There were no consistent statistically significant relationships between combined state
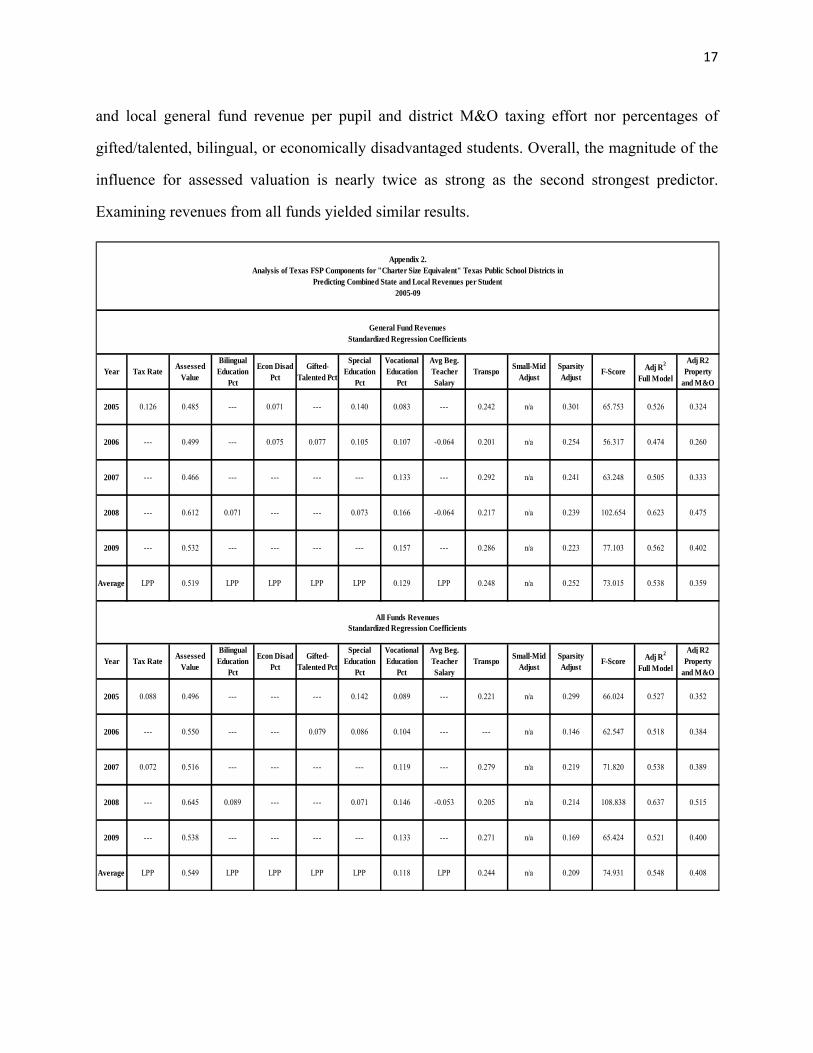
17
and local general fund revenue per pupil and district M&O taxing effort nor percentages of
gifted/talented, bilingual, or economically disadvantaged students. Overall, the magnitude of the
influence for assessed valuation is nearly twice as strong as the second strongest predictor.
Examining revenues from all funds yielded similar results.
Year Tax RateAssessed
Value
Bilingual Education
Pct
Econ Disad Pct
Gifted-Talented Pct
Special Education
Pct
Vocational Education
Pct
Avg Beg. Teacher Salary
TranspoSmall-Mid
AdjustSparsity Adjust
F-Score Adj R2
Full Model
Adj R2 Property
and M&O
2005 0.126 0.485 --- 0.071 --- 0.140 0.083 --- 0.242 n/a 0.301 65.753 0.526 0.324
2006 --- 0.499 --- 0.075 0.077 0.105 0.107 -0.064 0.201 n/a 0.254 56.317 0.474 0.260
2007 --- 0.466 --- --- --- --- 0.133 --- 0.292 n/a 0.241 63.248 0.505 0.333
2008 --- 0.612 0.071 --- --- 0.073 0.166 -0.064 0.217 n/a 0.239 102.654 0.623 0.475
2009 --- 0.532 --- --- --- --- 0.157 --- 0.286 n/a 0.223 77.103 0.562 0.402
Average LPP 0.519 LPP LPP LPP LPP 0.129 LPP 0.248 n/a 0.252 73.015 0.538 0.359
Year Tax RateAssessed
Value
Bilingual Education
Pct
Econ Disad Pct
Gifted-Talented Pct
Special Education
Pct
Vocational Education
Pct
Avg Beg. Teacher Salary
TranspoSmall-Mid
AdjustSparsity Adjust
F-Score Adj R2
Full Model
Adj R2 Property
and M&O
2005 0.088 0.496 --- --- --- 0.142 0.089 --- 0.221 n/a 0.299 66.024 0.527 0.352
2006 --- 0.550 --- --- 0.079 0.086 0.104 --- --- n/a 0.146 62.547 0.518 0.384
2007 0.072 0.516 --- --- --- --- 0.119 --- 0.279 n/a 0.219 71.820 0.538 0.389
2008 --- 0.645 0.089 --- --- 0.071 0.146 -0.053 0.205 n/a 0.214 108.838 0.637 0.515
2009 --- 0.538 --- --- --- --- 0.133 --- 0.271 n/a 0.169 65.424 0.521 0.400
Average LPP 0.549 LPP LPP LPP LPP 0.118 LPP 0.244 n/a 0.209 74.931 0.548 0.408
Standardized Regression Coefficients
Appendix 2.
2005-09
General Fund Revenues
Analysis of Texas FSP Components for "Charter Size Equivalent" Texas Public School Districts inPredicting Combined State and Local Revenues per Student
All Funds RevenuesStandardized Regression Coefficients

18
For “charter size equivalent” ISDs, the strongest predictor of combined state and local
general fund revenue per pupil also is assessed valuation from 2005-2009 examined (see
Appendix Chart 2, p. 17). The full model exhibited an adjusted R-square of 53.8% with 35.9
percentage points solely accounted for by assessed value and M&O rate (i.e., approximately 67%
of the explained variation shown in revenue is caused by changes in assessed valuation). The
standardized beta coefficient ranged from 0.466 up to 0.612; and, were statistically significant
for all years . The second strongest predictor – the sparsity adjustment controlling for low
enrollment ISDs – had coefficients ranging from 0.223 up to 0.301; and, were statistically
significant for all years examined. And, the third strongest predictor – transportation costs – had
coefficients ranging from 0.201 up to 0.292; and, were statistically significant for all years
examined. To a lesser extent, the percentage of students receiving vocational educational
services also was the only other statistically significant predictor of revenues. Overall, the
magnitude of the influence for assessed valuation is more than twice as strong as the second
strongest predictor. Examining revenues from all funds yielded similar results.
Summary: An Efficacy Analysis of FSP Components
As such, in its efforts to improve levels of equity in Texas, the state’s distribution formula is
failing to “counter-balance” the effect of local spending efforts. Moreover, given that the
magnitude and influence of local expenditures is the primary predictor for expenditure levels
across multiple spending categories, it can be inferred that general levels of equity are dictated
specifically by levels of local property values. Of particular note is the effect the influence of
local expenditures also is having on one specific demographic subgroup: students receiving
bilingual services. Therefore, if education finance equity and equality of educational opportunity
is to remain a policy goal for the State of Texas, the Foundation School Program – and its
structural components – needs to be reconceptualized and restructured to alleviate fiscal
inequities. In particular, attention needs to focus on: 1) Cost of Education Index – The structure
of the regression used to calculate the index needs to be evaluated to determine its efficacy. Due

19
to model specification errors, collinearity of independent predictors, or data errors, estimators –
and the predictions based on them – may be producing spurious equalization results; and, 2)
Community Complexity – The current fiscal capacity index does not (nor FSP) alleviate negative
– or reward positive – community characteristics; as a result, school districts with differential
school climates are being under-funded (or over-funded) by the state.

20
ABOUT THE CONSULTANTS
Dr. R. Anthony Rolle, Professor of K-12 Education Finance and Economics at the University of South Florida, conducts research that explores and improves relative measures of economic efficiency for public schools. Concomitantly, his research explores and applies measures of vertical equity to analyses of state education finance mechanisms. Utilizing these techniques recognizes that demographic differences among communities affect organizational processes; and, does not assume that all public schools have the same expenditure priorities. Dr. Rolle’s work is published in books, journals, and monographs such as To What Ends and By What Means? The Social Justice Implications of Contemporary School Finance Theory and Policy (2007), Modern Education Finance and Policy (2007), Measuring School Performance and Efficiency (2005), Journal of Education Finance, Peabody Journal of Education, School Business Affairs, School Administrator, and Developments in School Finance. In addition, Dr. Rolle has conducted K-12 education finance and policy research for such organizations as the University of Washington's Institute for Public Policy & Management, the Washington State Legislature and Democratic House Majority Whip, the Indiana Education Policy Center, the National Education Association, the Texas House of Representatives’ Office of the Speaker, the Office of U.S. Representative Jim Cooper (5th District - Nashville, TN) as well as agencies and commissions in Arkansas, Colorado, Missouri, North Carolina, South Carolina, Tennessee, and Texas. Formerly a member of the Board of Directors for the American Educational Finance Association (AEFA), and the 2002 AEFA Jean Flanigan Dissertation Award winner, Dr. Rolle received a Bachelor of Science in Political Science from Santa Clara University; a Masters Degree in Public Administration from the University of Washington's Graduate School of Public Affairs; and, a Ph.D. in Educational Policy Studies from the School of Education at Indiana University.
Dr. R. Craig Wood, past President of the American Education Finance Association, is one
of the leading scholars in the field of public education finance. He currently is a Research Foundation Professor at the University of Florida. Dr. Wood’s theoretical and applied research regarding the constitutional challenges of state methods of distributing school finance aid has appeared in a number of scholarly journals, chapters, and texts. In fact, he is one of the most prolific authors in America regarding constitutional challenges to state aid plans. Dr. Wood’s publication record includes more than 250 book chapters, monographs, and scholarly journal articles including the American Education Finance Association’s Annual Yearbooks, Journal of Education Finance, Education Law Association’s Handbook of School Law series. His books include Education Finance Law, Fiscal Leadership for Schools, Principles of School Business Management, and Money and Schools. His latest text, Financing Public and Private Education is forthcoming. Additionally, Dr. Wood is the executive editor of the Florida Journal of Educational Administration & Policy; and, he serves on the editorial boards of West’s Education Law Reporter, Journal of Education Finance, and Educational Considerations and the University of Florida Journal of Law and Public Policy. He has conducted education finance litigation workshops for the National Conference on State Legislatures and the National Association of Attorneys General. Dr. Wood’s education finance litigation activities include serving as lead expert for states of Florida, Missouri, Montana, South Dakota and recently designed the education finance distribution formula for the state of Missouri, which has withstood constitutional challenges.
Related Documents