Claudia Morrell, MS, MA, Senior Consultant, NAPE Carolyn Parker, PhD, Assistant Professor, JHU School of Education Edited by Nancy Tuvesson, MBA, Research Associate, NAPE A report developed for the Multi-stakeholder Coalition for Building a Diverse U.S. STEM Workforce

Welcome message from author
This document is posted to help you gain knowledge. Please leave a comment to let me know what you think about it! Share it to your friends and learn new things together.
Transcript

i
Claudia Morrell, MS, MA, Senior Consultant, NAPE
Carolyn Parker, PhD, Assistant Professor, JHU School of Education
Edited by Nancy Tuvesson, MBA, Research Associate, NAPE
A report developed for the Multi-stakeholder Coalition for
Building a Diverse U.S. STEM Workforce

Solving the Education Equation i
This report represents the work of a grassroots, multi-stakeholder coalition representing businesses, nonprofits,
civil rights groups, K-12 and higher education, associations, and quasi-governmental agencies concerned about
advancing U.S. global security and competitiveness through a strong STEM workforce. The Multi-stakeholder
Coalition for Building a Diverse U.S. STEM Workforce has contributed to the formation of this report and
supports its recommendations.
The Coalition thanks the National Alliance for Partnerships in Equity (NAPE) and its Education Foundation
and the Johns Hopkins University School of Education for its work in convening stakeholders and providing
leadership in re-visioning the education equation to achieve equally high academic outcomes for all students,
regardless of race, gender, language, family income, or physical ability, leading to high-skill, high-wage, high-
demand careers.
NAPE, chartered in 1990, is a consortium of state and local education and workforce development agencies,
corporations, and national organizations committed to building educators’ capacity to implement effective
solutions for increasing student access, educational equity, and workforce diversity. The NAPE Education
Foundation, Inc. (the Foundation) was established in 2002 in response to requests for assistance with
program improvement efforts by education and workforce agencies across the nation. The Foundation shares
NAPE’s commitment to the advancement of access, equity, and diversity in classrooms and workplaces.
The Johns Hopkins University School of Education was established in 2007 and has quickly taken a place
as a national leader in education reform through research and teaching. Ranked first nationally among graduate
schools of education by U.S. News & World Report, the school is engaged in a variety of research and
development activities that are making lasting improvements in student achievement—from early childhood to
the adult learner.

Solving the Education Equation ii
Contributors
The following individuals representing diverse organizations contributed their advice and guidance during the
development of this report.
Lezli Baskerville, President, CEO, National Association for Equal Opportunity in Higher Education
Barbara Bitters, Senior Consultant, National Alliance for Partnerships in Equity
Bridget Brown, Executive Director, National Association of Workforce Development Professionals
Monica Bruning, Associate Vice Chancellor, Enrollment and Institutional Effectiveness, University of
Minnesota-Duluth
Marie Louise Caravatti, Associate Director of Educational Issues, American Federation of Teachers
Jill Cook, Assistant Director, American School Counselor Association
Muriel Hairston Cooper, Senior Manager Stakeholder Relations and Event Management, Congressional
Black Caucus Foundation, Inc.
Judy D’Amico, Vice President of Development, Project Lead the Way
Derrick Figures, Assistant Director for Legislation, American Federation of Teachers
Barbara Gault, Vice President and Executive Director, Institute for Women’s Policy Research
Stephanie Hirsh, Executive Director, Learning Forward
Gene Irisari, Director, Government Relations, Texas Instruments
Carol Johnson, Manager, Deloitte Consulting
Kate Blosveren Kreamer, Associate Executive Director, National Association of State Directors of Career
Technical Education consortium
Dawn Krusemark, Senior Associate Director, Educational Issues Department, American Federation of
Teachers
Susan Lavrakas, Director, Workforce, Aerospace Industries Association
Mimi Lufkin, Chief Executive Officer, National Alliance for Partnerships in Equity and the NAPE Education
Foundation
Diane Matt, Executive Director, Women in Engineering ProActive Network
Ned McCulloch, Global Issue Manager, Skill Development and Education, North America, IBM
Corporation
Shawn McMahon, Vice President for Policy and Programs, Wider Opportunities for Women
Carol A. Moye, EdD, Assistant Dean, Advisement and Retention, Howard University
Lisa R. Ransom, Senior Policy Advisor, National Alliance for Partnerships in Equity; CEO and Chair,
Augustus F. Hawkins Foundation
Irelene P. Ricks, PhD, Director of Diversity, Life Sciences, Keystone Symposia
Hilary O. Shelton, Director, National Association for the Advancement of Colored People (NAACP)
Washington Bureau & Senior Vice President for Advocacy and Policy
Andre Thornton, Senior Manager for Technical Leadership Programs, Lockheed Martin’s Information
Systems and Global Solutions
Lillian Tsosie-Jensen, Comprehensive Counseling and Guidance Specialist, Utah State Office of
Education
Claus von Zastrow, Chief Operating Officer, Director of Research, Change the Equation
Mary Wiberg, President, National Alliance for Partnerships in Equity Education Foundation
Marie Zwickert, MEd, CSR Manager, Cisco Networking Academy

Solving the Education Equation iii
Supporters
Academic Innovations
Aerospace Industries Association
American School Counselor Association
American Federation of Teachers
American Society for Engineering Education
Augustus F. Hawkins Foundation
AVID Center
Change the Equation
Change the Story: Advancing Women...Powering the Economy (An Initiative of the Vermont Commission
on Women, the Vermont Women’s Fund, and Vermont Works for Women)
CompTIA Creating IT Futures Foundation
Congressional Black Caucus Foundation, Inc.
Delaware Department of Education
Design Connect Create
Did You Know Publishing, Inc.
FIRST
Freescale Semiconductor, Inc.
Her Own Words
High || STEPS, LLC
Learning Forward
Lockheed Martin Corporation
Missouri STEM Foundation
National Association for the Advancement of Colored People (NAACP)
National Association for Multicultural Education
National Education Association
National Girls Collaborative
North Dakota Department of Career and Technical Education
The Ohio State University, The Center for Education and Training for Employment and Work
Project Lead The Way, Inc.
Rockwell Collins
Rutgers, The State University of New Jersey Center for Women and Work
Society of Women Engineers
Report printed courtesy of

Solving the Education Equation iv
Table of Contents
Executive Summary .............................................................................................................................................. 1
Recommendations for Policy and Practice Reform ............................................................................................ 4
The Increasing Challenge of Providing a Strong STEM Workforce ....................................................................... 5
A Growing Shortage of U.S. STEM Workers ..................................................................................................... 5
Reinvigorating Our Goals .................................................................................................................................. 6
The Challenges Regarding the U.S. Education System ........................................................................................ 6
Closing the STEM Achievement Gaps .............................................................................................................. 8
Closing the STEM Interest Gaps ....................................................................................................................... 9
Rethinking the Education Equation ..................................................................................................................... 10
Model One: Creating Classroom Equity .......................................................................................................... 10
Model Two: Creating School and District-wide Equity ..................................................................................... 11
Final Thoughts ................................................................................................................................................ 12
Recommendations for Policy and Practice Reform ............................................................................................. 14
Glossary of Terms .............................................................................................................................................. 17
Endnotes ............................................................................................................................................................ 18

Solving the Education Equation 1
Executive Summary
Never has the need for science, technology,
engineering, and mathematics (STEM) workers been
more critical to expanding our economy, ensuring our
environmental stability, and maintaining our national
defense capabilities. Yet, changing workforce
demographics highlight a growing concern about the
nation’s ability to meet the workforce demands for a
literate and skilled STEM workforce. Today the
United States is faced with the following workforce
challenges in STEM:1
an underrepresentation of women, Blacks,
and Hispanics in STEM jobs at rates lower
than their U.S. population representation;
an aging STEM workforce;
a STEM workforce that is disproportionately
foreign-born compared to other occupations;
and
a demand for science and engineering
workers that will increase at a rate that is
higher than for all occupations (18.7 percent
vs. 14.3 percent).
STEM fields, including those explored within career
and technical education (CTE), offer middle- and
high-skill jobs with significantly higher-than-average
wages, increased employment opportunities and
stability, and transferrable knowledge. The shortage
of STEM professionals is evident, as indicated by
climbing wages and significant job vacancies. For
example, there are currently 4 million job openings
for computer workers alone, and the median time to
fill STEM vacancies is more than twice that for
vacancies in other fields.2 Sixty percent of companies
surveyed by the Business Roundtable and Change
the Equation reported that roughly 200,000 current
U.S. job openings require basic STEM literacy and
42 percent require advanced STEM knowledge.3
Failure to increase the numbers of STEM workers
may have serious consequences, not only for
individuals who remain in low-wage jobs, but also for
our nation in the following ways:

Solving the Education Equation 2
Workforce shortages may increase the risk of critical defense lapses;4
Individuals, their communities, and the nation may lose significant revenues;5 and
The nation’s ability to address growing instability due to climate change and environmental extremes may
be weakened.
This report revises and reinvigorates previously developed goals from the 2011 National Research Council
(NRC) report titled Successful K-12 STEM Education: Identifying Effective Approaches in Science, Technology,
Engineering, and Mathematics6 to expand the STEM workforce by targeting individuals who are least likely to
pursue STEM careers.
Goal 1: Develop fully the achievement, interests, access, and resources needed for female and
underrepresented minority students to improve STEM literacy and close academic gaps for all U.S. students.
Goal 2: Expand the number of female and underrepresented minorities who pursue advanced certificates,
degrees, and careers in STEM fields to ensure full participation of all U.S. students in those fields.
The U.S. educational system must recognize all the required elements (or variables) to increase the numbers of
students who are STEM literate and graduate from high school as college- and/or career-ready in STEM. To
provide a high-quality education, today’s teachers require strong content and pedagogical knowledge, plentiful
quality resources and facilities, and meaningful, rigorous assessments. There is also a growing awareness of the
importance of what students bring to the classroom in terms of social, emotional, and cultural contexts. Research
is beginning to show the effects of these elements on building or impeding student self-efficacy in STEM.
This report discusses the need to rebalance the education equation to include equitable learning environments
to ensure that teaching and learning are rich and relevant to students and connect meaningfully to STEM literacy

Solving the Education Equation 3
and competency. To build a strong STEM workforce, we must first “advance systemic changes that improve
educational policies and practices” to create equitable learning environments.7
This report addresses two recognized gaps that challenge expansion of the STEM workforce:
1. Academic achievement gaps (also referred to as equity gaps that are measured by recruitment, retention,
performance, and completion) between White/Asian students and students of color that are evident in
most rigorous STEM courses and programs.
2. A lack of interest in STEM courses and careers, particularly among females, people of color, and people
with disabilities, because of entrenched cultural attitudes and beliefs about innate abilities.
Although achievement and interest gaps present two distinct challenges, there is one common solution: address
the culturally based explicit and implicit biases that exist in education (particularly in STEM courses and
programs) and create inclusive, culturally responsive, equitable learning environments for every student.
The cost of failure is high. If we do not close achievement gaps in the next 35 years, then the U.S. economy is
estimated to lose $14.7 trillion and the U.S. government is estimated to lose $5.3 trillion in revenues.8 In
mathematics alone, the United States could lose $75.0 trillion in Gross Domestic Product (GDP) over the next 80
years. 9
Individual and community diversity provides the foundation for our culture (our strongest export), cultivates our
innovation and drive, and provides a quality of life that is the envy of the world. However, the value of human
diversity as an important variable in the education equation has yet to be satisfactorily recognized and
addressed.
CHARACTERISTICS OF EQUITABLE LEARNING ENVIRONMENTS
1. Educators and policy makers are aware of and responsive to the ways that diverse students may
be marginalized by our current education system;
2. Educators take seriously the multiple perspectives, values, experiences, and beliefs of their
students and their families and create daily opportunities for community contributions and
collaboration; and
3. Classrooms are student-centered in that students are responsible for their own learning and self-
assessment, are provided opportunities for free inquiry, experience learning relevant to their lives,
and participate in collaborative learning and continuous reanalysis to learn essential knowledge.

Solving the Education Equation 4
Recommendations for Policy and Practice Reform
Incorporate Evaluation into Regulation
Create regulatory procedures, with funding mechanisms, for tracking and evaluating efforts to ensure that all
educators are competent to provide an accessible, inclusive, and equitable learning environment for every
student in STEM.
Provide Proven Professional Development
Work with policymaking authorities to expand the standard
for highly qualified educators to include the ability to
provide an equitable learning environment for every
student in STEM, and support local and state education
agencies, accredited schools of education, technical
assistance organizations, and education practitioners to
provide professional learning so that every educator
achieves the higher standard.
Measure Progress with Disaggregated Data
Require the use of accountability indicators and disaggregated sociodemographic data to measure progress
toward closing achievement and interest gaps in STEM through policy and practice reform at the local, state, and
national levels.
Conduct Targeted Research
Provide federal funding for pilot research studies that can deepen our understanding of the potential for equity in
education to rapidly narrow achievement and interest gaps, as well as of the results of the strategies employed.
Report Progress to Congress
Every 5 years, conduct an evaluation and prepare a report to Congress that describes the nation’s progress
toward closing achievement and interest gaps in STEM for every student by 2050.
Build Databases of Quality Research and Practices
Work collaboratively with nonprofits and minority-serving institutions that purposefully serve low-income and first-
generation college students to build and connect databases that host quality research and practice to broaden
our understanding of equitable learning environments to ensure that every student is STEM proficient.
“One looks back with appreciation to the
brilliant teachers, but with gratitude to
those who touched our human feelings.
The curriculum is so much necessary raw
material, but warmth is the vital element for
the growing plant and for the soul of the
child.”—Carl Jung

Solving the Education Equation 5
The Increasing Challenge of Providing a Strong STEM Workforce
A Growing Shortage of U.S. STEM Workers
The unemployment rate among STEM occupations is
approximately half of the national average and in some
cases, such as computer and information systems managers,
slightly greater than 3 percent.10 This tight labor market
combined with an aging STEM workforce11 raises concerns
for business growth. Of member businesses surveyed by the
Business Roundtablea and Change the Equation,b 97 percent
stated that the STEM skills shortage is a problem.12 Sixty
percent of those companies’ roughly 200,000 job openings
require basic STEM literacy and 42 percent require advanced
STEM knowledge. In addition, companies will need to replace
945,000 U.S. workers who have basic STEM literacy and
635,000 U.S. workers who have advanced STEM knowledge
over the next 5 years. Of great concern is that 38 percent of
companies state that at least half of their U.S. job applicants
lack basic STEM skills.13
Heightened concerns over national security and defense
against cyberterrorism require that our best and brightest
workers be U.S. citizens. Although finding STEM workers is
challenging, finding Ph.D.-level qualified workers is even
more problematic. Currently, 66 percent of computer and
mathematical scientists and engineers in the United States
with doctorates are not U.S. citizens.14
Perhaps most concerning is our continued failure to attract
more students to STEM education and careers. Female
participation in engineering, computing, and advanced
manufacturing has remained flat since 2001. Although the
Black and Hispanic percentages in the workforce population
have steadily increased, their relative participation in these
fields has declined for more than a decade.
According to the Business-Higher Education Forum (BHEF),
17 percent of high school seniors are both proficient in math
and interested in the STEM fields.15 Among Black students
(who are underrepresented in STEM), only 6 percent are
interested in STEM careers and college-ready in math.
a Businessroundtable.org.
b Changetheequation.org.

Solving the Education Equation 6
Among other underrepresented groups, such as females, Hispanics, Native Americans, and students with
disabilities, similarly low interest or achievement inhibit access to STEM careers. BHEF concludes that the
“cur rent interest in STEM fields and proficiency in math are not sufficient to meet U.S. workforce demand.”16 With
the overall number of Hispanic, Black, and Asian students in public K-12 schools now surpassing the number of
White students, the need to address these shortages becomes even more pressing.
Reinvigorating Our Goals
A 2011 report from the National Research Council (NRC) titled Successful K-12 STEM Education: Identifying
Effective Approaches in Science, Technology, Engineering, and Mathematics17 established three ambitious
goals. This report’s authors have modified and condensed these goals to address the growing chasm between
supply and demand of a skilled STEM workforce.
Goal 1: Develop fully the achievement, interests, access, and resources needed for female and
underrepresented minority students to improve STEM literacy and close academic gaps for all U.S. students.
Goal 2: Expand the number of female and underrepresented minorities who pursue advanced certificates,
degrees, and careers in STEM fields to ensure full participation of all U.S. students in those fields.
This report integrates decades of research and practice to highlight the importance of students’ cultures, races,
ethnicities, languages, genders, classes, disabilities, income, and geography as critical factors that define the
classroom experience and are the key missing ingredients in creating an equitable learning environment for all
students.
The Challenges Regarding the U.S. Education System
Public education has been undergoing reform for more than 50 years with limited success, particularly among
low-income students, non-Asian minority students, and students with disabilities.18 Although females have made
significant progress in school performance and college enrollment and completion, they remain
underrepresented in many STEM careers.
Reform efforts have increasingly focused on teacher content and pedagogical competency, which have evolved
as technology innovates. Businesses voice their needs for soft skills, and teachers are expected to have the
knowledge and capacity to build these skills in their students, which include problem solving, collaboration and
teamwork, critical thinking, multicultural competence, and initiative. Current education models that are more
didactic and teacher-centered often do not focus on developing soft skills but rather meeting the demands of
high-stakes assessments. The result is an education system that does not meet the expectations of 21st-
century STEM jobs and fails to connect to the culture of students’ lives today.

Solving the Education Equation 7
Recognizing the importance of increasing the STEM
workforce, President Obama launched “Educate to
Innovate” in 2010. This campaign involves improving
the participation and performance of U.S. students in
STEM by setting three priorities:
1. Increase STEM literacy so that all students can
learn deeply and think critically in STEM.
2. Move U.S. students from the middle to the top of
the rankings in the next decade.
3. Expand STEM education and career opportunities for underrepresented groups, including women and girls.
The President’s Council of Advisors on Science and
Technology (PCAST) report titled Prepare and Inspire:
K-12 Education in Science, Technology, Engineering,
and Math (STEM) for America’s Future (PCAST)19
recommended that 100,000 excellent STEM educators
be hired over the next decade. The report defined an
excellent STEM educator as one who has deep content
knowledge of STEM subjects and mastery of the pedagogical skills required to teach them, but it did not
acknowledge classroom-based cultural awareness, sensitivity, and competence as critical qualifications.
In 2012, PCAST released Engage to Excel: Producing One Million Additional College Graduates with Degrees in
Science, Technology, Engineering, and Mathematics,20 which made additional recommendations focused on the
first 2 years of postsecondary education. This report stated that women and members of multicultural groups, the
“underrepresented majority,” must have full access to STEM pathways and suggested adoption of STEM
teaching strategies that emphasize student engagement as one of three means to achieve excellence in STEM.
Although moving in the right direction, the recommendations fall short of the system-wide refocus needed to
create an educational model that closes achievement and interest gaps.
To date, most educational efforts in the United States have focused on equality, or the right of every student to
have a high-quality educational experience, including highly qualified educators, a safe environment, excellent
curriculum, diverse pedagogy, quality resources, and access to afterschool programs, role models, mentors, and
other support resources. No doubt, if every student had access to all of these benefits, then student outcomes
would improve. However, providing equal education is not equivalent to providing equitable education because
across the nation our students do not enter classrooms on an equal footing. Students experience education very
differently depending on the school’s location (i.e., urban, suburban, and rural), funding, age, resources, and
family and community support.
To improve STEM literacy and expand the STEM workforce, the nation should finally and firmly address the two
entrenched barriers that seem resistant to change.
1. Academic achievement gaps between White/Asian students and students of color that are evident in
most rigorous STEM courses and programs.
IN A MEMO TO THE PRESIDENT’S
EDUCATE TO INNOVATE CAMPAIGN,
more than 8,000 individuals and equity
organizations requested that the White
House “help educators change their
interactions with students to engage and
motivate all students by learning and acting
to dispel stereotypes, build self-efficacy and
confidence in students, change the
classroom climate for underrepresented
students, and change the mindset of
everyone that these talents can be learned
by many, not few.”
NCWGE, MEMO to the EDUCATE to INNOVATE CAMPAIGN from “the July 19th COLLABORATION” and REPORT on “the July 19th COLLABORATION” Meeting, napequity.org/educate-innovate-memo.

Solving the Education Equation 8
2. A lack of interest in STEM courses and careers, particularly among females, people of color, and people
with disabilities, because of entrenched cultural attitudes and beliefs about innate abilities.
Closing the STEM Achievement Gaps
The education equation is imbalanced because the contributing factors that lead to STEM achievement gaps
have not always aligned with the recommended solutions to address them. Extensive research on diverse
student achievement has revealed that the gaps can be largely explained by community and school-based
inequities, including the following causes:
inequities in student resources;
school and teacher attitudes;
student motivation;
school environment;
family experience with education;
cultural norms;
racism, prejudice, and segregation; and
poverty.21
For females, students of color, English language learners, students with disabilities, and students living in
poverty, implicit biases can offer a very different educational experience than for White and Asian students,
particularly in STEM.
When the data are disaggregated by race, the achievement
gaps widen even more, with Black/African American and
Hispanic/Latino students having less access to mathematics
and science courses, lower participation rates in algebra I,
one-half their expected participation rates in calculus, and an
almost 20 percentage point gap in AP exam passage rates
as compared to their White peers.22 These gaps in
participation, performance, and persistence in middle school
and high school translate into even larger gaps in
postsecondary education and employment.
Disparate academic scores have led to very different dropout
rates: 42 percent of Hispanic, 43 percent of African
American, 46 percent of American Indian, 17 percent of
Asian, and 22 percent of White students will not graduate on
time with a high school diploma.23 National and state leaders
need to ask “How can we expand the STEM workforce with
high percentages of students not completing high school?”
By not considering all elements of the education equation, our outcomes will continue to come up short.
Many high-quality programs have been initiated to increase diverse student participation in STEM. Project Lead
the Wayc and FIRSTd are two examples of excellent engineering programs that struggle to recruit females and
minorities. One solution has been to offer bioengineering options, which has worked well to recruit females but
does not address the core problem—that is, the cultural biases that remain in traditional engineering education
programs (e.g., electrical, computer, chemical, mechanical, civil, and aerospace). The teachers and informal
c pltw.org.
d usfirst.org/?gclid=CK7JisXAxsQCFUo6gQodqKgAsg.

Solving the Education Equation 9
educators who often run these programs, like most educators, have little understanding of the needs of the
changing diversity of students and the cultural influences and biases that negatively impact student interest and
achievement. In fact, well-intentioned efforts focused on students who are low performing or underrepresented in
a course or program may actually backfire and reinforce the very stereotypes they are trying to address. In 2011,
the NRC presented K-12 indicators for high-quality STEM education.24,25 Missing was a strong imperative to
address the achievement and interest gaps among diverse students.
One of the most pressing education policy challenges that states face is the concern over closing the
achievement gap; it is also one of the most commonly referenced phrases in the education discussion
today.26 Since 1965, recognition of the need to provide teachers with professional development related to the
realities and complexities of racially diverse communities to ensure the “stability and survival of our society”27 has
been a call to action that has been largely ignored. Our inability to build a STEM workforce hinges on our ability
to finally address this historical debt in education.
Closing the STEM Interest Gaps
Recent work by Change the Equation demonstrated that the participation of minorities in the STEM workforce is
declining and female participation is stagnant in many STEM fields.28 Although the achievement gaps may
explain these outcomes, the cultural biases related to gender and race have created barriers to classroom equity
and exposure and access to STEM courses and careers. Few students or parents understand the options for
educational pathways to STEM, including CTE certifications, apprenticeships, associate degrees, as well as 4-
year degrees.
Although the enrollment and achievement gaps between
boys and girls in mathematics and science have been
reported as narrowed,29 further study reveals that the
interest gap continues to exist in STEM and females
continue to be underrepresented and underperforming in
rigorous mathematics, physics, and STEM-related CTE
programs of study. Although women now receive 57.2
percent of bachelor’s degrees in all fields, they remain
significantly underrepresented in many STEM degree
fields.30 Women earn 18.4 percent of engineering, 18.2
percent of computer science, and 43.1 percent of
mathematics and statistics degrees.31 Women of color
earn slightly greater than 10 percent of all science and
engineering bachelor’s degrees.32 Concurrently, women
and people of color are overrepresented in the lowest
paying occupations.33
Many efforts to date have overlooked the profound
impact of cultural biases in the classroom on student
identity and interest in course and career outcomes. Without awareness, educators, parents, and other adults
inadvertently and unconsciously discourage underrepresented students from pursuing rigorous courses and
career fields, particularly in STEM.34,35,36,37 Cultural bias about STEM education and who can be successful

Solving the Education Equation 10
within it has led to educational inequities that cause students to avoid the field, or if attempted, to drop out to
avoid the perceived failure.38
Rethinking the Education Equation
Students, educators, counselors, and administrators walk into schools and classrooms every day with
enculturated biases and beliefs that impact students’ self-efficacy, attributions, and beliefs about their academic
abilities and career options. The impact of these implicit biases is reflected in the growing gap in STEM course
and program enrollment, retention, performance, and persistence of underrepresented students—including
females, Black/African Americans, Hispanic/Latino, American Indian/Alaskan Natives,e English language
learners, students with disabilities, and students from low-income homes and communities—in rigorous STEM
courses and programs, including CTE.
The current education framework39 has been unable to address the needs of diverse students and the demands
by business for a more technically literate workforce. Input from students, educators, and families can
meaningfully impact school curriculum, practice, and policy, including assumptions, values, and traditions in
terms of race, class, gender, sexual orientation, ability, language, and how students learn.40 Student-centered
learning that incorporates soft skill development with content can frame a new teaching and learning experience.
Two models for building equitable learning environments are provided here.
Model One: Creating Classroom Equity
In 2013 NAPE published a new model recognizing school
and community culture as an important part of the education
equation. The NAPE Culture Wheel41 advances a model that
incorporates (1) micromessages (small, often subtle and
unconscious messages that communicate our biases to
others) to better frame the connection between implicit and
explicit cultural bias, (2) their powerful influence in
classrooms and educational programs, and (3) the impact
over time of micro-inequities (negative micromessages) on
students’ self-efficacy and their resulting behaviors. The
authors of that model and this report hypothesize that
beliefs about an individual’s ability and interest in STEM are
influenced by cultural biases connected to gender, race,
income level, class, language, or (dis)ability, and that these
biases shape our communication in intentional and
unintentional ways. This is true in all educational settings
but is most observable in STEM programs where the enrollment and performance imbalances are largest. Micro-
inequities can discourage a student from selecting a STEM course or career.42 Students who demonstrate a
perceived lack of interest, prematurely withdraw from a class or program, or declare themselves “bad” in a
subject may be avoiding the risk of failure that they perceive as inevitable based on their own sense of self-
efficacy. Shared among a large group, these behaviors shape the beliefs that we all witness and form our
e The race and ethnicity categories align with those of the National Center for Education Statistics,
nces.ed.gov/ipeds/reic/definitions.asp.
NAPE Culture Wheel
Solving the Education Equation 11
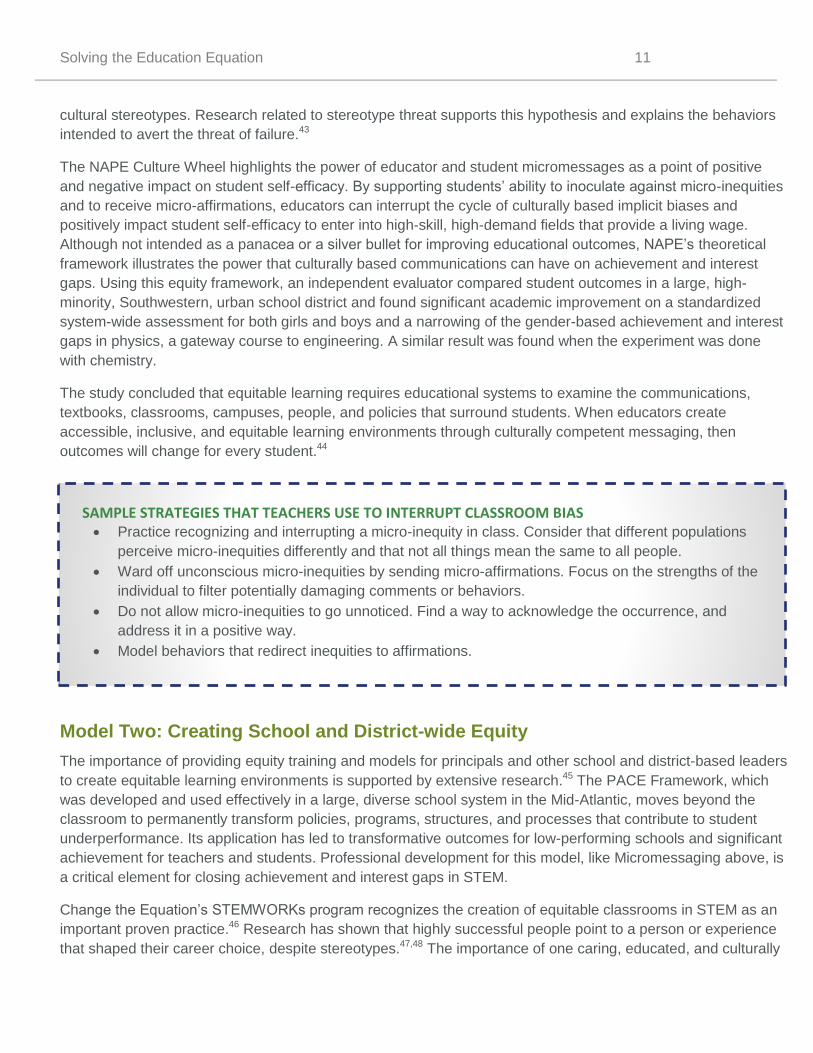
cultural stereotypes. Research related to stereotype threat supports this hypothesis and explains the behaviors
intended to avert the threat of failure.43
The NAPE Culture Wheel highlights the power of educator and student micromessages as a point of positive
and negative impact on student self-efficacy. By supporting students’ ability to inoculate against micro-inequities
and to receive micro-affirmations, educators can interrupt the cycle of culturally based implicit biases and
positively impact student self-efficacy to enter into high-skill, high-demand fields that provide a living wage.
Although not intended as a panacea or a silver bullet for improving educational outcomes, NAPE’s theoretical
framework illustrates the power that culturally based communications can have on achievement and interest
gaps. Using this equity framework, an independent evaluator compared student outcomes in a large, high-
minority, Southwestern, urban school district and found significant academic improvement on a standardized
system-wide assessment for both girls and boys and a narrowing of the gender-based achievement and interest
gaps in physics, a gateway course to engineering. A similar result was found when the experiment was done
with chemistry.
The study concluded that equitable learning requires educational systems to examine the communications,
textbooks, classrooms, campuses, people, and policies that surround students. When educators create
accessible, inclusive, and equitable learning environments through culturally competent messaging, then
outcomes will change for every student.44
Model Two: Creating School and District-wide Equity
The importance of providing equity training and models for principals and other school and district-based leaders
to create equitable learning environments is supported by extensive research.45 The PACE Framework, which
was developed and used effectively in a large, diverse school system in the Mid-Atlantic, moves beyond the
classroom to permanently transform policies, programs, structures, and processes that contribute to student
underperformance. Its application has led to transformative outcomes for low-performing schools and significant
achievement for teachers and students. Professional development for this model, like Micromessaging above, is
a critical element for closing achievement and interest gaps in STEM.
Change the Equation’s STEMWORKs program recognizes the creation of equitable classrooms in STEM as an
important proven practice.46 Research has shown that highly successful people point to a person or experience
that shaped their career choice, despite stereotypes.47,48 The importance of one caring, educated, and culturally
SAMPLE STRATEGIES THAT TEACHERS USE TO INTERRUPT CLASSROOM BIAS Practice recognizing and interrupting a micro-inequity in class. Consider that different populations
perceive micro-inequities differently and that not all things mean the same to all people.
Ward off unconscious micro-inequities by sending micro-affirmations. Focus on the strengths of the
individual to filter potentially damaging comments or behaviors.
Do not allow micro-inequities to go unnoticed. Find a way to acknowledge the occurrence, and
address it in a positive way.
Model behaviors that redirect inequities to affirmations.

Solving the Education Equation 12
competent adult in fostering an interest in and capability for STEM for each child cannot be overstated. Often,
after primary caregivers, such as parents, the adult with the most contact time with a child is an educator.
Perhaps one of the most appealing elements of an equitable learning environment is how well it aligns with
business needs for the development of soft skills. Equitable learning environments are characterized by the
following:
Group work and collaboration
Continuous redesign and
improvement
Respect and value for
nontraditional or culturally
different behaviors
Complexity, struggle, risk-
taking, and creative solutions
Adjustable timelines and
course corrections.
By adding the missing variable, that is,
what students bring to the classroom,
to the education equation, not only will
we attract and retain more diverse
students in STEM, but also they will be
better prepared for the global
workforce they must now enter.
Final Thoughts
The benefits of closing the achievement gap on GDP are significant. The Center for American Progress
estimates the average annual benefit to GDP alone between 2014 and 2050 would be $551.0 billion.49 By
another estimate, by 2050 cumulative increases in GDP could amount to $14.7 trillion and tax revenues could
increase by $5.3 trillion; by 2075, these numbers could be $86.5 trillion and $32.4 trillion, respectively.50 The
impact of closing just the mathematics achievement gap over the next 80 years could yield a cumulative
increase in GDP of $75.0 trillion.51 Addressing the interest gap in addition to the achievement gap could increase
our GDP to unimagined levels.
As the decade reaches a critical halfway point, the authoring organizations of this report, NAPE and the Johns
Hopkins University School of Education, along with the supporters listed within this report, call for a review,
renewed thinking, and reconsideration of the education equation so that all students can finally benefit from the
high levels of knowledge and skills required for robust economic growth; participate in an expanding, thriving
middle class; and enjoy a shared economic prosperity that benefits all Americans.

Solving the Education Equation 13

Solving the Education Equation 14
Recommendations for Policy and Practice Reform
As a nation, we should (1) incorporate evaluation into regulation, (2) provide proven professional development,
(3) measure progress with disaggregated data, (4) conduct targeted research, (5) report progress to Congress,
(6) build databases of quality research and practices.
Create regulatory procedures, with funding mechanisms, for tracking and evaluating efforts to
ensure that all educators are competent to provide an accessible, inclusive, and equitable
learning environment for every student in STEM.
Equity is now a recognized issue in most educational policy efforts, but how it is achieved and measured is less
well understood. Too often equity work is relegated to small equity offices rather than integrated within all
educational domains, from curriculum development to teacher selection and professional development to
building layout and appearance. School and district leaders responsible for educational policies need their own
training to better understand access, equity, and diversity and should take responsibility for and be held
accountable for closing the achievement and interest gaps among all students.
Policies should be put in place that keep individuals and organizations mindful of the importance of placing
access and equity first, rather than as an afterthought once “all” students are considered. This will ensure that
we move the nation forward in purposeful and intentional ways to narrow equity gaps and build the STEM
workforce needed.
Work with policymaking authorities to expand the standard for highly qualified educators to
include the ability to provide an equitable learning environment for every student in STEM, and
support local and state education agencies, accredited schools of education, technical
assistance organizations, and education practitioners to provide professional learning so that
every educator achieves the higher standard.
Problem-based learning and engineering design programs are being successfully infused into classrooms as a
means to better engage all students and improve critical thinking skills, collaboration, and problem solving.
Unless education is viewed through a culturally competent lens, traditional and innovative methods to educate
students will be ineffective for underrepresented students and STEM pathways to college and careers will
remain leaky or clogged for all students.
Evidence strongly indicates that improving classroom equity using culturally sensitive communication that
conveys genuine caring and expectations can directly impact student outcomes. Only through equitable
classroom experiences can every student meet the highest standards of achievement. Until current and future
educators are provided the knowledge, tools, resources, time, processes, and incentives required to build an
equitable learning environment in their schools and classrooms, they will never be fully equipped to provide
every student with what is needed for success in postsecondary education and/or a STEM career.

Solving the Education Equation 15
Require the use of accountability indicators and disaggregated sociodemographic data to
measure progress toward closing achievement and interest gaps in STEM through policy and
practice reform at the local, state, and national levels.
If legislation and policies were to provide funding for accountability systems that measure gaps and the success
of strategies to close them, then the importance of this issue would be elevated for all organizations and not only
those in education. The availability of valid and reliable data disaggregated and cross-tabulated by various
student demographics is critical in this process. Often the availability of these data is driven by the accountability
measures and requirements connected to various education funding sources. Without these data and the policy
requirements that push state and local education agencies to create accountability systems with adequate
sophistication, progress will be significantly hindered.
Provide federal funding for pilot research studies that
can deepen our understanding of the potential for equity
in education to rapidly narrow achievement and interest
gaps, as well as of the results of the strategies
employed.
More research is needed to study programs and processes that
increase access and equity in classrooms to finally close the
achievement and interest gaps for diverse students. Still lacking
are highly rigorous studies that identify effective practices to
inform the development of new models that could move the field
forward. Federal agencies, such as the U.S. Department of
Education, National Science Foundation, U.S. Department of
Labor, and others, should continue to encourage new research,
model building and testing, and dissemination that inform efforts
on behalf of students and workers. Research initiatives that
specifically address underrepresented student interest,
engagement, and achievement must be supported, funded, and
prioritized in the federal research strategy to ensure that pathways
out of poverty are indeed accessible for every individual. Finally,
funding must support efforts to move theory to practice by requiring partnerships between business, education,
and nonprofits so that well-researched pilot programs do not end up collecting dust on shelves.
Every 5 years, conduct an evaluation and prepare a report to Congress that describes the
nation’s progress toward closing achievement and interest gaps in STEM for every student by
2050.
In September 2000, the Congressional Commission on the Advancement of Women and Minorities in Science,
Engineering, and Technology Development released a report highlighting the importance of focusing on women,
minorities, and persons with disabilities as a means to develop a strong STEM workforce. In the executive

Solving the Education Equation 16
summary, the Commission concludes, “[I]f women, underrepresented minorities and persons with disabilities
were represented in the science, engineering, and technology workforce in parity with their percentages in the
total workforce population, this shortage could be largely ameliorated.”52 Fifteen years later the hoped-for
progress has not been realized. If an independent body were charged with careful monitoring and evaluation of
efforts to close the gaps, as well as with high-level reporting out of its results every 5 years, then the nation
would have the tools and time required to measure progress and to correct course.
Work collaboratively with nonprofits and minority-serving institutions that purposefully serve
low-income and first-generation college students to build and connect databases that host
quality research and practice to broaden our understanding of accessible and equitable
learning environments that ensure that every student is STEM proficient.
Transforming educators, educational systems, and systemic practices takes time. One-hour workshops, 1-day
retreats, or 3-day conferences will not affect the change the nation needs. According to the nationally recognized
Standards for Professional Learning (developed by Learning Forward53), transformation takes time, research,
resources, and support provided through communities. As the nation looks to improve education by adding the
variable that builds equitable learning environments, we need to gather the best content knowledge, delivery
mechanisms for that content, and assessment tools that measure impact and sustainability to address the
diverse intersections of culture, race, gender, ability, and poverty that play out in classrooms every day so that
teachers are able to address the achievement and interest gaps.

Solving the Education Equation 17
Glossary of Terms
Achievement Gap—The “disparity in academic performance between groups of students. The achievement gap
shows up in grades, standardized test scores, course selection, dropout rates, college completion rates, and
other success measures” (http://www.edweek.org/ew/issues/achievement-gap/)..
Implicit Bias—Attitudes or stereotypes that affect our understanding, actions, and decisions, in an unconscious
manner.54
Interest Gap—The observed, persistent disparity of expressed interest in STEM by students who are typically
underrepresented in STEM programs and careers.
Intersectionality—A theory that demonstrates the interconnectedness of forms, frameworks, or systems of
oppression, domination, or discrimination to cultural and social constructs, such as race, class, physical ability,
age, and gender.55
Micromessages—Subtle nonverbal messages that people send through facial expressions, body language,
tone or inflection in their voice, the omission of communication, or their physical surroundings.
Multicultural Competence—The ability to understand another culture well enough to be able to communicate
and work with people from that culture.56
Self-efficacy—Belief in one’s ability to be successful (or unsuccessful) in performing an activity or taking on a
program or project. This can be influenced by cultural biases such as “Girls can’t be engineers, so, as a girl, it is
not a career path I will consider.”

Solving the Education Equation 18
Endnotes
1 National Science Foundation. 2014. Science and engineering labor force. Science and Engineering Indicators. Available at
www.nsf.gov/statistics/seind14/content/chapter-3/chapter-3.pdf. 2 Rothwell, J. 2015 (September 15). Short on STEM talent. U.S. News & World Report. Available at
www.usnews.com/opinion/articles/2014/09/15/the-stem-worker-shortage-is-real. 3 Business Roundtable and Change the Equation. Solving the skills gap. Available at businessroundtable.org,
changetheequation.org. 4 Simmons, C. 2011 (November 8). U.S. faces critical shortage of STEM workers. Defense News and Career Advice.
Available at news.clearancejobs.com/2011/11/08/u-s-faces-critical-shortage-of-stem-workers/. 5 Philanthropy News Digest. 2015 (February 4). Closing achievement gap would boost economy report finds. Available at
philanthropynewsdigest.org/news. 6 National Research Council. 2011. Successful K-12 STEM Education: Identifying Effective Approaches in Science,
Technology, Engineering, and Mathematics. Washington, DC: The National Academies Press. 7 Charles Stewart Mott Foundation. n.d.. Improving Community Education. Available at
www.mott.org/FundingInterests/programs/pathwaysoutofpoverty. 8 Philanthropy News Digest. 2015 (February 4). Closing achievement gap would boost economy report finds. Available at
philanthropynewsdigest.org/news. 9 National Math and Science Initiative. n.d. Why STEM education matters. Available at
www.nms.org/Portals/0/Docs/Why%20Stem%20Education%20Matters.pdf. 10
Business Roundtable. Unemployment rates among STEM occupations, compared to the national average, 2012. Available at businessroundtable.org/issues/education-workforce. 11
Change the Equation. 2015. Solving the Diversity Dilemma. Available at http://changetheequation.org/solving-diversity-dilemma. 12
Business Roundtable and Change the Equation. Solving the skills gap. Available at businessroundtable.org, changetheequation.org. 13
Ibid. 14
National Science Foundation. 2014. Science and engineering labor force. Science and Engineering Indicators. Available at www.nsf.gov/statistics/seind14/content/chapter-3/chapter-3.pdf. 15
Business-Higher Education Forum. 2011. Meeting the STEM workforce demand: Accelerating math learning among students interested in STEM. Available at www.bhef.com/sites/g/files/g829556/f/brief_2011_accelerating_math.pdf. 16
Ibid. 17
National Research Council. 2011. Successful K-12 STEM education: Identifying effective approaches in science, technology, engineering, and mathematics. Washington, DC: The National Academies Press. 18
Mehta, J. 2013 (June). Why American education fails and how lessons from abroad could improve it. Foreign Affairs. Available at www.foreignaffairs.com/articles/139113/jal-mehta/why-american-education-fails. 19
President’s Council of Advisors on Science and Technology. 2010. Prepare and Inspire: K-12 Education in Science, Technology, Engineering, and Math (STEM) for America’s Future. Available at www.whitehouse.gov/sites/default/files/microsites/ostp/pcast-stem-ed-final.pdf. 20
President’s Council of Advisors on Science and Technology. 2012. Engage to Excel: Producing One Million Additional College Graduates with Degrees in Science, Technology, Engineering, and Mathematics. Available at www.whitehouse.gov/sites/default/files/microsites/ostp/pcast-engage-to-excel-final_2-25-12.pdf. 21
Oregon Department of Education, Office of Educational Improvement and Innovation. 2005 (August). Closing the Achievement Gap: Oregon’s Plan for Success for All Students. Available at www.cssia.org/pdf/20000022-ClosingtheAchievementGap-Oregon%E2%80%99sPlanforSuccessforAllStudents.pdf. 22
U.S. Department of Education. 2014 (March 21). Civil Rights Data Collection Data Snapshot: College and Career Readiness. Available at www2.ed.gov/about/offices/list/ocr/docs/crdc-college-and-career-readiness-snapshot.pdf. 23
Alliance for Excellent Education. 2011 (November). The High Cost of High School Dropouts: What the National Pays for Inadequate High Schools. Issue Brief. Available at http://all4ed.org/reports-factsheets/the-high-cost-of-high-school-dropouts-what-the-nation-pays-for-inadequate-high-schools/. 24
National Research Council. 2011. Successful K-12 STEM Education: Identifying Effective Approaches in Science, Technology, Engineering, and Mathematics. Washington, DC: The National Academies Press. 25
National Research Council. 2013. Monitoring Progress Toward Successful K-12 STEM Education: A Nation Advancing? Washington, DC: The National Academies Press.

Solving the Education Equation 19
26
Ladson-Billings, G. 2006. 2006 Presidential address; From the achievement gap to the education debt: Understanding achievement in US schools. Educational Researcher 35(7):3-12. 27
Clark, K.B. 1965. Dark Ghetto: Dilemmas of Social Power. Hanover, NH: Wesleyan University Press. 28
Change the Equation. 2015. Solving the Diversity Dilemma. Available at http://changetheequation.org/solving-diversity-dilemma. 29
U.S. Department of Education. 2012 (June). Gender Equity in Education: A Data Snapshot. Available at http://www2.ed.gov/about/offices/list/ocr/docs/gender-equity-in-education.pdf. 30
National Science Foundation. 2013 (February). Women, Minorities and Persons with Disabilities in Science and Engineering. Available at www.nsf.gov/statistics/wmpd/2013/. 31
Ibid. 32
Ibid. 33
U.S. Department of Labor. n.d. The Economic Status of Women of Color: A Snapshot. Available at www.dol.gov/wb/media/reports/WB_WomenColorFactSheet.pdf. 34
Hanson, S.L. 2009. Swimming Against the Tide: African American Girls and Science Education. Philadelphia, PA: Temple University. 35
Singleton, G.E., and C. Linton. 2006. Courageous Conversations About Race: A Field Guide for Achieving Equity in Schools. Thousand Oaks, CA: Corwin. 36
Sevo, R. 2011. Basics about disabilities, science and engineering education. Georgia Tech, Center for Assistive Technology and Environmental Access (CATEA). Directed by Robert L. Todd, PI. Funded via NSF HRD 06-22885. 37
Gorski, P. 2008. The myth of the “culture of poverty.” Educational Leadership 65(7). Available at www.equityallianceatasu.org/sites/default/files/Website_files/Forum%20Presentations/Myth-Culture-of-Poverty%20Paul%20Gorski.pdf. 38
American Association of University Women. 2010. Why So Few? Women in Science, Technology, Engineering, and Mathematics. Available at http://www.aauw.org/learn/research/upload/whysofew.pdf. 39
Mehta, J. 2013 (June). Why American education fails and how lessons from abroad could improve it. Foreign Affairs. Available at www.foreignaffairs.com/articles/139113/jal-mehta/why-american-education-fails. 40
Portelli, J.P., C.M. Shields, and A.B. Vibert. 2007. Toward an Equitable Education: Poverty, Diversity, and Students at Risk. Available at www.academia.edu/398343/Toward_an_Equitable_Education_Poverty_Diversity_and_Students_at_Risk. 41
Morrell, C., and C. Parker. 2013 (Spring). Adjusting micromessages to improve equity in STEM. Diversity & Democracy 16(2). Available at http://www.aacu.org/diversityDemocracy/vol16no2/morrell_parker.cfm. 42
Greenwald, A., and S. Farnham, 2000. Using the Implicit Association Test to measure self-esteem and self-concept. Journal of Personality and Social Psychology 79(6): 1022-1038. 43
Owens, J., and D.S. Massey. 2011. Stereotype threat and college academic performance: A latent variables approach. Social Science Research 40: 150-166. 44
Rhodes, J.E., J.B. Grossman, and N.R. Resch. 2000. Agents of change: Pathways through which mentoring relationships influence adolescents’ academic adjustment. Child Development 71: 1662-1671. 45
Johnson, K., and L. Williams. 2015. When Treating All Kids the Same Is the Real Problem: Educational Leadership in the 21st Century Dilemma of Difference. Thousand Oaks, CA: Corwin. 46
Change the Equation. n.d. STEMworks. Available at http://changetheequation.org/improving-philanthropy/stemworks. 47
Raskind, M. H., R.J.Goldberg, E.L. Higgins, and K.L. Herman. 2003. Life Success for Children with Learning Disabilities: A Parent’s Guide. Available at http://www.ldonline.org/article/12836/. 48
Hawkey, K. 1997. Roles, responsibilities, and relationships in mentoring: A literature review and agenda for research, Journal of Teacher Education 48(5): 325-335. 49
Lynch, R.G., and P. Oakford, 2014 (November). The Economic Benefits of Closing Educational Achievement Gaps: Promoting Growth and Strengthening the Nation by Improving the Educational Outcomes of Children of Color. Available at https://www.americanprogress.org/issues/race/report/2014/11/10/100577/the-economic-benefits-of-closing-educational-achievement-gaps/. 50
Philanthropy News Digest. 2015 (February 4). Closing achievement gap would boost economy report finds. Available at philanthropynewsdigest.org/news. 51
National Math and Science Initiative. n.d. Why STEM education matters. Available at https://www.nms.org/Portals/0/Docs/Why%20Stem%20Education%20Matters.pdf. 52
Congressional Commission on the Advancement of Women and Minorities in Science, Engineering, and Technology. Development Land of Plenty: Diversity as America’s Competitive Edge in Science, Engineering and Technology. Available at http://www.nsf.gov/pubs/2000/cawmset0409/cawmset_0409.pdf. 53
Learning Forward. n.d. Standards for Professional Learning. Available at http://learningforward.org/standards-for-professional-learning#.VDhAZ8tMt2E.

Solving the Education Equation 20
54
Kirwan Institute. 2013. State of the Science: Implicit Bias Review 2013. Available at http://kirwaninstitute.osu.edu/docs/SOTS-Implicit_Bias.pdf. 55
Wikipedia. Intersectionality. Available at http://en.wikipedia.org/wiki/Intersectionality. 56
Kivel, P. 2007. Multicultural Competence. Available at http://www.paulkivel.com/component/jdownloads/finish/1/25/0?Itemid=31.
Related Documents