FOOD INSECURITY AMONG ADULTS WITH DISABILITIES IN COOK COUNTY: REALITIES AND REMEDIES FULL REPORT A REPORT BY THE GREATER CHICAGO FOOD DEPOSITORY

Welcome message from author
This document is posted to help you gain knowledge. Please leave a comment to let me know what you think about it! Share it to your friends and learn new things together.
Transcript

FOOD INSECURITY AMONG ADULTS WITH DISABILITIES IN COOK COUNTY: REALITIES AND REMEDIES
FULL REPORT
A REPORT BY THE GREATER CHICAGO FOOD DEPOSITORY
ACKNOWLEDGMENTS ii
ACKNOWLEDGMENTS
The Greater Chicago Food Depository would like to thank the many organizations and individuals that provided feedback and assistance in the development and execution of this project.
In particular, we are grateful to the many individuals with disabilities who shared their personal stories and challenges with food insecurity.
This work relied heavily on the expertise, guidance, space, and connection to their networks provided by staff at Access Living, Progress Center for Independent Living, and Anixter Center. Tom Wilson from Access Living was especially helpful in providing thoughtful feedback throughout this project.
Staff at Feeding America, AgeOptions, and the Mayor’s Office for People with Disabilities also offered very valuable insight and expertise into the need for food assistance among adults with disabilities in the county while helping to connect us with project participants.
The Chicago Community Trust’s generous support of this project has been instrumental in making this important issue a priority among a wide cross section of stakeholders and bringing the findings to a larger audience.
The Social Impact Research Center of the Heartland Alliance provided input and technical assistance regarding the quantitative analysis and focus groups.
The mission of the Greater Chicago Food Depository, the food bank serving Cook County, is to feed hungry people while striving to end hunger in our community.
Report prepared by Taryn McCook, Research & Evaluation Manager: [email protected] or 773-843-7789.
Media inquiries can be directed to Paul Morello at [email protected] or 773-843-5498.

TABLE OF CONTENTS iii
TABLE OF CONTENTS
1 Letter from Kate Maehr, Executive Director and CEO of the Greater Chicago Food Depository
2 Summary of findings
5 Introduction and background
8 Research methods
11 Section A: Poverty, unemployment, and food insecurity among adults with disabilities in Cook County communities
24 Section B: Food assistance resources available to adults with disabilities in need and estimations of unmet need for food assistance among this population
34 Section C: Barriers to food security among low-income adults with disabilities and strategies used by adults with disabilities to cope with food insecurity.
49 Section D: Discussion of insights
54 Section E: Recommendations to increase food security among low-income adults with disabilities in Cook County
60 Appendices:
• Technical brief on quantitative analysis
• References

LETTER FROM THE EXECUTIVE DIRECTOR 1
DEAR FRIEND OF THE GREATER CHICAGO FOOD DEPOSITORY:
As the food bank serving Cook County, the Greater Chicago Food Depository’s mission is to feed hungry people while striving to end hunger in our community. In order to fulfill our goal of no one going hungry, we must identify who is in need of food assistance, where they are, and how we can best reach them while also working to prevent this need in the first place.
This research report aims to deepen our understanding of inadequate food access specifically in relation to adults with disabilities in Cook County. The limited yet troubling research on disability and food insecurity that existed prior to this project underscored the urgency of doing so. Most notably, a key 2013 United States Department of Agriculture’s Economic Research Service (USDA ERS) report tells us that living with a disability is one of the strongest known factors that affect a household’s food security, and that their food insecurity tends to be more severe.
Disability is a common part of life in Cook County households as it is in communities everywhere. Most all of us face a disability ourselves or we have a family member, friend, or neighbor who does. Addressing this disproportionate occurrence of food insecurity among households with adults with disabilities must therefore be of top concern to us all. Exploring the size of the problem specifically in Cook County, the food assistance services that are currently available to adults with disabilities, and the barriers this population faces in accessing adequate food resources is an important first step.
Our intention for this report is to spark collective conversation around food access and disability while laying out a portfolio of calls-to-action that can be followed to decrease food insecurity through programs and advocacy.
I extend my strongest gratitude to the organizations and individuals that worked with us on this research journey. Your willingness to share your stories and experiences of food insecurity with our staff and partners made this project possible and they will have a profound and lasting impact on the work to end hunger in Cook County.
Kate Maehr Executive Director and CEO, Greater Chicago Food Depository1 Coleman-Jensen, A. et. al, 2013.

SUMMARY OF FINDINGS 2
SUMMARY OF FINDINGS
In 2013, a United States Department of Agriculture (USDA) Economic Research Service (ERS) report found that having a disability was among the strongest known risk factors for food insecurity. Nationally, they estimated that in 2009-2010, 31.8% of households experiencing food insecurity included a working-age adult with a disability.2 Inadequate financial resources, high health care costs, specific dietary needs and more combine with inaccessible community assets such as transportation, housing, and food resources to contribute to this high prevalence of food insecurity among this population. The number of people managing some form of disability and food insecurity will likely only increase in the future unless we all take steps now to address it.
This research provides a jumping off point by exploring the disproportionate prevalence of food insecurity among adults with disabilities in Cook County and assessing the needs of those experiencing it, with a special focus on adults age 18-64. Using both quantitative and qualitative methods and the voices of adults with disabilities and service providers, it identifies relevant public policy and historical contexts, estimates the food insecurity, poverty, and unemployment rate among adults with disabilities, and visualizes areas of unmet need for food assistance by Zip Code. Themes emerging from focus groups and surveys give insight into the common barriers to food security this population encounters and the strategies used to cope with lack of access to enough food. The final section proposes several program and advocacy recommendations that emphasize partnerships and that build upon the extensive work currently being done to address our neighbors’ lack of access to basic needs. 2 Ibid.

3 FOOD INSECURITY AMONG ADULTS WITH DISABILITIES IN COOK COUNTY: REALITIES AND REMEDIES
Findings include:
1. Food insecurity is disproportionately high among adults with disabilities in Cook County, especially among working-age adults. Based on 2015 U.S. Census Current Population Survey data, an estimated 31% of households with a working-age member with a disability in the Chicago metro area are food insecure, compared to 8% of households with a working-age adult with no disabilities. Food insecure adults with disabilities are also more likely to experience higher levels of very low food security, the most severe category of lack of access. These data are on par with Illinois and national level figures.
2. Risk of food insecurity among adults with disabilities occurs in every Cook County community with hotspots throughout Chicago and the suburbs. Neighborhoods across Chicago and the suburbs show very high proportions of people with disabilities living in low-income households. While some areas mirror poverty patterns of the general population, several communities, particularly on the north side of Chicago, show considerably higher rates of low-income among adults with disabilities than among those with no disabilities.
3. Low-income adults with disabilities face many obstacles in getting healthy diets, and current supports are not sufficient to provide for adequate nutrition. Barriers include inadequate financial resources to cover the full cost of living, lack of affordable and accessible transportation to get groceries home, difficulty accessing food assistance programs, difficulty obtaining food appropriate for special diets required by their medical conditions, and more. Several impactful food assistance programs serving low-income adults with disabilities operate in Cook County, yet taken together, they do not reach all in need. Areas on the west side of Chicago exhibit the highest need for additional food assistance resources, yet many neighborhoods across Chicago and the suburbs show inadequate coverage in terms of food assistance programs accessible to people with disabilities.
4. Low-income adults with disabilities across the age-spectrum need increased access to medically-tailored home delivered meal and grocery options at no or very low cost. Depending on the individual and the day, getting to and from food assistance programs can be very physically and mentally taxing, time consuming, and prohibitively expensive. Obtaining foods that accommodate the special diets required by one’s medical conditions can also be very challenging. Such medically-tailored meals and grocery categories include diabetic friendly, low vitamin K, allergy sensitive (e.g. no dairy, eggs, nuts, gluten), renal, low fat, and more, many of which are often more expensive and harder to find than less healthy alternatives. The consumer must be able to choose which meals or groceries they receive for this expanded capacity to be successful.
5. Improving accessibility at food assistance programs will alleviate barriers to food security and strengthen the network for all participants. Many study participants described being discouraged from using the emergency food assistance network in times of need due to uncomfortable and long wait times, outdoor lines in adverse weather conditions, lack of ramps and elevators at buildings, and uncertainty in what food items would be available. Providing additional assistance to improve accessibility will be necessary since resources of food assistance programs are already stretched extremely thin. Lessening these barriers to use of the emergency food system will support a more inclusive experience for all clients.
6. Connecting more people in need with food assistance requires increasing targeted outreach and communication directly with adults with disabilities and disability service providers. Study participants described how they and others they know often are not aware of what food resources are currently available to them or they receive conflicting information from different sources. Increasing the flow of updated information about the Food Depository’s network, Public Benefit Outreach Team, partnerships, and nutrition education resources through targeted touch points that reach low-income adults with disabilities will help bridge this information divide.

SUMMARY OF FINDINGS 4
Policy-related findings:
7. Passing a state budget that adequately funds human services is necessary to improve food security. Many organizations providing essential services to people with disabilities have been forced to lay off staff and cut back services due to the State of Illinois’ backlog of unpaid bills. Food insecurity never exists in isolation and threats to other basic needs such as healthcare, housing, and in-home assistants directly impact stable food access as well. The State of Illinois must pass a budget that helps stabilize the service landscape for programs needed by vulnerable populations in our state.
8. Protecting access to federal nutrition assistance programs, especially the Supplemental Nutrition Assistance Program (SNAP), is critically important to preventing an increase in food insecurity. In 2015, 30% of Cook County households with 1 or more persons with a disability received SNAP benefits, and this report estimates that SNAP provides at least 80% of the food assistance reaching adults with disabilities across Cook County.3 While research participants shared that the SNAP benefit amount they receive is often not sufficient to see them through the full month, many households with low-income adults with disabilities rely on the ongoing availability of federal nutrition assistance programs to supplement their diets with the foods necessary for their health. Food insecure households with low-income adults with disabilities severe enough to qualify for federal disability payments as well as those with more short-term or less severe disabilities need access to these programs. Charitable emergency food assistance could not replace this level of service if SNAP disappeared or eligibility for participation substantially narrows.
3 2015 U.S. American Community Survey 1-year estimates.
9. Partnering with local and state agencies, social service organizations, and healthcare entities that oversee and provide services to low-income adults with disabilities can provide important opportunities to reach more people struggling with food insecurity. Presently, health care, food assistance, and other service providers most commonly operate in siloes from one another despite serving complementary missions and having an overlapping client base. Working together to identify and to connect food insecure adults with disabilities with needed assistance can replace these siloes while adding efficiency and cost savings for all involved. It will also establish food insecurity as a prominent health concern for affected individuals.
10. Aligning diverse stakeholders behind policies that support food security among people with disabilities will most effectively leverage the power of our communities and the full spectrum of social services and community-based organizations. Research participants emphasized the interdependency of their health and wellbeing with access to adequate and appropriate nutrition, together with access to transportation, housing, education, and jobs. Developing collaborative program and advocacy efforts can help address gaps in service while forming the groundwork for a united message if policy makers propose legislation that directly or indirectly harms the food security of people with disabilities.
Moving the needle on food insecurity in Cook County requires individuals, organizations, and elected officials to work together on implementing the recommendations outlined in this report. Initial investment, planning, and resources will be required, yet strengthening the food assistance safety net and public policy response aimed at eliminating hunger through inclusive planning and collaboration will benefit all. As stated by Angela Glover Blackwell in The Curb-Cut Effect, “laws and programs designed to benefit vulnerable groups, such as the disabled or people of color, often end up benefiting all of society … knock down walls of exclusion and build accessible pathways to success, and everyone gains.”4
4 Glover Blackwell, A.

5 FOOD INSECURITY AMONG ADULTS WITH DISABILITIES IN COOK COUNTY: REALITIES AND REMEDIES
The need to focus on food insecurity among adults with disabilitiesAs the food bank serving Cook County, the Greater Chicago Food Depository’s mission is to feed hungry people while striving to end hunger in our community. In order to do so, we must identify the need for food assistance across our community, the best methods of reaching those in need, and the strategies that will prevent the occurrence of food insecurity in the first place.
This research report aims to deepen the understanding of these topics specifically in relation to adults with disabilities in Cook County, with a focus on working age adults age 18 to 64. We chose to focus on this population because the limited yet very concerning research available to us on disability, food insecurity, and food assistance told us that inadequate food access was a major problem among households with a working-age adult member with a disability.
Most notably, a 2013 United States Department of Agriculture (USDA) Economic Research Service (ERS) study asserts that living with a disability is one of the strongest known factors that affect a household’s food security, and that their food insecurity tends to be more severe. Nationally, an estimated 31.8% of households experiencing food insecurity included a working-age adult with a disability in 2009-2010.5 Only income levels and participation in nutrition assistance programs correlate more firmly with food insecurity. Furthermore, the USDA asserts that “disability assistance programs and food and nutrition assistance programs, in their current form, do not fully protect adults with disabilities from food insecurity.”6
This report uses the USDA definition of food insecurity: a household-level economic and social condition of limited or uncertain access to adequate food. Hunger is an individual physiological condition and potential consequence of food insecurity. We define disability as any physical or mental impairment that substantially limits one or more major life activities. All disabilities are self-reported for the purposes of this project.
In addition, disability is very common in Cook County households as it is in communities everywhere, and if all else remains equal, the number of people managing some form of disability and therefore food insecurity will likely only increase in the future. More than 12% of the county’s current adult population has a disability and the Social Security Administration predicts that more than 1 in 4 of current 20 year olds will become disabled before they retire. In addition, demographers project the population over age 65 will increase 55% by 2030 and more than double by 2060.7 These shifting dynamics indicate that the number of adults with disabilities will likely grow in the coming years, and food insecurity can thus also be expected to increase if focus and priority is not placed on the barriers to food access faced by this population. 5 Coleman-Jensen, A. et al, 2013. Alternative, food security is defined as: access by all people at all times to enough food for an active, healthy life and includes at a minimum: (a) the ready availability of nutritionally adequate and safe foods, and (b) the assured ability to acquire acceptable foods in socially acceptable ways, e.g. without resorting to emergency food supplies, scavenging, stealing, and other coping strategies.6 Coleman-Jensen, A et al, 2013; summary document under Improving Food Security for Those With Disabilities.7 Social Security Administration Fact Sheet; the Council for Disability Awareness; U.S. Census Bureau.
INTRODUCTION AND BACKGROUND
INTRODUCTION AND BACKGROUND 6
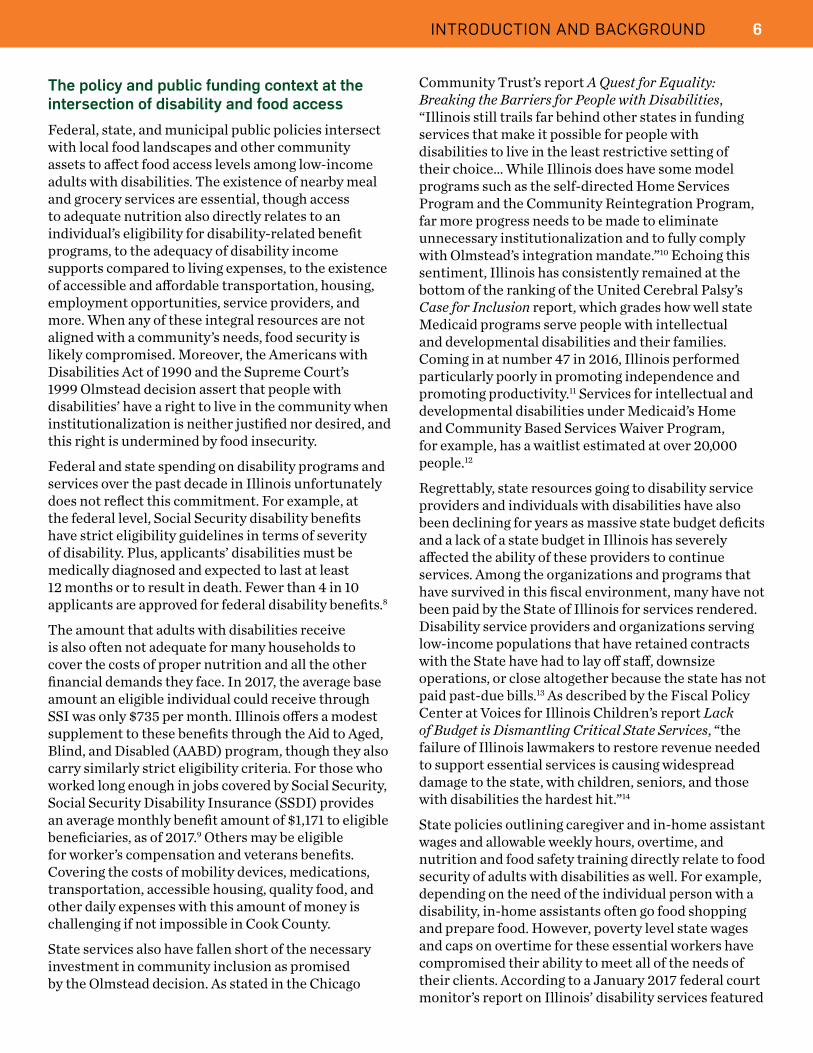
The policy and public funding context at the intersection of disability and food accessFederal, state, and municipal public policies intersect with local food landscapes and other community assets to affect food access levels among low-income adults with disabilities. The existence of nearby meal and grocery services are essential, though access to adequate nutrition also directly relates to an individual’s eligibility for disability-related benefit programs, to the adequacy of disability income supports compared to living expenses, to the existence of accessible and affordable transportation, housing, employment opportunities, service providers, and more. When any of these integral resources are not aligned with a community’s needs, food security is likely compromised. Moreover, the Americans with Disabilities Act of 1990 and the Supreme Court’s 1999 Olmstead decision assert that people with disabilities’ have a right to live in the community when institutionalization is neither justified nor desired, and this right is undermined by food insecurity.
Federal and state spending on disability programs and services over the past decade in Illinois unfortunately does not reflect this commitment. For example, at the federal level, Social Security disability benefits have strict eligibility guidelines in terms of severity of disability. Plus, applicants’ disabilities must be medically diagnosed and expected to last at least 12 months or to result in death. Fewer than 4 in 10 applicants are approved for federal disability benefits.8
The amount that adults with disabilities receive is also often not adequate for many households to cover the costs of proper nutrition and all the other financial demands they face. In 2017, the average base amount an eligible individual could receive through SSI was only $735 per month. Illinois offers a modest supplement to these benefits through the Aid to Aged, Blind, and Disabled (AABD) program, though they also carry similarly strict eligibility criteria. For those who worked long enough in jobs covered by Social Security, Social Security Disability Insurance (SSDI) provides an average monthly benefit amount of $1,171 to eligible beneficiaries, as of 2017.9 Others may be eligible for worker’s compensation and veterans benefits. Covering the costs of mobility devices, medications, transportation, accessible housing, quality food, and other daily expenses with this amount of money is challenging if not impossible in Cook County.
State services also have fallen short of the necessary investment in community inclusion as promised by the Olmstead decision. As stated in the Chicago
Community Trust’s report A Quest for Equality: Breaking the Barriers for People with Disabilities, “Illinois still trails far behind other states in funding services that make it possible for people with disabilities to live in the least restrictive setting of their choice… While Illinois does have some model programs such as the self-directed Home Services Program and the Community Reintegration Program, far more progress needs to be made to eliminate unnecessary institutionalization and to fully comply with Olmstead’s integration mandate.”10 Echoing this sentiment, Illinois has consistently remained at the bottom of the ranking of the United Cerebral Palsy’s Case for Inclusion report, which grades how well state Medicaid programs serve people with intellectual and developmental disabilities and their families. Coming in at number 47 in 2016, Illinois performed particularly poorly in promoting independence and promoting productivity.11 Services for intellectual and developmental disabilities under Medicaid’s Home and Community Based Services Waiver Program, for example, has a waitlist estimated at over 20,000 people.12
Regrettably, state resources going to disability service providers and individuals with disabilities have also been declining for years as massive state budget deficits and a lack of a state budget in Illinois has severely affected the ability of these providers to continue services. Among the organizations and programs that have survived in this fiscal environment, many have not been paid by the State of Illinois for services rendered. Disability service providers and organizations serving low-income populations that have retained contracts with the State have had to lay off staff, downsize operations, or close altogether because the state has not paid past-due bills.13 As described by the Fiscal Policy Center at Voices for Illinois Children’s report Lack of Budget is Dismantling Critical State Services, “the failure of Illinois lawmakers to restore revenue needed to support essential services is causing widespread damage to the state, with children, seniors, and those with disabilities the hardest hit.”14
State policies outlining caregiver and in-home assistant wages and allowable weekly hours, overtime, and nutrition and food safety training directly relate to food security of adults with disabilities as well. For example, depending on the need of the individual person with a disability, in-home assistants often go food shopping and prepare food. However, poverty level state wages and caps on overtime for these essential workers have compromised their ability to meet all of the needs of their clients. According to a January 2017 federal court monitor’s report on Illinois’ disability services featured
7 FOOD INSECURITY AMONG ADULTS WITH DISABILITIES IN COOK COUNTY: REALITIES AND REMEDIES
in the Chicago Tribune article ‘Illinois fails to support disability services, report finds,’ “a lack of state funding to raise caregiver wages has created unprecedented shortages of workers who assist developmentally disabled residents when they move out of institutions and into apartments or group homes. The services include everything from eating and hygiene to learning life skills... state funding for wage increases stalled almost a decade ago at about $9 per hour, which would place many caregivers and their families below the federal poverty level. Medicaid matches state wage rates, but states must raise wages first to secure a higher federal contribution.”15 This situation forces a choice about what basic needs to fulfill.
Food insecurity never exists in isolation as households make such compromises to make ends meet. Moreover, although we do not focus in on it here, legislation affecting accessible transportation, housing, and employment opportunities also affects food insecurity. The policy and fiscal climate in Illinois and Washington D.C. deeply affects food insecurity among adults with disabilities from multiple angles, as we will see throughout this report.8 Social Security Administration. https://www.ssa.gov/oact/cola/SSI.html9 Social Security Administration. https://www.ssa.gov/news/press/factsheets/colafacts2017.pdf10 The Chicago Community Trust, 2010.11 United Cerebral Palsy, 2016.12 The Arc Illinois, Forrest, S., & www.medicaidwaiver.org/state/illinois.html. 13 Fortino, E.14 Christensen Gee, L. 15 Tribune News Services 1/29/2017.
Advocacy efforts
Sustained advocacy efforts have helped prevent certain cuts to programs affecting people with disabilities in Illinois.16 Legislation affecting Medicaid, for example, has a particularly large impact on people with disabilities’ opportunity to live and prosper in the community, so this has been a focal point of activism in recent years. Medicaid and its Home and Community Based Services Waiver Program serves as a main source of health insurance and home services for qualified adults with disabilities. Although Illinois legislators drastically cut Medicaid funding in Illinois most notably in 2012 by $1.6 billion and in 2015 by $106 million, the cumulative reductions in the program could have been larger without those voices. While the $1.6 billion cut saw partial restoration with the expansion of Medicaid and federal matching funds under the Affordable Care Act (ACA), the
potential repeal of all or parts of the ACA would put these programs at risk again.17 Similarly, the Illinois Governor’s 2015 proposal to substantially tighten eligibility requirements to receive disability benefits (known as the Determination of Need, or DON, score) would have effectively cut 34,000 individuals from access to critical home services through the Community Care Program had they not been strongly opposed by organized disability rights groups.18,19 16 Garcia, M. 17 Garcia, M.; Associated Press, 4/24/2015; Huffington Post 6/14/2012; Crain’s 6/16/2014. 18 State Journal-Register 9/30/2015.19 Progress Illinois 11/9/2015.
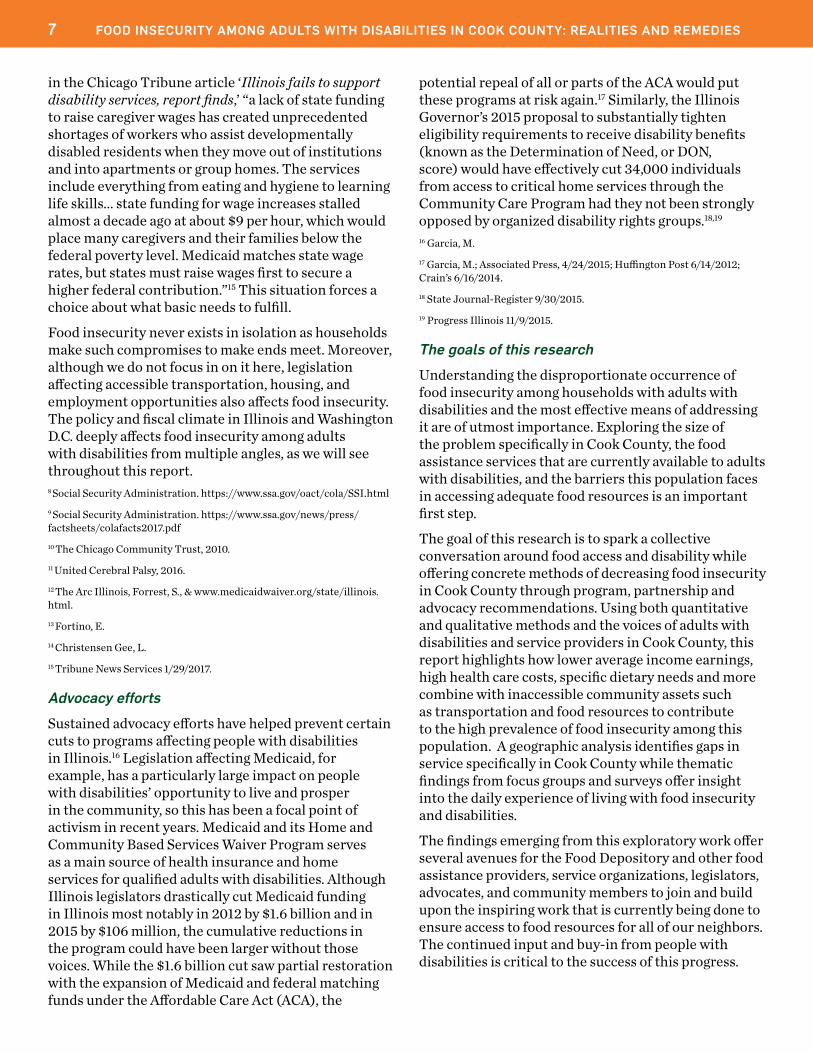
The goals of this research
Understanding the disproportionate occurrence of food insecurity among households with adults with disabilities and the most effective means of addressing it are of utmost importance. Exploring the size of the problem specifically in Cook County, the food assistance services that are currently available to adults with disabilities, and the barriers this population faces in accessing adequate food resources is an important first step.
The goal of this research is to spark a collective conversation around food access and disability while offering concrete methods of decreasing food insecurity in Cook County through program, partnership and advocacy recommendations. Using both quantitative and qualitative methods and the voices of adults with disabilities and service providers in Cook County, this report highlights how lower average income earnings, high health care costs, specific dietary needs and more combine with inaccessible community assets such as transportation and food resources to contribute to the high prevalence of food insecurity among this population. A geographic analysis identifies gaps in service specifically in Cook County while thematic findings from focus groups and surveys offer insight into the daily experience of living with food insecurity and disabilities.
The findings emerging from this exploratory work offer several avenues for the Food Depository and other food assistance providers, service organizations, legislators, advocates, and community members to join and build upon the inspiring work that is currently being done to ensure access to food resources for all of our neighbors. The continued input and buy-in from people with disabilities is critical to the success of this progress.
RESEARCH METHODS 8
The following research questions guided this project:
1. What is the current policy and programming landscape affecting food insecurity among low-income adults with disabilities in Cook County?
2. Is there need for additional nutritional assistance among low-income adults with disabilities in Cook County, and if so, where?
3. What factors contribute to food insecurity among low-income adults with disabilities, and how do they cope with difficulty accessing enough food?
4. How can the Food Depository and others, through collaboration with key stakeholders and people in need, address food insecurity among low-income adults with disabilities?
This exploratory analysis used both quantitative and qualitative methods to generate primary and secondary data to answer these questions as detailed below. The Food Depository relied heavily on the input and collaboration of several partners at various stages of the project to do so. Staff and consumers of Access Living, Progress Center for Independent Living, and Anixter Center provided feedback on the importance of this issue among their community members and generously opened their doors to host the focus groups featured in this report. They also helped with outreach for the online survey, as did the City of Chicago’s Mayor’s Office for People with Disabilities. The Social Impact Research Center of the Heartland Alliance provided technical assistance on the quantitative meal gap analysis and focus group protocols and administration. Several individuals with disabilities and staff of organizations serving people with disabilities spoke with the lead researcher along the way at events such as the MOPD’s annual Access Event, offering incredibly open and meaningful responses to questions about their personal situations and how they would suggest alleviating food insecurity. Further detail can be found in the technical brief in the appendix.
RESEARCH METHODS
1. Quantitative analysis of U.S. Census data and food program participation. In order to estimate and visualize the need for food assistance among adults with disabilities at the local level, we pulled statistics on income, food insecurity, employment, and disability from two key sources. The 2015 U.S. Current Population Survey (CPS) Food Security December Supplement supplied food insecurity estimates at the metropolitan area, state, and national level figures and the 2015 American Community Survey 5-year estimates supplied data for the zip-code level analyses. Participation in existing food assistance programs used information the author obtained through personal requests to the administering agencies.
2. Focus Groups: With the help of several partners, we held focus groups among adults with disabilities at the headquarters of three major leaders in the disability community in Cook County: Access Living, Progress Center for Independent Living and Anixter Center. Each focus group included 12 to 14 low-income adults with disabilities and lasted approximately 90 minutes. The facilitator asked participants to share information about how they access food, difficulties they experience getting enough food, whether they utilize public services, and other details about their circumstances. The Heartland Alliance’s Institutional Review Board approved the survey instruments and protocols.
3. Public Survey: The Food Depository hosted an online survey targeted to adults with disabilities and those in their networks, such as service providers, family members and friends. Survey questions asked how they access food, what challenges they face, how they or those they know cope with these challenges, and what they think would help alleviate their food access challenges. Access Living, Progress Center for Independent Living, Anixter Center and other stakeholders assisted in distributing the survey. The Food Depository also engaged in outreach for survey participation through the 2016 Access Chicago event and direct messages to other disability service providers in Cook County. Findings are based on a convenience sample and not generalizable. A total of 146 people completed the survey.

9 FOOD INSECURITY AMONG ADULTS WITH DISABILITIES IN COOK COUNTY: REALITIES AND REMEDIES
4. Food Depository Network Survey: The Food Depository performed a preliminary survey of a sample of their network of over 450 member agencies to solicit input on their levels of service to clients with disabilities. Feedback from pantries and other network programs gave insight into the needs they see in their community among those with a disability and opportunities to better support this specific population. The majority of participants described substantial presence of disability among their client populations, a need for home delivery of meals and groceries, and a desire for additional support and guidance on how to most effectively serve adults with disabilities. A total of 103 agencies completed the survey.
A note about defining disabilityData sources in this report determine presence of disability by the self-reporting of participants. The American Community Survey (ACS), the Current Population Survey (CPS), the online surveys and focus groups all asked respondents to self-report having a physical or mental impairment that substantially limits one or more major life activities.20
We purposefully chose this route over other alternatives because it best aligned with the goals of this project for many reasons. One, no single accepted designation of disability exists and it is “a complex and evolving concept with varying definitions used in different contexts.”21 Second, using receipt of Supplemental Security Income (SSI) or Social Security Disability Insurance (SSDI) would exclude many individuals who are included in the ACS definition and many who participated in this project. Indeed, strict eligibility guidelines can leave people in need of services behind, which in turn contributes to food insecurity. Adults with temporary, episodic, professionally undiagnosed, or untreated disabilities, less severe but still strongly impactful impairments, and those that are unable to successfully navigate the application process would not be included. Using enrollment in these programs as the key indicator for presence of disability would therefore undermine the intentions of this research.22,23,24
Third, the intent of this research is to better understand food insecurity among people that feel insecure about their access to food resources rather than to determine eligibility for a specific program or find associations between food insecurity and specific types of disability. For our purposes, no clear cut lines are necessary.
As a final methodological note, this report focuses on adults with disabilities, but this in no way implies that children and youth with disabilities and their families are not also very vulnerable to food insecurity.25 We strongly encourage similar in depth research among the younger demographic. Different age groups are eligible for different programs and can thus face different risks of food insecurity. For this reason, much of this report separates 18-64 year olds from adults over age 65 as well.20Americans with Disabilities Act of 1990. Washington DC: U.S. Congress.21 Vallas, R. et al.22 Carlson, S. et al.23 Brucker, DL.24 FRAC SNAP Report, 2015.25 Rose-Jacobs, R. et al.

RESEARCH METHODS 10
Limitations of this projectWe envision this project as a jumping off point for further research. Outside of the Current Population Survey (CPS) data used, all other estimates and descriptions of experience with food insecurity among participants cannot be generalized across the entire Cook County population of adults with disabilities.
Additionally, due to limited resources, we used convenience and snowball sampling to get responses for qualitative sections. Racial and ethnic minorities, particularly those identifying as Hispanic/Latino/a, men, and non-English speakers were underrepresented as compared to the total Cook County population. Moreover, this project did not study the effects of ethnicity, race, gender, sexual orientation, or other demographic factors that may weigh heavily on risk of food insecurity among adults with disabilities. We strongly support further research in this area. This works only touches on the surface of the relationships and conditions that cause and are caused by lack of access to adequate food.
Significant caveats also apply to the CPS metro area, state, and national food insecurity rates detailed in this report. Derived from the USDA food security module, the CPS Food Security Supplement (FSS) measures food insecurity as an ability to afford enough food. This emphasis on income may cause many adults with disabilities to be misclassified as food secure. As
described by Johnson in his Food Security for Seniors and Persons with Disabilities Project report, “the USDA Food Security Module fails to address non-monetary barriers that seniors and persons with disabilities face- for example, health problems, mobility issues, or lack of transportation.”26 Additionally, the incidence of disability appears to be underreported or underrepresented in the CPS. It is unclear what effect this would have on food insecurity rates.
Finally, the quantitative unmet need analysis makes many assumptions to get a general idea of locations of hotspots for additional food assistance. For example, in order to estimate the gap between the need for food assistance and food provided through current programming, all food distributed through assistance programs had to be allocated as “meals” to a specific Zip Code, requiring assumptions about the residential location of program participants. Moreover, because the metro area is the smallest geography for which we can get CPS food insecurity rates, we had to choose a proxy indicator of need available at the Zip Code level (i.e. 200% of the federal poverty level). As described in more detail in the technical brief in the appendix, we also had to adopt a method for estimating the optimal number of meals per week required per person in need. 26 Johnson, B.
11 FOOD INSECURITY AMONG ADULTS WITH DISABILITIES IN COOK COUNTY: REALITIES AND REMEDIES
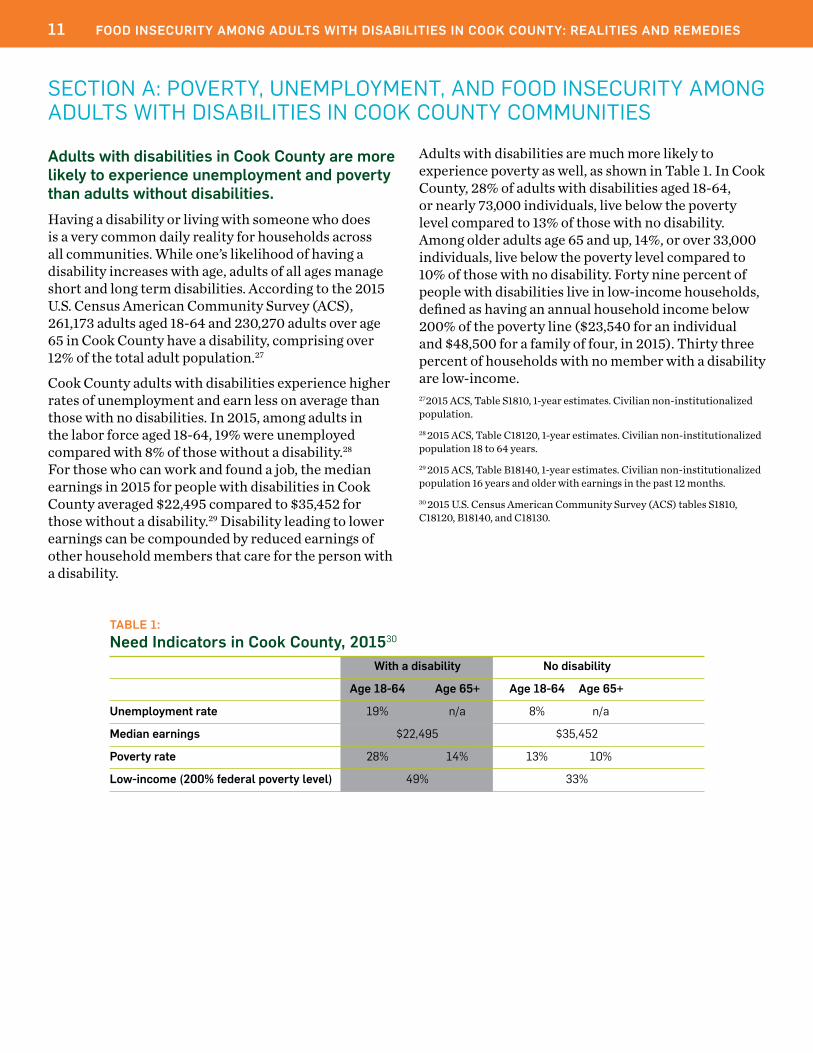
Adults with disabilities in Cook County are more likely to experience unemployment and poverty than adults without disabilities.Having a disability or living with someone who does is a very common daily reality for households across all communities. While one’s likelihood of having a disability increases with age, adults of all ages manage short and long term disabilities. According to the 2015 U.S. Census American Community Survey (ACS), 261,173 adults aged 18-64 and 230,270 adults over age 65 in Cook County have a disability, comprising over 12% of the total adult population.27
Cook County adults with disabilities experience higher rates of unemployment and earn less on average than those with no disabilities. In 2015, among adults in the labor force aged 18-64, 19% were unemployed compared with 8% of those without a disability.28
For those who can work and found a job, the median earnings in 2015 for people with disabilities in Cook County averaged $22,495 compared to $35,452 for those without a disability.29 Disability leading to lower earnings can be compounded by reduced earnings of other household members that care for the person with a disability.
Adults with disabilities are much more likely to experience poverty as well, as shown in Table 1. In Cook County, 28% of adults with disabilities aged 18-64, or nearly 73,000 individuals, live below the poverty level compared to 13% of those with no disability. Among older adults age 65 and up, 14%, or over 33,000 individuals, live below the poverty level compared to 10% of those with no disability. Forty nine percent of people with disabilities live in low-income households, defined as having an annual household income below 200% of the poverty line ($23,540 for an individual and $48,500 for a family of four, in 2015). Thirty three percent of households with no member with a disability are low-income.272015 ACS, Table S1810, 1-year estimates. Civilian non-institutionalized population. 28 2015 ACS, Table C18120, 1-year estimates. Civilian non-institutionalized population 18 to 64 years.29 2015 ACS, Table B18140, 1-year estimates. Civilian non-institutionalized population 16 years and older with earnings in the past 12 months.30 2015 U.S. Census American Community Survey (ACS) tables S1810, C18120, B18140, and C18130.
SECTION A: POVERTY, UNEMPLOYMENT, AND FOOD INSECURITY AMONG ADULTS WITH DISABILITIES IN COOK COUNTY COMMUNITIES
TABLE 1: Need Indicators in Cook County, 201530
With a disability No disability
Age 18-64 Age 65+ Age 18-64 Age 65+
Unemployment rate 19% n/a 8% n/a
Median earnings $22,495 $35,452
Poverty rate 28% 14% 13% 10%
Low-income (200% federal poverty level) 49% 33%
SECTION A: POVERTY, UNEMPLOYMENT, AND FOOD INSECURITY AMONG ADULTS WITH DISABILITIES IN COOK COUNTY COMMUNITIES 12
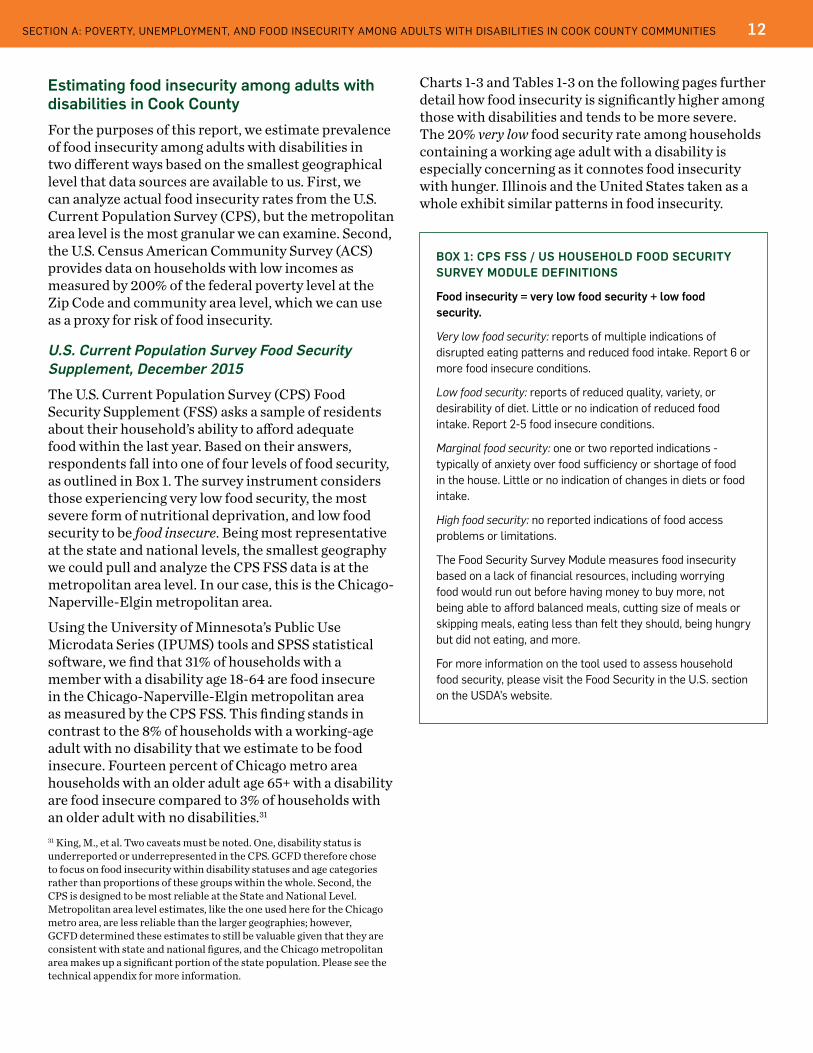
BOX 1: CPS FSS / US HOUSEHOLD FOOD SECURITY SURVEY MODULE DEFINITIONS
Food insecurity = very low food security + low food security.
Very low food security: reports of multiple indications of disrupted eating patterns and reduced food intake. Report 6 or more food insecure conditions.
Low food security: reports of reduced quality, variety, or desirability of diet. Little or no indication of reduced food intake. Report 2-5 food insecure conditions.
Marginal food security: one or two reported indications - typically of anxiety over food sufficiency or shortage of food in the house. Little or no indication of changes in diets or food intake.
High food security: no reported indications of food access problems or limitations.
The Food Security Survey Module measures food insecurity based on a lack of financial resources, including worrying food would run out before having money to buy more, not being able to afford balanced meals, cutting size of meals or skipping meals, eating less than felt they should, being hungry but did not eating, and more.
For more information on the tool used to assess household food security, please visit the Food Security in the U.S. section on the USDA’s website.
Estimating food insecurity among adults with disabilities in Cook County For the purposes of this report, we estimate prevalence of food insecurity among adults with disabilities in two different ways based on the smallest geographical level that data sources are available to us. First, we can analyze actual food insecurity rates from the U.S. Current Population Survey (CPS), but the metropolitan area level is the most granular we can examine. Second, the U.S. Census American Community Survey (ACS) provides data on households with low incomes as measured by 200% of the federal poverty level at the Zip Code and community area level, which we can use as a proxy for risk of food insecurity.
U.S. Current Population Survey Food Security Supplement, December 2015
The U.S. Current Population Survey (CPS) Food Security Supplement (FSS) asks a sample of residents about their household’s ability to afford adequate food within the last year. Based on their answers, respondents fall into one of four levels of food security, as outlined in Box 1. The survey instrument considers those experiencing very low food security, the most severe form of nutritional deprivation, and low food security to be food insecure. Being most representative at the state and national levels, the smallest geography we could pull and analyze the CPS FSS data is at the metropolitan area level. In our case, this is the Chicago-Naperville-Elgin metropolitan area.
Using the University of Minnesota’s Public Use Microdata Series (IPUMS) tools and SPSS statistical software, we find that 31% of households with a member with a disability age 18-64 are food insecure in the Chicago-Naperville-Elgin metropolitan area as measured by the CPS FSS. This finding stands in contrast to the 8% of households with a working-age adult with no disability that we estimate to be food insecure. Fourteen percent of Chicago metro area households with an older adult age 65+ with a disability are food insecure compared to 3% of households with an older adult with no disabilities.31
Charts 1-3 and Tables 1-3 on the following pages further detail how food insecurity is significantly higher among those with disabilities and tends to be more severe. The 20% very low food security rate among households containing a working age adult with a disability is especially concerning as it connotes food insecurity with hunger. Illinois and the United States taken as a whole exhibit similar patterns in food insecurity.
31 King, M., et al. Two caveats must be noted. One, disability status is underreported or underrepresented in the CPS. GCFD therefore chose to focus on food insecurity within disability statuses and age categories rather than proportions of these groups within the whole. Second, the CPS is designed to be most reliable at the State and National Level. Metropolitan area level estimates, like the one used here for the Chicago metro area, are less reliable than the larger geographies; however, GCFD determined these estimates to still be valuable given that they are consistent with state and national figures, and the Chicago metropolitan area makes up a significant portion of the state population. Please see the technical appendix for more information.
13 FOOD INSECURITY AMONG ADULTS WITH DISABILITIES IN COOK COUNTY: REALITIES AND REMEDIES
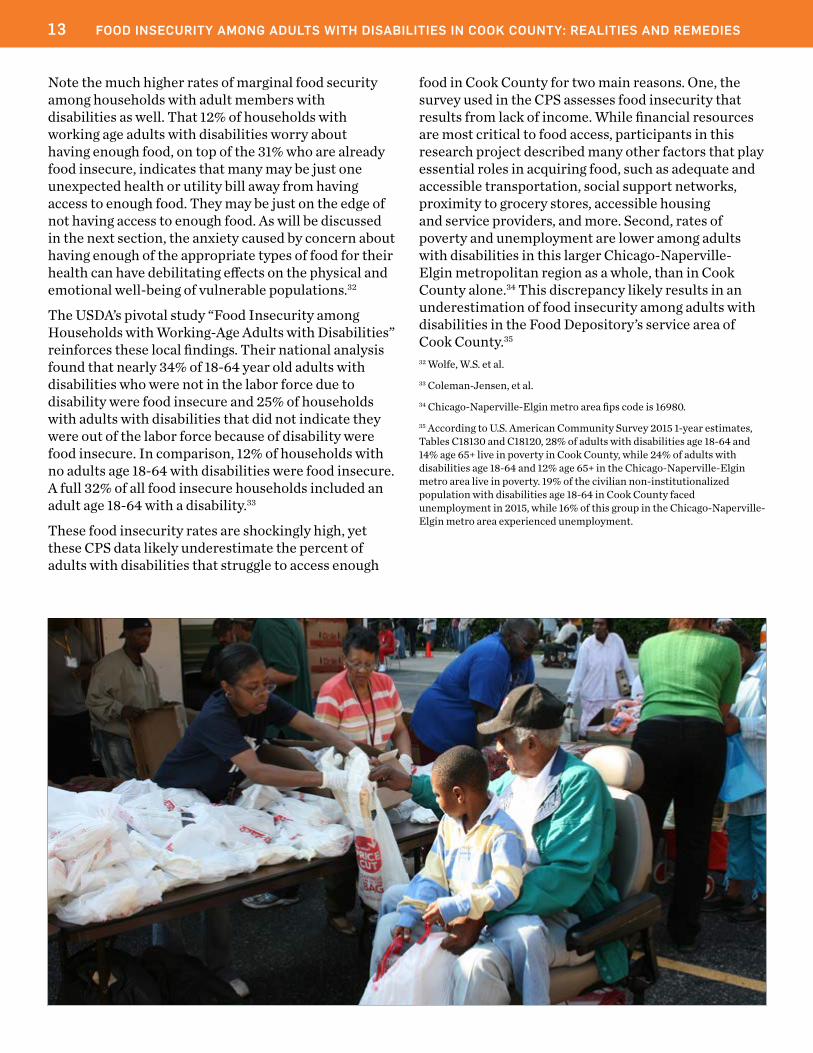
Note the much higher rates of marginal food security among households with adult members with disabilities as well. That 12% of households with working age adults with disabilities worry about having enough food, on top of the 31% who are already food insecure, indicates that many may be just one unexpected health or utility bill away from having access to enough food. They may be just on the edge of not having access to enough food. As will be discussed in the next section, the anxiety caused by concern about having enough of the appropriate types of food for their health can have debilitating effects on the physical and emotional well-being of vulnerable populations.32
The USDA’s pivotal study “Food Insecurity among Households with Working-Age Adults with Disabilities” reinforces these local findings. Their national analysis found that nearly 34% of 18-64 year old adults with disabilities who were not in the labor force due to disability were food insecure and 25% of households with adults with disabilities that did not indicate they were out of the labor force because of disability were food insecure. In comparison, 12% of households with no adults age 18-64 with disabilities were food insecure. A full 32% of all food insecure households included an adult age 18-64 with a disability.33
These food insecurity rates are shockingly high, yet these CPS data likely underestimate the percent of adults with disabilities that struggle to access enough
food in Cook County for two main reasons. One, the survey used in the CPS assesses food insecurity that results from lack of income. While financial resources are most critical to food access, participants in this research project described many other factors that play essential roles in acquiring food, such as adequate and accessible transportation, social support networks, proximity to grocery stores, accessible housing and service providers, and more. Second, rates of poverty and unemployment are lower among adults with disabilities in this larger Chicago-Naperville-Elgin metropolitan region as a whole, than in Cook County alone.34 This discrepancy likely results in an underestimation of food insecurity among adults with disabilities in the Food Depository’s service area of Cook County.35
32 Wolfe, W.S. et al.33 Coleman-Jensen, et al.34 Chicago-Naperville-Elgin metro area fips code is 16980.35 According to U.S. American Community Survey 2015 1-year estimates, Tables C18130 and C18120, 28% of adults with disabilities age 18-64 and 14% age 65+ live in poverty in Cook County, while 24% of adults with disabilities age 18-64 and 12% age 65+ in the Chicago-Naperville-Elgin metro area live in poverty. 19% of the civilian non-institutionalized population with disabilities age 18-64 in Cook County faced unemployment in 2015, while 16% of this group in the Chicago-Naperville-Elgin metro area experienced unemployment.

SECTION A: POVERTY, UNEMPLOYMENT, AND FOOD INSECURITY AMONG ADULTS WITH DISABILITIES IN COOK COUNTY COMMUNITIES 14
0% 10% 20% 30% 40% 50%
Chart 1: Food insecurity levels among households with and without adults with disabili�es: Chicago metropolitan area
Households with member age 18-64, with disability
Households with member age 18-64, no disability
20.4% 10.5% 11.7%
3% 5% 7%
Food insecure = very low food security + low food security = 31%
Very low food security
Marginal food security
Low food security
Households with member age 65+, with disability
Households with member age 65+, no disability
7% 7% 6%
2% 8%
0% 10% 20% 30% 40% 50%
Food security levels among households with and without adults with disabili�es, age 18-64: Chicago metropolitan area
Households with member age 18-64, with disability
Households with member age 18-64, no disability
20.4% 10.5% 11.7%
2.9% 5.5% 7.4%
Food insecure = very low food security + low food security = 31%
Food insecure = 8%
Very low food security: Reports of mul�ple indica�ons of disrupted ea�ng pa�erns and reduced food intake
Marginal food security: one or two reported indica�ons of food access problems—typically of anxiety over food sufficiency or shortage of food in the house
Low food security: reports of reduced quality, variety, or desirability of diet
0% 10% 20% 30% 40% 50%
Chart 2: Food insecurity levels among households with and without adults with disabili�es: Illinois
Households with member age 18-64, with disability
Households with member age 18-64, no disability
18% 16% 15%
3% 6% 8%
Very low food security
Marginal food security
Low food security
Households with member age 65+, with disability
Households with member age 65+, no disability
7% 6% 9%
3% 7%
0% 10% 20% 30% 40% 50%
Chart 3: Food insecurity levels among households with and without adults with disabili�es: United States
Households with member age 18-64, with disability
Households with member age 18-64, no disability
17% 17% 15%
4% 7% 9%
Very low food security
Marginal food security
Low food security
Households with member age 65+, with disability
Households with member age 65+, no disability
5% 8% 8%
3% 6%
Es�mated food assistance meals provided to adults with disabili�es in Cook County, by source, 2015
SNAP
DFSS Congregate MealsGCFD Meals
AgeOp�ons Home Delivery Meals
CSFP MealsDHS Home Delivered Meals
CACFP Meals
DFSS Home Delivered MealsAgeOp�ons Congregate Meals
MOPD Home Delivered Meals
81%
13%
2%<1%
0% 10% 20% 30% 40% 50%
Chart 1: Food insecurity levels among households with and without adults with disabili�es: Chicago metropolitan area
Households with member age 18-64, with disability
Households with member age 18-64, no disability
20.4% 10.5% 11.7%
3% 5% 7%
Food insecure = very low food security + low food security = 31%
Very low food security
Marginal food security
Low food security
Households with member age 65+, with disability
Households with member age 65+, no disability
7% 7% 6%
2% 8%
0% 10% 20% 30% 40% 50%
Food security levels among households with and without adults with disabili�es, age 18-64: Chicago metropolitan area
Households with member age 18-64, with disability
Households with member age 18-64, no disability
20.4% 10.5% 11.7%
2.9% 5.5% 7.4%
Food insecure = very low food security + low food security = 31%
Food insecure = 8%
Very low food security: Reports of mul�ple indica�ons of disrupted ea�ng pa�erns and reduced food intake
Marginal food security: one or two reported indica�ons of food access problems—typically of anxiety over food sufficiency or shortage of food in the house
Low food security: reports of reduced quality, variety, or desirability of diet
0% 10% 20% 30% 40% 50%
Chart 2: Food insecurity levels among households with and without adults with disabili�es: Illinois
Households with member age 18-64, with disability
Households with member age 18-64, no disability
18% 16% 15%
3% 6% 8%
Very low food security
Marginal food security
Low food security
Households with member age 65+, with disability
Households with member age 65+, no disability
7% 6% 9%
3% 7%
0% 10% 20% 30% 40% 50%
Chart 3: Food insecurity levels among households with and without adults with disabili�es: United States
Households with member age 18-64, with disability
Households with member age 18-64, no disability
17% 17% 15%
4% 7% 9%
Very low food security
Marginal food security
Low food security
Households with member age 65+, with disability
Households with member age 65+, no disability
5% 8% 8%
3% 6%
Es�mated food assistance meals provided to adults with disabili�es in Cook County, by source, 2015
SNAP
DFSS Congregate MealsGCFD Meals
AgeOp�ons Home Delivery Meals
CSFP MealsDHS Home Delivered Meals
CACFP Meals
DFSS Home Delivered MealsAgeOp�ons Congregate Meals
MOPD Home Delivered Meals
81%
13%
2%<1%
Charts: Food Insecure = Very Low Food Security + Low Food Security

15 FOOD INSECURITY AMONG ADULTS WITH DISABILITIES IN COOK COUNTY: REALITIES AND REMEDIES
TABLE 1: Food insecurity levels among households with and without adults with disabilities: Chicago metropolitan area36
With any disability No disability Total
Age 18- 64 Age 65+ Age 18-64 Age 65+ Age 18 - 64 Age 65+
Total in weighted sample 301,188 372,146 5,543,518 1,012,094 5,844,706 1,384,240
Very low food security 20%* 7% 3% 1% 4% 2%
Low food security 10%* 7% 5% 2% 6% 3%
Marginal food security 12% 6% 7% 8% 8% 7%
High food security 6% 80% 84% 89% 82% 87%
Food insecure 31% 14% 8% 3% 10% 6%
Food secure 68% 86% 91% 97% 90% 94%
*rounded/sum of very low and low food security = 31%36 King, M. et al.
TABLE 2: Food insecurity levels among households with and without adults with disabilities: Illinois With any disability No disability Total
Age 18- 64 Age 65+ Age 18-64 Age 65+ Age 18 - 64 Age 65+
Total in weighted sample 473,858 520,337 7,235,744 1,274,533 7,709,602 1,794,870
Very low food security 18% 7% 3% 1% 4% 3%
Low food security 16% 6% 6% 3% 6% 4%
Marginal food security 15% 9% 8% 7% 9% 8%
High food security 51% 78% 83% 88% 81% 85%
Food insecure 34% 13% 9% 5% 10% 7%
Food secure 66% 87% 91% 95% 89% 93%
TABLE 3: Food insecurity levels among households with and without adults with disabilities: United States With any disability No disability Total
Age 18- 64 Age 65+ Age 18-64 Age 65+ Age 18 - 64 Age 65+
Total in weighted sample 15,104,479 13,818,408 174,762,794 33,664,019 189,867,273 47,482,427
Very low food security 17% 5% 4% 2% 5% 3%
Low food security 17% 8% 7% 3% 8% 5%
Marginal food security 15% 8% 9% 6% 9% 6%
High food security 51% 79% 79% 89% 77% 86%
Food insecure 34% 13% 11% 5% 13% 7%
Food secure 66% 87% 88% 95% 87% 93%
SECTION A: POVERTY, UNEMPLOYMENT, AND FOOD INSECURITY AMONG ADULTS WITH DISABILITIES IN COOK COUNTY COMMUNITIES 16
U.S. American Community Survey, 2015
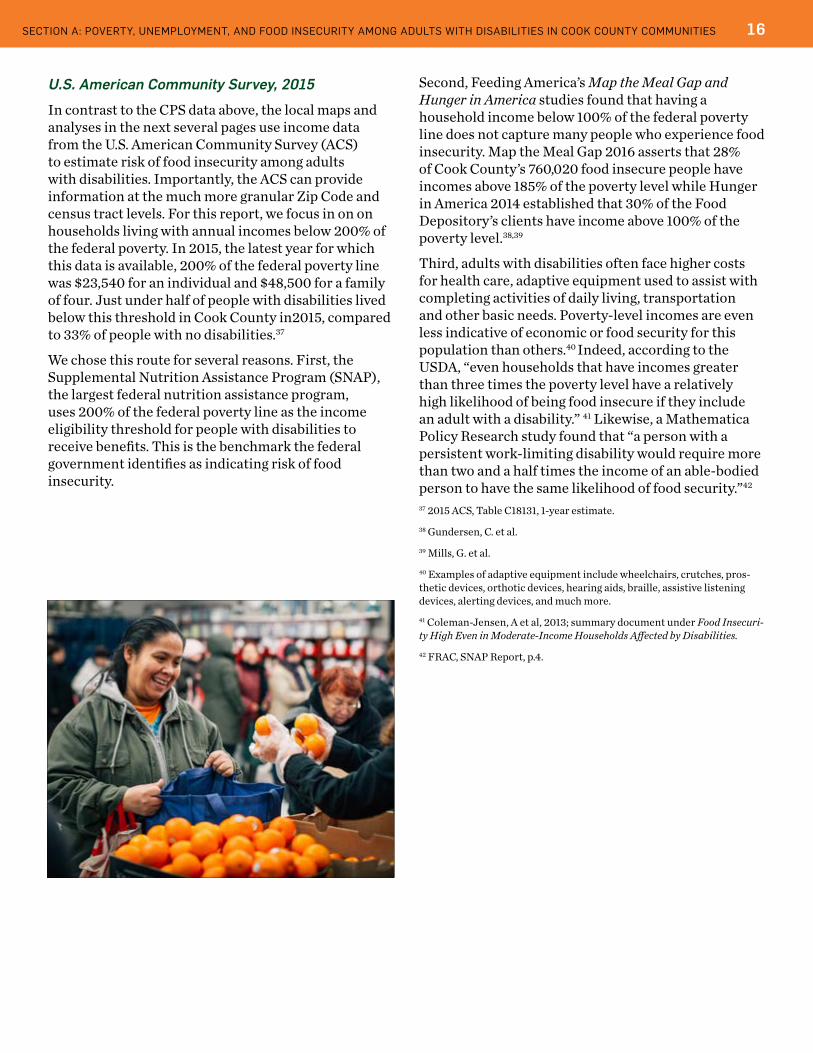
In contrast to the CPS data above, the local maps and analyses in the next several pages use income data from the U.S. American Community Survey (ACS) to estimate risk of food insecurity among adults with disabilities. Importantly, the ACS can provide information at the much more granular Zip Code and census tract levels. For this report, we focus in on on households living with annual incomes below 200% of the federal poverty. In 2015, the latest year for which this data is available, 200% of the federal poverty line was $23,540 for an individual and $48,500 for a family of four. Just under half of people with disabilities lived below this threshold in Cook County in2015, compared to 33% of people with no disabilities.37
We chose this route for several reasons. First, the Supplemental Nutrition Assistance Program (SNAP), the largest federal nutrition assistance program, uses 200% of the federal poverty line as the income eligibility threshold for people with disabilities to receive benefits. This is the benchmark the federal government identifies as indicating risk of food insecurity.
Second, Feeding America’s Map the Meal Gap and Hunger in America studies found that having a household income below 100% of the federal poverty line does not capture many people who experience food insecurity. Map the Meal Gap 2016 asserts that 28% of Cook County’s 760,020 food insecure people have incomes above 185% of the poverty level while Hunger in America 2014 established that 30% of the Food Depository’s clients have income above 100% of the poverty level.38,39
Third, adults with disabilities often face higher costs for health care, adaptive equipment used to assist with completing activities of daily living, transportation and other basic needs. Poverty-level incomes are even less indicative of economic or food security for this population than others.40 Indeed, according to the USDA, “even households that have incomes greater than three times the poverty level have a relatively high likelihood of being food insecure if they include an adult with a disability.” 41 Likewise, a Mathematica Policy Research study found that “a person with a persistent work-limiting disability would require more than two and a half times the income of an able-bodied person to have the same likelihood of food security.”42 37 2015 ACS, Table C18131, 1-year estimate. 38 Gundersen, C. et al.39 Mills, G. et al.40 Examples of adaptive equipment include wheelchairs, crutches, pros-thetic devices, orthotic devices, hearing aids, braille, assistive listening devices, alerting devices, and much more. 41 Coleman-Jensen, A et al, 2013; summary document under Food Insecuri-ty High Even in Moderate-Income Households Affected by Disabilities.42 FRAC, SNAP Report, p.4.
17 FOOD INSECURITY AMONG ADULTS WITH DISABILITIES IN COOK COUNTY: REALITIES AND REMEDIES
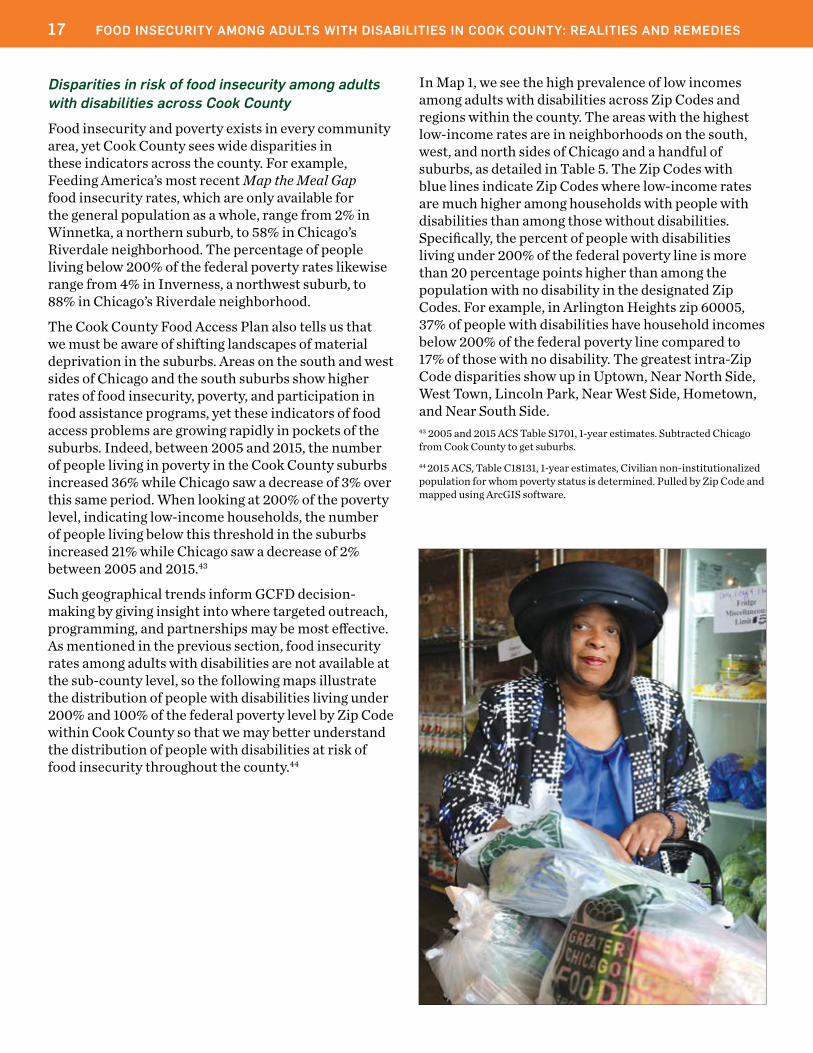
Disparities in risk of food insecurity among adults with disabilities across Cook County
Food insecurity and poverty exists in every community area, yet Cook County sees wide disparities in these indicators across the county. For example, Feeding America’s most recent Map the Meal Gap food insecurity rates, which are only available for the general population as a whole, range from 2% in Winnetka, a northern suburb, to 58% in Chicago’s Riverdale neighborhood. The percentage of people living below 200% of the federal poverty rates likewise range from 4% in Inverness, a northwest suburb, to 88% in Chicago’s Riverdale neighborhood.
The Cook County Food Access Plan also tells us that we must be aware of shifting landscapes of material deprivation in the suburbs. Areas on the south and west sides of Chicago and the south suburbs show higher rates of food insecurity, poverty, and participation in food assistance programs, yet these indicators of food access problems are growing rapidly in pockets of the suburbs. Indeed, between 2005 and 2015, the number of people living in poverty in the Cook County suburbs increased 36% while Chicago saw a decrease of 3% over this same period. When looking at 200% of the poverty level, indicating low-income households, the number of people living below this threshold in the suburbs increased 21% while Chicago saw a decrease of 2% between 2005 and 2015.43
Such geographical trends inform GCFD decision-making by giving insight into where targeted outreach, programming, and partnerships may be most effective. As mentioned in the previous section, food insecurity rates among adults with disabilities are not available at the sub-county level, so the following maps illustrate the distribution of people with disabilities living under 200% and 100% of the federal poverty level by Zip Code within Cook County so that we may better understand the distribution of people with disabilities at risk of food insecurity throughout the county.44
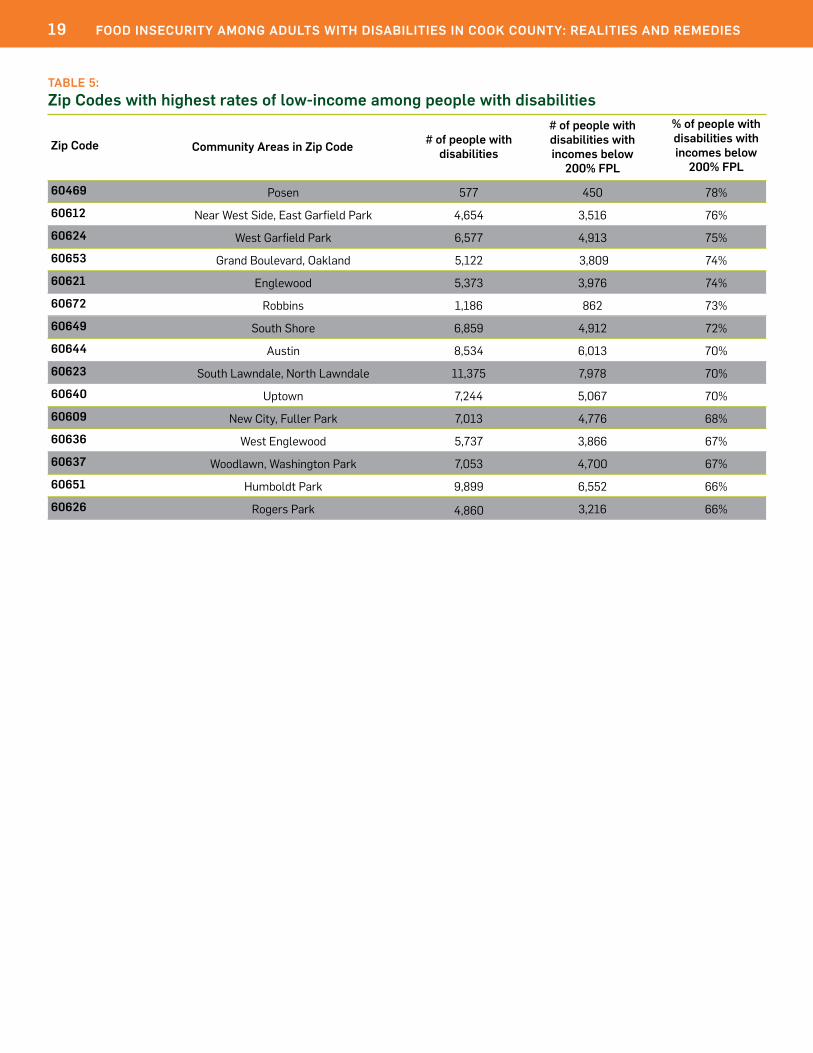
In Map 1, we see the high prevalence of low incomes among adults with disabilities across Zip Codes and regions within the county. The areas with the highest low-income rates are in neighborhoods on the south, west, and north sides of Chicago and a handful of suburbs, as detailed in Table 5. The Zip Codes with blue lines indicate Zip Codes where low-income rates are much higher among households with people with disabilities than among those without disabilities. Specifically, the percent of people with disabilities living under 200% of the federal poverty line is more than 20 percentage points higher than among the population with no disability in the designated Zip Codes. For example, in Arlington Heights zip 60005, 37% of people with disabilities have household incomes below 200% of the federal poverty line compared to 17% of those with no disability. The greatest intra-Zip Code disparities show up in Uptown, Near North Side, West Town, Lincoln Park, Near West Side, Hometown, and Near South Side.43 2005 and 2015 ACS Table S1701, 1-year estimates. Subtracted Chicago from Cook County to get suburbs.44 2015 ACS, Table C18131, 1-year estimates, Civilian non-institutionalized population for whom poverty status is determined. Pulled by Zip Code and mapped using ArcGIS software.

SECTION A: POVERTY, UNEMPLOYMENT, AND FOOD INSECURITY AMONG ADULTS WITH DISABILITIES IN COOK COUNTY COMMUNITIES 18
Sauk Village
Rosemont
Phoenix
Fuller Park
Oakland
Palos Park
Orland Hills
Edison Park
Calumet Heights
East Garfield Park
Near South Side
Washington Heights
Dixmoor
La Grange Park
Ford Heights
Rogers Park
Hyde Park
EdgewaterJefferson Park
Broadview
Lincoln Square
Lower West Side
Robbins
West Englewood
Woodlawn
Posen
Brighton Park
North Lawndale
Riverdale
River Grove
Norridge
Douglas
Lincolnwood
Forest Park
Gage Park
Auburn Gresham
Hickory Hills
North Park
Stickney
Humboldt Park
Countryside
South Shore
La Grange
Belmont Cragin
Bellwood
Prospect Heights
West Pullman
Thornton
Chicago Lawn
Lincoln ParkLogan Square
Maywood
West Lawn
Willow Springs
Forest Glen
Hodgkins
South Lawndale
Palos Heights
Summit
Uptown
Brookfield
Westchester
Irving Park
Hazel Crest
Lake ViewPortage Park
Clearing
Northfield
West Ridge
Northlake
Richton Park
Melrose Park
McCook
Chatham
Rolling Meadows
Glenwood
Loop
Park Forest
Flossmoor
Steger
Near West Side
Worth
Blue Island
Franklin Park
Winnetka
Lyons
West Town
BeverlyPalos Hills
Justice
Hillside
Homewood
Glencoe
Bedford Park
Berwyn
South Holland
Oak Park
Roseland
MarkhamOak Forest
Lynwood
Calumet City
Streamwood
Chicago Heights
South Deering
Evanston
Arlington Heights
Tinley Park
Hoffman Estates
Niles
Orland Park
Dunning
Hegewisch
Burbank
New City
Ashburn
Wilmette
Dolton
Lemont
Oak Lawn
Harvey
Wheeling
Cicero
Lansing
Matteson
Austin
NorthbrookBarrington Hills
Des PlainesElgin
Alsip
Glenview
Schaumburg
Skokie
Palatine
O'Hare
East Side
0 2.5 5Miles
¯
0% - 14%
15% - 34%
35% - 59%
60% - 100%
Cook County Forest Preserve
City of Chicago boundary
Clipfile_disproportionate
Map 1: Percent of people with disabilities living in low-income households by Cook County Zip Code, 2015
*Low income household = annual income below 200% of the federalpoverty line, which was $23,540 for an individual and $48,500 for afamily of four in 2015.
Zip Codes in Cook County
% of people with disabilities living in low-income households*
Percentage of people with disabilities living in low-income households is more than 20 percentage points higher than among households with no member(s) withdisabilities.
19 FOOD INSECURITY AMONG ADULTS WITH DISABILITIES IN COOK COUNTY: REALITIES AND REMEDIES
TABLE 5: Zip Codes with highest rates of low-income among people with disabilities
60469
60612
60624
60653
60621
60672
60649
60644
60623
60640
60609
60636
60637
60651
60626
Zip Code Community Areas in Zip Code # of people with disabilities
# of people with disabilities with incomes below
200% FPL
% of people with disabilities with incomes below
200% FPL
Posen
Near West Side, East Garfield Park
West Garfield Park
Grand Boulevard, Oakland
Englewood
Robbins
South Shore
Austin
South Lawndale, North Lawndale
Uptown
New City, Fuller Park
West Englewood
Woodlawn, Washington Park
Humboldt Park
Rogers Park
577
4,654
6,577
5,122
5,373
1,186
6,859
8,534
11,375
7,244
7,013
5,737
7,053
9,899
4,860
450
3,516
4,913
3,809
3,976
862
4,912
6,013
7,978
5,067
4,776
3,866
4,700
6,552
3,216
78%
76%
75%
74%
74%
73%
72%
70%
70%
70%
68%
67%
67%
66%
66%

SECTION A: POVERTY, UNEMPLOYMENT, AND FOOD INSECURITY AMONG ADULTS WITH DISABILITIES IN COOK COUNTY COMMUNITIES 20
Sauk Village
Rosemont
Phoenix
Fuller Park
Oakland
Palos Park
Orland Hills
Edison Park
Calumet Heights
East Garfield Park
Near South Side
Washington Heights
Dixmoor
La Grange Park
Ford Heights
Rogers Park
Hyde Park
EdgewaterJefferson Park
Broadview
Lincoln Square
Lower West Side
Robbins
West Englewood
Woodlawn
Posen
Brighton Park
North Lawndale
Riverdale
River Grove
Norridge
Douglas
Lincolnwood
Forest Park
Gage Park
Auburn Gresham
Hickory Hills
North Park
Stickney
Humboldt Park
Countryside
South Shore
La Grange
Belmont Cragin
Bellwood
Prospect Heights
West Pullman
Thornton
Chicago Lawn
Lincoln ParkLogan Square
Maywood
West Lawn
Willow Springs
Forest Glen
Hodgkins
South Lawndale
Palos Heights
Summit
Uptown
Brookfield
Westchester
Irving Park
Hazel Crest
Lake ViewPortage Park
Clearing
Northfield
West Ridge
Northlake
Richton Park
Melrose Park
McCook
Chatham
Rolling Meadows
Glenwood
Loop
Park Forest
Flossmoor
Steger
Near West Side
Worth
Blue Island
Franklin Park
Winnetka
Lyons
West Town
BeverlyPalos Hills
Justice
Hillside
Homewood
Glencoe
Bedford Park
Berwyn
South Holland
Oak Park
Roseland
MarkhamOak Forest
Lynwood
Calumet City
Streamwood
Chicago Heights
South Deering
Evanston
Arlington Heights
Tinley Park
Hoffman Estates
Niles
Orland Park
Dunning
Hegewisch
Burbank
New City
Ashburn
Wilmette
Dolton
Lemont
Oak Lawn
Harvey
Wheeling
Cicero
Lansing
Matteson
Austin
NorthbrookBarrington Hills
Des PlainesElgin
Alsip
Glenview
Schaumburg
Skokie
Palatine
O'Hare
East Side
0 2.5 5Miles
¯
0 - 500
501 - 2,500
2,501 - 4,500
4,501 - 7,978
Cook County Forest Preserve
City of Chicago boundary
Map 2: Number of people with disabilities living in low-income households by Cook County Zip Code, 2015
*Low income household = annual income below 200% of the federalpoverty line, which was $23,540 for an individual and $48,500 for afamily of four in 2015.
Zip Codes in Cook County# of people with disabilities livingin low-income households*
Map 2 depicts the number of people with disabilities with low-incomes by Zip Code. Zip Codes in South Lawndale, North Lawndale, Humboldt Park, South Deering, Avalon Park, Roseland, Auburn Gresham, Austin, and Chatham are each home to over 6,000 low income residents with disabilities. A handful of suburbs, including Chicago Heights, Ford Heights, Calumet City, Oak Lawn, Harvey, and Des Plaines are also home to over 2,000 low income people with disabilities.

21 FOOD INSECURITY AMONG ADULTS WITH DISABILITIES IN COOK COUNTY: REALITIES AND REMEDIES
Sauk Village
Rosemont
Phoenix
Fuller Park
Oakland
Palos Park
Orland Hills
Edison Park
Calumet Heights
East Garfield Park
Near South Side
Washington Heights
Dixmoor
La Grange Park
Ford Heights
Rogers Park
Hyde Park
EdgewaterJefferson Park
Broadview
Lincoln Square
Lower West Side
Robbins
West Englewood
Woodlawn
Posen
Brighton Park
North Lawndale
Riverdale
River Grove
Norridge
Douglas
Lincolnwood
Forest Park
Gage Park
Auburn Gresham
Hickory Hills
North Park
Stickney
Humboldt Park
Countryside
South Shore
La Grange
Belmont Cragin
Bellwood
Prospect Heights
West Pullman
Thornton
Chicago Lawn
Lincoln ParkLogan Square
Maywood
West Lawn
Willow Springs
Forest Glen
Hodgkins
South Lawndale
Palos Heights
Summit
Uptown
Brookfield
Westchester
Irving Park
Hazel Crest
Lake ViewPortage Park
Clearing
Northfield
West Ridge
Northlake
Richton Park
Melrose Park
McCook
Chatham
Rolling Meadows
Glenwood
Loop
Park Forest
Flossmoor
Steger
Near West Side
Worth
Blue Island
Franklin Park
Winnetka
Lyons
West Town
BeverlyPalos Hills
Justice
Hillside
Homewood
Glencoe
Bedford Park
Berwyn
South Holland
Oak Park
Roseland
MarkhamOak Forest
Lynwood
Calumet City
Streamwood
Chicago Heights
South Deering
Evanston
Arlington Heights
Tinley Park
Hoffman Estates
Niles
Orland Park
Dunning
Hegewisch
Burbank
New City
Ashburn
Wilmette
Dolton
Lemont
Oak Lawn
Harvey
Wheeling
Cicero
Lansing
Matteson
Austin
NorthbrookBarrington Hills
Des PlainesElgin
Alsip
Glenview
Schaumburg
Skokie
Palatine
O'Hare
East Side
0 2.5 5Miles
¯
< 100
101 - 500
501 - 1,000
1,010 - 2,500
Cook County Forest Preserve
City of Chicago boundary
Map 3: Number of people with disabilities living in low-income households per square mile, by Cook County Zip Code, 2015
*Low income household = annual income below 200% of the federalpoverty line, which was $23,540 for an individual and $48,500 for afamily of four in 2015.
Zip Codes in Cook County# of people with disabilities living in low-income households per square mile*
Taking into account the variance in geographical size and population density of different Zip Codes, Map 3 divides the number of low-income people with disabilities by the square mileage of the Zip Code. The areas with highest density of low-income people with disabilities are along the lakefront and Chicago’s west side, namely Edgewater, Uptown, Rogers Park, Humboldt Park, Austin, Near North Side, South Shore, Grand Boulevard, Oakland, South Lawndale, North Lawndale, West Garfield Park, and West Ridge (in order of density). Only very affluent suburbs on the edge of the county contain less than 50 low income people with a disability per square mile.

SECTION A: POVERTY, UNEMPLOYMENT, AND FOOD INSECURITY AMONG ADULTS WITH DISABILITIES IN COOK COUNTY COMMUNITIES 22
Sauk Village
Rosemont
Phoenix
Fuller Park
Oakland
Palos Park
Orland Hills
Edison Park
Calumet Heights
East Garfield Park
Near South Side
Washington Heights
Dixmoor
La Grange Park
Ford Heights
Rogers Park
Hyde Park
EdgewaterJefferson Park
Broadview
Lincoln Square
Lower West Side
Robbins
West Englewood
Woodlawn
Posen
Brighton Park
North Lawndale
Riverdale
River Grove
Norridge
Douglas
Lincolnwood
Forest Park
Gage Park
Auburn Gresham
Hickory Hills
North Park
Stickney
Humboldt Park
Countryside
South Shore
La Grange
Belmont Cragin
Bellwood
Prospect Heights
West Pullman
Thornton
Chicago Lawn
Lincoln ParkLogan Square
Maywood
West Lawn
Willow Springs
Forest Glen
Hodgkins
South Lawndale
Palos Heights
Summit
Uptown
Brookfield
Westchester
Irving Park
Hazel Crest
Lake ViewPortage Park
Clearing
Northfield
West Ridge
Northlake
Richton Park
Melrose Park
McCook
Chatham
Rolling Meadows
Glenwood
Loop
Park Forest
Flossmoor
Steger
Near West Side
Worth
Blue Island
Franklin Park
Winnetka
Lyons
West Town
BeverlyPalos Hills
Justice
Hillside
Homewood
Glencoe
Bedford Park
Berwyn
South Holland
Oak Park
Roseland
MarkhamOak Forest
Lynwood
Calumet City
Streamwood
Chicago Heights
South Deering
Evanston
Arlington Heights
Tinley Park
Hoffman Estates
Niles
Orland Park
Dunning
Hegewisch
Burbank
New City
Ashburn
Wilmette
Dolton
Lemont
Oak Lawn
Harvey
Wheeling
Cicero
Lansing
Matteson
Austin
NorthbrookBarrington Hills
Des PlainesElgin
Alsip
Glenview
Schaumburg
Skokie
Palatine
O'Hare
East Side
0 2.5 5Miles
¯
0% - 10%
11% - 25%
26% - 45%
46% - 100%
Cook County Forest Preserve
City of Chicago boundary
Map 4: Percent of adults with disabilities age 18-64 living below the poverty level by Cook County Zip Code, 2015
*Poverty level = annual household income of $11,770 for an individual and $24,250 for afamily of four in 2015.
Zip Codes in Cook County% of adults age 18-64 with disabilities living in households with incomes below the poverty level*
The next two maps break down poverty among adults with disabilities by Zip Code and by age. The 200% of the federal poverty level scale used in the previous maps is not available when bifurcating by age, so we use 100% of the poverty level here instead. Although all food insecure people are likely not reflected here, the widespread presence of material hardship across the county is clear. Note that the scales demarcating the percentages are the same for both maps, highlighting that poverty tends to be more prevalent among 18-64 year old adults with disabilities than among those over age 64. Only one Zip Code in Posen has a poverty rate higher than 50% among older adults age 65+, while 11 Zip Codes do for the younger cohort.
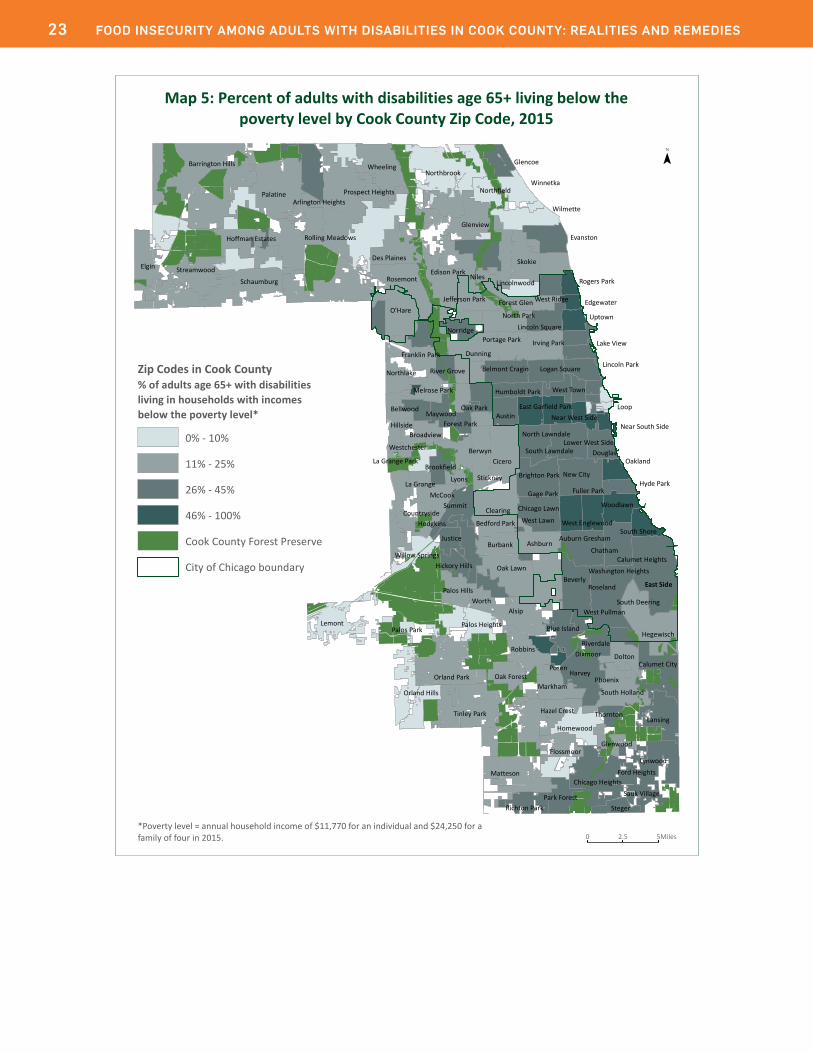
23 FOOD INSECURITY AMONG ADULTS WITH DISABILITIES IN COOK COUNTY: REALITIES AND REMEDIES
Sauk Village
Rosemont
Phoenix
Fuller Park
Oakland
Palos Park
Orland Hills
Edison Park
Calumet Heights
East Garfield Park
Near South Side
Washington Heights
Dixmoor
La Grange Park
Ford Heights
Rogers Park
Hyde Park
EdgewaterJefferson Park
Broadview
Lincoln Square
Lower West Side
Robbins
West Englewood
Woodlawn
Posen
Brighton Park
North Lawndale
Riverdale
River Grove
Norridge
Douglas
Lincolnwood
Forest Park
Gage Park
Auburn Gresham
Hickory Hills
North Park
Stickney
Humboldt Park
Countryside
South Shore
La Grange
Belmont Cragin
Bellwood
Prospect Heights
West Pullman
Thornton
Chicago Lawn
Lincoln ParkLogan Square
Maywood
West Lawn
Willow Springs
Forest Glen
Hodgkins
South Lawndale
Palos Heights
Summit
Uptown
Brookfield
Westchester
Irving Park
Hazel Crest
Lake ViewPortage Park
Clearing
Northfield
West Ridge
Northlake
Richton Park
Melrose Park
McCook
Chatham
Rolling Meadows
Glenwood
Loop
Park Forest
Flossmoor
Steger
Near West Side
Worth
Blue Island
Franklin Park
Winnetka
Lyons
West Town
BeverlyPalos Hills
Justice
Hillside
Homewood
Glencoe
Bedford Park
Berwyn
South Holland
Oak Park
Roseland
MarkhamOak Forest
Lynwood
Calumet City
Streamwood
Chicago Heights
South Deering
Evanston
Arlington Heights
Tinley Park
Hoffman Estates
Niles
Orland Park
Dunning
Hegewisch
Burbank
New City
Ashburn
Wilmette
Dolton
Lemont
Oak Lawn
Harvey
Wheeling
Cicero
Lansing
Matteson
Austin
NorthbrookBarrington Hills
Des PlainesElgin
Alsip
Glenview
Schaumburg
Skokie
Palatine
O'Hare
East Side
0 2.5 5Miles
¯
0% - 10%
11% - 25%
26% - 45%
46% - 100%
Cook County Forest Preserve
City of Chicago boundary
Map 5: Percent of adults with disabilities age 65+ living below the poverty level by Cook County Zip Code, 2015
*Poverty level = annual household income of $11,770 for an individual and $24,250 for afamily of four in 2015.
Zip Codes in Cook County% of adults age 65+ with disabilities living in households with incomes below the poverty level*

SECTION B: FOOD ASSISTANCE RESOURCES AVAILABLE TO ADULTS WITH DISABILITIES AND ESTIMATIONS OF UNMET NEED FOR FOOD ASSISTANCE AMONG THIS POPULATION 24
In order to identify gaps in services reaching food insecure adults with disabilities, we must first understand the current landscape of nutrition services available to this population. With the help of several requests to state and local agencies, this section explores the largest nutrition assistance programs. Because this report estimates that the Supplemental Nutrition Assistance Program (SNAP, formerly food stamps) supplies over 80% of the current food assistance reaching adults with disabilities, we explore this program in great depth.
We also describe program providing home delivered meals, congregate meal sites, food box delivery, and adult care centers as well the Food Depository’s network of food distribution sites and partners. Each of these networks of nutritional services play a critical role in the food assistance social safety net. Eligibility guidelines, capacity, participation rates, scope of services, and geographical coverage of these programs vary widely, however. Moreover, some are federal entitlement programs, meaning Congress is required to fund benefits for all that are eligible, while others are discretionary, meaning Congress funds them in varying amounts on an annual basis. Still others are privately financed through charitable giving.
This list is not exhaustive as other smaller-scale resources could not be tracked. Programs such as the Senior Farmers’ Market Nutrition Program and independent philanthropic efforts certainly contribute to alleviating food insecurity among adults with disabilities as well, yet we do not focus on them here.
The Supplemental Nutrition Assistance Program Administered by the Illinois Department of Human Services (IDHS) and funded by the federal government, the Supplemental Nutrition Assistance Program (SNAP, formerly food stamps) is the largest federal nutrition assistance program. As of spring 2017, it is an entitlement program. SNAP provides electronic benefits on a LINK card that low-income people can use to purchase groceries. In 2015, 30% of Cook County households with a member with a disability received SNAP.46
Eligibility is based on the household’s income and living expenses. Adults that receive federal or state disability payments or are over age 60 can have a maximum allowable income of 200% of the federal poverty level, or $1,980 per month for one person. Determination of disability by another governmental agency such as the Social Security Administration transfers to IDHS; there is no need to be separately assessed for disability.47 People with disability determinations are also not subject to the same work requirements and time limits as other adult SNAP recipients, and they are eligible for a medical deduction for expenses that exceed $35.
Nationally, the average SNAP benefit per person in households with a non-elderly individual with a disability was $102 per month in 2015, and elderly individuals received $98 per month on average.48 In order to ensure SNAP applicants with disabilities receive the maximum benefit amount their income qualifies them for, they should make sure to report all medical expenses, to get their income assessed during a month when no back payments for past due benefits will be arriving, and to reach out to either IDHS or GCFD for assistance when administrative concerns arise to avoid any lapse in paperwork. 462015 ACS, Table B22010 1-year estimates. Households.47Gray, K.F. (3). According to the USDA, “A person is considered to be elderly for SNAP eligibility purposes if he or she is age 60 or older. Generally, a person is considered to be disabled for SNAP eligibility purposes if he or she receives Federal or State disability or blindness payments or other disability retirement benefits from a government agency under the Social Security Act, including Supplemental Security Income (SSI) or Social Security disability or blindness payments; receives an annuity under the Railroad Retirement Act and is (1) eligible for Medicare or (2) considered to be disabled based on SSI rules; is a veteran who is totally disabled, permanently housebound, or in need of regular aid and attendance; or is permanently disabled and receiving veterans’ benefits as a surviving spouse or child of a veteran.” P 3
SECTION B: FOOD ASSISTANCE RESOURCES AVAILABLE TO ADULTS WITH DISABILITIES AND ESTIMATIONS OF UNMET NEED FOR FOOD ASSISTANCE AMONG THIS POPULATION

25 FOOD INSECURITY AMONG ADULTS WITH DISABILITIES IN COOK COUNTY: REALITIES AND REMEDIES
Adults managing a disability that do not receive disability benefits typically face the same eligibility, time limit, and work requirements as adults with no disabilities. Individuals can apply to the state for an individualized exemption from these requirements. For those that are not granted an exemption, they can still receive SNAP if they meet the general income and asset requirements, but their eligibility is based on the lower income threshold of 165% of the federal poverty line (in Illinois) and they cannot access the same medical deduction. These factors which would likely result in a lower monthly benefit amount.
Moreover, federal rules require that SNAP recipients age 18 to 50 that have not been medically certified as physically or mentally unfit for employment and are not pregnant or responsible for the care of a child or incapacitated household member be limited to 3 months of benefits in a 36 month period. In times of high unemployment or scarcer job opportunities, states can request to temporarily put aside these time limits and work requirements by applying for a waiver known as the able-bodied adults without dependents (ABAWDs) waiver. Illinois has requested this waiver as we recover from the Great Recession, though at least parts of the state are likely to lose this option in 2018 because Illinois will no longer qualify based on improved unemployment and labor force data. Some areas of Illinois will likely continue to qualify for a waiver as long as the state requests it.
In the absence of an ABAWD waiver, Illinois’ ability to exempt individuals from time limits and work requirements is important to reaching low-income adults with disabilities who do not receive disability benefits or otherwise have a disability determination for SNAP eligibility purposes. As described by the Center on Budget and Policy Priorities report Who Are the Low-Income Childless Adults Facing the Loss of SNAP in 2016, “many childless adults have disabilities that make working difficult or impossible but don’t meet the severe disability standard for receiving Supplemental Security Income (SSI) or Social Security Disability Insurance (SSDI).”49 Indeed, the Employment Policy and Measurement Rehabilitation Research and Training Center estimated in 2014 that “700,000 people with disabilities [in the U.S.] meet the definition of an ABAWD and thus will be affected by the reinstatement of the work requirement.”50
This disconnect between the presence of a disability, being eligible for and enrolling in disability benefit programs, and food insecurity came up in the focus groups and online survey participants featured in this report. Of the 42 adults with disabilities struggling
with food insecurity who participated in the focus groups, only 39% received SSI, 25% received SSDI, and 42% received SNAP. Of the 56 adults with disabilities who participated in the online survey and reported food insecurity, only 20% received SSI, 52% received SSDI, and 48% received SNAP. Moreover, many participants described how their SNAP benefits have been cut over time and are not sufficient to meet their nutrition needs. The reasons behind this widespread sense of SNAP benefits decreasing requires further investigation, though much of it likely came as a result of the expiration of the American Recovery and Reinvestment Act of 2009 (ARRA) SNAP benefit stimulus.
For more information about the SNAP program, or if you are interested in seeing if you are eligible or in receiving assistance to complete an application, please call the Food Depository’s Benefit Outreach Team hotline at (773) 843-5416 or visit IDHS’ website at http://www.dhs.state.il.us/page.aspx?item=3035748Gary, K.F.49Carlson, S.(2)50Morris, et al.
SECTION B: FOOD ASSISTANCE RESOURCES AVAILABLE TO ADULTS WITH DISABILITIES AND ESTIMATIONS OF UNMET NEED FOR FOOD ASSISTANCE AMONG THIS POPULATION 26
Meal delivery services and congregate meal sites Adults with disabilities can access prepared or frozen meals via home delivery or congregate meal sites through state and local agencies as well. Eligibility depends on disability status, age and residence. Top providers include:
Illinois Department of Rehabilitation Services (DRS)
Adults with long term, severe disabilities that are under age 60 can qualify for the Illinois Department of Human Services’ Division of Rehabilitation Services’ Home Services Program. Generally, this program targets people at risk of moving into a nursing home or other facility. Depending on an individual’s service plan, the program may provide home delivered meals to individuals who can feed themselves but are unable to prepare food. If services are funded through a Medicaid waiver program, they are part of an entitlement program. 31% of focus group participants and 30% of the online survey participants that reported struggling with food insecurity received DRS in-home services. In fiscal year 2015, an estimated 829 individuals in Cook County received home delivered meals through the DRS Home Services Program, amounting to just over 430,000 meals (estimated) across the year. Participants received 2 meals per day, 5 days per week, on average.51
For more information, visit http://www.dhs.state.il.us/page.aspx?item=67182 or call (800) 843-6154.
City of Chicago Mayor’s Office for People with Disabilities (MOPD)
For adults with disabilities younger than age 60 who do not qualify for DRS In-Home Services, the Mayor’s Office for People with Disabilities partners with Access Living and Meals on Wheels Chicago to offer in-home services essential to retaining independence, including home delivered meals and assistive technology grants.52 In calendar year 2015, the MOPD provided a total of 31,200 meals to an estimated 93 unique individuals throughout the year.53
To contact the City of Chicago Mayor’s Office for People with Disabilities, call (312) 744-6673 and ask for the intake line for the Mayor’s Office for People with Disabilities.
The Illinois Department of Aging nutrition services: administered by AgeOptions in the suburbs, and the Chicago Department of Family & Support Services in Chicago.
Similar meal delivery services are available for people over age 60 through the Illinois Department of Aging. AgeOptions is the local Area Agency on Aging for the Cook County suburbs and the City of Chicago’s Department of Family & Support Services fills this role within Chicago’s borders.
In fiscal year 2015, AgeOptions and their partners provided over 700,000 home delivered meals to homebound older adults in the suburbs. They also served over 270,000 congregate dining meals to older adults in the suburbs, though the agency does not capture disability status at these group dining events.54
Through their partnership with Meals on Wheels Chicago, in calendar year 2015, DFSS supplied over 1,166,000 home delivered meals to homebound older adults in the City of Chicago. They also served over 800,000 congregate dining meals to older adults in Chicago, though they similarly do not capture disability status at these group dining events.55
For more information on Age Options, visit http://www.ageoptions.org or call (708) 383-0258.
For more information on the City of Chicago’s Department of Family & Support Services, visit https://www.cityofchicago.org/city/en/depts/fss/provdrs/senior.html
For more information on Meals on Wheels Chicago, visit http://www.mealsonwheelschicago.org or call (773) 661-4550.51 Data received by direct request from the Illinois Department of Human Services.52 Assistive technology is an umbrella term that includes a wide variety of devices and processes that promote greater independence, such as wheelchairs, lifts, walkers, prosthesis, screen readers, braille, video magnifiers, screen magnifiers, navigation assistants, hearing aids, and much more.53 Data received by direct request from the City of Chicago’s Department of Family & Support Services.54 Data received by direct request from AgeOptions.55 Data received by direct request from the City of Chicago’s Department of Family & Support Services.
27 FOOD INSECURITY AMONG ADULTS WITH DISABILITIES IN COOK COUNTY: REALITIES AND REMEDIES
Food box delivery
Commodity Supplemental Food Program (CSFP)
The CSFP program provides supplemental food packages predominantly to older adults age 60+ with incomes at or below 130% of the federal poverty line. It is a federal nutrition assistance program locally administered by Catholic Charities of the Archdiocese of Chicago. According to the United States Department of Agriculture (USDA), “food packages include a variety of foods, such as nonfat dry and ultra-high temperature fluid milk, juice, farina, oats, ready-to-eat cereal, rice, pasta, peanut butter, dry beans, canned meat, poultry or fish, and canned fruits and vegetables.”56
In fiscal year 2015, the final CSFP caseload for the city of Chicago and selected sites in suburban Cook County totaled 16,281. Each participant (case) receives an approximately 25 pound box of food per month.57
To contact Catholic Charities, call (312) 655-7700.56USDA CSFP Fact Sheet: https://www.fns.usda.gov/sites/default/files/csfp/programFactSheet-csfp.pdf 57Data downloaded from USDA website: https://www.fns.usda.gov/csfp/commodity-supplemental-food-program-csfp
Prepared meals at adult care centers
Child and Adult Care Food Program (CACFP)
The Illinois Department on Aging administers the arm of the CACFP that reaches adults with disabilities. CACFP is a federal discretionary program. It reimburses participating agencies that provide healthy meals and snacks at Adult Day Service Centers under the Community Care Program.
Participants must either be age 60 or older or adults of any age with disabilities severe enough to limit their independence and ability to carry out activities of daily living. An individual’s eligibility to participate is also based on their household income, which must be at or below 130% of the federal poverty line. In fiscal year 2015, the CACFP program provided an estimated 334,200 meals to over 1,850 individuals in Cook County, averaging 180 meals per participant per year, or 3.5 meals per week.
For more information or to find a participating Adult Day Care Center near you, call (217) 782-2407 or visit https://www.illinois.gov/aging/CommunityServices/Pages/Child-and-Adult-Care-Food-Program-(CACFP).aspx
The Greater Chicago Food Depository (includes the Emergency Food Assistance Program, TEFAP)
As the food bank serving Cook County, the Food Depository operates with the support of government sources such as the Emergency Food Assistance Program (TEFAP) as well as other public and private funds and suppliers. TEFAP provides food at no cost to help supplement the diets of low-income individuals and households. It is a discretionary federal program administered by the USDA nationally and locally by the Illinois Department of Human Services (IDHS). IDHS contracts with 8 food banks across Illinois to oversee this program; the Food Depository holds the local contract for Cook County.
In fiscal year 2016, the Food Depository distributed over 67.2 million pounds of food (including over 30% produce), beverages, and a limited amount of other non-food necessities through a network of over 700 partner agencies and direct distribution programs in Cook County.
Based on Feeding America’s Hunger in America 2014 study, over 1 in 6 Cook County residents turn to the Food Depository’s network at some point throughout the year. This includes visits to member food pantries, soup kitchens, shelters, older adult programs, veterans’ programs, children’s programs, health programs, and mobile distributions. The Food Depository’s Benefits Outreach Team also assists people with SNAP and Medicaid applications and their Chicago’s Community Kitchens program runs a workforce development program focused on achieving productive careers in food service.
Generally, eligibility for receiving food at all open Food Depository programs only requires self-declaration of household income of 185% of the federal poverty line or below. Food pantries may request documentation to verify identity and residency since most have service boundaries. That is, anybody who lives within certain parameters can come to the pantry or other food program a certain number of times per month, usually twice, though first-timers must always be served regardless of residential address. People who receive prepared meals at soup kitchens or homeless shelters are considered income eligible by default.
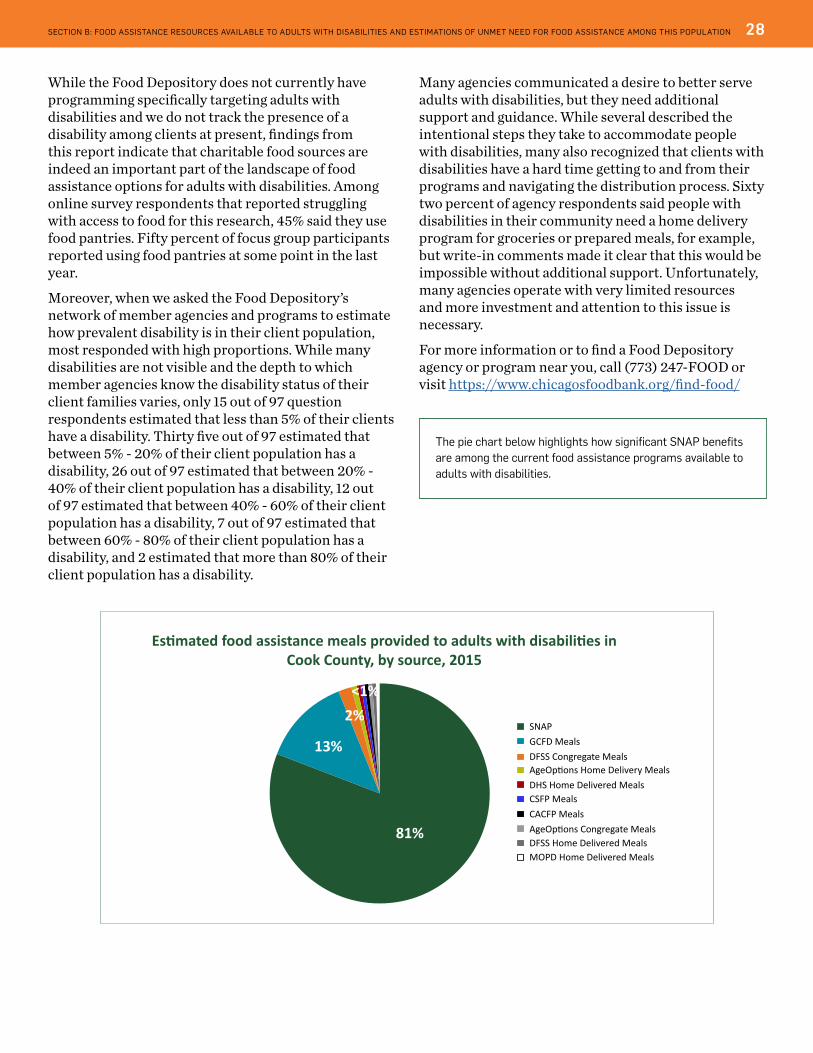
SECTION B: FOOD ASSISTANCE RESOURCES AVAILABLE TO ADULTS WITH DISABILITIES AND ESTIMATIONS OF UNMET NEED FOR FOOD ASSISTANCE AMONG THIS POPULATION 28
While the Food Depository does not currently have programming specifically targeting adults with disabilities and we do not track the presence of a disability among clients at present, findings from this report indicate that charitable food sources are indeed an important part of the landscape of food assistance options for adults with disabilities. Among online survey respondents that reported struggling with access to food for this research, 45% said they use food pantries. Fifty percent of focus group participants reported using food pantries at some point in the last year.
Moreover, when we asked the Food Depository’s network of member agencies and programs to estimate how prevalent disability is in their client population, most responded with high proportions. While many disabilities are not visible and the depth to which member agencies know the disability status of their client families varies, only 15 out of 97 question respondents estimated that less than 5% of their clients have a disability. Thirty five out of 97 estimated that between 5% - 20% of their client population has a disability, 26 out of 97 estimated that between 20% - 40% of their client population has a disability, 12 out of 97 estimated that between 40% - 60% of their client population has a disability, 7 out of 97 estimated that between 60% - 80% of their client population has a disability, and 2 estimated that more than 80% of their client population has a disability.
Many agencies communicated a desire to better serve adults with disabilities, but they need additional support and guidance. While several described the intentional steps they take to accommodate people with disabilities, many also recognized that clients with disabilities have a hard time getting to and from their programs and navigating the distribution process. Sixty two percent of agency respondents said people with disabilities in their community need a home delivery program for groceries or prepared meals, for example, but write-in comments made it clear that this would be impossible without additional support. Unfortunately, many agencies operate with very limited resources and more investment and attention to this issue is necessary.
For more information or to find a Food Depository agency or program near you, call (773) 247-FOOD or visit https://www.chicagosfoodbank.org/find-food/
0% 10% 20% 30% 40% 50%
Chart 1: Food insecurity levels among households with and without adults with disabili�es: Chicago metropolitan area
Households with member age 18-64, with disability
Households with member age 18-64, no disability
20.4% 10.5% 11.7%
3% 5% 7%
Food insecure = very low food security + low food security = 31%
Very low food security
Marginal food security
Low food security
Households with member age 65+, with disability
Households with member age 65+, no disability
7% 7% 6%
2% 8%
0% 10% 20% 30% 40% 50%
Food security levels among households with and without adults with disabili�es, age 18-64: Chicago metropolitan area
Households with member age 18-64, with disability
Households with member age 18-64, no disability
20.4% 10.5% 11.7%
2.9% 5.5% 7.4%
Food insecure = very low food security + low food security = 31%
Food insecure = 8%
Very low food security: Reports of mul�ple indica�ons of disrupted ea�ng pa�erns and reduced food intake
Marginal food security: one or two reported indica�ons of food access problems—typically of anxiety over food sufficiency or shortage of food in the house
Low food security: reports of reduced quality, variety, or desirability of diet
0% 10% 20% 30% 40% 50%
Chart 2: Food insecurity levels among households with and without adults with disabili�es: Illinois
Households with member age 18-64, with disability
Households with member age 18-64, no disability
18% 16% 15%
3% 6% 8%
Very low food security
Marginal food security
Low food security
Households with member age 65+, with disability
Households with member age 65+, no disability
7% 6% 9%
3% 7%
0% 10% 20% 30% 40% 50%
Chart 3: Food insecurity levels among households with and without adults with disabili�es: United States
Households with member age 18-64, with disability
Households with member age 18-64, no disability
17% 17% 15%
4% 7% 9%
Very low food security
Marginal food security
Low food security
Households with member age 65+, with disability
Households with member age 65+, no disability
5% 8% 8%
3% 6%
Es�mated food assistance meals provided to adults with disabili�es in Cook County, by source, 2015
SNAP
DFSS Congregate MealsGCFD Meals
AgeOp�ons Home Delivery Meals
CSFP MealsDHS Home Delivered Meals
CACFP Meals
DFSS Home Delivered MealsAgeOp�ons Congregate Meals
MOPD Home Delivered Meals
81%
13%
2%<1%
The pie chart below highlights how significant SNAP benefits are among the current food assistance programs available to adults with disabilities.

29 FOOD INSECURITY AMONG ADULTS WITH DISABILITIES IN COOK COUNTY: REALITIES AND REMEDIES
Estimating unmet need by Zip Code among adults with disabilities in Cook County
Each of the food assistance programs described above contributes to alleviating food insecurity among adults with disabilities, yet current supports do not sufficiently provide for good nutrition for all adults with disabilities struggling with low food access in Cook County.
The disproportionately high rates of food insecurity and low-income rates explored previously as well as feedback from participants in this project indicate an unmet need. Among the respondents to this report’s public survey, 70% of those with a disability and 38% of those with no disability said they strongly agree that there is an unmet need for food assistance among people with disabilities in Cook County. Another 19% and 38% agree with this statement, respectively. 8% were unsure. Moreover, 26% of respondents said this need was very severe, while 40% said one notch below very severe. Among the Food Depository’s network of member agencies, 65% strongly agreed or agreed that there are people with disabilities in their community that are in need of additional food assistance.
We also know from documenting existing food assistance programs that certain areas of the county experience less coverage in terms of food assistance programs and complementary neighborhood amenities than others. For example, in the suburbs, fewer accessible public transportation options and lack of home delivered meal programs for younger adults with disabilities intersect to make levels of food access and the best methods of improving it specific to that geography.
To quantify these geographical gaps in service, we estimated both the number of people in need and levels of participation in the food assistance programs mentioned above, by Zip Code.58 Our analysis imagines a food assistance system with the capacity to provide two meals per day, five days a week (or 520 annual meals), for every adult with a disability with income below 200% of the federal poverty line. This is the number of meals typically provided to enrolled individuals by the Illinois Department of Rehabilitation Services and Meals on Wheels. We chose to use 200% of the federal poverty line as this is the income eligibility threshold for adults with disabilities to participate in the largest federal nutrition program (SNAP, formerly food stamps), as described previously.
This analysis found considerable opportunities across the county to deepen the food assistance response available to adults with disabilities. Because of differences in eligibility for assistance programs, we separate data reflecting 18-64 years olds from those aged 65 and older. Maps 6 and 7 show that in both age cohorts, in only two Zip Codes were the full 520 meals per year provided to each person in need. The first Zip Code is in the upper northwest area covered by the Food Depository’s largest distribution partner of Willow Creek in South Barrington, which serves multiple area municipalities. The second is a small Zip Code in Oak Park, which also likely reaches people in the surrounding areas as well. Far north Zip Codes have particularly low coverage, likely due in part to fewer lower-income households living there. The majority of Zip Codes appear to have either limited to moderate coverage.58 We accepted several assumptions and caveats to arrive at these assess-ments, as detailed in the methodology section and the technical appendix. This analysis estimates the size of gaps in service but does not imply any specific mix of programs to close the gap nor does it measure the quality of existing programs. The intention is to jumpstart further research into these findings rather than to suggest specific choices in programming lo-cation or composition. Food insecurity rates are not used because they are not available at the sub-county level and it is unclear if people reporting food insecurity currently receive food assistance.

SECTION B: FOOD ASSISTANCE RESOURCES AVAILABLE TO ADULTS WITH DISABILITIES AND ESTIMATIONS OF UNMET NEED FOR FOOD ASSISTANCE AMONG THIS POPULATION 30
Sauk Village
Rosemont
Phoenix
Fuller Park
Oakland
Palos Park
Orland Hills
Edison Park
Calumet Heights
East Garfield Park
Near South Side
Washington Heights
Dixmoor
La Grange Park
Ford Heights
Rogers Park
Hyde Park
EdgewaterJefferson Park
Broadview
Lincoln Square
Lower West Side
Robbins
West Englewood
Woodlawn
Posen
Brighton Park
North Lawndale
Riverdale
River Grove
Norridge
Douglas
Lincolnwood
Forest Park
Gage Park
Auburn Gresham
Hickory Hills
North Park
Stickney
Humboldt Park
Countryside
South Shore
La Grange
Belmont Cragin
Bellwood
Prospect Heights
West Pullman
Thornton
Chicago Lawn
Lincoln ParkLogan Square
Maywood
West Lawn
Willow Springs
Forest Glen
Hodgkins
South Lawndale
Palos Heights
Summit
Uptown
Brookfield
Westchester
Irving Park
Hazel Crest
Lake ViewPortage Park
Clearing
Northfield
West Ridge
Northlake
Richton Park
Melrose Park
McCook
Chatham
Rolling Meadows
Glenwood
Loop
Park Forest
Flossmoor
Steger
Near West Side
Worth
Blue Island
Franklin Park
Winnetka
Lyons
West Town
BeverlyPalos Hills
Justice
Hillside
Homewood
Glencoe
Bedford Park
Berwyn
South Holland
Oak Park
Roseland
MarkhamOak Forest
Lynwood
Calumet City
Streamwood
Chicago Heights
South Deering
Evanston
Arlington Heights
Tinley Park
Hoffman Estates
Niles
Orland Park
Dunning
Hegewisch
Burbank
New City
Ashburn
Wilmette
Dolton
Lemont
Oak Lawn
Harvey
Wheeling
Cicero
Lansing
Matteson
Austin
NorthbrookBarrington Hills
Des PlainesElgin
Alsip
Glenview
Schaumburg
Skokie
Palatine
O'Hare
East Side
0 2.5 5Miles
¯
< 100
101 - 250
251 - 519
> 520
Cook County Forest Preserve
City of Chicago boundary
Map 6: Food assistance reaching low-income adults with disabilities age 18-64 by Cook County Zip Code, 2015
*Low income household = annual income below 200% of the federalpoverty line, which was $23,540 for an individual and $48,500 for afamily of four in 2015.
Zip Codes in Cook CountyEstimated # of annual meals per person reaching low-income adults age 18-64 with disabilities through food assistance programs*

31 FOOD INSECURITY AMONG ADULTS WITH DISABILITIES IN COOK COUNTY: REALITIES AND REMEDIES
Sauk Village
Rosemont
Phoenix
Fuller Park
Oakland
Palos Park
Orland Hills
Edison Park
Calumet Heights
East Garfield Park
Near South Side
Washington Heights
Dixmoor
La Grange Park
Ford Heights
Rogers Park
Hyde Park
EdgewaterJefferson Park
Broadview
Lincoln Square
Lower West Side
Robbins
West Englewood
Woodlawn
Posen
Brighton Park
North Lawndale
Riverdale
River Grove
Norridge
Douglas
Lincolnwood
Forest Park
Gage Park
Auburn Gresham
Hickory Hills
North Park
Stickney
Humboldt Park
Countryside
South Shore
La Grange
Belmont Cragin
Bellwood
Prospect Heights
West Pullman
Thornton
Chicago Lawn
Lincoln ParkLogan Square
Maywood
West Lawn
Willow Springs
Forest Glen
Hodgkins
South Lawndale
Palos Heights
Summit
Uptown
Brookfield
Westchester
Irving Park
Hazel Crest
Lake ViewPortage Park
Clearing
Northfield
West Ridge
Northlake
Richton Park
Melrose Park
McCook
Chatham
Rolling Meadows
Glenwood
Loop
Park Forest
Flossmoor
Steger
Near West Side
Worth
Blue Island
Franklin Park
Winnetka
Lyons
West Town
BeverlyPalos Hills
Justice
Hillside
Homewood
Glencoe
Bedford Park
Berwyn
South Holland
Oak Park
Roseland
MarkhamOak Forest
Lynwood
Calumet City
Streamwood
Chicago Heights
South Deering
Evanston
Arlington Heights
Tinley Park
Hoffman Estates
Niles
Orland Park
Dunning
Hegewisch
Burbank
New City
Ashburn
Wilmette
Dolton
Lemont
Oak Lawn
Harvey
Wheeling
Cicero
Lansing
Matteson
Austin
NorthbrookBarrington Hills
Des PlainesElgin
Alsip
Glenview
Schaumburg
Skokie
Palatine
O'Hare
East Side
0 2.5 5Miles
¯
< 100
101 - 250
251 - 519
> 520
Cook County Forest Preserve
City of Chicago boundary
Map 7: Food assistance reaching low-income adults with disabilities age 65+ by Cook County Zip Code, 2015
*Low income household = annual income below 200% of the federalpoverty line, which was $23,540 for an individual and $48,500 for afamily of four in 2015.
Zip Codes in Cook CountyEstimated # of annual meals per person reaching low-income adults age 65+ with disabilities through food assistance programs*

SECTION B: FOOD ASSISTANCE RESOURCES AVAILABLE TO ADULTS WITH DISABILITIES AND ESTIMATIONS OF UNMET NEED FOR FOOD ASSISTANCE AMONG THIS POPULATION 32
Sauk Village
Rosemont
Phoenix
Fuller Park
Oakland
Palos Park
Orland Hills
Edison Park
Calumet Heights
East Garfield Park
Near South Side
Washington Heights
Dixmoor
La Grange Park
Ford Heights
Rogers Park
Hyde Park
EdgewaterJefferson Park
Broadview
Lincoln Square
Lower West Side
Robbins
West Englewood
Woodlawn
Posen
Brighton Park
North Lawndale
Riverdale
River Grove
Norridge
Douglas
Lincolnwood
Forest Park
Gage Park
Auburn Gresham
Hickory Hills
North Park
Stickney
Humboldt Park
Countryside
South Shore
La Grange
Belmont Cragin
Bellwood
Prospect Heights
West Pullman
Thornton
Chicago Lawn
Lincoln ParkLogan Square
Maywood
West Lawn
Willow Springs
Forest Glen
Hodgkins
South Lawndale
Palos Heights
Summit
Uptown
Brookfield
Westchester
Irving Park
Hazel Crest
Lake ViewPortage Park
Clearing
Northfield
West Ridge
Northlake
Richton Park
Melrose Park
McCook
Chatham
Rolling Meadows
Glenwood
Loop
Park Forest
Flossmoor
Steger
Near West Side
Worth
Blue Island
Franklin Park
Winnetka
Lyons
West Town
BeverlyPalos Hills
Justice
Hillside
Homewood
Glencoe
Bedford Park
Berwyn
South Holland
Oak Park
Roseland
MarkhamOak Forest
Lynwood
Calumet City
Streamwood
Chicago Heights
South Deering
Evanston
Arlington Heights
Tinley Park
Hoffman Estates
Niles
Orland Park
Dunning
Hegewisch
Burbank
New City
Ashburn
Wilmette
Dolton
Lemont
Oak Lawn
Harvey
Wheeling
Cicero
Lansing
Matteson
Austin
NorthbrookBarrington Hills
Des PlainesElgin
Alsip
Glenview
Schaumburg
Skokie
Palatine
O'Hare
East Side
0 2.5 5Miles
¯
< 15,000
15,001 - 50,000
50,001 - 150,000
150,001 - 415,000
Cook County Forest Preserve
City of Chicago boundary
Map 8: Additional food assistance resources needed per square mile among low-income adults with disabilities age 18-64 by Cook County Zip Code, 2015
*Low income household = annual income below 200% of the federalpoverty line, which was $23,540 for an individual and $48,500 for afamily of four in 2015.
Zip Codes in Cook County Estimated # of additional food assistance meals needed annually among low-income adults with disabilities age 18-64, per square mile*
Our next step calculated how many additional meals would be necessary to reach 520 meals per year available to each low-income adult with a disability, by Zip Code. Food assistance providers are currently most active in Zip Codes along Chicago’s north lakefront, west, and south sides, and in the west and south suburbs; the density of low-income adults with disabilities per square mile is similarly highest in these areas.
Community areas across the county exhibit considerable unmet need for food assistance among adults with disabilities. As depicted in Maps 8 and 9, Zip Codes in Edgewater, Humboldt Park, Austin, Uptown, West Ridge, and Rogers Park neighborhoods had the highest number of meals needed per square mile. If we do not divide by square mileage of the Zip Code, the highest numbers of meals are needed in Zip Codes within Humboldt Park, South Lawndale, North Lawndale, Austin, Belmont Cragin, Chicago Lawn, West Lawn, and Irving Park.
This analysis also shows that, in sum, 18-64 year old adults with disabilities in Cook County need over 1.25 times more meals than adults age 60+ with disabilities. The overall higher number of younger adults with disabilities, the higher likelihood of food insecurity among younger adults with disabilities, and the greater number of food assistance programs used by and available to older adults contribute to this trend.
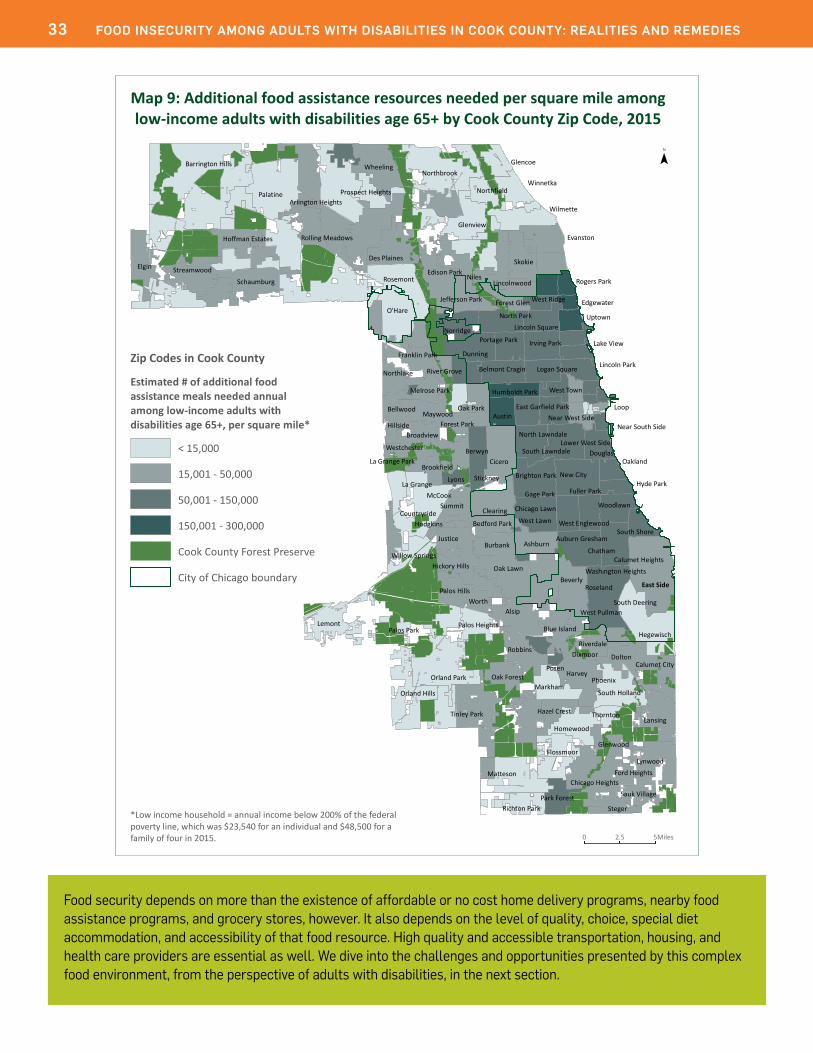
33 FOOD INSECURITY AMONG ADULTS WITH DISABILITIES IN COOK COUNTY: REALITIES AND REMEDIES
Food security depends on more than the existence of affordable or no cost home delivery programs, nearby food assistance programs, and grocery stores, however. It also depends on the level of quality, choice, special diet accommodation, and accessibility of that food resource. High quality and accessible transportation, housing, and health care providers are essential as well. We dive into the challenges and opportunities presented by this complex food environment, from the perspective of adults with disabilities, in the next section.
Sauk Village
Rosemont
Phoenix
Fuller Park
Oakland
Palos Park
Orland Hills
Edison Park
Calumet Heights
East Garfield Park
Near South Side
Washington Heights
Dixmoor
La Grange Park
Ford Heights
Rogers Park
Hyde Park
EdgewaterJefferson Park
Broadview
Lincoln Square
Lower West Side
Robbins
West Englewood
Woodlawn
Posen
Brighton Park
North Lawndale
Riverdale
River Grove
Norridge
Douglas
Lincolnwood
Forest Park
Gage Park
Auburn Gresham
Hickory Hills
North Park
Stickney
Humboldt Park
Countryside
South Shore
La Grange
Belmont Cragin
Bellwood
Prospect Heights
West Pullman
Thornton
Chicago Lawn
Lincoln ParkLogan Square
Maywood
West Lawn
Willow Springs
Forest Glen
Hodgkins
South Lawndale
Palos Heights
Summit
Uptown
Brookfield
Westchester
Irving Park
Hazel Crest
Lake ViewPortage Park
Clearing
Northfield
West Ridge
Northlake
Richton Park
Melrose Park
McCook
Chatham
Rolling Meadows
Glenwood
Loop
Park Forest
Flossmoor
Steger
Near West Side
Worth
Blue Island
Franklin Park
Winnetka
Lyons
West Town
BeverlyPalos Hills
Justice
Hillside
Homewood
Glencoe
Bedford Park
Berwyn
South Holland
Oak Park
Roseland
MarkhamOak Forest
Lynwood
Calumet City
Streamwood
Chicago Heights
South Deering
Evanston
Arlington Heights
Tinley Park
Hoffman Estates
Niles
Orland Park
Dunning
Hegewisch
Burbank
New City
Ashburn
Wilmette
Dolton
Lemont
Oak Lawn
Harvey
Wheeling
Cicero
Lansing
Matteson
Austin
NorthbrookBarrington Hills
Des PlainesElgin
Alsip
Glenview
Schaumburg
Skokie
Palatine
O'Hare
East Side
0 2.5 5Miles
¯
< 15,000
15,001 - 50,000
50,001 - 150,000
150,001 - 300,000
Cook County Forest Preserve
City of Chicago boundary
Map 9: Additional food assistance resources needed per square mile among low-income adults with disabilities age 65+ by Cook County Zip Code, 2015
*Low income household = annual income below 200% of the federalpoverty line, which was $23,540 for an individual and $48,500 for afamily of four in 2015.
Zip Codes in Cook County
Estimated # of additional food assistance meals needed annual among low-income adults with disabilities age 65+, per square mile*

SECTION C: BARRIERS TO FOOD SECURITY AMONG LOW-INCOME ADULTS WITH DISABILITIES AND STRATEGIES USED BY ADULTS WITH DISABILITIES TO COPE WITH FOOD INSECURITY 34
Theoretical frameworks The experience of food insecurity and the conditions that lead up to it are unique to the individual, without or without a disability. Financial, health, and other personal circumstances interact with the opportunities and resources available through one’s community to contribute to a household’s access to enough healthy food and ease of community living. Webber, Sobal, and Dollahite frame this interdependency of forces in a hierarchy of social, material, and contextual elements.59 Positioning “food access [as] individual, variable, and subjective,” they assert that when financial resources are in short supply, transportation, social support networks, and residential location (in terms of physical proximity to necessities) becomes essential to food security. When looking specifically at food security and disability, they found “that even temporarily disabling conditions, accompanied by lack of other household resources and adverse contextual factors, could considerably decrease food access one week or one month but not necessarily the next.”60
Researchers Wolfe, Frongillo, and Valois also explore how physical and cognitive impairments interact with environmental and social influences to affect a household’s food security. Focusing on older adults but relevant to younger adults with disabilities as well, they lay out ten themes that emerged as important elements of the experience of food insecurity along qualitative, quantitative, psychological, and social axes. Specifically, their research participants described key elements of their experience of food insecurity, including “lack of money for food, not enough food due to transportation limitations, not enough food due to health or mobility limitations, not the right foods for health including health-related dietary requirements, financial priorities (food versus other expenses), food compromises (quality and quantity), strategies for accessing food (e.g., borrowing money, using food programs and food trade), lack of motivation to cook or eat, perception of adequate food for health (quality and quantity) and worry or anxiety about their food situation.”61
Wolfe et al. urge policy makers to broaden conceptualizations of food insecurity to take into account access to the right food for health, ability to get food into the home even when money is available, and ability to prepare food in the home. They describe how many of the fluid and concrete barriers to food access are beyond an individual or household’s control or financial means as people try to manage their food security situation, such as the unpredictable weather and road construction or availability of accessible food resources, transportation, housing, and service providers.59 Webber, C.B. et al. p. 2. From Results: “Human/social resources consisted of (1) the physical health and capabilities of the primary food provider – e.g., locomotion, stamina, sensory acuity; (2) social support networks made up of family, friends, and neighbors; and (3) knowledge-based skills learned either formally, such as in school or adult education, or informally from parents or mentors (gardening or shopping skills, for example). Material resources included: (1) money and other financial resources (e.g., store discount cards and food assistance – such as WIC, FSP, NSLP); (2) transportation (car ownership, access to public transportation or dependable rides to the store); and (3) time. Contextual elements were dependent on participants’ location in space and time: (1) climate and season; (2) local physical environment (density, demography, public safety); (3) local food landscape – stores with accessible, appropriate and affordable food; and (4) location in relation to that food landscape.”60 Ibid, p. 11.61 Wolfe, W.S. p. 2764.
SECTION C: BARRIERS TO FOOD SECURITY AMONG LOW-INCOME ADULTS WITH DISABILITIES AND STRATEGIES USED BY ADULTS WITH DISABILITIES TO COPE WITH FOOD INSECURITY.
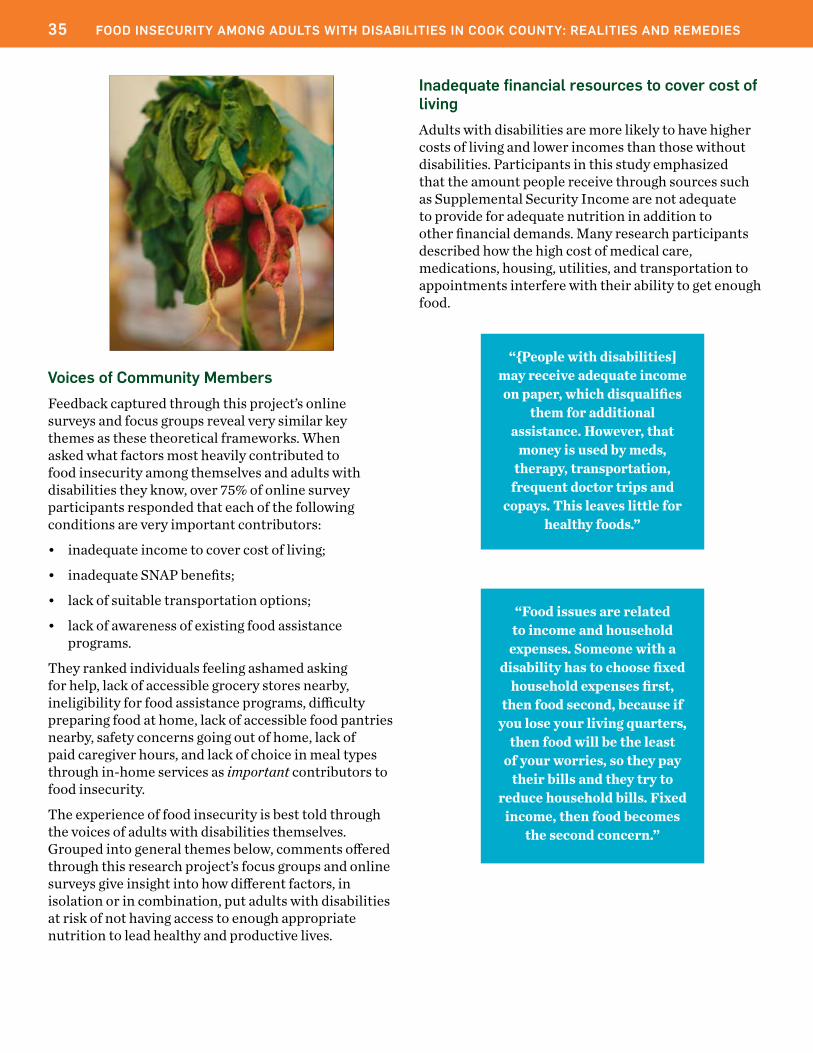
35 FOOD INSECURITY AMONG ADULTS WITH DISABILITIES IN COOK COUNTY: REALITIES AND REMEDIES
Voices of Community MembersFeedback captured through this project’s online surveys and focus groups reveal very similar key themes as these theoretical frameworks. When asked what factors most heavily contributed to food insecurity among themselves and adults with disabilities they know, over 75% of online survey participants responded that each of the following conditions are very important contributors:
• inadequate income to cover cost of living;
• inadequate SNAP benefits;
• lack of suitable transportation options;
• lack of awareness of existing food assistance programs.
They ranked individuals feeling ashamed asking for help, lack of accessible grocery stores nearby, ineligibility for food assistance programs, difficulty preparing food at home, lack of accessible food pantries nearby, safety concerns going out of home, lack of paid caregiver hours, and lack of choice in meal types through in-home services as important contributors to food insecurity.
The experience of food insecurity is best told through the voices of adults with disabilities themselves. Grouped into general themes below, comments offered through this research project’s focus groups and online surveys give insight into how different factors, in isolation or in combination, put adults with disabilities at risk of not having access to enough appropriate nutrition to lead healthy and productive lives.
Inadequate financial resources to cover cost of livingAdults with disabilities are more likely to have higher costs of living and lower incomes than those without disabilities. Participants in this study emphasized that the amount people receive through sources such as Supplemental Security Income are not adequate to provide for adequate nutrition in addition to other financial demands. Many research participants described how the high cost of medical care, medications, housing, utilities, and transportation to appointments interfere with their ability to get enough food.
“Food issues are related to income and household
expenses. Someone with a disability has to choose fixed
household expenses first, then food second, because if
you lose your living quarters, then food will be the least
of your worries, so they pay their bills and they try to
reduce household bills. Fixed income, then food becomes
the second concern.”
“{People with disabilities] may receive adequate income on paper, which disqualifies
them for additional assistance. However, that
money is used by meds, therapy, transportation,
frequent doctor trips and copays. This leaves little for
healthy foods.”
SECTION C: BARRIERS TO FOOD SECURITY AMONG LOW-INCOME ADULTS WITH DISABILITIES AND STRATEGIES USED BY ADULTS WITH DISABILITIES TO COPE WITH FOOD INSECURITY 36
The lack of financial resources tends to be worse toward the end of the month.
Others did not qualify for government financial assistance due to their younger age (being below 65) or severity of disability (their impairment will not last over 12 months or result in death), which in turn affects their eligibility for meal programs that are catered to the needs of adults with disabilities. As discussed previously, Social Security Disability Insurance, Supplemental Security Income, and services under the Department of Rehabilitation Services and Department of Aging have assessment requirements and priorities that may not capture all adults with disabilities.
“If people with disabilities are living on disability or Supplemental Security Income on its own, then they only have about 733 dollars
to spend. If they are living alone, then they have to pay a lot of bills. After their bills, they could
have as little as 50 dollars to spend on food, depending on the time of year. So I think the last
of the month would be the hardest time to get food.”
“A lot of people struggle at the end of the month more so than the beginning of the month. It depends on when they’re paid or when the
benefits come.”
“I fall in this doughnut; I’m 45 years old and have a
disability. I’m not old enough to get certain services, so it’s
like, where does that leave me?”
“If I could do one magical thing, I would make it possible to get meals on wheels for younger
people with disabilities [who are not currently eligible].”
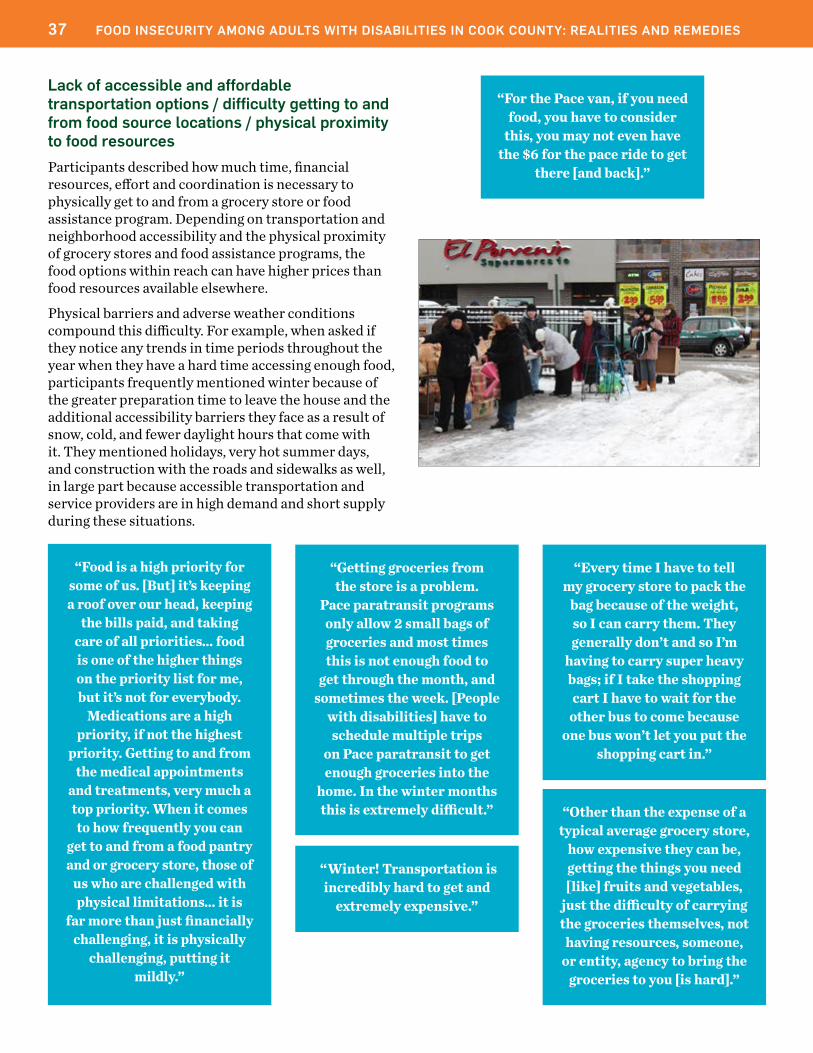
37 FOOD INSECURITY AMONG ADULTS WITH DISABILITIES IN COOK COUNTY: REALITIES AND REMEDIES
Lack of accessible and affordable transportation options / difficulty getting to and from food source locations / physical proximity to food resourcesParticipants described how much time, financial resources, effort and coordination is necessary to physically get to and from a grocery store or food assistance program. Depending on transportation and neighborhood accessibility and the physical proximity of grocery stores and food assistance programs, the food options within reach can have higher prices than food resources available elsewhere.
Physical barriers and adverse weather conditions compound this difficulty. For example, when asked if they notice any trends in time periods throughout the year when they have a hard time accessing enough food, participants frequently mentioned winter because of the greater preparation time to leave the house and the additional accessibility barriers they face as a result of snow, cold, and fewer daylight hours that come with it. They mentioned holidays, very hot summer days, and construction with the roads and sidewalks as well, in large part because accessible transportation and service providers are in high demand and short supply during these situations.
“For the Pace van, if you need food, you have to consider
this, you may not even have the $6 for the pace ride to get
there [and back].”
“Food is a high priority for some of us. [But] it’s keeping a roof over our head, keeping
the bills paid, and taking care of all priorities… food is one of the higher things on the priority list for me, but it’s not for everybody.
Medications are a high priority, if not the highest
priority. Getting to and from the medical appointments
and treatments, very much a top priority. When it comes to how frequently you can
get to and from a food pantry and or grocery store, those of
us who are challenged with physical limitations… it is
far more than just financially challenging, it is physically
challenging, putting it mildly.”
“Other than the expense of a typical average grocery store,
how expensive they can be, getting the things you need [like] fruits and vegetables,
just the difficulty of carrying the groceries themselves, not having resources, someone,
or entity, agency to bring the groceries to you [is hard].”
“Getting groceries from the store is a problem.
Pace paratransit programs only allow 2 small bags of groceries and most times this is not enough food to
get through the month, and sometimes the week. [People
with disabilities] have to schedule multiple trips
on Pace paratransit to get enough groceries into the
home. In the winter months this is extremely difficult.”
“Every time I have to tell my grocery store to pack the
bag because of the weight, so I can carry them. They generally don’t and so I’m
having to carry super heavy bags; if I take the shopping cart I have to wait for the
other bus to come because one bus won’t let you put the
shopping cart in.”
“Winter! Transportation is incredibly hard to get and
extremely expensive.”
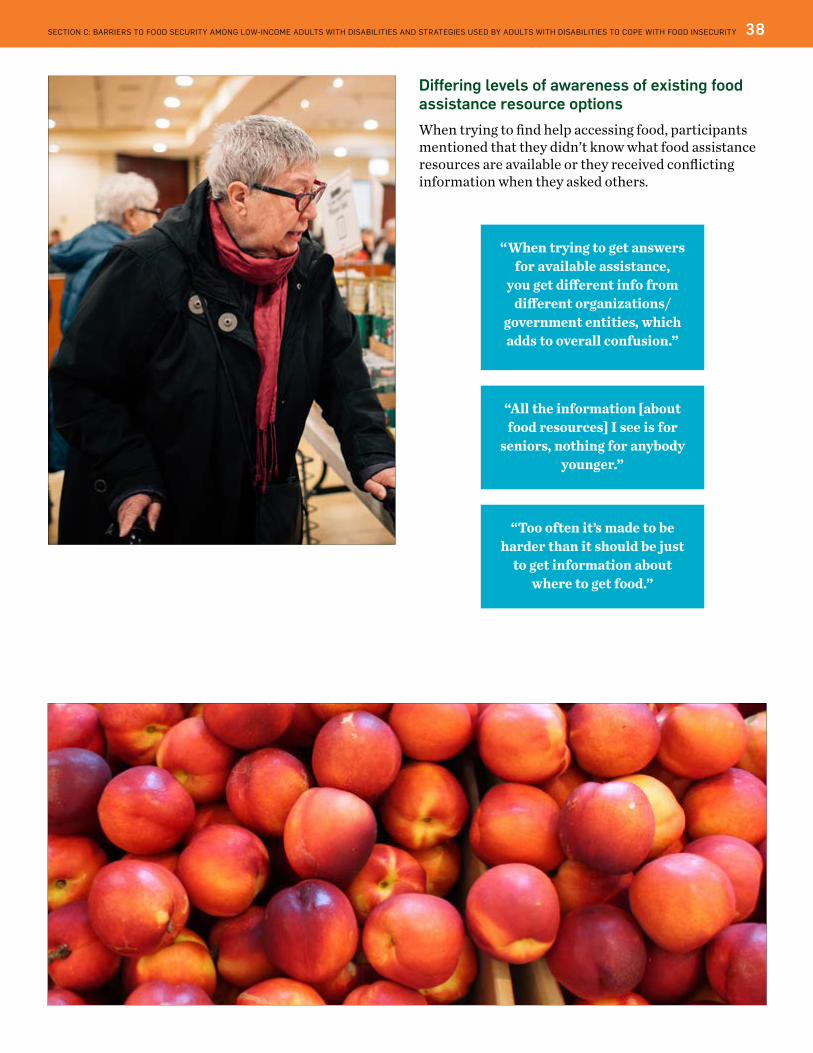
SECTION C: BARRIERS TO FOOD SECURITY AMONG LOW-INCOME ADULTS WITH DISABILITIES AND STRATEGIES USED BY ADULTS WITH DISABILITIES TO COPE WITH FOOD INSECURITY 38
Differing levels of awareness of existing food assistance resource optionsWhen trying to find help accessing food, participants mentioned that they didn’t know what food assistance resources are available or they received conflicting information when they asked others.
“When trying to get answers for available assistance,
you get different info from different organizations/
government entities, which adds to overall confusion.”
“All the information [about food resources] I see is for
seniors, nothing for anybody younger.”
“Too often it’s made to be harder than it should be just
to get information about where to get food.”

39 FOOD INSECURITY AMONG ADULTS WITH DISABILITIES IN COOK COUNTY: REALITIES AND REMEDIES
Inaccessible food resource buildings and processesOnce an individual does get to a grocery store or food assistance location, the building’s level of accessibility and the process of obtaining food can present substantial barriers for patrons, including adults with physical or cognitive disabilities.
“In a lot of stores everything is too high; you have to wait so long for someone to reach
things for you.”
“The pantry I use has stairs – no lift”
“Standing in line is very difficult for me. The chaotic intake structure at my food
pantry makes it almost impossible for me to go, so I
go without.”
“The food pantry I go to, you can get into the building but you can’t actually get to the
food. I have to get a volunteer to go get the food for me. You don’t get choices and
with me, with food allergies, if someone doesn’t take the
time to read the ingredients, I actually get nothing.”
“[Wheelchair accessibility], that’s our major problem
right there. Before we can talk about anything else, we
need to talk about wheelchair accessibility.”
“In regards to food pantries, what I’ve noticed with other patients in the past, is that a lot of them, they get so discouraged going out to the food pantry because of the lines being so long.
Ya know, a lot of it contributes to the weather… The consumer, whether they have a ride to get
there... I’ve known cases where people have waited in long lines for hours and they’ve got to the top, finally, and they only got whatever was
left, not a great selection… but I’m sure they were grateful for what they did receive, but you know, a lot of that plays a role in the judgments
when it comes to going to the food pantries and things like that… A lot of it’s got to do with contributing factors such as the weather, and
availability, and how long the person is gonna be at the site to get the food, and if there’s gonna be
anything left to give them.”

SECTION C: BARRIERS TO FOOD SECURITY AMONG LOW-INCOME ADULTS WITH DISABILITIES AND STRATEGIES USED BY ADULTS WITH DISABILITIES TO COPE WITH FOOD INSECURITY 40
Lack of availability and affordability of appropriate foods for special diets at food resource locationsAs alluded to in the quotes above, many adults with disabilities have special diets and allergies; they must be very diligent about following their nutritional requirements in order to manage their disability, health conditions, prescription regimes, and oftentimes, compromised immune systems. Not being able to access the appropriate food for their specific dietary situation came up repeatedly in all forums; study participants felt very strongly about the need for food pantries and other food assistance programs to better accommodate special diets. They recognized that it would require greater costs and effort on the programs’ part, but there is no alternative for the participants if they are to get the food they need.
“I have a pantry near me that’s really convenient, it’s right around the corner, but it’s
on the second floor… and I’ll make my way up there, but then I’m really limited on what I can
eat because I’m on a special diet... so I spend an hour and half getting here and now I have
nothing but an apple I can take home.”
“I know people who have problems being able to chew and require specific special diets that
are more liquid based and they have a hard time finding foods, nutritious foods.”
“If something could be implemented where there are different divisions, however
or wherever they prepare the food, say food for people with
specific types of allergies – peanut, and or dairy, wheat gluten allergies. Ya know, in
separate parts of the kitchen or even in an altogether
different location that could more cater to people and their needs… What’s the
point of giving people food that they cannot eat?”
“Food allergies seem to be a big mystery… People with a real income can better accommodate
their need to avoid things they are allergic to. Meals that are served for the poor aren’t very…
well… how do you ask specifically for a meal that won’t kill you and not be looked at, treated, like you’re stupid. How can you be picky with ‘free
meals’?”
“Diet plays a big role, in everything, because everybody can’t eat everything. I have a nephew
who is autistic and there’s some things he just won’t eat.”
“My concern is not only enough food but healthy food.”

41 FOOD INSECURITY AMONG ADULTS WITH DISABILITIES IN COOK COUNTY: REALITIES AND REMEDIES
When asked about prepared-meal delivery services, several participants expressed frustration at their inability to eat these meals because the provider did not cater the meals to their nutritional requirements.
“You say you’re lactose intolerant, and every day, they’re gonna give you 1%
milk. All’s I can do with it is give it away.”
“There’s so much miscommunication about
what I can eat. How do we let them know about the food
restrictions we have? A lot of foods that they deliver I can’t
eat.”
“There’s no labels on foods, there’s no directions on
foods, they don’t tell you how to heat it up, there’s
no ingredients on the food, the majority of the food is
the last option that I would choose. Even though the
meals are healthy, there’s no variety, no balance of taste.”
“Before we are disabled, we are human beings first. And we have choices to make as
disabled consumers.”
“The only problem, the prepared food they give
me doesn’t fit my diet. And sometimes I don’t know what it is because what they write
on there I can’t read it.”
Some shared that they weren’t allowed to visit food assistance programs as frequently as they needed. Others found the food available through nutrition assistance programs to be generally unhealthy or too small of a quantity compared to what they needed. Several mentioned the presence of expired items; it is unclear if the items were still okay by food safety standards or if bad food indeed got through inspections somewhere along the distribution channel.
“A lot of the food is expired and is not good.”
“People go to the pantries, and they stand there, and then they get discouraged because they may
get something with an expired date on it, so it kinda turns them away… they’re scared to eat it because it’s expired. Sadly, I’ve known some people who have gotten expired food so they
threw it away; they didn’t want to eat it and they didn’t want to pass it on to someone else.”
“The quality of the food, meat depositories is bad. The fresh foods/fruits are mostly spoiled or
no good.”
“Some pantries have spoiled or stale foods that has been improperly stored. Some locations have
a strong smell of spoiled foods.”
“The amount of food and quality of food some clients get from individual food pantries are not
enough.”
“[I] avoid the canned food… some of the canned vegetables really aren’t healthy.”
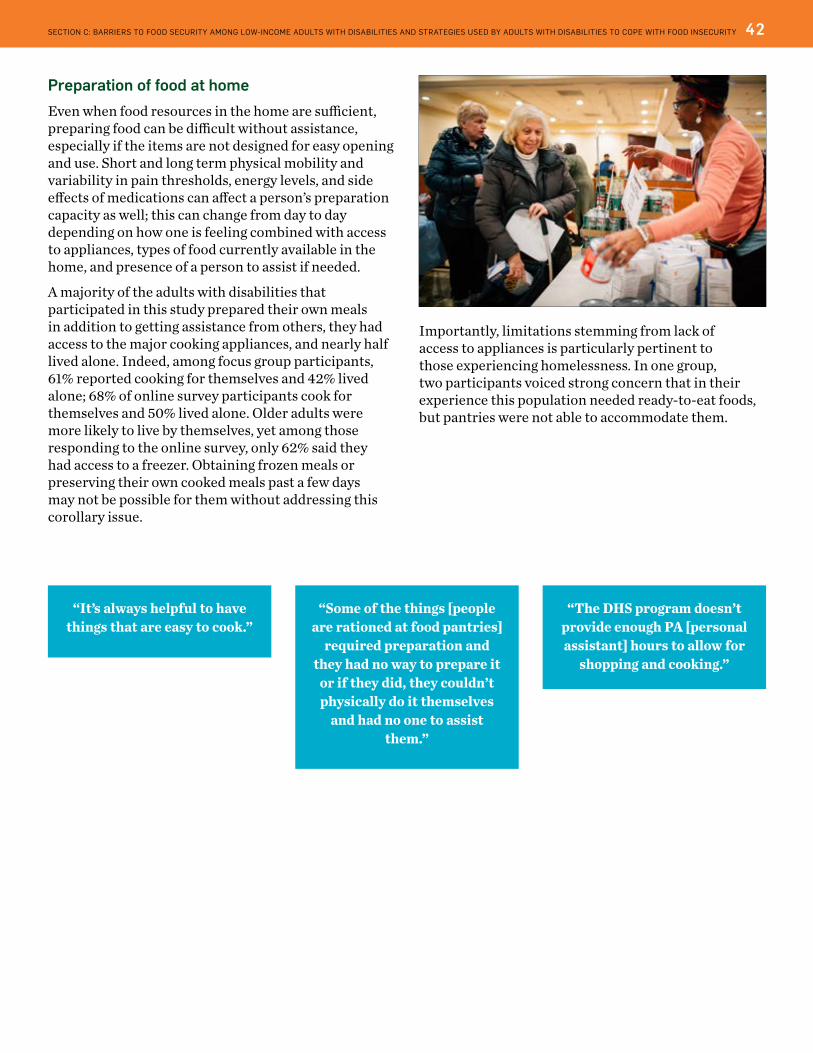
SECTION C: BARRIERS TO FOOD SECURITY AMONG LOW-INCOME ADULTS WITH DISABILITIES AND STRATEGIES USED BY ADULTS WITH DISABILITIES TO COPE WITH FOOD INSECURITY 42
Preparation of food at home Even when food resources in the home are sufficient, preparing food can be difficult without assistance, especially if the items are not designed for easy opening and use. Short and long term physical mobility and variability in pain thresholds, energy levels, and side effects of medications can affect a person’s preparation capacity as well; this can change from day to day depending on how one is feeling combined with access to appliances, types of food currently available in the home, and presence of a person to assist if needed.
A majority of the adults with disabilities that participated in this study prepared their own meals in addition to getting assistance from others, they had access to the major cooking appliances, and nearly half lived alone. Indeed, among focus group participants, 61% reported cooking for themselves and 42% lived alone; 68% of online survey participants cook for themselves and 50% lived alone. Older adults were more likely to live by themselves, yet among those responding to the online survey, only 62% said they had access to a freezer. Obtaining frozen meals or preserving their own cooked meals past a few days may not be possible for them without addressing this corollary issue.
“It’s always helpful to have things that are easy to cook.”
“The DHS program doesn’t provide enough PA [personal assistant] hours to allow for
shopping and cooking.”
“Some of the things [people are rationed at food pantries]
required preparation and they had no way to prepare it
or if they did, they couldn’t physically do it themselves
and had no one to assist them.”
Importantly, limitations stemming from lack of access to appliances is particularly pertinent to those experiencing homelessness. In one group, two participants voiced strong concern that in their experience this population needed ready-to-eat foods, but pantries were not able to accommodate them.
43 FOOD INSECURITY AMONG ADULTS WITH DISABILITIES IN COOK COUNTY: REALITIES AND REMEDIES
Trusted, communicative, and knowledgeable support networks and service providersParticipants described how navigating complex strategies to obtain enough of the right kinds of food and preparing meals can be largely eased by having trusted support networks such as family, friends, or neighbors available to help at key points along the way. They reciprocated in kind when they had resources to share.
“My mom usually brings the meal. She had some rice,
pork chops and gravy, but she’s not going to bring that
to me because she knows I’m not going to eat pork. When I get it from her, it
great. It’s exactly the way I like it, seasoned exactly the way I like it. I don’t have a complaint about that; the only complaint is that it
doesn’t come more often.”
“What can we do, as a disabled community and
organizations that support us, to get our family and
friends to understand that before we are ever disabled,
that we are human beings first. And that we have
choices to make as disabled consumers. I think there
needs to be a lot more involvement with that with our family and friends. And
the thing is, a lot of the times, when we communicate “no I don’t really like that, no I don’t want that, I can have that but I need it cut up or
I need it fixed a certain way or whatever,” a lot of people take things very personally
instead of understanding we’re not meaning it directed
toward them personally…. That you’re just simply stating your disability
needs, and your feelings as a disabled consumer.”
“Over the course of the past 16 to 20 years, there have
been many occasions where I’ve been challenged with not being able to fill my cabinets,
refrigerator, freezer, with food that I need… it’s really not necessary for that to be
the case because there are so many food pantries out there, but it’s not always accessible for those, for myself, to get
to those pantries. That’s one of the major setbacks.
And having the family size that I do, on occasion I have neighbors, family
members that do assist with transportation needs.”
Open and effective communication with loved ones and providers intersects closely with getting nutritional needs met.

SECTION C: BARRIERS TO FOOD SECURITY AMONG LOW-INCOME ADULTS WITH DISABILITIES AND STRATEGIES USED BY ADULTS WITH DISABILITIES TO COPE WITH FOOD INSECURITY 44
“My food pantry has a lottery, and I swear I get the
last number every time so that they’ll have a volunteer available to do my shopping
for me.”
“I don’t want my paid caregiver bringing me
groceries because I have to give them my money and they
can steal my money. I want control over what I buy even
if it takes me longer in the grocery store.”
“I don’t trust everyone and not everybody listens to
directions.”
“People with disabilities are not allowed to be angry. Because if we’re angry or raise our
voice and kind of explain a point…people automatically think I’m mad, I’m not mad. I’m
trying to explain a point to you.”
Quality communication between adults with disabilities and service providers is also an important touch point with implications for food security. Untrained or very busy staff and volunteers that may not know how to assist adults with disabilities, or may not recognize them as someone with a disability, can increase confusion at food resource locations and result in a poor experience for the client or consumer. Participants expressed how grocery store employees and pantry volunteers often seemed unaware of the difficulties faced by adults with disabilities; for example, one participant relayed an experience where volunteers didn’t know where elevators were or how to create enough space for a wheelchair; it just wasn’t something they had yet considered.
Based on their previous experiences, reliance on the assistance of unaware, or worse, dishonest or abusive individuals, led some participants to fear exploitation and to avoid any relinquishment of independence.
Some participants described nutrition and food safety practices of in-home assistants that made them uncomfortable, and they wished there was some way of standardizing expectations around nutrition education training. One research participant expressed that they don’t voice sanitation concerns in regards to food preparation because they were “so fearful that a paid caregiver won’t come back, that they’ll leave and I’ll be stuck.”
Another recalled an experience paying at the register at a grocery store:
“Where you put your card in that machine, it’s up here
[motions up high], and I can’t see it. You put the card
in and ask [the check-out employee] ‘what does it say?’ and they’re like ‘You’ll have to push this and push that.’ I can’t reach it, [so] they’re
like ‘I’ll put your PIN number in for you.’ Hell no you
won’t! [laughter]. I don’t give strangers my PIN number, and then other people will
hear it.”
45 FOOD INSECURITY AMONG ADULTS WITH DISABILITIES IN COOK COUNTY: REALITIES AND REMEDIES
Lack of coordination between food assistance and other necessary community-based servicesParticipants in this project described the challenge of staying on top of all the paperwork, policies, appointments, offices, and timelines that is necessary to effectively manage one’s health and independence as an adult with a disability living in the community. Different providers often operate in silos, meaning that clients, patients, and consumers need to visit a patchwork of stand-alone services that do not communicate with one another. They also have to be consistently and constantly vigilant and responsive to changes in the public policies and services that affect them in order to avoid any lapse in paperwork requirements.
More closely integrating disability services and food assistance as a means of better serving consumers came up several times in this research.
“I don’t know how closely disability services coordinate with food services. But about half of our clients experience
prolonged food insecurity and many of them have
disabling conditions. It’s not just poverty.”
“In working with public entities, I find that the intent to provide service is strong, but the financial means do not match. Housing, care
and food issues top the list, but you certainly can’t accomplish anything unless
the individual is fed well enough to concentrate on the
other issues.”
“Service Cost Maximums… that’s restricting the services
even further. And there’s another thing going on with
managed care, and that’s causing a lot of impact on the service hours and how
it’s being applied. People are getting their hours cut back
even though the Department of Human Services is
supposed to make the plan with the hours. The Medicaid
plans are revising those without going through DHS.
So we’re seeing those impacts now, on services, especially
on food preparation.”
“Managed care is supposed to give you integrated care,
and it should give the health resources to keep people fed and to give transportation to doctors and the pharmacy.”

SECTION C: BARRIERS TO FOOD SECURITY AMONG LOW-INCOME ADULTS WITH DISABILITIES AND STRATEGIES USED BY ADULTS WITH DISABILITIES TO COPE WITH FOOD INSECURITY 46
“Cutting out anything that is an unnecessary expense… like not going to the movies,
not going out spending money.”
“I know people who struggle just to provide
for themselves for various reasons. A lot of people, especially older people,
are ashamed of their new problems, or feel that there is nothing they can do to make
their lives easier.”
“We don’t always make healthful choices... even when we know it, but it’s helpful to be educated.
Budgeting and nutritional education are two pieces
that help stretch [my] food budget.”
“In the summer months, no air conditioner and
reduce electricity… reduce transportation when you
don’t have to go”
Stigma Seventy four percent of online survey participants with a disability reported that feeling ashamed to ask for help is a very important factor contributing to the experience of food insecurity among adults with disabilities. Moreover, discomfort asking for assistance to secure enough of the right kinds of foods, whether from family or friends, the emergency food system, or government programs can contribute to anxiety and isolation, which in turn exacerbates challenging health conditions. As affirmed by Wolfe et al. in their similarly themed interviews with older adults, “knowing and perceiving their lack of food choice and the need to make compromises leads to feelings of deprivation, anger, and embarrassment… socially unacceptable ways to access food included using a food pantry and buying food on credit (both less severe), and asking others for food or meals and borrowing money for food (both more severe). These experiences often led to feelings of embarrassment, hurt pride and loss of independence.”62
62Wolfe, W.S., p. 2765.
Strategies used by adults with disabilities to cope with food insecurity
Participants described using several strategies to cope with food insecurity, many of which cost substantially more time, effort, or stress than would be necessary if financial resources were adequate.
Strict Budgeting
Participants worked hard to maximize their limited funds, not spending on anything they deemed non-essential. They only used discount grocery stores such as Aldi, found sales, and bought generic foods over name-brand items whenever possible. Participants also tried to educate themselves on ways to cut costs and to decrease transportation costs by minimizing the trips needed, such as finding pharmacies that deliver if possible.

47 FOOD INSECURITY AMONG ADULTS WITH DISABILITIES IN COOK COUNTY: REALITIES AND REMEDIES
Purchasing trade-off decisions
While budgeting can be done without compromising one’s health, other coping mechanisms are more damaging. Several study participants discussed how they make decisions between buying food and other necessities, and some cut costs by stretching their medications. Among adults with disabilities responding to the online survey, 36% reported that they have had to decide between paying for food and paying for medicine/medical care. Respondents also emphasized that transportation costs and high rents were large barriers to being able to afford basic necessities.
“I have chronic fatigue syndrome where your
immune system is very low. I usually buy an immune
booster. My Link Card has been cut first $65, then $30
something, now $11, so when I ran out of my immune pills, I knew if I bought
those certainly I would be more likely to run out of food sooner. So I did not. As a result, I now have [a]
serious sinus infection [and] bronchitis.”
“I think some of the people in my building, and there is only one floor for disabled, it’s
mainly a senior building… I think some of them have trouble with the choice between food
and medicine. Maybe a few times I’ve had that problem, but I would always choose food and then maybe split the pills in half… the senior Part D programs are very expensive for the
medicine, and even with the premiums, it’s still sometimes hard to get the meds. It’s really not a
food problem, so maybe I shouldn’t have brought it up; it’s really a medicine concern.”
Altering amount or quality of food purchased and consumed
When the online survey asked participants how they or other adults get by when having a hard time accessing food, lowering the quantity and quality of food consumed in order to lower costs arose as a key coping strategy. 43% said they buy less healthy food than otherwise, 39% said they cut back on the number of meals they eat, 38% said they buy less expensive food than otherwise, 32% said they cut back on the size of their meals, and 17% said they buy food that they don’t like as much.
Moreover, when food preparation presented a problem due to low energy levels or lack of ingredients they could prepare in the house, individuals reported relying on eating processed snack foods, raw foods, and restaurant delivery to get by.
“As for having a ‘hard time accessing food’ - for me I
think this means when I can’t get up due to my symptoms... I simply don’t eat. We already hardly go anywhere requiring
paying for transportation. I recently found out my
daughter actually reduced how much she eats in
response to not being able to work/generate her own
income. Due to our situation we live with my SSDI.”
SECTION C: BARRIERS TO FOOD SECURITY AMONG LOW-INCOME ADULTS WITH DISABILITIES AND STRATEGIES USED BY ADULTS WITH DISABILITIES TO COPE WITH FOOD INSECURITY 48
Reaching out to support systems and food assistance programs
As described in detail in the previous section, adults with disabilities may reach out to family or friends for help, share food, or visit a neighborhood food assistance program. 32% of focus group participants received food from family or friends, and 50% used food pantries. 42% of online survey participants reported that they or adults they know with disabilities contact family or friends for help when in need, and 45% used food pantries. Unfortunately, if family or friends do not live close by or the relationships are not at their best, this management strategy is less viable.
“I try to share those resources with the people around me, once I receive them myself. Of course I want to pay it forward.”
“It’s important to avoid waste and spoilage… I live
with a whole bunch of neighbors, and to avoid that,
we share food.”
A handful of focus group discussion threads emerged around feelings of isolation, the importance of community, and how much people valued having the chance to share stories and come together in their struggles to access food. Participants proposed many ideas to address and cope with food insecurity, including starting regular food access workgroups and community meal events and institutionalizing the value of inclusive feedback forums for service providers.

49 FOOD INSECURITY AMONG ADULTS WITH DISABILITIES IN COOK COUNTY: REALITIES AND REMEDIES
Remedies to food insecurity among adults with disabilities should 1.) be tackled community area by community area; and 2.) include partnerships with organizations that work with people with disabilities. While food insecure households live in every corner of the county, particular communities show much higher rates of risk of food insecurity than others. Proximity to accessible food assistance programs and eligibility for that support varies across neighborhoods as well. For example, working age adults with disabilities in the suburbs have fewer options for nutritional support since no equivalent of the City of Chicago MOPD’s program reaches them. If they do not have a long-term disability severe enough to qualify for federal disability benefits and Medicaid’s Home Services Program, emergency food providers such as the Food Depository member agencies likely provide their only option. In general, suburban service providers, accessible housing, job opportunities, grocery stores, sidewalks, and accessible transportation options are fewer and farther apart as well, compounding this challenge of food access. The option of asking family, friends, or neighbors for help in large part depends on having such relations in near proximity and on those individuals being healthy and with reliable transportation themselves.
Decreasing food insecurity and filling gaps in need for food assistance among low-income adults with disabilities thus requires us to consider how this wider community and programming context affects the most appropriate response. This process helps identify which community partners and assets to leverage in removing the barriers to food access through proactive and informed decision-making. For example, partnering with a suburban disability provider and Food Depository member agency in high unmet-need Zip Codes to discuss outreach strategies and a mobile food distribution opportunity near a bus line would be much more effective at reach people in need than reacting to requests for programming in an area with five other pantries. Taking a comprehensive and geographically-informed perspective will help the Food Depository and partners ensure that Cook County invests in the promise and hope of the Supreme Court’s Olmstead for people with disabilities to thrive in community settings.
Comprehensive approaches require strong partnerships and a common goal. Since proper nutrition provides the foundation for life among all people, in most cases the vision and importance of eliminating hunger immediately resonates with organizations and individuals across sectors, organizations, and geographies. Participants at every touch point of this project indicated the desire and intention to act and come to the table to make progress on solutions. All organizational and individual participants expressed eagerness to contribute their well-thought out ideas and to volunteer their time to ending hunger.
SECTION D: DISCUSSION OF INSIGHTS
SECTION D: DISCUSSION OF INSIGHTS 50
Proper nutrition plays a preventative and healing role in health and wellbeing. We must approach food insecurity as a threat to public health. In addition to preventing health complications in the first place, access to the nutritious foods necessary for one’s health conditions provides the foundation for treatment and recovery from illness. Conversely, a growing body of research demonstrates the adverse health outcomes associated with food insecurity. As described in Making the Connection – Food Security and Public Health, “food security is a prerequisite for healthy eating and foundational to human and environmental health. It is a basis for the prevention of chronic disease and the promotion of healthy growth and development… If people do not have access to a sustainable supply of appropriate foods, their health will be compromised, regardless of available health care.”63
Harmful and costly health and quality-of-life outcomes resulting from food insecurity affect all age ranges. Mariana Chilton and Donald Rose illustrate in their Journal of Public Health article titled A Rights-Based Approach to Food Insecurity in the United States that “food insecurity is a serious public health problem associated with poor cognitive and emotional development in children and with depression and poor health in adults.”64 Craig Gundersen, a leading expert and researcher of food insecurity, asserts that “households suffering from food insecurity are more likely to have adults who have lower nutrient intakes, greater probabilities of mental health problems, long-term physical health problems, higher levels of depression, diabetes, higher levels of chronic disease, and lower scores on physical and mental health exams. Food insecure seniors have lower nutrient intakes, are more likely to be in poor or fair health, and are more likely to have limitations in activities of daily living (ADL).”65 Meals on Wheels of America’s February 2017 study Hunger in Older Adults describes how “the consensus is that poor nutritional intake, multiple chronic conditions, and limited access to healthy food affect older adults’ ability to remain at home.”66
Outside of the unacceptable suffering resulting from food insecurity, the costs of this problem are also financially prohibitive and wasteful. A recent study authored by Tarasuk, et al. found that health care expenditures increase as food insecurity grows in severity among Ontario residents: in comparison to food secure households, total health care costs for adults in marginally food insecure households were 23% higher, 49% higher for those in moderately food insecure households, and 121% higher for severely food insecure households.67 In Hunger in America: Suffering We All Pay For, Shepard and coauthors found that “hunger costs [the United States] at least $167.5 billion due to the combination of lost economic productivity per year, more expensive public education because of the rising costs of poor education outcomes, avoidable health care costs, and the cost of charity to keep families fed.”68
63 The Community Nutritionists (2004) Council of British Columbia. “Making the Connection – Food Security and Public Health.” Library and Archives Canada Cataloguing in Publication, June 2004.64 Chilton, M. & Rose, D. 65 Gundersen, C (2012).66 Meals on Wheels of America, p. 5. 67 Tarasuk, V, et al.68 Shepard, D.E.

51 FOOD INSECURITY AMONG ADULTS WITH DISABILITIES IN COOK COUNTY: REALITIES AND REMEDIES
Much of this expense comes in the form of potentially avoidable health complications, emergency room visits, readmissions, and cost-related medication underuse. Meals on Wheels of America estimates “the disease-related cost of malnutrition at approximately $51 billion. About 60% of older adults in emergency rooms are either malnourished or at risk of malnutrition… malnutrition lengthens hospital stays, causes complications while in the hospital, increases readmissions and increases costs.”69 The National Commission on Hunger’s report Freedom From Hunger asserts that “readmissions among [Medicaid patients 65 and older] costs the health care system approximately $25 billion annually, and 70% of this cost is for return trips that might not have been necessary if patients had received proper care, including proper nutrition.”70 Berkowitz et al. found that adults who reported food insecurity were significantly more likely to report not filling or taking their prescription medications due to cost. Finally, Seligman et al.’s findings that inpatient admissions for hypoglycemia increasing 27% in the last week of the month for low-income populations “suggest that exhaustion of food budgets might be an important driver of health inequities. Policy solutions to improve stable access to nutrition in low-income populations and raise awareness of the health risks of food insecurity might be warranted.”71
With adults with disabilities already facing higher average costs of living, the costs of food insecurity compound the difficulty of making ends meet. Medicaid, Medicare, other health insurance and health care companies also see much of the immediate monetary costs that may have been preventable. Despite this clear association, very little federal healthcare spending focuses on prevention and public health. In fact, according to the American Public Health Association, only 3% of the United States’ health care spending is spent on prevention and public health even though 75% of our health care costs are related to preventable conditions.72
The intersection of food insecurity and health figures prominently in the Food Depository’s research and experience as well, including this report. As described in the previous qualitative portion, participants in this study shared how deeply food insecurity affected their sense of health and well-being. Epitomizing the destructive cycle of food insecurity and poor health, when resources ran thin, participants reported making choices between different necessities such as medications and quality food and not eating as well as they would prefer, causing anxiety and further health complications.73 Moreover, Feeding America’s Hunger in America 2014 analysis of the Food Depository’s overall client population found that 44% of Cook County respondents reported fair or poor health, 58% had unpaid medical bills, 62% faced choices between paying for food and paying for medicine or medical care in the last year, and 73% coped with food insecurity by purchasing inexpensive, unhealthy food.74 In comparison, a much smaller 17% of the Cook County population overall reported poor or fair health in 2015.75
An emerging body of research concentrates on investigating exactly how and to what degree providing quality food to people vulnerable to food insecurity can result in better health outcomes and reduced health care costs.76,77 Participants who shared their experiences with us for this report emphasized that in the case of adults with disabilities, such interventions must include the option to choose from a menu of medically-tailored meals and groceries. Participants described the regularly intense distress caused by the challenge of obtaining the right amount and types of food for their health. They highlighted that the existing food assistance infrastructure taken as a whole, meaning both public and private sources, home delivery programs and emergency food assistance pantries and soup kitchens, do not cover this need at present. As an ever more diverse population, they recommend providing ethnically varied choices as well. No one-size-fits-all food access solution will meet the needs of all low-income adults with disabilities and others facing food insecurity. 69 Meals on Wheels of America, p. 23.70 National Commission on Hunger (2015). p 20.71 Berkowitz (2014) & Seligman (2014; abstract).72 American Public Health Association.73 See Seligman, HK and https://cvp.ucsf.edu/resources/Seligman_Issues_Brief_1.24.16.pdf for a powerful framing of the cycle of food insecurity and chronic disease. 74 Mills, G. et al.75 Cook County Department of Public Health.76 Cohn, D.J., and Waters, D.B.77 See Philadelphia’s Good Food, Healthy Hospitals Initiative.

SECTION D: DISCUSSION OF INSIGHTS 52
Low-income adults with long-term, severe disabilities as well as those with more temporary, episodic, undiagnosed, untreated or less severe disabilities experience high risk of food insecurity. Inclusive policy responses that allow for flexibility in eligibility criteria reach more food insecure populations of all disability levels. Not all individuals with impairments that significantly affect their activities of daily living participate in federal disability programs or have been designated as having a disability by federal or state agencies. In fact, the Social Security Administration asserts that only a small subset of Americans living with disability get a Social Security disability benefit, for its purpose is to only reach those that cannot work due to a severe medical condition that has lasted, or is expected to last, at least one year or result in death.78 Medicaid waiver services through the Home and Community Based Service Program are available only to those with a medical determination of a diagnosed, severe disability which is expected to last for 12 months or for the duration of life and are at risk of nursing facility placement as measured by their Determination of Need (DON) assessment. Moreover, qualification for these services does not necessarily mean services will be provided or that those payment amounts meet costs of living; there is currently at least 20,000 people on Illinois’ waitlist for services under the Medicaid Home and Community-Based Services waiver, and as stated previously, the average disability benefit payments are not adequate given the other financial demands people face.79
Low-income adults with disabilities that do not qualify for disability programs under these terms or that have income or assets that exceed the limitations for receipt of benefits also face risk of food insecurity and should have access to services when needed. Less than half the adults with disabilities contributing to this study received federal disability benefits or services under the Home and Community Based Services (HCBS) Medicaid waiver. Further evidence of this gap includes the difference between the number of adults reporting a disability in the American Community Survey and those that receive Social Security disability benefits. For example, in 2015, 155,373 Cook County residents received SSI benefits compared to the 253,858 residents with disabilities living below 200% of the federal poverty line, the threshold for low-incomes featured in this report.80
Public policies allowing for flexibility in eligibility provisions can help address this disconnect between formal disability determination and the need for assistance due to a physical or mental impairment. As of February 2017, for example, low-income adults with disabilities without a disability determination can generally still receive SNAP and Medicaid in Illinois based on their low income alone, as long as they are below 165% and 138% of the federal poverty line, respectively. They do, however, face lower income ceilings, work and time requirements, and do not have access to more specific services or additional accommodations in the absence of the disability determination (e.g. the home-based services in the case of Medicaid and the medical deduction in the case of SNAP). Importantly, the State has discretionary authority to exempt an individual who has a temporary or chronic disability from the SNAP work requirements on a case-by-case basis. This report’s findings illustrate the importance of retaining and maximizing this ability in order to ensure this population does not fall through the cracks.

53 FOOD INSECURITY AMONG ADULTS WITH DISABILITIES IN COOK COUNTY: REALITIES AND REMEDIES
The State can also exempt adults aged 18 to 49 who do not have dependents or a disability determination from SNAP program work and time limits if unemployment rates and other indicators of a poor economy are present. This exemption capacity directly affects the “many childless adults [that have] disabilities that make working difficult or impossible but don’t meet the severe disability standard for receiving SSI or SSDI.”81 In the absence of this exemption or waiver, this group of SNAP beneficiaries can only get benefits for 3 months in every 3 years unless they work or participate in a training program for at least 80 hours a month. The Illinois Hunger Coalition asserts that 260,000 Illinoisans would have been newly subject to the time limit after December 2016 if Governor Bruce Rauner had allowed this exemption capacity to expire.82
Unfortunately, Illinois is unlikely to be eligible for this waiver statewide in 2018, though certain areas of the state will likely continue to qualify.
Disability determination similarly affects access to healthcare services through Medicaid, wherein more inclusive and flexible policy responses reach more adults with disabilities at risk of food insecurity with services. As we explored in the previous section, food insecurity is a public health threat and access to healthcare is another key ingredient to a stable, healthy, food secure life. Most prominently, the State of Illinois opted to expand Medicaid under the Affordable Care Act, resulting in an estimated 650,000 Illinoisans becoming newly eligible for health insurance coverage. These residents can now sign up for Medicaid because of the expansion’s creation of an eligibility category based solely on having a low-income rather than other requirements such as having dependents.
We cannot isolate how many adults with disabilities gained the option for coverage under this provision, but the information we do have available suggests that the expansion benefited many previously uninsured low-income adults with disabilities. For example, the U.S. Census American Community Survey tells us that the uninsured rate among adults with disabilities age 18-64 decreased from 19.8% to 8.9% between 2012 (prior to the expansion) and 2015.83 Repealing the Affordable Care Act has been stated as a priority of the current U.S. Presidential Administration, yet without a comparable replacement, this will likely affect the food security and health of populations that had become newly eligible based on their low incomes. As described by the State Journal-Register, “if [the Affordable Care Act] is repealed, hospitals and clinics will pick up the tab for uninsured. Others will not get valuable mental health or drug treatments, ending up in jails or homeless shelters. Still others will have untreated medical conditions and will get sicker.”84
Anti-hunger leaders and community members must work with government agencies and managed care organizations to protect and emphasize the importance of program exemptions and expansions that reach more low-income adults the disabilities who cannot participate in federal disability programs. We all share the same long-term vision of optimizing health outcomes and minimizing preventable costs.78 Social Security Administration Disability Fact Sheet: https://www.ssa.gov/disabilityfacts/facts.html 79 Forrest, S. (2016).80 https://www.ssa.gov/policy/docs/statcomps/ssi_sc/2015/il.html & U.S Census 2015 American Community Survey Table C18131 1-year estimates. 81 Carlson. S (2016).82 Illinois Hunger Coalition, 2017. 83 2015 U.S. American Community Survey 1-year estimates, Table C18131 and Table B18135. First calculation uses 200% FPL as low income.84 The State Journal-Register, Feb 3, 2017.

SECTION E: RECOMMENDATIONS TO INCREASE FOOD SECURITY AMONG LOW-INCOME ADULTS WITH DISABILITIES IN COOK COUNTY 54
This research project demonstrates that a significant proportion of low-income adults with disabilities in Cook County do not get enough quantity or quality of nutrition. The range of communities showing a need for an increased response to food insecurity and the wide diversity of adults with disabilities makes clear that no one-size-fits-all solution will work to end hunger in all households. Instead, we need to strengthen the portfolio of programmatic and policy approaches to hunger alleviation.
The Food Depository, food assistance programs, community members, service providers, legislators, disability and anti-hunger advocates, government agencies, the business community, and philanthropists must work together to increase food security in Cook County. The following recommendations offer specific actions to increase access to food assistance programs, to deepen existing partnerships and start new ones, and to embolden public policy responses to hunger, all of which we believe will move the needle on food insecurity in the short and long term. Initial investments of time and funds will be required to varying degrees, yet all suggestions are complementary to existing programming and policy goals of anti-hunger practitioners.
This section does not focus on improving employment opportunities among adults with disabilities, which would address a key root cause of food insecurity. We strongly encourage collaborations with others specializing in that work.
SECTION E: RECOMMENDATIONS TO INCREASE FOOD SECURITY AMONG LOW-INCOME ADULTS WITH DISABILITIES IN COOK COUNTY
Increasing access to local food assistance programsExpand access to medically-tailored home delivered meal and grocery programs at no or very low cost to the consumer. The unmet need for home delivered groceries, meals, and meal components came up often in this research. Participants greatly value their ability to choose their food and such programs must accommodate special diets to make this a valuable service. Offering weekend meals, providing meal components that require only simple preparation and grocery items together with prepared meals, and starting an emergency food delivery hotline for immediate needs would strengthen this food assistance response.
Tactical and partnership recommendations:
• Partner with Meals on Wheels and similar existing home delivery programs to plan the best way forward to meet this demand without duplication of efforts.
• Create a best practices document on home delivery for Food Depository network members and programs. Several Food Depository member agencies expressed interest in providing home delivery to clients, but they need support in the form of transportation and food costs, volunteers, and guidance on program design and implementation (e.g. obtaining meals and meal components, client enrollment, client outreach, delivery, food safety compliance, tracking and evaluation). Member agencies and partners that currently provide home delivery are a source of great knowledge in this regard.

55 FOOD INSECURITY AMONG ADULTS WITH DISABILITIES IN COOK COUNTY: REALITIES AND REMEDIES
Improve accessibility and client experience at food assistance programs. Participants discussed lack of wheelchair accessibility, having to withstand long, uncomfortable wait times in adverse weather conditions, and lack of sensitivity to their disability as barriers to using food assistance programs. Providing guidance and investment in the Food Depository network to address these concerns will strengthen the network for all users.
Tactical and partnership recommendations:
• Create training materials for food assistance providers on maximizing inclusion and accessibility. Topics covered should include recruiting volunteers with disabilities, methods of increasing physical accessibility, training volunteers on assisting people with disabilities, tips to optimize the proxy program, addressing special diets and allergies, obtaining and using a TTY device, and more. Recognize and reward member agencies who exemplify inclusive service for people with disabilities.
• Commission Centers for Independent Living to consult with individual member agencies on maximizing accessibility at their food distributions. Participants felt that shelters, soup kitchens and food pantries should be more physically accessible and the distribution process more streamlined. Most if not all member agencies lack the resources to make very large improvements, but an expert from Access Living or Progress Center for Independent Living could provide insights into meaningful changes food assistance programs could make that span the spectrum of financial investment.
Build more awareness and communication lines among adults with disabilities and other service providers regarding available food assistance programs. Many research participants did not know what food assistance programs are available to them or who to talk to for reliable information on those resources. Getting to a food assistance program requires substantial investment of time, effort, and money for some people, so they felt minimizing uncertainty is a necessity to using these resources.
Tactical and partnership recommendations:
• On the Food Depository’s agency locator tool, indicate if a member agency or program is ADA accessible, if it accommodates specific medical diets and allergies, and if it has a home delivery program.
• Work with the Food Depository network of member agencies and programs to ensure all food distribution locations have the capacity to use a TTY device for deaf, hard of hearing, or speech-impaired clients who wish to call for information.
• Let food assistance program participants know ahead of time what food items or meal types will be available. Perhaps by posting this information online, through a phone recording or at the food assistance program location itself, increasing lines of communication lines with clients sets expectations and will allow clients to decide if the trip is the best use of their limited resources.
• Identify key community touch points reaching low-income adults with disabilities, including but not limited to the organizations helping with this needs assessment. Target these touch points for outreach efforts regarding food insecurity, food assistance providers, SNAP outreach, and nutrition education.

SECTION E: RECOMMENDATIONS TO INCREASE FOOD SECURITY AMONG LOW-INCOME ADULTS WITH DISABILITIES IN COOK COUNTY 56
Increase capacity of food assistance programs to accommodate clients with allergies and special dietary needs. Research participants frequently shared how distressing and difficult they found affording the high quality food items required by their special diets and allergies, and that most often they could not find these items at food assistance programs either.
Tactical and partnership recommendations:
• Continue to increase the quality and quantity of fresh produce, dairy, and protein offered at Food Depository network distributions. Participants voiced concern about the quality of some of the food they received at food assistance programs and described their need for greater stocks of fresh food.
• Expand food items available to member agencies that specifically accommodate special diets and allergies, such as renal, gluten free, and mechanically soft. This may include creating diet-specific categories on the Food Depository’s menu, purchasing new types of foods from new suppliers, developing more detailed signage for distributions, and more. The Food Depository should include guidance on safely handling food distributed as allergy-free in the training documents mentioned previously.
• Make it easy for member agencies and clients to immediately report concerns about food distribution quality to the Food Depository. Encouraging this behavior by providing signs at distribution locations or having an anonymous online submission option, for example, may increase participation.
• Provide nutrition education and food safety training opportunities for clients as well as caregiving assistants. Include a segment on the meaning of “best by” dates to avoid misconceptions and waste of foods that may still be safe to distribute and consume.
Broaden eligibility and frequency of distributions at high functioning programs. Participants discussed how they would be more food secure if they could visit food assistance programs more frequently than the one or two time cap allowed by program regulations.
Tactical and partnership recommendations:
• Extend eligibility of food bank-run older adult programs to include people with disabilities of all ages. This may require reconfiguration of funding streams and development of methods of qualification for participation, but many adults with disabilities also live in the buildings served by these programs and face similar barriers to food security as those who are eligible for services.
• Enable and encourage select high functioning pantries to allow people to visit weekly. While the Food Depository remains an emergency food assistance network, we are also in a position to react to the inadequacy of the government’s response to food insecurity among those most vulnerable to it, particularly in the absence of a state budget.
• Use the quantitative data section of the report to help inform targeted, geographically-informed decisions regarding additional investments and program expansions. Prioritize neighborhoods where the unmet need is highest, taking into account the accessibility of other nearby social safety net and transit resources.

57 FOOD INSECURITY AMONG ADULTS WITH DISABILITIES IN COOK COUNTY: REALITIES AND REMEDIES
Building new programming partnershipsPartner with local disability service providers to provide mobile food distributions, community meal events, or onsite pantries. Centers for Independent Living (CILs) and other disability service providers are important convening points for people with disabilities living independently, many of whom we have learned struggle with food insecurity. In Cook County, this includes Access Living and Progress Center for Independent Living, two of the focus group locations. This community touch point could serve as an important venue to meet people in need where they otherwise gather.
Participants in this project also voiced concern about the isolation felt by adults with disabilities, and food has an immensely strong power to bring people together. Partnering with organizations that hold the trust of their community members in order to offer meals and groceries could provide needed nutrition as well as social support and camaraderie. Such events would also provide key opportunities to share information about additional community resources, food assistance programs, SNAP application assistance, nutrition education, and more.
Partner with state and local government agencies that oversee services for low-income adults with disabilities in order to connect more food insecure people with food assistance. Many food insecure adults with disabilities interact at some point with government agencies, yet addressing access to food often is not on the radar at that touch point. Given the magnitude of food insecurity among this population and how essential nutrition is to maximize healthy lives, consistently connecting the dots between inadequate food access and other services will improve public support of this population.
Formally linking up with the Illinois Department of Rehabilitative Services, the Illinois Department of Healthcare and Family Services, and the City of Chicago Mayor’s Office for People with Disabilities to identify food insecure households and to connect them with food assistance programs and other services as appropriate will close this missed opportunity to reach people in need.
Partner with local health care systems and managed care organizations to connect more food insecure adults with disabilities with food assistance, including those who do not qualify for federal disability payments. Health care providers, particularly those serving low-income populations, directly see the consequences of food insecurity on a daily basis. They are on the front lines, fighting for the health of communities and patients through everything from preventative check-ups to emergency room visits in times of crisis. The opportunities to reach patients that are struggling to access enough food, including adults with disabilities, at these touch points are abundant. More and more health systems and managed care organizations are recognizing the role food insecurity and other social determinants of health have on the wellbeing of their patients, but the work has only just begun on effectively connecting these patients to needed community services.
The Food Depository’s already blossoming collaborations with Cook County Health and Hospital Systems and Access Community Health Network represent the foundation of this effort. Integrating the findings of this report, such as the need for home delivery options and medically-tailored meals, should inform the evolution of this work.
SECTION E: RECOMMENDATIONS TO INCREASE FOOD SECURITY AMONG LOW-INCOME ADULTS WITH DISABILITIES IN COOK COUNTY 58
Advocating for public policy responses to hungerMany of the food assistance, health insurance, and health care programs mentioned throughout this report rely on federal and state funds and priorities. Anti-hunger advocates must continue to fight for the protection of these programs to avoid any further increase in food insecurity among adults with disabilities in Cook County.
Stress the importance of passing a state budget to Illinois legislators and the Governor. Many organizations providing necessary services to people with disabilities have been forced to lay off staff and cut back services due to the state’s backlog of unpaid bills. Food Depository partners have been adversely affected, which in turn harms our clients as they try to emerge out of food insecurity. The State of Illinois government must pass a budget that stabilizes this funding landscape for services and community assets that all residents, including people with disabilities, rely on to thrive.
Advocate for protection of federal nutrition assistance programs, especially the Supplemental Nutrition Assistance Program (i.e. SNAP, LINK, food stamps). In 2015, 30% of Cook County households with 1 or more persons with a disability received SNAP benefits, and this report estimates that SNAP provides around 80% of the food assistance reaching adults with disabilities across Cook County. Although many participants shared that the SNAP benefit amount they receive is not sufficient to see them through the full month, many households with low-income adults with disabilities rely on the ongoing availability of these programs to supplement their diets with the foods necessary for their health and preferences. This is true for households with low-income adults with disabilities severe enough to qualify for federal disability payments as well as those with more short-term or less severe disabilities. Charitable
emergency food assistance could not replace this level of service if SNAP disappeared or eligibility for participation substantially narrows.
Additionally, if current USDA SNAP grocery delivery pilots succeed, advocates should support legislation allowing SNAP to be used for home delivery of groceries. Presently, SNAP recipients cannot use their LINK card to order home delivery. Having this option would be much easier for many adults with disabilities than getting to and from a grocery store with heavy bags. As the USDA’s explanation of the home delivery pilot asserts, “your neighborhood grocery may be conveniently located just a few short blocks away. But for many persons with disabilities and the elderly participating in the USDA’s SNAP, the store might as well be on the other side of the world.” For now, we in Illinois can only monitor this pilot and then support its expansion if and when the USDA releases positive pilot findings.
Align diverse stakeholders behind policies that support food security among people with disabilities. Research participants emphasized the interdependency of their health and wellbeing with access to adequate and appropriate nutrition as well as access to transportation, housing, education, and jobs. Developing collaborative program and advocacy efforts can help address gaps in service while forming the groundwork for a united message if policy makers propose legislation that directly or indirectly harms the food security of people with disabilities.

59 FOOD INSECURITY AMONG ADULTS WITH DISABILITIES IN COOK COUNTY: REALITIES AND REMEDIES
Other recommendationsEncourage and support additional research and discussion on the relationship between food insecurity and disabilities. The stories and data collected in the pages of this report only scrape the surface of the complexity around food insecurity and disability. Disparities in the experience and severity of food insecurity should consider additional layers of ethnicity, race, gender, veteran status, type of disability and other characteristics that we did not focus on in this report.
Testing expanded measurements of food insecurity beyond income, such as embedding concepts of access to the right kinds of food for special diets and meal preparation capabilities would also further capture the more complex dimensions of food insufficiency.87
By providing data and ideas to others researchers, partnering with academic institutions and students, and supporting community forums or other similar venues exploring food insecurity and food assistance programming in Cook County, the Food Depository can continue to contribute to the necessary exchange of ideas and information to end hunger in our community.
Champion inclusion and diversity in all internal and external operations. Envisioning and building the most inclusive culture and ecosystem requires us to continually assess and improve our practices, both at home and in the outside world. According to the Chicago Community Trust’s guide on Renewing the Commitment: An ADA Compliance Guide for Nonprofits, this means “you welcome people with disabilities and subscribe to the goal of providing access to programs, services and facilities. This philosophy should then be integrated into all activities: policies, guidelines, plans, budgets, funding proposals, meetings and outreach.”88 Ensuring the Food Depository continuously strives for full ADA compliance and inclusion only strengthens our fight against hunger at all levels of the organization. 87 Wolfe, W.S. 88 Bowen, I. p. 7.
APPENDIX 60
U.S. Census Current Population Survey (CPS) Food Security Supplement (FSS) micro-data analysis on food insecurity and disability by age group. The report uses the U.S. Census Current Population Survey (CPS) Food Security Supplement (FSS), the University of Minnesota’s Public Use Microdata Series (IPUMS) tools, and SPSS statistical software to estimate the food insecurity rate among adults with disabilities. We analyzed data for three geographies: the Chicago metro area, Illinois, and the nation. The CPS FSS is the only data source with information on actual food insecurity and disability that we can pull at different scales like this.
We extracted household-level FSS data for December 2015 and person-level disability data from the ASEC 2015 for ages 18 and over. We then used SPSS software to calculate the number of people with any disability among age groups 18-64 and 65+ that reported food insecurity in the United States, Illinois (fips code = 17), and the Chicago-Naperville-Elgin metropolitan area (metrofips = 16980). All data was weighted by the FSS household variable FSHWTSCALE, as calculated by IPUMS.
APPENDIX: TECHNICAL BRIEF ON QUANTITATIVE ANALYSIS
Important limitations to this data source that we must balance with our need to illustrate the disproportionate occurrence of food insecurity among adults with disabilities in our service area include:
• It is designed to be most representative of the overall population at the state and national level (though the Chicago metro area is larger than some states);
• Disability and use of emergency food are both underreported in the CPS sample. Since we are looking at food insecurity rates within the group that reported a disability, rather than capturing the prevalence of disability and food insecurity in the overall population as a proportion, this underreporting is not as concerning as it might be otherwise given the goals of this project.
• Given the underreporting of disability, we would optimally have used three years’ worth of data. However, this analysis landed on using one year of data due to very large differences in local sample size and incidence of disability and food insecurity in 2013, and to a lesser extent, in 2014, from national percentages, in comparison to 2015 figures.

61 FOOD INSECURITY AMONG ADULTS WITH DISABILITIES IN COOK COUNTY: REALITIES AND REMEDIES
Zip Code-level quantitative analysis; estimating the unmet need for food assistance among adults with disabilities in Cook County, 2015.The author performed separate analyses for adults with disabilities age 18-64 and adults with disabilities age 65+ because of the difference in eligibility for assistance programs between these two age groups.
Methodology for adults with disabilities, age 18-64
Data Analysis Output Summary (explained in more detail in the following pages):
# of meals needed by people with disabilities age 18-64 in Zip Code = estimated # of people with disabilities age 18-64 in Zip Code with incomes <=200% FPL (nutrition assistance eligibility threshold)* 10 meals per week * 52 weeks per year = 73,777,062 total meals across Zip Codes
# of meals supplied to people with disabilities age 18-64 in need in Zip Code = IDHS Department of Rehabilitation Services Home Delivered Meals provided in Zip Code – City of Chicago Mayor’s Office for People with Disabilities Home Delivered Meals provided in Zip Code -- SNAP Meals provided in meals – GCFD meals provided in Zip Code – Non-GCFD meals provided through GCFD network in Zip Code = 36,370,132 total meals across Zip Codes
Unmet need for meals among people with disabilities age 18-64 in Zip Code = # of meals needed by people with disabilities age 18-64 in Zip Code - # of meals supplied to people with disabilities age 18-64 in need in Zip Code = 37,406,930 meals across Zip Codes
# of meals served per person in need by Zip Code = (Total meals supplied to people with disabilities age 18-64 in Zip Code) / (people with disabilities age 18-64 with incomes <= 200% FPL in Zip Code)
Background calculations (Demand – Supply):
Demand Side by Zip Code, 2015
This report uses incomes <=200% of the federal poverty level because this is the eligibility threshold for SNAP for people with disabilities in Cook County. This is the income amount that the state has decided is a meaningful indicator of possible need for food assistance. Moreover, in terms of using other income thresholds, Feeding America’s Map the Meal Gap study tells us that 28% of food insecure people in Cook County have incomes above the nutrition program threshold of 185% of the federal poverty level, indicating that we should take into account income levels above 185%. We did not use the CPS food insecurity estimate for the Chicago – Naperville – Elgin metro area because it is not available at the Zip Code level nor easily approximated by other calculations. Moreover, it is not clear if respondents to the food insecurity screen that informs the CPS food insecurity rate receive food assistance or at what levels. Feeding America food insecurity rates are not specific to people with disabilities.
Since a census table for 200% FPL for people with disabilities separated out by age does not exist through the U.S. Census American Community Survey, and IPUMS-USA data cannot be pulled at the Zip Code level, we used IPUMS-USA data to calculate the proportion of all adults with disabilities in Illinois with incomes <= 200% FPL that are aged 18-64. This proportion came out to 53.3105%. In each Zip Code, the number of people with disabilities <= 200% FPL of all ages was multiplied by 53.3105% to get the estimated # of people with a disabilities age 18-64 <= 200% FPL. We cycled through other methods, but this seemed the most reliable across Zip Codes. As instructed by IPUMS, we weighted IPUMS-USA data by PERWT, the POVERTY variable > 000 because 000 = N/A, the author created a new variable to connote “any difficulty” and a new variable for income <= 200% FPL, as poverty is a continuous variable in this system.
10 meals per week are used since that is the typical level of service provided to participants in DRS and MOPD existing food assistance programs. It represents full utilization for a specific amount of assistance rather than the total amount of food needed by people that struggle with food insecurity.
# of meals needed by people with disabilities age 18-64 in Zip Code = # of people with disabilities age 18-64 in Zip Code with income <=200% FPL (nutrition assistance eligibility threshold)* 10 meals per week * 52 weeks per year

APPENDIX 62
Supply Side by Zip Code, 2015
IDHS Department of Rehabilitation Services (DRS) home delivered meals, 2015 + City of Chicago Mayor’s Office for People with Disabilities (MOPD) home delivered meals, 2015 + SNAP meals, 2015 + GCFD meals (including TEFAP), 2015 + Non-GCFD supplied food program distributions, 2015
Broken out by components
DRS meals = People receiving home delivered meals from DRS in Zip Code, FY2015 * 2 meals per day * 5 meals per week * 52 weeks per year (raw data supplied by DRS)
+
MOPD meals = People receiving home delivered meals from MOPD’s Access Living administered program in Zip Code, CY2015 * 335.5 meals average per individual per year (raw data supplied by MOPD)
+
SNAP meals = Households receiving SNAP in past 12 months that have 1 or more persons with a disability, 2015 (ACS B22010)*proportion of people with a disability in Zip Code with income <= 200 FPL (53.3105%)*average SNAP benefit per person with a disability per month ($102 according to the USDA ERS)* average SNAP certification period in IL in month (12 months) / average meal cost in Cook County among food insecure individuals ($2.76).
This calculation assumes that 1 person with a disability lives in each household receiving SNAP with 1 or more persons with a disability
The average SNAP certification period in IL in months is actually a little over 12 months, but doesn’t make sense to make it over the maximum number of months in a year.
Average meal cost in Cook County among food insecure households is from Feeding America’s Map the Meal Gap study, 2014.
+
GCFD meals (includes TEFAP) = IPUMS CPS proportion of all people who received emergency food assistance from church/food pantry/food bank during the past year that had a disability and aged 18-64, December 2015 in Chicago-Naperville-Elgin
*Calendar year 2015 GCFD food only lbs. distributed to general population programs, converted to meals using “1.2lbs per meal” per the USDA for grocery programs and “meals served” for soup kitchens and shelters. This excludes closed children and older adult programs.
*64.3%. According to Feeding America’s Hunger in America 2014 Study for Cook County, 64.3% of GCFD clients are between the ages of 18-64.
For CPS calculation: Household Variables YEAR = 2015; METROFIPS=16980; FSFDBNK, Person variables AGE= 18-64, DIFFANY = 2; weighted cases by WTFINL as instructed by IPUMs. 18.6%= (has difficulty and has received emergency food at least once + only 1 or 2 months + some months but not every month + almost every month) / (total population and has received emergency food at least once + only 1 or 2 months + some months but not every month + almost every month).
+
Non-GCFD supplied meals as emergency food assistance = (# of GCFD meals from above/ .721) – GCFD Meals.
Feeding America’s Hunger in America 2014 study for Cook County found that GCFD member agencies reported that 72.1% of food distributed through their program was supplied by GCFD. This is likely an overestimate for some programs, but this factor can take into account other charitable food assistance distributions as well.
**Requests made to Catholic Charities for emergency food assistance to this population provided by their agencies could not be filled.

63 FOOD INSECURITY AMONG ADULTS WITH DISABILITIES IN COOK COUNTY: REALITIES AND REMEDIES
Methodology for adults with disabilities, age 65+
Data Analysis Output Summary (explained in more detail in the following pages):
# of meals needed by people with disabilities age 65+ in Zip Code = estimated # of people with disabilities age 65+ in Zip Code with incomes <=200% FPL (nutrition assistance eligibility threshold)* 10 meals per week * 52 weeks per year = total of 52,891,610 meals
# of meals supplied to people with disabilities age 65+ in need in Zip Code = Age Options Home Delivered Meals and Congregate Meals provided in Zip Code – City of Chicago Department of Family & Support Services Home Delivered Meals and Congregate provided in Zip Code – CSFP meals – CACFP meals - SNAP Meals provided in meals – GCFD meals provided in Zip Code – Non-GCFD meals provided through GCFD network in Zip Code = total of 23,633,226 meals
Unmet need for meals among people with disabilities age 65+ in Zip Code = # of meals needed by people with disabilities age 65+ in Zip Code - # of meals supplied to people with disabilities age 65+ in need in Zip Code = total of 29,258,383 meals
# of meals served per person in need by Zip Code = (Total meals supplied to people with disabilities age 65+ in Zip Code) / (people with disabilities age 65+ with incomes <= 200% FPL in Zip Code)
Background calculations (Demand – Supply):
Demand Side by Zip Code, 2015
Again, we used incomes <=200% of the federal poverty level because this is the eligibility threshold for SNAP for people with disabilities in Cook County. This is the income amount that the state has decided is a meaningful indicator of possible need for food assistance. Moreover, in terms of using other income thresholds, Feeding America’s Map the Meal Gap study tells us that 28% of food insecure people in Cook County have incomes above the nutrition program threshold of 185% of the federal poverty level, indicating that we should take into account income levels above 185%. We did not use the CPS food insecurity estimate for the Chicago – Naperville – Elgin metro area because it is not available at the Zip Code level nor easily approximated by other calculations. Moreover, it is not clear if respondents to the food insecurity screen that informs the CPS food insecurity rate receive food assistance or at what levels. Feeding America food insecurity rates are not specific to people with disabilities.
Since a census table for 200% FPL for people with disabilities separated out by age does not exist through the U.S. American Community Survey, and IPUMS-USA data cannot be pulled at the Zip Code level, we used IPUMS-USA data to calculate the proportion of all adults with disabilities in Illinois with incomes <= 200% FPL that are aged 65+. This proportion came out to 38.2189%. In each Zip Code, the number of people with disabilities with incomes <= 200% FPL of all ages was multiplied by 38.2189% to get the estimated # of people with a disabilities age 65+ with incomes<= 200% FPL. Other methods were tried, but this seemed the most reliable across Zip Codes. The author weighted IPUMS-USA data by PERWT as instructed by IPUMS, the POVERTY variable > 000 because 000 = N/A, we created a new variable to connote “any difficulty” and one for income <= 200% FPL, as poverty is a continuous variable in this system.
10 meals per week are used since that is the typical level of service provided to participants in existing meal delivery food assistance programs. It represents full utilization for a specific amount of assistance rather than the total amount of food needed by people that struggle with food insecurity.
# of meals needed by people with disabilities age 65+ in Zip Code = # of people with disabilities age 65+ in Zip Code <=200% FPL (nutrition assistance eligibility threshold)* 10 meals per week * 52 weeks per year
APPENDIX 64
Supply Side by Zip Code, 2015
AgeOptions home delivered meals and congregate meals, 2015 + City of Chicago Dept. of Family & Support Services home delivered meals and congregate meals, 2015 + CSFP meals + CACFP meals + SNAP meals, 2015 + GCFD meals (including TEFAP), 2015 + Non-GCFD supplied food program distributions, 2015
Broken down by components
Age Options meals (raw data supplied by Age Options)
+
DFSS meals (raw data supplied by DFSS)
+
CSFP meals (In FY2015, the caseload in IL was 16,281). The program is only active in Chicago and Cook County suburbs, so can assume all comes here. Assuming 30 pound boxes per month based on USDA program stats, and divided by 1.2 pounds per meal, gives 407,025 CSFP meals distributed in Cook. Divide evenly based on older adults living with incomes <=200% FPL. Calculation=407,025*(number of older adults <= 200% FPL in Zip Code / 65+ <= 200% FPL in all Zip Codes). See https://www.fns.usda.gov/sites/default/files/csfp/Revised-Maximum-Monthly-Distribution-Rates.pdf
+
CACFP meals (raw data supplied by IL Dept. of Aging)
+
SNAP meals = Households receiving SNAP in past 12 months that have 1 or more persons with a disability, 2015 (ACS B22010)*proportion of people 65+ with a disability in Zip Code with incomes <= 200 FPL (38.2189%)*average SNAP benefit per older adult per month ($98 according to the USDA ERS)* average SNAP certification period in IL in month (12 months) / average meal cost in Cook County among food insecure individuals ($2.76).
This calculation assumes that only 1 member with a disability lives in each household receiving SNAP with 1 or more persons with a disability
The average SNAP certification period in IL in months is actually a little over 12 months, but doesn’t make sense to make it over the maximum number of months in a year.
Average meal cost in Cook County among food insecure households is from Feeding America Map the Meal Gap study, 2014.
+
GCFD meals (includes TEFAP) = IPUMS CPS proportion of all people who received emergency food assistance from church/food pantry/food bank during the past year that had a disability and were ages 65+, December 2015 in Chicago-Naperville-Elgin
*Calendar year 2015 GCFD food only lbs. distributed to general population programs and older adult programs, converted to meals using “1.2lbs per meal” per the USDA for grocery programs and “meals served” for soup kitchens and shelters. This excludes closed children’s programs.
*18.2%. According to Feeding America’s Hunger in America 2014 Study for Cook County, 18.2% of GCFD clients are older adults.
For CPS calculation: Household Variables YEAR = 2015; METROFIPS=16980; FSFDBNK, Person variables AGE>=65, DIFFANY = 2; weighted cases by WTFINL as instructed by IPUMS. 23% = (has difficulty and has received emergency food at least once + only 1 or 2 months + some months but not every month + almost every month )/ (total population and has received emergency food at least once + only 1 or 2 months + some months but not every month + almost every month).
+
Non-GCFD supplied meals as emergency food assistance = (# of GCFD meals from above/ .721) – GCFD Meals.
Feeding America’s Hunger in America 2014 study for Cook County found that GCFD member agencies reported that 72.1% of food distributed through their program was supplied by GCFD. This is likely an overestimate for some programs, but this factor can take into account other charitable food assistance distributions as well.
65 FOOD INSECURITY AMONG ADULTS WITH DISABILITIES IN COOK COUNTY: REALITIES AND REMEDIES
American Association of People with Disabilities & The Leadership Conference Education Fund. “Equity in Transportation for People with Disabilities,” accessed 1/1/2017. http://www.civilrights.org/transportation/disability/facts.html
Americans With Disabilities Act of 1990. Washington DC: U.S. Congress.
American Public Health Association Fact Sheet on the Prevention and Public Health Fund. Accessed 2/27/2017: https://www.apha.org/~/media/files/pdf/factsheets/160127_pphf.ashx
Arc of Illinois. PUNS Misconceptions. Accessed 2/3/2017. https://www.thearcofil.org/arc-and-puns-misconceptions-2/.
Associated Press. “Medicaid hit with $106 million cut from Illinois budget deal.” Chicago Sun-Times. April 24, 2015. Accessed 1/1/2017. http://chicago.suntimes.com/politics/medicaid-hit-with-106-million-cut-from-illinois-budget-deal/
Berkowitz, S., Seligman, H., Choudhry, N. “Treat or Eat: Food Insecurity, Cost-related Medication Underuse, and Unmet Needs.” The American Journal of Medicine 127 (2014): pp. 303-310.
Bowen, I. and ADA One, LLC, “Renewing the Commitment: An ADA Compliance Guide for Nonprofits.” The Chicago Community Trust and Affiliates and ADA25 Chicago, 2015.
Brucker, D.L. “Food security among young adults with disabilities in the United States: Findings from the National Health Interview Survey,” Disability and Health Journal 9, 2 (2016): 298-305.
Carlson, S., Rosenbaum, D., & Keith-Jennings, B., “Who Are the Low-Income Childless Adults Facing the Loss of SNAP in 2016?” Center of Budget and Policy Priorities, February 8, 2016.
Chicago Community Trust. “A Quest for Equality: Breaking the Barriers for People with Disabilities.” 2010: pp. 5.
Chilton, M. & Rose, D. “A Rights-Based Approach to Food Insecurity in the United States.” American Journal of Public Health 99, 7 (July 2009). pp. 1203.
Christensen Gee, Lisa. “Lack of Budget Is Dismantling Critical State Services.” Fiscal Policy Center at Voices for Illinois Children.” Issue Brief, September 2015, page 1. Accessed 2/1/2017. http://www.voices4kids.org/wp-content/uploads/2015/09/Lack-of-Budget-Dismantling-Critical-State-Services-Final.pdf
Coleman-Jensen, A., & Nord, M. “Food insecurity Among Households with Working-Age Adults with Disabilities.” United States Department of Agriculture Economic Research Service (144), January 2013.
Summary document: “Disability Is an Important Risk Factor for Food Insecurity,” United States Department of Agriculture Economic Research Service, accessed 1/12/2017, https://www.ers.usda.gov/amber-waves/2013/may/disability-is-an-important-risk-factor-for-food-insecurity/
Cohn, D.J., & Waters, D.B., “Food as Medicine: Medically Tailored, Home-Delivered Meals Can Improve Health Outcomes for People with Critical and Chronic Disease.” Community Servings, Inc. and Congressional Hunger Center, February 2013.
The Community Nutritionists. “Making the Connection – Food Security and Public Health.” Council of British Columbia. Library and Archives Canada Cataloguing in Publication Data, June 2004. Accessed 2/7/2017. http://bcfoodsecuritygateway.ca/wp-content/uploads/sites/2/2015/11/Making_the_Connection.pdf
Concannon, K. “New SNAP Pilot Provides Grocery Delivery for Homebound Disabled, Elderly,” United States Department of Agriculture Blog, accessed 1/11/2017. http://blogs.usda.gov/2016/09/30/new-snap-pilot-provides-grocery-delivery-for-homebound-disabled-elderly/
Conroy, N.E., McDonald, K., Morris, M., & Jennings, E. “Financial Capability of Adults with Disabilities.” National Disability Institute, July 2014.
Cook County Department of Public Health. County Health Rankings and Roadmaps: Suburban Cook County Equivalent Measures – 2015. Mar 2015. http://www.cookcountypublichealth.org/files/pdf/data-and-reports/other-data-reports/scc-health-rankings-report-2015-v9.4-03272015.pdf
Council for Disability Awareness. Disability statistics, accessed 2/1/2017. http://www.disabilitycanhappen.org/chances_disability/disability_stats.asp
APPENDIX: REFERENCES
APPENDIX 66
Crain’s Chicago Business. “Quinn signs bill restoring Medicaid cuts.” June 16, 2014. Accessed 1/12/2017: http://www.chicagobusiness.com/article/20140616/NEWS03/140619863/quinn-signs-bill-restoring-medicaid-cuts
Ellwood, M., Downer, S., Leib, E.B., Greenwald, R., Farthing-Nichol, D., Luk, E., & Mendle, A. “Food Is Medicine: Opportunities in Public and Private Health Care for Supporting Nutritional Counseling and Medically-Tailored, Home-Delivered Meals.” Center for Health Law & Policy Innovation at Harvard Law School; 2014.
Food Research & Action Center. “SNAP Matters for People with Disabilities,” July 2015.
Forrest, Sharita L. “Adults with disabilities on Medicaid wait list most likely to have unmet service needs.” Illinois News Bureau. October 6, 2016. Accessed 2/27/2017. https://news.illinois.edu/blog/view/6367/414954
Fortino, Ellyn. “With State Owing Agency $1 Million, Chicago Home Care Service Struggles to Keep Doors Open.” Progress Illinois. February 2, 2016.
Garcia, Monique. “Rauner takes budget ax to health care for the poor.” Chicago Tribune. April 24, 2015. Accessed 1/12/2017. http://www.chicagotribune.com/ct-bruce-rauner-illinois-budget-cuts-met-0424-20150423-story.html
Glover Blackwell, A. “The Curb-Cut Effect.” Stanford Social Innovation Review. Winter 2017.
Gray, K.F., Fisher, S., & Lauffer, S. “Characteristics of Supplemental Nutrition Assistance Program Households: Fiscal Year 2015,” prepared by Mathematica Policy Research for the U.S. Department of Agriculture’s Food and Nutrition Service, November 2016.
Greater Chicago Food Depository and the Office of the Cook County Board President. “Cook County Food Access Plan.” 2015.
Gundersen, Craig. “An Overview of the Effectiveness of Various Approaches to Addressing Food Insecurity in the United States.” Texas Hunger Research Project, 2012. pp. 8-9.
Gundersen, C., A. Dewey, A. Crumbaugh, M. Kato & E. Engelhard. “Map the Meal Gap 2016: Food Insecurity and Child Food Insecurity Estimates at the County Level.” Feeding America, 2016.
Gundersen, C., & J. Ziliak. “Food Insecurity and Health Outcomes.” Health Affairs 34,11(2015): pp. 1830-1839.
Hager, E. et al., “Development and validity of a 2-item screen to identify families at risk for food insecurity.” Pediatrics, 7, 126 (2010): pp. e26-e32.
Hamos, Julie. “Medicaid expansion in Illinois should be praised.” Chicago Tribune, February 10, 2015. Accessed 2/27/2017. http://www.chicagotribune.com/news/opinion/commentary/ct-medicaid-expansion-obamacare-quinn-hamos-perspec-0210-jm-20150209-story.html
Huffington Post. “Illinois Medicaid Cuts: Gov. Pat Quinn $1.6 Billion in Medicaid Cuts, Cigarette Tax Hike Into Law.” June 14, 2012. Accessed 2/27/2017. http://www.huffingtonpost.com/2012/06/14/illinois-medicaid-cuts-go_n_1596467.html
Illinois Hunger Coalition. Illinois’ Loss of the ABAWD Waiver: Potential loss of $421 million in federal funding for hungry families and local businesses, 2016. Accessed 2/27/2017. http://cjc.net/wp-content/uploads/2016/10/SNAP-ABAWD-report-FY17.pdf
Johnson, B. “Food Security for Seniors and Persons with Disabilities Project: A look at Household Food Security for Seniors and Persons with Disabilities in Seattle’s low income housing.” Congressional Hunger Center, February 2008.
King, M., et al. Integrated Public Use Microdata Series, Current Population Survey: Version 3.0. [Machine-readable database]. Minneapolis, MN: Minnesota Population Center [producer and distributor], 2010.
Macker, B. “State budget impasse slams brake on Meals on Wheels in Illinois,” Chicago Talks, May 9, 2016. Accessed 2/27/2017. http://www.chicagotalks.org/?p=59124
Meals on Wheels of America. Hunger in Older Adults: Challenges and Opportunities for the Aging Services Network. Prepared by Jean L. Lloyd. February 2017.
Mills, G. et al. “Hunger in America 2014: Report for the Greater Chicago Food Depository.” Prepared by Urban Institute and Westat for Feeding America, 2014.
Montclair State College of Humanities and Social Science Anthropology Website. “Food and Disability Research.” accessed 1/11/2017. http://www.montclair.edu/chss/anthropology/research/food-disability-research/

67 FOOD INSECURITY AMONG ADULTS WITH DISABILITIES IN COOK COUNTY: REALITIES AND REMEDIES
Morris, M., & Goodman, N. “Impact of the Work Requirement in Supplemental Nutrition Assistance (SNAP) on Low-Income Working-Age People with Disabilities.” Employment Policy and Measurement Rehabilitation Research and Training Center. August 2014. Accessed 2/25/2017: http://www.researchondisability.org/docs/publications/snap-paper-8-23-2014-with-appendix.pdf?sfvrsn=2
National Commission on Hunger. “Freedom from Hunger: An Achievable Goal for the United States of America. Recommendation of the National Commission on Hunger to Congress and the Secretary of the Department of Agriculture.” 2015.
Phipps, E.J., et al. “Food Insecurity in Patients with High Hospital Utilization,” Population Health Management 19, 6 (2016): pp. 414-420.
Population Reference Bureau. Fact Sheet: Aging in the United States, accessed 2/1/2017, www.prb.org/Publications/Media-Guides/2016/aging-unitedstates-fact-sheet.aspx
Progress Illinois. “Rauner Makes Amendatory Veto to Home Services Legislation (Updated).” November 9, 2015. Accessed 2/24/2017. http://progressillinois.com/news/content/2015/11/09/rauner-makes-amendatory-veto-home-services-legislation
Rose-Jacobs, R. et al. “Children with Special Health Care Needs, Supplemental Security Income, and Food Insecurity,” Journal of Developmental & Behavioral Pediatrics 37,2 (2016): pp. 140-147.
Seligman, H.K., & Schillinger, D. “Hunger and Socioeconomic Disparities in Chronic Disease.” New England Journal of Medicine, 363(1), (2010): pp.6.
Seligman, H.K., Bolger, A.F., Guzman, D., Lopez, A., & Bibbins-Domingo, K. “Exhaustion of Food Budgets At Month’s End and Hospital Admissions for Hypoglycemia.” Health Affairs 33,1 (2014): pp. 116-123.
Shepard, E., E. Setren, D. Cooper. “Hunger in America: Suffering We All Pay For.” Center for American Progress. October 2011, pp. 1.
Smock, A. “Illinois Budget Impasse impact on Centers for Independent Living,” Access Living, accessed 1/11/2017. https://www.accessliving.org/1410ga488
Social Security Administration Disability Fact Sheet, SSA website. Accessed 2/1/2017. https://www.ssa.gov/disabilityfacts/facts.html
State Journal-Register. “Marca Bristo and Bob Gallo: Decisive action by Rauner needed for Illinois’ seniors, disabled.” September 30, 2015. Accessed 2/27/2017. http://www.sj-r.com/article/20150930/OPINION/150939957
The State Journal-Register. “Letter: Changes to Medicaid expansion would be detriment to Illinois.” February 3, 2017. Accessed 2/27/2017. http://www.sj-r.com/opinion/20170203/letter-changes-to-medicaid-expansion-would-be-detriment-to-illinois
Tarasuk, V., Cheng, J., de Oliveira, C., Dachner, N., Gundersen, C., & Kurdyak, P. “Association Between Household Food Insecurity and Annual Health Care Costs.” CMAJ: Canadian Medical Association Journal 187,14 (2015): pp. E429.
Tribune news services. “Illinois fails to support disability services, report finds.” Chicago Tribune. January 29, 2017. Accessed 2/27/2017. http://www.chicagotribune.com/news/nationworld/midwest/ct-llinois-disability-services-report-20170129-story.html
United Cerebral Palsy. Case for Inclusion 2016.
United States Census Bureau. American Community Survey 1 and 5 year estimates. Tables referenced in document. Population Projections accessed 2/1/2017. https://www.census.gov/population/projections/data/national/2014/summarytables.html
United States Department of Transportation Bureau of Transportation Statistics. “Freedom to Travel.” 2003.
Vallas, R., Fremstad, S., & Ekman, L. “A Fair Shot for Workers with Disabilities,” Center for American Progress, January 28, 2015.
Venteicher, W. “Illinois Medicaid shifts 1.4 million to managed care,” Chicago Tribune, January 3, 2015. Accessed 2/27/2017. http://www.chicagotribune.com/ct-medicaid-managed-care-20150102-story.html
Webber, C.B., Sobal, J., & Dollahite, J.S. “Physical Disabilities and Food Access Among Limited Resource Households,” Disability Studies Quarterly 27, 3 (2007).
Wolfe, W.S., Frongillo, E.A., & Valois, P. “Understanding the Experience of Food Insecurity by Elders Suggests Ways to Improve Its Measurement,” The Journal of Nutrition 133, 9 (2003): pp. 2752-2769.
We wish to thank the many organizations and individuals who provided invaluable assistance and feedback in the development of the report, including:
• The Chicago Community Trust
• Focus group and survey participants
• Access Living (special acknowledgement to Tom Wilson, Community Organizer, Health Care)
• AgeOptions
• Anixter Center
• Feeding America
• The Heartland Alliance’s Social Impact Research Center
• The Mayor’s Office for People with Disabilities
• Progress Center for Independent Living
Quotes from adults with disabilities and service providers highlighted throughout this report were derived from focus groups and surveys conducted during the course of our research.
The Greater Chicago Food Depository’s mission is to feed hungry people while striving to end hunger in our community.
Related Documents