This article was downloaded by: [Dicle University] On: 02 November 2014, At: 19:14 Publisher: Taylor & Francis Informa Ltd Registered in England and Wales Registered Number: 1072954 Registered office: Mortimer House, 37-41 Mortimer Street, London W1T 3JH, UK Petroleum Science and Technology Publication details, including instructions for authors and subscription information: http://www.tandfonline.com/loi/lpet20 A Reliable Model for Estimating the Wax Deposition Rate During Crude Oil Production and Processing A. Kamari a , A. H. Mohammadi ab , A. Bahadori c & S. Zendehboudi d a Thermodynamics Research Unit, School of Engineering, University of KwaZulu-Natal, ýHoward College Campus, Durban, South Africa b Institut de Recherche en Génie Chimique et Pétrolier (IRGCP), Paris, France c School of Environment, Science & Engineering, Southern Cross University, Lismore, NSW, Australia d Department of Chemical Engineering, Massachusetts Institute of Technology (MIT), Cambridge, MA, USA Published online: 31 Oct 2014. To cite this article: A. Kamari, A. H. Mohammadi, A. Bahadori & S. Zendehboudi (2014) A Reliable Model for Estimating the Wax Deposition Rate During Crude Oil Production and Processing, Petroleum Science and Technology, 32:23, 2837-2844, DOI: 10.1080/10916466.2014.919007 To link to this article: http://dx.doi.org/10.1080/10916466.2014.919007 PLEASE SCROLL DOWN FOR ARTICLE Taylor & Francis makes every effort to ensure the accuracy of all the information (the “Content”) contained in the publications on our platform. However, Taylor & Francis, our agents, and our licensors make no representations or warranties whatsoever as to the accuracy, completeness, or suitability for any purpose of the Content. Any opinions and views expressed in this publication are the opinions and views of the authors, and are not the views of or endorsed by Taylor & Francis. The accuracy of the Content should not be relied upon and should be independently verified with primary sources of information. Taylor and Francis shall not be liable for any losses, actions, claims, proceedings, demands, costs, expenses, damages, and other liabilities whatsoever or howsoever caused arising directly or indirectly in connection with, in relation to or arising out of the use of the Content. This article may be used for research, teaching, and private study purposes. Any substantial or systematic reproduction, redistribution, reselling, loan, sub-licensing, systematic supply, or distribution in any form to anyone is expressly forbidden. Terms &

Welcome message from author
This document is posted to help you gain knowledge. Please leave a comment to let me know what you think about it! Share it to your friends and learn new things together.
Transcript
This article was downloaded by: [Dicle University]On: 02 November 2014, At: 19:14Publisher: Taylor & FrancisInforma Ltd Registered in England and Wales Registered Number: 1072954 Registeredoffice: Mortimer House, 37-41 Mortimer Street, London W1T 3JH, UK
Petroleum Science and TechnologyPublication details, including instructions for authors andsubscription information:http://www.tandfonline.com/loi/lpet20
A Reliable Model for Estimating theWax Deposition Rate During Crude OilProduction and ProcessingA. Kamaria, A. H. Mohammadiab, A. Bahadoric & S. Zendehboudida Thermodynamics Research Unit, School of Engineering, Universityof KwaZulu-Natal, ýHoward College Campus, Durban, South Africab Institut de Recherche en Génie Chimique et Pétrolier (IRGCP),Paris, Francec School of Environment, Science & Engineering, Southern CrossUniversity, Lismore, NSW, Australiad Department of Chemical Engineering, Massachusetts Institute ofTechnology (MIT), Cambridge, MA, USAPublished online: 31 Oct 2014.
To cite this article: A. Kamari, A. H. Mohammadi, A. Bahadori & S. Zendehboudi (2014) A ReliableModel for Estimating the Wax Deposition Rate During Crude Oil Production and Processing, PetroleumScience and Technology, 32:23, 2837-2844, DOI: 10.1080/10916466.2014.919007
To link to this article: http://dx.doi.org/10.1080/10916466.2014.919007
PLEASE SCROLL DOWN FOR ARTICLE
Taylor & Francis makes every effort to ensure the accuracy of all the information (the“Content”) contained in the publications on our platform. However, Taylor & Francis,our agents, and our licensors make no representations or warranties whatsoever as tothe accuracy, completeness, or suitability for any purpose of the Content. Any opinionsand views expressed in this publication are the opinions and views of the authors,and are not the views of or endorsed by Taylor & Francis. The accuracy of the Contentshould not be relied upon and should be independently verified with primary sourcesof information. Taylor and Francis shall not be liable for any losses, actions, claims,proceedings, demands, costs, expenses, damages, and other liabilities whatsoever orhowsoever caused arising directly or indirectly in connection with, in relation to or arisingout of the use of the Content.
This article may be used for research, teaching, and private study purposes. Anysubstantial or systematic reproduction, redistribution, reselling, loan, sub-licensing,systematic supply, or distribution in any form to anyone is expressly forbidden. Terms &

Conditions of access and use can be found at http://www.tandfonline.com/page/terms-and-conditions
Dow
nloa
ded
by [
Dic
le U
nive
rsity
] at
19:
14 0
2 N
ovem
ber
2014
Petroleum Science and Technology, 32:2837–2844, 2014Copyright C© Taylor & Francis Group, LLCISSN: 1091-6466 print / 1532-2459 onlineDOI: 10.1080/10916466.2014.919007
A Reliable Model for Estimating the Wax Deposition RateDuring Crude Oil Production and Processing
A. Kamari,1 A. H. Mohammadi,1,2 A. Bahadori,3 and S. Zendehboudi4
1Thermodynamics Research Unit, School of Engineering, University of KwaZulu-Natal, yHowardCollege Campus, Durban, South Africa
2Institut de Recherche en Genie Chimique et Petrolier (IRGCP), Paris, France3School of Environment, Science & Engineering, Southern Cross University, Lismore, NSW,
Australia4Department of Chemical Engineering, Massachusetts Institute of Technology (MIT), Cambridge,
MA, USA
Deposition of wax in surface and subsurface pipes and even perforations can lead to serious problemsincluding pore spaces blockage, plugging of pipelines, and minimum profitability. Therefore, under-standing wax deposition and wax related-properties improves the oil recovery and processing operationsin petroleum industry. In this research work, the rate of wax deposition is correlated to a number ofmain parameters such as the dynamic viscosity of crude oil, shear stress, gradient of wax molecular con-centration and temperature difference in pipeline system through implementation of a newly developedmodel, known as least squares support vector machine (LSSVM) along with the coupled simulated an-nealing (CSA) optimization strategy. The possible outliers are detected through employing the Leveragetechnique which involves residual errors plots, Williams’ plot, and Hat matrix. The results imply thatwhole collected real data are in applicability domain of the proposed model. Using a comprehensivestatistical investigation, a very good agreement between the predicted LSSVM-CSA outputs and realwax deposition rate is found such that the average relative error percentage and determination coefficient(R2) are 0.048% and 0.999, respectively. Such a study can assist to provide better designs (technicallyand economically) for underground and surface facilities while dealing with wax deposition cases.
Keywords: deposition, wax rate, model, LSSVM, error analysis, outlier detection
1. INTRODUCTION
From a chemical engineering science point of view, petroleum waxes as a troublesome flow assur-ance solid have carbon numbers ranging from 15 or 18 to 90, which deposits when the hydrocarbontemperature drops below the appearance temperature of wax (Wu et al., 2002; Ajayi, 2013). Fur-thermore, it has been characterized into two major classes: microcrystalline including iso-alkanesand cyclo-alkanes as well as macrocrystalline involving n-alkanes (Srivastava et al., 1993). In thepetroleum industry, the wax deposition problem from crude oil has been recognized as a seriousproblem in production, refining, and transportation that leads to mechanical failure of production
Address correspondence to A. Bahadori, School of Environment, Science & Engineering, Southern Cross University,Lismore, NSW, Australia. E-mail: [email protected]
Color versions of one or more of the figures in the article can be found online at www.tandfonline.com/lpet.
2837
Dow
nloa
ded
by [
Dic
le U
nive
rsity
] at
19:
14 0
2 N
ovem
ber
2014
2838 A. KAMARI ET AL.
equipment, pore spaces blockage, production loss, minimum profitability, increased handling costs,increased production downtime, and plugging of pipelines (Adewusi, 1997; Wu et al., 2002). Inother words, wax deposition problem in the petroleum industry causes the problem of limiting theproduction capacity of facilities with progressive accumulation or deposition of wax at the perfora-tions section, surface and subsurface (tubing) production pipelines, and tanks associated with storage(Adewusi, 1997; Wu et al., 2002). Consequently, avoiding or eliminating precipitated wax remains afundamental factor in petroleum production issues. Therefore, methods such as mechanical piggingand chemical inhibition are implemented to avoid or control wax deposition in petroleum productionstrategies.
Several studies have been done to predict wax deposition performance in pipelines (Burger et al.,1981; Hamouda and Ravneøy, 1992; Hsu et al., 1994). Kamari et al. (2013b) developed an efficientmodel based on least squares support vector machine (LSSVM) mathematical approach to accurateprediction of wax deposition. They showed that the applied method predictions are in good agreementwith the literature data. Wei et al. (2010) proposed a seven hidden neurons back-propagation neuralnetwork to estimate wax deposition rate. The estimated result indicated that error is less than 2%.Moradi et al. (2013) developed an artificial neural network model to predict the disappearancetemperature of wax. The results indicated that the predictions are in agreement with experimentalvalues and data obtained from the thermodynamic models. Consequently, it is very important toproperly estimate the rate of wax precipitation in order to evaluate the economic feasibility andbetter design and operation of petroleum production pipes and systems (Wu et al., 2005). Therefore,a reliable model based on LSSVM computing strategy was developed in this study for the predictionof wax deposition rate.
2. DATA COLLECTION
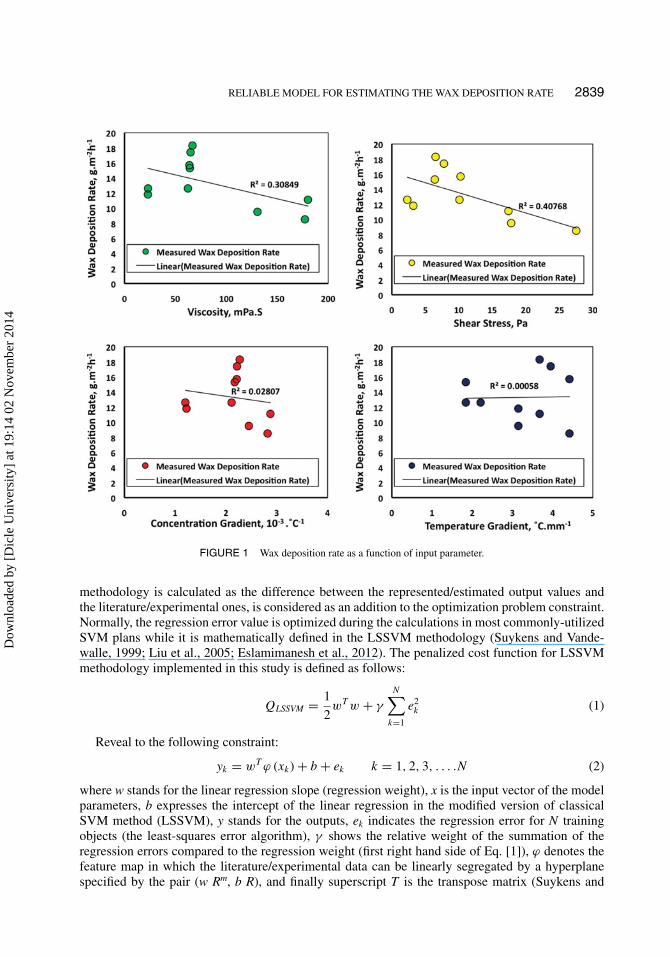
Selection of proper input parameters and in other words reliability of dataset used for developmentof LSSVM models has a key role in efficient, accurate and reliable prediction (Kamari et al., 2013a;Kamari et al., 2014a, 2014b; Kamari et al., in press). Therefore, to estimate the wax depositionrate (g/m2h) most affecting parameters including the dynamic viscosity of crude oil (mPa.sec), shearstress (Pa) in pipeline, wax molecular concentration gradient (10−3◦C−1) in pipeline, and temperaturegradient (◦C.mm−1) in pipeline were gathered as input parameters from the literature (Wei et al.,2010). As there is a complex nonlinear relationship (Wei et al., 2010) between wax deposition ratethe aformentioned input parameters, we sketched the impacts of these mentioned parameters on thewax deposition rate in Figure 1. Moreover, calculated correlation coefficients for each input variableagainst wax deposition rate are indicated in Figure 1. This figure well reveals that shear stress anddynamic viscosity of crude oil have the highest correlation coefficient and gradient of temperatureand wax molecular concentration have the lowest correlation coefficient. The gathered dataset covera wide range of was deposition rate from 8.5 to 18.3 g/m2h. To pursue our objective in this study, theavailable wax deposition dataset is randomly divided into two subdatasets consisting of the Trainingset (80%, eight data points) and the Test set (20%, two data points).
3. MODEL DEVELOPMENT
Suykens and Vandewalle (1999) presented a modified form of the original SVM to support thesolution of a set of nonlinear equations (quadratic programming). The resulting LSSVM (Suykensand Vandewalle, 1999) strategy benefits from advantages of classical SVM form although it onlyneeds solving a set of linear programming (linear equations), resulting in a faster and more adequateoption to the traditional form of SVM tools. The error of regression for the LSSVM mathematical
Dow
nloa
ded
by [
Dic
le U
nive
rsity
] at
19:
14 0
2 N
ovem
ber
2014
RELIABLE MODEL FOR ESTIMATING THE WAX DEPOSITION RATE 2839
FIGURE 1 Wax deposition rate as a function of input parameter.
methodology is calculated as the difference between the represented/estimated output values andthe literature/experimental ones, is considered as an addition to the optimization problem constraint.Normally, the regression error value is optimized during the calculations in most commonly-utilizedSVM plans while it is mathematically defined in the LSSVM methodology (Suykens and Vande-walle, 1999; Liu et al., 2005; Eslamimanesh et al., 2012). The penalized cost function for LSSVMmethodology implemented in this study is defined as follows:
QLSSVM = 1
2wT w + γ
N∑k=1
e2k (1)
Reveal to the following constraint:
yk = wT ϕ (xk) + b + ek k = 1, 2, 3, . . . .N (2)
where w stands for the linear regression slope (regression weight), x is the input vector of the modelparameters, b expresses the intercept of the linear regression in the modified version of classicalSVM method (LSSVM), y stands for the outputs, ek indicates the regression error for N trainingobjects (the least-squares error algorithm), γ shows the relative weight of the summation of theregression errors compared to the regression weight (first right hand side of Eq. [1]), ϕ denotes thefeature map in which the literature/experimental data can be linearly segregated by a hyperplanespecified by the pair (w Rm, b R), and finally superscript T is the transpose matrix (Suykens and
Dow
nloa
ded
by [
Dic
le U
nive
rsity
] at
19:
14 0
2 N
ovem
ber
2014
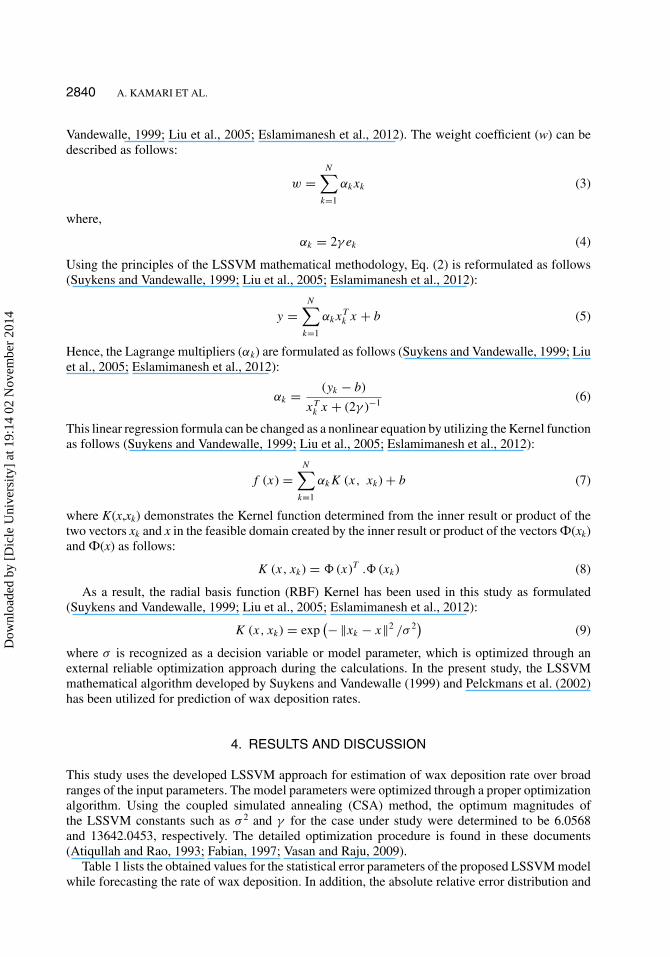
2840 A. KAMARI ET AL.
Vandewalle, 1999; Liu et al., 2005; Eslamimanesh et al., 2012). The weight coefficient (w) can bedescribed as follows:
w =N∑
k=1
αkxk (3)
where,
αk = 2γ ek (4)
Using the principles of the LSSVM mathematical methodology, Eq. (2) is reformulated as follows(Suykens and Vandewalle, 1999; Liu et al., 2005; Eslamimanesh et al., 2012):
y =N∑
k=1
αkxTk x + b (5)
Hence, the Lagrange multipliers (αk) are formulated as follows (Suykens and Vandewalle, 1999; Liuet al., 2005; Eslamimanesh et al., 2012):
αk = (yk − b)
xTk x + (2γ )−1 (6)
This linear regression formula can be changed as a nonlinear equation by utilizing the Kernel functionas follows (Suykens and Vandewalle, 1999; Liu et al., 2005; Eslamimanesh et al., 2012):
f (x) =N∑
k=1
αkK (x, xk) + b (7)
where K(x,xk) demonstrates the Kernel function determined from the inner result or product of thetwo vectors xk and x in the feasible domain created by the inner result or product of the vectors Ф(xk)and Ф(x) as follows:
K (x, xk) = � (x)T .� (xk) (8)
As a result, the radial basis function (RBF) Kernel has been used in this study as formulated(Suykens and Vandewalle, 1999; Liu et al., 2005; Eslamimanesh et al., 2012):
K (x, xk) = exp(−‖xk − x‖2 /σ 2) (9)
where σ is recognized as a decision variable or model parameter, which is optimized through anexternal reliable optimization approach during the calculations. In the present study, the LSSVMmathematical algorithm developed by Suykens and Vandewalle (1999) and Pelckmans et al. (2002)has been utilized for prediction of wax deposition rates.
4. RESULTS AND DISCUSSION
This study uses the developed LSSVM approach for estimation of wax deposition rate over broadranges of the input parameters. The model parameters were optimized through a proper optimizationalgorithm. Using the coupled simulated annealing (CSA) method, the optimum magnitudes ofthe LSSVM constants such as σ 2 and γ for the case under study were determined to be 6.0568and 13642.0453, respectively. The detailed optimization procedure is found in these documents(Atiqullah and Rao, 1993; Fabian, 1997; Vasan and Raju, 2009).
Table 1 lists the obtained values for the statistical error parameters of the proposed LSSVM modelwhile forecasting the rate of wax deposition. In addition, the absolute relative error distribution and
Dow
nloa
ded
by [
Dic
le U
nive
rsity
] at
19:
14 0
2 N
ovem
ber
2014
RELIABLE MODEL FOR ESTIMATING THE WAX DEPOSITION RATE 2841
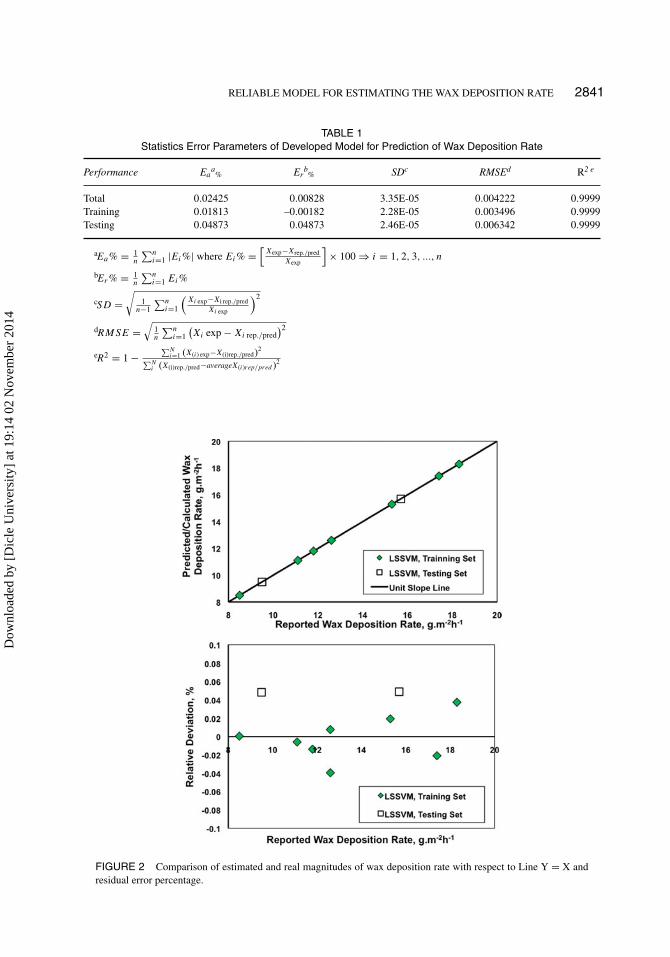
TABLE 1Statistics Error Parameters of Developed Model for Prediction of Wax Deposition Rate
Performance Eaa% Er
b% SDc RMSEd R2 e
Total 0.02425 0.00828 3.35E-05 0.004222 0.9999Training 0.01813 –0.00182 2.28E-05 0.003496 0.9999Testing 0.04873 0.04873 2.46E-05 0.006342 0.9999
aEa% = 1n
∑ni=1 |Ei%| where Ei% =
[Xexp−Xrep./pred
Xexp
]× 100 ⇒ i = 1, 2, 3, ..., n
bEr% = 1n
∑ni=1 Ei%
cSD =√
1n−1
∑ni=1
(Xi exp−Xi rep./pred
Xi exp
)2
dRMSE =√
1n
∑ni=1
(Xi exp − Xi rep./pred
)2
eR2 = 1 −∑N
i=1 (X(i) exp−X(i)rep./pred)2
∑Ni (X(i)rep./pred−averageX(i)rep/pred )2
FIGURE 2 Comparison of estimated and real magnitudes of wax deposition rate with respect to Line Y = X andresidual error percentage.
Dow
nloa
ded
by [
Dic
le U
nive
rsity
] at
19:
14 0
2 N
ovem
ber
2014
2842 A. KAMARI ET AL.
TABLE 2Comparison Study Between Literature-reported Data, the Obtained Results by the Newly Developed Model
and Neural Network Modeling
Shear Concentration Gradient of Reported Wax ANN (Wei,Viscosity, Stress, Gradient, Temperature, Deposition Wu et al.,mPa.sec Pa 10−3.◦C−1 ◦C.mm−1 Rate, g/m2h 2010) ARD,% LSSVM ARD,%
180.13 17.4 2.875 3.675 11.1 11.0 0.2 11.1 0.0130.52 17.81 2.45 3.1456 9.5 9.0 4.6 9.4 0.023.09 2.29 1.201 1.8375 12.6 12.6 0.1 12.6 0.0177.12 27.51 2.819 4.4166 8.5 8.4 0.0 8.5 0.064.83 7.76 2.218 3.9486 17.4 17.1 1.5 17.4 0.062.29 10.08 2.111 2.2083 12.6 12.6 0.1 12.5 0.064.08 6.4 2.172 1.8375 15.3 15.1 0.9 15.2 0.066.71 6.51 2.271 3.675 18.3 18.1 1.0 18.2 0.063.72 10.24 2.212 4.4166 15.7 15.6 0.5 15.6 0.022.95 3.2 1.223 3.1456 11.8 11.7 0.5 11.8 0.0
Note. The reported data are from Wei et al. (2010).
crossplot are illustrated in Figure 2 for both training and testing phases in LSSVM implementation.As clear from the figure, an acceptable match is noticed between the experimental and estimatedwax deposition rate values. Table 2 also reports a systematic comparison between the real data, thetraditional ANN outputs taken from Wei et al. (2010), and the results of CSA-LSSVM techniquein terms of statistical precision. This investigation clearly conveys the message that the developedLSSVM system is able to forecast the target variable (e.g., the rate of wax deposition) with higheraccuracy and reliability. On the other hand, the newly proposed technique contains lower numberof tuning parameters (e.g., σ 2 and γ ) compared to the ANN model, meaning that the optimizationprocess is more economical with respect to cost and time for the CSA-LSSVM method.
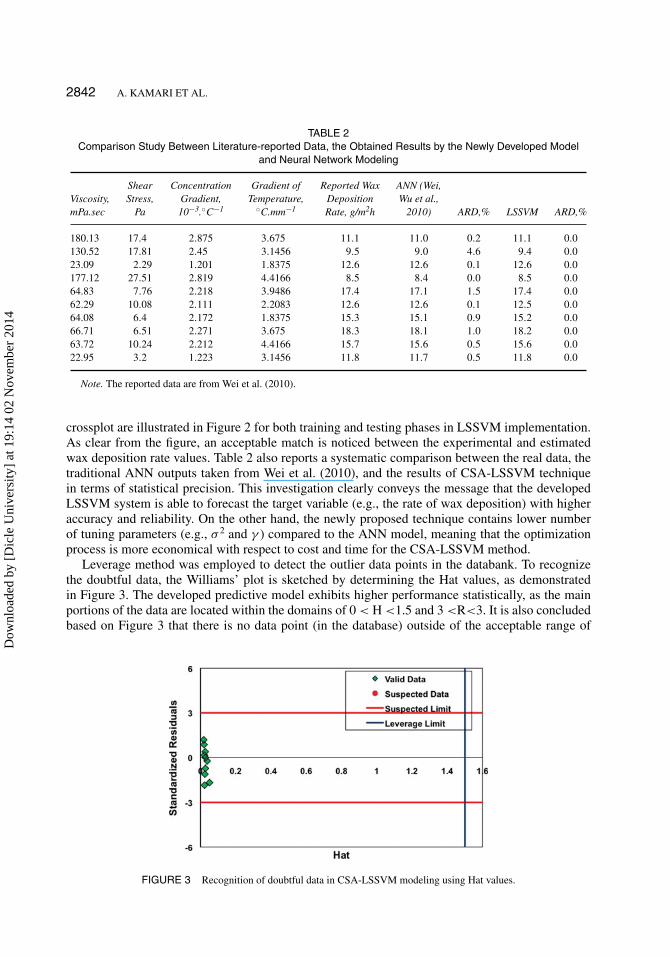
Leverage method was employed to detect the outlier data points in the databank. To recognizethe doubtful data, the Williams’ plot is sketched by determining the Hat values, as demonstratedin Figure 3. The developed predictive model exhibits higher performance statistically, as the mainportions of the data are located within the domains of 0 < H <1.5 and 3 <R<3. It is also concludedbased on Figure 3 that there is no data point (in the database) outside of the acceptable range of
FIGURE 3 Recognition of doubtful data in CSA-LSSVM modeling using Hat values.
Dow
nloa
ded
by [
Dic
le U
nive
rsity
] at
19:
14 0
2 N
ovem
ber
2014
RELIABLE MODEL FOR ESTIMATING THE WAX DEPOSITION RATE 2843
the proposed technique. Technical readers are encouraged to see the documents/papers for furtherdetails on the modeling strategy (Goodall, 1993; Gramatica, 2007; Rousseeuw and Leroy, 2005;Gramatica, 2007; Mohammadi et al., 2012a; Mohammadi et al., 2012b).
It is believed that the attempt made in this study can facilitate the calculation of wax depositionrate for researchers and engineers being involved in different operational units of the oil and gasindustries.
5. CONCLUSIONS
Prediction of wax deposition rate is of great importance throughout various stages in oil and gasengineering processes. A new training methodology for the LSSVM model on the basis of the CSAapproach was proposed in this paper. Moreover, the CSA-LSSVM model was compared (or/andexamined) with the conventional smart technique in terms of accuracy and reliability, depictingsupremacy of the developed LSSVM technique. The Leverage methodology was also utilized tospot the existing outliers. Low error percentage and high R2 attained in the current study confirmgreat capability of the CSA-LSSVM technique as a predictive tool for a variety of engineeringproblems/processes (e.g., wax deposition and thermodynamic characteristics). It is expected thatthe developed approach can be easily embedded in various chemical, environmental and petroleumengineering software packages in the near future for the sake of simplicity and accuracy.
REFERENCES
Adewusi, V. A. (1997). Prediction of wax deposition potential of hydrocarbon systems from viscosity-pressure correlations.Fuel 76:1079–1083.
Ajayi, O. E. (2013). Modelling of controlled wax deposition and loosening in oil and gas production systems. MSc Thesis,Norwegian University of Science and Technology, Norway.
Atiqullah, M. M., and Rao, S. (1993). Reliability optimization of communication networks using simulated annealing.Microelectron. Reliab. 33:1303–1319.
Burger, E., Perkins, T., and Striegler, J. (1981). Studies of wax deposition in the trans Alaska pipeline. J. Pet. Technol.33:1075–1086.
Eslamimanesh, A., Gharagheizi, F., Illbeigi, M., Mohammadi, A. H., Fazlali, A., and Richon, D. (2012). Phase equilibriummodeling of clathrate hydrates of methane, carbon dioxide, nitrogen, and hydrogen+ water soluble organic promotersusing Support Vector Machine algorithm. Fluid Phase Equilib. 316:34–45.
Fabian, V. (1997). Simulated annealing simulated. Comput. Math. Applic. 33:81–94.Goodall, C. R. (1993). 13 Computation using the QR decomposition. Handbook Stat. 9:467–508.Gramatica, P. (2007). Principles of QSAR models validation: internal and external. QSAR & Comb. Sci. 26:694–
701.Hamouda, A., and Ravneøy, J. (1992). Prediction of wax deposition in pipelines and field experience on the influence of wax
on drag-reducer performance. Offshore Technology Conference, Offshore Technology Conference. April 5, Texas.Hsu, J., Santamaria, M., and Brubaker, J. (1994). Wax deposition of waxy live crudes under turbulent flow conditions. SPE
Annual Technical Conference and Exhibition, Society of Petroleum Engineers.Kamari, A., Gharagheizi, F., Bahadori, A., and Mohammadi, A. H. (2014a). Determination of the equilibrated calcium
carbonate (calcite) scaling in aqueous phase using a reliable approach. J. Taiwan Instit. Chem. Engineers.Kamari, A., Gharagheizi, F., Bahadori, A., Mohammadi, A. H., and Zendehboudi, S. (2014b). Rigorous modeling for
prediction of barium sulfate (barite) deposition in oilfield brines. Fluid Phase Equilib. 366:117–126.Kamari, A., Hemmati-Sarapardeh, A., Mirabbasi, S.-M., Nikookar, M., and Mohammadi, A. H. (2013a). Prediction of sour
gas compressibility factor using an intelligent approach. Fuel Process. Technol. 116:209–216.Kamari, A., Khaksar-Manshad, A., Gharagheizi, F., Mohammadi, A. H., and Ashoori, S. (2013b). Robust model for the
determination of wax deposition in oil systems. Ind. Eng. Chem. Res. 52:15664–15672.Kamari, A., Safiri, A., and Mohammadi, A. H. (in press). A compositional model for estimating asphaltene precipitation
conditions in live reservoir oil systems. J. Dispers. Sci. Technol.
Dow
nloa
ded
by [
Dic
le U
nive
rsity
] at
19:
14 0
2 N
ovem
ber
2014
2844 A. KAMARI ET AL.
Liu, H., Yao, X., Zhang, R., Liu, M., Hu, Z., and Fan, B. (2005). Accurate quantitative structure-property relationship modelto predict the solubility of C60 in various solvents based on a novel approach using a least-squares support vector machine.J. Phys. Chem. B 109:20565–20571.
Mohammadi, A. H., Eslamimanesh, A., Gharagheizi, F., and Richon, D. (2012a). A novel method for evaluation of asphalteneprecipitation titration data. Chem. Eng. Sci. 78:181–185.
Mohammadi, A. H., Gharagheizi, F., Eslamimanesh, A., and Richon, D. (2012b). Evaluation of experimental data for waxand diamondoids solubility in gaseous systems. Chem. Eng. Sci. 81:1–7.
Moradi, G., Mohadesi, M., and Moradi, M. R. (2013). Prediction of wax disappearance temperature using artificial neuralnetworks. J. Pet. Sci. Eng. 108:74–81.
Pelckmans, K., Suykens, J. A. K., Van Gestel, T., De Brabanter, J., Lukas, L., Hamers, B., De Moor, B., and Vandewalle,J. (2002). LS-SVMlab: a Maltab/c toolbox for least squares support vector machines, tutorial. Leuven, the Netherlands:KULeuven-ESAT.
Rousseeuw, P. J., and Leroy, A. M. (2005). Robust regression and outlier detection. New York: Wiley.Srivastava, S., Handoo, J., Agrawal, K., and Joshi, G. (1993). Phase-transition studies in n-alkanes and petroleum-related
waxes—A review. J. Phys. Chem. Solids 54:639–670.Suykens, J. A., and Vandewalle, J. (1999). Least squares support vector machine classifiers.” Neural Process. Lett. 9:293–300.Vasan, A., and Raju, K. S. (2009). Comparative analysis of simulated annealing, simulated quenching and genetic algorithms
for optimal reservoir operation. Appl. Soft Comput. 9:274–281.Wei, Y., Wu, M., and Zhao, L. (2010). Wax deposition rate model for crude oil pipeline based on neural network. IEEE 2010
Sixth International Conference on Natural Computation (ICNC), Shandong, China, August 10-12.Wu, C. H., Wang, K. S., Shuler, P. J., Tang, Y., Creek, J. L., Carlson, R. M., and Cheung, S. (2002). Measurement of wax
deposition in paraffin solutions. AIChE J. 48:2107–2110.Wu, M., Qiu, S., Liu, J., and Zhao, L. (2005). Prediction model based on the grey theory for tackling wax deposition in oil
pipelines. J. Nat. Gas Chem. 14:243.
Dow
nloa
ded
by [
Dic
le U
nive
rsity
] at
19:
14 0
2 N
ovem
ber
2014
Related Documents


