International Journal of Humanities and Social Science Vol. 2 No. 19 [Special Issue – October 2012] 1 A Relationship between Text Message Volume and SAT Writing Test Scores Dr. Brian J. Wardyga Associate Professor of Communication General Manager of Lasell College Radio Lasell College 1844 Commonwealth Ave. Auburndale, MA 02466 Abstract The purpose of this study was to reveal whether there is a relationship between students’ volume of text messaging and formal writing performance on the Scholastic Aptitude Test writing section. The study also examined gender as a contributing variable in this measure. The design included a questionnaire that collected data to show whether any relationships exist that indicate a correlation between paired scores. The sample was taken from college freshmen who completed the SAT writing test before the fall 2011 semester. The results of the study showed a significant negative relationship between female students’ average monthly text message volume and SAT writing scores. Keywords: text messaging, SMS, writing scores, high school students, college freshmen, higher education, relationship, correlation, SAT test Background Text messaging has become one of the preferred methods of telecommunication for teens and young adults today. To promote the use of such technology, most cellular service providers such as AT&T Mobility, Verizon Wireless, T-Mobile, and Sprint offer unlimited texting plans as options to their services. In addition, there are the newer ―smartphones‖ like the Blackberry, iPhone, and Droid, which make the process of sending a text message all the more easier for consumers. Current research on the subject reveals that text messaging is on the rise as a dominant form of communication among people today. The Nielson Company (2009) reported that ―the average U.S. mobile teen now sends or receives an average of 2,899 text-messages per month compared to 191 calls‖ and that ―the average number of texts has gone up 566% in just two years, far surpassing the a verage number of calls, which has stayed nearly steady‖ (p. 8). It was further reported that ―more than half of all U.S. teen mobile subscribers (66%) say they actually prefer text-messaging to calling‖ and ―thirty-four percent say it’s the reason they got their phone‖ (The Nielson Company, 2009, p. 8). Such claims were supported by the Pew Research Center, where a study by Lenhart, Ling, Campbell, and Purcell (2010) showed that ―between February 2008 and September 2009, daily use of text messaging by teens shot up from 38% in 2008 to 54% of all teens saying they text every day in 2009‖ (p. 30). Beyond the increase in frequency, teens are also reported to be sending large quantities of text messages each day. According to Lenhart, Ling, Campbell, and Purcell (2010): About 14% of teens send between 100-200 texts a day, or between 3000 and 6000 text messages a month. Another 14% of teens send more than 200 text messages a day – or more than 6000 texts a month. In light of these findings, it is not surprising that three-quarters of teens (75%) have an unlimited text messaging plan. (p. 32) Lenhart and her colleagues identified three main reasons why teens are choosing texting over talking (p. 47). First, sending text messages is a form of asynchronous communication and is more discrete than traditional voice phone calls.

Welcome message from author
This document is posted to help you gain knowledge. Please leave a comment to let me know what you think about it! Share it to your friends and learn new things together.
Transcript

International Journal of Humanities and Social Science Vol. 2 No. 19 [Special Issue – October 2012]
1
A Relationship between Text Message Volume and SAT Writing Test Scores
Dr. Brian J. Wardyga
Associate Professor of Communication
General Manager of Lasell College Radio
Lasell College
1844 Commonwealth Ave.
Auburndale, MA 02466
Abstract
The purpose of this study was to reveal whether there is a relationship between students’ volume of text messaging and formal writing performance on the Scholastic Aptitude Test writing section. The study also
examined gender as a contributing variable in this measure. The design included a questionnaire that collected
data to show whether any relationships exist that indicate a correlation between paired scores. The sample was taken from college freshmen who completed the SAT writing test before the fall 2011 semester. The results of the
study showed a significant negative relationship between female students’ average monthly text message volume
and SAT writing scores.
Keywords: text messaging, SMS, writing scores, high school students, college freshmen, higher education, relationship, correlation, SAT test
Background
Text messaging has become one of the preferred methods of telecommunication for teens and young adults today.
To promote the use of such technology, most cellular service providers such as AT&T Mobility, Verizon Wireless, T-Mobile, and Sprint offer unlimited texting plans as options to their services. In addition, there are the
newer ―smartphones‖ like the Blackberry, iPhone, and Droid, which make the process of sending a text message
all the more easier for consumers. Current research on the subject reveals that text messaging is on the rise as a dominant form of communication among people today. The Nielson Company (2009) reported that ―the average
U.S. mobile teen now sends or receives an average of 2,899 text-messages per month compared to 191 calls‖ and
that ―the average number of texts has gone up 566% in just two years, far surpassing the average number of calls,
which has stayed nearly steady‖ (p. 8). It was further reported that ―more than half of all U.S. teen mobile subscribers (66%) say they actually prefer text-messaging to calling‖ and ―thirty-four percent say it’s the reason
they got their phone‖ (The Nielson Company, 2009, p. 8).
Such claims were supported by the Pew Research Center, where a study by Lenhart, Ling, Campbell, and Purcell
(2010) showed that ―between February 2008 and September 2009, daily use of text messaging by teens shot up
from 38% in 2008 to 54% of all teens saying they text every day in 2009‖ (p. 30). Beyond the increase in frequency, teens are also reported to be sending large quantities of text messages each day. According to Lenhart,
Ling, Campbell, and Purcell (2010):
About 14% of teens send between 100-200 texts a day, or between 3000 and 6000 text messages
a month. Another 14% of teens send more than 200 text messages a day – or more than 6000 texts
a month. In light of these findings, it is not surprising that three-quarters of teens (75%) have an unlimited text messaging plan. (p. 32)
Lenhart and her colleagues identified three main reasons why teens are choosing texting over talking (p. 47).
First, sending text messages is a form of asynchronous communication and is more discrete than traditional voice phone calls.

The Special Issue on Business and Social Science © Centre for Promoting Ideas, USA www.ijhssnet.com
2
Second, text messaging can serve as a ―buffer‖ when communicating with friends around parents—in addition to
being a more comfortable form of communication when discussing intimate or personal subjects with possible
romantic interests. Lastly, Lenhart, Ling, Campbell, and Purcell (2010) described texting as ―a simple way to keep up with friends when there is nothing special that needs to be communicated‖ (p. 47).
Just as talk time has become shorter, text messages themselves are a short method of communication. According to Buczynski (2008), ―text messaging, or more specifically, SMS (Short Message Service) texting enables text
messages up to 160 characters long to be sent and received by mobile phones‖ (p. 263). At an average word
length of five, an average ―text‖ would only allow a total of 32 words per message.
This limitation in characters may be one of the reasons teens tend to abbreviate and often ignore the rules of
spelling and grammar when texting. Another reason for abbreviations is the use of secret codes. With the many
abbreviations used by teens when texting, it is no wonder that teenagers are sending and receiving thousands of text messages each month. As Vosloo (2009) made clear, ―texting does not always follow the standard rules of
English grammar, nor usual word spellings. It is so pervasive that some regard it as an emergent language register
in its own right‖ (p. 2). Like any new technology or rising trend, there will be people in the media and research fields seeking to both understand its potential, as well as determine whether any negative consequences could
result from its use.
The majority of the current literature on text messaging has focused on sociological connections (Taylor & Harper, 2003; Faulkner & Culwin, 2005; Igarashi, Takai, & Yoshida, 2005) and emotional links (Reid & Reid,
2007; Igarashi, Motoyoshi, Takai, & Yoshida, 2008; Lin & Peper, 2009), literacy (McWilliam, Schepman, &
Rodway, 2009; Plester, Wood, & Joshi, 2009; Rosen, Chang, Erwin, Carrier, & Cheever, 2010), and the ways schools can use the technology to enhance a student’s education (Harley, Winn, Pemberton, & Wilcox, 2007; Hill,
Hill, & Sherman, 2007; Naismith, 2007; Buczynski, 2008). While studies have shown positive correlations
between students who text and the intimacy levels of their communication (Igarashi, Takai, & Yoshida, 2005), questions still remain in regards to texting and its relationship to formal writing ability in the classroom.
One such inquiry into text messaging is to determine whether the time high school students spend texting instead of talking over the phone has a positive or negative impact on their formal writing skills. A review of literature
on the subject has uncovered little research regarding the impact of texting on formal writing skills and the
research that has been done is somewhat contradictory. Dr. Beverly Plester, the head researcher on the Children's
Text Messaging and Literacy projects at Coventry University, has conducted studies with her colleagues on children that show a positive correlation between text message volume and their competence with literacy and
language (Plester, Wood, & Joshi, 2009, p. 158).
A study by Larry Rosen, Jennifer Chang, Lynne Erwin, L. Mark Carrier, and Nancy A. Cheever (2010) showed a
positive relationship between texting and informal writing, but a negative correlation between texting volume and
formal writing among young adults (p. 433). Another scholar on the subject is executive director emeritus of the National Writing Project and lecturer at the University of California's Berkeley Graduate School of Education,
Richard Sterling. Sterling concluded that a sufficient amount of writing, even through texting, is very beneficial
and can develop student writing in a positive way (Vosloo, 2009, p. 5-6).
The problem is that texting is replacing talking among teens (Lindley, 2008, p. 19) yet their primary form of
communication in the classroom is oral communication and formal writing. Plester, Wood, and Bell (2008)
claimed that texting (which is more conversationally based) is appearing in standard written English and that ―this concern, often cited in the media, is based on anecdotes and reported incidents of text language used in
schoolwork‖ (p. 138). Rosen, Chang, Erwin, Carrier, and Cheever (2010) added that ―educators and the media
have decried the use of these shortcuts, suggesting that they are causing youth … to lose the ability to write acceptable English prose‖ (p. 421). Lastly, Vosloo (2009) stated that ―for a number of years teachers and parents
have blamed texting for two ills: the corruption of language and the degradation in spelling of youth writing‖ (p.
2).
At this time, only a small number of studies have been focused on the impact that high levels of text messaging
may have on teenagers, and even fewer studies have been focused on their ramifications on formal writing in an
education setting. Simply put, further research is needed to reveal the impact that high levels of text messaging
may have on teenagers and young adults when it comes to formal writing performance.
International Journal of Humanities and Social Science Vol. 2 No. 19 [Special Issue – October 2012]
3
First-year college students were chosen for this study because they are over 18 years old (for consent purposes) and because ―they communicate with friends via MPTM (mobile phone text messages) on a daily basis, and have
many opportunities for forming new relationships upon arriving to campus‖ (Igarashi, Takai, & Yoshida, 2005, p.
692). The study sought to determine whether there was a relationship between the number of text messages that these students sent/received and their scores on the Scholastic Aptitude Test (SAT) writing test. The study also
examined gender as a possible contributing factor in such correlations.
Research Questions 1. Is there a relationship between upper high school students’ average monthly volume of text messaging
and their formal writing performance on the SAT writing placement test? 2. Is there a relationship between upper high school male students’ average monthly volume of text
messaging and their formal writing performance on the SAT writing placement test?
3. Is there a relationship between upper high school female students’ average monthly volume of text
messaging and their formal writing performance on the SAT writing placement test?
Hypotheses
1. There will be no significant relationship between the average number of text messages the entire sample sent and received per month and their formal writing performance on the SAT writing section.
2. There will be no significant relationship between the average number of text messages male students
sent and received per month and their formal writing performance on the SAT writing section.
3. There will be no significant relationship between the average number of text messages female students sent and received per month and their formal writing performance on the SAT writing
section.
Theoretical Framework
The theoretical framework for this study was based on the theories of Moffett and Gibson who ―contend that these
choices are determined by one's sense of the relation of speaker, subject, and audience‖ (Flower & Hayes, 1981, p. 365). In other words, the style and substance of one’s writing is a matter of context that can and will vary from
situation to situation. This theory supports the idea that students may write one way when sending text messages
to friends and an entirely different way when writing formal papers for their college professors. The framework is reinforced by Lloyd Bitzer’s ―Rhetorical Situation‖ theory which ―argues that speech always occurs as a response
to a rhetorical situation, which he succinctly defines as containing an exigency (which demands a response), an
audience, and a set of constraints‖ (Flower & Hayes, 1981, p. 365).
Method
Participants
The population for this study included a sample of freshmen students at a regional college in Massachusetts during the 2011-12 academic year. The total population of freshmen students at the time of the study was
approximately 465 students. A demographic profile of the college’s students showed that the majority of the
student body was between the ages of 18 and 21 years-old and of predominantly white ethnicity. This lack of
diversity at the college was one of the main reasons that age and ethnicity were not variables chosen to be examined in the study.
The student body at the time of the study was approximately 2/3 female and 1/3 male. In total, the college graduated 270 students last year, of which 68 were male and 202 were female. Finally, SAT test scores are not
required for admission to this school, however the college does record the information since 91% of applicants
submit their SAT results.
Measures
The main instrument used in this study was the SAT Writing section of the SAT Reasoning Test. Beyond this
instrument, a short voluntary questionnaire was administered to collect each student’s gender and a set of text message data showing the volume of text messages sent and received during the two months prior to the time the
student took the SAT. During the weeks following the initial distribution, the researcher collected all remaining
questionnaires, along with the documentation of the students’ reported text message totals.
The Special Issue on Business and Social Science © Centre for Promoting Ideas, USA www.ijhssnet.com
4
Students unable to complete the questionnaire on paper were provided with a link to complete it online. The
students were asked to forward cell phone statements electronically or to bring a hard copy of their cell phone
evidence to the researcher’s office during the second week of the study.
To confirm validity of the reported text message totals, the first page of all reported months’ cell phone bills were
requested by the researcher for each of the months the students reported. Two alternative ways for students to validate their text message totals included: a) students forwarding text message responses from cellular service
providers showing the total number of text messages sent and received in a given month to the researcher, and b)
students forwarding email message responses from cellular service providers showing the total number of text messages sent and received in a given month to the researcher. Electronic validation was the most popular
method, with over 83% of the sample providing text message totals in this way.
Validity of SAT writing scores and gender was confirmed with administrative college officials at the Registrar’s
office. Regarding the SAT, multiple organizations and college systems, such as the University of California
system, have conducted studies on the validity of this test. Studies from the University of California and the College Board have shown similar results—where the writing section has been found to be ―the most predictive
section of the SAT, slightly more predictive than either math or critical reading‖ (College Board, 2010, p. 1).
Procedure
Before conducting any research, the author completed an application to the Liberty University Institutional
Review Board (IRB), as well as a similar application to the Committee for the Protection of Human Subjects
(CPHS) at the college of study. The study complied with all FERPA regulations. The questionnaire included an informed consent form, granting the author permission to obtain and/or verify the students’ SAT writing scores
from the college Registrar’s office. This informed consent also assured students that their information would be
kept confidential, secure, used only for the purpose of this study, and would be properly destroyed at the end of the study. Students were also given the option to discontinue the study at any time. The order of general
procedures included:
1. Contacting all faculty members teaching freshmen writing courses in the spring semester to explain the study and to ask permission to visit their writing classes during the spring semester to distribute the
questionnaire to freshmen students who have completed the SAT exam and the ENG: 101 Writing I
course. 2. Visiting each section of ENG 102: Writing II or ENG102H: Honors Writing II in the spring semester to
distribute and collect all questionnaires.
3. Emailing the survey link to any students who were absent from class or unable to complete the paper copy
for any reason. 4. Sending a follow-up email to participants requesting proof of the text message numbers reported on their
questionnaires.
5. Validating all text message totals and SAT scores. 6. Collecting and entering all validated information into spreadsheets.
7. Analyzing all data using SPSS.
Participants were contacted when the investigator visited their freshman writing classes to distribute the short voluntary questionnaire. Students who were absent and/or unable to complete the questionnaire on paper were
emailed all documents and provided with a link to take the questionnaire online. Each of the students were asked
for their gender, college class, their best SAT Writing Score, and their total number of text messages during the two months before they took the SAT. Students had to retrieve cell phone bills or contact their cell phone
provider for this information.
Before distributing the questionnaire, the investigator reviewed an informed consent document. Students in the classroom were given up to 10 minutes to review and sign the document. All informed consent documents were
collected before distributing the questionnaire. Students who received the documents electronically were asked
electronically sign and email the investigator the consent form before completing the questionnaire. Because the
questionnaire was delivered to most students during a class session, students were only given 15 minutes to complete the questionnaire. Students that did not complete it during this timeframe were allowed to submit it to
the investigator by the following week.

International Journal of Humanities and Social Science Vol. 2 No. 19 [Special Issue – October 2012]
5
There were two options for students to submit late questionnaires to the investigator: 1) by hand delivering it in person to the researcher's office; or 2) by entering the information electronically and submitting their final
answers via Survey Monkey. Finally, students signed the questionnaire to grant the investigator permission to
verify the two academic scores from the Registrar's office.
Valid proof of text message data (electronic or via printed cell phone bill) listing the number of text messages sent
and received per month was collected within a week of all participants having completed the questionnaire. This
data was tallied and averaged to develop a mean that represented each student’s average monthly text message use. Since participants only included freshmen college students who have taken the SAT writing test, all
questionnaires by students who did not take the SAT writing test were removed from the sample. Other
questionnaires omitted from the test included surveys where text message data was not validated.
The data was first organized into a spreadsheet with the following columns: 1. Student Name (coded as a
―Participant Number‖ for privacy), 2. Gender, 3. Total Text Messages for Month One, 4. Total Text Messages for Month Two, 5. Mean Text Messages average before SAT, and 9. SAT Writing Score.
This raw data was then broken down into smaller spreadsheets of isolated data sets to be analyzed. Spreadsheet A included data for analysis of the entire sample that compared the students’ SAT writing scores and mean total
monthly text messages from the two months immediately preceding that test. It included columns for: 1.
Participant Number, 2. SAT Writing Score, and 3. Mean Total Text Messages.
Spreadsheet Two included data for analysis based on gender. It showed the entire male population and entire
female population’s text message means beside their SAT writing scores. This table included columns for: 1.
Participant Number, 2. Gender, 3. SAT Writing Score, and 4. Mean Total Text Messages. This list was sorted by gender and divided into two groups—male and female.
The population’s combined text message means was analyzed within their respective data sets and then any differences in these correlations were examined by gender between the male and female participants. The
strengths of these procedures included:
• Gathering the primary data after the fact to eliminate the influence the study would have if the data were
collected during the months the students took the test and were engaged in their texting.
• Isolating and analyzing the data in multiple ways to strengthen consistent relationships and suggestion(s) of the study.
• Recording two consecutive months of text message data from the months before the students took the
SAT test, for an accurate texting habit snapshot of the students during this time period.
Since there were two independent variables (one categorical and one continuous) and one continuous dependent variable, the ideal test for this study was a test that focused on multiple regression where data could be used for
prediction between variables and the amount of variance they accounted for. Testing for multiple regression
showed ―how much variance in the DV is accounted for by linear combination of the IVs‖ [and] ―how strongly related to the DV is the beta coefficient for each IV‖ (Marenco, 2011, p. 5).
A multiple linear regression analysis to assess this data with the intended power of 0.80, level of significance of
0.05, and a medium effect size of 0.25 (25 points on the SAT scores on a scale of 200 to 800 points, and a quarter of a point [0.25] on the students’ final writing course grade on a scale from 0.7 to 4.0) required a minimum
sample size of 55 students to participate in the study. This calculation was made using the software program
G*Power 3.1.3.
Results
A total of 127 fully-completed questionnaires were obtained by the end of the collection period. There were 79 female respondents and 48 male respondents. Out of these 127 questionnaires, 91 were collected via the paper
version distributed to students in the Writing II classrooms and 36 were submitted to the researcher electronically
through SurveyMonkey.com. Over 80% of the participants emailed their cell phone bills or forwarded text
messages from their cell phone service providers indicating their monthly text message totals. The rest of the students provided hard copies of their cell phone bills.

The Special Issue on Business and Social Science © Centre for Promoting Ideas, USA www.ijhssnet.com
6
The mean SAT writing score of all participants was M = 489.36. The range for this score was 200 to 800 points,
indicating the mean score of these students to be almost perfectly in the middle range. Gender was entered as 0
for male and 1 for female, where M = .6282 can be translated to 62.82% of the participants being female. Lastly,
the average monthly text message volume for this group was just over 2,405 text messages per month.
The standard deviation for the SAT writing score was 64.91 points from the mean. The standard deviation for
gender was the expected .49. The standard deviation for average monthly text message volume showed the highest level of variety at 2,405.08.
In the ANOVA results, the Sum of Squares column shows the total sum of squares to be TSS = Σ(y - y )2 =
324467.95, with the residual sum of squares to predict y to be SSE = Σ(y -ŷ)2 = 321726.32. Applying the formula
R2 = TSS – SSE, divided by TSS, the result is .008. Using gender and monthly text message volume together to
predict SAT writing scores provides an 8% reduction in the prediction error relative to using only y alone.
The resulting total degrees of freedom (df) was 77, with an F statistic of .320 and a level of significance of .727 a.
The F statistic was close enough to 1 that it failed to reject the null hypotheses. Since the alpha level of
significance for this study was .05, the p-value of .727 was not statistically significant—failing to show a
significant relationship between these variables. The regression equation for predicting text message volume was
E(Y) = .440X gender + 494.16 where Beta (the probability of a Type II error) was just .003. The regression
equation for predicting gender is Y = .003X texts + 494.16 where Beta was -.092. The 95% confidence interval
for the slope was -30.18 to 31.06 for gender and -.009 to .004 for average monthly text message volume. Again, with the level of significance for this study set to .05, the results of .98 and .43 (p > .05) failed to reject the null
hypotheses, showing no significant relationship among these variables.
The histogram for partial regression in the SAT writing score correlation and P-Plot showed a relatively standard
distribution for this test. Three scatterplots were produced to show any relationships between: 1) texting volume
and SAT writing scores for all students, 2) texting volume and SAT writing scores for male students, and 3) texting volume and SAT writing scores for female students.
Scatterplot of Texting Volume and SAT Writing Scores for All Students.
The dot cluster for the first test did not show a significant positive or negative relationship between variables.
The Pearson correlation for all students was -.09 with a level of significance of .21. This data failed to reject the
null hypothesis (H01) which stated that there would be no significant relationship between the average number of
text messages the entire collective sample sent and received per month and their formal writing performance on the SAT writing section.
Scatterplot of Texting Volume and SAT Writing Scores for Male Students.
The dot cluster in the second test did not show a significant positive or negative relationship between variables.
The Pearson correlation for male students only was .10 with a level of significance of .30. This data failed to
reject the null hypothesis (H02) which stated that there would be no significant relationship between the average number of text messages male students sent and received per month and their formal writing performance on the
SAT writing section.
Scatterplot of Texting Volume and SAT Writing Scores for Female Students.
The dot cluster in the third test showed a negative relationship between variables. The Pearson correlation for
female students only was -.33 with a level of significance of .01. This data rejected the null hypothesis (H03), showing a significant negative relationship between the average number of text messages female students sent and
received per month and their formal writing performance on the SAT writing section.
Discussion
This research applied to other similar studies by building upon Plester’s assessment on texting and literacy by examining an older age group and cross-examining the age group of the study by Rosen and his colleagues.
Unlike Dr. Beverly Plester’s studies on younger children that showed a positive correlation between text message
volume and their competence with literacy and language (Plester, Wood, & Joshi, 2009, p. 158), this study on college students revealed mostly no positive correlation between text message volume and formal college writing
scores.

International Journal of Humanities and Social Science Vol. 2 No. 19 [Special Issue – October 2012]
7
The results of research question #3 in this study were more closely related to the study by Larry Rosen, Jennifer Chang, Lynne Erwin, L. Mark Carrier, and Nancy A. Cheever (2010) whose research showed a negative
correlation between texting volume and formal writing among young adults (p. 433). While two of the three tests
showed no significant correlation, the results of research question #3 in the present study indicated that a relationship may exist between the number of text messages female students sent and received on average (before
taking the SAT) and their formal writing performance on the SAT writing test.
For the analysis, the Pearson correlation for female students was -.33 with a level of significance of .01. This data may suggest that as female students mature beyond high school, the relationship between their text message
frequency and quality of formal writing performance decreases. At the very least, the study showed the negative
correlation between the SAT writing test and the average monthly volume of text messages for female students to be significant.
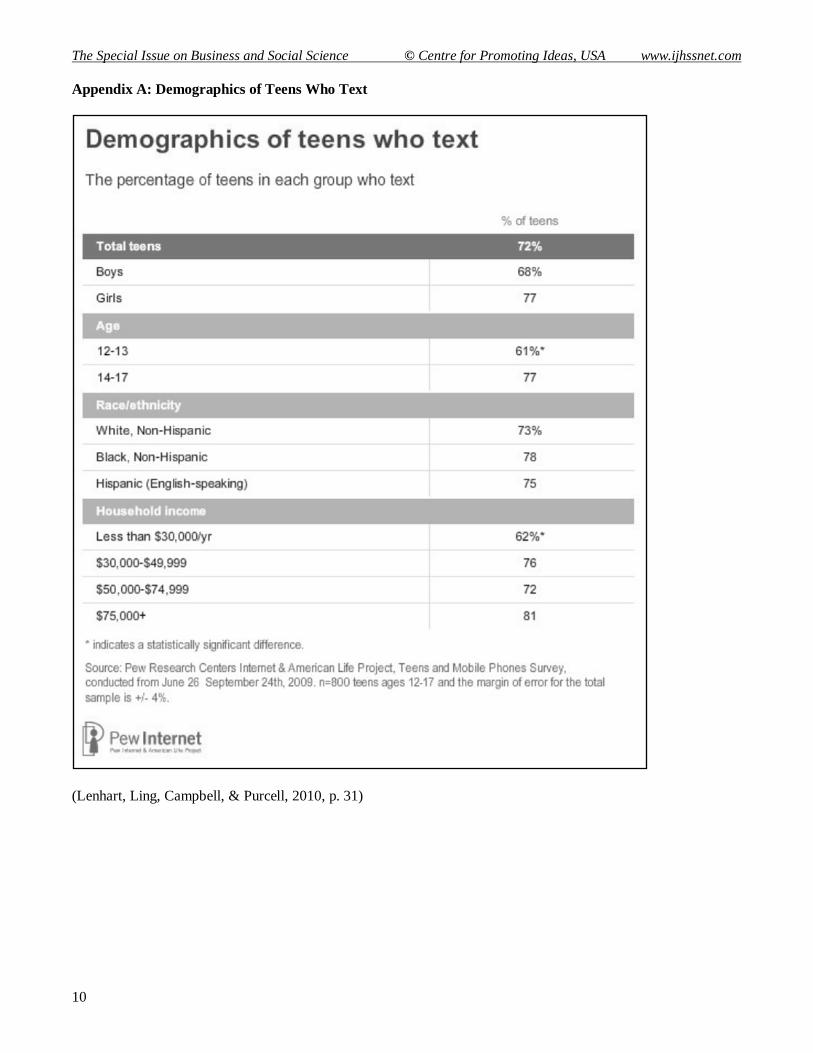
Lenhart, Ling, Campbell, and Purcell (2010) revealed that high school age females ―are the most active texters, with 14-17 year-old girls typically sending and receiving 100 text messages a day, or more than 3000 texts a
month‖ (p. 31). This was supported by Plester’s studies on younger students, which found that females
demonstrated a greater knowledge of textisms compared to males (Plester, Wood, & Joshi, 2009, p. 157).
The implications of the current study receive further support by Faulkner and Culwin’s study which showed that
the volume of text messaging tends to decline with age (Faulkner & Culwin, 2005, p. 180). Their study indicated that text messaging was more popular with females and that males had a tendency to send shorter text messages
than females (p. 181).
The study by Rosen and his colleagues found that females reported using more contextual and linguistic textisms
in comparison to males (p. 434). Their study indicated that ―those participants with some college who reported
sending more text messages demonstrated worse formal writing‖ (Rosen, Chang, Erwin, Carrier & Cheever, 2010, p. 433) and that ―the negative associations between texting and literacy … appear to moderate to some degree by
gender and by level of education in young adults‖ (p. 437).
A study of 151,316 students (54 percent female) by Krista D. Mattern, Brian F. Patterson, Emily J. Shaw, Jennifer L. Kobrin, and Sandra M. Barbuti (2008) revealed that ―females, on average, score higher on the SAT writing
section (SAT-W) (F = 557, M = 550)‖ (p. 5), which may account for there being no significant correlation
between text message frequency and SAT writing scores when examining males independently or males and females together. Drouin (2011) noted that:
These different samples have the potential to produce contradictory results, as do the different
methodologies used (e.g. literacy tasks and methods of analysis). Moreover, it is possible that the text messaging boom that has taken place in the United States in the last few years may have
affected the relationships between texting and literacy. (p. 72)
It is also possible that that as text messaging becomes more popular, that ―college students with greater
reading and spelling abilities may be using text messaging more frequently, or that those with poorer
literacy skills may be using text messaging less frequently‖ (Drouin, 2011, p. 72). There are so many
angles to approach on this subject matter that the research in this field has only just begun.
Limitations
The study had a number of limitations. First, it was targeted only toward freshman college students from one
institution. The students at this college were not the most ethnically diverse and were predominantly between the
ages of 18 and 24. Second, the study only averaged two months of text message volume during the two months
before the time students took the SAT for their monthly mean texting average in this correlation. These limitations were set to encourage student participation by not overwhelming them with a larger amount of data to
present to the researcher.
Further limitations included the fact that test results from the last time the students took the SAT exam could have
been up to two to three years old, at a time where the students may not have had a cell phone. The study was
limited in scope in that it only set out to seek a relationship between monthly text message volume and one
validated writing instrument with the SAT writing score.
The Special Issue on Business and Social Science © Centre for Promoting Ideas, USA www.ijhssnet.com
8
Other limitations included not examining the students’ text message sent and received totals separately, because at
the time of the study some providers did not separate these totals on their monthly statements. Also, the study did
not examine the students’ cell phone plans (e.g. the number of free talk minutes or any text message limits they may have been restricted to following each month). Lastly, the study did not examine the students’ cell phone
capabilities (e.g. whether they had a Blackberry, other smart phone, or a phone with a keyboard interface that
could result in easier texting).
Recommendations
This research is one of a small handful of studies just beginning to examine this new and rapidly growing
technology and its impact on the educational performance of students. The results showed a strong normal distribution in the SAT writing score test and a significant negative correlation between female students’ SAT
writing score and their number of average monthly text messages.
Because of the relatively small sample size of this study and the significant negative correlation found between
female students’ SAT writing score and number of average monthly text messages, future correlational studies
using the SAT writing score and gender are recommended. Some closely-related future studies on this subject could include comparing students’ average monthly text message volume to other validated writing tests, such as
the ACT (American College Test) COMPASS (Computerized Adaptive Placement Assessment & Support
System) exam.
Since this study only sought to find a relationship between its variables, continued studies could be conducted to
determine if one variable actually leads to the other and why. The concept of this study as a whole may
encourage future research on the correlation between the volume of various other types of technology usage and the quality of formal writing by both college students and younger children as well.
Summary
This study was significant to the subject in that it addressed the question that so many teachers, parents, and
students have about the potential relationship(s) between SMS technology and students’ formal writing skills in
the classroom: Is there a relationship between students’ average monthly volume of text messaging and their
formal writing performance? The results of the study may lead educators and students toward a greater understanding of how text messaging volume and a teenager’s writing development are related. This perspective could provide administrative insight
as to how text messaging should be managed and used by and within an educational institution. At the very least,
this synthesis of information and the findings of the research may help direct future studies on this subject.
Future correlational studies comparing formal writing scores and gender are recommended, as are continued
studies that attempt to determine if one variable leads to the other and why. Lastly, future studies could be
conducted in this area to seek a correlation between the volume of other types of technology use and educational performance measures by both college students and younger children alike.
International Journal of Humanities and Social Science Vol. 2 No. 19 [Special Issue – October 2012]
9
References
Buczynski, James A. (2008). Libraries begin to engage their menacing mobile phone hordes without shhhhh! Internet Reference Services Quarterly, 13(2/3), 261-269.
College Board. (2010). SAT validity studies. Retrieved from http://professionals.collegeboard.com/data-reports-
research/sat/validity-studies
Drouin, M. (2011). College students' text messaging, use of textese and literacy skills. Journal of Computer Assisted Learning, 27, 67–75.
Faulkner, X., & Culwin, F. (2005, March). When fingers do the talking: A study of text messaging. Interacting with Computers, 17(2), 167-185.
Flower, L. & Hayes, J. R. (1981, December). A cognitive process theory of writing. College Composition and
Communication, 32(4), 365-387. Retrieved from http://kdevries.net/teaching/teaching/wp-
content/uploads/2009/01/flower-hayes-81.pdf
Harley, D., Winn, S., Pemberton, S., & Wilcox, P. (2007, August). Using texting to support students' transition to
university. Innovations in Education & Teaching International, 44(3), 229-241.
Hill, J. B., Hill, C. M., & Sherman, D. (2007). Text messaging in an academic library: Integrating SMS into digital
reference. Reference Librarian, 47(97), 17-29.
Igarashi, T., Motoyoshi, T., Takai, J., & Yoshida, T. (2008, September). No mobile, no life: Self-perception and text-message dependency among Japanese high school students. Computers in Human Behavior, 24(5), 2311-2324.
Igarashi, T., Takai, J., & Yoshida, T. (2005, October). Gender differences in social network development via mobile
phone text messages: A longitudinal study. Journal of Social & Personal Relationships, 22(5), 691-713.
Lenhart, A., Ling, R., Campbell, S., & Purcell, K. (2010, April 20). Teens and mobile phones: Text messaging
explodes as teens embrace it as the centerpiece of their communication strategies with friends. Pew Research Center. Retrieved from http://www.pewinternet.org/~/media//Files/Reports/2010/PIP-Teens-and-Mobile-2010-with-topline.pdf
Lin, I-M., & Peper, E. (2009, March). Psychophysiological patterns during cell phone text messaging: A preliminary
study. Applied Psychophysiology & Biofeedback, 34(1), 53-57.
Lindley, D. (2008, November). Telecommunications: Teens who text. Communications of the ACM, 51(11), 19.
Marenco, A. (2011). When to use a particular statistical test. California State University: Northridge. Retrieved from
http://www.csun.edu/~amarenco/Fcs%20682/When%20to%20use%20what%20test.pdf
Mattern, K. D., Patterson, B. F., Shaw, E. J., Kobrin, J. L., & Barbuti, S. M. (2008). Differential validity and prediction of the SAT. Research Report No. 2008-4: College Board. Retrieved July 19, 2010, from
http://professionals.collegeboard.com/profdownload/Differential_Validity_and_Prediction_of_the_SAT.pdf
McWilliam, L., Schepman, A., & Rodway, P. (2009, July). The linguistic status of text message abbreviations: An
exploration using a Stroop task. Computers in Human Behavior, 25(4), 970-974.
Mills, R. (2010, June 22). Does using an internet based program for improving student performance in grammar and
punctuation really work in a college composition course? Education, 130(4). 652-656.
Naismith, L. (2007, July). Using text messaging to support administrative communication in higher education. Active Learning in Higher Education, 8(2), 155-171.
Plester, B., Wood, C.,& Bell, V. (2008, November). Txt msg n school literacy: Does texting and knowledge of text
abbreviations adversely affect children's literacy attainment? Literacy,42(3), 137-144. Retrieved from
http://www3.interscience .wiley.com.ezproxy.liberty.edu:2048/cgi-bin/fulltext/121481340/PDFSTART
Plester, B., Wood, C., & Joshi, P. (2009, March). Exploring the relationship between children's knowledge of text message abbreviations and school literacy outcomes. British Journal of Developmental Psychology, 27(1), 145-161.
Plester, B. & Wood, C. (2009, July). Exploring relationships between traditional and new media literacies: British
preteen texters at school. Journal of Computer-Mediated Communication, 14(4), 1108–1129. Retrieved from
http://onlinelibrary.wiley.com/doi/10.1111/j.1083-6101.2009.01483.x/pdf
Reid, D. J., & Reid, F. J. M. (2007, June). Text or talk? Social anxiety, loneliness, and divergent preferences for cell
phone use. CyberPsychology & Behavior, 10(3), 424-435.
Rosen, L., Chang, J., Erwin, L., Carrier, L. M., & Cheever, N. A. (2010). The relationship between ―textisms‖ and
formal and informal writing among young adults. Communication Research, 37(3) 420-440.
Taylor, A. S., & Harper, R. (2003). The gift of the gab: A design oriented sociology of young people's use of
mobiles. The Journal of Collaborative Computing, 12(3), 267-296.
The Nielsen Company. (2009, June). How teens use media: A Nielsen report on the myths and realities of teen media
trends. Retrieved from http://blog.nielsen.com/nielsenwire/reports/nielsen_howteensusemedia_june09.pdf
Vosloo, S. (2009, April). The effects of texting on literacy: Modern scourge or opportunity? Shuttleworth
Foundation. Retrieved from
http://citeseerx.ist.psu.edu/viewdoc/download?doi=10.1.1.175.2588&rep=rep1&type=pdf
The Special Issue on Business and Social Science © Centre for Promoting Ideas, USA www.ijhssnet.com
10
Appendix A: Demographics of Teens Who Text
(Lenhart, Ling, Campbell, & Purcell, 2010, p. 31)

International Journal of Humanities and Social Science Vol. 2 No. 19 [Special Issue – October 2012]
11
Appendix B: Voluntary Student Questionnaire
This questionnaire is being administered to collect data for Professor Brian Wardyga’s doctoral dissertation at
Liberty University.
Circle one answer each:
1. I am a: a) male b) female
2. My age is: a) 18 to 21 b) Over 21
3. My best SAT Writing Score was (number should be 200 – 800): __________ *If you do not recall your
SAT writing score, just leave it blank.
4. My total number of text messages (sent & received) during the 2 months before I took the SAT:
Month 1: _______________ Month 2: _______________
*If you do not have instant access to your text message totals, just call customer service right now at:
AT&T By Phone: 1-800-331-0500 or just dial 611 from your wireless phone
By Online Account: https://www.att.com/olam/registrationAction.olamexecute
Sprint By Phone: 1-888-211-4727 or just dial *2 from your wireless phone By Online Account: https://mysprint.sprint.com/mysprint/pages/sl/common/
createProfile.jsp?notMeClicked=true
T-Mobile By Phone: 1-877-453-1304 or just dial 611 from your wireless phone
By Online Account: https://my.t-mobile.com/Login/Registration.aspx
Verizon By Phone: 1-800-922-0204 or just dial 611 from your wireless phone By Online Account: https://myaccount.verizonwireless.com/accessmanager/
public/controller?action=displayRegistration&goto=
Informed Consent:
By signing below, I agree that above information is 100% accurate to my knowledge. I agree to provide electronic or printed proof of my text message totals. My signature provides Professor Wardyga with permission
to obtain or verify my SAT writing score from the Registrar’s Office. This informed consent assures students that
their info will be confidential, secure, used only for the purpose of this study, and will be destroyed properly at the
end of the study. Students have the option to discontinue the study at any time. Finally, your professor will not be aware of whose scores are being used and whose are not (i.e. participation in this study will not affect your
grades in this class).
Name (Print Clearly): ____________________________________________________________
Signature: ____________________________________________ Date: ___________________
Email Address: ________________________________________ Cell #: __________________
The Special Issue on Business and Social Science © Centre for Promoting Ideas, USA www.ijhssnet.com
12
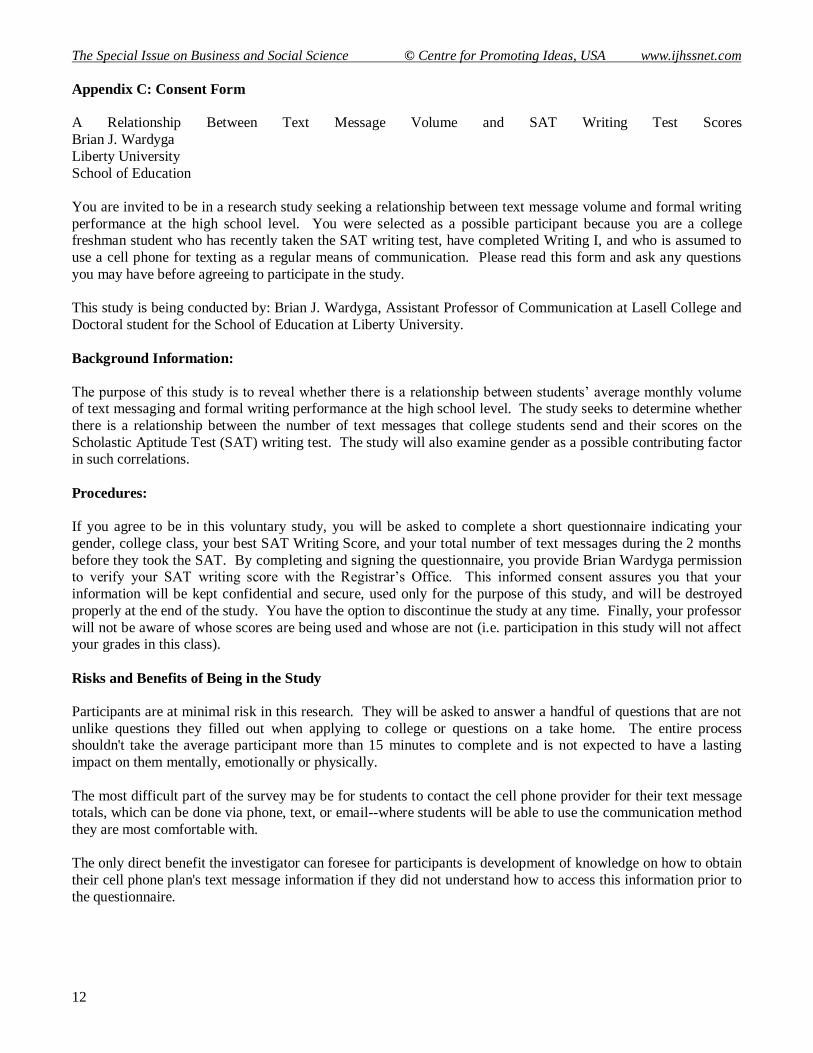
Appendix C: Consent Form
A Relationship Between Text Message Volume and SAT Writing Test Scores
Brian J. Wardyga
Liberty University
School of Education
You are invited to be in a research study seeking a relationship between text message volume and formal writing
performance at the high school level. You were selected as a possible participant because you are a college freshman student who has recently taken the SAT writing test, have completed Writing I, and who is assumed to
use a cell phone for texting as a regular means of communication. Please read this form and ask any questions
you may have before agreeing to participate in the study.
This study is being conducted by: Brian J. Wardyga, Assistant Professor of Communication at Lasell College and
Doctoral student for the School of Education at Liberty University.
Background Information:
The purpose of this study is to reveal whether there is a relationship between students’ average monthly volume of text messaging and formal writing performance at the high school level. The study seeks to determine whether
there is a relationship between the number of text messages that college students send and their scores on the
Scholastic Aptitude Test (SAT) writing test. The study will also examine gender as a possible contributing factor in such correlations.
Procedures:
If you agree to be in this voluntary study, you will be asked to complete a short questionnaire indicating your
gender, college class, your best SAT Writing Score, and your total number of text messages during the 2 months
before they took the SAT. By completing and signing the questionnaire, you provide Brian Wardyga permission to verify your SAT writing score with the Registrar’s Office. This informed consent assures you that your
information will be kept confidential and secure, used only for the purpose of this study, and will be destroyed
properly at the end of the study. You have the option to discontinue the study at any time. Finally, your professor
will not be aware of whose scores are being used and whose are not (i.e. participation in this study will not affect your grades in this class).
Risks and Benefits of Being in the Study
Participants are at minimal risk in this research. They will be asked to answer a handful of questions that are not
unlike questions they filled out when applying to college or questions on a take home. The entire process shouldn't take the average participant more than 15 minutes to complete and is not expected to have a lasting
impact on them mentally, emotionally or physically.
The most difficult part of the survey may be for students to contact the cell phone provider for their text message totals, which can be done via phone, text, or email--where students will be able to use the communication method
they are most comfortable with.
The only direct benefit the investigator can foresee for participants is development of knowledge on how to obtain
their cell phone plan's text message information if they did not understand how to access this information prior to
the questionnaire.

International Journal of Humanities and Social Science Vol. 2 No. 19 [Special Issue – October 2012]
13
This study would benefit society in the following ways:
1. It would address the question that so many teachers, parents, and students have about the potential
relationship(s) between SMS technology and students’ formal writing skills in the classroom.
2. The study would lead educators and students to a greater understanding of how text messaging volume may
relate to a teenager’s writing development and ability to effectively present him or herself through writing.
3. It would provide administrative insight as to how text messaging should be managed by the school; e.g. should
it be encouraged or banned from the classroom?
4. It can be of value in solving the problem by providing theories about the relationship(s) to be tested with
further research. For example, if a relationship were to be found between high text message volume and low
writing scores, studies could be conducted to determine if one variable leads to the other.
5. It would encourage future studies such as the association between the frequency and/or volume of technology
usage and the quality of formal writing by students of all ages.
Confidentiality:
The records of this study will be kept private. In any sort of report the investigator might publish, he will not
include any information that will make it possible to identify a subject. Research records will be stored securely
and only the investigator will have access to the records. All data will be collected in person by only the
investigator and stored in a lockable file cabinet and/or password protected electronic database. Careful attention will be made to not link survey information to participant identity.
Once the text message data is paired with the formal writing data, all electronic data containing participants'
names will be both deleted and electronically shredded within a 3-year period after the study, while hard copy data with participants' names will be physically shredded and disposed in the same timeframe.
Voluntary Nature of the Study:
Participation in this study is voluntary. Your decision whether or not to participate will not affect your current or
future relations with the Liberty University or Lasell College. If you decide to participate, you are free to not
answer any question or withdraw at any time without affecting those relationships.
Contacts and Questions:
The researcher conducting this study is Brian J. Wardyga. You may ask any questions you have now. If you
have questions later, you are encouraged to contact Brian at his office […], by phone at […], or by email at […].
If you have any questions or concerns regarding this study and would like to talk to someone other than the researcher(s), you are encouraged to contact the Institutional Review Board, Dr. Fernando Garzon, Chair, 1971
University Blvd, Suite 1582, Lynchburg, VA 24502 or email at […].
You will be given a copy of this information to keep for your records.
Statement of Consent:
I have read and understood the above information. I have asked questions and have received answers. I consent to
participate in the study.
Participant Signature: _____________________________ Date: ______________
Signature of Investigator: __________________________ Date: ______________

The Special Issue on Business and Social Science © Centre for Promoting Ideas, USA www.ijhssnet.com
14
Appendix D: Participant Data Omitted Due to Missing and/or Non-Validated Monthly Text Message Totals
SAT:
Respondent ID Gender Month A1 Month A2 Txt Mean (A)
SAT
Writing
1666784981 female 1500 2000 1750.0 480
1664614116 male 1432 1413 1422.5 n/a
1664577180 female 200 300 250.0 n/a
1664500271 male 53 41 47.0 n/a
1664080537 female 10000 11000 10500.0 n/a
1663856402 female 12000 10000 11000.0 530
1662884743 female Over 1000 Over 1000 n/a 490
1662867099 female 250 400 325.0 n/a
1662615805 male 1234 900 1067.0 n/a
1662517280 male don't know don't know n/a 480
1662347810 female 500 600 550.0 n/a
1662308072 male 988 1192 1090.0 n/a
1662296297 female 986 998 992.0 n/a
1662278839 male 1300 1800 1550.0 480
1635101158 female n/a n/a n/a n/a
1630517598 female 978 1124 1051.0 400
1629961378 male 41 36 38.5 410
1629604181 female 1058 997 1027.5 n/a
1629523408 female 846 1241 1043.5 340
1629453277 male 0 0 0.0
1628711892 female 1014 974 994.0 n/a
1628685403 female 298 405 351.5 590
1628641362 male 97 153 125.0 480
1628605696 female 4719 5297 5008.0 n/a
1628596745 female 0 0 0.0 n/a
1628588080 male 393 435 414.0 n/a
1628585635 female 288 225 256.5 580
1628543122 female 1000 1000 1000.0 440
International Journal of Humanities and Social Science Vol. 2 No. 19 [Special Issue – October 2012]
15
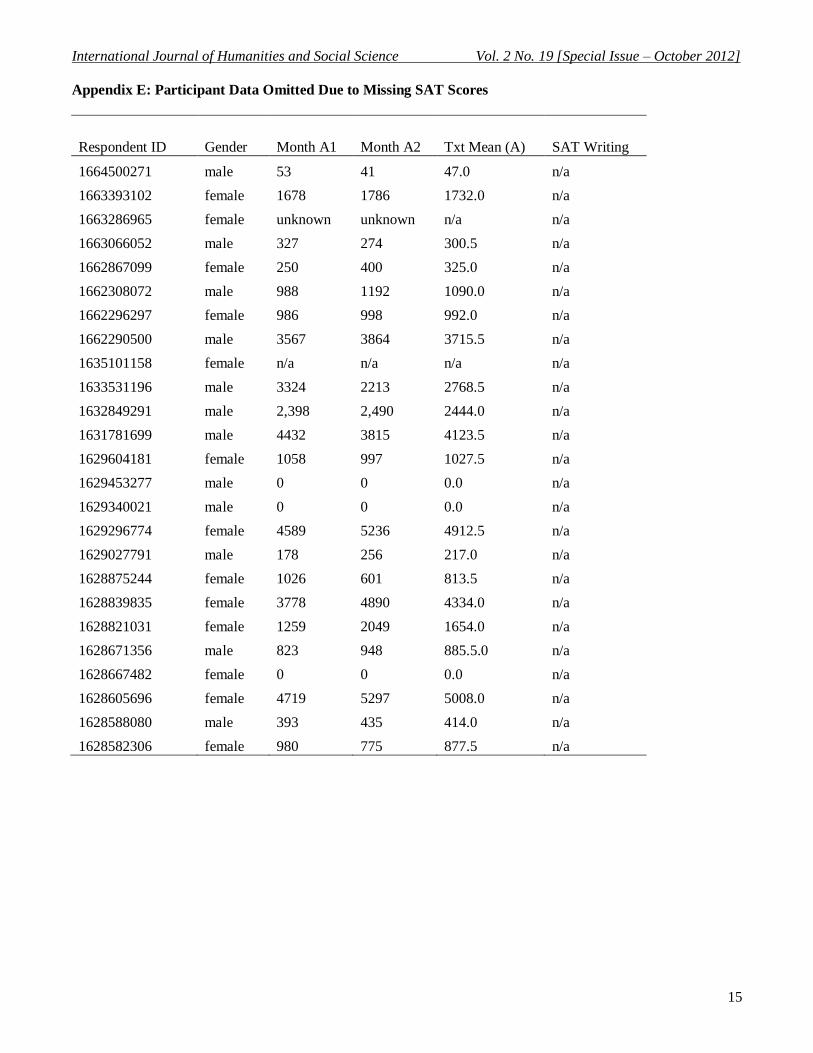
Appendix E: Participant Data Omitted Due to Missing SAT Scores
Respondent ID Gender Month A1 Month A2 Txt Mean (A) SAT Writing
1664500271 male 53 41 47.0 n/a
1663393102 female 1678 1786 1732.0 n/a
1663286965 female unknown unknown n/a n/a
1663066052 male 327 274 300.5 n/a
1662867099 female 250 400 325.0 n/a
1662308072 male 988 1192 1090.0 n/a
1662296297 female 986 998 992.0 n/a
1662290500 male 3567 3864 3715.5 n/a
1635101158 female n/a n/a n/a n/a
1633531196 male 3324 2213 2768.5 n/a
1632849291 male 2,398 2,490 2444.0 n/a
1631781699 male 4432 3815 4123.5 n/a
1629604181 female 1058 997 1027.5 n/a
1629453277 male 0 0 0.0 n/a
1629340021 male 0 0 0.0 n/a
1629296774 female 4589 5236 4912.5 n/a
1629027791 male 178 256 217.0 n/a
1628875244 female 1026 601 813.5 n/a
1628839835 female 3778 4890 4334.0 n/a
1628821031 female 1259 2049 1654.0 n/a
1628671356 male 823 948 885.5.0 n/a
1628667482 female 0 0 0.0 n/a
1628605696 female 4719 5297 5008.0 n/a
1628588080 male 393 435 414.0 n/a
1628582306 female 980 775 877.5 n/a
The Special Issue on Business and Social Science © Centre for Promoting Ideas, USA www.ijhssnet.com
16
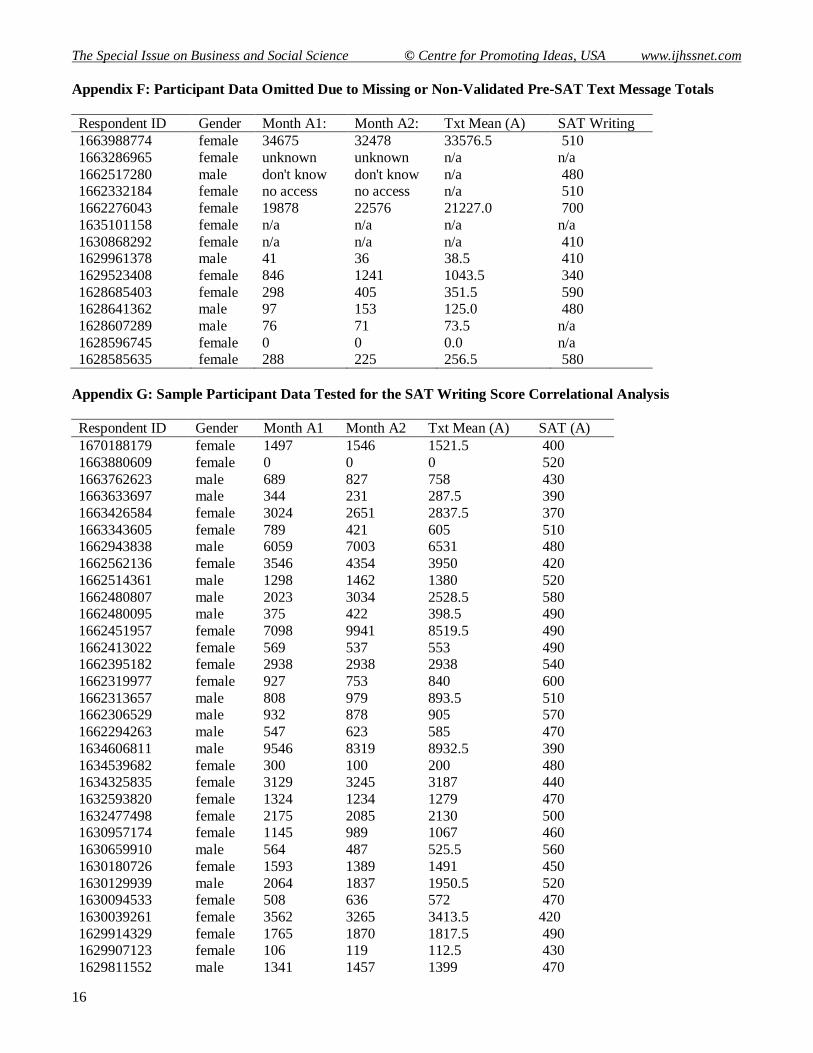
Appendix F: Participant Data Omitted Due to Missing or Non-Validated Pre-SAT Text Message Totals
Respondent ID Gender Month A1: Month A2: Txt Mean (A) SAT Writing
1663988774 female 34675 32478 33576.5 510
1663286965 female unknown unknown n/a n/a
1662517280 male don't know don't know n/a 480 1662332184 female no access no access n/a 510
1662276043 female 19878 22576 21227.0 700
1635101158 female n/a n/a n/a n/a
1630868292 female n/a n/a n/a 410 1629961378 male 41 36 38.5 410
1629523408 female 846 1241 1043.5 340
1628685403 female 298 405 351.5 590 1628641362 male 97 153 125.0 480
1628607289 male 76 71 73.5 n/a
1628596745 female 0 0 0.0 n/a 1628585635 female 288 225 256.5 580
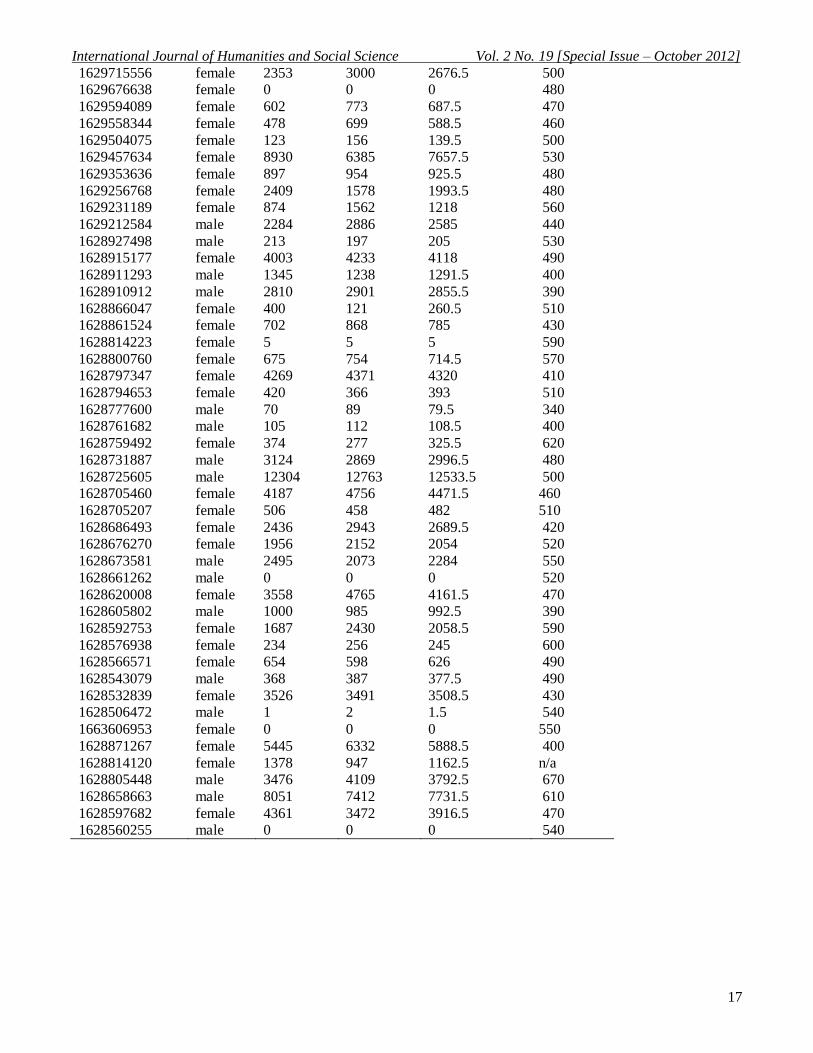
Appendix G: Sample Participant Data Tested for the SAT Writing Score Correlational Analysis
Respondent ID Gender Month A1 Month A2 Txt Mean (A) SAT (A)
1670188179 female 1497 1546 1521.5 400
1663880609 female 0 0 0 520
1663762623 male 689 827 758 430 1663633697 male 344 231 287.5 390
1663426584 female 3024 2651 2837.5 370
1663343605 female 789 421 605 510 1662943838 male 6059 7003 6531 480
1662562136 female 3546 4354 3950 420
1662514361 male 1298 1462 1380 520
1662480807 male 2023 3034 2528.5 580 1662480095 male 375 422 398.5 490
1662451957 female 7098 9941 8519.5 490
1662413022 female 569 537 553 490 1662395182 female 2938 2938 2938 540
1662319977 female 927 753 840 600
1662313657 male 808 979 893.5 510 1662306529 male 932 878 905 570
1662294263 male 547 623 585 470
1634606811 male 9546 8319 8932.5 390
1634539682 female 300 100 200 480 1634325835 female 3129 3245 3187 440
1632593820 female 1324 1234 1279 470
1632477498 female 2175 2085 2130 500 1630957174 female 1145 989 1067 460
1630659910 male 564 487 525.5 560
1630180726 female 1593 1389 1491 450
1630129939 male 2064 1837 1950.5 520 1630094533 female 508 636 572 470
1630039261 female 3562 3265 3413.5 420
1629914329 female 1765 1870 1817.5 490 1629907123 female 106 119 112.5 430
1629811552 male 1341 1457 1399 470
International Journal of Humanities and Social Science Vol. 2 No. 19 [Special Issue – October 2012]
17
1629715556 female 2353 3000 2676.5 500 1629676638 female 0 0 0 480
1629594089 female 602 773 687.5 470
1629558344 female 478 699 588.5 460
1629504075 female 123 156 139.5 500 1629457634 female 8930 6385 7657.5 530
1629353636 female 897 954 925.5 480
1629256768 female 2409 1578 1993.5 480 1629231189 female 874 1562 1218 560
1629212584 male 2284 2886 2585 440
1628927498 male 213 197 205 530 1628915177 female 4003 4233 4118 490
1628911293 male 1345 1238 1291.5 400
1628910912 male 2810 2901 2855.5 390
1628866047 female 400 121 260.5 510 1628861524 female 702 868 785 430
1628814223 female 5 5 5 590
1628800760 female 675 754 714.5 570 1628797347 female 4269 4371 4320 410
1628794653 female 420 366 393 510
1628777600 male 70 89 79.5 340 1628761682 male 105 112 108.5 400
1628759492 female 374 277 325.5 620
1628731887 male 3124 2869 2996.5 480
1628725605 male 12304 12763 12533.5 500 1628705460 female 4187 4756 4471.5 460
1628705207 female 506 458 482 510
1628686493 female 2436 2943 2689.5 420 1628676270 female 1956 2152 2054 520
1628673581 male 2495 2073 2284 550
1628661262 male 0 0 0 520
1628620008 female 3558 4765 4161.5 470 1628605802 male 1000 985 992.5 390
1628592753 female 1687 2430 2058.5 590
1628576938 female 234 256 245 600 1628566571 female 654 598 626 490
1628543079 male 368 387 377.5 490
1628532839 female 3526 3491 3508.5 430 1628506472 male 1 2 1.5 540
1663606953 female 0 0 0 550
1628871267 female 5445 6332 5888.5 400
1628814120 female 1378 947 1162.5 n/a 1628805448 male 3476 4109 3792.5 670
1628658663 male 8051 7412 7731.5 610
1628597682 female 4361 3472 3916.5 470 1628560255 male 0 0 0 540
Related Documents