A regional modeling study of the entraining Mediterranean outflow X. Xu, 1,2 E. P. Chassignet, 3 J. F. Price, 4 T. M. O ¨ zgo ¨kmen, 1 and H. Peters 1 Received 5 February 2007; revised 25 July 2007; accepted 5 September 2007; published 12 December 2007. [1] We have evaluated a regional-scale simulation of the Mediterranean outflow by comparison with field data obtained in the 1988 Gulf of Ca ´diz Expedition. Our ocean model is based upon the Hybrid Coordinate Ocean Model (HYCOM) and includes the Richardson number–dependent entrainment parameterization of Xu et al. (2006). Given realistic topography and sufficient resolution, the model reproduces naturally the major, observed features of the Mediterranean outflow in the Gulf of Ca ´diz: the downstream evolution of temperature, salinity, and velocity profiles, the mean path and the spreading of the outflow plume, and most importantly, the localized, strong entrainment that has been observed to occur just west of the Strait of Gibraltar. As in all numerical solutions, there is some sensitivity to horizontal and vertical resolution. When the resolution is made coarser, the simulated currents are less vigorous and there is consequently less entrainment. Our Richardson number – dependent entrainment parameterization is therefore not recommended for direct application in coarse-resolution climate models. We have used the high-resolution regional model to investigate the response of the Mediterranean outflow to a change in the freshwater balance over the Mediterranean basin. The results are found in close agreement with the marginal sea boundary condition (MSBC): A more saline and dense Mediterranean deep water generates a significantly greater volume transport of the Mediterranean product water having only very slightly greater salinity. Citation: Xu, X., E. P. Chassignet, J. F. Price, T. M. O ¨ zgo ¨kmen, and H. Peters (2007), A regional modeling study of the entraining Mediterranean outflow, J. Geophys. Res., 112, C12005, doi:10.1029/2007JC004145. 1. Introduction [2] The Mediterranean Sea is a semienclosed marginal basin in which strong evaporation exceeds the sum of precipitation and river runoff, thus transforming the rela- tively fresh North Atlantic surface water (salinity S of 36.1) into the salty and dense Mediterranean water (S of 38.45 and potential density s q of 28.95 kg m 3 )[Wu ¨st, 1961]. As this dense water mass spreads into the North Atlantic Ocean, it mixes with the surrounding waters, creating a warm and saline tongue of water at an intermediate depth of about 1100 m that can be traced throughout the entire subtropics [Levitus and Boyer, 1994]. Moreover, the impact of the Mediterranean outflow water (MOW hereafter) extends well beyond the subtropics of the North Atlantic Ocean and the intermediate depth. Through either indirect or direct routes, the MOW is responsible for supplying salt to the near surface water that ultimately flows into the Nordic Seas and influences the deep water formation there [Reid, 1979, 1994; Iorga and Lozier, 1999a, 1999b; McCartney and Mauritzen, 2001; Bower et al., 2002]. Therefore studying the Mediterranean outflow is important for understanding not only the water properties and circulation in the subsurface of the eastern North Atlantic, but also the meridional overturning circulation in the entire Atlantic basin. [3] The circulation and evolution of the MOW begins as a bottom-trapped gravity current flowing out the Strait of Gibraltar. This dense water plume descends the Iberian continental slope, on which bottom topography, earth rota- tion, and bottom friction play a key role in controlling the plume pathway [Ochoa and Bray , 1991; Madelain, 1970; Smith, 1975; Zenk, 1975; Johnson et al., 1994a, 1994b; Price and Baringer, 1994]. At the upper interface of the outflow plume, the entrainment of North Atlantic Central Water (NACW hereafter) increases the volume transport and consequently reduces the density contrast between the MOW and the ambient water [Ambar and Howe, 1979a, 1979b; Baringer and Price, 1997a, 1997b; Price et al., 1993; Zenk and Armi, 1990]. The outflow plume shows the spatial variations and multicore features at about 7°W [e.g., Zenk, 1970; Ambar and Howe, 1979a; Ambar, 1983; Ambar et al., 2002]. The variations have usually been attributed to JOURNAL OF GEOPHYSICAL RESEARCH, VOL. 112, C12005, doi:10.1029/2007JC004145, 2007 1 Division of Meteorology and Physical Oceanography, Rosenstiel School of Marine and Atmospheric Science, University of Miami, Miami, Florida, USA. 2 Now at Department of Marine Science, University of Southern Mississippi, Stennis Space Center, Mississippi, USA. 3 Center for Ocean-Atmospheric Prediction Studies, Florida State University, Tallahassee, Florida, USA. 4 Physical Oceanography Department, Woods Hole Oceanographic Institution, Woods Hole, Massachusetts, USA. Copyright 2007 by the American Geophysical Union. 0148-0227/07/2007JC004145 C12005 1 of 20

Welcome message from author
This document is posted to help you gain knowledge. Please leave a comment to let me know what you think about it! Share it to your friends and learn new things together.
Transcript
A regional modeling study of the entraining
Mediterranean outflow
X. Xu,1,2 E. P. Chassignet,3 J. F. Price,4 T. M. Ozgokmen,1 and H. Peters1
Received 5 February 2007; revised 25 July 2007; accepted 5 September 2007; published 12 December 2007.
[1] We have evaluated a regional-scale simulation of the Mediterranean outflow bycomparison with field data obtained in the 1988 Gulf of Cadiz Expedition. Our oceanmodel is based upon the Hybrid Coordinate Ocean Model (HYCOM) and includes theRichardson number–dependent entrainment parameterization of Xu et al. (2006). Givenrealistic topography and sufficient resolution, the model reproduces naturally the major,observed features of the Mediterranean outflow in the Gulf of Cadiz: the downstreamevolution of temperature, salinity, and velocity profiles, the mean path and the spreadingof the outflow plume, and most importantly, the localized, strong entrainment that hasbeen observed to occur just west of the Strait of Gibraltar. As in all numerical solutions,there is some sensitivity to horizontal and vertical resolution. When the resolution is madecoarser, the simulated currents are less vigorous and there is consequently lessentrainment. Our Richardson number–dependent entrainment parameterization istherefore not recommended for direct application in coarse-resolution climate models. Wehave used the high-resolution regional model to investigate the response of theMediterranean outflow to a change in the freshwater balance over the Mediterraneanbasin. The results are found in close agreement with the marginal sea boundary condition(MSBC): A more saline and dense Mediterranean deep water generates a significantlygreater volume transport of the Mediterranean product water having only very slightlygreater salinity.
Citation: Xu, X., E. P. Chassignet, J. F. Price, T. M. Ozgokmen, and H. Peters (2007), A regional modeling study of the entraining
Mediterranean outflow, J. Geophys. Res., 112, C12005, doi:10.1029/2007JC004145.
1. Introduction
[2] The Mediterranean Sea is a semienclosed marginalbasin in which strong evaporation exceeds the sum ofprecipitation and river runoff, thus transforming the rela-tively fresh North Atlantic surface water (salinity S of 36.1)into the salty and dense Mediterranean water (S of 38.45and potential density sq of 28.95 kg m�3) [Wust, 1961]. Asthis dense water mass spreads into the North AtlanticOcean, it mixes with the surrounding waters, creating awarm and saline tongue of water at an intermediate depth ofabout 1100 m that can be traced throughout the entiresubtropics [Levitus and Boyer, 1994]. Moreover, the impactof the Mediterranean outflow water (MOW hereafter)extends well beyond the subtropics of the North AtlanticOcean and the intermediate depth. Through either indirect
or direct routes, the MOW is responsible for supplying saltto the near surface water that ultimately flows into theNordic Seas and influences the deep water formation there[Reid, 1979, 1994; Iorga and Lozier, 1999a, 1999b;McCartney and Mauritzen, 2001; Bower et al., 2002].Therefore studying the Mediterranean outflow is importantfor understanding not only the water properties andcirculation in the subsurface of the eastern North Atlantic,but also the meridional overturning circulation in the entireAtlantic basin.[3] The circulation and evolution of the MOW begins as a
bottom-trapped gravity current flowing out the Strait ofGibraltar. This dense water plume descends the Iberiancontinental slope, on which bottom topography, earth rota-tion, and bottom friction play a key role in controlling theplume pathway [Ochoa and Bray, 1991; Madelain, 1970;Smith, 1975; Zenk, 1975; Johnson et al., 1994a, 1994b;Price and Baringer, 1994]. At the upper interface of theoutflow plume, the entrainment of North Atlantic CentralWater (NACW hereafter) increases the volume transportand consequently reduces the density contrast between theMOW and the ambient water [Ambar and Howe, 1979a,1979b; Baringer and Price, 1997a, 1997b; Price et al.,1993; Zenk and Armi, 1990]. The outflow plume shows thespatial variations and multicore features at about 7�W [e.g.,Zenk, 1970; Ambar and Howe, 1979a; Ambar, 1983; Ambaret al., 2002]. The variations have usually been attributed to
JOURNAL OF GEOPHYSICAL RESEARCH, VOL. 112, C12005, doi:10.1029/2007JC004145, 2007
1Division of Meteorology and Physical Oceanography, RosenstielSchool of Marine and Atmospheric Science, University of Miami, Miami,Florida, USA.
2Now at Department of Marine Science, University of SouthernMississippi, Stennis Space Center, Mississippi, USA.
3Center for Ocean-Atmospheric Prediction Studies, Florida StateUniversity, Tallahassee, Florida, USA.
4Physical Oceanography Department, Woods Hole OceanographicInstitution, Woods Hole, Massachusetts, USA.
Copyright 2007 by the American Geophysical Union.0148-0227/07/2007JC004145
C12005 1 of 20
differential mixing with NACW [Baringer and Price,1997a, 1997b; Iorga and Lozier, 1999a]. An importanttransition in plume behavior, from a bottom-trapped densitycurrent to a wall-bounded jet, the MOW undercurrent,occurs to the west of about 8�W. Downstream from thispoint the plume becomes equilibrated in the water columnand continues westward at intermediate depths. Furtherdownstream at Cape St. Vincent, the bottom topographyabruptly changes direction, and the flow separation from thebottom slope promotes the generation of MOWanticyclonicvortices (so-called Meddies [McDowell and Rossby, 1978;Bower et al., 1997]). Beyond the Cape, the undercurrentgenerally separates into two main branches flowing north-ward and westward [Daniault et al., 1994].[4] Reproducing the circulation and the evolution of
MOW in oceanic general circulation models (OGCMs) isa challenge. This is due not only to the high computationalcost in resolving the small topographic and geographicfeatures associated with the MOW, but also to the difficultyof accurately prescribing the entrainment process in theoutflow, the key process in determining the final waterproperties, the volume flux, and the equilibrium depth ofMOW when spreading into the North Atlantic Ocean. Thedifficulty of outflow representation depends strongly on thechoice of vertical coordinates [Griffies et al., 2000]. Byconstruction, there is no numerically induced diapycnalmixing in isopycnic coordinate models, and the entrainmentcan be precisely controlled. Furthermore, these modelsnaturally provide efficient vertical resolution by migratingisopycnals to the pycnocline atop the outflow plume.[5] The finding by Chang et al. [2005], that the param-
eterization of Hallberg [2000] is too strong and the interiormixing induced by shear instability in the K-profile param-eterization (KPP) [Large et al., 1994, 1997] is too weak foraccurately representing the entrainment process in gravitycurrents, led Xu et al. [2006] to develop a new algebraicentrainment parameterization. The parameterization caststhe entrainment as a function of the layer Richardsonnumber (Ri) times the velocity difference across layers. Todetermine the function f (Ri), simulations of generic gravitycurrents over various bottom slope angles were carried outwith the hydrostatic Hybrid Coordinate Ocean Model(HYCOM), and compared to similarly configured experi-ments using a high-resolution, three-dimensional, nonhy-drostatic model, which serves as a ground truth. A simplelinear function, f (Ri) = 0.2 (1 � Ri/0.25) with Ri < 0.25,was found to reproduce entrainment, salt flux, Richardsonnumber, velocity profiles, and plume propagation well incomparison with the nonhydrostatic simulations. This pa-rameterization, though extremely simple, is also consistentwith the theoretical and laboratory results from stablystratified shear flows in that the shear-induced turbulencegrows (decays) in the regime of Ri < 0.25 (Ri > 0.25),respectively [e.g., Miles, 1961; Rohr et al., 1988]. Whenapplied to a regional model of the Mediterranean outflow,the Xu et al. [2006] parameterization produced a betterequilibrium depth of the MOW in the Gulf of Cadiz than theparameterizations of Hallberg [2000] and KPP.[6] The representation of marginal sea outflows in cli-
mate models is a challenge given that climate modelstypically have a horizontal grid size of 1� or more. Thishorizontal grid spacing is one order of magnitude larger
than is required to explicitly resolve the width of the narrowoutflow passages. An alternative method of outflow repre-sentation in climate models was suggested by Price andYang [1998] and termed the marginal sea boundary condi-tion, or MSBC. As the name implies, the MSBC collapsesthe deep water formation processes (exchange between themarginal sea and the open ocean, descent and entrainmentof the outflow on the continental slope) into what amountsto a side-wall boundary condition for an OGCM. Thisapproach to modeling deep water formation by a marginalsea is appropriate from an oceanic perspective since theoutflow water mass transformation takes place within onegrid cell of a typical ocean climate model. In MSBC, ahydraulic model converts the surface inflow of open oceanwater into an outflow source water; and a rotating, entrain-ing density current model then transforms the source waterinto the final outflow product water by entraining oceanicwater.[7] This study has three aims. The first is to evaluate how
well the algebraic entrainment parameterization of Xu et al.[2006] is able to reproduce the observed outflow whenincluded in a well-resolved numerical, regional simulationof the Mediterranean outflow. This is achieved byperforming a detailed model-data comparison, focusing onthe question of whether the simulation can reproduce thelocalized entrainment immediately west of the Strait of theGibraltar as well as the evolution of MOW in the Gulf ofCadiz. The second aim of this study is to investigate howsensitive this parameterization is to the horizontal andvertical resolutions used in the model. This is an importantquestion because the regional, basin-scale, and global cli-mate models typically use very different resolution andeddy viscosity, and will therefore have different densitygradient and velocity shear, and thus Ri. The result is likelyto be quite different. The third aim is to compare theHYCOM regional model and the MSBC to learn howsimulated MOW product water changes when the waterproperties in the deep Mediterranean Sea are changed. Thiscomparison can be regarded as an interim test for MSBC tothe extent that the HYCOM simulation contains far fewermodeling assumptions. It may also be viewed as an attemptto understand/forecast the change in MOW induced by longtimescale variations over the Mediterranean Sea or else-where in the North Atlantic Ocean; see Curry et al. [2003]for documented changes in salinity over the North Atlantic.[8] The paper is organized as follows. Sections 2 and 3
briefly present the observational data and the numericalmodel configuration, respectively. The numerical results arecompared in detail to the observations in sections 4, 5, and6. The sensitivity of the modeled results to the horizontaland vertical resolutions is investigated in section 7. Thesensitivity of the MOW product water to a water propertychange in outflow source water and ambient oceanic wateris explored in section 8. Finally, the paper concludes with asummary and discussion.
2. Observational Data
[9] The observational data used in this study are obtainedfrom the 1988 Gulf of Cadiz Expedition survey [Price et al.,1993]. This survey primarily focused on the descent andmixing of the Mediterranean outflow as it spreads into the
C12005 XU ET AL.: MODELING MOW
2 of 20
C12005
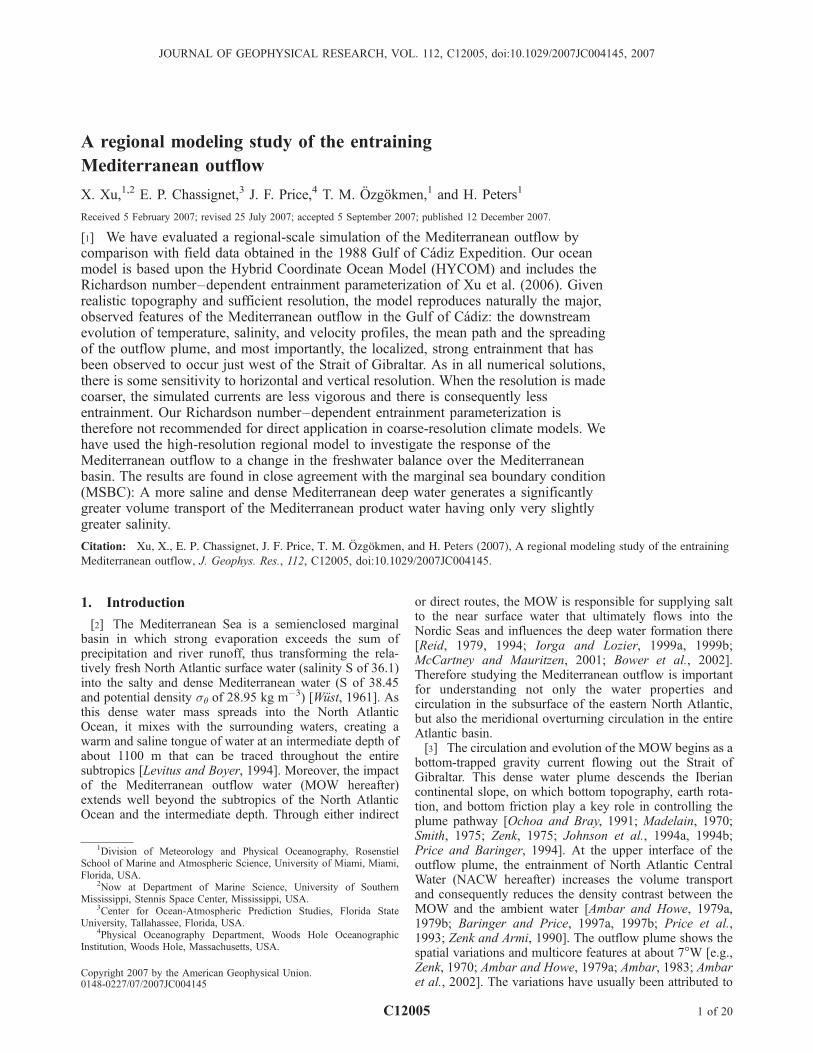
Gulf of Cadiz, particularly the first 100 km of the pathwhere the mixing was shown to be most intense. It thereforeprovides an excellent data set that can be used to evaluateour numerical simulations. The observational data that willbe used in the comparison includes 120 CTD profiles and79 in situ horizontal current profiles gathered with the XCP(expendable current profiler). Figure 1 shows the location ofthe stations. The CTD stations were laid out in 11 sections,labeled from A to K, with section I along the axis of thestrait and the rest approximately normal to the outflow inthe gulf. The XCPs were deployed throughout sections Athrough F whenever CTD casts indicated the presence ofsalty MOW. The repeat profiles in sections A, B, and Cshow remarkably similar velocity and density structurewithin the plume, implying a negligible tidal influenceand a steady plume signature. Analysis of this data set hasappeared in work by Baringer [1993], Price et al. [1993],Johnson et al. [1994a, 1994b], and Baringer and Price[1997a].[10] Additional field data including mean velocity pro-
files obtained from measurements within the Strait ofGibraltar are used to assess the exchange between the NorthAtlantic and the Mediterranean. One set of velocity profiles
was obtained from two moorings deployed at Gibraltar’smain sill between October 1985 and October 1986 duringthe Gibraltar Experiment (GibEx) [Bryden et al., 1994]. Asecond set was obtained at a nearby location during October1994 to October 1996 with one mooring with a bottom-mounted, upward-looking Acoustic Doppler Current Profil-er (ADCP), capable of measuring the velocity of the entirewater column with a vertical resolution of 10 m [Candela,2001].
3. Model Configuration and Exchange Throughthe Strait of Gibraltar
3.1. Model Configuration
[11] The general circulation model used in this study isthe Hybrid Coordinate Ocean Model (HYCOM) [Bleck,2002; Chassignet et al., 2003; Halliwell, 2004]. The verticalcoordinate in HYCOM is isopycnal in the open, stratifiedocean and smoothly changes over to terrain-following inshallow coastal regions and to fixed depth level in thesurface mixed layer and/or unstratified seas. In doing so,the model combines the advantages of different coordinatein optimally simulating coastal and open ocean circulationfeatures. In our application, the outflow plume is primarilyresolved with isopycnic coordinates.[12] The regional model is configured with an horizontal
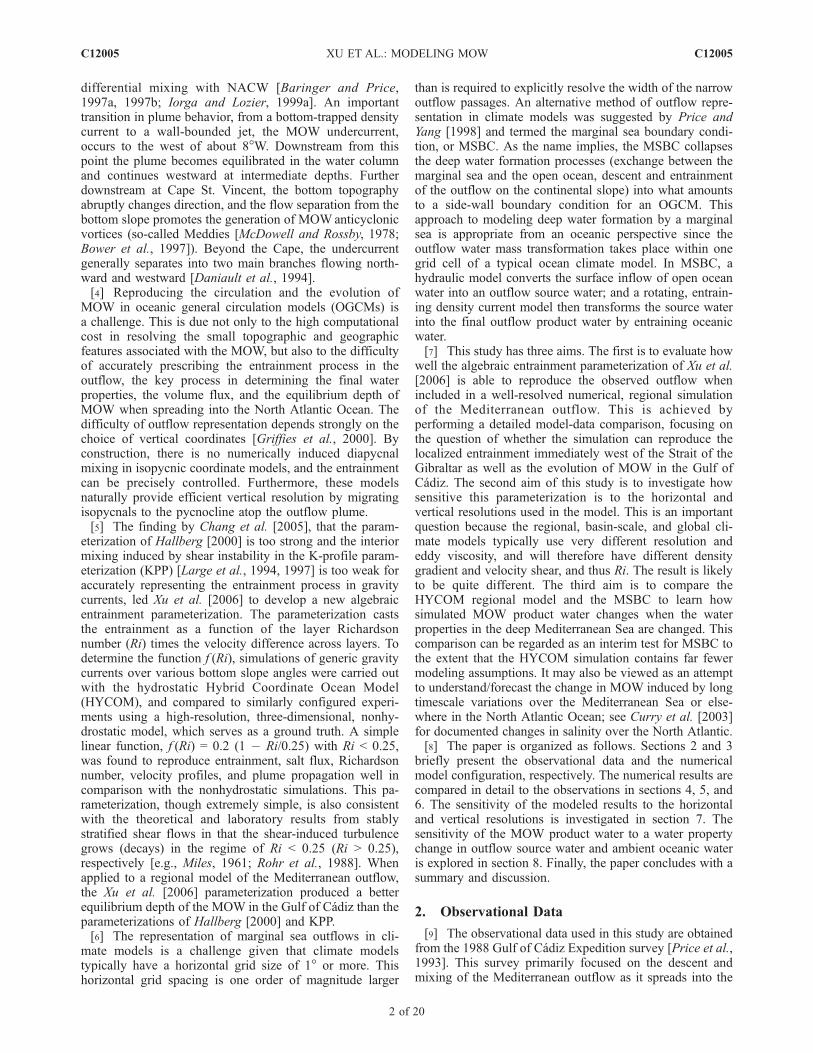
grid resolution of 0.08� (approx. 7 km). The computationaldomain (13.0 � 3.08�W, 34.2 � 40.6�N; see Figure 2)includes the northeast Atlantic Ocean, the Gulf of Cadiz, theStrait of Gibraltar, and a small part of the western Mediter-ranean Sea. There are 28 layers in the vertical, withreference densities listed in Table 1. The bottom topographyis based on the Naval Research Laboratory digital bathym-etry database with 2-min resolution (NRL DBDB2, seehttp://www7320.nrlssc.navy.mil/DBDB2_WWW for docu-mentation). The model is initialized with the temperatureand salinity fields from the third version of climatology‘‘Generalized Digital Environmental Model’’ (GDEM)[Teague et al., 1990]. Since this is a process study, thereis no surface forcing, all boundaries are closed, and relax-
Figure 1. Locations of (top) CTD and (bottom) XCPstations during the 1988 Gulf of Cadiz Expedition.
Figure 2. Bathymetry in meters of the eastern NorthAtlantic Ocean, the Gulf of Cadiz, and the western end ofthe Mediterranean Sea.
C12005 XU ET AL.: MODELING MOW
3 of 20
C12005
ation to climatology is applied near the boundaries in1�-wide buffer zones. The simulation has a backgroundhorizontal viscosity A of �35 m2 s�1 and a deformation-dependent Smagorinsky viscosity with coefficient C = 0.1.The bottom stress is estimated by a quadratic drag law in thelowest 10 m with a constant drag coefficient CD = 3.0 �
10�3. There is small background diapycnal mixing of10�5 m2 s�1 and entrainment is estimated via the algebraicparameterization by Xu et al. [2006] noted in section 1. Themodel starts from rest and is integrated for 6 months.
3.2. Exchange Through the Strait of Gibraltar
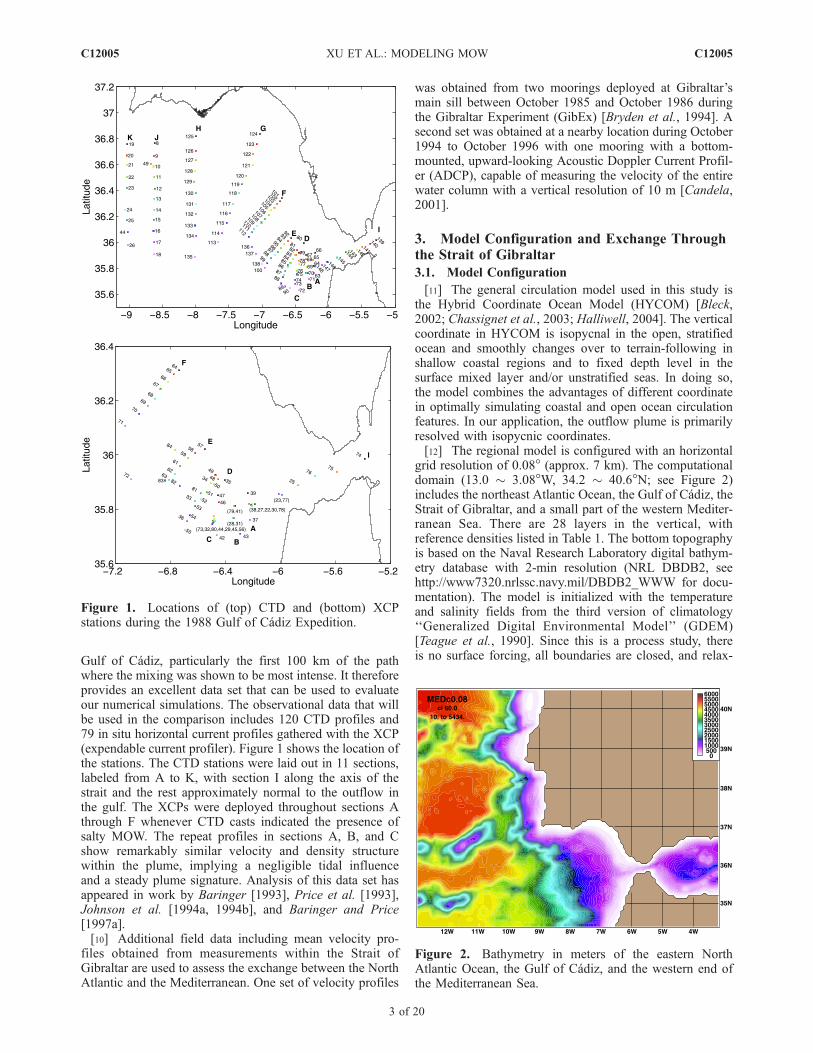
[13] Unlike previous numerical studies of the Mediterra-nean outflow [e.g., Jungclaus and Mellor, 2000; Papadakiset al., 2003], the model configuration used here includespart of the western Mediterranean basin and the outflowsource water is supplied by relaxing the temperature andsalinity fields east of 4�W (roughly 150 km to the east of theStrait) to their climatological values. The simulated verticalprofiles of salinity and horizontal velocity near the Camari-nal Sill (5.72�W, 35.9�N) within the Strait are thereforegenuine predictions of the model, and can be compared tothe velocity profiles observed at nearby locations (seeFigure 3). A steady two-layer exchange flow system isquickly reached in the model, and both the salinity andvelocity profiles remain nearly constant throughout thesimulation. The simulated isohaline of 37.0 approximatelymarks the boundary between inflow and outflow, whichhave characteristic salinities of 36.2 and 38.45, respectively.This agrees well with the observations. The maximumoutflow velocity reaches 0.5 ms�1, which is about the samemagnitude as reported by Bryden et al. [1994] but isconsiderably weaker than a value of about 0.8 ms�1 asreported by Candela [2001].[14] The exchange through the Strait is often measured by
a volume and/or salinity transport, and a number of estimateshave been reported using different methods [see Bryden etal., 1994, Table 1; Hopkins, 1999]. The volume transportbased on evaporation and precipitation over the Mediterra-nean Sea ranges from 0.9 to 1.8 Sv (1 Sv = 106 m3 s�1)[Hopkins, 1978], with the most widely quoted value being1.2 Sv [Lacombe and Richez, 1982]. On the basis of
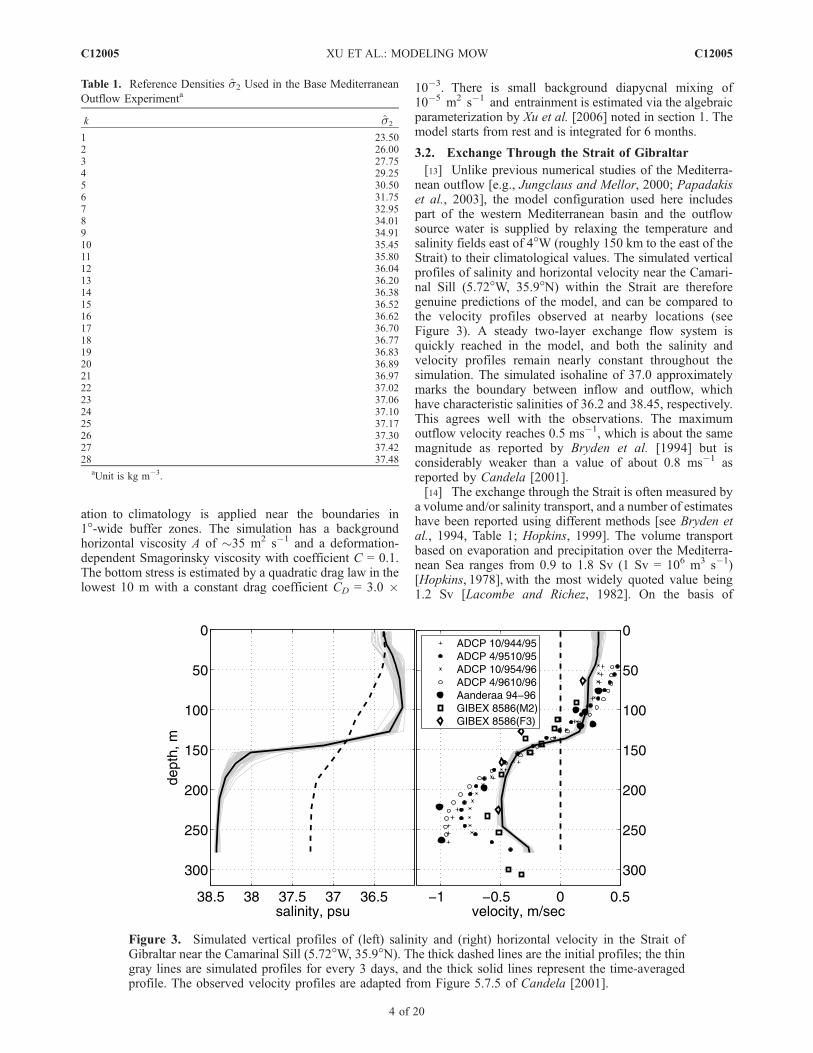
Table 1. Reference Densities s2 Used in the Base Mediterranean
Outflow Experimenta
k s2
1 23.502 26.003 27.754 29.255 30.506 31.757 32.958 34.019 34.9110 35.4511 35.8012 36.0413 36.2014 36.3815 36.5216 36.6217 36.7018 36.7719 36.8320 36.8921 36.9722 37.0223 37.0624 37.1025 37.1726 37.3027 37.4228 37.48
aUnit is kg m�3.
Figure 3. Simulated vertical profiles of (left) salinity and (right) horizontal velocity in the Strait ofGibraltar near the Camarinal Sill (5.72�W, 35.9�N). The thick dashed lines are the initial profiles; the thingray lines are simulated profiles for every 3 days, and the thick solid lines represent the time-averagedprofile. The observed velocity profiles are adapted from Figure 5.7.5 of Candela [2001].
C12005 XU ET AL.: MODELING MOW
4 of 20
C12005
data from GibEx, Bryden et al. [1994] estimate volumeand salinity transports of 0.7 Sv and 1.5 � 103 m3 s�1 (1 �103 m3 s�1 of salinity transport is equivalent to an inflow/outflow exchange of 1 Sv with a salinity difference of 1),respectively. Candela [2001] estimates a higher volumetransport of 1.0 Sv which is consistent with the higherobserved outflow velocity. Our numerical simulation exhibitsmean values of 0.76 Sv and 1.50 � 103 m3 s�1 for volumeand salinity transports, respectively, in agreement with theresults of GibEx.[15] We should note here that while the model simulates
the exchange through the Strait, nevertheless grid spacingdoes not resolve the bathymetric detail near the Strait. Thusthe structure of the outflow within the Strait (e.g., the cross-sectional shape) is not well represented.
4. Characteristics of the Modeled Outflow Plume
[16] The Mediterranean outflow plume spreads into theGulf of Cadiz through the Strait of Gibraltar as a warm,salty, dense gravity current. In this section, we examine theregional model’s ability to represent the basic characteristicsof the outflow plume.
4.1. T/S Profiles
[17] Figure 4 presents a direct comparison between theobserved and the simulated temperature and salinity profilesin three selected CTD sections as shown in Figure 1. Themodel results are linearly interpolated to the location of eachstation and a time average of the last three months of modelsimulation was calculated.[18] Immediately west of the Strait at section A, the
observed outflow plume shows a two-layer structure: aweakly stratified bottom layer and a highly stratified inter-facial layer above it (Figure 4a). The bottom layer has athickness of about 60 m and maximum salinity of about38.25. The interfacial layer, about 100 m thick, is sand-wiched between the bottom layer and the NACW which ischaracterized by a salinity minimum of <36.0. The simula-tion shows a similar two-layer structure at section A. Themodeled maximum salinity, however, is about 0.5 less thanobserved at deepest station, and somewhat more than isobserved at the shallowest (northern most) station. Thisdiscrepancy is indicative of poor horizontal resolution nearthe Strait: 7 km grid spacing simply cannot resolve thebottom bathymetry near the Strait, where the outflow plumeis observed less than 12 km wide [Baringer, 1993]. As theoutflow plume spreads northwestward along the continentalshelf of the northern Gulf of Cadiz, the weakly stratifiedpart of the plume disappears while the plume is bottom-trapped (Figure 4b). The simulated plume at section F alsoshows a similar spatial salinity distribution as observed: thesalinity maximum is higher in the deeper stations than in theshallower stations. Farther west at section H (about 8�W), theMOW plume detaches from the ocean floor and continueswestward at depths between 1000 m and 1500 m (Figure 4c).The model successfully simulates this transition from abottom-trapped gravity current to an interflow (or jet).[19] The evolution of water properties of MOW in the
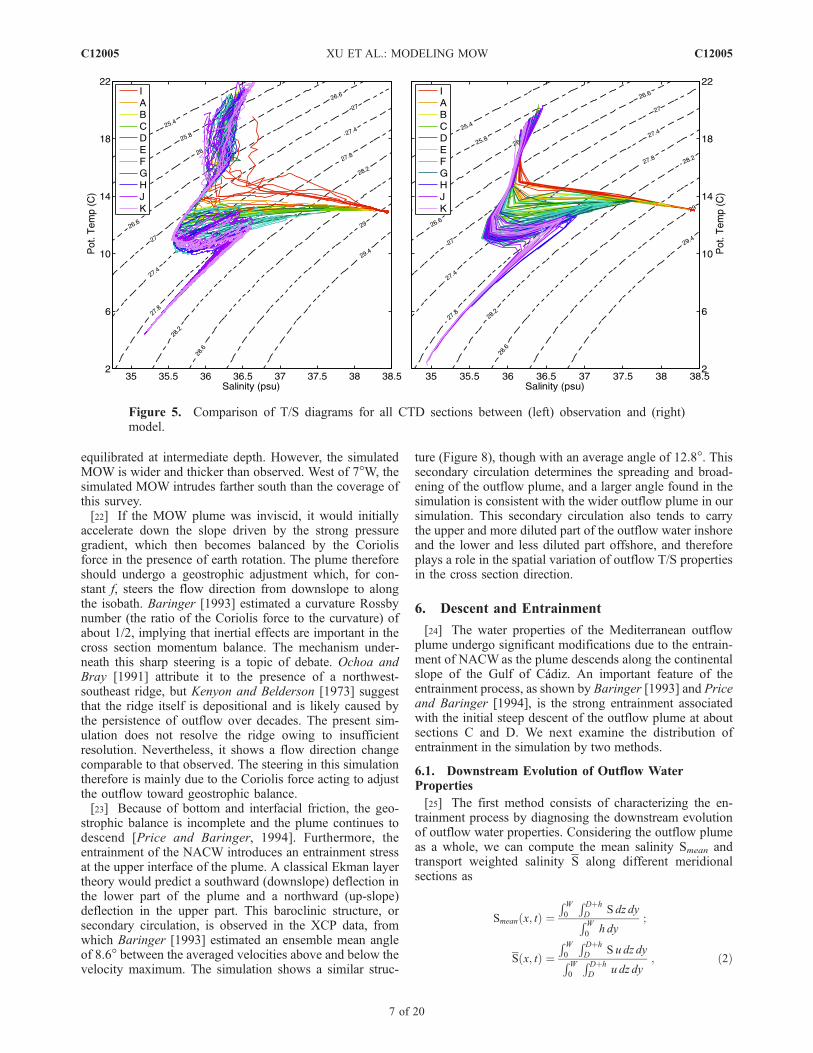
Gulf of Cadiz is illustrated in the T-S diagram in Figure 5.The outflow begins at potential density s0 of �29 kg m�3,and mixes with the NACW above as the plume spreads into
the Gulf of Cadiz, substantially decreasing the salinity andthus the density. When the plume is equilibrated at inter-mediate depth after section H, the MOW has a s0 value ofabout �27.8 kg m�3. The comparison shows that thesimulation reproduces this evolution quite well.
4.2. Velocity Profiles
[20] Figure 6 presents a direct comparison between theobserved and the simulated velocity profiles for three XCPsections near the exit of the Strait of Gibraltar. The samelinear interpolation and time averaging process (as in T/Sprofiles comparison) are applied. As already mentioned,XCP data is only available in sections A to F and the repeatdrops in sections A, B, and C show nearly identical velocityprofiles. The simulation reproduces both the observedvelocity magnitude of about 1 m s�1 in sections A to Cand the typical vertical structure of the outflow velocity,with a maximum located between the weakly stratifiedbottom layer and the interfacial layer of the outflow plume.The simulation also reproduces the change in outflow plumedirection from southwestward at section B to northwestwardat section C. As the plume spreads farther downstream, itsvelocity decreases, and the simulation is overall in consis-tent with the observation.
5. Steering and Spreading of the Outflow Plume
[21] In the Gulf of Cadiz, we define the MOWas the watermass below the NACW with salinity S � max(Sc, S0 +DS),in which S0 is the initial mean salinity profile in the gulf andDS = 0.05 and Sc = 36.0. The definition is meant to ‘capture’all of the newly formedMOWin the gulf. On the basis of this,the vertically averaged velocity of the MOW plume u is thencalculated by
u x; y; tð Þ ¼ h�1
Z Dþh
D
u x; y; z; tð Þ dz ; ð1Þ
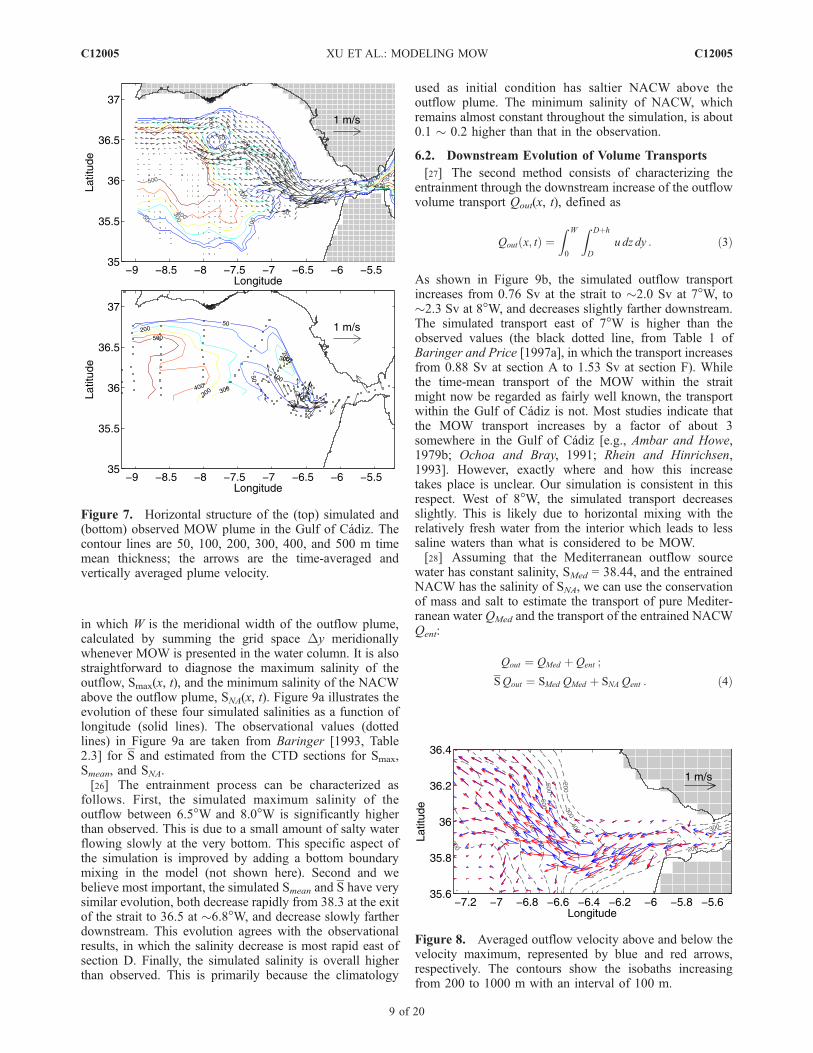
in which depth D is the bottom depth of the lowest layer inmodel that mets the salinity criteria of MOW, and plumethickness h is the vertical summation of the thickness ofMOW layers. Figure 7 shows the time average h and u fromthe last three model months. The simulated flow bears asimilar pattern to that of the schematic diagram of Madelain[1970]. The plume flows southwestward at the exit of thestrait, where it is channel-constrained, then steers sharply tothe northwest at the longitude of �6.4�W. Part of the plumeseparates from the continental slope at �7.0�W and 36.0�Nmoving westward. The majority of the plume, however,continues to flow northwestward along the continentalslope. At about 7.6�W and 36.5�N, the plume encountersthe Guadalquivir Bank which divides the flow into twobranches: one flowing southwestward and the other north-westward. These two branches merge at west of 8.0�W, andthe plume narrows as the steepness of the continental slopeincreases. The thickness h and velocity u of the MOWplume from the CTD and XCP data are also plotted inFigure 7 for comparison. XCPs were taken only near theexit of the Strait where the plume steering is clearly shown.Both the simulation and the observations show a thinoutflow plume (<100 m thick) when it is bottom-trapped,and the plume thickens at �8.0�W where it becomes
C12005 XU ET AL.: MODELING MOW
5 of 20
C12005
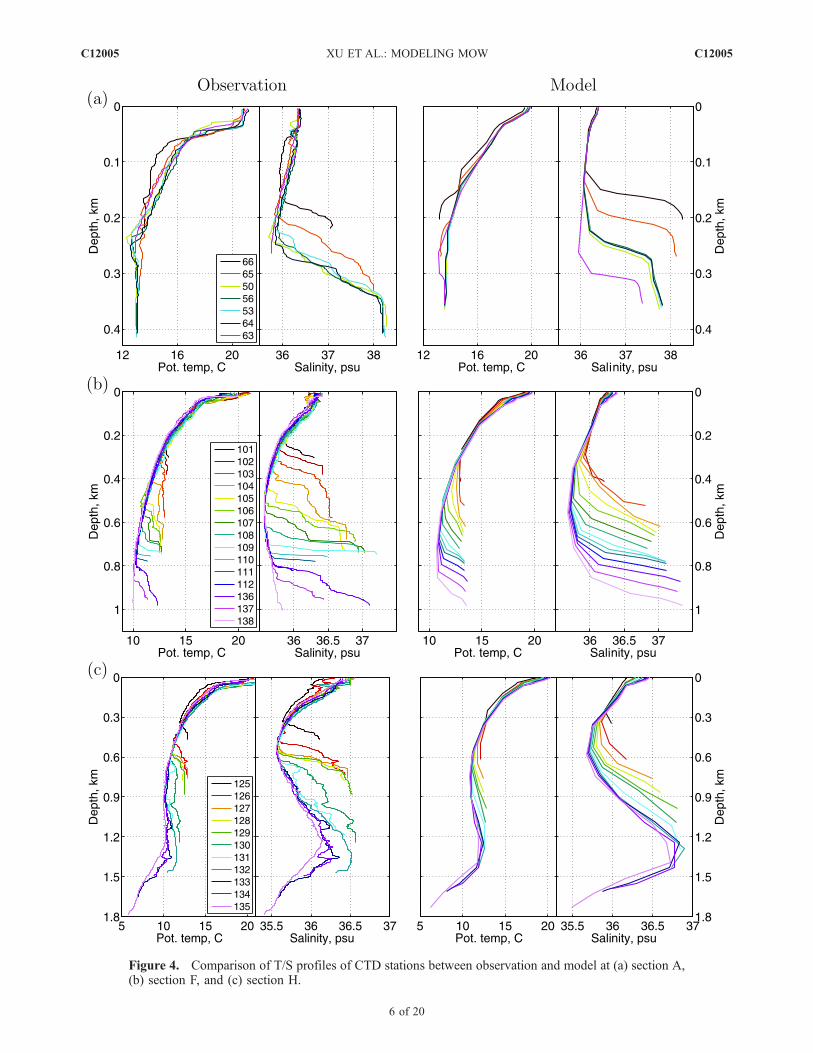
Figure 4. Comparison of T/S profiles of CTD stations between observation and model at (a) section A,(b) section F, and (c) section H.
C12005 XU ET AL.: MODELING MOW
6 of 20
C12005
equilibrated at intermediate depth. However, the simulatedMOW is wider and thicker than observed. West of 7�W, thesimulated MOW intrudes farther south than the coverage ofthis survey.[22] If the MOW plume was inviscid, it would initially
accelerate down the slope driven by the strong pressuregradient, which then becomes balanced by the Coriolisforce in the presence of earth rotation. The plume thereforeshould undergo a geostrophic adjustment which, for con-stant f, steers the flow direction from downslope to alongthe isobath. Baringer [1993] estimated a curvature Rossbynumber (the ratio of the Coriolis force to the curvature) ofabout 1/2, implying that inertial effects are important in thecross section momentum balance. The mechanism under-neath this sharp steering is a topic of debate. Ochoa andBray [1991] attribute it to the presence of a northwest-southeast ridge, but Kenyon and Belderson [1973] suggestthat the ridge itself is depositional and is likely caused bythe persistence of outflow over decades. The present sim-ulation does not resolve the ridge owing to insufficientresolution. Nevertheless, it shows a flow direction changecomparable to that observed. The steering in this simulationtherefore is mainly due to the Coriolis force acting to adjustthe outflow toward geostrophic balance.[23] Because of bottom and interfacial friction, the geo-
strophic balance is incomplete and the plume continues todescend [Price and Baringer, 1994]. Furthermore, theentrainment of the NACW introduces an entrainment stressat the upper interface of the plume. A classical Ekman layertheory would predict a southward (downslope) deflection inthe lower part of the plume and a northward (up-slope)deflection in the upper part. This baroclinic structure, orsecondary circulation, is observed in the XCP data, fromwhich Baringer [1993] estimated an ensemble mean angleof 8.6� between the averaged velocities above and below thevelocity maximum. The simulation shows a similar struc-
ture (Figure 8), though with an average angle of 12.8�. Thissecondary circulation determines the spreading and broad-ening of the outflow plume, and a larger angle found in thesimulation is consistent with the wider outflow plume in oursimulation. This secondary circulation also tends to carrythe upper and more diluted part of the outflow water inshoreand the lower and less diluted part offshore, and thereforeplays a role in the spatial variation of outflow T/S propertiesin the cross section direction.
6. Descent and Entrainment
[24] The water properties of the Mediterranean outflowplume undergo significant modifications due to the entrain-ment of NACWas the plume descends along the continentalslope of the Gulf of Cadiz. An important feature of theentrainment process, as shown by Baringer [1993] and Priceand Baringer [1994], is the strong entrainment associatedwith the initial steep descent of the outflow plume at aboutsections C and D. We next examine the distribution ofentrainment in the simulation by two methods.
6.1. Downstream Evolution of Outflow WaterProperties
[25] The first method consists of characterizing the en-trainment process by diagnosing the downstream evolutionof outflow water properties. Considering the outflow plumeas a whole, we can compute the mean salinity Smean andtransport weighted salinity S along different meridionalsections as
Smean x; tð Þ ¼RW
0
RDþh
DS dz dyRW
0h dy
;
S x; tð Þ ¼RW
0
RDþh
DS u dz dyRW
0
RDþh
Du dz dy
; ð2Þ
Figure 5. Comparison of T/S diagrams for all CTD sections between (left) observation and (right)model.
C12005 XU ET AL.: MODELING MOW
7 of 20
C12005
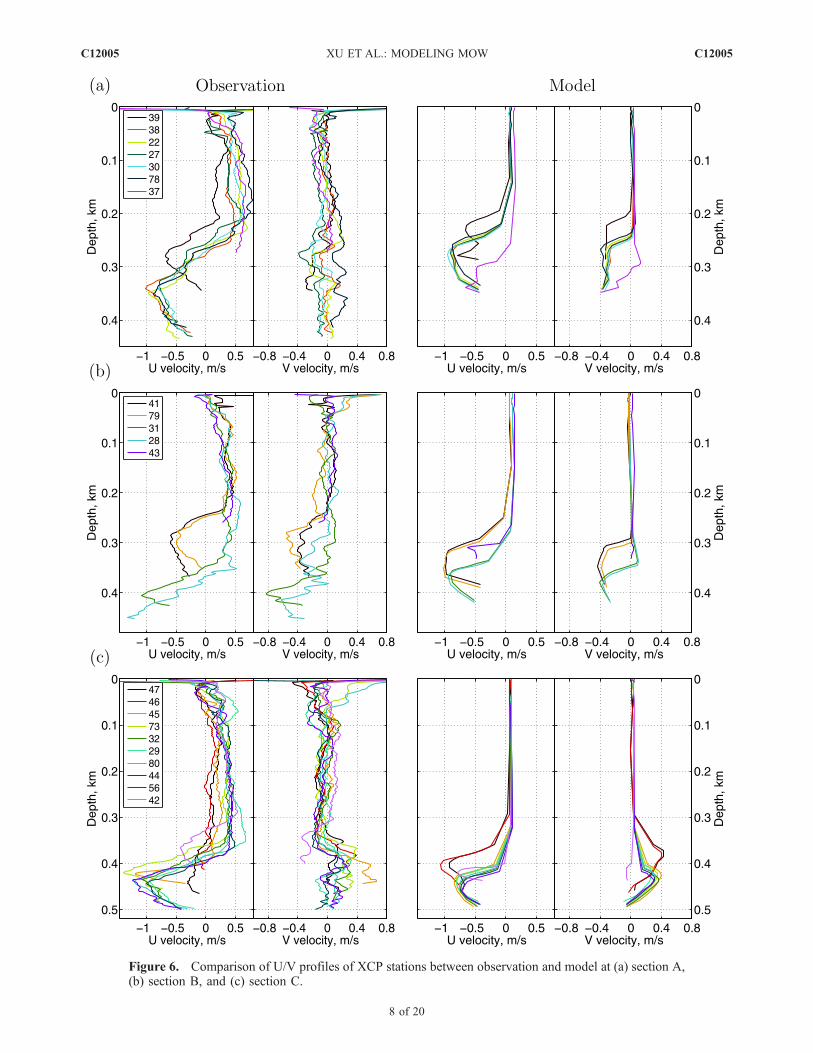
Figure 6. Comparison of U/V profiles of XCP stations between observation and model at (a) section A,(b) section B, and (c) section C.
C12005 XU ET AL.: MODELING MOW
8 of 20
C12005
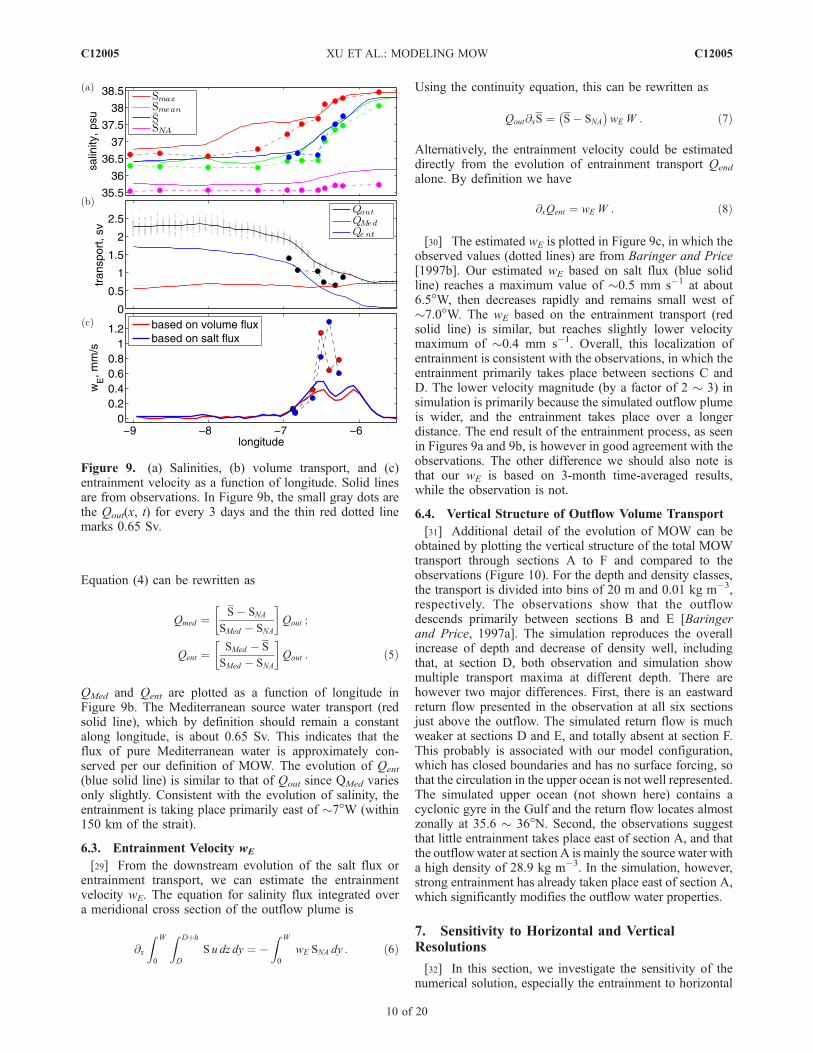
in which W is the meridional width of the outflow plume,calculated by summing the grid space Dy meridionallywhenever MOW is presented in the water column. It is alsostraightforward to diagnose the maximum salinity of theoutflow, Smax(x, t), and the minimum salinity of the NACWabove the outflow plume, SNA(x, t). Figure 9a illustrates theevolution of these four simulated salinities as a function oflongitude (solid lines). The observational values (dottedlines) in Figure 9a are taken from Baringer [1993, Table2.3] for S and estimated from the CTD sections for Smax,Smean, and SNA.[26] The entrainment process can be characterized as
follows. First, the simulated maximum salinity of theoutflow between 6.5�W and 8.0�W is significantly higherthan observed. This is due to a small amount of salty waterflowing slowly at the very bottom. This specific aspect ofthe simulation is improved by adding a bottom boundarymixing in the model (not shown here). Second and webelieve most important, the simulated Smean and S have verysimilar evolution, both decrease rapidly from 38.3 at the exitof the strait to 36.5 at �6.8�W, and decrease slowly fartherdownstream. This evolution agrees with the observationalresults, in which the salinity decrease is most rapid east ofsection D. Finally, the simulated salinity is overall higherthan observed. This is primarily because the climatology
used as initial condition has saltier NACW above theoutflow plume. The minimum salinity of NACW, whichremains almost constant throughout the simulation, is about0.1 � 0.2 higher than that in the observation.
6.2. Downstream Evolution of Volume Transports
[27] The second method consists of characterizing theentrainment through the downstream increase of the outflowvolume transport Qout(x, t), defined as
Qout x; tð Þ ¼Z W
0
Z Dþh
D
u dz dy : ð3Þ
As shown in Figure 9b, the simulated outflow transportincreases from 0.76 Sv at the strait to �2.0 Sv at 7�W, to�2.3 Sv at 8�W, and decreases slightly farther downstream.The simulated transport east of 7�W is higher than theobserved values (the black dotted line, from Table 1 ofBaringer and Price [1997a], in which the transport increasesfrom 0.88 Sv at section A to 1.53 Sv at section F). Whilethe time-mean transport of the MOW within the straitmight now be regarded as fairly well known, the transportwithin the Gulf of Cadiz is not. Most studies indicate thatthe MOW transport increases by a factor of about 3somewhere in the Gulf of Cadiz [e.g., Ambar and Howe,1979b; Ochoa and Bray, 1991; Rhein and Hinrichsen,1993]. However, exactly where and how this increasetakes place is unclear. Our simulation is consistent in thisrespect. West of 8�W, the simulated transport decreasesslightly. This is likely due to horizontal mixing with therelatively fresh water from the interior which leads to lesssaline waters than what is considered to be MOW.[28] Assuming that the Mediterranean outflow source
water has constant salinity, SMed = 38.44, and the entrainedNACW has the salinity of SNA, we can use the conservationof mass and salt to estimate the transport of pure Mediter-ranean water QMed and the transport of the entrained NACWQent:
Qout ¼ QMed þ Qent ;
SQout ¼ SMed QMed þ SNA Qent : ð4Þ
Figure 7. Horizontal structure of the (top) simulated and(bottom) observed MOW plume in the Gulf of Cadiz. Thecontour lines are 50, 100, 200, 300, 400, and 500 m timemean thickness; the arrows are the time-averaged andvertically averaged plume velocity.
Figure 8. Averaged outflow velocity above and below thevelocity maximum, represented by blue and red arrows,respectively. The contours show the isobaths increasingfrom 200 to 1000 m with an interval of 100 m.
C12005 XU ET AL.: MODELING MOW
9 of 20
C12005
Equation (4) can be rewritten as
Qmed ¼S� SNA
SMed � SNA
� �Qout ;
Qent ¼SMed � S
SMed � SNA
� �Qout : ð5Þ
QMed and Qent are plotted as a function of longitude inFigure 9b. The Mediterranean source water transport (redsolid line), which by definition should remain a constantalong longitude, is about 0.65 Sv. This indicates that theflux of pure Mediterranean water is approximately con-served per our definition of MOW. The evolution of Qent
(blue solid line) is similar to that of Qout since QMed variesonly slightly. Consistent with the evolution of salinity, theentrainment is taking place primarily east of �7�W (within150 km of the strait).
6.3. Entrainment Velocity wE
[29] From the downstream evolution of the salt flux orentrainment transport, we can estimate the entrainmentvelocity wE. The equation for salinity flux integrated overa meridional cross section of the outflow plume is
@x
Z W
0
Z Dþh
D
S u dz dy ¼ �Z W
0
wE SNA dy : ð6Þ
Using the continuity equation, this can be rewritten as
Qout@xS ¼ S� SNA� �
wE W : ð7Þ
Alternatively, the entrainment velocity could be estimateddirectly from the evolution of entrainment transport Qend
alone. By definition we have
@xQent ¼ wE W : ð8Þ
[30] The estimated wE is plotted in Figure 9c, in which theobserved values (dotted lines) are from Baringer and Price[1997b]. Our estimated wE based on salt flux (blue solidline) reaches a maximum value of �0.5 mm s�1 at about6.5�W, then decreases rapidly and remains small west of�7.0�W. The wE based on the entrainment transport (redsolid line) is similar, but reaches slightly lower velocitymaximum of �0.4 mm s�1. Overall, this localization ofentrainment is consistent with the observations, in which theentrainment primarily takes place between sections C andD. The lower velocity magnitude (by a factor of 2 � 3) insimulation is primarily because the simulated outflow plumeis wider, and the entrainment takes place over a longerdistance. The end result of the entrainment process, as seenin Figures 9a and 9b, is however in good agreement with theobservations. The other difference we should also note isthat our wE is based on 3-month time-averaged results,while the observation is not.
6.4. Vertical Structure of Outflow Volume Transport
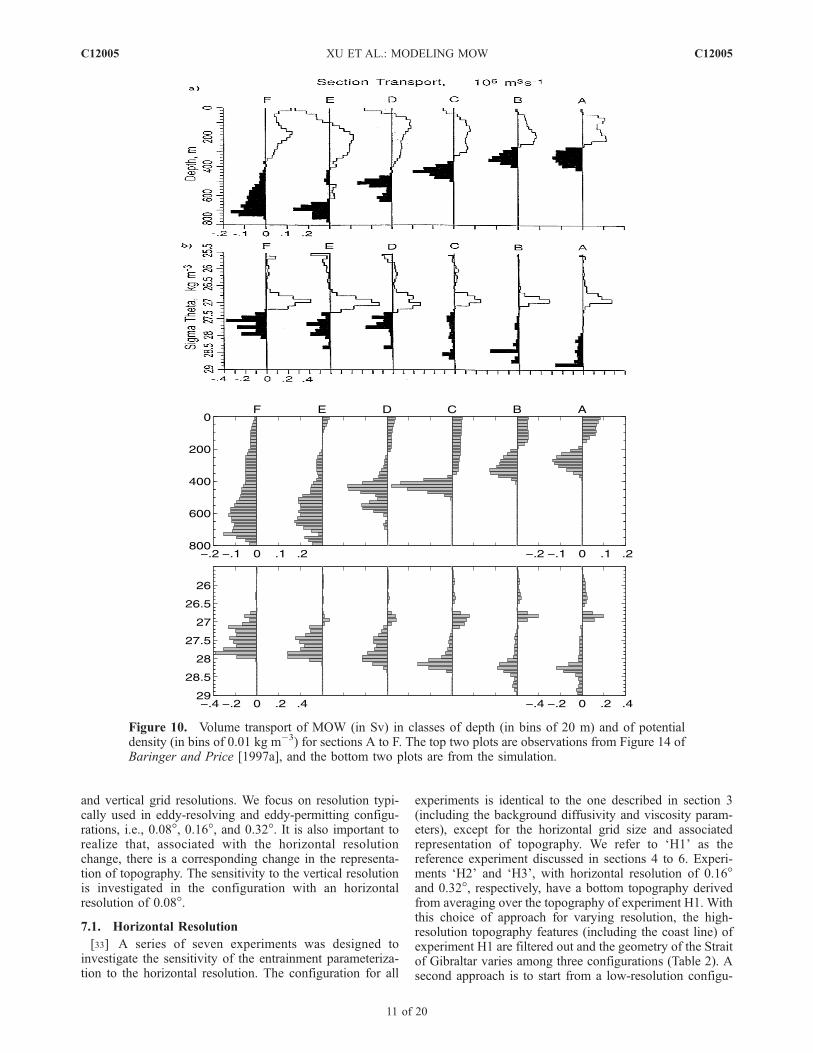
[31] Additional detail of the evolution of MOW can beobtained by plotting the vertical structure of the total MOWtransport through sections A to F and compared to theobservations (Figure 10). For the depth and density classes,the transport is divided into bins of 20 m and 0.01 kg m�3,respectively. The observations show that the outflowdescends primarily between sections B and E [Baringerand Price, 1997a]. The simulation reproduces the overallincrease of depth and decrease of density well, includingthat, at section D, both observation and simulation showmultiple transport maxima at different depth. There arehowever two major differences. First, there is an eastwardreturn flow presented in the observation at all six sectionsjust above the outflow. The simulated return flow is muchweaker at sections D and E, and totally absent at section F.This probably is associated with our model configuration,which has closed boundaries and has no surface forcing, sothat the circulation in the upper ocean is not well represented.The simulated upper ocean (not shown here) contains acyclonic gyre in the Gulf and the return flow locates almostzonally at 35.6 � 36�N. Second, the observations suggestthat little entrainment takes place east of section A, and thatthe outflowwater at section A is mainly the source water witha high density of 28.9 kg m�3. In the simulation, however,strong entrainment has already taken place east of section A,which significantly modifies the outflow water properties.
7. Sensitivity to Horizontal and VerticalResolutions
[32] In this section, we investigate the sensitivity of thenumerical solution, especially the entrainment to horizontal
Figure 9. (a) Salinities, (b) volume transport, and (c)entrainment velocity as a function of longitude. Solid linesare from observations. In Figure 9b, the small gray dots arethe Qout(x, t) for every 3 days and the thin red dotted linemarks 0.65 Sv.
C12005 XU ET AL.: MODELING MOW
10 of 20
C12005
and vertical grid resolutions. We focus on resolution typi-cally used in eddy-resolving and eddy-permitting configu-rations, i.e., 0.08�, 0.16�, and 0.32�. It is also important torealize that, associated with the horizontal resolutionchange, there is a corresponding change in the representa-tion of topography. The sensitivity to the vertical resolutionis investigated in the configuration with an horizontalresolution of 0.08�.
7.1. Horizontal Resolution
[33] A series of seven experiments was designed toinvestigate the sensitivity of the entrainment parameteriza-tion to the horizontal resolution. The configuration for all
experiments is identical to the one described in section 3(including the background diffusivity and viscosity param-eters), except for the horizontal grid size and associatedrepresentation of topography. We refer to ‘H1’ as thereference experiment discussed in sections 4 to 6. Experi-ments ‘H2’ and ‘H3’, with horizontal resolution of 0.16�and 0.32�, respectively, have a bottom topography derivedfrom averaging over the topography of experiment H1. Withthis choice of approach for varying resolution, the high-resolution topography features (including the coast line) ofexperiment H1 are filtered out and the geometry of the Straitof Gibraltar varies among three configurations (Table 2). Asecond approach is to start from a low-resolution configu-
Figure 10. Volume transport of MOW (in Sv) in classes of depth (in bins of 20 m) and of potentialdensity (in bins of 0.01 kg m�3) for sections A to F. The top two plots are observations from Figure 14 ofBaringer and Price [1997a], and the bottom two plots are from the simulation.
C12005 XU ET AL.: MODELING MOW
11 of 20
C12005
ration and then increase the resolution so that none of theconfigurations contains high-resolution topographic fea-tures. There are two possible ways of treating the topogra-phy when using this approach. First, in experiments ‘H2a’and ‘H1a’, with resolution of 0.16� and 0.08� respectively,the topography is obtained by dividing every grid box of H3into 2 � 2 and 4 � 4 grid boxes. Second, in experiments‘H2b’ and ‘H1b’, the topography is linearly interpolatedfrom H3. All 7 experiments have comparable mass and saltfluxes into the Gulf of Cadiz (Table 2).[34] Snapshots of the simulated salinity distribution in a
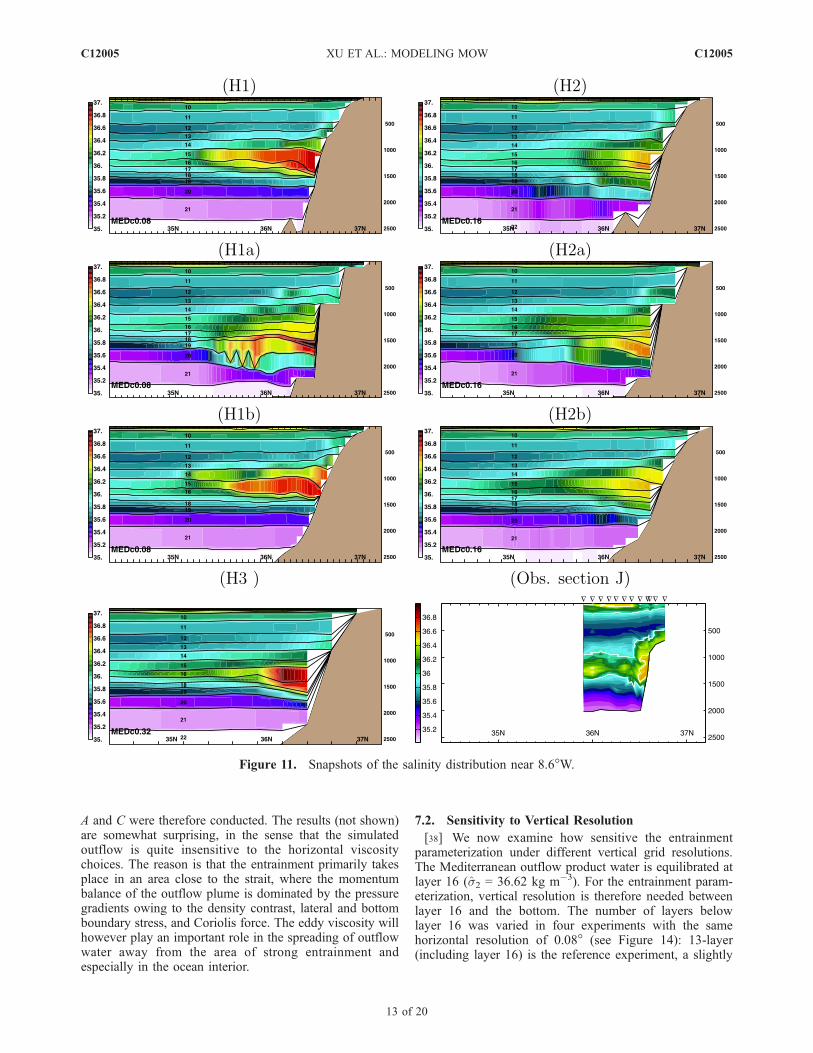
section near 8.6�W are plotted in Figure 11 for the sevenexperiments. The simulated MOW in experiments H1, H2,and H3 equilibrates at depths between 1000 m and 1500 min reasonable agreement with the observations at section J(Figure 11). The core salinity magnitude is higher thanobserved for the reasons laid out in section 6. In experimentH2, part of the salty MOW descends below the salinitymaximum and mixes with the surrounding fresh water,leading to a thicker MOW core. The simulated MOW inexperiment H3 is saltier than in H1 or H2, indicating furtherweakened entrainment. However, the MOW in H3 does notdescend as deep as in H2 because it is also warmer. Thewarmer MOW is due to shallower outflow source water andshallower entrained oceanic water, both of which areassociated with the topographic changes by reduction inhorizontal resolution. The simulated MOW of experimentsH1a and H2a equilibrates at deeper and denser isopycnalsthan in H3. The layer interface of H1a also shows some‘noisy jumps’ separated by a distance of 2Dx, where Dx ishorizontal grid size. This feature highlights the importanceof consistent topography representation in various resolu-tions. Although the topography is identical among experi-ments H1a, H2a, and H3, the topographic slope r, defined asDH/Dx, varies significantly: r is gentle and smooth inexperiment H3, yet it is ‘step-like’ in experiment H1a orH2a, jumping between 0 and 2 or 4 times that in H3. Theexperiment H1b does not exhibit the ‘spurious’ noise ofH1a, indicating that the step topography of H1a creates thenoise. Finally, when compared to H1 and H2, the simulatedMOW of H1b and H2b is slightly fresher and lighter, andequilibrates at a slightly shallower depth, suggesting thatsmall-scale topographic features affect the simulation too.[35] The horizontal structure of the simulated MOW
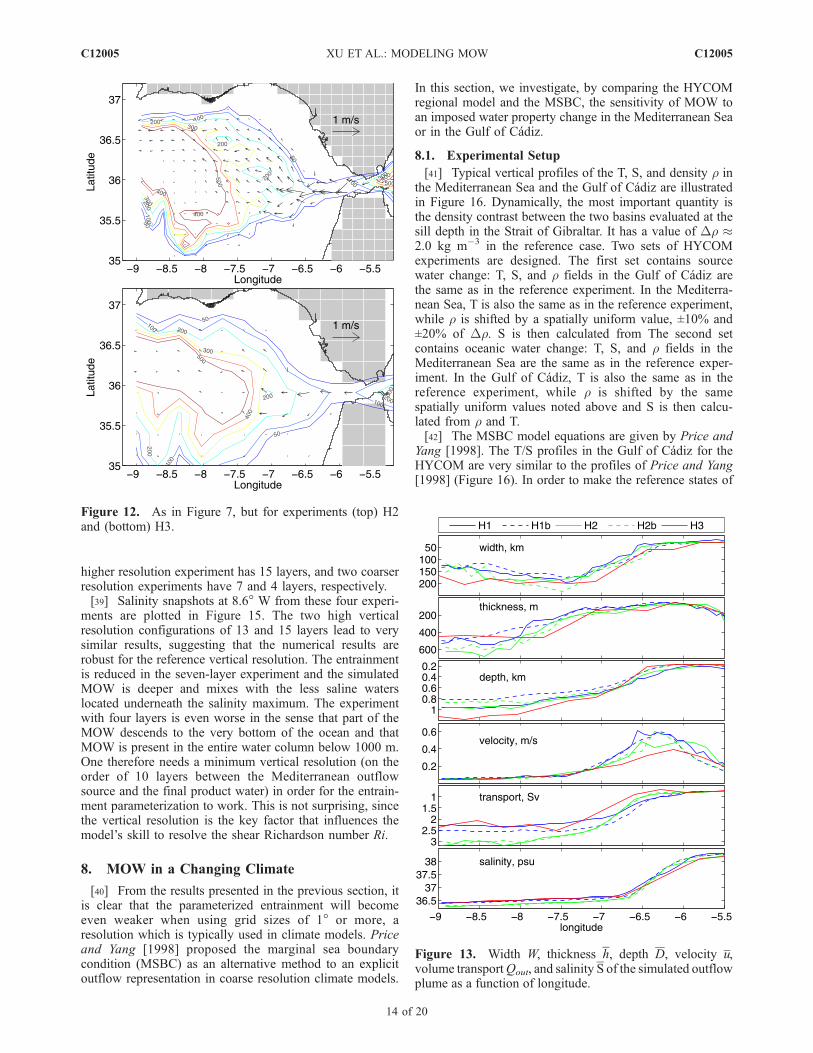
plume in the Gulf of Cadiz for experiments H2 and H3 isplotted in Figure 12. In comparison to Figure 7 for H1, theplume loses the detailed features of meandering, sharp
steering, and splitting, owing to the lack of resolution andfine topographic details. The general pattern, however, isretained. All show a wide, thin plume in the eastern gulfmerging into a narrow, thick boundary current at west of�8�W. Although the different runs are configured with thesame background viscosity parameters, the velocity of theplume becomes weaker as the resolution decreases.[36] To quantitatively compare the plumes in the various
experiments, we compute the width W, the meridionallyaveraged thickness h, depth D, and velocity juj, the volumetransport Qout, and the salinity S. The values are plotted inFigure 13 as a function of longitude. For all three horizontalresolutions,W increases from�25 kmat the strait to�200 kmat about 7.5�W, then slowly narrows to �150 km at thewestern end of the gulf. Here h is nearly a constant (�100 m)between the strait and �7.2�W, increases rapidly to �500 mat �8.0�W, and stabilizes farther downstream. The experi-ments with horizontal resolution of 0.16� have thickerMOW as already mentioned and also show considerablystronger volume transport than the corresponding 0.08� and0.32� runs. D increases continuously from 200 m at strait to�1000 m at 8�W, and remains at that level. The experimentH3 has a deeper equilibrium depth of MOW than thehigher-resolution runs due to weaker entrainment. jujincreases after the plume flows out of the strait and reachesits maximum between 6�W and 6.5�W where the plumeundergoes steering, and then decreases continuously fartherdownstream. Between 6�W and 7�W, the magnitude ofvelocity decreases as the resolution decreases. The totalincrease of volume transport, however, remains reasonablewhen compared to the observations. S decreases from thestrait to just east of 7�W and remains nearly a constantfarther west. Overall, the entrainment weakens as thehorizontal resolution decreases. This is most obvious whencomparing experiments with 0.08� and 0.32�. The simulatedMOW with horizontal resolutions of 0.08�, 0.16�, and0.32�, however, all equilibrate at intermediate depths inthe western part of the Gulf of Cadiz.[37] For comparison purpose, all the experiments dis-
cussed above use the same background horizontal viscosityA of 35 m2 s�1 and deformation-dependent Smagorinskyviscosity coefficient C of 0.1. However, the current practicein numerical modeling is to decrease the horizontal viscos-ity as the resolution is increased. Since the viscosity choicestrongly influences the velocity distribution and magnitude,one may expect the mixing parameterization to be sensitiveto changes in viscosity. A set of experiments with different
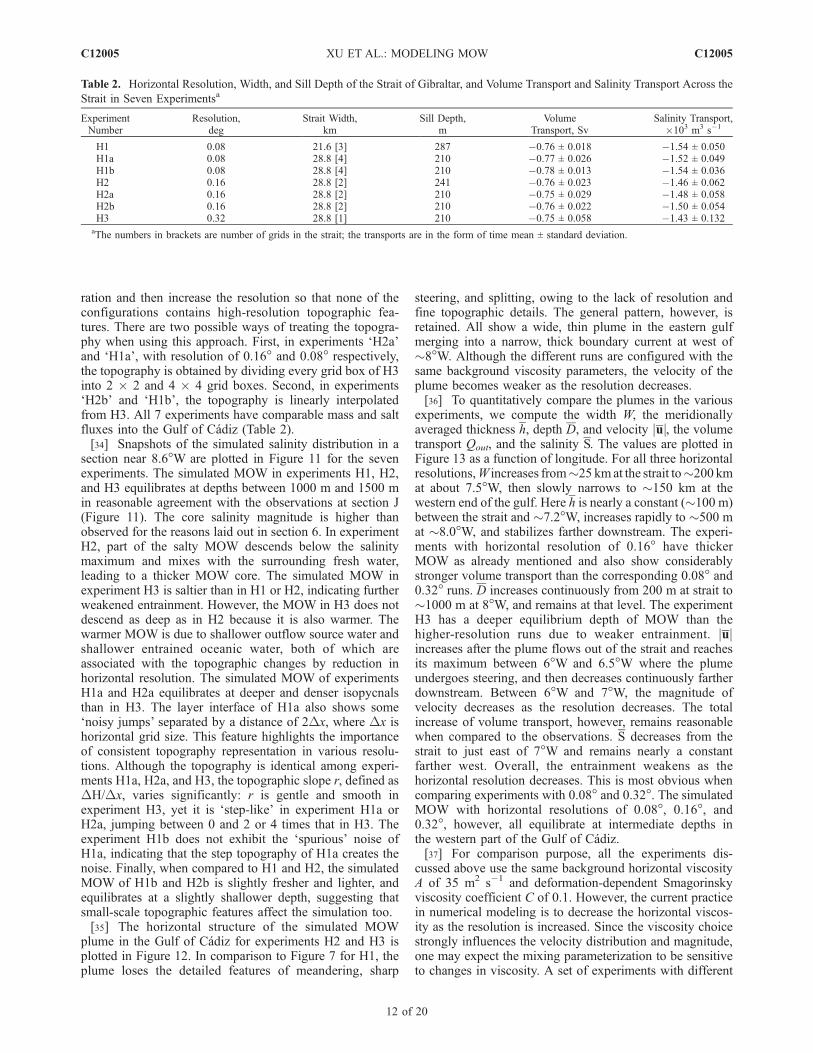
Table 2. Horizontal Resolution, Width, and Sill Depth of the Strait of Gibraltar, and Volume Transport and Salinity Transport Across the
Strait in Seven Experimentsa
ExperimentNumber
Resolution,deg
Strait Width,km
Sill Depth,m
VolumeTransport, Sv
Salinity Transport,�103 m3 s�1
H1 0.08 21.6 [3] 287 �0.76 ± 0.018 �1.54 ± 0.050H1a 0.08 28.8 [4] 210 �0.77 ± 0.026 �1.52 ± 0.049H1b 0.08 28.8 [4] 210 �0.78 ± 0.013 �1.54 ± 0.036H2 0.16 28.8 [2] 241 �0.76 ± 0.023 �1.46 ± 0.062H2a 0.16 28.8 [2] 210 �0.75 ± 0.029 �1.48 ± 0.058H2b 0.16 28.8 [2] 210 �0.76 ± 0.022 �1.50 ± 0.054H3 0.32 28.8 [1] 210 �0.75 ± 0.058 �1.43 ± 0.132
aThe numbers in brackets are number of grids in the strait; the transports are in the form of time mean ± standard deviation.
C12005 XU ET AL.: MODELING MOW
12 of 20
C12005
A and C were therefore conducted. The results (not shown)are somewhat surprising, in the sense that the simulatedoutflow is quite insensitive to the horizontal viscositychoices. The reason is that the entrainment primarily takesplace in an area close to the strait, where the momentumbalance of the outflow plume is dominated by the pressuregradients owing to the density contrast, lateral and bottomboundary stress, and Coriolis force. The eddy viscosity willhowever play an important role in the spreading of outflowwater away from the area of strong entrainment andespecially in the ocean interior.
7.2. Sensitivity to Vertical Resolution
[38] We now examine how sensitive the entrainmentparameterization under different vertical grid resolutions.The Mediterranean outflow product water is equilibrated atlayer 16 (s2 = 36.62 kg m�3). For the entrainment param-eterization, vertical resolution is therefore needed betweenlayer 16 and the bottom. The number of layers belowlayer 16 was varied in four experiments with the samehorizontal resolution of 0.08� (see Figure 14): 13-layer(including layer 16) is the reference experiment, a slightly
Figure 11. Snapshots of the salinity distribution near 8.6�W.
C12005 XU ET AL.: MODELING MOW
13 of 20
C12005
higher resolution experiment has 15 layers, and two coarserresolution experiments have 7 and 4 layers, respectively.[39] Salinity snapshots at 8.6� W from these four experi-
ments are plotted in Figure 15. The two high verticalresolution configurations of 13 and 15 layers lead to verysimilar results, suggesting that the numerical results arerobust for the reference vertical resolution. The entrainmentis reduced in the seven-layer experiment and the simulatedMOW is deeper and mixes with the less saline waterslocated underneath the salinity maximum. The experimentwith four layers is even worse in the sense that part of theMOW descends to the very bottom of the ocean and thatMOW is present in the entire water column below 1000 m.One therefore needs a minimum vertical resolution (on theorder of 10 layers between the Mediterranean outflowsource and the final product water) in order for the entrain-ment parameterization to work. This is not surprising, sincethe vertical resolution is the key factor that influences themodel’s skill to resolve the shear Richardson number Ri.
8. MOW in a Changing Climate
[40] From the results presented in the previous section, itis clear that the parameterized entrainment will becomeeven weaker when using grid sizes of 1� or more, aresolution which is typically used in climate models. Priceand Yang [1998] proposed the marginal sea boundarycondition (MSBC) as an alternative method to an explicitoutflow representation in coarse resolution climate models.
In this section, we investigate, by comparing the HYCOMregional model and the MSBC, the sensitivity of MOW toan imposed water property change in the Mediterranean Seaor in the Gulf of Cadiz.
8.1. Experimental Setup
[41] Typical vertical profiles of the T, S, and density r inthe Mediterranean Sea and the Gulf of Cadiz are illustratedin Figure 16. Dynamically, the most important quantity isthe density contrast between the two basins evaluated at thesill depth in the Strait of Gibraltar. It has a value of Dr 2.0 kg m�3 in the reference case. Two sets of HYCOMexperiments are designed. The first set contains sourcewater change: T, S, and r fields in the Gulf of Cadiz arethe same as in the reference experiment. In the Mediterra-nean Sea, T is also the same as in the reference experiment,while r is shifted by a spatially uniform value, ±10% and±20% of Dr. S is then calculated from The second setcontains oceanic water change: T, S, and r fields in theMediterranean Sea are the same as in the reference exper-iment. In the Gulf of Cadiz, T is also the same as in thereference experiment, while r is shifted by the samespatially uniform values noted above and S is then calcu-lated from r and T.[42] The MSBC model equations are given by Price and
Yang [1998]. The T/S profiles in the Gulf of Cadiz for theHYCOM are very similar to the profiles of Price and Yang[1998] (Figure 16). In order to make the reference states of
Figure 12. As in Figure 7, but for experiments (top) H2and (bottom) H3.
Figure 13. Width W, thickness h, depth D, velocity u,volume transportQout, and salinity S of the simulated outflowplume as a function of longitude.
C12005 XU ET AL.: MODELING MOW
14 of 20
C12005

the MSBC and HYCOM nearly identical, we have madechanges to three of the independent, geophysical variablesthat have to be provided to the MSBC (see Table 3). In theMSBC, the Mediterranean source water properties are theresult of prescribed air-sea heat and fresh water flux overthe Mediterranean basin and exchange with the NorthAtlantic. Price and Yang [1998] ignored the small but notquite negligible heat flux over the Mediterranean basin, ofabout 5–10 W m�2 as inferred from the heat budget of theMediterranean basin. Variable fluxes (an E–P of 0.35 �0.75 m a�1 and a heat flux of �6.0 � �7.6 W m�2) arespecified in order to have outflow source water from MSBCthat is closely consistent with that from HYCOM. Also,Price and Yang [1998] took the depth of entrainment to be400 m, which is on the upper side of the depth range overwhich the Mediterranean outflow entrains, roughly 400 m to700 m judging from the HYCOM regional model. We have
here set the entrainment depth to be 600 m. Clearly then, thereference state of the MSBC is the result of some modesttuning, and is not fully (or blindly) predicted. This is likelytrue of every ocean model solution if one construes param-eter tuning and model configuration to be the ends of acontinuum, model development. The issue is whether thechosen values or model configurations are within a plausi-ble range, and we believe that they are for both HYCOMand MSBC. However, the reference state is not the centralissue here, because our intent is to examine the sensitivity ofproduct water transport to source water density, say, whichis only slightly dependent upon the reference state of themodels. This sensitivity is almost entirely due to modeldynamics and is thus a genuine prediction of the models.
Figure 14. Distribution of target density (s2) between36.62 and 37.48 kg m�3 in four configurations.
Figure 15. Snapshots of the salinity distribution at a meridional section at 9� with different number oflayers between the outflow source water and product water.
Figure 16. T(z), S(z), and r(z) in the Mediterranean Sea(red) and in the Gulf of Cadiz (orange) from the referenceexperiment. Dr = 2 kg m�3 marks the reference densitycontrast between the two basins. The black dash lines showthe ocean profiles from Price and Yang [1998].
C12005 XU ET AL.: MODELING MOW
15 of 20
C12005
8.2. Imposed Source Water Change
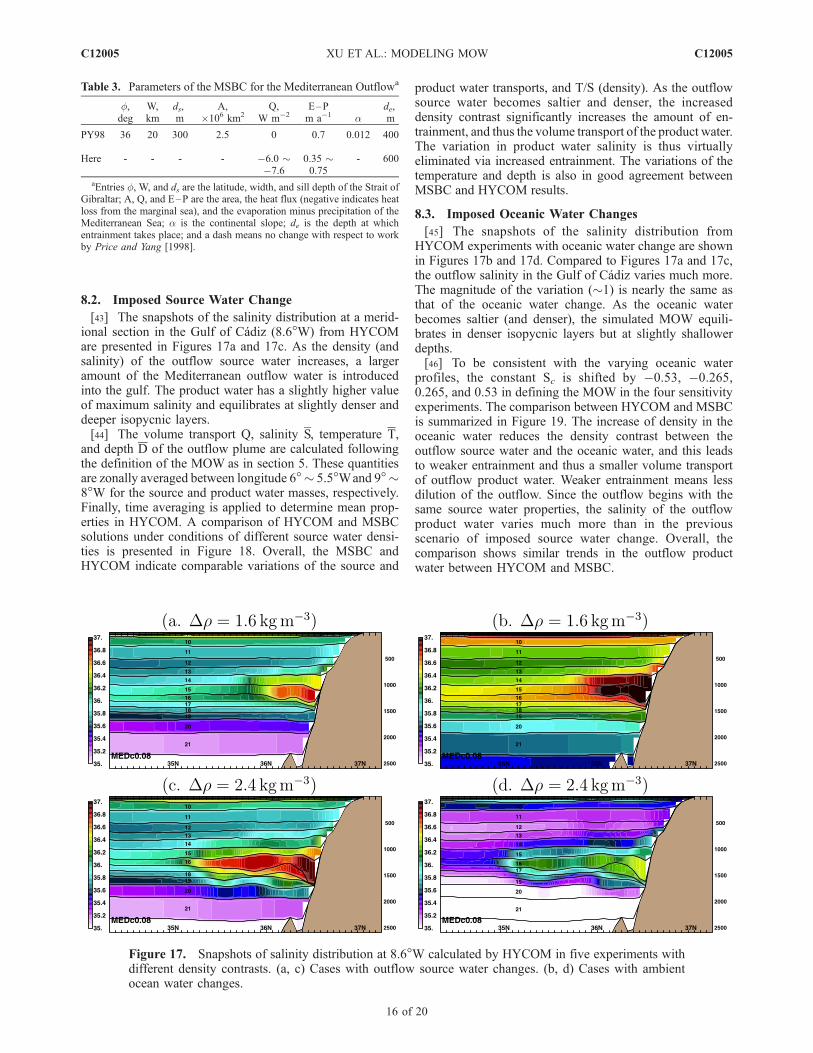
[43] The snapshots of the salinity distribution at a merid-ional section in the Gulf of Cadiz (8.6�W) from HYCOMare presented in Figures 17a and 17c. As the density (andsalinity) of the outflow source water increases, a largeramount of the Mediterranean outflow water is introducedinto the gulf. The product water has a slightly higher valueof maximum salinity and equilibrates at slightly denser anddeeper isopycnic layers.[44] The volume transport Q, salinity S, temperature T,
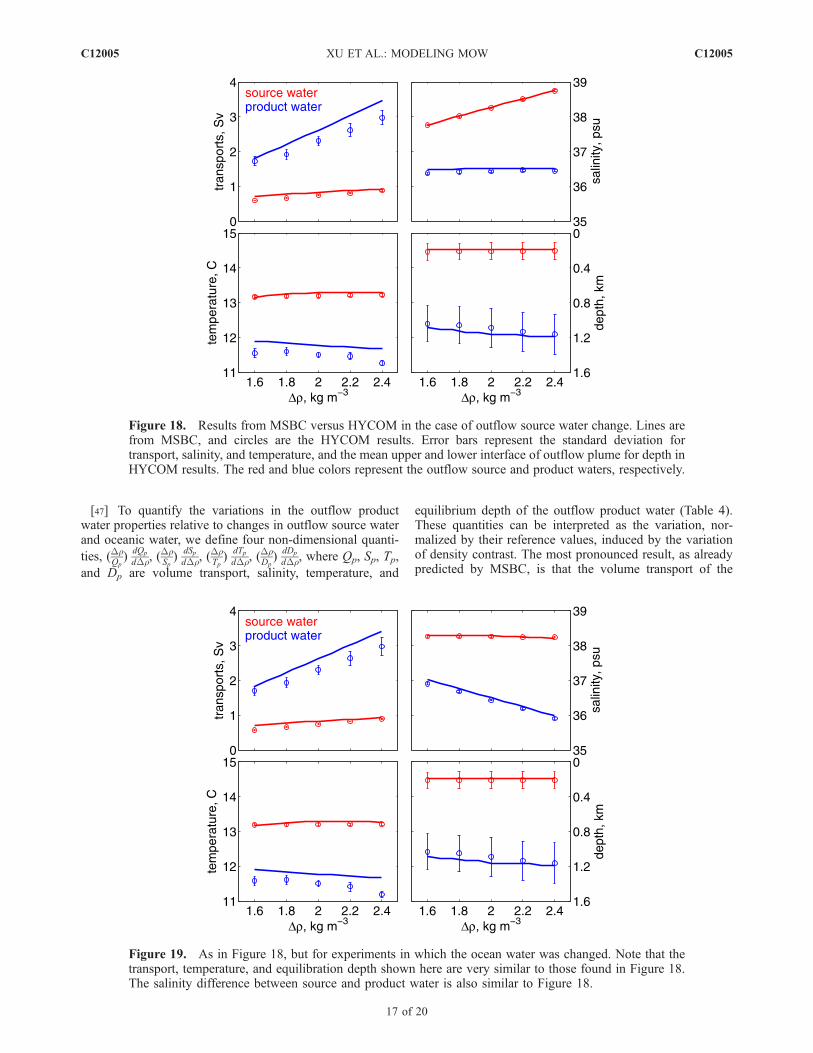
and depth D of the outflow plume are calculated followingthe definition of the MOW as in section 5. These quantitiesare zonally averaged between longitude 6�� 5.5�Wand 9��8�W for the source and product water masses, respectively.Finally, time averaging is applied to determine mean prop-erties in HYCOM. A comparison of HYCOM and MSBCsolutions under conditions of different source water densi-ties is presented in Figure 18. Overall, the MSBC andHYCOM indicate comparable variations of the source and
product water transports, and T/S (density). As the outflowsource water becomes saltier and denser, the increaseddensity contrast significantly increases the amount of en-trainment, and thus the volume transport of the product water.The variation in product water salinity is thus virtuallyeliminated via increased entrainment. The variations of thetemperature and depth is also in good agreement betweenMSBC and HYCOM results.
8.3. Imposed Oceanic Water Changes
[45] The snapshots of the salinity distribution fromHYCOM experiments with oceanic water change are shownin Figures 17b and 17d. Compared to Figures 17a and 17c,the outflow salinity in the Gulf of Cadiz varies much more.The magnitude of the variation (�1) is nearly the same asthat of the oceanic water change. As the oceanic waterbecomes saltier (and denser), the simulated MOW equili-brates in denser isopycnic layers but at slightly shallowerdepths.[46] To be consistent with the varying oceanic water
profiles, the constant Sc is shifted by �0.53, �0.265,0.265, and 0.53 in defining the MOW in the four sensitivityexperiments. The comparison between HYCOM and MSBCis summarized in Figure 19. The increase of density in theoceanic water reduces the density contrast between theoutflow source water and the oceanic water, and this leadsto weaker entrainment and thus a smaller volume transportof outflow product water. Weaker entrainment means lessdilution of the outflow. Since the outflow begins with thesame source water properties, the salinity of the outflowproduct water varies much more than in the previousscenario of imposed source water change. Overall, thecomparison shows similar trends in the outflow productwater between HYCOM and MSBC.
Table 3. Parameters of the MSBC for the Mediterranean Outflowa
f,deg
W,km
ds,m
A,�106 km2
Q,W m�2
E–Pm a�1 a
de,m
PY98 36 20 300 2.5 0 0.7 0.012 400
Here - - - - �6.0 ��7.6
0.35 �0.75
- 600
aEntries f, W, and ds are the latitude, width, and sill depth of the Strait ofGibraltar; A, Q, and E–P are the area, the heat flux (negative indicates heatloss from the marginal sea), and the evaporation minus precipitation of theMediterranean Sea; a is the continental slope; de is the depth at whichentrainment takes place; and a dash means no change with respect to workby Price and Yang [1998].
Figure 17. Snapshots of salinity distribution at 8.6�W calculated by HYCOM in five experiments withdifferent density contrasts. (a, c) Cases with outflow source water changes. (b, d) Cases with ambientocean water changes.
C12005 XU ET AL.: MODELING MOW
16 of 20
C12005
[47] To quantify the variations in the outflow productwater properties relative to changes in outflow source waterand oceanic water, we define four non-dimensional quanti-
ties, (DrQp)
dQp
dDr, (DrSp)
dSpdDr, (
DrTp)
dTpdDr, (
DrDp)
dDp
dDr, where Qp, Sp, Tp,
and Dp are volume transport, salinity, temperature, and
equilibrium depth of the outflow product water (Table 4).These quantities can be interpreted as the variation, nor-malized by their reference values, induced by the variationof density contrast. The most pronounced result, as alreadypredicted by MSBC, is that the volume transport of the
Figure 18. Results from MSBC versus HYCOM in the case of outflow source water change. Lines arefrom MSBC, and circles are the HYCOM results. Error bars represent the standard deviation fortransport, salinity, and temperature, and the mean upper and lower interface of outflow plume for depth inHYCOM results. The red and blue colors represent the outflow source and product waters, respectively.
Figure 19. As in Figure 18, but for experiments in which the ocean water was changed. Note that thetransport, temperature, and equilibration depth shown here are very similar to those found in Figure 18.The salinity difference between source and product water is also similar to Figure 18.
C12005 XU ET AL.: MODELING MOW
17 of 20
C12005
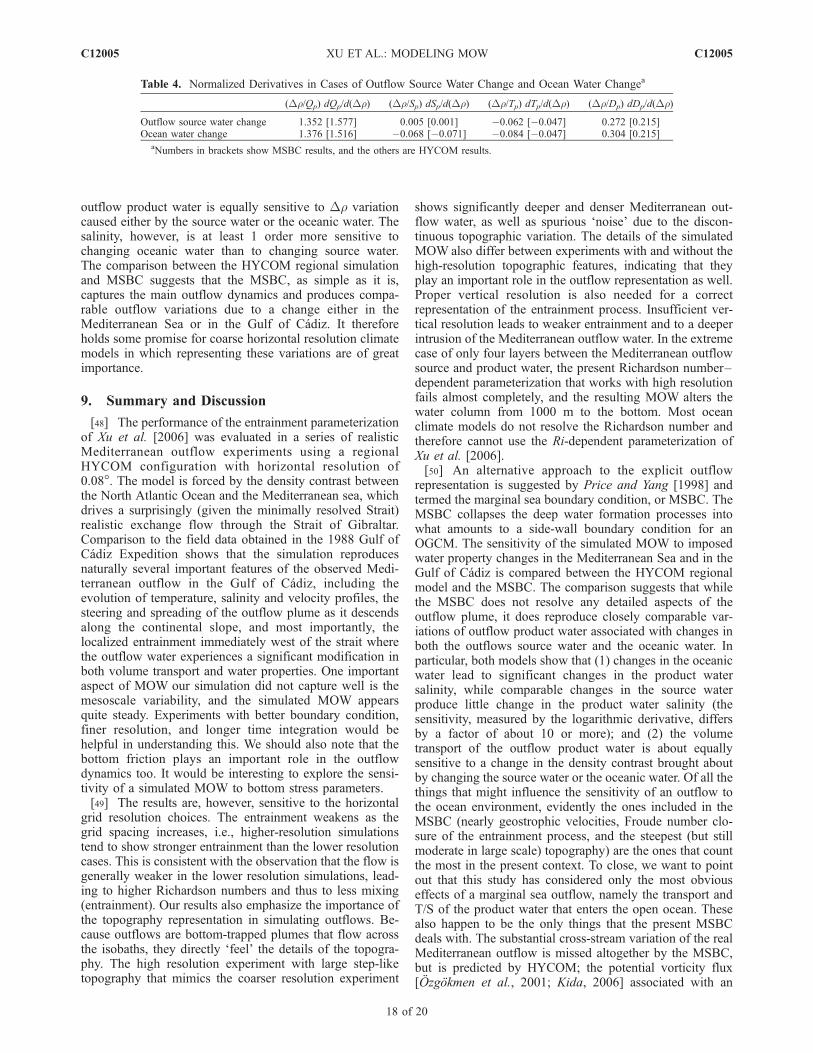
outflow product water is equally sensitive to Dr variationcaused either by the source water or the oceanic water. Thesalinity, however, is at least 1 order more sensitive tochanging oceanic water than to changing source water.The comparison between the HYCOM regional simulationand MSBC suggests that the MSBC, as simple as it is,captures the main outflow dynamics and produces compa-rable outflow variations due to a change either in theMediterranean Sea or in the Gulf of Cadiz. It thereforeholds some promise for coarse horizontal resolution climatemodels in which representing these variations are of greatimportance.
9. Summary and Discussion
[48] The performance of the entrainment parameterizationof Xu et al. [2006] was evaluated in a series of realisticMediterranean outflow experiments using a regionalHYCOM configuration with horizontal resolution of0.08�. The model is forced by the density contrast betweenthe North Atlantic Ocean and the Mediterranean sea, whichdrives a surprisingly (given the minimally resolved Strait)realistic exchange flow through the Strait of Gibraltar.Comparison to the field data obtained in the 1988 Gulf ofCadiz Expedition shows that the simulation reproducesnaturally several important features of the observed Medi-terranean outflow in the Gulf of Cadiz, including theevolution of temperature, salinity and velocity profiles, thesteering and spreading of the outflow plume as it descendsalong the continental slope, and most importantly, thelocalized entrainment immediately west of the strait wherethe outflow water experiences a significant modification inboth volume transport and water properties. One importantaspect of MOW our simulation did not capture well is themesoscale variability, and the simulated MOW appearsquite steady. Experiments with better boundary condition,finer resolution, and longer time integration would behelpful in understanding this. We should also note that thebottom friction plays an important role in the outflowdynamics too. It would be interesting to explore the sensi-tivity of a simulated MOW to bottom stress parameters.[49] The results are, however, sensitive to the horizontal
grid resolution choices. The entrainment weakens as thegrid spacing increases, i.e., higher-resolution simulationstend to show stronger entrainment than the lower resolutioncases. This is consistent with the observation that the flow isgenerally weaker in the lower resolution simulations, lead-ing to higher Richardson numbers and thus to less mixing(entrainment). Our results also emphasize the importance ofthe topography representation in simulating outflows. Be-cause outflows are bottom-trapped plumes that flow acrossthe isobaths, they directly ‘feel’ the details of the topogra-phy. The high resolution experiment with large step-liketopography that mimics the coarser resolution experiment
shows significantly deeper and denser Mediterranean out-flow water, as well as spurious ‘noise’ due to the discon-tinuous topographic variation. The details of the simulatedMOW also differ between experiments with and without thehigh-resolution topographic features, indicating that theyplay an important role in the outflow representation as well.Proper vertical resolution is also needed for a correctrepresentation of the entrainment process. Insufficient ver-tical resolution leads to weaker entrainment and to a deeperintrusion of the Mediterranean outflow water. In the extremecase of only four layers between the Mediterranean outflowsource and product water, the present Richardson number–dependent parameterization that works with high resolutionfails almost completely, and the resulting MOW alters thewater column from 1000 m to the bottom. Most oceanclimate models do not resolve the Richardson number andtherefore cannot use the Ri-dependent parameterization ofXu et al. [2006].[50] An alternative approach to the explicit outflow
representation is suggested by Price and Yang [1998] andtermed the marginal sea boundary condition, or MSBC. TheMSBC collapses the deep water formation processes intowhat amounts to a side-wall boundary condition for anOGCM. The sensitivity of the simulated MOW to imposedwater property changes in the Mediterranean Sea and in theGulf of Cadiz is compared between the HYCOM regionalmodel and the MSBC. The comparison suggests that whilethe MSBC does not resolve any detailed aspects of theoutflow plume, it does reproduce closely comparable var-iations of outflow product water associated with changes inboth the outflows source water and the oceanic water. Inparticular, both models show that (1) changes in the oceanicwater lead to significant changes in the product watersalinity, while comparable changes in the source waterproduce little change in the product water salinity (thesensitivity, measured by the logarithmic derivative, differsby a factor of about 10 or more); and (2) the volumetransport of the outflow product water is about equallysensitive to a change in the density contrast brought aboutby changing the source water or the oceanic water. Of all thethings that might influence the sensitivity of an outflow tothe ocean environment, evidently the ones included in theMSBC (nearly geostrophic velocities, Froude number clo-sure of the entrainment process, and the steepest (but stillmoderate in large scale) topography) are the ones that countthe most in the present context. To close, we want to pointout that this study has considered only the most obviouseffects of a marginal sea outflow, namely the transport andT/S of the product water that enters the open ocean. Thesealso happen to be the only things that the present MSBCdeals with. The substantial cross-stream variation of the realMediterranean outflow is missed altogether by the MSBC,but is predicted by HYCOM; the potential vorticity flux[Ozgokmen et al., 2001; Kida, 2006] associated with an
Table 4. Normalized Derivatives in Cases of Outflow Source Water Change and Ocean Water Changea
(Dr/Qp) dQp/d(Dr) (Dr/Sp) dSp/d(Dr) (Dr/Tp) dTp/d(Dr) (Dr/Dp) dDp/d(Dr)
Outflow source water change 1.352 [1.577] 0.005 [0.001] �0.062 [�0.047] 0.272 [0.215]Ocean water change 1.376 [1.516] �0.068 [�0.071] �0.084 [�0.047] 0.304 [0.215]
aNumbers in brackets show MSBC results, and the others are HYCOM results.
C12005 XU ET AL.: MODELING MOW
18 of 20
C12005
outflow is more imposed than predicted by the MSBC butis, again, predicted by HYCOM. If we knew these aspectsof outflow dynamics as well as we think we know the grosstransport and T/S properties, and if they are found to beimportant in climate-scale ocean models, then they mightperhaps be added to a future MSBC.
[51] Acknowledgments. We are grateful for the support of NationalScience Foundation via grant OCE0336799 and of the National OceanPartnership Program (NOPP) via award N000140410676. The authorsbenefited greatly from discussions with the other PIs of the Climate ProcessTeam on Entrainment in Gravity Currents. J. H. Dunlap and T. B. Sanfordfrom the University of Washington have kindly provided the preprocesseddata of the 1988 Gulf of Cadiz Expedition. We thank the two anonymousreviewers for their constructive comments and suggestions, which greatlyimproved the manuscript.
ReferencesAmbar, I. (1983), A shallow core of Mediterranean water off westernPortugal, Deep Sea Res., 30, 677–680.
Ambar, I., and M. R. Howe (1979a), Observations of the Mediterraneanoutflow. I. Mixing in the Mediterranean outflow, Deep Sea Res., Part A,26, 535–554.
Ambar, I., and M. R. Howe (1979b), Observations of the Mediterraneanoutflow. II. The deep circulation in the vicinity of the Gulf of Cadiz, DeepSea Res., Part A, 26, 555–568.
Ambar, I., N. Serra, M. J. Brogueira, G. Cabecadas, F. Abrantes, P. Freitas,C. Goncalves, and N. Gonzalez (2002), Physical, chemical and sedimen-tological aspects of the Mediterranean outflow off Iberia, Deep Sea Res.,Part II, 49, 4163–4177.
Baringer, M. O. (1993), Mixing and dynamics of the Mediterranean out-flow, WHOI-93-52, 244 pp, Woods Hole Oceanogr. Inst., Woods Hole,Mass.
Baringer, M. O., and J. F. Price (1997a), Mixing and spreading of theMediterranean outflow, J. Phys. Oceanogr., 27, 1654–1677.
Baringer, M. O., and J. F. Price (1997b), Momentum and energy balance ofthe Mediterranean outflow, J. Phys. Oceanogr., 27, 1678–1692.
Bleck, R. (2002), An oceanic general circulation model framed in hybridisopycnic-Cartesian coordinates, Ocean Modell., 37, 55–88.
Bower, A. S., L. Armi, and I. Ambar (1997), Lagrangian observations ofmeddy formation during a Mediterranean Undercurrent seeding experi-ment, J. Phys. Oceanogr., 27, 2545–2575.
Bower, A. S., B. L. Cann, T. Rossby, W. Zenk, J. Gould, K. Speer, P. L.Richardson, M. D. Prater, and H.-M. Zhang (2002), Directly measuredmid-depth circulation in the northeastern North Atlantic Ocean, Nature,419, 603–607.
Bryden, H. L., J. C. Candela, and T. H. Kinder (1994), Exchange throughthe Strait of Gibraltar, Prog. Oceanogr., 33, 201–248.
Candela, J. (2001), Mediterranean water and global circulation, in OceanCirculation and Climate, edited by G. Siedler, J. Church, and J. Gould,pp. 419–429, Academic Press, San Diego, Calif.
Chang, Y., X. Xu, T. Ozgokmen, E. P. Chassignet, H. Peters, and P. F.Fischer (2005), Comparison of gravity current mixing parameterizationsand calibration using a high-resolution 3D nonhydrostatic spectral ele-ment model, Ocean Modell., 10, 342–368.
Chassignet, E. P., L. T. Smith, G. R. Halliwell, and R. Bleck (2003), NorthAtlantic simulations with the hybrid coordinate ocean model (HYCOM):Impact of the vertical coordinate choice, reference pressure, and thermo-baricity, J. Phys. Oceanogr., 33, 2504–2526.
Curry, R. G., R. R. Dickson, and I. Yashayaev (2003), A change in thefreshwater balance of the Atlantic Ocean over the past four decades,Nature, 426, 826–829.
Daniault, N., J. P. Maze, and M. Arhan (1994), Circulation and mixing ofMediterranean water west of the Iberian Peninsula, Deep Sea Res., Part I,41, 1685–1714.
Griffies, S. M., C. Boning, F. O. Bryan, E. P. Chassignet, R. Gerdes,H. Hasumi, A. Hirst, A.-M. Treguier, and D. Webb (2000), Developmentsin ocean climate modelling, Ocean Modell., 2, 123–192.
Hallberg, R. (2000), Time integration of diapycnal diffusion and Richard-son number dependent mixing in isopycnal coordinate ocean models,Mon. Weather Rev., 128, 1402–1419.
Halliwell, G. R. (2004), Evaluation of vertical coordinate and vertical mix-ing algorithms in the HYbrid-Coorinate Ocean Model (HYCOM), OceanModell., 7, 285–322.
Hopkins, T. S. (1978), Physical processes in the Mediterranean basins, inEstuarine Transport Processes, edited by B. Kjerve, pp. 269–310, Univ.of S. C. Press, Columbia.
Hopkins, T. S. (1999), The thermohaline forcing of the Gibraltar exchange,J. Mar. Syst., 20, 1–31.
Iorga, M. C., and M. S. Lozier (1999a), Signatures of the Mediterraneanoutflow from a North Atlantic climatology: 1. Salinity and density fields,J. Geophys. Res., 104, 25,985–26,009.
Iorga, M. C., and M. S. Lozier (1999b), Signatures of the Mediterraneanoutflow from a North Atlantic climatology: 2. Diagnostic velocity fields,J. Geophys. Res., 104, 26,011–26,029.
Johnson, G. C., R. G. Lueck, and M. O. Baringer (1994a), Stress on theMediterranean outflow plume. Part II: Turbulent dissipation and shearmeasurement, J. Phys. Oceanogr., 24, 2084–2092.
Johnson, G. C., T. B. Sanford, and M. O. Baringer (1994b), Stress on theMediterranean outflow plume. Part I: Velocity and water property mea-surement, J. Phys. Oceanogr., 24, 2072–2083.
Jungclaus, J. H., and G. Mellor (2000), A three-dimensional model study ofthe Meditarranean outflow, J. Mar. Syst., 24, 41–66.
Kenyon, N. H., and R. H. Belderson (1973), Bed forms of the Mediterra-nean undercurrent observed with side-scan sonar, Sediment. Geol., 9,77–99.
Kida, S. (2006), Overflows and upper ocean interaction: A mechanism forthe Azores Current, Ph.D. thesis, Mass. Inst. of Technol./Woods HoleOceanogr. Inst. Joint Program, Woods Hole.
Lacombe, H., and C. Richez (1982), The regime of the strait of Gibraltar, inHydrodynamics of Semi-Enclosed Seas, Oceanogr. Ser., vol. 34, edited byJ. C. J. Nihoul, pp. 13–73, Elsevier, New York.
Large, W. G., J. C. McWilliams, and S. C. Doney (1994), Ocean verticalmixing: A review and a model with a nonlocal boundary layer parame-terization, Rev. Geophys., 32, 363–403.
Large, W. G., G. Danabasoglu, S. C. Doney, and J. C. McWilliams (1997),Sensitivity to surface forcing and boundary layer mixing in a globalocean model: Annual-mean climatology, J. Phys. Oceanogr., 27,2418–2447.
Levitus, S., and T. Boyer (1994), World Ocean Atlas 1994, vol. 4, Tem-perature, NOAA Atlas NESDIS 4, 129 pp., NOAA, Silver Spring, Md.
Madelain, F. (1970), Influence de la topographie du fond sur l’ecoulementMediterranee entre le Detroit de Gebraltar et le Cap Saint-Vincent, Cah.Oceanogr., 22, 43–61.
McCartney, M. S., and C. Mauritzen (2001), On the origin of the warminfow to the Nordic Seas, Prog. Oceanogr., 51, 125–214.
McDowell, S. E., and H. T. Rossby (1978), Mediterranean water: An in-tense mesoscale eddy off the Bahamas, Science, 202, 1085–1087.
Miles, J. W. (1961), On the stability of heterogeneous shear flows, J. FluidMech., 10, 496–508.
Ochoa, J., and N. A. Bray (1991), Water mass exchange in the Gulf ofCadiz, Deep Sea Res., 38, S465–S503, suppl. 1.
Ozgokmen, T. M., E. Chassignet, and C. H. Rooth (2001), On the connec-tion between the Mediterranean outflow and the Azores Current, J. Phys.Oceanogr., 31, 461–480.
Papadakis, M. P., E. P. Chassignet, and R. W. Hallberg (2003), Numericalsimulations of the Mediterranean Sea outflow: Impact of the entrainmentparameterization in an isopycnic coordinate model, Ocean Modell., 5,325–356.
Price, J. F., and M. O. Baringer (1994), Outflows and deep water productionby marginal seas, Prog. Oceanogr., 33, 161–200.
Price, J. F., and J. Yang (1998), Marginal sea overflows for climate simula-tions, in Ocean Modelling and Parameterization, edited by E. Chassignetand J. Verron, pp. 155–170, Kluwer Acad., Norwell, Mass.
Price, J. F.,M. O. Baringer, R. G. Lueck, G. C. Johnson, I. Ambar, G. Parrilla,A. Cantos, M. A. Kennelly, and T. B. Sanford (1993), Mediterranean out-flows and dynamics, Science, 259, 1277–1282.
Reid, J. L. (1979), On the contribution of the Mediterranean Sea outflowto the Norwegian-Greenland Sea, Deep Sea Res., Part A, 26, 1199–1223.
Reid, J. L. (1994), On the total geostrophic circulation of the North AtlanticOcean, Prog. Oceanogr., 33, 1–99.
Rhein, M., and H. H. Hinrichsen (1993), Modification of Mediterraneanwater in the Gulf of Cadiz, studied with hydrographic, nutrient andchlorofluoromethane data, Deep Sea Res., Part I, 40, 267–291.
Rohr, J. J., E. C. Itsweire, K. N. Helland, and C. V. Atta (1988), Growth anddecay of turbulence in stably stratified shear flow, J. Fluid Mech., 195,77–111.
Smith, P. C. (1975), A streamtube model for bottom boundary currents inthe ocean, Deep Sea Res., 22, 853–873.
Teague, W. J., M. J. Carron, and P. J. Hogan (1990), A comparison betweenthe Generalized Digital Environmental Model and Levitus climatologies,J. Geophys. Res., 95, 7167–7183.
Wust, G. (1961), On the vertical circulation of the Mediterranean Sea,J. Geophys. Res., 66, 3261–3271.
Xu, X., Y. S. Chang, H. Peters, T. M. Ozgokmen, and E. P. Chassignet(2006), Parameterization of gravity current entrainment for ocean circula-
C12005 XU ET AL.: MODELING MOW
19 of 20
C12005

tion models using a high-order 3D nonhydrostatic spectral element model,Ocean Modell., 14, 19–44.
Zenk, W. (1970), On the temperature and salinity structure of the Mediter-ranean Water in the North Atlantic, Deep Sea Res., 17, 627–631.
Zenk, W. (1975), On the Mediterranean Outflow west of Gibraltar, MeteorForschungsergeb. A, 16, 23–34.
Zenk, W., and L. Armi (1990), The complex spreading pattern of Mediter-ranean water off the Portuguese slope, Deep Sea Res., 37, 1805–2392.
�����������������������E. P. Chassignet, Center for Ocean-Atmospheric Prediction Studies,
Florida State University, 200 R. M. Johnson Building, 2035 East Paul
Dirac Drive, P.O. Box 3062840, Tallahassee, FL 32306-2840, USA.([email protected])T. M. Ozgokmen and H. Peters, Division of Meteorology and Physical
Oceanography, Rosenstiel School of Marine and Atmospheric Science,University of Miami, Miami, FL, USA. ([email protected];[email protected])J. F. Price, Physical Oceanography Department, Woods Hole Oceano-
graphic Institution, MS 29, Clark 209, Woods Hole, MA 02543, USA.([email protected])X. Xu, Department of Marine Science, University of Southern
Mississippi, 1020 Balch Boulevard, Stennis Space Center, MS 39529,USA. ([email protected])
C12005 XU ET AL.: MODELING MOW
20 of 20
C12005
Related Documents