A Reference Equation of State for the Thermodynamic Properties of Ethane for Temperatures from the Melting Line to 675 K and Pressures up to 900 MPa D. Bu ¨ cker a… and W. Wagner b… Lehrstuhl fu ¨r Thermodynamik, Ruhr-Universita ¨t Bochum, D-44780 Bochum, Germany Received 22 April 2004; revised manuscript received 9 November 2004; accepted 29 November 2004; published online 31 January 2006 A new formulation for the thermodynamic properties of the fluid phase of ethane in the form of a fundamental equation explicit in the Helmholtz energy is presented. The func- tional form of the residual part was developed using state-of-the-art linear and nonlinear optimization algorithms. It contains 44 coefficients which were fitted to selected data for the thermal and caloric properties of ethane both in the single-phase region and on the liquid–vapor phase boundary. This work provides information on the available experi- mental data for the thermodynamic properties of ethane and presents all details of the new formulation. The new equation of state describes the p T surface of ethane with an uncertainty in density of less than 0.02%–0.03% coverage factor k 2 corresponding to a level of confidence of about 95% from the melting line up to temperatures of 520 K and pressures of 30 MPa. In the gaseous and supercritical region, high precision speed of sound data are represented generally within less than 0.015%. Other reliable data sets are represented within their experimental uncertainties. The primary data, to which the equa- tion was fitted, cover the fluid region from the melting line to temperatures of 675 K and pressures of 900 MPa. Beyond this range the equation shows reasonable extrapolation behavior up to very high temperatures and pressures. In addition to the equation of state, independent equations for the vapor pressure, the saturated-liquid and saturated-vapor densities, and the melting pressure are given. Tables of thermodynamic properties calcu- lated from the new formulation are listed in the Appendix. © 2006 American Institute of Physics. DOI: 10.1063/1.1859286 Key words: caloric properties; density; ethane; equation of state; fundamental equation; property tables; thermal properties; thermodynamic properties; vapor–liquid phase boundary. Contents 1. Introduction................................ 209 1.1. Background............................ 209 1.2. Previous Equations of State............... 209 1.3. Notes on the Values of Temperature Used in This Article............................ 210 2. Phase Equilibria of Ethane.................... 210 2.1. Triple Point............................ 210 2.2. Critical Point........................... 211 2.3. Melting Pressure........................ 211 2.4. Vapor Pressure.......................... 211 2.5. Saturated-Liquid Density................. 211 2.6. Saturated-Vapor Density.................. 213 2.7. Caloric Data on the Vapor–Liquid Phase Boundary.............................. 214 2.7.1. Speed of Sound................... 214 2.7.2. Heat Capacities.................... 214 2.7.3. Enthalpy of Vaporization............ 215 3. Experimental Data for the Single-Phase Region... 215 3.1. Thermal Properties...................... 215 3.1.1. p T Data........................ 215 3.1.2. Virial Coefficients.................. 217 3.2. Speeds of Sound........................ 218 3.3. Isochoric Heat Capacities................. 219 3.4. Isobaric Heat Capacities.................. 220 3.4.1. Experimental Results for the Real Fluid............................ 220 3.4.2. Results for the Ideal-Gas State....... 221 3.5. Enthalpy Differences and Throttling Coefficients............................ 221 4. The New Equation of State................... 222 4.1. The Equation for the Helmholtz Energy of the Ideal Gas........................... 223 4.2. The Equation for the Residual Part of the Helmholtz Energy....................... 224 4.2.1. Fitting Procedures.................. 224 4.2.2. Selected Database.................. 225 4.2.3. The Equation for the Residual Part r . 225 5. Comparison of the New Equation of State with a Current address: E.ON Energy Projects GmbH,, Denisstr. 2, D-80335 Mu ¨nchen, Germany. b Author to whom correspondence should be addressed; electronic mail: [email protected] © 2006 American Institute of Physics. 0047-2689Õ2006Õ35„1…Õ205Õ62Õ$40.00 J. Phys. Chem. Ref. Data, Vol. 35, No. 1, 2006 205

Welcome message from author
This document is posted to help you gain knowledge. Please leave a comment to let me know what you think about it! Share it to your friends and learn new things together.
Transcript

A Reference Equation of State for the Thermodynamic Propertiesof Ethane for Temperatures from the Melting Line to 675 K
and Pressures up to 900 MPa
D. Buckera… and W. Wagnerb…
Lehrstuhl fur Thermodynamik, Ruhr-Universitat Bochum, D-44780 Bochum, Germany
�Received 22 April 2004; revised manuscript received 9 November 2004; accepted 29 November 2004; published online 31 January 2006�
A new formulation for the thermodynamic properties of the fluid phase of ethane in theform of a fundamental equation explicit in the Helmholtz energy is presented. The func-tional form of the residual part was developed using state-of-the-art linear and nonlinearoptimization algorithms. It contains 44 coefficients which were fitted to selected data forthe thermal and caloric properties of ethane both in the single-phase region and on theliquid–vapor phase boundary. This work provides information on the available experi-mental data for the thermodynamic properties of ethane and presents all details of thenew formulation. The new equation of state describes the p�T surface of ethane with anuncertainty in density of less than 0.02%–0.03% �coverage factor k�2 corresponding toa level of confidence of about 95%� from the melting line up to temperatures of 520 Kand pressures of 30 MPa. In the gaseous and supercritical region, high precision speed ofsound data are represented generally within less than 0.015%. Other reliable data sets arerepresented within their experimental uncertainties. The primary data, to which the equa-tion was fitted, cover the fluid region from the melting line to temperatures of 675 K andpressures of 900 MPa. Beyond this range the equation shows reasonable extrapolationbehavior up to very high temperatures and pressures. In addition to the equation of state,independent equations for the vapor pressure, the saturated-liquid and saturated-vapordensities, and the melting pressure are given. Tables of thermodynamic properties calcu-lated from the new formulation are listed in the Appendix. © 2006 American Institute ofPhysics. �DOI: 10.1063/1.1859286�
Key words: caloric properties; density; ethane; equation of state; fundamental equation; property tables;thermal properties; thermodynamic properties; vapor–liquid phase boundary.
Contents
1. Introduction. . . . . . . . . . . . . . . . . . . . . . . . . . . . . . . . 2091.1. Background. . . . . . . . . . . . . . . . . . . . . . . . . . . . 2091.2. Previous Equations of State. . . . . . . . . . . . . . . 2091.3. Notes on the Values of Temperature Used in
This Article. . . . . . . . . . . . . . . . . . . . . . . . . . . . 2102. Phase Equilibria of Ethane. . . . . . . . . . . . . . . . . . . . 210
2.1. Triple Point. . . . . . . . . . . . . . . . . . . . . . . . . . . . 2102.2. Critical Point. . . . . . . . . . . . . . . . . . . . . . . . . . . 2112.3. Melting Pressure. . . . . . . . . . . . . . . . . . . . . . . . 2112.4. Vapor Pressure. . . . . . . . . . . . . . . . . . . . . . . . . . 2112.5. Saturated-Liquid Density. . . . . . . . . . . . . . . . . 2112.6. Saturated-Vapor Density. . . . . . . . . . . . . . . . . . 2132.7. Caloric Data on the Vapor–Liquid Phase
Boundary. . . . . . . . . . . . . . . . . . . . . . . . . . . . . . 2142.7.1. Speed of Sound. . . . . . . . . . . . . . . . . . . 214
a�Current address: E.ON Energy Projects GmbH,, Denisstr. 2, D-80335Munchen, Germany.
b�Author to whom correspondence should be addressed; electronic mail:[email protected]© 2006 American Institute of Physics.
0047-2689Õ2006Õ35„1…Õ205Õ62Õ$40.00 205
2.7.2. Heat Capacities. . . . . . . . . . . . . . . . . . . . 2142.7.3. Enthalpy of Vaporization. . . . . . . . . . . . 215
3. Experimental Data for the Single-Phase Region... 2153.1. Thermal Properties. . . . . . . . . . . . . . . . . . . . . . 215
3.1.1. p�T Data. . . . . . . . . . . . . . . . . . . . . . . . 2153.1.2. Virial Coefficients. . . . . . . . . . . . . . . . . . 217
3.2. Speeds of Sound. . . . . . . . . . . . . . . . . . . . . . . . 2183.3. Isochoric Heat Capacities. . . . . . . . . . . . . . . . . 2193.4. Isobaric Heat Capacities. . . . . . . . . . . . . . . . . . 220
3.4.1. Experimental Results for the RealFluid. . . . . . . . . . . . . . . . . . . . . . . . . . . . 220
3.4.2. Results for the Ideal-Gas State. . . . . . . 2213.5. Enthalpy Differences and Throttling
Coefficients. . . . . . . . . . . . . . . . . . . . . . . . . . . . 2214. The New Equation of State. . . . . . . . . . . . . . . . . . . 222
4.1. The Equation for the Helmholtz Energy ofthe Ideal Gas. . . . . . . . . . . . . . . . . . . . . . . . . . . 223
4.2. The Equation for the Residual Part of theHelmholtz Energy. . . . . . . . . . . . . . . . . . . . . . . 2244.2.1. Fitting Procedures. . . . . . . . . . . . . . . . . . 2244.2.2. Selected Database. . . . . . . . . . . . . . . . . . 2254.2.3. The Equation for the Residual Part � r.. 225
5. Comparison of the New Equation of State with
J. Phys. Chem. Ref. Data, Vol. 35, No. 1, 2006

206206 D. BUCKER and W. WAGNER
Experimental Data. . . . . . . . . . . . . . . . . . . . . . . . . . 2265.1. The Vapor–Liquid Phase Boundary. . . . . . . . . 226
5.1.1. Thermal Properties. . . . . . . . . . . . . . . . . 2265.1.2. Caloric Properties. . . . . . . . . . . . . . . . . . 227
5.2. Single-Phase Region. . . . . . . . . . . . . . . . . . . . . 2285.2.1. p�T Data. . . . . . . . . . . . . . . . . . . . . . . . 2285.2.2. Virial Coefficients. . . . . . . . . . . . . . . . . . 2305.2.3. Speed of Sound. . . . . . . . . . . . . . . . . . . 2315.2.4. Isochoric Heat Capacity. . . . . . . . . . . . . 2325.2.5. Isobaric Heat Capacity. . . . . . . . . . . . . . 2325.2.6. Enthalpy Differences and Throttling
Coefficients. . . . . . . . . . . . . . . . . . . . . . . 2335.3. Critical Region. . . . . . . . . . . . . . . . . . . . . . . . . 233
5.3.1. Thermal Properties. . . . . . . . . . . . . . . . . 2345.3.2. Caloric Properties. . . . . . . . . . . . . . . . . . 234
5.4. Extrapolation Behavior. . . . . . . . . . . . . . . . . . . 2355.4.1. High Pressures and High
Temperatures. . . . . . . . . . . . . . . . . . . . . . 2355.4.2. Ideal Curves. . . . . . . . . . . . . . . . . . . . . . 235
6. Estimated Uncertainty of Calculated Properties. . . 2367. Recommendations for Improving the Basis of
the Experimental Data. . . . . . . . . . . . . . . . . . . . . . . 2368. Acknowledgments. . . . . . . . . . . . . . . . . . . . . . . . . . 2379. Appendix: Tables of Thermodynamic Properties
of Ethane. . . . . . . . . . . . . . . . . . . . . . . . . . . . . . . . . . 23710. References. . . . . . . . . . . . . . . . . . . . . . . . . . . . . . . . . 264
List of Tables1. Information on selected equations of state for
ethane. . . . . . . . . . . . . . . . . . . . . . . . . . . . . . . . . . . . 2092. Available data for the triple-point temperature of
ethane. . . . . . . . . . . . . . . . . . . . . . . . . . . . . . . . . . . . 2113. Available data for the critical point of ethane . . . . 2124. Summary of the data sets for the melting
pressure of ethane. . . . . . . . . . . . . . . . . . . . . . . . . . . 2125. Summary of the data sets for the vapor pressure
of ethane. . . . . . . . . . . . . . . . . . . . . . . . . . . . . . . . . . 2136. Summary of the data sets for the saturated-liquid
density of ethane. . . . . . . . . . . . . . . . . . . . . . . . . . . 2137. Summary of the data sets for the saturated-vapor
density of ethane. . . . . . . . . . . . . . . . . . . . . . . . . . . 2148. Summary of the data sets for the speed of sound
on the vapor–liquid phase boundary of ethane. . . 2149. Summary of the data sets for the heat capacity
along the saturated-liquid line of ethane. . . . . . . . . 21510. Summary of the data sets for the enthalpy of
vaporization of ethane. . . . . . . . . . . . . . . . . . . . . . . 21511. Summary of the p�T data sets that were
assigned to group 1 . . . . . . . . . . . . . . . . . . . . . . . . . 21612. Summary of the p�T data sets that were
assigned to groups 2 and 3. . . . . . . . . . . . . . . . . . . 21613. Summary of the data sets for the second and
third virial coefficients of ethane. . . . . . . . . . . . . . . 21814. Data for the second virial coefficients B
calculated by Klimeck �2000� from a square-wellpotential. . . . . . . . . . . . . . . . . . . . . . . . . . . . . . . . . . 218
15. Summary of the data sets for the speed of sound
J. Phys. Chem. Ref. Data, Vol. 35, No. 1, 2006
that were assigned to group 1 . . . . . . . . . . . . . . . . 21916. Summary of the data sets for the speed of sound
that were assigned to groups 2 and 3. . . . . . . . . . . 21917. Summary of the data sets for the isochoric heat
capacity that were assigned to group 1 . . . . . . . . . 22018. Summary of the data sets for the isochoric heat
capacity that were assigned to groups 2 and 3. . . . 22019. Summary of the data sets for the isobaric heat
capacity that were assigned to group 1 . . . . . . . . . 22120. Summary of the data sets for the isobaric heat
capacity that were assigned to groups 2 and 3. . . . 22221. Summary of the data sets for the isobaric heat
capacity in the ideal-gas state . . . . . . . . . . . . . . . . . 22222. Summary of the data sets for the enthalpy h , the
Joule–Thomson coefficient �, and the isothermalthrottling coefficient �T. . . . . . . . . . . . . . . . . . . . . . 223
23. Relations of thermodynamic properties to theideal-gas part �°, Eq. �4.6�, and the residualpart � r, Eq. �4.8�, of the dimensionless Helmholtzenergy and their derivatives. . . . . . . . . . . . . . . . . . . 223
24. Coefficients for the correlation equations for theideal-gas isobaric heat capacity and the ideal-gaspart of the Helmholtz energy, Eqs. �4.5� and�4.6�. . . . . . . . . . . . . . . . . . . . . . . . . . . . . . . . . . . . . . 224
25. The ideal-gas part �°, Eq. �4.6�, of thedimensionless Helmholtz free energy and itsderivatives. . . . . . . . . . . . . . . . . . . . . . . . . . . . . . . . . 224
26. Summary of the selected data that were used inthe linear and nonlinear optimization algorithms.. 225
27. Coefficients and exponents of Eq. �4.8�. . . . . . . . . 22628. The residual part � r, Eq. �4.8�, of the
dimensionless Helmholtz energy and itsderivatives. . . . . . . . . . . . . . . . . . . . . . . . . . . . . . . . . 227
29. Thermodynamic properties of ethane on thevapor–liquid phase boundary as a functionof temperature. . . . . . . . . . . . . . . . . . . . . . . . . . . . . . 238
30. Thermodynamic properties of ethane in thesingle-phase region. . . . . . . . . . . . . . . . . . . . . . . . . . 243
List of Figures1. Percentage deviations 100pm /pm�100(pm,exp
�pm,calc)/pm,exp of experimental data for themelting pressure pm from values calculated fromthe melting-pressure equation, Eq. �2.3�. . . . . . . . . 213
2. Absolute deviations and percentage deviations100ps /ps�100(ps,exp�ps,calc)/ps,exp ofexperimental data for the vapor pressure ps fromvalues calculated from the vapor-pressureequation, Eq. �2.4�. . . . . . . . . . . . . . . . . . . . . . . . . . 213
3. Percentage deviations 100��/���100(�exp���calc� )/�exp� of experimental data for thesaturated-liquid density �� from values calculatedfrom the equation for the saturated-liquiddensity, Eq. �2.5�. . . . . . . . . . . . . . . . . . . . . . . . . . . 214

207207EQUATION OF STATE FOR THE THERMODYNAMIC PROPERTIES OF ETHANE
4. Percentage deviations 100��/���100(�exp���calc� )/�exp� of the selected data for thesaturated-vapor density �� from values calculatedfrom the equation for the saturated-vapordensity, Eq. �2.6�. . . . . . . . . . . . . . . . . . . . . . . . . . . 214
5. Distribution of the experimental p�T data usedto develop the residual part of the equation ofstate, Eq. �4.1�, in a p-T diagram. . . . . . . . . . . . . . 217
6. Distribution of the experimental data for thespeed of sound used to develop the residualpart of the equation of state, Eq. �4.1�, in a p-Tdiagram. . . . . . . . . . . . . . . . . . . . . . . . . . . . . . . . . . . 219
7. Distribution of the experimental data for theisochoric heat capacity used to develop theresidual part of the equation of state, Eq. �4.1�,in a p-T diagram. . . . . . . . . . . . . . . . . . . . . . . . . . . 220
8. Distribution of the experimental data for theisobaric heat capacity used to develop theresidual part of the equation of state, Eq. �4.1�,in a p-T diagram. . . . . . . . . . . . . . . . . . . . . . . . . . . 221
9. Absolute and percentage deviations �100ym /ym
�100(ym,exp�ym,calc)/ym,exp with y�ps ,��,��]of the selected thermal data at saturationfrom values calculated from Eq. �4.1�. Valuescalculated from the ancillary equations,Eqs. �2.4�–�2.6�, and from the equation of stateof Friend et al. �1991� are plotted forcomparison. . . . . . . . . . . . . . . . . . . . . . . . . . . . . . . . 227
10. Percentage deviations �100ym /ym�100(ym,exp
�ym,calc)/ym,exp with y�w�,c] of experimentaldata for the speed of sound in the saturatedliquid and for the heat capacity along thesaturated-liquid line from values calculated fromthe equation of state, Eq. �4.1�. Valuescalculated from the equation of state of Friendet al. �1991� are plotted for comparison. . . . . . . . . 228
11. Representation of the speed of sound on thephase boundary near the critical point. Theplotted curves correspond to values calculatedfrom the equation of state, Eq. �4.1�, and from theequation of state of Friend et al. �1991�. . . . . . . . . 228
12. Percentage density deviations of highly accuratep�T data �95–210 K� from values calculatedfrom the equation of state, Eq. �4.1�. Valuescalculated from the equation of state of Friendet al. �1991� are plotted for comparison. . . . . . . . . 228
13. Percentage density deviations of highly accuratep�T data �240–520 K� from values calculatedfrom the equation of state, Eq. �4.1�. Valuescalculated from the equation of state of Friendet al. �1991� are plotted for comparison. . . . . . . . . 229
14. Percentage density deviations of p�T data �120–350 K� assigned to groups 1 and 2 from valuescalculated from the equation of state, Eq.�4.1�. Values calculated from the equation ofFriend et al. �1991� are plotted for comparison. . . 229
15. Percentage density deviations of p�T data �373–623 K� assigned to groups 1 and 2 from valuescalculated from the equation of state, Eq.�4.1�. Values calculated from the equation ofFriend et al. �1991� are plotted for comparison. . . 229
16. Percentage density deviations of p�T data in thehigh-pressure region from values calculated fromthe equation of state, Eq. �4.1�. Valuescalculated from the equation of Friend et al.�1991� are plotted for comparison. Note that therange of validity of the equation of Friendet al. �1991� is restricted to pressures up to 70MPa and temperatures up to 625 K. . . . . . . . . . . . 230
17. Representation of data for the second virialcoefficient at temperatures up to 650 K. Theplotted lines correspond to values calculated fromthe equation of state, Eq. �4.1�, and from theequation of Friend et al. �1991�. . . . . . . . . . . . . . . . 230
18. Representation of data for the third virialcoefficient at temperatures up to 650 K.The plotted lines correspond to values calculatedfrom the equation of state, Eq. �4.1�, andfrom the equation of Friend et al. �1991�. . . . . . . . 231
19. Percentage deviations of highly accurate speedof sound data for densities up to about half thecritical density from values calculated fromthe equation of state, Eq. �4.1�. Values calculatedfrom the equation of Friend et al. �1991� areplotted for comparison. . . . . . . . . . . . . . . . . . . . . . . 231
20. Percentage deviations of speed of sound data inthe liquid and supercritical region from valuescalculated from the equation of state, Eq. �4.1�.Values calculated from the equation of Friendet al. �1991� are plotted for comparison. . . . . . . . . 232
21. Percentage deviations of group 1 isochoric heatcapacity data from values calculated from theequation of state, Eq. �4.1�. Values calculated fromthe equation of Friend et al. �1991� are plottedfor comparison. . . . . . . . . . . . . . . . . . . . . . . . . . . . . 232
22. Percentage deviations of isobaric heat capacitydata assigned to groups 1 and 2 from valuescalculated from the equation of state, Eq. �4.1�.Values calculated from the equation of Friendet al. �1991� are plotted for comparison. . . . . . . . . 232
23. Percentage deviations of experimental enthalpydifferences from values calculated from theequation of state, Eq. �4.1�. Deviations betweenisobaric enthalpy differences for T�1 K,calculated from the equation of Friend et al.�1991� and Eq. �4.1� are plotted for comparison. . 233
24. Percentage deviations of experimental data forthe Joule–Thomson coefficient from valuescalculated from the equation of state, Eq. �4.1�.Values calculated from the equation of Friendet al. �1991� are plotted for comparison. . . . . . . . . 233
J. Phys. Chem. Ref. Data, Vol. 35, No. 1, 2006

208208 D. BUCKER and W. WAGNER
25. Representation of experimental data for theisothermal throttling coefficient. The plottedlines correspond to values calculated from theequation of state, Eq. �4.1�, and from the equationof Friend et al. �1991�. . . . . . . . . . . . . . . . . . . . . . . 234
26. Percentage pressure deviations of highlyaccurate p�T data in the extended critical regionfrom values calculated from the equation ofstate, Eq. �4.1�. Values calculated from theequation of Friend et al. �1991� are plotted forcomparison. . . . . . . . . . . . . . . . . . . . . . . . . . . . . . . . 234
27. Representation of the isochoric heat capacity onthe critical isochore. The plotted lines correspondto values calculated from the equation ofstate, Eq. �4.1�, and from the equation of Friendet al. �1991�. . . . . . . . . . . . . . . . . . . . . . . . . . . . . . . 235
28. Representation of the speed of sound onisotherms in the extended critical region. Theplotted lines correspond to values calculatedfrom the equation of state, Eq. �4.1�, and from theequation of Friend et al. �1991�. . . . . . . . . . . . . . . . 235
29. Representation of data calculated from thereference equation of state for nitrogen �Spanet al. �2000�� and transferred to ethane by a simplecorresponding states approach. The plottedlines correspond to values calculated from theequation of state, Eq. �4.1�, and from the equationof Friend et al. �1991�. . . . . . . . . . . . . . . . . . . . . . . 235
30. ‘‘Ideal curves’’ in a double logarithmic p/pc vs.T/Tc diagram. The curves correspond to valuescalculated from the equation of state, Eq.�4.1�, and from the equation of Friend et al.�1991�. The area marked in gray corresponds tothe region where Eq. �4.1� was fitted toexperimental data. . . . . . . . . . . . . . . . . . . . . . . . . . . 236
31. Tolerance diagram for densities calculated fromthe equation of state, Eq. �4.1�. In the extendedcritical region the uncertainty in pressure isgiven. . . . . . . . . . . . . . . . . . . . . . . . . . . . . . . . . . . . . 236
32. Tolerance diagram for speeds of sound calculatedfrom the equation of state, Eq. �4.1�. . . . . . . . . . . . 236
33. Tolerance diagram for isobaric and isochoricheat capacities calculated from the equationof state, Eq. �4.1�. . . . . . . . . . . . . . . . . . . . . . . . . . . 237
Nomenclature
Latin symbols
a specific Helmholtz energyB second virial coefficientc density exponentcp specific isobaric heat capacitycv specific isochoric heat capacityc specific heat capacity along the saturated-liquid lineC third virial coefficientd density exponent
J. Phys. Chem. Ref. Data, Vol. 35, No. 1, 2006
g specific Gibbs energyh specific enthalpyi , j serial numbersM molar massn adjustable coefficientp pressureR specific gas constantRm molar gas constants specific entropyt temperature exponentT thermodynamic temperature, ITS-90u specific internal energyv specific volumew speed of soundy any thermodynamic propertyZ compression factor �Z�p/(�RT)�
Greek symbols
� dimensionless Helmholtz energy ���a/(RT)��,�, ,�,� adjustable parameters� reduced density (���/�c)�T isothermal throttling coefficient ��T�(�h/�p)T� difference in any quantity� transformed temperature (��1�T/Tc)� Joule-Thomson coefficient ���(�T/�p)h�� mass density� inverse reduced temperature (��Tc /T)
Superscripts
° ideal-gas stater residual contribution� saturated-liquid state� saturated-vapor state
Subscripts0 at some reference state90 based on ITS-90b at the normal boiling pointc at the critical pointcalc calculatedexp experimentalh isenthalpici , j indicesm denotes a state on the melting curvep isobarics denotes a state on the vapor–pressure curves isentropic along the saturated-liquid linet at the triple pointT isothermalv isochoric

209209EQUATION OF STATE FOR THE THERMODYNAMIC PROPERTIES OF ETHANE
Physical Constants and Characteristic Properties of EthaneMolar mass M�30.069 04 g mol�1 �Coplen �2001��Universal gas constant Rm�8.314 472 J mol�1 K�1 �Mohr and Taylor �1999��Specific gas constant R�0.276 512 72 kJ kg�1 K�1
Critical pointTemperature Tc�305.322 K �Funke et al. �2002b��Pressure pc�4.8722 MPa �Funke et al. �2002b��Density �c�206.18 kg m�3 �Funke et al. �2002b��
Triple pointTemperature T t�90.368 K �Funke et al. �2002b��Pressure p t�1.14 Pa �Sec. 2.1�
Reference stateTemperature T0�298.15 KPressure p0�0.101 325 MPaSpecific enthalpy h0
° �0 kJ kg�1
ßpecific entropy s0° �0 kJ kg�1 K�1
1. Introduction
1.1. Background
As the second member of the alkane series and one of themajor components of natural gas, ethane is important bothfor industrial and scientific applications. An accurate knowl-edge of the thermodynamic properties of ethane is of vitalinterest as much to the power and the chemical industry as toscientists in a broad variety of research fields. Numerousexperimental studies of the thermodynamic properties ofethane have been carried out over the last century, and todayhigh precision data of its thermal and caloric properties areavailable for a wide range of temperatures and pressures.This work is part of an international collaboration betweenthe Ruhr University in Bochum and the National Institute ofStandards and Technology in Bolder to characterize the prop-erties of ethane �this work�, propane �Lemmon, McLinden,and Wagner to be published in J. Phys. Chem. Ref. Data�,and the butanes �Bucker and Wagner, accepted for publica-tion in J. Phys. Chem. Ref. Data, 35, 2006�.
Over the last few decades, a lot of work has been done bythe National Institute of Standards and Technology to collectinformation on the thermodynamic properties of ethane.Comprehensive tables were published by Goodwin et al.�1976� and equations of state were developed by Youngloveand Ely �1987� and Friend et al. �1991�. Since the publica-tion of the latter equation, the thermodynamic surface ofethane has been redefined by highly accurate measurementsof the thermal and acoustic properties. Moreover, correlation
techniques have improved considerably. Particularly, sophis-ticated procedures for the optimization of the functional form�Setzmann and Wagner �1989�, Tegeler et al. �1997�� weredeveloped that provide powerful tools for the developmentof accurate empirical equations of state.
1.2. Previous Equations of State
A number of correlation equations are available for thethermodynamic properties of ethane. However, none of theseequations meets current demands on accuracy. Table 1 sum-marizes selected equations of state for ethane that cover largeparts of the fluid region and that are commonly used in in-dustrial or scientific applications.
Teja and Singh �1977� fitted the coefficients of a Bender-type equation of state. This was the first accurate equationthat could describe the homogeneous fluid region of ethaneincluding the vapor–liquid phase equilibrium. The coeffi-cients were refitted later by Buhner et al. �1981� to accountfor more recent data sets.
A higher accuracy and hence a new reference for the ther-modynamic properties of ethane was attained in the work ofYounglove and Ely �1987� by fitting the coefficients of anequation of state of the modified Benedict–Webb–Rubin�MBWR� type. In the same year, the first equation with afunctional form specially designed for the description of theproperties of ethane was published by Sychev et al. �1987�.The equation had been developed in Russia in 1982. Al-though the tables in the work of Sychev et al. were widely
TABLE 1. Information on selected equations of state for ethane
Authors YearTemperature
range/KUpper pressure
limit/MPaStructure
of the equationNumber ofcoefficients
Span & Wagner 2003a, b 90–623 52 Helmholtz energy 12Friend et al. 1991 90–625 70 Helmholtz energy 32Sychev et al. 1987 90–700 80 Compression factor 50Younglove & Ely 1987 90–600 70 Pressure explicit 32Buhner et al. 1981 90–573 100 Pressure explicit 20Teja & Singh 1977 185–1000 81 Pressure explicit 20
J. Phys. Chem. Ref. Data, Vol. 35, No. 1, 2006

210210 D. BUCKER and W. WAGNER
used, the equation itself never was of great importance sincethe MBWR-type equation of Younglove and Ely is superiorboth with respect to the functional form and the data used tofit the coefficients.
Till now, the reference for the thermodynamic propertiesof ethane has been an equation developed at NIST by Friendet al. �1991�. The functional form of this equation was origi-nally developed by Schmidt and Wagner �1985� for the de-scription of the thermodynamic properties of oxygen. Thedata used in the fit include thermal properties in the single-phase region and on the vapor–liquid phase boundary, sec-ond virial coefficients, speeds of sound in the homogenousregion and on the phase boundary, isochoric and isobaricheat capacities, and heat capacities along the saturated-liquidline. The correlation function for the ideal-gas part was fittedto data reported by Chao et al. �1973�.
A simultaneously optimized functional form was intro-duced by Span and Wagner �2003a, 2003b� for simple non-polar fluids, including ethane. The rather short functionalform was developed for a broad range of substances. Theaim was not to reach the highest possible accuracy for eachsubstance but rather to establish a new class of equationswhich are numerically very stable and which can easily beadopted to physically similar substances even when only re-stricted data sets are available. These equations are strictlydesigned for technical applications and do not compete withhighly accurate reference equations of state. Data from therecent high precision measurements of the thermal propertiesby Funke et al. �2002a, 2002b� and Claus et al. �2003� werenot available when the simultaneously optimized equationswere set up.
Each of the aforementioned equations has several of thefollowing disadvantages:
�1� State-of-the-art data for the thermodynamic properties ofethane are not represented within their experimental un-certainty.
�2� Unreasonable behavior is observed in regions with apoor data situation.
�3� Extrapolation to temperatures and pressures outside therange of validity yields unreasonable results.
�4� Data in the extended critical region are not describedwithin their accuracy.
�5� The temperature values do not correspond to the currentInternational Temperature Scale of 1990 �ITS-90�.
In this paper, a new equation of state for ethane is pre-sented to overcome these shortcomings. The thermodynamicsurface of ethane in the range covered by reliable experimen-tal data is described within the experimental uncertainties.The new equation was developed using current fitting proce-dures and state-of-the-art linear and nonlinear optimizationalgorithms.
1.3. Notes on the Values of Temperature Usedin This Article
�1� All correlation equations presented in this article refer tothe ITS-90.
J. Phys. Chem. Ref. Data, Vol. 35, No. 1, 2006
�2� No distinction is made between the thermodynamic tem-perature T and the temperature T90 of the currently validInternational Temperature Scale of 1990 �ITS-90�, seePreston-Thomas �1990�.
�3� Temperature values of available experimental data refer-ring to older temperature scales were converted to ITS-90. The conversion from the IPTS-68 temperature scaleto ITS-90 temperatures was carried out based on conver-sion equations given by Rusby �1991�. Data correspond-ing to the IPTS-48 temperature scale were converted toIPTS-68 according to the procedure given by Bedfordand Kirby �1969�.
�4� Values calculated from literature equations that are usedin the corresponding figures for comparison purposeswere, if necessary, converted from their original tem-perature scale to ITS-90 values.
2. Phase Equilibria of Ethane
Ancillary equations, which accurately describe the phaseequilibria, are an important precondition for the developmentof a wide-range equation of state. Additionally, they serve asa helpful tool for users who are interested in phase equilibriaonly. To establish the experimental basis for these equations,the available experimental information on the triple point,the critical point, the melting pressure, the vapor pressure,the saturated liquid and vapor densities, and on caloric prop-erties on the vapor–liquid phase boundary have been re-viewed. Simple correlation equations are given for the ther-mal properties.
To provide the reader with an assessment of the qualityand importance of the different experimental data, all datasets have been divided into three groups. The assignmentconsiders the critically assessed uncertainty of the data, thesize of the data set, the covered temperature range, and thedata situation of the corresponding property in the relevantregion. Data that are of no significance in regions wherehighly accurate experimental data are available may gain im-portance in regions where the data situation is poor. Group 1includes all the data used for the development of the corre-sponding correlation equation. Group 2 contains reliable datasets suitable for comparisons. These data are inferior in qual-ity to the group 1 data with respect to at least one of theaspects mentioned above. Data sets that are very small orthat show great uncertainties are assigned to group 3 and arenot taken under further consideration here. However, an as-signment to this group does not imply a devaluation of thedata. The ranking is determined by the quality relative to thebest available reference data rather than by any kind of ab-solute level of quality, and data that do not contribute to thelevel of accuracy aspired to here may be very useful for otherpurposes.
2.1. Triple Point
The temperature of the gas-liquid-solid triple point ofethane has been determined by different authors since 1930.Table 2 shows selected values of the triple-point temperature

211211EQUATION OF STATE FOR THE THERMODYNAMIC PROPERTIES OF ETHANE
as reported in literature. Some of the older values differgreatly from the more recent and more reliable values. Inaddition to the inferior measurement techniques, this dis-agreement is owed to a total of three different solid phaseswith transitions between them occurring closely beneath thetemperature of the gas-liquid-solid triple point. The valuereported by Funke et al. �2002b� was selected in this work:
T t��90.368�0.005� K. �2.1a�
No experimental values for the pressure at the triple point areavailable. Therefore, the triple-point pressure was taken as
p t�1.14 Pa, �2.1b�
which was calculated by inserting the temperature for thetriple point as given in Eq. �2.1a� into the vapor-pressureequation, Eq. �2.4�.
2.2. Critical Point
Values for the critical parameters of ethane reported inliterature are compiled in Table 3. The parameters reportedby Funke et al. �2002b� were determined by evaluation oftheir accurate measurements of the thermal properties on thevapor–liquid phase boundary. These data are consistent withthe precise density measurements in the homogeneous regionas published by Funke et al. �2002a� and were used as thecritical parameters in this work:
Tc��305.322�0.01� K, �2.2a�
pc��4.8722�0.0011� MPa, �2.2b�
�c��206.18�0.15� kg m�3. �2.2c�
2.3. Melting Pressure
Table 4 gives a summary of the available data sets for themelting pressure of ethane. In this work, the melting pressureis used only as the limit of the range of validity of the fun-damental equation. Three of the referred articles only give agraphical presentation of their results. These data were notconsidered for the development of the correlation equationbecause the other data sets, namely the ones published byStraty and Tsumura �1976a� and by Schutte et al. �1979�,give reliable information on the melting pressure up to 1026
TABLE 2. Available data for the triple-point temperature of ethane
Authors T t /K
Funke et al. �2002b� 90.368�0.005Pavese �1978� 90.361�0.001a
Atake & Chihara �1976� 90.350�0.002Roder �1976a� 90.342�0.05Straty & Tsumura �1976a� 90.357�0.005Eggers �1975� 90.279�0.02Burnett & Muller �1970� 89.829�0.03Clusius & Weigand �1940� 90.36�0.03Witt & Kemp �1937� 89.88�0.1Wiebe et al. �1930� 89.53�0.1
aUncertainty implicitly set to 0.005 K by Bedford et al. �1984�.
MPa. Based on the data reported by Straty and Tsumura�1976a� and Schutte et al. �1979�, a simple correlation equa-tion was formulated for the melting pressure of ethane:
pm
p t�1�n1� T
T t�1��n2� � T
T t� 2.55
�1� , �2.3�
with p t�1.14 Pa, T t�90.368 K, n1�2.236 26315�108,and n2�1.052 623 74�108. The upper temperature limit ofEq. �2.3� is T�195 K. Figure 1 compares measured meltingpressures with values calculated from Eq. �2.3�. The equationrepresents all pm data used in the fit to within 0.7%.
2.4. Vapor Pressure
The earliest measurements of the vapor pressure of ethanewere reported more than 100 years ago. Since then, this im-portant fluid property has been continually investigated. Theavailable 26 data sets are summarized in Table 5. The vaporpressures reported by Douslin and Harrison �1973� and byFunke et al. �2002b� are consistent within 0.01% and wereassigned to group 1. The data set published by Funke et al.�2002b� describes the entire vapor–pressure curve with verylow uncertainties, ranging from 0.006% near the criticalpoint to 0.02% in vapor pressure at T�195 K. At tempera-tures below 190 K, enlarged relative uncertainties arise froman absolute contribution of 2–20 Pa to the relative uncer-tainty. Nevertheless, these data are still substantially moreaccurate than the other data sets for which similar effects areencountered. Data that deviate from the aforementioned ref-erence data by no more than (0.2%�50 Pa) are assigned togroup 2.
The vapor–pressure equation of Funke et al. �2002b� isalso used here to describe the vapor–pressure curve
ln� ps
pc��
Tc
T�n1��n2�1.5�n3�2.5�n4�3.5�n5�4�,
�2.4�
with ��1�T/Tc , Tc�305.322 K, pc�4.8722 MPa, n1
��6.486 475 77, n2�1.470 100 78, n3��1.662 611 22,n4�3.578 983 78, and n5��4.791 057 05. Comparisons ofthe group 1 and group 2 data with values calculated from Eq.�2.4� are given in Fig. 2. The diagram is divided into twoparts. On the left hand side, absolute deviations are shownfor temperatures below 170 K, while on the right hand side,percentage deviations are shown for higher temperatures.
2.5. Saturated-Liquid Density
The 20 available data sets for the saturated-liquid densityof ethane are compiled in Table 6. Only the data measured byFunke et al. �2002b� were assigned to group 1. The reporteduncertainties of the data are less than 0.016% in density attemperatures from the triple point to 303 K. In the vicinity ofthe critical point, the reported uncertainties increase, but donot exceed 0.4%. Group 2 data deviate from these referencevalues by no more than 0.2% in general.
J. Phys. Chem. Ref. Data, Vol. 35, No. 1, 2006

212212 D. BUCKER and W. WAGNER
TABLE 3. Available data for the critical point of ethane. Uncertainties are given where the original articles contain such estimates
Authors Method Tc /K pc /MPa �c /(kg m�3)
Funke et al. �2002b� A 305.322�0.01 4.8722�0.0011 206.18�0.15Ambrose & Tsonopoulos �1995� B 305.32�0.04 4.872�0.01 206.6�3Colgate et al. �1992� C 305.362 4.879Friend et al. �1991� B 305.32�0.04 4.8718�0.005 206.6�3Brunner �1988� D 305.38�0.1 4.877�0.005Brunner �1987� D 305.6 4.889Younglove & Ely �1987� B 305.33 4.87143 206.7Morrison & Kincaid �1984� D 305.385�0.001 200.9Sychev et al. �1987� B 305.32�0.02 4.8714�0.005 204.46Bulavin & Shimanskii �1979� E 305.339 205.8�4Burton & Balzarini �1974� D 305.221�0.03 206.2�0.3Strumpf et al. �1974� D 305.36 205.5Douslin & Harrison �1973� F 305.322 4.8718 206.6Bulavin et al. �1971� E 305.342 206.2Khazanova & Sominskaya �1971� D 305.33 4.88 203.9Miniovich & Sorina �1971� E 305.34�0.005 4.8749�0.000 05 205.8�0.7Chaskin et al. �1970� E 305.49�0.01 205.1�0.6Sliwinski �1969� E 305.326Tsiklis & Prokhorov �1967� D 305.28 203Khodeeva �1966� D 305.6 203.5Kay �1964� D 305.4 4.93Tanneberger �1959� E 305.39Kay & Albert �1956� D 305.1 4.876Palmer �1954� D 305.45Schmidt & Thomas �1954� D 305.32 5.044Kay & Brice �1953� D 305.1 4.876Whiteway & Mason �1953� D 305.3 215Kay & Nevens �1952� D 305.24 4.875 201.9Murray & Mason �1952� D 305.36Atack & Schneider �1950� D 305.5Lu et al. �1941� D 305.2 4.92Mason et al. �1940� D 305.36Beattie et al. �1939a� F 305.4 4.884 203.0�2Kay �1938� D 305.4 4.91 220Sage et al. �1937� F 305.7 4.951 212Prins �1915� D 305.47 4.877Cardoso & Bell �1912� D 305.25 4.950Kuenen & Robson �1902a� D 305.05 4.907 207Olszewski �1895� D 307 5.09Dewar �1884� D 308 4.58Hainlen �1894� D 307.6 5.1
Methods used to determine the critical parameters:A Evaluation of measurements of the saturated-vapor and saturated-liquid densities in the critical region.B Equation of state/evaluation of published data.C Evaluation of speed of sound measurements on the phase boundary.D Disappearance of the meniscus.E Other methods or no method indicated.F Evaluation of p�T measurements.
TABLE 4. Summary of the data sets for the melting pressure of ethane
AuthorsNumberof data
Pressurerange/MPa Group
van der Putten et al. �1985� 12a 650–1200 —Wieldraaijer et al. �1983� 8a 2500–4700 —Geijsel et al. �1979� 6a 500–2500 —Schutte et al. �1979� 7 213–1026 1Straty & Tsumura �1976a� 16 0.3–33 1Clusius & Weigand �1940� 7 0.6–4.3 3
aData presented in graphs only.
J. Phys. Chem. Ref. Data, Vol. 35, No. 1, 2006
The equation given by Funke et al. �2002b� for thesaturated-liquid density
ln� ��
�c���n1�0.329�n2�4/6�n3�8/6�n4�19/6�,
�2.5�
with ��1�T/Tc , Tc�305.322 K, �c�206.18 kg m�3, n1
�1.561 380 26, n2��0.381 552 776, n3�0.078 537 2040,n4�0.037 031 5089, was adopted for this work. Figure 3shows comparisons of values calculated with Eq. �2.5� to theexperimental data assigned to groups 1 and 2.

213213EQUATION OF STATE FOR THE THERMODYNAMIC PROPERTIES OF ETHANE
2.6. Saturated-Vapor Density
Accurate measurement of the saturated-vapor density isdifficult as compared to the other thermal properties on thevapor–liquid phase boundary. Consequently, appreciablyfewer data are available for this property than for the vaporpressure or the saturated-liquid density. The seven availabledata sets are summarized in Table 7. Again, the data reportedby Funke et al. �2002b� were the only values assigned togroup 1. The other data sets are of substantially inferior qual-ity. The uncertainties of the saturated-vapor densities re-
FIG. 1. Percentage deviations 100pm /pm�100(pm,exp�pm,calc)/pm,exp ofexperimental data for the melting pressure pm from values calculated fromthe melting-pressure equation, Eq. �2.3�.
TABLE 5. Summary of the data sets for the vapor pressure of ethane
AuthorsNumberof data
Temperaturerange/K Group
Funke et al. �2002b� 44 90–305 1Holcomb et al. �1995� 6 242–299 3Brown et al. �1988� 8 207–270 3Barclay et al. �1982� 7 198–278 3Luo & Miller �1981� 5 220–250 2Ohgaki & Katayama �1977� 5 283–298 3Pal et al. �1976� 50 214–305 2Straty & Tsumura �1976b� 44 160–300 2Fredenslund & Mollerup �1974� 5 223–293 2Gugnoni et al. �1974� 4 241–283 3Carruth & Kobayashi �1973� 11 91–144 2Douslin & Harrison �1973� 18 238–305 1a
Kahre �1973� 5 267–300 3Pope �1972� 9 198–305 2Regnier �1972� 21 89–135 2Chui & Canfield �1971� 2 115–162 3Miniovich & Sorina �1971� 15 302–305 2Djordjevich & Budenholzer �1970� 6 127–256 3Van Hook �1966� 182 112–201 2Tickner & Lossing �1951� 13 89–130 3Beattie et al. �1935� 2 273–298 3Loomis & Walters �1926� 34 135–200 3Porter �1926� 20 184–289 3Maass & Wright �1921� 7 172–201 3Burell & Robertson �1915� 19 113–184 3Kuenen & Robson �1902b� 15 194–274 3
aAlthough the data were assigned to group 1, they were not used to developthe new correlation equations because the entire phase boundary is coveredby the highly accurate and very consistent data of Funke et al. �2002b�.
ported by Funke et al. �2002b� are generally less than0.017% at temperatures from 240 to 303 K. In the vicinity ofthe critical point, the uncertainties increase up to 0.8% at T�305.3 K. Towards lower temperatures, uncertainties in-crease up to 0.07% at T�185 K. Below this temperature, noexperimental determination of saturated-vapor densities hasbeen achieved yet. Therefore, Funke et al. �2002b� deter-mined reliable densities from a virial equation of state withrelative uncertainties comparable to those of their experi-mental vapor-pressure data.
Based on these data, Funke et al. �2002b� set up a corre-lation equation for the saturated-vapor density of ethane
ln� ��
�c��
Tc
T�n1�0.346�n2�5/6�n3��n4�2�n5�3
�n6�5�, �2.6�
FIG. 2. Absolute deviations and percentage deviations 100ps /ps
�100(ps,exp�ps,calc)/ps,exp of experimental data for the vapor pressure ps
from values calculated from the vapor-pressure equation, Eq. �2.4�.
TABLE 6. Summary of the data sets for the saturated-liquid density of ethane
AuthorsNumberof data
Temperaturerange/K Group
Funke et al. �2002b� 42 91–305 1Pestak et al. �1987� 39 299–305 3Shinsaka et al. �1985� 20 113–205 3Luo & Miller �1981� 5 220–250 2Orrit & Laupretre �1978� 43 103–232 2Haynes & Hiza �1977� 22 100–270 2McClune �1976� 17 93–173 2Pal et al. �1976� 11 216–304 3Gugnoni et al. �1974� 4 241–283 3Douslin & Harrison �1973� 13 248–305 3Kahre �1973� 10 267–300 3Chui & Canfield �1971� 2 116–161 2Khazanova & Sominskaya �1971� 7 302–305 3Miniovich & Sorina �1971� 8 303–305 2Tomlinson �1971� 7 283–302 3Sliwinski �1969� 11 283–305 2Klosek & McKinley �1968� 8 94–183 2Leadbetter et al. �1964� 18 127–183 3Mason et al. �1940� 33 296–305 3Maass & Wright �1921� 10 165–200 3
J. Phys. Chem. Ref. Data, Vol. 35, No. 1, 2006

214214 D. BUCKER and W. WAGNER
with ��1�T/Tc , Tc�305.322 K, �c�206.18 kg m�3, n1
��1.898 791 45, n2��3.654 592 62, n3�0.850 562 745,n4�0.363 965 487, n5��1.500 059 43, and n6
��2.266 903 89, which was adopted for this work. Com-parisons of the available data and saturated-vapor densitiescalculated from Eq. �2.6� are shown in Fig. 4. The inconsis-tencies between the reference data reported by Funke et al.�2002b� and the older data are well appreciable.
2.7. Caloric Data on the Vapor–LiquidPhase Boundary
No ancillary equations have been developed for the caloricproperties on the vapor–liquid phase boundary, but the group1 data were included in the development of the new equationof state.
2.7.1. Speed of Sound
Four data sets are available for the speed of sound in satu-rated liquid ethane. Poole and Aziz �1972� and Colgate et al.�1992� used resonators while Vangeel �1976� and Tsumuraand Straty �1977� performed measurements using pulse-echotechniques. The only available experimental speeds of soundin the saturated vapor were reported by Colgate et al. �1992�.The relevant information on all data sets is given in Table 8.
The measurements by Colgate et al. �1992� were carriedout in the immediate vicinity of the critical point. The objec-
TABLE 7. Summary of the data sets for the saturated-vapor density of ethane
AuthorsNumberof data
Temperaturerange/K Group
Funke et al. �2002b� 32a 185–305 1Pestak et al. �1987� 39 299–305 3Douslin & Harrison �1973� 13 248–305 3Khazanova & Sominskaya �1971� 13 303–305 3Miniovich & Sorina �1971� 8 303–305 3Sliwinski �1969� 11 283–305 3Porter �1926� 14 185–288 3
aAdditionally, 12 values were calculated from a virial equation at tempera-tures from 91 to 170 K.
FIG. 3. Percentage deviations 100��/���100(�exp� ��calc� )/�exp� of experi-mental data for the saturated-liquid density �� from values calculated fromthe equation for the saturated-liquid density, Eq. �2.5�.
J. Phys. Chem. Ref. Data, Vol. 35, No. 1, 2006
tive of the investigation was rather the determination of thecritical parameters of ethane than the actual speed of sounddata themselves. Accordingly, no estimates are given for therelevant uncertainties. Resonator techniques generally per-form best at low densities, while uncertainties of the mea-sured speeds of sound will increase substantially when ap-proaching the critical point, see Trusler �1991�. Nonetheless,these data give important information on the speed of soundin the vicinity of the critical point of ethane.
The pulse-echo technique, as applied by Vangeel �1976�and Tsumura and Straty �1977�, is considered to be the mostappropriate method for the determination of saturated-liquidspeeds of sound. Tsumura and Straty �1977� report uncertain-ties of the measured variables of 0.01% in pressure, 0.05 Kin temperature, and 0.06%–0.1% in speed of sound, whilethe purity of the ethane is reported as 99.98%. Vangeel�1976� gives estimated total uncertainties of 0.2% in speed ofsound. The uncertainties of both data sets are expected to behigher at low temperatures near the triple point due to dis-persion effects and at high temperatures when approachingthe critical temperature. In both regions, greater inconsisten-cies between the data sets can be observed that exceed thecombined claimed uncertainties. The values of the speed ofsound published by Poole and Aziz �1972� deviate system-atically from the more reliable data by Vangeel �1976� andTsumura and Straty �1977�.
2.7.2. Heat Capacities
While no data are available for the heat capacity of eitherthe saturated liquid or the saturated vapor, four data sets
FIG. 4. Percentage deviations 100��/���100(�exp� ��calc� )/�exp� of the se-lected data for the saturated-vapor density �� from values calculated fromthe equation for the saturated-vapor density, Eq. �2.6�.
TABLE 8. Summary of the data sets for the speed of sound on the vapor–liquid phase boundary of ethane
Authors
Number of dataTemperature
range/K Groupw� w�
Colgate et al. �1992� 14 8 304–305 2Tsumura & Straty �1977� 55 — 90–305 1Vangeel �1976� 44 — 98–288 1Poole & Aziz �1972� 25 — 92–199 2

215215EQUATION OF STATE FOR THE THERMODYNAMIC PROPERTIES OF ETHANE
containing experimental values of heat capacities c alongthe saturated-liquid line have been published. They are sum-marized in Table 9. Amongst the older data sets, the resultsof Wiebe et al. �1930� and Witt and Kemp �1937� are con-sistent within 0.7%, while the results of Eucken and Hauck�1928� deviate from these by up to 20%. Only the most re-cent data set, published by Roder �1976b�, was used for thedevelopment of the new equation of state. The reported totaluncertainties of the heat capacities are less than 0.5% exceptfor the vicinity of the critical temperature where the uncer-tainties increase to 5%. Roder �1976b� expects potential un-detected systematic errors to be less than 2%.
The relation between the dimensionless Helmholtz energyand c contains the first derivative of the vapor pressure �seeTable 23�. Direct inclusion of this property in the nonlinearfit therefore involves an interlocked relation to the Maxwellcriterion as given by Eq. �4.2�. To avoid numerical problems,the specific heat capacities along the saturated-liquid linehave been transformed into specific isobaric heat capacitiesat the saturated-liquid line according to
cp��T ��c�T ��T
��2
� �p
�T ��
dps
dT
� �p
�� �T
. �2.7�
The loss of accuracy associated with this transformation isnegligible if accurate preliminary equations are used to cal-culate the fraction in Eq. �2.7� or if temperatures are near thetriple point.
2.7.3. Enthalpy of Vaporization
Experimental data on the enthalpy of vaporization ofethane are given in two sources, which are listed in Table 10.The enthalpy of vaporization is linked directly to the vaporpressure and the orthobaric liquid and vapor densities by theequation of Clausius–Clapeyron. Since these properties are
TABLE 9. Summary of the data sets for the heat capacity along the saturated-liquid line of ethane
AuthorsNumberof data
Temperaturerange/K Group
Roder �1976b� 106 93–301 1Witt & Kemp �1937� 29 92–180 3Wiebe et al. �1930� 50 97–295 3Eucken & Hauck �1928� 18 100–270 3
TABLE 10. Summary of the data sets for the enthalpy of vaporization ofethane
AuthorsNumberof data
Temperaturerange/K Group
Miyazaki et al. �1980� 2 289–301 3Dana et al. �1926� 11 233–272 3
very accurately known, none of the data for the enthalpy ofvaporization were taken into account in the development ofthe new equation of state.
3. Experimental Data for the Single-PhaseRegion
This section presents experimental data sets for the ther-modynamic properties of ethane in the homogeneous fluidregion. General information on all available data sets andmore detailed information on the data selected for the devel-opment of the new equation of state are presented in thefollowing tables. Where appropriate, the data have been clas-sified into three groups as explained in Sec. 2. Since the datasituation in the homogeneous region is more involved thanon the phase boundaries, some data sets are assigned to morethan one group. Typically, these data sets reside in regionswith sparse or poor data and are used only for comparisonsin regions where more reliable data are available.
The uncertainties given in the tables usually correspond toestimates reported by the authors. In some studies, however,the stated uncertainties appear overly optimistic or no esti-mates are given at all. In these cases, we had to estimatemore realistic values for the uncertainties. In the tables, thesevalues are presented in parentheses.
3.1. Thermal Properties
3.1.1. p�T Data
During the last century, the thermal properties of ethanehave been investigated by numerous experimental studies.The fluid region is described with very good quality up totemperatures of 625 K and pressures of 70 MPa. Further-more, high-pressure data are available up to 673 K and 900MPa. Many of the 37 available data sets, however, do notmeet the level of accuracy aspired to here. Table 11 givesdetails on the data sets that were assigned to group 1. How-ever, not every data point was used to set up the new equa-tion of state. The number of data actually used is specified inthe row ‘‘selected data.’’ Table 12 summarizes the data setsthat were assigned to groups 2 and 3.
At temperatures up to 340 K and pressures up to 12 MPa,the thermal behavior of ethane is defined very accurately bythe data published by Funke et al. �2002a�. The measure-ments have been performed on ethane with a reported purityof 99.9984% using a two-sinker densimeter, which is prob-ably the most accurate technique for the measurement offluid densities available today. In the vicinity of the criticalpoint, this study is supplemented by the work of Funke et al.�2002b� who provide another high accuracy data set mea-sured with the two-sinker densimeter. Details on the experi-mental setup are given by Kleinrahm and Wagner �1986�,Handel et al. �1992�, and Wagner and Kleinrahm �2004�.
The region described by highly accurate p�T data is ex-tended to temperatures up to 520 K and pressures up to 30MPa by the work of Claus et al. �2003� who used a single-sinker densimeter. The densimeter was developed by Bracht-
J. Phys. Chem. Ref. Data, Vol. 35, No. 1, 2006

216216 D. BUCKER and W. WAGNER
TABLE 11. Summary of the p�T data sets that were assigned to group 1. Uncertainties are given where the original articles contain such estimates. Uncertaintyvalues in parentheses were estimated by ourselves
Authors
Number of dataTemperature
range/KPressure
range/MPaTotal uncertainty
in densityTotal Selected
Claus et al. �2003� 168 168 240–520 1–30 0.02%–0.03%Funke et al. �2002a� 356 356 140–340 0.2–12 0.015%–0.022%Funke et al. �2002b� 203 203 303–305 4.7–4.9 0.006%–0.016%a
Mansoorian et al. �1981� 91 91 323–473 0.04–5.4 0.033% �0.05%–0.2%�Golovskii et al. �1978� 112 57 92–270 1.2–60 �0.25%�Straty & Tsumura �1976b� 477 153 92–320 0.4–38 0.1%–0.2%b
Pal et al. �1976� 267 58 157–344 0.52–73 0.2% �0.4%�Douslin & Harrison �1973� 298 58 248–623 1.2–41 0.03%–0.3%Tsiklis et al. �1972� 75 75 323–673 200–900 �2%�Beattie et al. �1939b� 82 20 323–548 6.1–36 �0.2%�
aTotal uncertainty in pressure. These values also apply for the data reported by Funke et al. �2002a� in the temperature range from 298 to 318 K at densitiesbetween 120 and 280 kg m�3.
bThese values apply for the selected data, not for the entire data set.
hauser et al. �1993� to extend the operating range of thebuoyancy method by using a simpler setup without a signifi-cant loss of accuracy compared to the two-sinker method, seealso Wagner et al. �1995� and Wagner and Kleinrahm �2004�.The ethane used had a reported purity of 99.99%.
Mansoorian et al. �1981� performed measurements in thegas region at pressures reaching down to 0.04 MPa and tem-peratures from 323 to 473 K using the Burnett method. Thepurity of the sample is reported to be 99.99%. These data
J. Phys. Chem. Ref. Data, Vol. 35, No. 1, 2006
were used to supplement the aforementioned data sets at lowpressures. In this particular region, namely at pressures be-low 0.69 MPa, a shift of the null position of the differentialpressure transducers was identified by the authors to be thedominating source of error leading to uncertainties of up to0.17% in density at the lowest pressures. The data are con-sistent with the values reported by Funke et al. �2002a� towithin 0.05%. At pressures below 0.2 MPa, where no otherreliable data are available, we estimate the total uncertainty
TABLE 12. Summary of the p�T data sets that were assigned to groups 2 and 3
AuthorsNumberof data
Temperaturerange/K
Pressurerange/MPa Group
Byun et al. �2000� 36 373–423 15–276 3Lau et al. �1997� 46 240–350 1.1–34 3Hou et al. �1996� 44 300–320 0.11–6.6 3Guo et al. �1992� 18 273–293 1.3–3.7 2Weber �1992� 11 320 0.34–4.3 2Jaeschke & Humphreys �1990�a 222 260–360 0.10–27 2Jaeschke & Humphreys �1990�b 121 280–348 0.22–26 2Lau �1986� 56 240–350 1.1–34 3Parrish �1984� 9 300–322 5.52–9.65 3Young �1978� 52 250–300 0.49–1.6 2Besserer & Robinson �1973� 68 311–394 0.69–10 3Rodosevich & Miller �1973� 4 91–115 0.02 2Pope �1972� 191 210–306 0.11–4.95 3Chui & Canfield �1971� 2 116–161 0.0007–0.024 2Khazanova & Sominskaya �1971� 87 299–318 0.49–7.4 3Tomlinson �1971� 61 280–325 4.28–13.80 2Jensen & Kurata �1969� 7 103–163 0.02–0.05 3Wallace et al. �1964� 20 248–348 0.07–0.2 2Michels et al. �1954� 101 273–423 1.6–22 2Lambert et al. �1949� 5 293–353 0.1 3Reamer et al. �1944� 183 311–511 0.1–69 3Beattie et al. �1939a� 86 305 4.87–4.89 3Michels & Nederbragt �1939� 12 273–323 1.0–6.0 3Sage et al. �1937� 305 294–394 0.1–24 3Beattie et al. �1935� 97 298–523 1.1–20 3Burrell & Jones �1921� 87 288 0.1–3.1 3Quint �1902� 71 286–326 3.2–3.7 3
aValues obtained by measurement of the refractive index.bValues obtained using a Burnett apparatus.

217217EQUATION OF STATE FOR THE THERMODYNAMIC PROPERTIES OF ETHANE
in this region to be less than 0.2% in density.Extensive measurements at temperatures up to 623 K and
pressures up to 41 MPa have been performed by Douslin andHarrison �1973�. The pycnometer-based method involves nu-merous sources of uncertainties and requires a complex as-sessment of the measured variables. Reported total uncer-tainties of the measured densities vary from 0.03% at lowtemperatures and pressures to 0.3% at the highest tempera-tures and pressures. The isotherms measured by Douslin andHarrison �1973� exhibit a steeper increase in density withpressure than those published by Claus et al. �2003�. How-ever, this systematic effect remains within the claimed uncer-tainties. We used the data of Douslin and Harrison �1973�above 520 K for the development of the new equation ofstate, deliberately accepting deviations from the data thatcould be traced back to the aforementioned inconsistencies.
The results of two earlier studies, by Beattie et al. �1939b�and Michels et al. �1954� show better agreement with thedata of Claus et al. �2003� at high temperatures. Both studieswere performed using piezometric setups. Maximum densitydeviations from the reference data of Claus et al. �2003� are0.1%. Some of the data of Beattie et al. �1939b� have beenused for the development of the new equation of state attemperatures above 498 K to complement the data of Dou-slin and Harrison �1973�.
The liquid and the supercritical region, particularly athigher pressures, have been the subject of two more piezo-metric studies in the 1970s. The data measured by Golovskiiet al. �1978� were published by Sychev et al. �1987�. Theauthors used ethane with a reported purity of 99.99% andstated a total uncertainty of the density values of 0.01%.Considering both the measurement technique and the appar-ent scatter in the data, this estimate appears to be overlyoptimistic. The second group, Pal et al. �1976�, estimated thetotal uncertainties of their p�T data to be 0.2% in density,and reported a purity of the specimen of 99.95%. Both datasets generally agree with the high accuracy data sets towithin 0.25% in density, with a few of the values reported byPal et al. �1976� showing notably larger deviations. Datafrom both sets have been selected at pressures above 30 MPato direct the shape of the p�T surface at elevated pressures.
A slightly better consistency with the reference data isseen in the results reported by Straty and Tsumura �1976b�,who used a Burnett apparatus to obtain density values. Thedata generally agree with the values reported by Funke et al.�2002a� to within 0.2%, except for the near-critical region.The ethane sample is stated to be 99.98% pure, total uncer-tainties of the density values are estimated to be 1% in thevicinity of the critical point and 0.1%–0.2% elsewhere. Thevalues were not used in regions where data from the work ofFunke et al. �2002a� are available, but they could be used attemperatures below 240 K to expand the reliably measuredregion towards higher and lower pressures.
At very high pressures, up to 900 MPa, and temperaturesup to 673 K, Tsiklis et al. �1972� obtained density valuesusing a high-pressure piezometer. In view of the extremeexperimental conditions, the accuracy of the data may be
considered as uncertain. However, the results provide impor-tant information on the thermal behavior of ethane in thehigh-pressure region.
In a p-T diagram, Fig. 5 shows the p�T data that wereused to establish the new equation of state. Although a num-ber of additional studies are available, some of which pro-vide very reliable data for the thermal properties, none ofthem were selected for the development of the new equationof state. In most cases, the range of parameters investigatedlies completely within the region covered by high accuracydata.
3.1.2. Virial Coefficients
Table 13 summarizes the available data sets for the secondand third virial coefficients of ethane. Except for the valuescalculated by Klimeck �2000� these virial coefficients onlycover temperatures above 190 K. Values of the virial coeffi-cients are usually established by isothermal fits to p�T mea-surements. Consequently, such virial coefficients do not con-tain much new information which is not given by thegenuine p�T data. In any case, if one includes virial coeffi-cients in the development of an equation of state, then onlythose values should be used that were derived from veryaccurate p�T data. Therefore, only the B values of Funkeet al. �2002a�, which are based on the most accurate p�Tdata and are given for temperatures from 240 to 340 K, wereused to develop the new equation of state. For low tempera-tures from 71 to 200 K there are second virial coefficientscalculated by Klimeck �2000� from a square-well potentialgiven by Mason and Spurling �1969�. These values wereused in the development of the new equation of state in order
FIG. 5. Distribution of the experimental p�T data used to develop the re-sidual part of the equation of state, Eq. �4.1�, in a p-T diagram.
J. Phys. Chem. Ref. Data, Vol. 35, No. 1, 2006

218218 D. BUCKER and W. WAGNER
to ensure reasonable plots of the virial coefficients at lowtemperatures. Since these data are not readily published, theyare given in Table 14.
3.2. Speeds of Sound
Over the course of the last 2 decades, the importance ofexperimental data for the isentropic speed of sound in thedevelopment of equations of state has increased profoundly.The main reason is the development of highly precise mea-surement techniques, see Trusler �1991�. Today, the highestaccuracy is attained by spherical resonators. Especially in thelow-density region, where fluid modes and resonator modesremain uncoupled, this method yields the same reliability asthe most accurate density measurements. At higher densitiesthe coupling between resonator and fluid modes gains impacton the resonance frequencies, leading to a significant loss ofaccuracy. For this reason, reliable measurements in high-density regions, especially in the liquid phase, are not fea-sible with this technique.
Estrada-Alexanders and Trusler �1997� established themost comprehensive and most accurate data set available forthe speed of sound in gaseous ethane using a spherical reso-nator. The measurements were conducted on 99.99% pureethane along isotherms between 220 and 450 K. The highestdensity on each isotherm corresponds to approximately0.8�� at subcritical temperatures and to 0.5�c at supercriticaltemperatures to ensure that coupling effects between resona-
TABLE 13. Summary of the data sets for the second and third virial coeffi-cients of ethane
Authors
Number of dataTemperature
range/KB C
Funke et al. �2002a� 14a 14 240–340Klimeck �2000� 44a,b 14 71–200Estrada-Alexanders & Trusler �1997� 20 — 200–600Hou et al. �1996� 2 2 300–320Bell et al. �1992� 3 — 290–310Kerl & Hausler �1984� 5 — 299–365Holste et al. �1982� 1 1 300Mansoorian et al. �1981� 7 7 323–473Rigby et al. �1980� 4 — 273–323Hahn et al. �1974� 4 — 199–251Schafer et al. �1974� 6 — 295–511Douslin & Harrison �1973� 16 16 273–623Pope �1972� 5 5 210–306Strein et al. �1971� 10 — 286–493Lichtenthaler & Schafer �1969� 5 — 288–323Hoover et al. �1968� 3 3 215–273Huff & Reed �1963� 8 — 273–511Gunn �1958� 8 — 273–510Hamann & McManamey �1953� 14 — 303–423Lambert et al. �1949� 5 — 291–351Hirschfelder et al. �1942� 10 — 298–523Eucken & Parts �1933� 15 — 192–273
aThese values were considered in the development of the new equation ofstate.
bSee Table 14.
J. Phys. Chem. Ref. Data, Vol. 35, No. 1, 2006
tor and fluid modes remain negligible. All data from thisstudy were considered in the development of the equation ofstate presented here.
Trusler and Costa Gomes �1996� used a similar setup toconduct measurements for the Groupe Europeen de Recher-ches Gazieres. The estimated total uncertainties of the speedof sound values are given as 0.025%. Nevertheless, theirresults are approximately 0.02% lower than the values re-ported by Estrada-Alexanders and Trusler �1997�. At 300 K,these discrepancies reach up to �0.06%, which is clearlybeyond the combined estimated uncertainties. On the 350 Kisotherm, values have been measured at pressures to 20 MPa,with the density being more than 1.6�c . These values aresubject to a substantially larger uncertainty. We assume theyare accurate to within 0.15% and included them in the devel-opment of the new equation of state since they give impor-tant information on the crossover from low-density to high-density speeds of sound at supercritical states.
The results of two more measurement runs with sphericalresonators are available. The values reported by Boyes�1992� are in excellent agreement with the data reported byEstrada-Alexanders and Trusler �1997�. Differences are lessthan 0.005% except for the 300 K isotherm, where deviationsof up to �0.025% can be observed. The data published byLemming �1989� are generally consistent with the results ofthe other authors to within 0.02%. At 350 K, however, thespeeds of sound reported by Lemming �1989� are about�0.035% higher than the values obtained by Estrada-Alexanders and Trusler �1997�.
With the exception of a few values, all available data setsthat were obtained with spherical resonators are mutuallyconsistent within 0.05% in speed of sound, which confirmsthe remarkable quality of the data.
TABLE 14. Data for the second virial coefficients B calculated by Klimeck�2000� from a square-well potential
T/K B/(cm3 mol�1) T/K B/(cm3 mol�1)
71 �5956.62 137 �942.4874 �5160.99 140 �897.0277 �4517.31 143 �855.0280 �3989.65 146 �816.1483 �3551.94 149 �780.0586 �3184.96 152 �746.4889 �2874.30 155 �715.2092 �2608.98 158 �685.9995 �2380.56 161 �658.6698 �2182.48 164 �633.04
101 �2009.54 167 �608.99104 �1857.61 170 �586.38107 �1723.38 173 �565.09110 �1604.16 176 �545.01113 �1497.75 179 �526.04116 �1402.33 182 �508.10119 �1316.42 185 �491.12122 �1238.76 188 �475.02125 �1168.29 191 �459.73128 �1104.13 194 �445.21131 �1045.52 197 �431.39134 �991.82 200 �418.23

219219EQUATION OF STATE FOR THE THERMODYNAMIC PROPERTIES OF ETHANE
TABLE 15. Summary of the data sets for the speed of sound that were assigned to group 1. Uncertainties are given where the original articles contain suchestimates. Uncertainty values in parentheses were estimated by ourselves
Authors
Number of dataTemperature
range/KPressure
range/MPaTotal uncertaintyin speed of soundTotal Selected
Estrada-Alexanders & Trusler �1997� 186 186 220–450 0.01–10 0.01% �up to 0.05%�Trusler & Costa Gomez �1996� 52 7 250–350 0.03–19.60 0.025% �0.15%�Boyes �1992� 71 51 210–360 0.02–1 �0.02% up to 0.05%�Lemming �1989� 163 127 223–351 0.02–0.6 0.007 �up to 0.05%�Tsumura & Straty �1977� 154 154 100–323 3.56–36.83 0.06%–0.1%a
aClose to the critical point the uncertainties are expected to be higher than these estimates.
The most important set of caloric data for ethane at higherdensities was published by Tsumura and Straty �1977�. Theauthors obtained values for the speed of sound by the pulse-echo method in large parts of the liquid and supercriticalregions. The ethane sample is stated to be 99.98% pure, andthe authors report their experimental uncertainties of the dif-ferent variables to be 0.01% in pressure, 0.05 K in tempera-ture, and 0.06%–0.1% in speed of sound, with the highestuncertainties occurring in the proximity of the critical point.From this, the total uncertainties in the speeds of sound canbe estimated to be 0.06%–0.1% except for the near-criticalregion, where higher uncertainties are expected.
Table 15 gives details on the data sets that were selectedfor the development of the new equation of state. These dataare also shown in a p-T diagram in Fig. 6. The data sets thatwere assigned to groups 2 and 3 are compiled in Table 16.
3.3. Isochoric Heat Capacities
Four of the total of five experimental studies that are avail-able for the isochoric heat capacity of ethane investigated thenear-critical region or the critical isochore. Berestov et al.�1973� investigated the influence of gravity on the isochoric
FIG. 6. Distribution of the experimental data for the speed of sound used todevelop the residual part of the equation of state, Eq. �4.1�, in a p-T dia-gram.
heat capacity of pure fluids in the vicinity of the criticalpoint. The calorimetric measurements were performed toverify predictions from scaled equations of state. The authorsdo not give any details on the purity of the ethane sample oron the numerical value of the density investigated. The iso-chore on which the measurements were conducted is referredto as ‘‘critical.’’ Plotting the absolute values against tempera-ture reveals good consistency to reliable measurements per-formed by Haase and Tillmann �1994�, see Sec. 5.3.2. All ofthe data reported by Berestov et al. �1973� were obtainedwithin �T�Tc��0.15 K. Due to its functional form �see thestatement at the end of Sec. 4.2.1�, the new equation of statecannot reproduce the steep increase in isochoric heat capac-ity that is observed in this immediate vicinity of the criticalpoint. Only the three values at the greatest distance from thecritical temperature were included in the development of thenew equation of state. Since the authors do not give a densityvalue, we chose the critical density used in this work, ��206.18 kg m�3. Moreover, we did not use the absolutevalues of temperature as given by Berestov et al. �1973�, butrather the distance from the critical temperature, T�TBerestov�Tc,Berestov , and calculated new values T�Tc,this work�T with Tc,this work�305.322 K. In this way,we transformed the data to suit the critical parameters chosenin this work.
Haase and Tillman �1994�, Shmakov �1973�, and Abdula-gatov et al. �1996� investigated near-critical isochores takinga more general approach. The estimated uncertainties re-ported by Abdulagatov et al. �1996� appear too optimistic.Their experimental heat capacities are 20%–25% higher thanthose reported by the other authors. The data measured byHaase and Tillmann �1994� and by Shmakov �1973� are mu-tually consistent. Unfortunately, the authors do not give es-timates of the experimental uncertainties. The data reportedby Haase and Tillman �1994� were used to establish the newequation of state.
TABLE 16. Summary of the data sets for the speed of sound that wereassigned to groups 2 and 3
AuthorsNumberof data
Temperaturerange/K
Pressurerange/MPa Group
Terres et al. �1957� 99 292–448 0.00–11.77 3Noury �1952� 89 304–306 1.18–14.42 2
J. Phys. Chem. Ref. Data, Vol. 35, No. 1, 2006

220220 D. BUCKER and W. WAGNER
Data for the isochoric heat capacity in the remaining fluidregions are of greater importance for the development of awide-range equation as presented in this work. Such mea-surements were performed extensively by Roder �1976b�.The reported uncertainties in cv are 0.5%–5% excludingpossible systematic errors. The data give important informa-tion on the temperature derivative of the Helmholtz energy.The selected data are shown in a p-T diagram in Fig. 7,while details on the available data sets are summarized inTables 17 and 18.
3.4. Isobaric Heat Capacities
This section is divided into two parts. The first part pre-sents values obtained for the isobaric heat capacity of the realfluid. Just like the other properties discussed in this chapter,these isobaric heat capacities were obtained by measure-ments. The second section is concerned with the data situa-tion for the isobaric heat capacity of ethane in the ideal-gasstate. These data were established either via theoretical ap-proaches or by extrapolating real fluid data to the ideal-gas
FIG. 7. Distribution of the experimental data for the isochoric heat capacityused to develop the residual part of the equation of state, Eq. �4.1�, in a p-Tdiagram.
J. Phys. Chem. Ref. Data, Vol. 35, No. 1, 2006
state and were used in this work to set up the equation for theHelmholtz energy of the ideal gas given in Sec. 4.1.
3.4.1. Experimental Results for the Real Fluid
Most of the nine data sets available for the isobaric heatcapacity of real fluid ethane are of poor quality. Kistiakowskiand Rice �1939� obtained their data by adiabatic expansionof the gas sample, the other data sets were established byflow calorimetry. The data are of little importance for thedevelopment of the new equation of state because the ther-modynamic behavior of the fluid is essentially defined by thehighly accurate p�T and speed of sound data.
The mostly supercritical data published by Ernst andHochberg �1989� and the data obtained in the gas region byBender �1982� complement each other. The values measuredby Bier et al. �1976b� are consistent with the data by Bender�1982� but they reveal systematic deviations from the morerecent data by Ernst and Hochberg �1989� at higher tempera-tures and pressures. We assume the newer data to be morereliable and hence used the values reported by Ernst andHochberg �1989� and by Bender �1982� to establish the newequation of state. A p-T plot of the selected data is shown inFig. 8, details on the data sets are presented in Table 19. Thedata sets that were assigned to groups 2 and 3 are summa-rized in Table 20.
The isobaric heat capacities reported by Lammers et al.�1978� and van Kasteren and Zeldenrust �1979� appear to beinconsistent with reliable data of other properties. In thecourse of the development of the equation of state presentedhere, preliminary equations were set up to check the consis-tency of the different data sets. All preliminary equations thatcould represent the values of the isochoric heat capacity re-ported by Roder �1976b� and the speed of sound data pub-lished by Tsumura and Straty �1977� within their experimen-tal uncertainties predicted lower isobaric heat capacities than
TABLE 18. Summary of the data sets for the isochoric heat capacity that wereassigned to groups 2 and 3
AuthorsNumberof data
Temperaturerange/K
Densityrange/(kg m�3) Group
Abdulagatov et al. �1996� 100 305–376 203 2–3
TABLE 17. Summary of the data sets for the isochoric heat capacity that were assigned to group 1. Uncertainties are given where the original articles containsuch estimates. Uncertainty values in parentheses were estimated by ourselves
Authors
Number of dataTemperature
range/KDensity
range/(kg m�3)Total uncertainty
in isochoric heat capacityTotal Selected
Haase & Tillmann �1994� 11 11 305–317 202 �5%�Roder �1976b� 209 209 110–329 48–610 2%–5%Berestov et al. �1973� 24 3 305–306 —a 1.5% �5%�Shmakov �1973� 158 —b 295–315 205 —b
aThe density is denoted as ‘‘critical’’ in the article. We therefore assigned the critical density used in this work, ��206.18 kg m�3.bThe data were not available when the new equation of state was developed. No estimates for the experimental uncertainties could be drawn from the originalarticle.

221221EQUATION OF STATE FOR THE THERMODYNAMIC PROPERTIES OF ETHANE
the values obtained by Lammers et al. �1978� and van Kas-teren and Zeldenrust �1979�. The data of Furtado �1973� ex-hibit large scatter and substantial deviations from the morereliable values reported by other authors. Roder �1976b� al-ready noted these inconsistencies that amount up to 10% incp in some cases. The values reported by Miyazaki et al.�1980� were obtained by interpretation of their enthalpy mea-surements, see Sec. 3.5. Friend et al. �1991� have alreadydiscussed the large errors attributed to these data.
3.4.2. Results for the Ideal-Gas State
Two methods are widely used to establish data for theideal-gas isobaric heat capacity. The first method uses ex-perimental data for caloric properties extrapolated to thelimit of zero density. Major sources of uncertainties are themeasurements themselves and the extrapolation of real fluiddata to zero pressure to get the ideal-gas values. The tem-perature range where such data are available is restricted tothe operating range of the corresponding experimental set-ups. Today, the most reliable of such data are extrapolatedfrom measurements of the speed of sound taken with spheri-cal resonators. Three data sets are available that have beenestablished in this way. Estrada-Alexanders and Trusler�1997� obtained ideal-gas values consistent with their highlyaccurate data for the speed of sound �see Sec. 3.2�, by ex-trapolating their experimental results. These values wereused to establish the equation for the Helmholtz energy of
FIG. 8. Distribution of the experimental data for the isobaric heat capacityused to develop the residual part of the equation of state, Eq. �4.1�, in a p-Tdiagram.
the ideal gas presented in Sec. 4.1. The reported uncertaintiesof the cp
° data are less than 0.05%. The data also agree wellwith values reported by Boyes �1992�, although the uncer-tainties in cp
° of 0.002%, estimated by Boyes, are certainlytoo optimistic. The values measured by Esper et al. �1995�systematically deviate from the aforementioned data by up to0.4% and were not selected.
The second method to determine the heat capacity of idealgases uses theoretical approaches that depend on molecularconstants measured by spectroscopy. Such property modelsusually consider contributions from molecular translation,rotation, and vibration. For more complex polyatomic mol-ecules, such as ethane, internal rotation has to be consideredas well. In some cases, excited electronic states may becomerelevant at very high temperatures. For higher accuracy, es-pecially at elevated temperatures, interactions between dif-ferent energetic modes will have to be considered. Althoughthe inclusion of such anharmonicity corrections is state-of-the-art for many simple molecules, none of the seven datasets available for ethane accounts for these effects. While thefour earlier studies may be considered as obsolete, the morerecent works by Gurvich et al. �1991�, Pamidimukkala et al.�1982�, and Chao et al. �1973� differ mainly with respect tothe consideration of internal rotation. We selected the valuesreported by Gurvich et al. �1991� for the development ofthe equation for the ideal-gas Helmholtz energy. The cp
° dataare consistent with the results of Estrada-Alexanders andTrusler �1997� within 0.05%. Information on the data setspublished for the ideal-gas heat capacity of ethane is reportedin Table 21.
3.5. Enthalpy Differences and ThrottlingCoefficients
Three reports containing experimental values for enthalpydifferences of ethane and four studies of the Joule–Thomsoncoefficient, ��(�T/�p)h , are available. Miyazaki et al.�1980� gave additional results for the isothermal throttlingcoefficient �T�(�h/�p)T . The data sets are summarized inTable 22. Although none of the data were included in thedevelopment of the equation of state presented here, most ofthem are used for comparisons.
The enthalpy differences measured by Miyazaki et al.�1980� show large deviations from the predictions of all re-liable equations of state available in the literature. None ofthe preliminary equations developed in the course of thiswork was able to give a reasonable representation of thedata. Friend et al. �1991� encountered similar problems withvalues for the isobaric heat capacity that Miyazaki et al.
TABLE 19. Summary of the data sets for the isobaric heat capacity that were assigned to group 1. Uncertainties are given as estimated by the authors
Authors
Number of dataTemperature
range/KPressure
range/MPaTotal uncertainty
in isobaric heat capacityTotal Selected
Ernst & Hochberg �1989� 52 52 303–393 0.3–53 0.2%–1.2%Bender �1982� 36 36 233–298 0.1–1.5 0.1%–0.15%
J. Phys. Chem. Ref. Data, Vol. 35, No. 1, 2006

222222 D. BUCKER and W. WAGNER
TABLE 20. Summary of the data sets for the isobaric heat capacity that were assigned to groups 2 and 3
AuthorsNumberof data
Temperaturerange/K
Pressurerange/MPa Group
Miyazaki et al. �1980� 30 298–323 4.47–13.00 3van Kasteren & Zeldenrust �1979� 30 110–270 3.20–5.07 3Lammers et al. �1978� 14 120–240 3.20–5.70 3Bier et al. �1976b� 121 283–473 0.10–10.00 2Furtado �1973� 299 100–378 1.38–12.07 3Dailey & Felsing �1943� 7 347–603 0.10 3Kistiakowski & Rice �1939� 4 272–365 0.10 2
�1980� deduced from their enthalpy measurements. We there-fore decided to disregard these values.
The enthalpy differences published by Grini �1994� andGrini et al. �1996� are in better agreement with the selecteddata. Nevertheless, the stated standard deviation of 0.21% isnot quite comprehensible, and systematic deviations of0.5%–1% from enthalpy differences calculated from prelimi-nary equations were evident throughout the development ofthe new equation of state.
The measurements of the Joule–Thomson coefficient per-formed by Bender �1982� and Bier et al. �1976b� were car-ried out with the same equipment as the corresponding mea-surements of the isobaric heat capacities �see Sec. 3.4.1�. Theearliest experimental values for Joule–Thomson coefficientswere reported by Sage et al. �1937�. They deviate from theresults of Bier et al. �1976b� by up to 20%. No further con-sideration was given to these data.
4. The New Equation of State
The equation of state for ethane presented here is a funda-mental equation explicit in the Helmholtz energy a as a func-
J. Phys. Chem. Ref. Data, Vol. 35, No. 1, 2006
tion of density � and temperature T . This equation is ex-pressed in dimensionless form, ��a/(RT), and is separatedinto two parts, an ideal-gas part, �°, and a residual part, � r,that accounts for intermolecular forces, so that
��� ,T �
RT���� ,����°�� ,���� r�� ,��, �4.1�
where ���/�c is the reduced density and ��Tc /T is theinverse reduced temperature with the critical density �c
�206.18 kg m�3 and the critical temperature Tc
�305.322 K; R�0.276 512 72 kJ kg�1 K�1 is the specificgas constant of ethane. The ideal-gas part �° and the residualpart � r of the dimensionless Helmholtz energy � are givenby Eqs. �4.6� and �4.8�.
Since Eq. �4.1� is an equation of state in the form of afundamental equation, all thermodynamic properties can becalculated using combinations of �° and � r and their deriva-tives. These relations are given in Table 23 for the thermo-dynamic properties considered in this paper. At a given tem-perature, the vapor pressure and the orthobaric liquid andvapor densities can be obtained by simultaneously solvingthe phase-equilibrium conditions
TABLE 21. Summary of the data sets for the isobaric heat capacity in the ideal-gas state. Uncertainties are given where the original articles contain suchestimates
AuthorsNumberof data
Temperaturerange/K
Totaluncertainty
Measuredproperty
Data calculated from models based on spectroscopic dataGurvich et al. �1991� 61a 100–6000 — —Pamidimukkala et al. �1982� 32 0–3000 0.025%–0.3% —Chao et al. �1973� 42 0–1500 — —Schafer & Auer �1961� 25 100–1500 — —Rossini et al. �1953� 15 100–1500 — —Dailey & Felsing �1943� 7 348–603 1% —Thompson �1941� 10 291–1000 — —
Data extrapolated from experimental resultsEstrada-Alexanders & Trusler �1997� 17a 220–450 0.05% wEsper et al. �1995� 16 223–351 0.1%–0.2% wBoyes �1992� 14 210–360 0.002% wErnst & Hochberg �1989� 4 303–393 0.2% cp
Bender �1982� 5 233–283 0.2% cp
Bier et al. �1976a� 9 283–473 0.2% cp
Kistiakowsky & Rice �1939� 4 272–365 0.3% cp
Eucken & Parts �1933� 6 189–292 0.5%–1% cp
Heuse �1919� 3 191–288 — cp
aThese data were used to fit the correlation equation for the ideal-gas heat capacity, Eq. �4.5�.

223223EQUATION OF STATE FOR THE THERMODYNAMIC PROPERTIES OF ETHANE
TABLE 22. Summary of the data sets for the enthalpy h , the Joule–Thomson coefficient �, and the isothermal throttling coefficient �T
Authors
Number of dataTemperature
range/KPressure
range/MPa Grouph � �T
Grini et al. �1996� 60 — — 154–267 1.16–5.10 2Grini �1994� 22a — — 156–256 0.84–4.07 2Bender �1982� — 27 — 233–298 0.30–1.50 2Miyazaki et al. �1980� 104 6 27 283–326 3.44–6.75 2–3Bier et al. �1976b� — 66 — 298–473 0.30–10.0 2Sage et al. �1937� — 41 — 294–377 0.10–4.20 3
aContains also 60 of the values published by Grini et al. �1996�.
ps
RT����1�����
r ���,���, �4.2a�
ps
RT����1�����
r ���,���, �4.2b�
ps
RT � 1
���
1
����ln� ��
����� r���,���� r���,��. �4.2c�
4.1. The Equation for the Helmholtz Energyof the Ideal Gas
The Helmholtz energy of the ideal gas is given by
a°�� ,T ��h°�T ��RT�Ts°�� ,T �. �4.3�
The enthalpy h°(T) and the entropy s°(� ,T) of the ideal gas
TABLE 23. Relations of thermodynamic properties to the ideal-gas part �°, Eq. �4.6�, and the residual part � r, Eq. �4.8�, of the dimensionless Helmholtz energyand their derivativesa,b
Property Relation
Pressurep��2(�a/��)T
p��,��
�RT�1����
r
Entropys��(�a/�T)v
s��,��
R�����
°���r ���°�� r
Internal energyu�a�Ts
u��,��
RT�����
°���r �
Enthalpyh�u�pv
h��,��
RT�1�����
°���r �����
r
Gibbs free energyg�h�Ts
g��,��
RT�1��°��r����
r
Isochoric heat capacitycv�(�u/�T)v
cv��,��
R���2����
° ����r �
Isobaric heat capacitycp�(�h/�T)p
cp��,��
R���2����
° ����r ��
�1����r ������
r �2
1�2���r ��2���
r
Saturated-liquid heat capacityc(T)�(�h/�T)p�T(�p/�T)v•(dps /dT)/(��2(�p/��)T�����
c���
R���2����
° ����r ��
1�����r �������
r
1�2����r ���2���
r •� �1�����r �������
r ��1
�cR��
dps
dT � c
Speed of soundw�(�p/��)s
1/2w2��,��
RT�1�2���
r ��2���r �
�1����r ������
r �2
�2����° ����
r �
Joule–Thomson coefficient��(�T/�p)h �T��,��R��
�����r ��2���
r ������r �
�1����r ������
r �2��2����° ����
r ��1�2���r ��2���
r �
Isothermal throttling coefficient�T�(�h/�p)T �T��,����1�
1����r ������
r
1�2���r ��2���
r
Second virial coefficient
B�T �� lim�→0
��Z/���T B����c� lim�→0
��r �� ,��
Third virial coefficient
C�T �� lim�→0
�1
2��2Z/��2�T� C����c
2� lim�→0
���r �� ,��
a��r ���� r/���� , ���
r ���2� r/��2�� , ��r ���� r/���� , ���
r ���2� r/��2�� , ���r ���2� r/����� , ��
°����°/���� , ���° ���2�°/��2�� .
bFor the specific gas constant R see Eq. �4.1�.cdps /dT����•��/(�����)�R� ln(��/��)��r(� ,��)�� r(� ,��)��(��
r (� ,��)���r (� ,��))� .
J. Phys. Chem. Ref. Data, Vol. 35, No. 1, 2006

224224 D. BUCKER and W. WAGNER
can be derived from an equation for the ideal-gas isobaricheat capacity cp
° (T). Replacing h° and s° in Eq. �4.3� by theappropriate expressions yields
a°�� ,T ���T0
T
cp° dT�h0
° �RT�T
�� �T0
T cp° �R
TdT�R ln� �
�0° � �s0
° � , �4.4�
where all variables with the index ‘‘0’’ refer to an arbitraryreference state. Often the enthalpy and the entropy are set tozero at T0�298.15 K and p0�0.101 325 MPa. The corre-sponding ideal-gas density is given by �0
° �p0 /(RT0).The data sets published by Estrada-Alexanders and Trusler
�1997� and Gurvich et al. �1991� were used to fit the follow-ing correlation equation for cp
° (T):
cp° �T �
R�1�n3
° ��i�4
7
ni°�� i
°��2exp��� i
°��
�exp��� i°���1�2 .
�4.5�
With the coefficients given in Table 24, Eq. �4.5� reproducesall of the input data within their mutual consistency, which is0.05%. At temperatures from 700 to 6000 K, the data byGurvich et al. �1991� are represented with deviations of lessthan 0.01%.
The expression for the Helmholtz energy of the ideal gascan be derived by inserting Eq. �4.5� into Eq. �4.4� and car-rying out the integration
�°�ln����n1° �n2
° ��n3° ln���
��i�4
7
ni° ln�1�exp��� i
°��� , �4.6�
for the definition of � and � see Eq. �4.1�. The coefficients ni°
and � i° are given in Table 24. The integration constants ni
°
and n2° were chosen to give zero for the ideal-gas enthalpy at
T0�298.15 K and the ideal-gas entropy at T0�298.15 Kand p0�0.101 325 MPa. Table 25 compiles the derivativesof the ideal-gas part �° required for the calculation of ther-modynamic properties.
TABLE 24. Coefficients for the correlation equations for the ideal-gas iso-baric heat capacity and the ideal-gas part of the Helmholtz energy, Eqs. �4.5�and �4.6�
i ni° � i
°
1 9.212 802 589 —2 �4.682 248 550 —3 3.003 039 265 —4 1.117 433 359 1.409 105 23325 3.467 773 215 4.009 917 07126 6.941 944 640 6.596 709 83427 5.970 850 948 13.979 810 2659
J. Phys. Chem. Ref. Data, Vol. 35, No. 1, 2006
4.2. The Equation for the Residual Partof the Helmholtz Energy
Unlike the ideal-gas part of the Helmholtz energy, nophysically founded models are available that accurately de-scribe the thermodynamic behavior of real fluids over a widerange of parameters. Therefore, an empirical description ofthe residual Helmholtz energy was developed in this work.State-of-the-art procedures were used to establish the math-ematical structure of the correlation equation and to adjustthe coefficients. Although certain demands on the functionalform as formulated by Span and Wagner �1997� were con-sidered, the terms in the equation are basically empirical.
4.2.1. Fitting Procedures
The coefficients of the equation were determined in aleast-squares fit. Therefore, a weighting factor was calculatedfor each data point using the experimental total uncertaintiesas stated by the authors. Where only individual uncertaintiesare given for the different variables, total uncertainties werecalculated according to the Gaussian error propagation for-mula. Where no uncertainties are available or in the case ofartificial data points that were used to ensure physically rea-sonable results, we estimated the uncertainties by thoroughlyanalyzing the data. The partial derivatives needed for theapplication of the error propagation formula were calculatedfrom preliminary equations. In some instances, the calculatedweights were modified by arbitrary multiplicative factors toincrease or reduce the influence of a particular data set on theoverall representation of the surface. In this way, the dispro-portionate influence of single data sets that were assignedoverly optimistic uncertainties by the authors could beavoided.
We used a modified adaptation of the well known algo-rithm by Setzmann and Wagner �1989� to optimize prelimi-nary functional forms for the residual part. Since only linearresidua are supported in this algorithm, nonlinear data suchas speeds of sound can only be used if they are linearized byappropriate methods, see, e.g., Setzmann and Wagner �1991�and Wagner and Pruß �2002�. To improve the representationof the available highly accurate data for the speed of sound,
TABLE 25. The ideal-gas part �°, Eq. �4.6�, of the dimensionless Helmholtzfree energy and its derivativesa
�°�ln ��n1°�n2
°��n3° ln ���
i�4
7
ni° ln�1�e��i
°��
��° �1/��0�0�0�0
���° ��1/�2�0�0�0�0
��°�0�0�n2
°�n3°/���
i�4
7
ni°�i
°��1�e��i°���1�1�
���° �0�0�0�n3
°/�2��i�4
7
ni°��i
°�2e��i°��1�e��i
°���2
���° �0�0�0�0�0
a��° ����°/���� , ���
° ���2�°/��2�� , ��°����°/���� , ���
° ���2�°/��2�� ,���
° ���2�°/������ .

225225EQUATION OF STATE FOR THE THERMODYNAMIC PROPERTIES OF ETHANE
the final functional form was developed by means of a non-linear regression analysis developed by Tegeler et al. �1997�.This algorithm combines linear and nonlinear procedures andenables a direct consideration of both linear and nonlineardata in the development of the functional form. The residuaused in the linear and nonlinear algorithms correspond tocommon formulations recently explained by Span �2000�.
The bank of terms that built the basis for the developmentof the new equation of state
� r��i�1
4
�j�0
16
ni j�i� j /4�exp�����
i�1
10
�j�2
20
ni j�i� j /4
�exp���2��i�2
10
�j�1
20
ni j�i� j /2
�exp���3��i�2
14
�j�5
20
ni j�i� j
�exp���4��i�2
10
�j�10
30
ni j�i� j��
i�1
72
ni�di� t j
�exp��� i���� i�2�� i��� i�
2� , �4.7�
comprises a total of 907 terms, including 68 simple polyno-mial terms, 767 polynomials combined with exponentialfunctions, and 72 modified Gaussian bell-shaped terms asintroduced by Setzmann and Wagner �1991� to improve therepresentation of data in the critical region. The parametersof these Gaussian terms covered the ranges 1�di�3, 0�t i
�3, 15�� i�25, 150�� i�400, � i�1, and 1.05� i
�1.25. The density and temperature exponents of the re-maining terms in Eq. �4.7� were chosen according to recom-mendations given by Span and Wagner �1997� to ensure re-liable extrapolation behavior of the equation. Equation �4.7�does not contain nonanalytical terms as applied by Span andWagner �1996� to CO2 and by Wagner and Pruß �2002� toH2O. Due to the absence of really good caloric data in thenear critical region, we felt that the additional computationsand complexity required by these terms were not justified forthe new equation of state for ethane.
4.2.2. Selected Database
The experimental data that were selected to establish thenew equation of state have been presented in Secs. 2 and 3.Table 26 gives a brief summary of the data used in the linearoptimization procedure and in the nonlinear regressionanalysis. In addition to the data discussed in the precedingchapters, several data have been generated either for the ex-clusive use in the linear optimization algorithm or to ensurereasonable behavior of the equation of state in regions wherethe data available in the literature yield insufficient informa-tion. These are:
�1� Twenty-eight p�T data within the high-temperature/high-pressure region calculated from the reference equa-
tion of state for nitrogen �Span et al. �2000�� and trans-ferred to ethane by a simple corresponding statesapproach �see Sec. 5.4.1�.
�2� 232 data for the isobaric heat capacity calculated frompreliminary equations to ensure a numerically reliablelinearization of the experimental speeds of sound pub-lished by Estrada-Alexanders and Trusler �1997� andTsumura and Straty �1977�. Details on the linearizationprocedures are given by Setzmann and Wagner �1991�and Tegeler et al. �1997�. These data were used only inthe linear optimization algorithm.
�3� 244 data calculated from the ancillary equations, Eqs.�2.4�–�2.6�, for a linearized solution of the Maxwell cri-terion, see Wagner �1972�. These data were used only inthe linear optimization algorithm.
4.2.3. The Equation for the Residual Part �r
From the bank of terms as formulated in Eq. �4.7�, theoptimization algorithms selected the final functional form forthe residual part of the dimensionless Helmholtz energygiven by
� r��i�1
5
ni�di� t i��
i�6
39
ni�di� t iexp���ci�
� �i�40
44
ni�di� t i exp��� i���� i�
2�� i��� i�2� ,
�4.8�
for the definition of � and � see Eq. �4.1�. The final values ofthe parameters were determined by the nonlinear regression
TABLE 26. Summary of the selected data that were used in the linear andnonlinear optimization algorithms
Property For details, see
Number of data
Linearoptimization
Nonlinearregression analysis
p(� ,T) Table 11 1239 1239p(� ,T) Sec. 7.2 28 28ps(T) 224a —��(T) 224a —��(T) 224a —ps(T) Table 5 — 44��(T) Table 6 — 42��(T) Table 7 — 44B(T) Table 13 14 14B(T) Table 14 44 44cv(� ,T) Table 17 223 223cv(� ,T) Sec. 4.2.2 232 —cp(p ,T) Table 19 88b 88cp�(T) Table 9 106b 106w(p ,T) Table 15 525b 525w�(T) Table 8 99b 99
aLinearized solution of the Maxwell criterion using data calculated from theancillary equations, Eqs. �2.4� to �2.6�, see Wagner �1972�.
bLinearized data used in the linear optimization procedure, see Setzmannand Wagner �1991� and Wagner and Pruß �2002�.
J. Phys. Chem. Ref. Data, Vol. 35, No. 1, 2006

226226 D. BUCKER and W. WAGNER
analysis and are given in Table 27. The coefficients ni re-sulted in a nonlinear fit which is part of the regression analy-sis.
The new equation of state for ethane, Eq. �4.1�, in combi-nation with the formulation for �°, Eq. �4.6�, and the formu-lation for � r, Eq. �4.8�, was constrained to the critical param-eters given in Sec. 2.2 by setting the first and secondderivatives of pressure with respect to density to zero at thecritical point.
The range of validity of the new equation of state forethane, Eq. �4.1�, is based on the region from which reliableexperimental data were used to develop the equation. Thus,the range of validity is defined by the following region intemperature and pressure:
TABLE 27. Coefficients and exponents of Eq. �4.8�
i ni ci di t i
1 0.834 407 457 352 41 — 1 0.252 �0.142 873 606 071 71�101 — 1 1.003 0.344 302 422 109 27 — 2 0.254 �0.420 966 779 202 65 — 2 0.755 0.120 945 008 865 49�10�1 — 4 0.756 �0.579 762 015 973 41 1 1 2.007 �0.331 270 378 708 38�10�1 1 1 4.258 �0.117 516 548 941 30 1 2 0.759 �0.111 609 578 330 67 1 2 2.25
10 0.621 815 926 544 06�10�1 1 3 3.0011 0.984 817 954 344 43�10�1 1 6 1.0012 �0.982 685 826 823 58�10�1 1 6 1.2513 �0.239 778 310 070 49�10�3 1 7 2.7514 0.698 856 633 288 21�10�3 1 9 1.0015 0.196 659 878 033 05�10�4 1 10 2.0016 �0.145 861 522 079 28�10�1 2 2 2.5017 0.463 541 005 367 81�10�1 2 4 5.5018 0.607 646 221 806 45�10�2 2 4 7.0019 �0.264 473 301 478 28�10�2 2 5 0.5020 �0.429 318 726 899 04�10�1 2 5 5.5021 0.299 877 865 172 63�10�2 2 6 2.5022 0.529 193 351 750 10�10�2 2 8 4.0023 �0.103 838 977 981 98�10�2 2 9 2.0024 �0.542 603 482 146 94�10�1 3 2 10.0025 �0.219 593 629 184 93 3 3 16.0026 0.353 624 566 503 54 3 3 18.0027 �0.124 773 901 737 14 3 3 20.0028 0.184 256 935 915 17 3 4 14.0029 �0.161 922 564 367 54 3 4 18.0030 �0.827 708 761 490 64�10�1 3 5 12.0031 0.501 607 580 964 37�10�1 3 5 19.0032 0.936 143 263 366 55�10�2 3 6 7.0033 �0.278 391 862 428 64�10�3 3 11 15.0034 0.235 602 740 714 81�10�4 3 14 9.0035 0.392 383 297 385 27�10�2 4 3 26.0036 �0.764 883 258 136 18�10�3 4 3 28.0037 �0.499 443 044 407 30�10�2 4 4 28.0038 0.185 933 864 071 86�10�2 4 8 22.0039 �0.614 043 533 311 99�10�3 4 10 13.00
i ni ci di t i � i � i i � i
40 �0.233 121 793 679 24�10�2 — 1 0.00 15 150 1.05 141 0.293 010 479 087 60�10�2 — 1 3.00 15 150 1.05 142 �0.269 124 728 428 83�10�3 — 3 3.00 15 150 1.05 143 0.184 138 341 118 14�103 — 3 0.00 20 275 1.22 144 �0.103 971 279 848 54�102 — 2 3.00 20 400 1.16 1
J. Phys. Chem. Ref. Data, Vol. 35, No. 1, 2006
90.368 K�T�675 K
and
p�900 MPa.
The lowest temperature given above corresponds to thetriple-point temperature. At pressures above the triple-pointpressure the melting line �see Sec. 2.3� forms the range ofvalidity regarding the lowest temperature. In this range ofvalidity of Eq. �4.1�, clear statements about the uncertaintyof the equation of state can be made. The equation can alsobe used outside this range of validity, however, with greateruncertainties �see also Sec. 5.4�.
The derivatives of the residual part of the equation ofstate, Eq. �4.1�, needed for the property calculations, are pre-sented in Table 28. Estimations for the uncertainties are sum-marized in Sec. 6.
5. Comparison of the New Equationof State with Experimental Data
This section gives a discussion of the quality of the newequation of state �Eq. �4.1�� based mainly on comparisonswith selected experimental data. Most of the figures alsoshow calculations from the equation published by Friendet al. �1991�, which is commonly accepted as the interna-tional standard for the thermodynamic properties of ethane.Since the equation is based on the International PracticalTemperature Scale of 1968 �IPTS-68�, temperature valueswere converted to the IPTS-68 scale before values were cal-culated from this equation.
5.1. The Vapor–Liquid Phase Boundary5.1.1. Thermal Properties
Since the highly accurate data measured by Funke et al.�2002b� cover the entire phase boundary, the comparisonscan be restricted to these values. Figure 9 shows compari-sons of the thermal saturation properties calculated from Eq.�4.1� to experimental data. Additionally, values calculatedfrom the ancillary equations, Eqs. �2.4�–�2.6�, and from theequation of state of Friend et al. �1991� are included. Abso-lute deviations are shown for the vapor pressure and the va-por density at temperatures below 170 K. Due to the smallabsolute values in this region, absolute deviations are moresignificant than the divergent relative deviations. Percentagedeviations are plotted in the other diagrams.
Equation �4.1� represents the selected data clearly withintheir experimental uncertainties. Deviations from the vapor–pressure data are within 0.01% above 170 K and within 10Pa below 170 K. The selected saturated-liquid densities arereproduced within 0.005% up to a temperature of 304.9 K.Approaching the critical temperature, the deviations increaseup to 0.12%. The experimental saturated-vapor densities arerepresented within 0.015% at temperatures up to 305.1 K.Closer to the critical temperature, the deviations reach up to0.35%. Below 185 K, no experimental saturated-vapor den-sities are available. Absolute deviations from values calcu-lated from the virial equation of state of Funke et al. �2002b�are within 0.0004 kg m�3.-

TABLE 28. The residual part � r, Eq. �4.8�, of the dimensionless Helmholtz energy and its derivativesa
227227EQUATION OF STATE FOR THE THERMODYNAMIC PROPERTIES OF ETHANE
The equation of Friend et al. �1991� is not able to repro-duce the experimental data within their uncertainties.Nonetheless, relative deviations between calculated and mea-sured vapor pressures are within 0.03% for temperaturesabove 180 K and absolute deviations are within 25 Pa belowthis point. The maximum deviations from the experimentalsaturated-liquid densities reach up to 0.12% at temperatures
FIG. 9. Absolute and percentage deviations �100ym /ym�100(ym,exp
�ym,calc)/ym,exp with y�ps ,��,��] of the selected thermal data at saturationfrom values calculated from Eq. �4.1�. Values calculated from the ancillaryequations, Eqs. �2.4�–�2.6�, and from the equation of state of Friend et al.�1991� are plotted for comparison.
below 300 K and up to 0.7% above 300 K. The representa-tion of the saturated-vapor densities is particularly poor withdeviations from experimental values reaching as much as0.4% far from the critical temperature and 1.1% above 305K.
The ancillary equations give a slightly better representa-tion of the experimental data on the phase boundary than thenew equation of state. However, if thermodynamically con-sistent values for all properties on the phase boundary aredesired, such values should be calculated from Eq. �4.1�.
5.1.2. Caloric Properties
Figure 10 gives comparisons of the caloric properties ofsaturated-liquid ethane calculated from Eq. �4.1� to selectedexperimental data. The upper diagram shows speeds ofsound measured by Vangeel �1976� and Tsumura and Straty�1977�. Both data sets were included in the development ofthe new equation of state. The two data sets are consistentwith each other at temperatures from 120 to 270 K. In thisregion, both data sets are reproduced by Eq. �4.1� within thereported uncertainties. Above 270 K and below 120 K, how-ever, the discrepancies between the different measurementruns exceed the combined reported uncertainties. Equation�4.1� represents both data sets in these regions within 0.5%which is better than their mutual consistency. The valuescalculated from the equation of Friend et al. �1991� deviatesystematically from the measured data. Particularly at tem-peratures above 220 K, the calculated values are up to 2%higher than the experimental data.
Absolute values of the speed of sound on the phase bound-ary in the proximity of the critical point are plotted in Fig.11. Values calculated from Eq. �4.1� and the equation ofFriend et al. �1991� are plotted as lines. Additionally, mea-sured speeds of sound reported by Colgate et al. �1992� for
J. Phys. Chem. Ref. Data, Vol. 35, No. 1, 2006

228228 D. BUCKER and W. WAGNER
temperatures (Tc�T)�0.75 K and data reported byTsumura and Straty �1977� are shown. Equation �4.1� pro-vides a better representation of the data than the equation ofFriend et al. �1991�, but without the nonanalytical terms �see
FIG. 10. Percentage deviations deviations �100ym /ym�100(ym,exp
�ym,calc)/ym,exp with y�w�,c] of experimental data for the speed of soundin the saturated liquid and for the heat capacity along the saturated-liquidline from values calculated from the equation of state, Eq. �4.1�. Valuescalculated from the equation of state of Friend et al. �1991� are plotted forcomparison.
FIG. 11. Representation of the speed of sound on the phase boundary nearthe critical point. The plotted curves correspond to values calculated fromthe equation of state, Eq. �4.1�, and from the equation of state of Friendet al. �1991�.
J. Phys. Chem. Ref. Data, Vol. 35, No. 1, 2006
the statement at the end of Sec. 4.2.1� it cannot reproduce thesharp decline of the speed of sound towards the critical tem-perature at the critical density.
The experimental values for the heat capacity along thesaturated-liquid line published by Roder �1976b� cover theentire phase boundary. The author reports uncertainties of hismeasurements to be generally less than 0.5%, increasing to5% within a few Kelvin of the critical temperature. Addition-ally, he suggests that undetected systematic errors remainwithin 2%. The lower diagram in Fig. 10 gives comparisonsof these values and of older data measured by Wiebe et al.�1930� with values calculated from Eq. �4.1�. At tempera-tures above 100 K, all data are reproduced within the re-ported uncertainties, even if possible systematic errors areassumed to be zero. Below 100 K, the maximum deviationsare less than 1.5%, which is presumably far less than thetotal uncertainties of the data. The equation of state of Friendet al. �1991� also yields a good representation of the dataover a large part of the phase boundary. At temperaturesfrom 100 to 150 K, however, the performance of the equa-tion is poor with deviations from the measured values reach-ing up to �3.5%.
5.2. Single-Phase Region
5.2.1. p�T Data
As a result of the measurements performed by Funke et al.�2002a, 2002b�, the thermal properties of fluid-phase ethaneat temperatures from 95 to 340 K and pressures up to 12MPa are known to the highest degree of accuracy attainabletoday. These measurements are complemented by the valuesobtained by Claus et al. �2003� at temperatures up to 520 Kand pressures up to 30 MPa. These data very precisely definethe p�T surface in the largest part of the relevant region. Noother p�T data were included in the development of the newequation of state within the range of parameters covered bythese measurements. Comparisons of densities calculatedfrom Eq. �4.1� to the highly accurate p�T data are shown in
FIG. 12. Percentage density deviations of highly accurate p�T data �95–210K� from values calculated from the equation of state, Eq. �4.1�. Valuescalculated from the equation of state of Friend et al. �1991� are plotted forcomparison.

229229EQUATION OF STATE FOR THE THERMODYNAMIC PROPERTIES OF ETHANE
Figs. 12 and 13. All data are reproduced clearly within thesmall experimental uncertainties which are generally 0.02%of the densities measured by Funke et al. �2002a� and0.02%–0.03% of the densities measured by Claus et al.�2003�. In the extended critical region, total uncertainties areabout 0.015% in pressure. This particular region is discussedin more detail in Sec. 5.3. Along the 340 K isotherm, thevalues published by Claus et al. �2003� exhibit slightly os-cillating deviations from the values measured by Funke et al.�2002a� and from the values calculated from Eq. �4.1�. Thissmall but systematic effect can be observed along the higherisotherms as well and may be an indication for experimentalerrors in the order of 0.01%–0.02% in this region. The au-thors accounted for these possible errors by estimating thetotal uncertainties in density to be 0.03% at the higher tem-peratures.
Over the entire range of parameters shown in Figs. 12 and13, the deviations between measured densities and valuescalculated from the equation of state of Friend et al. �1991�exceed the experimental uncertainties by far. In the subcriti-cal gaseous region, the calculated densities are systematicallyhigher than the experimental values with maximum devia-tions of �0.3% close to the phase boundary. Similarly, sys-tematic inconsistencies are observed in the liquid phase with
FIG. 13. Percentage density deviations of highly accurate p�T data �240–520 K� from values calculated from the equation of state, Eq. �4.1�. Valuescalculated from the equation of state of Friend et al. �1991� are plotted forcomparison.
maximum deviations reaching 0.1% near the saturated-liquidline. The deviations oscillate along the supercritical iso-therms mostly within a margin of 0.05%, but reaching up to0.3% at higher temperatures and pressures and in the vicinityof the critical isochore.
Figures 14 and 15 show comparisons of densities calcu-lated from Eq. �4.1� to representative sets of group 1 andgroup 2 p�T data for pressures up to 80 MPa. In the liquid
FIG. 14. Percentage density deviations of p�T data �120–350 K� assigned togroups 1 and 2 from values calculated from the equation of state, Eq. �4.1�.Values calculated from the equation of Friend et al. �1991� are plotted forcomparison.
FIG. 15. Percentage density deviations of p�T data �373–623 K� assigned togroups 1 and 2 from values calculated from the equation of state, Eq. �4.1�.Values calculated from the equation of Friend et al. �1991� are plotted forcomparison.
J. Phys. Chem. Ref. Data, Vol. 35, No. 1, 2006

230230 D. BUCKER and W. WAGNER
region at low temperatures, the densities reported by Stratyand Tsumura �1976b� agree best with the measurements ofFunke et al. �2002a�. Inconsistencies remain within 0.05%–0.1% approximately, although the data show a considerableinherent scatter. The data sets of Golovskii et al. �1978� andPal et al. �1976� exhibit larger scatter and systematic errors.Some of the densities measured by Pal et al. �1976� are morethan �0.3% higher than the reference data by Funke et al.�2002a�. Due to the inherent scatter and the systematic de-viations varying with pressure, we could not find a means tomethodically adjust these data sets to show better agreementwith the reference data. Therefore, these data were used inthe development of the new equation of state without anycorrections, but only at pressures above 30 MPa and assign-ing them only moderate weights.
A number of data sets that agree with the group 1 datamostly to within 0.05% exist in the subcritical gaseous re-gion, namely, the values reported by Guo et al. �1992�, We-ber �1992�, Jaeschke and Humphreys �1990�, Mansoorianet al. �1981� and Michels et al. �1954�. Approaching thesaturated-vapor line, however, the density values reported byJaeschke and Humphreys �1990�, and by Michels et al.�1954� are higher than the values reported by the other au-thors by up to �0.15%. None of these data were used toestablish the new equation of state.
The densities measured by Douslin and Harrison �1973�are generally higher than the other group 1 data. While theseinconsistencies increase with pressure in the low pressurerange, the gap remains almost constant at higher pressures.The highest difference is �0.3% in the gas phase and ap-proximately �0.2% at higher densities. Two earlier datasets, published by Michels et al. �1954� and Beattie et al.�1939b� are in better agreement with the reference data.Equation �4.1� reproduces both data sets with deviations ofless than 0.1%, although they were assigned only smallweights in the development of the equation. Figure 15 indi-cates that the gap between the data of Douslin and Harrison�1973� and the other group 1 data decreases with tempera-ture. Friend et al. �1991� apparently overfitted the data ofDouslin and Harrison �1973� in the gas phase. Their equationreproduces the faulty densities and thus yields values up to
FIG. 16. Percentage density deviations of p�T data in the high-pressureregion from values calculated from the equation of state, Eq. �4.1�. Valuescalculated from the equation of Friend et al. �1991� are plotted for compari-son. Note that the range of validity of the equation of Friend et al. �1991� isrestricted to pressures up to 70 MPa and temperatures up to 625 K.
J. Phys. Chem. Ref. Data, Vol. 35, No. 1, 2006
�0.3% higher than the most accurate data. At higher pres-sures and temperatures above 370 K, the values oscillatearound the reference data and the densities calculated fromEq. �4.1�.
The only experimental fluid phase densities above 73 MPawere measured by Tsiklis et al. �1972� at temperatures from323 to 673 K. Comparisons with values calculated from Eq.�4.1� are shown in Fig. 16 for the highest and the lowestisotherm of the investigation. All of the reported densitiescan be reproduced within 1.6% which is certainly less thanthe experimental uncertainties. The data are beyond therange of validity of the equation of Friend et al. �1991�.
5.2.2. Virial Coefficients
Figure 17 shows absolute values of selected data for thesecond virial coefficient B . Additionally, values calculatedfrom the new equation of state and from the equation of stateof Friend et al. �1991� are plotted as lines. Equation �4.1�yields a plausible plot of the second virial coefficient overthe entire temperature range. The desired sharp decrease to-wards low temperatures was accomplished by including thedata calculated by Klimeck �2000� in the development of theequation. The values reported by Funke et al. �2002a� arerepresented by Eq. �4.1� within 0.6%.
The corresponding diagram for the third virial coefficientC is shown in Fig. 18. Again, the values calculated from Eq.�4.1� show a thermodynamically correct plot, yielding theexpected maximum and the succeeding sharp decrease to-
FIG. 17. Representation of data for the second virial coefficient at tempera-tures up to 650 K. The plotted lines correspond to values calculated from theequation of state, Eq. �4.1�, and from the equation of Friend et al. �1991�.

231231EQUATION OF STATE FOR THE THERMODYNAMIC PROPERTIES OF ETHANE
wards low temperatures. Compared to the data obtained frommeasurements, the maximum calculated from Eq. �4.1� islocated at a slightly higher temperature.
The equation of Friend et al. �1991� generates plausibleplots of the virial coefficients only in a limited temperaturerange. Below 130 K, the values of the second virial coeffi-cient abruptly increase towards infinity. Calculated values ofthe third virial coefficient show a similar sharp increaseoriginating at 230 K, just below the location of the maxi-mum.
5.2.3. Speed of Sound
The values for the speed of sound obtained by Estrada-Alexanders and Trusler �1997� using spherical resonatorsrepresent the most accurate description of the caloric prop-erties of ethane now available. The gaseous region from 220to 450 K is measured with the highest possible accuracy. Thedata published by Tsumura and Straty �1977� describe theliquid region at temperatures from 100 to 323 K at pressuresup to 37 MPa with the highest accuracy available in thisparticular region today. These two data sets, complementedby the measurements of Trusler and Costa Gomez �1996�,make the speed of sound a key property for the description ofthe thermodynamic behavior of fluid phase ethane.
Figure 19 shows the comparison of speeds of sound cal-culated from Eq. �4.1� to highly accurate data in the gaseousregion on representative isotherms. The vast majority of thedata of Estrada-Alexanders and Trusler �1997� are repro-duced within 0.01%, which is the uncertainty estimated bythe authors, with deviations for only two values at 300 Kexceeding 0.015%. The equation of Friend et al. �1991� is
FIG. 18. Representation of data for the third virial coefficient at temperaturesup to 650 K. The plotted lines correspond to values calculated from theequation of state, Eq. �4.1�, and from the equation of Friend et al. �1991�.
not able to reproduce the data sufficiently. The data were notavailable when this equation was established and the func-tional form is not flexible enough to adequately reflect thesehigh precision data. At subcritical temperatures, the equationof Friend et al. �1991� systematically predicts lower valueswith differences reaching up to �0.4% near the phaseboundary. These systematic errors decrease towards highertemperatures. At temperatures above 365 K, the speeds ofsound calculated from the equation of Friend et al. �1991�are too high, with deviations from the experimental data ofup to 0.1%.
In Fig. 20, values of the speed of sound from the newequation of state, Eq. �4.1�, are compared to the experimentaldata of Tsumura and Straty �1977� and Trusler and CostaGomez �1996� in the liquid and supercritical region on char-acteristic isotherms. The experimental uncertainties of thedata shown in the diagrams are 0.06%–0.15%, with the high-est uncertainties to be expected near the critical region. Thedifferent symbols for the data on the 323 K isotherm denotevariations of the measurement technique. Data plotted as tri-angles or diamonds were measured using the classical pulse-echo technique at frequencies of 10 MHz �triangles� and 1MHz �diamonds�, respectively. Near the critical point, thistechnique is limited due to the large sound attenuation.
FIG. 19. Percentage deviations of highly accurate speed of sound data fordensities up to about half the critical density from values calculated from theequation of state, Eq. �4.1�. Values calculated from the equation of Friendet al. �1991� are plotted for comparison.
J. Phys. Chem. Ref. Data, Vol. 35, No. 1, 2006
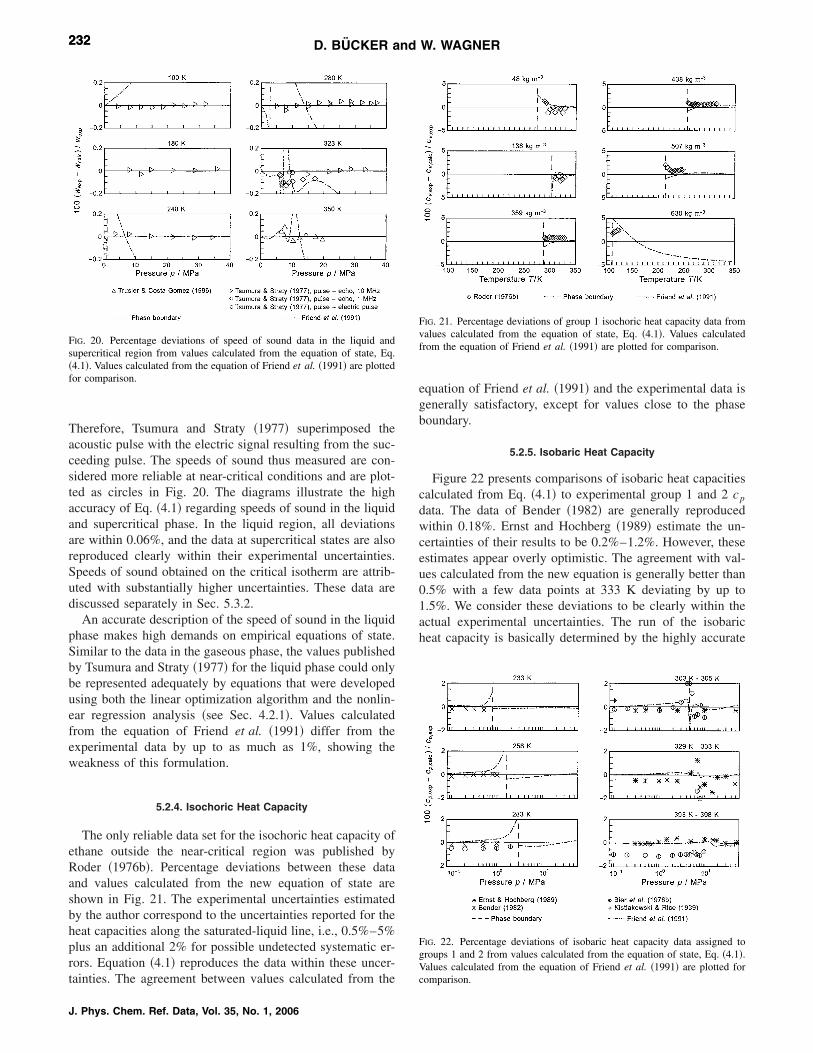
232232 D. BUCKER and W. WAGNER
Therefore, Tsumura and Straty �1977� superimposed theacoustic pulse with the electric signal resulting from the suc-ceeding pulse. The speeds of sound thus measured are con-sidered more reliable at near-critical conditions and are plot-ted as circles in Fig. 20. The diagrams illustrate the highaccuracy of Eq. �4.1� regarding speeds of sound in the liquidand supercritical phase. In the liquid region, all deviationsare within 0.06%, and the data at supercritical states are alsoreproduced clearly within their experimental uncertainties.Speeds of sound obtained on the critical isotherm are attrib-uted with substantially higher uncertainties. These data arediscussed separately in Sec. 5.3.2.
An accurate description of the speed of sound in the liquidphase makes high demands on empirical equations of state.Similar to the data in the gaseous phase, the values publishedby Tsumura and Straty �1977� for the liquid phase could onlybe represented adequately by equations that were developedusing both the linear optimization algorithm and the nonlin-ear regression analysis �see Sec. 4.2.1�. Values calculatedfrom the equation of Friend et al. �1991� differ from theexperimental data by up to as much as 1%, showing theweakness of this formulation.
5.2.4. Isochoric Heat Capacity
The only reliable data set for the isochoric heat capacity ofethane outside the near-critical region was published byRoder �1976b�. Percentage deviations between these dataand values calculated from the new equation of state areshown in Fig. 21. The experimental uncertainties estimatedby the author correspond to the uncertainties reported for theheat capacities along the saturated-liquid line, i.e., 0.5%–5%plus an additional 2% for possible undetected systematic er-rors. Equation �4.1� reproduces the data within these uncer-tainties. The agreement between values calculated from the
FIG. 20. Percentage deviations of speed of sound data in the liquid andsupercritical region from values calculated from the equation of state, Eq.�4.1�. Values calculated from the equation of Friend et al. �1991� are plottedfor comparison.
J. Phys. Chem. Ref. Data, Vol. 35, No. 1, 2006
equation of Friend et al. �1991� and the experimental data isgenerally satisfactory, except for values close to the phaseboundary.
5.2.5. Isobaric Heat Capacity
Figure 22 presents comparisons of isobaric heat capacitiescalculated from Eq. �4.1� to experimental group 1 and 2 cp
data. The data of Bender �1982� are generally reproducedwithin 0.18%. Ernst and Hochberg �1989� estimate the un-certainties of their results to be 0.2%–1.2%. However, theseestimates appear overly optimistic. The agreement with val-ues calculated from the new equation is generally better than0.5% with a few data points at 333 K deviating by up to1.5%. We consider these deviations to be clearly within theactual experimental uncertainties. The run of the isobaricheat capacity is basically determined by the highly accurate
FIG. 21. Percentage deviations of group 1 isochoric heat capacity data fromvalues calculated from the equation of state, Eq. �4.1�. Values calculatedfrom the equation of Friend et al. �1991� are plotted for comparison.
FIG. 22. Percentage deviations of isobaric heat capacity data assigned togroups 1 and 2 from values calculated from the equation of state, Eq. �4.1�.Values calculated from the equation of Friend et al. �1991� are plotted forcomparison.

233233EQUATION OF STATE FOR THE THERMODYNAMIC PROPERTIES OF ETHANE
data for the thermal properties and the speed of sound.Hence, the measurements of the isobaric heat capacity didnot have a wide influence on the development of Eq. �4.1�.The data published by Bier et al. �1976b� were classified asless reliable than the aforementioned data.
5.2.6. Enthalpy Differences and Throttling Coefficients
Percentage deviations between enthalpy differences,hexp , reported by Grini �1994� and Grini et al. �1996�, andvalues calculated from Eq. �4.1� are plotted in Fig. 23. Alldata are reproduced within 1.6%. Additionally, deviations be-tween isobaric enthalpy differences for T�1 K, calculatedfrom the equation of Friend et al. �1991� and the new equa-tion of state, are shown in the diagrams. Both equations yieldsimilar results.
Although the experimental uncertainties of the Joule–Thomson coefficients reported by Bender �1982� are speci-fied to be 0.35%, no preliminary equation could represent thevalues within this margin. Since the discrepancies betweencalculated and measured values always decreased with in-creasing pressure along the isotherms, we suspected system-atic errors in the data and performed some plausibility
FIG. 23. Percentage deviations of experimental enthalpy differences fromvalues calculated from the equation of state, Eq. �4.1�. Deviations betweenisobaric enthalpy differences for T�1 K, calculated from the equation ofFriend et al. �1991� and Eq. �4.1� are plotted for comparison.
checks. We thus could ascertain that a better representationof the measured Joule–Thomson coefficients inevitably ledto a significantly worse agreement with the p�T measure-ments of Funke et al. �2002a� in the same region. The Joule–Thomson coefficient is defined quite precisely by the highlyaccurate p�T and speed of sound data that are available inthe gas region. We hence assume systematic errors in themeasurements performed by Bender �1982�. Nevertheless,the deviations between these experimental data and valuescalculated from Eq. �4.1� are less than 0.9%.
Comparisons of � values calculated from the new equa-tion of state to experimental data are given in Fig. 24. Justlike the corresponding cp data, the measurements of theJoule–Thomson coefficient performed by Bier et al. �1976b�and Miyazaki et al. �1980� were not considered reliableenough to be included in the development of the new equa-tion. The performance of the equation of Friend et al. �1991�and Eq. �4.1� is equivalent in the liquid phase, while Eq.�4.1� is in slightly better agreement with the measurements inthe gas phase.
Absolute values of the isothermal throttling coefficient ofethane, calculated from Eq. �4.1� and from the equation ofFriend et al. �1991� are shown in Fig. 25. Additionally,smoothed values obtained by Miyazaki et al. �1980� fromtheir measurements of enthalpy differences are plotted. Therun of the throttling coefficient, particularly on the 313.15 Kisotherm, is determined mostly by the compressibility andthus by the p�T behavior of the fluid. Since both the equa-tions have been fitted to sufficiently precise thermal data, thecalculated values can be considered more reliable than thevalues obtained by measurements in this peculiar region.
5.3. Critical Region
The aim of this work is not to present a universal modelfor the thermodynamic properties in the critical region, butrather an accurate and comprehensive phenomenological de-scription of the thermodynamic properties of ethane in theentire fluid region. We did not use special nonanalyticalterms �see the statement at the end of Sec. 4.2.1�, but wechose a purely analytical functional form for the new equa-
FIG. 24. Percentage deviations of experimental data for the Joule–Thomsoncoefficient from values calculated from the equation of state, Eq. �4.1�.Values calculated from the equation of Friend et al. �1991� are plotted forcomparison.
J. Phys. Chem. Ref. Data, Vol. 35, No. 1, 2006

234234 D. BUCKER and W. WAGNER
tion of state, i.e., a functional form which can be expanded ina Taylor series about the critical point. Such equations yieldfinite values for the isochoric heat capacity and the speed ofsound at the critical point. Moreover, they result in values forthe critical exponents which do not agree with those pre-dicted by renormalization theory. However, it is a commonmisinterpretation that such equations cannot correctly de-scribe thermodynamic properties in the critical region. Infact, it will be shown in this section that Eq. �4.1� representshighly accurate data for the thermal properties clearly withintheir experimental uncertainties even in the immediate vicin-ity of the critical point.
Furthermore, the renormalization theory predicts a weakdivergence of the isochoric heat capacity for three-dimensional Ising-like systems without any outer field, e.g.,gravity. As a consequence, the speed of sound becomes zeroat the critical point. On earth, neither a singularity of the heatcapacity nor a value of zero of the speed of sound have beenobserved in experiments thus far. Unquestionably, however,in the critical region, the isochoric heat capacity increasesrapidly towards the critical point, while the speed of sounddrops off. Equation �4.1� yields finite values for both heatcapacity and speed of sound at the critical point. The rangeof parameters where Eq. �4.1� cannot reflect the steep in-crease of the isochoric heat capacity and the sharp decreaseof the speed of sound, however, is limited to �T�Tc���0.7 K.
5.3.1. Thermal Properties
The thermal properties of ethane in the critical region havebeen measured comprehensively by Funke et al. �2002a,2002b�. Total experimental uncertainties in pressure are0.007%–0.016% at 298 K�T�318 K and 120 kg m�3���280 kg m�3. Comparisons of pressures calculated from
FIG. 25. Representation of experimental data for the isothermal throttlingcoefficient. The plotted lines correspond to values calculated from the equa-tion of state, Eq. �4.1�, and from the equation of Friend et al. �1991�.
J. Phys. Chem. Ref. Data, Vol. 35, No. 1, 2006
Eq. �4.1� to these reference p�T data are shown in Fig. 26for representative isotherms. No other data sets with compa-rable accuracy are available in this region. All data are rep-resented clearly within their uncertainties. This holds equallyfor the critical isotherm and slightly sub- and supercriticalisotherms as well as for the extended critical region, which isshown in the diagrams for 313 and 323 K in Fig. 26. Theequation of Friend et al. �1991� represents these data onlywith appreciable systematic deviations that exceed the uncer-tainties of the data by far.
5.3.2. Caloric Properties
Figure 27 shows absolute values of the isochoric heat ca-pacity along the critical isochore of ethane, calculated fromEq. �4.1� and from the equation of Friend et al. �1991�. Ad-ditionally, experimental data at densities near the density areincluded. We can offer no explanation for the striking dis-agreement between the values measured by Abdulagatovet al. �1996� and by the other authors. Considering the datapublished by Haase and Tillmann �1994�, Berestov et al.�1973�, and Shmakov �1973� to be reliable, it can be seen inFig. 27 that Eq. �4.1� gives a very good representation of theisochoric heat capacity at T�306 K. Below the critical tem-perature, the two-phase isochoric heat capacities are also rep-resented within their experimental uncertainties. Thus, Eq.�4.1� does not reproduce the steep increase of the isochoricheat capacity for Tc�T�(Tc�0.7 K). The equation ofFriend et al. �1991� yields a decent representation of the ex-perimental data only at T�309 K.
The representation of speeds of sound on the phase bound-ary near the critical point was shown in Sec. 5.1.2. In thehomogenous critical region, virtually no reliable data for thespeed of sound are available. The values measured by Noury�1952�, which are the only data in the immediate vicinity ofthe critical point, exhibit considerable measuring errors. Thisis noticed in Fig. 28, which shows absolute values of data
FIG. 26. Percentage pressure deviations of highly accurate p�T data in theextended critical region from values calculated from the equation of state,Eq. �4.1�. Values calculated from the equation of Friend et al. �1991� areplotted for comparison.

235235EQUATION OF STATE FOR THE THERMODYNAMIC PROPERTIES OF ETHANE
published by Noury �1952� on three isotherms in the criticalregion. Substantially more accurate values, measured byTsumura and Straty �1977� at T�305.3 K, are also shown inthe diagram. The systematic errors inherent in the data ofNoury �1952� are obvious by comparison with the more ac-curate data. Additionally, values calculated from Eq. �4.1�and the equation of Friend et al. �1991� on the corresponding
FIG. 27. Representation of the isochoric heat capacity on the critical isoch-ore. The plotted lines correspond to values calculated from the equation ofstate, Eq. �4.1�, and from the equation of Friend et al. �1991�.
FIG. 28. Representation of the speed of sound on isotherms in the extendedcritical region. The plotted lines correspond to values calculated from theequation of state, Eq. �4.1�, and from the equation of Friend et al. �1991�.
isotherms are plotted as lines. Due to the poor quality of thedata, no reliable conclusion can be drawn on the regionwhere the equations yield physically correct values for thespeed of sound.
5.4. Extrapolation Behavior
5.4.1. High Pressures and High Temperatures
No experimental data for the thermodynamic properties ofethane are available beyond 900 MPa and 673 K. To ensurereasonable behavior at very high pressures and temperatures,28 p�T data have been calculated from the recent referenceequation of state for nitrogen, Span et al. �2000�, and trans-ferred to ethane by a simple corresponding states approachthat goes back to van der Waals �simple substances have thesame reduced density � for the same reduced pressure andtemperature, � and ��. These data were used in the develop-ment of the new equation of state with low weights. Figure29 compares these data with values calculated from Eq. �4.1�and from the equation of Friend et al. �1991�. Equation �4.1�yields reasonable plots of the isotherms in the entire range ofparameters. The pressures calculated from the equation ofFriend et al. �1991� appear to be far too large and, at veryhigh pressures, the isotherms suddenly deviate, as can beseen for the 500 K isotherm, dropping off towards zero andeven displaying negative pressures.
5.4.2. Ideal Curves
Ideal curves are frequently used to verify the extrapolationbehavior of equations of state. In this work, ideal curves ofthe compression factor and its first derivatives are consid-ered, namely the classical ideal curve (Z�1), the Boylecurve �(�Z/��)T�0� , the Joule–Thomson inversion curve
FIG. 29. Representation of data calculated from the reference equation ofstate for nitrogen �Span et al. �2000�� and transferred to ethane by a simplecorresponding states approach. The plotted lines correspond to values cal-culated from the equation of state, Eq. �4.1�, and from the equation of Friendet al. �1991�.
J. Phys. Chem. Ref. Data, Vol. 35, No. 1, 2006

236236 D. BUCKER and W. WAGNER
�(�Z/�T)p�0� , and the Joule inversion curve �(�Z/�T)�
�0� . The plots of these characteristic curves, calculatedfrom Eq. �4.1� and from the equation of Friend et al. �1991�,are shown in Fig. 30. Although no quantitative informationshould be drawn from the diagram, the plot of the curvescalculated from Eq. �4.1� shows reasonable shapes with nosharp inflection points or random oscillations. Each of thecurves intersects the abscissa at values of the reduced tem-perature that compare well to results for other well measuredsubstances, see Span and Wagner �1997�. All this indicatesqualitatively correct extrapolation behavior of the new equa-tion of state. The equation of Friend et al. �1991� yields rea-sonable plots only for three of the considered ideal curves.The shape of the Joule inversion curve is not plausible andno intersection with the abscissa occurs, indicating that anextrapolation of this equation to high temperatures will givemisleading results.
6. Estimated Uncertainty of CalculatedProperties
Based on comparisons of calculated properties to availableexperimental data, estimates for the uncertainty of calculateddensities, speeds of sound, isochoric heat capacities, and iso-baric heat capacities have been established. These uncertain-ties are illustrated in tolerance diagrams in Figs. 31–33. Allestimates are given as total expanded uncertainties �coveragefactor k�2 corresponding to a level of confidence of about95%�.
According to the results of the assessment of the extrapo-lation behavior presented in Sec. 5.4, Eq. �4.1� should yieldreasonable results outside of its range of validity at least for
FIG. 30. ‘‘Ideal curves’’ in a double logarithmic p/pc vs. T/Tc diagram. Thecurves correspond to values calculated from the equation of state, Eq. �4.1�,and from the equation of Friend et al. �1991�. The area marked in graycorresponds to the region where Eq. �4.1� was fitted to experimental data.
J. Phys. Chem. Ref. Data, Vol. 35, No. 1, 2006
basic thermodynamic properties like pressure, density, andenthalpy. One should be more careful when extrapolating Eq.�4.1� with regard to caloric properties for which second de-rivatives of the equation of state are needed, for example,heat capacities and speeds of sound. The uncertainties ofthese extrapolated properties might be clearly higher thanthose of the basic properties.
7. Recommendations for Improvingthe Basis of the Experimental Data
The thermal properties on the vapor–liquid phase bound-ary are very well measured. There is no need for any improv-ing.
The data situation regarding the p�T data in the single-phase region could be clearly improved by having experi-mental data with uncertainties of less than about 0.05% forthe entire temperature range from the melting line to 700 K
FIG. 31. Tolerance diagram for densities calculated from the equation ofstate, Eq. �4.1�. In the extended critical region the uncertainty in pressure isgiven.
FIG. 32. Tolerance diagram for speeds of sound calculated from the equationof state, Eq. �4.1�.

237237EQUATION OF STATE FOR THE THERMODYNAMIC PROPERTIES OF ETHANE
and pressures between about 30 and 100 MPa. Moreover, itwould be desirable to have p�T data with density uncertain-ties of less than 0.2% for pressures above 100 MPa over theentire temperature range.
As usual, compared with the p�T data, the data situationregarding the caloric properties is clearly worse. Concerningthe speed of sound, the very good data in the liquid region ofTsumura and Straty �1977� should be supplemented byspeed-of-sound measurements below about 5 MPa and aboveabout 40 MPa. Moreover, for pressures above 10 MPa thedata should extend to temperatures higher than 350 K, pref-erably up to about 650 K. The experimental uncertainty ofsuch data should be not higher than 0.05%–0.1% in thespeed of sound. It would also be welcomed, when in the gasphase the measurements with the spherical resonator couldbe extended to higher temperatures.
FIG. 33. Tolerance diagram for isobaric and isochoric heat capacities calcu-lated from the equation of state, Eq. �4.1�.
Experimental data of heat capacities are only really help-ful if they are accurate enough. This means that measure-ments of the isochoric heat capacity should cover the liquidregion up to possibly 100 MPa, where the experimental un-certainties should be 0.2%–0.4%. Concerning isobaric heatcapacities, it would be desirable to have such data in the gasregion and also in the supercritical range up to high pressuresand temperatures of up to 500 K or higher. However, theserequirements on cv and cp measurements might probably beunrealistic. Therefore, it would be all the more important toget p�T data and speed of sound data of very good qualitythat fill the gaps mentioned above.
8. Acknowledgments
We would like to express our gratitude to C. Guder for hismany important contributions to this work and to E. W. Lem-mon for his very valuable suggestions and advice. We areindebted to the Deutsche Forschungsgemeinschaft �GermanResearch Association� for their financial support of thisproject.
9. Appendix: Tables of ThermodynamicProperties of Ethane
Table 29 is given here for the saturation properties ofethane as a function of temperature and Table 30 for single-phase state points from 0.1 to 900 MPa from the melting lineto 675 K. In order to preserve thermodynamic consistency,all values were calculated from the new equation of stategiven by Eqs. �4.1�, �4.6�, and �4.8�. The saturation proper-ties were calculated using the phase-equilibrium conditionand are also shown in the single-phase table to define theboundary between liquid and vapor state. The melting pres-sures were calculated from Eq. �2.3�.
J. Phys. Chem. Ref. Data, Vol. 35, No. 1, 2006
238238 D. BUCKER and W. WAGNER
TABLE 29. Thermodynamic properties of ethane on the vapor–liquid phase boundary as a function of temperaturea
T�K�
p�MPa�
�(kg m�3)
h(kJ kg�1)
s(kJ kg�1 K�1)
cv
(kJ kg�1 K�1)cp
(kJ kg�1 K�1)w
(m s�1)
90.368b 0.000 0011 651.529 48 �888.90 �5.058 1.605 2.326 2008.690.000 046 �294.12 1.524 0.892 1.168 180.93
92 0.000 0017 649.731 65 �885.11 �5.016 1.591 2.315 1996.720.000 068 �292.22 1.428 0.895 1.171 182.48
94 0.000 0029 647.532 28 �880.49 �4.966 1.576 2.304 1982.080.000 11 �289.87 1.317 0.899 1.175 184.36
96 0.000 0046 645.335 99 �875.89 �4.918 1.563 2.295 1967.480.000 17 �287.52 1.211 0.903 1.179 186.22
98 0.000 0072 643.141 70 �871.31 �4.871 1.551 2.288 1952.940.000 27 �285.15 1.110 0.907 1.183 188.05
100 0.000 011 640.948 52 �866.74 �4.825 1.541 2.283 1938.440.000 40 �282.78 1.015 0.911 1.187 189.86
102 0.000 017 638.755 69 �862.18 �4.779 1.531 2.279 1923.970.000 59 �280.41 0.924 0.915 1.191 191.65
104 0.000 025 636.562 54 �857.62 �4.735 1.523 2.276 1909.550.000 87 �278.02 0.838 0.919 1.195 193.42
106 0.000 036 634.368 52 �853.07 �4.692 1.515 2.274 1895.140.001 24 �275.63 0.756 0.923 1.199 195.17
108 0.000 052 632.173 12 �848.53 �4.649 1.508 2.273 1880.750.001 75 �273.23 0.677 0.927 1.204 196.90
110 0.000 074 629.975 91 �843.98 �4.608 1.502 2.273 1866.370.002 44 �270.82 0.603 0.931 1.208 198.61
112 0.000 104 627.776 49 �839.43 �4.567 1.497 2.274 1851.990.003 36 �268.41 0.532 0.935 1.212 200.30
114 0.000 144 625.574 51 �834.88 �4.526 1.491 2.274 1837.610.004 56 �265.99 0.464 0.940 1.216 201.98
116 0.000 196 623.369 63 �830.33 �4.487 1.487 2.276 1823.220.006 11 �263.56 0.399 0.944 1.221 203.63
118 0.000 264 621.161 55 �825.78 �4.448 1.482 2.278 1808.810.008 10 �261.13 0.337 0.948 1.226 205.27
120 0.000 352 618.949 97 �821.22 �4.410 1.478 2.280 1794.400.010 62 �258.69 0.278 0.953 1.230 206.89
122 0.000 465 616.734 62 �816.66 �4.372 1.475 2.282 1779.960.013 79 �256.25 0.222 0.957 1.235 208.49
124 0.000 608 614.515 22 �812.10 �4.335 1.471 2.284 1765.510.017 74 �253.80 0.168 0.962 1.240 210.07
126 0.000 787 612.291 49 �807.52 �4.298 1.468 2.287 1751.040.022 60 �251.35 0.116 0.967 1.245 211.63
128 0.001 009 610.063 17 �802.95 �4.262 1.465 2.290 1736.540.028 55 �248.89 0.066 0.972 1.251 213.17
130 0.001 284 607.829 99 �798.36 �4.227 1.462 2.293 1722.030.035 76 �246.43 0.019 0.977 1.256 214.69
132 0.001 620 605.591 68 �793.77 �4.192 1.459 2.297 1707.490.044 45 �243.96 �0.026 0.982 1.262 216.19
134 0.002 028 603.347 96 �789.18 �4.157 1.457 2.300 1692.920.054 84 �241.50 �0.070 0.987 1.267 217.68
136 0.002 521 601.098 56 �784.57 �4.123 1.455 2.304 1678.340.067 18 �239.03 �0.112 0.993 1.273 219.14
J. Phys. Chem. Ref. Data, Vol. 35, No. 1, 2006

239239EQUATION OF STATE FOR THE THERMODYNAMIC PROPERTIES OF ETHANE
TABLE 29. Thermodynamic properties of ethane on the vapor–liquid phase boundary as a function of temperature—Continued
T�K�
p�MPa�
�(kg m�3)
h(kJ kg�1)
s(kJ kg�1 K�1)
cv
(kJ kg�1 K�1)cp
(kJ kg�1 K�1)w
(m s�1)
138 0.003 111 598.843 19 �779.96 �4.089 1.452 2.307 1663.730.081 73 �236.55 �0.152 0.998 1.279 220.58
140 0.003 814 596.581 56 �775.34 �4.056 1.450 2.311 1649.090.098 80 �234.08 �0.190 1.003 1.284 222.01
142 0.004 645 594.313 37 �770.71 �4.023 1.448 2.315 1634.430.118 69 �231.61 �0.227 1.008 1.290 223.42
144 0.005 623 592.038 32 �766.08 �3.991 1.446 2.319 1619.750.141 76 �229.13 �0.262 1.013 1.296 224.80
146 0.006 766 589.756 10 �761.43 �3.959 1.445 2.324 1605.030.168 36 �226.66 �0.296 1.018 1.301 226.17
148 0.008 097 587.466 38 �756.78 �3.927 1.443 2.328 1590.290.198 88 �224.18 �0.329 1.022 1.307 227.51
150 0.009 638 585.168 84 �752.12 �3.896 1.442 2.333 1575.530.233 73 �221.71 �0.360 1.027 1.312 228.84
152 0.011 413 582.863 12 �747.44 �3.865 1.440 2.337 1560.740.273 35 �219.24 �0.390 1.031 1.317 230.14
154 0.013 448 580.548 89 �742.76 �3.834 1.439 2.342 1545.920.318 20 �216.77 �0.419 1.036 1.322 231.42
156 0.015 772 578.225 79 �738.07 �3.804 1.438 2.347 1531.070.368 75 �214.31 �0.447 1.040 1.328 232.68
158 0.018 414 575.893 43 �733.37 �3.774 1.437 2.352 1516.190.425 52 �211.85 �0.474 1.044 1.333 233.91
160 0.021 405 573.551 44 �728.65 �3.745 1.436 2.357 1501.290.489 01 �209.40 �0.499 1.048 1.338 235.12
162 0.024 779 571.199 43 �723.93 �3.715 1.435 2.363 1486.350.559 79 �206.96 �0.524 1.052 1.344 236.30
164 0.028 570 568.836 98 �719.19 �3.686 1.435 2.369 1471.380.638 42 �204.53 �0.548 1.056 1.349 237.45
166 0.032 814 566.463 69 �714.45 �3.658 1.434 2.374 1456.380.725 49 �202.10 �0.571 1.061 1.355 238.57
168 0.037 551 564.079 11 �709.69 �3.629 1.434 2.381 1441.350.821 61 �199.69 �0.594 1.065 1.361 239.67
170 0.042 819 561.682 81 �704.91 �3.601 1.433 2.387 1426.290.927 42 �197.29 �0.615 1.070 1.368 240.73
172 0.048 660 559.274 32 �700.13 �3.573 1.433 2.393 1411.201.043 57 �194.91 �0.636 1.075 1.375 241.76
174 0.055 118 556.853 17 �695.33 �3.545 1.433 2.400 1396.071.170 73 �192.54 �0.656 1.080 1.383 242.76
176 0.062 235 554.418 86 �690.51 �3.518 1.433 2.407 1380.901.309 60 �190.18 �0.675 1.086 1.391 243.72
178 0.070 060 551.970 89 �685.68 �3.491 1.433 2.414 1365.711.460 88 �187.85 �0.694 1.092 1.400 244.65
180 0.078 638 549.508 74 �680.84 �3.464 1.434 2.421 1350.471.625 33 �185.53 �0.712 1.098 1.409 245.54
182 0.088 019 547.031 86 �675.98 �3.437 1.434 2.429 1335.201.803 68 �183.23 �0.730 1.105 1.419 246.39
184 0.098 253 544.539 69 �671.10 �3.410 1.435 2.437 1319.891.996 73 �180.95 �0.747 1.112 1.430 247.20
J. Phys. Chem. Ref. Data, Vol. 35, No. 1, 2006

240240 D. BUCKER and W. WAGNER
TABLE 29. Thermodynamic properties of ethane on the vapor–liquid phase boundary as a function of temperature—Continued
T�K�
p�MPa�
�(kg m�3)
h(kJ kg�1)
s(kJ kg�1 K�1)
cv
(kJ kg�1 K�1)cp
(kJ kg�1 K�1)w
(m s�1)
186 0.109 391 542.031 64 �666.20 �3.384 1.435 2.445 1304.552.205 26 �178.69 �0.763 1.119 1.441 247.98
188 0.121 485 539.507 11 �661.29 �3.358 1.436 2.454 1289.172.430 10 �176.45 �0.779 1.127 1.453 248.71
190 0.134 591 536.965 48 �656.36 �3.332 1.437 2.463 1273.752.672 08 �174.24 �0.794 1.135 1.466 249.41
192 0.148 761 534.406 09 �651.41 �3.306 1.438 2.472 1258.282.932 09 �172.04 �0.810 1.143 1.479 250.06
194 0.164 053 531.828 26 �646.44 �3.281 1.439 2.482 1242.783.211 00 �169.88 �0.824 1.152 1.493 250.67
196 0.180 524 529.231 30 �641.45 �3.255 1.441 2.492 1227.243.509 73 �167.73 �0.838 1.161 1.507 251.24
198 0.198 231 526.614 46 �636.44 �3.230 1.442 2.502 1211.663.829 23 �165.61 �0.852 1.170 1.522 251.77
200 0.217 233 523.976 98 �631.41 �3.205 1.444 2.512 1196.044.170 47 �163.52 �0.865 1.179 1.537 252.26
202 0.237 590 521.318 06 �626.36 �3.180 1.445 2.524 1180.374.534 44 �161.46 �0.878 1.189 1.553 252.70
204 0.259 364 518.636 87 �621.28 �3.155 1.447 2.535 1164.664.922 20 �159.42 �0.891 1.198 1.570 253.10
206 0.282 614 515.932 54 �616.18 �3.130 1.449 2.547 1148.915.334 79 �157.41 �0.903 1.208 1.587 253.45
208 0.307 404 513.204 15 �611.05 �3.106 1.452 2.559 1133.115.773 35 �155.43 �0.915 1.218 1.604 253.76
210 0.333 796 510.450 75 �605.90 �3.081 1.454 2.572 1117.276.239 00 �153.48 �0.927 1.228 1.622 254.02
212 0.361 855 507.671 32 �600.71 �3.057 1.456 2.586 1101.386.732 95 �151.56 �0.939 1.239 1.640 254.24
214 0.391 644 504.864 82 �595.51 �3.033 1.459 2.600 1085.447.256 44 �149.68 �0.950 1.249 1.659 254.41
216 0.423 228 502.030 14 �590.27 �3.009 1.462 2.614 1069.467.810 76 �147.83 �0.961 1.259 1.679 254.54
218 0.456 674 499.166 09 �585.00 �2.985 1.465 2.629 1053.428.397 26 �146.01 �0.971 1.269 1.699 254.62
220 0.492 046 496.271 45 �579.70 �2.961 1.468 2.645 1037.349.017 35 �144.23 �0.982 1.280 1.720 254.65
222 0.529 413 493.344 90 �574.37 �2.937 1.471 2.661 1021.209.672 52 �142.49 �0.992 1.290 1.741 254.63
224 0.568 842 490.385 06 �569.01 �2.914 1.474 2.678 1005.0110.364 31 �140.79 �1.002 1.301 1.764 254.56
226 0.610 401 487.390 45 �563.61 �2.890 1.478 2.696 988.7611.094 37 �139.13 �1.012 1.311 1.786 254.44
228 0.654 158 484.359 51 �558.17 �2.866 1.481 2.715 972.4611.864 42 �137.51 �1.021 1.322 1.810 254.27
230 0.700 182 481.290 57 �552.70 �2.843 1.485 2.734 956.0912.676 27 �135.94 �1.031 1.333 1.835 254.05
232 0.748 545 478.181 85 �547.19 �2.820 1.489 2.755 939.6613.531 88 �134.41 �1.040 1.344 1.861 253.78
J. Phys. Chem. Ref. Data, Vol. 35, No. 1, 2006

241241EQUATION OF STATE FOR THE THERMODYNAMIC PROPERTIES OF ETHANE
TABLE 29. Thermodynamic properties of ethane on the vapor–liquid phase boundary as a function of temperature—Continued
T�K�
p�MPa�
�(kg m�3)
h(kJ kg�1)
s(kJ kg�1 K�1)
cv
(kJ kg�1 K�1)cp
(kJ kg�1 K�1)w
(m s�1)
234 0.799 315 475.031 44 �541.63 �2.796 1.493 2.776 923.1714.433 28 �132.93 �1.050 1.355 1.888 253.45
236 0.852 564 471.837 30 �536.04 �2.773 1.498 2.799 906.6015.382 66 �131.51 �1.059 1.366 1.916 253.07
238 0.908 364 468.597 23 �530.40 �2.750 1.502 2.822 889.9716.382 36 �130.13 �1.068 1.377 1.945 252.64
240 0.966 788 465.308 87 �524.72 �2.726 1.507 2.847 873.2517.434 87 �128.82 �1.077 1.388 1.976 252.14
242 1.027 908 461.969 65 �518.98 �2.703 1.512 2.873 856.4518.542 86 �127.56 �1.086 1.400 2.009 251.59
244 1.091 798 458.576 80 �513.20 �2.680 1.517 2.901 839.5719.709 22 �126.36 �1.094 1.412 2.043 250.98
246 1.158 534 455.127 32 �507.37 �2.657 1.522 2.930 822.5920.937 06 �125.23 �1.103 1.423 2.080 250.31
248 1.228 191 451.617 92 �501.48 �2.633 1.528 2.961 805.5122.229 75 �124.17 �1.112 1.436 2.119 249.58
250 1.300 845 448.045 02 �495.53 �2.610 1.533 2.994 788.3323.590 94 �123.18 �1.121 1.448 2.160 248.79
252 1.376 574 444.404 71 �489.52 �2.587 1.539 3.029 771.0325.024 63 �122.27 �1.129 1.461 2.205 247.93
254 1.455 457 440.692 67 �483.45 �2.564 1.546 3.066 753.6026.535 17 �121.43 �1.138 1.474 2.252 247.00
256 1.537 574 436.904 16 �477.32 �2.540 1.552 3.106 736.0528.127 37 �120.68 �1.147 1.488 2.303 246.01
258 1.623 006 433.033 93 �471.11 �2.517 1.559 3.149 718.3629.806 50 �120.03 �1.156 1.502 2.358 244.95
260 1.711 835 429.076 17 �464.83 �2.493 1.566 3.195 700.5231.578 45 �119.47 �1.165 1.516 2.418 243.81
262 1.804 148 425.024 40 �458.47 �2.470 1.573 3.244 682.5333.449 73 �119.01 �1.174 1.531 2.483 242.61
264 1.900 029 420.871 38 �452.02 �2.446 1.580 3.298 664.3835.427 65 �118.66 �1.183 1.546 2.554 241.33
266 1.999 567 416.608 96 �445.49 �2.422 1.588 3.356 646.0637.520 45 �118.44 �1.193 1.562 2.632 239.97
268 2.102 853 412.227 93 �438.86 �2.399 1.597 3.420 627.5839.737 43 �118.34 �1.203 1.578 2.719 238.54
270 2.209 980 407.717 76 �432.13 �2.375 1.605 3.491 608.9242.089 22 �118.38 �1.212 1.595 2.815 237.02
272 2.321 044 403.066 36 �425.28 �2.350 1.614 3.568 590.0844.587 99 �118.56 �1.223 1.613 2.922 235.42
274 2.436 146 398.259 65 �418.32 �2.326 1.624 3.655 571.0447.247 85 �118.92 �1.233 1.632 3.043 233.73
276 2.555 389 393.281 18 �411.23 �2.301 1.633 3.752 551.7750.085 27 �119.45 �1.244 1.652 3.181 231.95
278 2.678 881 388.111 45 �403.99 �2.276 1.644 3.862 532.2353.119 68 �120.19 �1.255 1.673 3.339 230.07
280 2.806 736 382.727 12 �396.59 �2.251 1.654 3.987 512.3856.374 28 �121.14 �1.267 1.696 3.522 228.10
J. Phys. Chem. Ref. Data, Vol. 35, No. 1, 2006

242242 D. BUCKER and W. WAGNER
TABLE 29. Thermodynamic properties of ethane on the vapor–liquid phase boundary as a function of temperature—Continued
T�K�
p�MPa�
�(kg m�3)
h(kJ kg�1)
s(kJ kg�1 K�1)
cv
(kJ kg�1 K�1)cp
(kJ kg�1 K�1)w
(m s�1)
282 2.939 073 377.099 93 �389.02 �2.225 1.666 4.132 492.1559.877 13 �122.34 �1.279 1.720 3.737 226.01
284 3.076 020 371.195 12 �381.24 �2.199 1.678 4.303 471.4663.662 74 �123.83 �1.293 1.745 3.992 223.82
286 3.217 713 364.969 23 �373.24 �2.172 1.692 4.506 450.2267.774 29 �125.64 �1.306 1.773 4.300 221.51
288 3.364 299 358.366 67 �364.98 �2.145 1.708 4.753 428.3472.267 04 �127.82 �1.321 1.803 4.681 219.07
290 3.515 942 351.314 40 �356.42 �2.117 1.727 5.061 405.7077.213 56 �130.45 �1.337 1.835 5.162 216.50
292 3.672 818 343.713 15 �347.48 �2.088 1.749 5.459 382.1882.712 39 �133.61 �1.355 1.871 5.791 213.78
294 3.835 131 335.422 19 �338.08 �2.057 1.776 5.995 357.6488.903 01 �137.44 �1.375 1.912 6.648 210.88
296 4.003 112 326.230 70 �328.10 �2.025 1.809 6.757 331.8495.994 15 �142.14 �1.397 1.959 7.885 207.77
298 4.177 038 315.798 16 �317.30 �1.990 1.852 7.937 304.47104.323 07 �148.01 �1.422 2.016 9.826 204.37
300 4.357 255 303.508 79 �305.32 �1.952 1.912 10.022 274.91114.500 91 �155.61 �1.453 2.089 13.299 200.51
301 4.449 861 296.305 93 �298.65 �1.931 1.952 11.815 258.98120.643 14 �160.39 �1.472 2.136 16.304 198.29
302 4.544 230 288.016 28 �291.29 �1.908 2.005 14.743 241.95127.867 74 �166.17 �1.493 2.194 21.215 195.74
303 4.640 463 278.032 97 �282.87 �1.881 2.079 20.373 223.34136.781 05 �173.47 �1.520 2.270 30.602 192.59
304 4.738 705 264.891 19 �272.44 �1.848 2.197 35.385 202.16148.851 27 �183.59 �1.556 2.386 55.117 188.14
305 4.839 225 241.961 49 �255.73 �1.794 2.470 164.093 175.12170.754 82 �202.19 �1.619 2.623 247.460 178.83
305.322c 4.872 200 206.180 00 �230.72 �1.713
aFor each temperature, the values on the first line correspond to the saturated-liquid line and the values on the second line correspond to the saturated-vaporline.
bTriple point.cCritical point.
J. Phys. Chem. Ref. Data, Vol. 35, No. 1, 2006

243243EQUATION OF STATE FOR THE THERMODYNAMIC PROPERTIES OF ETHANE
TABLE 30. Thermodynamic properties of ethane in the single-phase region
T�K�
�(kg m�3)
u(kJ kg�1)
h(kJ kg�1)
s(kJ kg�1 K�1)
cv
(kJ kg�1 K�1)cp
(kJ kg�1 K�1)w
(m s�1)
0.1 MPa
90.384a 651.55 �888.88 �888.73 �5.0574 1.6051 2.3256 2008.9795 646.47 �878.21 �878.06 �4.9423 1.5694 2.2990 1975.17
100 640.99 �866.77 �866.61 �4.8249 1.5407 2.2826 1938.83105 635.51 �855.38 �855.22 �4.7137 1.5191 2.2749 1902.75
110 630.02 �844.01 �843.85 �4.6079 1.5024 2.2730 1866.79115 624.52 �832.64 �832.48 �4.5069 1.4892 2.2749 1830.85120 619.00 �821.26 �821.10 �4.4100 1.4785 2.2794 1794.85125 613.45 �809.85 �809.69 �4.3168 1.4696 2.2856 1758.75130 607.88 �798.40 �798.24 �4.2270 1.4622 2.2932 1722.52
135 602.28 �786.92 �786.75 �4.1403 1.4558 2.3017 1686.14140 596.64 �775.39 �775.22 �4.0564 1.4503 2.3111 1649.61145 590.96 �763.81 �763.64 �3.9751 1.4457 2.3213 1612.93150 585.23 �752.18 �752.01 �3.8963 1.4418 2.3323 1576.07155 579.45 �740.49 �740.32 �3.8196 1.4387 2.3443 1539.03
160 573.61 �728.74 �728.56 �3.7450 1.4362 2.3572 1501.80165 567.71 �716.92 �716.74 �3.6722 1.4345 2.3712 1464.37170 561.73 �705.03 �704.85 �3.6012 1.4335 2.3865 1426.71175 555.67 �693.05 �692.87 �3.5318 1.4332 2.4032 1388.81180 549.53 �681.00 �680.81 �3.4638 1.4337 2.4214 1350.64184.33b 544.13 �670.49 �670.30 �3.4062 1.4347 2.4385 1317.40184.33c 2.0295 �229.85 �180.58 �0.749 30 1.1128 1.4317 247.33
185 2.0213 �229.09 �179.61 �0.744 07 1.1143 1.4327 247.80190 1.9626 �223.38 �172.43 �0.705 76 1.1260 1.4405 251.25195 1.9075 �217.63 �165.21 �0.668 24 1.1376 1.4485 254.61200 1.8557 �211.83 �157.94 �0.631 46 1.1491 1.4570 257.90210 1.7608 �200.08 �143.28 �0.559 92 1.1735 1.4762 264.25
220 1.6757 �188.09 �128.41 �0.490 74 1.2002 1.4989 270.34230 1.5989 �175.84 �113.29 �0.423 55 1.2292 1.5249 276.18240 1.5291 �163.30 �97.903 �0.358 05 1.2604 1.5535 281.81250 1.4654 �150.45 �82.215 �0.294 01 1.2933 1.5845 287.25260 1.4070 �137.28 �66.207 �0.231 23 1.3279 1.6174 292.53
270 1.3532 �123.76 �49.861 �0.169 55 1.3639 1.6521 297.65280 1.3035 �109.88 �33.161 �0.108 82 1.4012 1.6882 302.63290 1.2573 �95.626 �16.092 �0.048 93 1.4397 1.7256 307.49300 1.2144 �80.987 1.3561 0.010 223 1.4791 1.7642 312.23310 1.1744 �65.954 19.195 0.068 713 1.5194 1.8037 316.88
320 1.1370 �50.518 37.433 0.126 61 1.5604 1.8441 321.43330 1.1019 �34.673 56.079 0.183 99 1.6020 1.8851 325.89340 1.0690 �18.411 75.137 0.240 88 1.6440 1.9266 330.28350 1.0380 �1.7298 94.612 0.297 33 1.6864 1.9686 334.59360 1.0087 15.375 114.51 0.353 38 1.7291 2.0109 338.84
370 0.981 12 32.906 134.83 0.409 05 1.7720 2.0533 343.02380 0.954 99 50.864 155.58 0.464 38 1.8149 2.0960 347.15390 0.930 23 69.250 176.75 0.519 37 1.8579 2.1386 351.22400 0.906 74 88.063 198.35 0.574 05 1.9007 2.1812 355.24425 0.852 93 136.96 254.20 0.709 47 2.0072 2.2871 365.07
450 0.805 18 188.50 312.69 0.843 16 2.1122 2.3916 374.65475 0.762 53 242.62 373.77 0.975 22 2.2150 2.4940 383.97500 0.724 20 299.29 437.37 1.1057 2.3153 2.5941 393.08525 0.689 55 358.42 503.45 1.2346 2.4130 2.6915 401.99550 0.658 07 419.97 571.92 1.3620 2.5079 2.7862 410.71
575 0.629 36 483.84 642.73 1.4879 2.6001 2.8782 419.25600 0.603 05 549.99 715.81 1.6123 2.6895 2.9674 427.63625 0.578 86 618.33 791.08 1.7352 2.7762 3.0539 435.85650 0.556 54 688.80 868.48 1.8566 2.8602 3.1379 443.92675 0.535 89 761.35 947.95 1.9766 2.9418 3.2193 451.85
J. Phys. Chem. Ref. Data, Vol. 35, No. 1, 2006
244244 D. BUCKER and W. WAGNER
TABLE 30. Thermodynamic properties of ethane in the single-phase region—Continued
T�K�
�(kg m�3)
u(kJ kg�1)
h(kJ kg�1)
s(kJ kg�1 K�1)
cv
(kJ kg�1 K�1)cp
(kJ kg�1 K�1)w
(m s�1)
0.5 MPa
90.449a 651.62 �888.83 �888.06 �5.0568 1.6050 2.3250 2010.1295 646.62 �878.31 �877.54 �4.9434 1.5699 2.2987 1976.74100 641.15 �866.87 �866.09 �4.8259 1.5412 2.2823 1940.41105 635.67 �855.49 �854.70 �4.7148 1.5196 2.2745 1904.36
110 630.19 �844.13 �843.34 �4.6090 1.5029 2.2725 1868.46115 624.70 �832.77 �831.97 �4.5080 1.4897 2.2744 1832.59120 619.19 �821.40 �820.59 �4.4111 1.4790 2.2788 1796.66125 613.65 �810.00 �809.18 �4.3180 1.4701 2.2850 1760.64130 608.09 �798.56 �797.74 �4.2282 1.4627 2.2924 1724.50
135 602.50 �787.09 �786.26 �4.1415 1.4563 2.3009 1688.21140 596.87 �775.57 �774.73 �4.0577 1.4509 2.3102 1651.78145 591.20 �764.00 �763.15 �3.9765 1.4463 2.3203 1615.20150 585.49 �752.38 �751.52 �3.8976 1.4424 2.3312 1578.45155 579.72 �740.70 �739.84 �3.8210 1.4392 2.3430 1541.53
160 573.90 �728.96 �728.09 �3.7464 1.4368 2.3558 1504.43165 568.01 �717.16 �716.28 �3.6737 1.4350 2.3696 1467.13170 562.06 �705.28 �704.39 �3.6027 1.4340 2.3847 1429.61175 556.02 �693.33 �692.43 �3.5334 1.4337 2.4012 1391.87180 549.90 �681.29 �680.38 �3.4655 1.4342 2.4191 1353.88
185 543.68 �669.16 �668.24 �3.3989 1.4355 2.4387 1315.61190 537.35 �656.92 �655.99 �3.3336 1.4375 2.4602 1277.05195 530.90 �644.57 �643.63 �3.2694 1.4404 2.4839 1238.16200 524.32 �632.10 �631.15 �3.2062 1.4441 2.5098 1198.92210 510.69 �606.74 �605.76 �3.0823 1.4541 2.5702 1119.19
220 496.28 �580.70 �579.70 �2.9611 1.4677 2.6448 1037.44220.43b 495.64 �579.55 �578.55 �2.9559 1.4683 2.6484 1033.83220.43c 9.1568 �198.45 �143.85 �0.983 90 1.2822 1.7246 254.65230 8.6361 �185.44 �127.54 �0.911 47 1.2847 1.6923 262.24240 8.1679 �171.88 �110.66 �0.839 62 1.3026 1.6869 269.53250 7.7584 �158.21 �93.762 �0.770 65 1.3267 1.6941 276.34260 7.3953 �144.36 �76.750 �0.703 93 1.3549 1.7094 282.75
270 7.0698 �130.28 �59.555 �0.639 03 1.3861 1.7304 288.84280 6.7757 �115.92 �42.127 �0.575 65 1.4198 1.7559 294.66290 6.5080 �101.25 �24.425 �0.513 54 1.4554 1.7849 300.25300 6.2629 �86.256 �6.4202 �0.452 50 1.4926 1.8166 305.63310 6.0373 �70.905 11.913 �0.392 39 1.5312 1.8504 310.84
320 5.8288 �55.187 30.594 �0.333 09 1.5707 1.8860 315.90330 5.6353 �39.089 49.637 �0.274 49 1.6111 1.9230 320.81340 5.4552 �22.599 69.057 �0.216 52 1.6522 1.9611 325.61350 5.2870 �5.7105 88.862 �0.159 11 1.6938 2.0001 330.29360 5.1294 11.583 109.06 �0.102 21 1.7358 2.0397 334.87
370 4.9815 29.287 129.66 �0.045 78 1.7781 2.0799 339.36380 4.8423 47.405 150.66 0.010 229 1.8205 2.1205 343.77390 4.7111 65.938 172.07 0.065 838 1.8630 2.1614 348.10400 4.5871 84.888 193.89 0.121 08 1.9055 2.2024 352.35425 4.3050 134.09 250.23 0.257 67 2.0111 2.3050 362.71
450 4.0566 185.87 309.13 0.392 31 2.1155 2.4068 372.70475 3.8362 240.22 370.56 0.525 13 2.2178 2.5071 382.39500 3.6390 297.07 434.47 0.656 24 2.3177 2.6055 391.80525 3.4616 356.37 500.81 0.785 70 2.4151 2.7015 400.96550 3.3010 418.05 569.53 0.913 54 2.5098 2.7951 409.90
575 3.1549 482.06 640.54 1.0398 2.6017 2.8861 418.63600 3.0213 548.32 713.81 1.1645 2.6910 2.9745 427.17625 2.8988 616.76 789.25 1.2877 2.7775 3.0603 435.53650 2.7859 687.33 866.80 1.4093 2.8614 3.1437 443.73675 2.6816 759.96 946.41 1.5295 2.9428 3.2245 451.77
J. Phys. Chem. Ref. Data, Vol. 35, No. 1, 2006

245245EQUATION OF STATE FOR THE THERMODYNAMIC PROPERTIES OF ETHANE
TABLE 30. Thermodynamic properties of ethane in the single-phase region—Continued
T�K�
�(kg m�3)
u(kJ kg�1)
h(kJ kg�1)
s(kJ kg�1 K�1)
cv
(kJ kg�1 K�1)cp
(kJ kg�1 K�1)w
(m s�1)
1 MPa
90.529a 651.71 �888.76 �887.22 �5.0561 1.6049 2.3241 2011.5395 646.81 �878.44 �876.89 �4.9447 1.5706 2.2984 1978.69100 641.34 �867.01 �865.45 �4.8273 1.5419 2.2818 1942.37105 635.88 �855.63 �854.06 �4.7161 1.5202 2.2740 1906.37
110 630.41 �844.28 �842.70 �4.6104 1.5035 2.2719 1870.55115 624.93 �832.93 �831.33 �4.5094 1.4903 2.2737 1834.76120 619.43 �821.57 �819.96 �4.4125 1.4796 2.2780 1798.93125 613.90 �810.18 �808.55 �4.3194 1.4708 2.2841 1763.00130 608.36 �798.76 �797.11 �4.2297 1.4633 2.2915 1726.96
135 602.78 �787.29 �785.63 �4.1431 1.4569 2.2998 1690.79140 597.16 �775.79 �774.11 �4.0593 1.4515 2.3090 1654.48145 591.51 �764.23 �762.54 �3.9781 1.4469 2.3190 1618.03150 585.81 �752.63 �750.92 �3.8993 1.4430 2.3298 1581.41155 580.06 �740.97 �739.24 �3.8227 1.4399 2.3414 1544.64
160 574.26 �729.25 �727.51 �3.7482 1.4375 2.3540 1507.69165 568.40 �717.46 �715.70 �3.6755 1.4357 2.3677 1470.56170 562.46 �705.60 �703.83 �3.6046 1.4347 2.3825 1433.23175 556.45 �693.67 �691.87 �3.5353 1.4344 2.3987 1395.68180 550.36 �681.65 �679.84 �3.4675 1.4349 2.4163 1357.89
185 544.17 �669.55 �667.71 �3.4011 1.4361 2.4356 1319.85190 537.87 �657.34 �655.48 �3.3358 1.4382 2.4567 1281.54195 531.46 �645.02 �643.14 �3.2717 1.4410 2.4798 1242.92200 524.92 �632.58 �630.68 �3.2086 1.4447 2.5053 1203.96210 511.39 �607.29 �605.34 �3.0850 1.4546 2.5641 1124.92
220 497.12 �581.36 �579.35 �2.9641 1.4681 2.6365 1044.02230 481.89 �554.62 �552.55 �2.8450 1.4854 2.7275 960.67240 465.39 �526.86 �524.71 �2.7265 1.5070 2.8460 873.85241.10b 463.48 �523.73 �521.57 �2.7135 1.5097 2.8614 864.04241.10c 18.036 �183.56 �128.12 �1.0816 1.3945 1.9938 251.85250 16.948 �169.78 �110.77 �1.0109 1.3866 1.9154 260.39260 15.930 �154.60 �91.822 �0.93658 1.4001 1.8798 268.91
270 15.066 �139.47 �73.099 �0.865 91 1.4220 1.8676 276.67280 14.317 �124.27 �54.425 �0.798 00 1.4489 1.8691 283.85290 13.656 �108.91 �35.686 �0.732 24 1.4793 1.8799 290.57300 13.067 �93.335 �16.803 �0.668 23 1.5126 1.8977 296.92310 12.535 �77.489 2.2842 �0.605 64 1.5480 1.9206 302.96
320 12.053 �61.343 21.622 �0.544 25 1.5852 1.9475 308.73330 11.612 �44.870 41.244 �0.483 87 1.6237 1.9774 314.29340 11.207 �28.050 61.179 �0.424 37 1.6633 2.0097 319.64350 10.833 �10.866 81.445 �0.365 62 1.7036 2.0439 324.83360 10.486 6.6930 102.06 �0.307 55 1.7446 2.0794 329.86
370 10.163 24.637 123.04 �0.250 07 1.7860 2.1161 334.76380 9.8607 42.973 144.39 �0.193 15 1.8277 2.1536 339.54390 9.5779 61.705 166.11 �0.136 71 1.8695 2.1918 344.20400 9.3123 80.839 188.22 �0.080 73 1.9115 2.2305 348.76425 8.7131 130.44 245.21 0.057 420 2.0161 2.3283 359.78
450 8.1912 182.56 304.64 0.193 28 2.1196 2.4265 370.32475 7.7316 237.19 366.53 0.327 10 2.2213 2.5240 380.45500 7.3232 294.28 430.83 0.459 01 2.3208 2.6201 390.24525 6.9577 353.79 497.52 0.589 13 2.4177 2.7143 399.72550 6.6282 415.66 566.53 0.717 54 2.5121 2.8063 408.93
575 6.3296 479.82 637.81 0.844 27 2.6038 2.8960 417.89600 6.0575 546.23 711.31 0.969 38 2.6928 2.9834 426.64625 5.8085 614.80 786.96 1.0929 2.7791 3.0683 435.17650 5.5796 685.48 864.71 1.2149 2.8629 3.1509 443.52675 5.3685 758.22 944.49 1.3353 2.9442 3.2311 451.70
J. Phys. Chem. Ref. Data, Vol. 35, No. 1, 2006

246246 D. BUCKER and W. WAGNER
TABLE 30. Thermodynamic properties of ethane in the single-phase region—Continued
T�K�
�(kg m�3)
u(kJ kg�1)
h(kJ kg�1)
s(kJ kg�1 K�1)
cv
(kJ kg�1 K�1)cp
(kJ kg�1 K�1)w
(m s�1)
1.5 MPa
90.609a 651.80 �888.69 �886.38 �5.0553 1.6048 2.3233 2012.9295 647.00 �878.56 �876.24 �4.9460 1.5712 2.2980 1980.63100 641.54 �867.14 �864.80 �4.8286 1.5425 2.2814 1944.32105 636.08 �855.77 �853.41 �4.7175 1.5209 2.2735 1908.38
110 630.62 �844.43 �842.05 �4.6118 1.5041 2.2713 1872.62115 625.15 �833.09 �830.70 �4.5108 1.4909 2.2730 1836.92120 619.66 �821.74 �819.32 �4.4140 1.4802 2.2773 1801.18125 614.15 �810.36 �807.92 �4.3209 1.4714 2.2833 1765.36130 608.62 �798.95 �796.49 �4.2312 1.4639 2.2906 1729.43
135 603.05 �787.50 �785.01 �4.1446 1.4576 2.2988 1693.37140 597.45 �776.01 �773.50 �4.0609 1.4522 2.3079 1657.17145 591.81 �764.47 �761.93 �3.9797 1.4476 2.3177 1620.84150 586.13 �752.88 �750.32 �3.9009 1.4437 2.3284 1584.37155 580.40 �741.23 �738.65 �3.8244 1.4406 2.3399 1547.74
160 574.62 �729.53 �726.92 �3.7499 1.4381 2.3523 1510.94165 568.78 �717.76 �715.12 �3.6773 1.4364 2.3657 1473.97170 562.86 �705.92 �703.26 �3.6065 1.4354 2.3804 1436.81175 556.88 �694.01 �691.32 �3.5373 1.4351 2.3963 1399.45180 550.81 �682.02 �679.29 �3.4695 1.4356 2.4136 1361.87
185 544.65 �669.93 �667.18 �3.4032 1.4368 2.4325 1324.06190 538.39 �657.75 �654.96 �3.3380 1.4389 2.4532 1285.98195 532.02 �645.46 �642.64 �3.2740 1.4417 2.4759 1247.62200 525.52 �633.06 �630.20 �3.2110 1.4454 2.5008 1208.96210 512.08 �607.85 �604.92 �3.0876 1.4552 2.5583 1130.57
220 497.93 �582.01 �578.99 �2.9671 1.4686 2.6286 1050.48230 482.88 �555.39 �552.29 �2.8484 1.4857 2.7164 968.17240 466.61 �527.80 �524.58 �2.7305 1.5069 2.8296 882.75250 448.67 �498.90 �495.56 �2.6120 1.5331 2.9837 792.63255.09b 438.63 �483.52 �480.10 �2.5508 1.5490 3.0876 744.01255.09c 27.396 �175.76 �121.01 �1.1431 1.4816 2.2796 246.47260 26.286 �167.15 �110.09 �1.1007 1.4678 2.1833 252.28
270 24.418 �150.27 �88.837 �1.0205 1.4691 2.0801 262.68280 22.907 �133.79 �68.310 �0.945 85 1.4853 2.0310 271.80290 21.639 �117.45 �48.130 �0.875 03 1.5085 2.0085 280.02300 20.548 �101.08 �28.085 �0.807 07 1.5362 2.0027 287.59310 19.593 �84.595 �8.0381 �0.741 34 1.5675 2.0082 294.64
320 18.745 �67.913 12.107 �0.677 38 1.6015 2.0220 301.26330 17.985 �50.983 32.421 �0.614 88 1.6376 2.0417 307.54340 17.296 �33.770 52.956 �0.553 57 1.6752 2.0659 313.53350 16.668 �16.243 73.751 �0.493 30 1.7141 2.0935 319.27360 16.092 1.6197 94.835 �0.433 90 1.7538 2.1237 324.80
370 15.561 19.834 116.23 �0.375 28 1.7942 2.1560 330.13380 15.068 38.412 137.96 �0.317 34 1.8351 2.1897 335.30390 14.611 57.365 160.03 �0.260 01 1.8762 2.2247 340.31400 14.183 76.698 182.46 �0.203 24 1.9175 2.2606 345.20425 13.228 126.73 240.12 �0.063 43 2.0210 2.3529 356.90
450 12.405 179.20 300.12 0.073 715 2.1237 2.4470 367.99475 11.687 234.12 362.47 0.208 55 2.2247 2.5414 378.57500 11.053 291.47 427.18 0.341 29 2.3237 2.6351 388.74525 10.488 351.19 494.21 0.472 10 2.4203 2.7273 398.54550 9.9812 413.25 563.53 0.601 07 2.5144 2.8177 408.02
575 9.5236 477.58 635.08 0.728 28 2.6058 2.9061 417.21600 9.1080 544.13 708.82 0.853 79 2.6946 2.9924 426.15625 8.7286 612.84 784.68 0.977 66 2.7808 3.0764 434.87650 8.3806 683.64 862.62 1.0999 2.8644 3.1581 443.37675 8.0602 756.47 942.57 1.2206 2.9455 3.2377 451.67
J. Phys. Chem. Ref. Data, Vol. 35, No. 1, 2006
247247EQUATION OF STATE FOR THE THERMODYNAMIC PROPERTIES OF ETHANE
TABLE 30. Thermodynamic properties of ethane in the single-phase region—Continued
T�K�
�(kg m�3)
u(kJ kg�1)
h(kJ kg�1)
s(kJ kg�1 K�1)
cv
(kJ kg�1 K�1)cp
(kJ kg�1 K�1)w
(m s�1)
2 MPa
90.690a 651.89 �888.62 �885.55 �5.0545 1.6048 2.3225 2014.2895 647.18 �878.68 �875.59 �4.9473 1.5719 2.2977 1982.55100 641.73 �867.27 �864.15 �4.8299 1.5431 2.2810 1946.26105 636.29 �855.91 �852.77 �4.7188 1.5215 2.2730 1910.38
110 630.84 �844.58 �841.41 �4.6132 1.5048 2.2707 1874.70115 625.38 �833.25 �830.06 �4.5122 1.4915 2.2724 1839.08120 619.90 �821.91 �818.69 �4.4154 1.4808 2.2765 1803.43125 614.40 �810.54 �807.29 �4.3224 1.4720 2.2825 1767.71130 608.88 �799.14 �795.86 �4.2327 1.4646 2.2896 1731.88
135 603.33 �787.71 �784.39 �4.1461 1.4582 2.2978 1695.93140 597.74 �776.23 �772.88 �4.0624 1.4528 2.3067 1659.86145 592.12 �764.70 �761.32 �3.9813 1.4482 2.3165 1623.65150 586.45 �753.12 �749.71 �3.9026 1.4444 2.3270 1587.30155 580.74 �741.49 �738.05 �3.8261 1.4412 2.3383 1550.81
160 574.98 �729.81 �726.33 �3.7517 1.4388 2.3506 1514.17165 569.15 �718.06 �714.54 �3.6792 1.4371 2.3638 1477.36170 563.26 �706.24 �702.69 �3.6084 1.4361 2.3782 1440.38175 557.30 �694.35 �690.76 �3.5392 1.4358 2.3939 1403.21180 551.26 �682.38 �678.75 �3.4715 1.4363 2.4109 1365.83
185 545.13 �670.32 �666.65 �3.4052 1.4375 2.4295 1328.23190 538.90 �658.16 �654.45 �3.3402 1.4395 2.4499 1290.39195 532.57 �645.90 �642.14 �3.2763 1.4424 2.4721 1252.28200 526.11 �633.53 �629.72 �3.2134 1.4460 2.4964 1213.90210 512.76 �608.39 �604.49 �3.0903 1.4558 2.5526 1136.15
220 498.74 �582.64 �578.63 �2.9700 1.4691 2.6210 1056.85230 483.84 �556.15 �552.01 �2.8517 1.4860 2.7058 975.52240 467.80 �528.71 �524.44 �2.7343 1.5069 2.8141 891.42250 450.19 �500.05 �495.61 �2.6167 1.5326 2.9593 803.18260 430.26 �469.69 �465.04 �2.4968 1.5645 3.1702 708.23266.01b 416.59 �450.26 �445.46 �2.4224 1.5884 3.3567 645.98266.01c 37.530 �171.73 �118.44 �1.1930 1.5619 2.6328 239.97270 36.030 �163.75 �108.24 �1.1549 1.5427 2.4845 245.72
280 33.056 �145.02 �84.520 �1.0686 1.5330 2.2873 257.97290 30.770 �127.17 �62.171 �0.990 21 1.5442 2.1928 268.34300 28.911 �109.69 �40.516 �0.916 79 1.5643 2.1437 277.51310 27.348 �92.345 �19.212 �0.846 94 1.5901 2.1204 285.81
320 26.000 �74.975 1.9469 �0.779 76 1.6199 2.1137 293.45330 24.819 �57.482 23.100 �0.714 67 1.6529 2.1185 300.57340 23.770 �39.796 44.344 �0.651 25 1.6882 2.1314 307.28350 22.828 �21.866 65.747 �0.589 21 1.7252 2.1502 313.63360 21.974 �3.6543 87.363 �0.528 32 1.7635 2.1735 319.68
370 21.195 14.866 109.23 �0.468 41 1.8027 2.2000 325.49380 20.480 33.715 131.37 �0.409 36 1.8427 2.2292 331.07390 19.820 52.909 153.82 �0.351 06 1.8830 2.2602 336.46400 19.208 72.460 176.58 �0.293 42 1.9237 2.2928 341.67425 17.854 122.95 234.97 �0.151 87 2.0260 2.3788 354.07
450 16.701 175.80 295.55 �0.013 37 2.1278 2.4684 365.72475 15.702 231.03 358.40 0.122 52 2.2282 2.5594 376.77500 14.827 288.63 423.52 0.256 12 2.3267 2.6504 387.31525 14.052 348.58 490.91 0.387 62 2.4229 2.7406 397.42550 13.360 410.83 560.54 0.517 16 2.5166 2.8293 407.17
575 12.736 475.33 632.36 0.644 86 2.6078 2.9163 416.59600 12.172 542.03 706.34 0.770 78 2.6964 3.0014 425.73625 11.658 610.87 782.42 0.895 00 2.7824 3.0845 434.61650 11.188 681.79 860.55 1.0176 2.8658 3.1654 443.25675 10.756 754.73 940.67 1.1385 2.9468 3.2442 451.69
J. Phys. Chem. Ref. Data, Vol. 35, No. 1, 2006
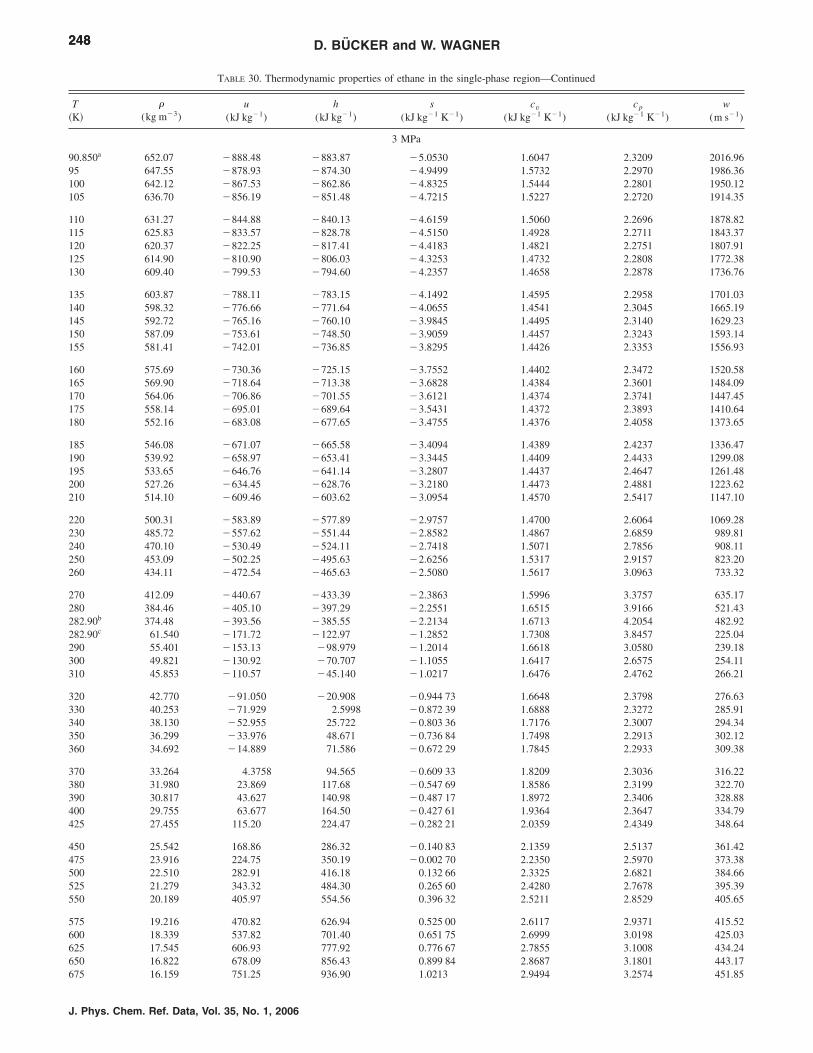
248248 D. BUCKER and W. WAGNER
TABLE 30. Thermodynamic properties of ethane in the single-phase region—Continued
T�K�
�(kg m�3)
u(kJ kg�1)
h(kJ kg�1)
s(kJ kg�1 K�1)
cv
(kJ kg�1 K�1)cp
(kJ kg�1 K�1)w
(m s�1)
3 MPa
90.850a 652.07 �888.48 �883.87 �5.0530 1.6047 2.3209 2016.9695 647.55 �878.93 �874.30 �4.9499 1.5732 2.2970 1986.36100 642.12 �867.53 �862.86 �4.8325 1.5444 2.2801 1950.12105 636.70 �856.19 �851.48 �4.7215 1.5227 2.2720 1914.35
110 631.27 �844.88 �840.13 �4.6159 1.5060 2.2696 1878.82115 625.83 �833.57 �828.78 �4.5150 1.4928 2.2711 1843.37120 620.37 �822.25 �817.41 �4.4183 1.4821 2.2751 1807.91125 614.90 �810.90 �806.03 �4.3253 1.4732 2.2808 1772.38130 609.40 �799.53 �794.60 �4.2357 1.4658 2.2878 1736.76
135 603.87 �788.11 �783.15 �4.1492 1.4595 2.2958 1701.03140 598.32 �776.66 �771.64 �4.0655 1.4541 2.3045 1665.19145 592.72 �765.16 �760.10 �3.9845 1.4495 2.3140 1629.23150 587.09 �753.61 �748.50 �3.9059 1.4457 2.3243 1593.14155 581.41 �742.01 �736.85 �3.8295 1.4426 2.3353 1556.93
160 575.69 �730.36 �725.15 �3.7552 1.4402 2.3472 1520.58165 569.90 �718.64 �713.38 �3.6828 1.4384 2.3601 1484.09170 564.06 �706.86 �701.55 �3.6121 1.4374 2.3741 1447.45175 558.14 �695.01 �689.64 �3.5431 1.4372 2.3893 1410.64180 552.16 �683.08 �677.65 �3.4755 1.4376 2.4058 1373.65
185 546.08 �671.07 �665.58 �3.4094 1.4389 2.4237 1336.47190 539.92 �658.97 �653.41 �3.3445 1.4409 2.4433 1299.08195 533.65 �646.76 �641.14 �3.2807 1.4437 2.4647 1261.48200 527.26 �634.45 �628.76 �3.2180 1.4473 2.4881 1223.62210 514.10 �609.46 �603.62 �3.0954 1.4570 2.5417 1147.10
220 500.31 �583.89 �577.89 �2.9757 1.4700 2.6064 1069.28230 485.72 �557.62 �551.44 �2.8582 1.4867 2.6859 989.81240 470.10 �530.49 �524.11 �2.7418 1.5071 2.7856 908.11250 453.09 �502.25 �495.63 �2.6256 1.5317 2.9157 823.20260 434.11 �472.54 �465.63 �2.5080 1.5617 3.0963 733.32
270 412.09 �440.67 �433.39 �2.3863 1.5996 3.3757 635.17280 384.46 �405.10 �397.29 �2.2551 1.6515 3.9166 521.43282.90b 374.48 �393.56 �385.55 �2.2134 1.6713 4.2054 482.92282.90c 61.540 �171.72 �122.97 �1.2852 1.7308 3.8457 225.04290 55.401 �153.13 �98.979 �1.2014 1.6618 3.0580 239.18300 49.821 �130.92 �70.707 �1.1055 1.6417 2.6575 254.11310 45.853 �110.57 �45.140 �1.0217 1.6476 2.4762 266.21
320 42.770 �91.050 �20.908 �0.944 73 1.6648 2.3798 276.63330 40.253 �71.929 2.5998 �0.872 39 1.6888 2.3272 285.91340 38.130 �52.955 25.722 �0.803 36 1.7176 2.3007 294.34350 36.299 �33.976 48.671 �0.736 84 1.7498 2.2913 302.12360 34.692 �14.889 71.586 �0.672 29 1.7845 2.2933 309.38
370 33.264 4.3758 94.565 �0.609 33 1.8209 2.3036 316.22380 31.980 23.869 117.68 �0.547 69 1.8586 2.3199 322.70390 30.817 43.627 140.98 �0.487 17 1.8972 2.3406 328.88400 29.755 63.677 164.50 �0.427 61 1.9364 2.3647 334.79425 27.455 115.20 224.47 �0.282 21 2.0359 2.4349 348.64
450 25.542 168.86 286.32 �0.140 83 2.1359 2.5137 361.42475 23.916 224.75 350.19 �0.002 70 2.2350 2.5970 373.38500 22.510 282.91 416.18 0.132 66 2.3325 2.6821 384.66525 21.279 343.32 484.30 0.265 60 2.4280 2.7678 395.39550 20.189 405.97 554.56 0.396 32 2.5211 2.8529 405.65
575 19.216 470.82 626.94 0.525 00 2.6117 2.9371 415.52600 18.339 537.82 701.40 0.651 75 2.6999 3.0198 425.03625 17.545 606.93 777.92 0.776 67 2.7855 3.1008 434.24650 16.822 678.09 856.43 0.899 84 2.8687 3.1801 443.17675 16.159 751.25 936.90 1.0213 2.9494 3.2574 451.85
J. Phys. Chem. Ref. Data, Vol. 35, No. 1, 2006

249249EQUATION OF STATE FOR THE THERMODYNAMIC PROPERTIES OF ETHANE
TABLE 30. Thermodynamic properties of ethane in the single-phase region—Continued
T�K�
�(kg m�3)
u(kJ kg�1)
h(kJ kg�1)
s(kJ kg�1 K�1)
cv
(kJ kg�1 K�1)cp
(kJ kg�1 K�1)w
(m s�1)
4 MPa
91.010a 652.25 �888.33 �882.20 �5.0515 1.6047 2.3192 2019.5695 647.92 �879.17 �873.00 �4.9525 1.5745 2.2964 1990.12100 642.51 �867.79 �861.56 �4.8352 1.5457 2.2793 1953.94105 637.10 �856.47 �850.19 �4.7242 1.5240 2.2710 1918.29
110 631.69 �845.18 �838.84 �4.6186 1.5072 2.2684 1882.91115 626.27 �833.89 �827.50 �4.5178 1.4940 2.2698 1847.64120 620.84 �822.59 �816.14 �4.4211 1.4833 2.2736 1812.36125 615.39 �811.26 �804.76 �4.3282 1.4745 2.2792 1777.03130 609.91 �799.91 �793.35 �4.2386 1.4670 2.2861 1741.61
135 604.41 �788.52 �781.90 �4.1522 1.4607 2.2938 1706.09140 598.88 �777.09 �770.41 �4.0687 1.4554 2.3024 1670.48145 593.32 �765.62 �758.87 �3.9877 1.4508 2.3116 1634.76150 587.72 �754.10 �747.29 �3.9092 1.4470 2.3216 1598.93155 582.08 �742.53 �735.66 �3.8329 1.4439 2.3324 1562.99
160 576.39 �730.91 �723.97 �3.7586 1.4415 2.3440 1526.93165 570.64 �719.22 �712.21 �3.6863 1.4398 2.3565 1490.74170 564.84 �707.48 �700.40 �3.6158 1.4388 2.3701 1454.43175 558.97 �695.67 �688.51 �3.5469 1.4385 2.3848 1417.97180 553.04 �683.78 �676.55 �3.4795 1.4390 2.4008 1381.36
185 547.02 �671.81 �664.50 �3.4134 1.4402 2.4181 1344.58190 540.91 �659.76 �652.37 �3.3487 1.4422 2.4370 1307.63195 534.71 �647.61 �640.13 �3.2851 1.4450 2.4576 1270.50200 528.40 �635.36 �627.79 �3.2226 1.4485 2.4801 1233.15210 515.41 �610.50 �602.74 �3.1004 1.4581 2.5314 1157.78
220 501.84 �585.10 �577.12 �2.9813 1.4711 2.5929 1081.35230 487.53 �559.04 �550.83 �2.8645 1.4874 2.6676 1003.58240 472.29 �532.18 �523.71 �2.7490 1.5074 2.7599 924.04250 455.82 �504.33 �495.55 �2.6341 1.5313 2.8776 842.02260 437.65 �475.17 �466.03 �2.5183 1.5598 3.0352 756.29
270 417.01 �444.21 �434.62 �2.3998 1.5946 3.2636 664.70280 392.25 �410.46 �400.27 �2.2749 1.6394 3.6463 563.04290 358.86 �371.27 �360.13 �2.1341 1.7096 4.5495 439.39295.96b 326.41 �340.54 �328.28 �2.0255 1.8084 6.7404 332.33295.96c 95.855 �183.77 �142.04 �1.3963 1.9584 7.8578 207.83300 84.773 �165.36 �118.18 �1.3161 1.8159 4.8051 221.78310 71.710 �135.28 �79.497 �1.1892 1.7365 3.3168 242.82
320 64.272 �111.10 �48.862 �1.0919 1.7251 2.8734 257.91330 59.027 �89.054 �21.288 �1.0070 1.7338 2.6638 270.27340 54.982 �68.027 4.7242 �0.929 34 1.7527 2.5496 280.96350 51.699 �47.505 29.866 �0.856 46 1.7781 2.4849 290.48360 48.944 �27.206 54.520 �0.787 00 1.8078 2.4497 299.14
370 46.576 �6.9584 78.923 �0.720 14 1.8405 2.4334 307.14380 44.505 13.353 103.23 �0.655 32 1.8755 2.4299 314.60390 42.669 33.805 127.55 �0.592 14 1.9119 2.4355 321.62400 41.022 54.455 151.96 �0.530 34 1.9494 2.4477 328.27425 37.541 107.18 213.73 �0.380 58 2.0459 2.4971 343.59
450 34.722 161.75 276.95 �0.236 05 2.1440 2.5626 357.50475 32.371 218.36 341.93 �0.095 54 2.2417 2.6367 370.34500 30.368 277.10 408.82 0.041 692 2.3382 2.7152 382.34525 28.633 338.01 477.71 0.176 11 2.4329 2.7958 393.66550 27.111 401.08 548.62 0.308 05 2.5254 2.8771 404.42
575 25.761 466.28 621.56 0.437 73 2.6155 2.9581 414.71600 24.553 533.60 696.51 0.565 32 2.7033 3.0383 424.58625 23.464 602.98 773.46 0.690 96 2.7886 3.1172 434.09650 22.475 674.39 852.36 0.814 73 2.8714 3.1947 443.28675 21.574 747.77 933.18 0.936 73 2.9519 3.2706 452.20
J. Phys. Chem. Ref. Data, Vol. 35, No. 1, 2006

250250 D. BUCKER and W. WAGNER
TABLE 30. Thermodynamic properties of ethane in the single-phase region—Continued
T�K�
�(kg m�3)
u(kJ kg�1)
h(kJ kg�1)
s(kJ kg�1 K�1)
cv
(kJ kg�1 K�1)cp
(kJ kg�1 K�1)w
(m s�1)
5 MPa
91.170a 652.43 �888.19 �880.53 �5.0499 1.6047 2.3176 2022.1095 648.29 �879.41 �871.70 �4.9551 1.5759 2.2957 1993.84100 642.89 �868.05 �860.27 �4.8378 1.5470 2.2784 1957.73105 637.51 �856.74 �848.90 �4.7268 1.5252 2.2700 1922.21
110 632.12 �845.47 �837.56 �4.6213 1.5084 2.2673 1886.99115 626.72 �834.20 �826.22 �4.5205 1.4952 2.2685 1851.88120 621.31 �822.92 �814.87 �4.4239 1.4845 2.2722 1816.79125 615.88 �811.61 �803.50 �4.3310 1.4757 2.2777 1781.64130 610.43 �800.28 �792.09 �4.2416 1.4683 2.2844 1746.43
135 604.95 �788.92 �780.65 �4.1552 1.4620 2.2919 1711.12140 599.45 �777.51 �769.17 �4.0717 1.4566 2.3003 1675.73145 593.92 �766.07 �757.65 �3.9909 1.4521 2.3093 1640.25150 588.35 �754.58 �746.08 �3.9124 1.4483 2.3191 1604.67155 582.74 �743.04 �734.46 �3.8362 1.4452 2.3295 1568.99
160 577.08 �731.44 �722.78 �3.7621 1.4428 2.3408 1533.21165 571.38 �719.80 �711.05 �3.6898 1.4411 2.3530 1497.32170 565.62 �708.09 �699.25 �3.6194 1.4401 2.3662 1461.33175 559.79 �696.31 �687.38 �3.5506 1.4399 2.3805 1425.21180 553.90 �684.47 �675.44 �3.4833 1.4403 2.3959 1388.96
185 547.94 �672.55 �663.42 �3.4175 1.4415 2.4127 1352.58190 541.89 �660.54 �651.31 �3.3529 1.4435 2.4310 1316.04195 535.76 �648.44 �639.11 �3.2895 1.4463 2.4509 1279.35200 529.52 �636.24 �626.80 �3.2272 1.4498 2.4725 1242.50210 516.69 �611.51 �601.84 �3.1054 1.4593 2.5216 1168.22
220 503.33 �586.27 �576.34 �2.9868 1.4721 2.5802 1093.08230 489.28 �560.41 �550.19 �2.8706 1.4883 2.6506 1016.88240 474.39 �533.81 �523.27 �2.7560 1.5079 2.7365 939.29250 458.40 �506.30 �495.39 �2.6422 1.5311 2.8440 859.81260 440.93 �477.63 �466.29 �2.5281 1.5586 2.9836 777.57
270 421.40 �447.41 �435.55 �2.4121 1.5911 3.1760 691.15280 398.70 �414.98 �402.44 �2.2917 1.6312 3.4689 598.06290 370.37 �378.88 �365.38 �2.1617 1.6858 4.0096 492.98300 327.98 �334.24 �318.99 �2.0046 1.7873 5.7005 359.63310 123.88 �181.86 �141.49 �1.4246 1.9621 8.6868 211.10
320 95.552 �138.95 �86.625 �1.2501 1.8157 4.0927 237.07330 83.351 �110.44 �50.451 �1.1387 1.7915 3.2810 254.00340 75.479 �85.789 �19.545 �1.0464 1.7946 2.9401 267.54350 69.690 �62.874 8.8728 �0.964 06 1.8103 2.7607 279.10360 65.131 �40.848 35.920 �0.887 86 1.8335 2.6579 289.32
370 61.387 �19.280 62.171 �0.815 93 1.8617 2.5978 298.55380 58.219 2.0809 87.963 �0.747 14 1.8932 2.5641 307.02390 55.484 23.393 113.51 �0.680 78 1.9272 2.5478 314.89400 53.082 44.764 138.96 �0.616 35 1.9627 2.5435 322.27425 48.137 98.878 202.75 �0.461 67 2.0559 2.5658 339.05
450 44.246 154.47 267.47 �0.313 71 2.1519 2.6151 354.04475 41.065 211.86 333.62 �0.170 66 2.2483 2.6785 367.72500 38.394 271.23 401.46 �0.031 49 2.3438 2.7495 380.40525 36.107 332.65 471.13 0.104 46 2.4377 2.8246 392.28550 34.118 396.15 542.71 0.237 64 2.5296 2.9017 403.50
575 32.365 461.73 616.22 0.368 34 2.6192 2.9794 414.16600 30.807 529.37 691.67 0.496 78 2.7066 3.0569 424.37625 29.408 599.04 769.06 0.623 13 2.7915 3.1337 434.16650 28.144 670.69 848.35 0.747 52 2.8741 3.2094 443.60675 26.995 744.30 929.52 0.870 04 2.9544 3.2838 452.73
J. Phys. Chem. Ref. Data, Vol. 35, No. 1, 2006

251251EQUATION OF STATE FOR THE THERMODYNAMIC PROPERTIES OF ETHANE
TABLE 30. Thermodynamic properties of ethane in the single-phase region—Continued
T�K�
�(kg m�3)
u(kJ kg�1)
h(kJ kg�1)
s(kJ kg�1 K�1)
cv
(kJ kg�1 K�1)cp
(kJ kg�1 K�1)w
(m s�1)
6 MPa
91.330a 652.61 �888.05 �878.86 �5.0484 1.6048 2.3160 2024.5895 648.65 �879.65 �870.40 �4.9576 1.5772 2.2951 1997.51100 643.28 �868.30 �858.97 �4.8404 1.5483 2.2776 1961.49105 637.91 �857.02 �847.61 �4.7295 1.5265 2.2690 1926.10
110 632.54 �845.76 �836.27 �4.6240 1.5097 2.2662 1891.03115 627.16 �834.51 �824.94 �4.5233 1.4964 2.2673 1856.10120 621.77 �823.25 �813.60 �4.4267 1.4857 2.2709 1821.19125 616.36 �811.97 �802.23 �4.3339 1.4769 2.2762 1786.23130 610.93 �800.66 �790.83 �4.2445 1.4695 2.2827 1751.21
135 605.49 �789.31 �779.40 �4.1582 1.4632 2.2901 1716.12140 600.01 �777.93 �767.93 �4.0748 1.4579 2.2982 1680.94145 594.50 �766.51 �756.42 �3.9940 1.4534 2.3071 1645.69150 588.96 �755.05 �744.86 �3.9156 1.4496 2.3166 1610.35155 583.39 �743.54 �733.25 �3.8395 1.4465 2.3268 1574.93
160 577.77 �731.98 �721.59 �3.7655 1.4441 2.3378 1539.43165 572.10 �720.36 �709.87 �3.6933 1.4424 2.3496 1503.83170 566.38 �708.69 �698.09 �3.6230 1.4415 2.3624 1468.14175 560.60 �696.95 �686.25 �3.5543 1.4412 2.3763 1432.35180 554.76 �685.14 �674.33 �3.4872 1.4417 2.3913 1396.46
185 548.85 �673.26 �662.33 �3.4214 1.4429 2.4076 1360.45190 542.86 �661.30 �650.25 �3.3570 1.4448 2.4252 1324.32195 536.78 �649.26 �638.08 �3.2938 1.4476 2.4444 1288.06200 530.61 �637.11 �625.80 �3.2316 1.4511 2.4652 1251.66210 517.95 �612.51 �600.92 �3.1102 1.4605 2.5124 1178.42
220 504.77 �587.41 �575.53 �2.9921 1.4732 2.5683 1104.50230 490.98 �561.74 �549.52 �2.8765 1.4891 2.6349 1029.75240 476.40 �535.38 �522.78 �2.7627 1.5084 2.7153 953.95250 460.85 �508.18 �495.16 �2.6500 1.5312 2.8141 876.72260 444.00 �479.93 �466.42 �2.5373 1.5578 2.9392 797.46
270 425.39 �450.34 �436.24 �2.4234 1.5888 3.1050 715.23280 404.25 �418.93 �404.09 �2.3065 1.6256 3.3408 628.54290 379.06 �384.79 �368.96 �2.1833 1.6719 3.7188 534.75300 346.19 �345.80 �328.47 �2.0461 1.7376 4.4938 428.64310 290.95 �293.44 �272.82 �1.8638 1.8677 7.5519 296.37
320 158.25 �189.14 �151.23 �1.4781 1.9726 9.4521 218.30330 118.29 �139.36 �88.642 �1.2852 1.8664 4.6261 239.00340 101.61 �107.46 �48.414 �1.1650 1.8434 3.5955 255.32350 91.230 �80.636 �14.868 �1.0678 1.8461 3.1645 268.84360 83.769 �56.090 15.535 �0.982 10 1.8613 2.9378 280.52
370 77.989 �32.734 44.200 �0.903 56 1.8840 2.8063 290.91380 73.298 �10.024 71.834 �0.829 86 1.9117 2.7272 300.33390 69.366 12.351 98.849 �0.759 68 1.9428 2.6799 309.00400 65.995 34.586 125.50 �0.692 20 1.9762 2.6534 317.05425 59.256 90.306 191.56 �0.532 01 2.0658 2.6412 335.16
450 54.110 147.02 257.90 �0.380 33 2.1597 2.6711 351.13475 49.988 205.26 325.29 �0.234 61 2.2547 2.7223 365.58500 46.578 265.30 394.11 �0.093 42 2.3492 2.7850 378.88525 43.690 327.26 464.59 0.044 115 2.4423 2.8541 391.26550 41.199 391.21 536.85 0.178 55 2.5336 2.9267 402.89
575 39.021 457.17 610.94 0.310 28 2.6228 3.0009 413.92600 37.094 525.14 686.89 0.439 58 2.7098 3.0757 424.42625 35.372 595.10 764.72 0.566 65 2.7944 3.1502 434.47650 33.823 667.00 844.40 0.691 64 2.8768 3.2241 444.13675 32.418 740.83 925.92 0.814 69 2.9568 3.2970 453.45
J. Phys. Chem. Ref. Data, Vol. 35, No. 1, 2006

252252 D. BUCKER and W. WAGNER
TABLE 30. Thermodynamic properties of ethane in the single-phase region—Continued
T�K�
�(kg m�3)
u(kJ kg�1)
h(kJ kg�1)
s(kJ kg�1 K�1)
cv
(kJ kg�1 K�1)cp
(kJ kg�1 K�1)w
(m s�1)
7 MPa
91.490a 652.79 �887.91 �877.19 �5.0469 1.6049 2.3145 2027.0195 649.02 �879.89 �869.10 �4.9602 1.5786 2.2944 2001.14100 643.66 �868.55 �857.68 �4.8430 1.5496 2.2768 1965.22105 638.31 �857.29 �846.32 �4.7321 1.5277 2.2681 1929.96
110 632.96 �846.05 �834.99 �4.6267 1.5109 2.2651 1895.06115 627.60 �834.82 �823.66 �4.5260 1.4976 2.2661 1860.29120 622.23 �823.57 �812.32 �4.4295 1.4869 2.2695 1825.56125 616.84 �812.31 �800.96 �4.3367 1.4781 2.2747 1790.79130 611.44 �801.02 �789.58 �4.2474 1.4707 2.2810 1755.97
135 606.01 �789.70 �778.15 �4.1612 1.4644 2.2883 1721.08140 600.57 �778.35 �766.69 �4.0778 1.4591 2.2962 1686.12145 595.09 �766.95 �755.19 �3.9971 1.4546 2.3048 1651.09150 589.58 �755.52 �743.64 �3.9188 1.4508 2.3141 1615.99155 584.03 �744.03 �732.05 �3.8428 1.4478 2.3241 1580.82
160 578.45 �732.50 �720.40 �3.7688 1.4454 2.3348 1545.58165 572.82 �720.92 �708.70 �3.6968 1.4437 2.3463 1510.27170 567.14 �709.28 �696.94 �3.6266 1.4428 2.3588 1474.88175 561.40 �697.58 �685.11 �3.5580 1.4425 2.3722 1439.41180 555.61 �685.81 �673.21 �3.4910 1.4430 2.3868 1403.85
185 549.74 �673.97 �661.24 �3.4254 1.4442 2.4026 1368.20190 543.81 �662.06 �649.18 �3.3611 1.4461 2.4197 1332.46195 537.79 �650.06 �637.04 �3.2980 1.4489 2.4382 1296.61200 531.69 �637.96 �624.80 �3.2360 1.4524 2.4583 1260.66210 519.17 �613.48 �600.00 �3.1150 1.4617 2.5036 1188.41
220 506.19 �588.53 �574.70 �2.9973 1.4743 2.5571 1115.63230 492.62 �563.03 �548.82 �2.8823 1.4900 2.6203 1042.24240 478.35 �536.89 �522.25 �2.7693 1.5091 2.6957 968.06250 463.18 �509.97 �494.85 �2.6574 1.5314 2.7872 892.85260 446.88 �482.10 �466.44 �2.5460 1.5573 2.9005 816.19
270 429.06 �453.05 �436.74 �2.4339 1.5871 3.0460 737.45280 409.16 �422.46 �405.35 �2.3198 1.6218 3.2424 655.74290 386.18 �389.72 �371.59 �2.2013 1.6632 3.5296 569.69300 358.13 �353.67 �334.13 �2.0744 1.7155 4.0122 477.31310 320.13 �311.45 �289.58 �1.9284 1.7890 5.0560 375.61
320 256.48 �253.66 �226.36 �1.7280 1.9081 8.1224 270.19330 174.00 �180.88 �140.65 �1.4641 1.9369 7.2387 236.17340 136.48 �134.59 �83.303 �1.2927 1.8939 4.6820 247.87350 117.56 �101.37 �41.822 �1.1724 1.8828 3.7469 261.48360 105.43 �73.176 �6.7841 �1.0737 1.8896 3.3080 273.85
370 96.677 �47.427 24.980 �0.986 64 1.9066 3.0665 284.96380 89.894 �23.005 54.865 �0.906 93 1.9303 2.9223 295.05390 84.399 0.66618 83.606 �0.832 27 1.9583 2.8330 304.31400 79.805 23.923 111.64 �0.761 30 1.9895 2.7778 312.89425 70.897 81.476 180.21 �0.594 99 2.0755 2.7229 332.08
450 64.302 139.43 248.29 �0.439 34 2.1673 2.7302 348.88475 59.127 198.58 316.97 �0.290 82 2.2609 2.7676 363.99500 54.906 259.31 386.80 �0.147 55 2.3544 2.8213 377.81525 51.370 321.84 458.11 �0.008 41 2.4468 2.8840 390.63550 48.346 386.26 531.05 0.127 31 2.5376 2.9519 402.64
575 45.719 452.61 605.72 0.260 08 2.6263 3.0225 413.97600 43.406 520.91 682.18 0.390 23 2.7129 3.0944 424.74625 41.350 591.16 760.45 0.518 01 2.7972 3.1667 435.02650 39.506 663.32 840.51 0.643 62 2.8793 3.2387 444.88675 37.839 737.38 922.37 0.767 19 2.9591 3.3100 454.38
J. Phys. Chem. Ref. Data, Vol. 35, No. 1, 2006

253253EQUATION OF STATE FOR THE THERMODYNAMIC PROPERTIES OF ETHANE
TABLE 30. Thermodynamic properties of ethane in the single-phase region—Continued
T�K�
�(kg m�3)
u(kJ kg�1)
h(kJ kg�1)
s(kJ kg�1 K�1)
cv
(kJ kg�1 K�1)cp
(kJ kg�1 K�1)w
(m s�1)
8 MPa
91.649a 652.97 �887.77 �875.52 �5.0454 1.6050 2.3129 2029.3995 649.38 �880.12 �867.80 �4.9627 1.5800 2.2938 2004.74100 644.04 �868.81 �856.38 �4.8456 1.5509 2.2761 1968.92105 638.71 �857.55 �845.03 �4.7347 1.5290 2.2671 1933.80
110 633.37 �846.33 �833.70 �4.6294 1.5121 2.2641 1899.06115 628.03 �835.12 �822.38 �4.5287 1.4988 2.2649 1864.47120 622.68 �823.90 �811.05 �4.4323 1.4881 2.2682 1829.91125 617.32 �812.66 �799.70 �4.3396 1.4793 2.2732 1795.33130 611.94 �801.39 �788.32 �4.2503 1.4719 2.2794 1760.70
135 606.54 �790.09 �776.90 �4.1641 1.4657 2.2865 1726.01140 601.12 �778.76 �765.45 �4.0809 1.4603 2.2943 1691.26145 595.67 �767.39 �753.96 �4.0002 1.4559 2.3027 1656.45150 590.19 �755.98 �742.42 �3.9220 1.4521 2.3117 1621.58155 584.67 �744.52 �730.84 �3.8460 1.4491 2.3215 1586.66
160 579.12 �733.02 �719.21 �3.7722 1.4467 2.3319 1551.68165 573.52 �721.47 �707.52 �3.7002 1.4450 2.3431 1516.64170 567.88 �709.86 �695.77 �3.6301 1.4441 2.3552 1481.54175 562.19 �698.20 �683.97 �3.5616 1.4438 2.3683 1446.38180 556.44 �686.47 �672.09 �3.4947 1.4443 2.3825 1411.15
185 550.63 �674.67 �660.14 �3.4293 1.4455 2.3978 1375.85190 544.74 �662.79 �648.11 �3.3651 1.4474 2.4143 1340.48195 538.78 �650.84 �635.99 �3.3021 1.4502 2.4322 1305.03200 532.74 �638.80 �623.78 �3.2403 1.4536 2.4516 1269.50210 520.37 �614.43 �599.06 �3.1197 1.4629 2.4953 1198.18
220 507.56 �589.62 �573.85 �3.0025 1.4754 2.5465 1126.49230 494.22 �564.28 �548.10 �2.8880 1.4910 2.6066 1054.36240 480.22 �538.34 �521.68 �2.7756 1.5098 2.6777 981.69250 465.42 �511.68 �494.50 �2.6646 1.5318 2.7628 908.30260 449.60 �484.16 �466.37 �2.5543 1.5571 2.8664 833.92
270 432.47 �455.58 �437.08 �2.4438 1.5861 2.9959 758.16280 413.59 �425.67 �406.32 �2.3319 1.6191 3.1638 680.45290 392.26 �394.00 �373.60 �2.2171 1.6573 3.3936 600.14300 367.29 �359.86 �338.08 �2.0967 1.7029 3.7365 516.47310 336.32 �321.88 �298.09 �1.9657 1.7594 4.3197 428.84
320 294.34 �277.08 �249.90 �1.8128 1.8327 5.4434 340.14330 235.51 �221.48 �187.51 �1.6209 1.9113 6.8792 271.63340 181.00 �166.43 �122.23 �1.4259 1.9239 5.8070 254.26350 149.44 �125.06 �71.530 �1.2789 1.9133 4.4632 260.63360 130.49 �92.107 �30.801 �1.1641 1.9152 3.7583 271.10
370 117.62 �63.337 4.6813 �1.0668 1.9279 3.3738 281.76380 108.08 �36.830 37.190 �0.980 14 1.9480 3.1465 291.86390 100.60 �11.626 67.894 �0.900 37 1.9733 3.0051 301.30400 94.508 12.812 97.460 �0.825 51 2.0024 2.9148 310.13425 83.039 72.416 168.76 �0.652 59 2.0848 2.8100 329.98
450 74.799 131.71 238.66 �0.492 76 2.1745 2.7918 347.39475 68.460 191.82 308.68 �0.341 34 2.2668 2.8143 363.00500 63.362 253.29 379.55 �0.195 93 2.3594 2.8582 377.25525 59.133 316.40 451.69 �0.055 16 2.4511 2.9142 390.43550 55.546 381.30 525.32 0.081 840 2.5414 2.9772 402.75
575 52.449 448.05 600.58 0.215 64 2.6297 3.0441 414.35600 49.736 516.69 677.54 0.346 65 2.7159 3.1131 425.34625 47.334 587.23 756.24 0.475 15 2.8000 3.1831 435.82650 45.187 659.65 836.70 0.601 36 2.8818 3.2532 445.85675 43.252 733.94 918.90 0.725 44 2.9614 3.3229 455.50
J. Phys. Chem. Ref. Data, Vol. 35, No. 1, 2006

254254 D. BUCKER and W. WAGNER
TABLE 30. Thermodynamic properties of ethane in the single-phase region—Continued
T�K�
�(kg m�3)
u(kJ kg�1)
h(kJ kg�1)
s(kJ kg�1 K�1)
cv
(kJ kg�1 K�1)cp
(kJ kg�1 K�1)w
(m s�1)
10 MPa
91.967a 653.33 �887.49 �872.18 �5.0424 1.6053 2.3099 2034.0495 650.10 �880.59 �865.21 �4.9678 1.5828 2.2926 2011.83100 644.79 �869.30 �853.79 �4.8507 1.5535 2.2745 1976.23105 639.49 �858.08 �842.45 �4.7400 1.5314 2.2653 1941.41
110 634.20 �846.90 �831.13 �4.6347 1.5145 2.2620 1906.99115 628.90 �835.72 �819.82 �4.5341 1.5011 2.2625 1872.74120 623.59 �824.54 �808.50 �4.4378 1.4904 2.2656 1838.53125 618.27 �813.33 �797.16 �4.3452 1.4816 2.2704 1804.32130 612.93 �802.11 �785.79 �4.2560 1.4743 2.2763 1770.06
135 607.58 �790.86 �774.40 �4.1700 1.4681 2.2830 1735.76140 602.21 �779.57 �762.96 �4.0868 1.4628 2.2905 1701.42145 596.81 �768.25 �751.49 �4.0063 1.4583 2.2985 1667.04150 591.39 �756.89 �739.98 �3.9282 1.4546 2.3072 1632.62155 585.93 �745.48 �728.42 �3.8524 1.4516 2.3164 1598.17
160 580.45 �734.04 �716.81 �3.7788 1.4493 2.3263 1563.69165 574.92 �722.55 �705.15 �3.7070 1.4476 2.3370 1529.18170 569.35 �711.00 �693.44 �3.6371 1.4467 2.3485 1494.63175 563.74 �699.41 �681.67 �3.5688 1.4464 2.3609 1460.06180 558.08 �687.75 �669.83 �3.5021 1.4469 2.3742 1425.46
185 552.35 �676.03 �657.92 �3.4369 1.4481 2.3886 1390.82190 546.57 �664.24 �645.94 �3.3730 1.4500 2.4042 1356.15195 540.72 �652.37 �633.88 �3.3103 1.4527 2.4210 1321.45200 534.80 �640.43 �621.73 �3.2488 1.4562 2.4391 1286.72210 522.70 �616.27 �597.14 �3.1288 1.4654 2.4798 1217.15
220 510.22 �591.71 �572.11 �3.0124 1.4777 2.5270 1147.46230 497.28 �566.68 �546.57 �2.8989 1.4930 2.5818 1077.63240 483.78 �541.12 �520.45 �2.7877 1.5114 2.6456 1007.64250 469.62 �514.92 �493.63 �2.6782 1.5329 2.7204 937.43260 454.63 �487.99 �465.99 �2.5699 1.5574 2.8088 866.92
270 438.64 �460.19 �437.39 �2.4619 1.5850 2.9148 795.96280 421.36 �431.35 �407.62 �2.3537 1.6159 3.0445 724.40290 402.42 �401.24 �376.39 �2.2441 1.6505 3.2073 652.16300 381.28 �369.54 �343.31 �2.1320 1.6894 3.4187 579.32310 357.14 �335.77 �307.77 �2.0154 1.7333 3.7061 506.34
320 328.78 �299.22 �268.80 �1.8918 1.7828 4.1091 434.79330 294.87 �259.08 �225.16 �1.7575 1.8369 4.6315 369.55340 255.88 �215.48 �176.40 �1.6120 1.8884 5.0696 319.90350 217.58 �171.62 �125.66 �1.4649 1.9224 4.9685 293.79360 186.98 �131.93 �78.445 �1.3319 1.9407 4.4525 286.76
370 164.73 �97.190 �36.483 �1.2169 1.9566 3.9614 289.09380 148.42 �66.125 1.2515 �1.1162 1.9755 3.6077 295.16390 136.02 �37.471 36.048 �1.0258 1.9983 3.3674 302.58400 126.22 �10.368 68.857 �0.942 73 2.0247 3.2049 310.38425 108.60 53.811 145.89 �0.755 85 2.1017 2.9923 329.47
450 96.552 116.03 219.60 �0.587 33 2.1879 2.9187 347.04475 87.595 178.19 292.35 �0.429 97 2.2778 2.9091 363.06500 80.566 241.20 365.32 �0.280 26 2.3687 2.9326 377.77525 74.841 305.52 439.14 �0.136 22 2.4592 2.9746 391.40550 70.052 371.39 514.14 0.003 3445 2.5485 3.0274 404.12
575 65.963 438.96 590.56 0.139 21 2.6360 3.0868 416.08600 62.414 508.29 668.51 0.271 91 2.7216 3.1500 427.41625 59.294 579.43 748.08 0.401 81 2.8051 3.2153 438.18650 56.523 652.37 829.29 0.529 21 2.8865 3.2816 448.47675 54.038 727.10 912.16 0.654 31 2.9657 3.3482 458.34
J. Phys. Chem. Ref. Data, Vol. 35, No. 1, 2006

255255EQUATION OF STATE FOR THE THERMODYNAMIC PROPERTIES OF ETHANE
TABLE 30. Thermodynamic properties of ethane in the single-phase region—Continued
T�K�
�(kg m�3)
u(kJ kg�1)
h(kJ kg�1)
s(kJ kg�1 K�1)
cv
(kJ kg�1 K�1)cp
(kJ kg�1 K�1)w
(m s�1)
15 MPa
92.758a 654.22 �886.78 �863.86 �5.0350 1.6063 2.3024 2045.1395 651.87 �881.72 �858.71 �4.9802 1.5898 2.2898 2029.01100 646.64 �870.51 �847.31 �4.8633 1.5599 2.2709 1994.10105 641.43 �859.37 �835.98 �4.7528 1.5375 2.2611 1960.06
110 636.23 �848.27 �824.69 �4.6477 1.5204 2.2571 1926.45115 631.02 �837.18 �813.41 �4.5474 1.5069 2.2571 1893.04120 625.80 �826.08 �802.12 �4.4513 1.4962 2.2596 1859.68125 620.59 �814.98 �790.81 �4.3589 1.4874 2.2637 1826.33130 615.36 �803.85 �779.48 �4.2700 1.4801 2.2690 1792.96
135 610.12 �792.70 �768.12 �4.1843 1.4739 2.2751 1759.58140 604.86 �781.52 �756.72 �4.1014 1.4687 2.2817 1726.19145 599.59 �770.31 �745.30 �4.0213 1.4643 2.2889 1692.81150 594.30 �759.07 �733.83 �3.9435 1.4607 2.2967 1659.43155 588.99 �747.80 �722.33 �3.8681 1.4578 2.3049 1626.07
160 583.65 �736.48 �710.78 �3.7948 1.4555 2.3137 1592.73165 578.29 �725.13 �699.19 �3.7234 1.4539 2.3232 1559.42170 572.89 �713.73 �687.55 �3.6539 1.4530 2.3333 1526.15175 567.46 �702.29 �675.86 �3.5861 1.4528 2.3442 1492.91180 561.99 �690.80 �664.11 �3.5199 1.4533 2.3558 1459.71
185 556.48 �679.25 �652.30 �3.4552 1.4545 2.3684 1426.55190 550.93 �667.65 �640.42 �3.3919 1.4564 2.3819 1393.44195 545.32 �655.98 �628.48 �3.3298 1.4591 2.3965 1360.38200 539.66 �644.25 �616.46 �3.2690 1.4625 2.4121 1327.38210 528.16 �620.57 �592.17 �3.1505 1.4715 2.4467 1261.58
220 516.38 �596.55 �567.51 �3.0357 1.4835 2.4862 1196.09230 504.28 �572.17 �542.42 �2.9243 1.4984 2.5312 1130.99240 491.80 �547.36 �516.86 �2.8155 1.5162 2.5822 1066.33250 478.89 �522.08 �490.76 �2.7089 1.5368 2.6398 1002.21260 465.47 �496.27 �464.04 �2.6041 1.5600 2.7049 938.70
270 451.46 �469.86 �436.63 �2.5007 1.5859 2.7783 875.89280 436.76 �442.79 �408.44 �2.3982 1.6144 2.8613 813.93290 421.27 �414.98 �379.37 �2.2962 1.6453 2.9549 753.01300 404.85 �386.36 �349.30 �2.1943 1.6786 3.0606 693.47310 387.38 �356.84 �318.12 �2.0920 1.7142 3.1793 635.77
320 368.73 �326.35 �285.67 �1.9890 1.7520 3.3115 580.60330 348.81 �294.85 �251.85 �1.8849 1.7915 3.4551 528.86340 327.64 �262.34 �216.56 �1.7796 1.8322 3.6013 481.90350 305.46 �228.98 �179.88 �1.6733 1.8729 3.7306 441.39360 282.89 �195.12 �142.09 �1.5669 1.9122 3.8164 408.76
370 260.82 �161.28 �103.77 �1.4619 1.9491 3.8361 384.58380 240.21 �128.05 �65.603 �1.3601 1.9834 3.7878 368.37390 221.70 �95.829 �28.169 �1.2628 2.0160 3.6939 358.78400 205.51 �64.769 8.2189 �1.1707 2.0477 3.5828 354.12425 174.15 8.4169 94.549 �0.961 27 2.1278 3.3381 355.22
450 152.25 77.442 175.96 �0.775 08 2.2118 3.1909 364.67475 136.24 144.65 254.75 �0.604 69 2.2989 3.1220 376.82500 123.99 211.50 332.48 �0.445 20 2.3875 3.1028 389.62525 114.23 278.83 410.14 �0.293 64 2.4759 3.1140 402.30550 106.24 347.14 488.34 �0.148 14 2.5635 3.1441 414.57
575 99.529 416.73 567.44 �0.007 48 2.6496 3.1861 426.37600 93.791 487.78 647.71 0.129 15 2.7340 3.2358 437.68625 88.809 560.37 729.27 0.262 33 2.8164 3.2904 448.52650 84.430 634.59 812.25 0.392 50 2.8969 3.3480 458.93675 80.539 710.44 896.69 0.519 96 2.9753 3.4074 468.94
J. Phys. Chem. Ref. Data, Vol. 35, No. 1, 2006

256256 D. BUCKER and W. WAGNER
TABLE 30. Thermodynamic properties of ethane in the single-phase region—Continued
T�K�
�(kg m�3)
u(kJ kg�1)
h(kJ kg�1)
s(kJ kg�1 K�1)
cv
(kJ kg�1 K�1)cp
(kJ kg�1 K�1)w
(m s�1)
20 MPa
93.543a 655.10 �886.07 �855.55 �5.0278 1.6075 2.2953 2055.7895 653.60 �882.81 �852.21 �4.9924 1.5967 2.2872 2045.56100 648.45 �871.67 �840.82 �4.8756 1.5663 2.2676 2011.43105 643.32 �860.60 �829.52 �4.7653 1.5435 2.2571 1978.21
110 638.20 �849.58 �818.24 �4.6604 1.5261 2.2527 1945.41115 633.08 �838.57 �806.98 �4.5603 1.5125 2.2521 1912.80120 627.96 �827.57 �795.72 �4.4644 1.5017 2.2541 1880.25125 622.83 �816.55 �784.44 �4.3723 1.4930 2.2577 1847.70130 617.70 �805.52 �773.14 �4.2837 1.4857 2.2624 1815.16
135 612.57 �794.46 �761.81 �4.1982 1.4796 2.2679 1782.62140 607.42 �783.38 �750.46 �4.1156 1.4745 2.2739 1750.10145 602.27 �772.28 �739.07 �4.0357 1.4702 2.2804 1717.61150 597.10 �761.15 �727.65 �3.9583 1.4666 2.2873 1685.17155 591.92 �749.99 �716.20 �3.8832 1.4638 2.2947 1652.79
160 586.72 �738.79 �704.71 �3.8102 1.4616 2.3026 1620.47165 581.50 �727.57 �693.17 �3.7392 1.4601 2.3110 1588.23170 576.26 �716.30 �681.59 �3.6701 1.4592 2.3201 1556.07175 570.99 �705.00 �669.97 �3.6027 1.4590 2.3297 1523.99180 565.69 �693.65 �658.30 �3.5369 1.4595 2.3401 1492.01
185 560.37 �682.26 �646.57 �3.4726 1.4607 2.3512 1460.12190 555.01 �670.82 �634.78 �3.4098 1.4627 2.3631 1428.34195 549.62 �659.33 �622.94 �3.3482 1.4653 2.3759 1396.68200 544.18 �647.78 �611.02 �3.2879 1.4687 2.3896 1365.13210 533.18 �624.49 �586.98 �3.1706 1.4776 2.4197 1302.43
220 521.98 �600.93 �562.62 �3.0573 1.4894 2.4539 1240.33230 510.55 �577.06 �537.89 �2.9474 1.5040 2.4922 1178.91240 498.86 �552.85 �512.76 �2.8404 1.5215 2.5350 1118.29250 486.87 �528.25 �487.17 �2.7360 1.5416 2.5823 1058.58260 474.55 �503.24 �461.09 �2.6337 1.5642 2.6345 999.89
270 461.87 �477.77 �434.47 �2.5332 1.5893 2.6915 942.38280 448.77 �451.81 �407.25 �2.4342 1.6166 2.7536 886.21290 435.22 �425.33 �379.38 �2.3365 1.6461 2.8207 831.57300 421.18 �398.30 �350.82 �2.2396 1.6776 2.8926 778.73310 406.62 �370.70 �321.51 �2.1436 1.7109 2.9687 728.00
320 391.54 �342.51 �291.43 �2.0481 1.7458 3.0482 679.76330 375.92 �313.75 �260.54 �1.9530 1.7821 3.1297 634.43340 359.82 �284.42 �228.84 �1.8584 1.8195 3.2108 592.46350 343.32 �254.59 �196.34 �1.7642 1.8576 3.2880 554.34360 326.57 �224.35 �163.11 �1.6706 1.8960 3.3561 520.55
370 309.79 �193.83 �129.27 �1.5778 1.9343 3.4095 491.53380 293.25 �163.18 �94.983 �1.4864 1.9720 3.4437 467.46390 277.25 �132.60 �60.464 �1.3967 2.0090 3.4567 448.25400 262.07 �102.23 �25.915 �1.3093 2.0454 3.4502 433.55425 228.69 �27.876 59.581 �1.1019 2.1344 3.3815 412.70
450 202.15 44.132 143.07 �0.911 03 2.2226 3.2999 407.05475 181.38 114.53 224.79 �0.734 27 2.3111 3.2432 409.60500 164.96 184.25 305.49 �0.568 70 2.3996 3.2172 416.34525 151.72 254.04 385.86 �0.411 84 2.4877 3.2166 425.10550 140.82 324.45 466.47 �0.261 84 2.5746 3.2348 434.79
575 131.67 395.82 547.71 �0.117 39 2.6600 3.2662 444.83600 123.87 468.40 629.86 0.022 444 2.7438 3.3067 454.90625 117.11 542.33 713.10 0.158 36 2.8256 3.3535 464.86650 111.19 617.70 797.57 0.290 87 2.9055 3.4045 474.62675 105.96 694.59 883.35 0.420 36 2.9833 3.4583 484.15
J. Phys. Chem. Ref. Data, Vol. 35, No. 1, 2006

257257EQUATION OF STATE FOR THE THERMODYNAMIC PROPERTIES OF ETHANE
TABLE 30. Thermodynamic properties of ethane in the single-phase region—Continued
T�K�
�(kg m�3)
u(kJ kg�1)
h(kJ kg�1)
s(kJ kg�1 K�1)
cv
(kJ kg�1 K�1)cp
(kJ kg�1 K�1)w
(m s�1)
25 MPa
94.322a 655.98 �885.36 �847.25 �5.0207 1.6086 2.2885 2066.2295 655.29 �883.85 �845.70 �5.0043 1.6036 2.2848 2061.59100 650.22 �872.78 �834.33 �4.8877 1.5725 2.2645 2028.31105 645.17 �861.79 �823.04 �4.7775 1.5493 2.2534 1995.91
110 640.13 �850.84 �811.79 �4.6728 1.5316 2.2485 1963.91115 635.09 �839.91 �800.55 �4.5729 1.5180 2.2475 1932.06120 630.05 �828.99 �789.31 �4.4772 1.5072 2.2490 1900.26125 625.02 �818.06 �778.06 �4.3854 1.4984 2.2522 1868.47130 619.98 �807.11 �766.78 �4.2970 1.4912 2.2564 1836.69
135 614.94 �796.14 �755.49 �4.2117 1.4852 2.2614 1804.92140 609.90 �785.16 �744.17 �4.1294 1.4801 2.2668 1773.19145 604.85 �774.15 �732.82 �4.0497 1.4759 2.2727 1741.53150 599.80 �763.12 �721.44 �3.9726 1.4724 2.2790 1709.94155 594.73 �752.07 �710.03 �3.8977 1.4696 2.2857 1678.43
160 589.66 �740.98 �698.58 �3.8251 1.4675 2.2928 1647.03165 584.57 �729.87 �687.10 �3.7544 1.4660 2.3004 1615.74170 579.46 �718.72 �675.58 �3.6856 1.4652 2.3085 1584.56175 574.34 �707.54 �664.02 �3.6186 1.4651 2.3171 1553.51180 569.20 �696.33 �652.41 �3.5531 1.4656 2.3264 1522.60
185 564.04 �685.07 �640.75 �3.4893 1.4669 2.3364 1491.82190 558.86 �673.78 �629.04 �3.4268 1.4688 2.3470 1461.20195 553.65 �662.43 �617.28 �3.3657 1.4715 2.3584 1430.72200 548.41 �651.04 �605.46 �3.3059 1.4748 2.3706 1400.42210 537.84 �628.10 �581.62 �3.1896 1.4837 2.3974 1340.33
220 527.12 �604.93 �557.50 �3.0773 1.4953 2.4275 1281.03230 516.25 �581.48 �533.06 �2.9687 1.5098 2.4611 1222.62240 505.19 �557.75 �508.26 �2.8632 1.5270 2.4982 1165.19250 493.93 �533.70 �483.08 �2.7604 1.5468 2.5389 1108.88260 482.45 �509.29 �457.48 �2.6600 1.5691 2.5830 1053.80
270 470.72 �484.52 �431.41 �2.5616 1.5937 2.6305 1000.11280 458.74 �459.35 �404.85 �2.4650 1.6204 2.6813 947.94290 446.48 �433.77 �377.78 �2.3700 1.6492 2.7349 897.46300 433.95 �407.76 �350.15 �2.2764 1.6798 2.7911 848.87310 421.12 �381.31 �321.95 �2.1839 1.7120 2.8494 802.39
320 408.01 �354.43 �293.16 �2.0925 1.7458 2.9088 758.23330 394.64 �327.12 �263.77 �2.0021 1.7808 2.9687 716.65340 381.05 �299.39 �233.78 �1.9126 1.8169 3.0278 677.88350 367.28 �271.29 �203.22 �1.8240 1.8538 3.0848 642.13360 353.40 �242.84 �172.10 �1.7363 1.8912 3.1381 609.57
370 339.51 �214.11 �140.48 �1.6497 1.9290 3.1859 580.37380 325.73 �185.16 �108.41 �1.5641 1.9669 3.2263 554.64390 312.17 �156.06 �75.978 �1.4799 2.0047 3.2581 532.41400 298.97 �126.90 �43.277 �1.3971 2.0423 3.2806 513.59425 268.26 �54.108 39.084 �1.1974 2.1353 3.3006 480.16
450 241.67 18.049 121.49 �1.0090 2.2268 3.2897 462.28475 219.34 89.555 203.53 �0.831 55 2.3174 3.2740 454.91500 200.79 160.77 285.27 �0.663 84 2.4071 3.2674 454.16525 185.34 232.12 367.01 �0.504 32 2.4956 3.2739 457.44550 172.35 304.01 449.07 �0.351 63 2.5826 3.2927 463.12
575 161.31 376.75 531.73 �0.204 65 2.6679 3.3219 470.19600 151.82 450.56 615.23 �0.062 52 2.7514 3.3590 478.06625 143.56 525.59 699.73 0.075 461 2.8329 3.4020 486.34650 136.32 601.97 785.37 0.209 80 2.9125 3.4493 494.81675 129.89 679.75 872.22 0.340 92 2.9900 3.4996 503.33
J. Phys. Chem. Ref. Data, Vol. 35, No. 1, 2006

258258 D. BUCKER and W. WAGNER
TABLE 30. Thermodynamic properties of ethane in the single-phase region—Continued
T�K�
�(kg m�3)
u(kJ kg�1)
h(kJ kg�1)
s(kJ kg�1 K�1)
cv
(kJ kg�1 K�1)cp
(kJ kg�1 K�1)w
(m s�1)
50 MPa
98.136a 660.30 �881.76 �806.04 �4.9872 1.6126 2.2588 2118.07100 658.54 �877.76 �801.84 �4.9448 1.6011 2.2516 2107.34105 653.82 �867.09 �790.62 �4.8353 1.5760 2.2385 2078.73
110 649.12 �856.47 �779.44 �4.7313 1.5574 2.2319 2050.19115 644.44 �845.88 �768.29 �4.6322 1.5434 2.2293 2021.58120 639.77 �835.30 �757.14 �4.5373 1.5325 2.2293 1992.88125 635.11 �824.72 �745.99 �4.4463 1.5240 2.2309 1964.13130 630.46 �814.14 �734.83 �4.3587 1.5171 2.2335 1935.39
135 625.83 �803.55 �723.66 �4.2744 1.5114 2.2367 1906.69140 621.21 �792.95 �712.47 �4.1930 1.5068 2.2403 1878.09145 616.60 �782.35 �701.26 �4.1143 1.5030 2.2442 1849.62150 612.00 �771.72 �690.02 �4.0381 1.4999 2.2483 1821.31155 607.41 �761.09 �678.77 �3.9643 1.4975 2.2527 1793.18
160 602.83 �750.44 �667.50 �3.8927 1.4957 2.2573 1765.26165 598.25 �739.78 �656.20 �3.8232 1.4945 2.2622 1737.54170 593.69 �729.09 �644.87 �3.7556 1.4939 2.2675 1710.05175 589.13 �718.39 �633.52 �3.6898 1.4940 2.2731 1682.79180 584.58 �707.67 �622.14 �3.6257 1.4947 2.2792 1655.77
185 580.03 �696.93 �610.73 �3.5631 1.4961 2.2857 1628.99190 575.48 �686.17 �599.28 �3.5021 1.4982 2.2927 1602.46195 570.94 �675.38 �587.80 �3.4424 1.5009 2.3002 1576.19200 566.40 �664.56 �576.28 �3.3841 1.5042 2.3082 1550.18210 557.33 �642.83 �553.11 �3.2711 1.5130 2.3260 1498.97
220 548.26 �620.95 �529.76 �3.1624 1.5245 2.3460 1448.90230 539.19 �598.92 �506.19 �3.0576 1.5387 2.3682 1400.03240 530.11 �576.70 �482.38 �2.9563 1.5554 2.3927 1352.42250 521.03 �554.29 �458.33 �2.8581 1.5745 2.4192 1306.16260 511.94 �531.66 �433.99 �2.7627 1.5960 2.4477 1261.30
270 502.83 �508.80 �409.37 �2.6698 1.6197 2.4779 1217.93280 493.73 �485.70 �384.43 �2.5791 1.6453 2.5098 1176.10290 484.62 �462.34 �359.17 �2.4904 1.6729 2.5429 1135.88300 475.51 �438.72 �333.57 �2.4036 1.7021 2.5772 1097.31310 466.40 �414.82 �307.62 �2.3186 1.7328 2.6123 1060.45
320 457.32 �390.65 �281.32 �2.2351 1.7649 2.6481 1025.32330 448.26 �366.20 �254.66 �2.1530 1.7982 2.6842 991.96340 439.23 �341.47 �227.63 �2.0724 1.8325 2.7205 960.39350 430.25 �316.46 �200.25 �1.9930 1.8676 2.7568 930.62360 421.33 �291.17 �172.50 �1.9148 1.9035 2.7928 902.63
370 412.48 �265.61 �144.39 �1.8378 1.9400 2.8284 876.43380 403.72 �239.78 �115.93 �1.7619 1.9770 2.8633 851.97390 395.07 �213.69 �87.128 �1.6871 2.0143 2.8975 829.24400 386.53 �187.34 �57.986 �1.6133 2.0518 2.9308 808.17425 365.80 �120.40 16.285 �1.4332 2.1462 3.0098 762.47
450 346.10 �52.020 92.448 �1.2591 2.2404 3.0822 725.90475 327.60 17.714 170.34 �1.0907 2.3336 3.1483 697.36500 310.39 88.732 249.82 �0.927 61 2.4254 3.2093 675.68525 294.52 161.01 330.78 �0.769 63 2.5154 3.2667 659.70550 279.95 234.53 413.13 �0.616 39 2.6035 3.3218 648.32
575 266.62 309.32 496.86 �0.467 53 2.6894 3.3757 640.60600 254.44 385.41 581.92 �0.322 73 2.7731 3.4291 635.78625 243.32 462.82 668.31 �0.181 67 2.8547 3.4824 633.23650 233.14 541.57 756.04 �0.044 05 2.9341 3.5355 632.46675 223.82 621.70 845.09 0.090 375 3.0113 3.5887 633.08
J. Phys. Chem. Ref. Data, Vol. 35, No. 1, 2006

259259EQUATION OF STATE FOR THE THERMODYNAMIC PROPERTIES OF ETHANE
TABLE 30. Thermodynamic properties of ethane in the single-phase region—Continued
T�K�
�(kg m�3)
u(kJ kg�1)
h(kJ kg�1)
s(kJ kg�1 K�1)
cv
(kJ kg�1 K�1)cp
(kJ kg�1 K�1)w
(m s�1)
75 MPa
101.82a 664.49 �878.11 �765.24 �4.9566 1.6152 2.2356 2169.89105 661.67 �871.50 �758.15 �4.8880 1.5996 2.2276 2153.58110 657.25 �861.15 �747.03 �4.7846 1.5805 2.2200 2127.64115 652.84 �850.83 �735.94 �4.6860 1.5664 2.2167 2101.41120 648.46 �840.52 �724.86 �4.5917 1.5558 2.2159 2074.97125 644.10 �830.22 �713.78 �4.5012 1.5476 2.2167 2048.41130 639.75 �819.93 �702.69 �4.4142 1.5411 2.2185 2021.84
135 635.43 �809.63 �691.60 �4.3305 1.5359 2.2208 1995.32140 631.13 �799.32 �680.49 �4.2497 1.5316 2.2235 1968.93145 626.84 �789.01 �669.36 �4.1716 1.5282 2.2263 1942.70150 622.58 �778.69 �658.22 �4.0961 1.5255 2.2294 1916.68155 618.34 �768.36 �647.07 �4.0229 1.5234 2.2325 1890.88
160 614.11 �758.02 �635.90 �3.9520 1.5218 2.2359 1865.33165 609.91 �747.68 �624.71 �3.8831 1.5209 2.2395 1840.04170 605.72 �737.32 �613.50 �3.8162 1.5206 2.2434 1815.01175 601.55 �726.95 �602.27 �3.7511 1.5208 2.2476 1790.26180 597.40 �716.57 �591.02 �3.6877 1.5217 2.2521 1765.78
185 593.26 �706.17 �579.75 �3.6260 1.5232 2.2571 1741.58190 589.14 �695.76 �568.45 �3.5657 1.5253 2.2624 1717.66195 585.03 �685.33 �557.13 �3.5069 1.5281 2.2682 1694.02200 580.94 �674.87 �545.77 �3.4494 1.5315 2.2745 1670.67210 572.80 �653.89 �522.96 �3.3381 1.5403 2.2886 1624.84
220 564.71 �632.80 �499.99 �3.2312 1.5517 2.3047 1580.19230 556.68 �611.58 �476.86 �3.1284 1.5656 2.3228 1536.74240 548.70 �590.21 �453.53 �3.0291 1.5821 2.3430 1494.54250 540.77 �568.68 �429.99 �2.9330 1.6010 2.3651 1453.62260 532.89 �546.96 �406.22 �2.8398 1.6221 2.3890 1414.01
270 525.06 �525.04 �382.20 �2.7492 1.6453 2.4147 1375.75280 517.28 �502.91 �357.92 �2.6609 1.6706 2.4419 1338.87290 509.56 �480.55 �333.36 �2.5747 1.6976 2.4704 1303.38300 501.89 �457.95 �308.51 �2.4904 1.7263 2.5001 1269.31310 494.27 �435.09 �283.36 �2.4080 1.7565 2.5309 1236.67
320 486.72 �411.98 �257.89 �2.3271 1.7880 2.5625 1205.46330 479.23 �388.60 �232.10 �2.2478 1.8206 2.5948 1175.68340 471.82 �364.95 �205.99 �2.1698 1.8543 2.6277 1147.32350 464.47 �341.02 �179.55 �2.0932 1.8888 2.6609 1120.37360 457.20 �316.81 �152.77 �2.0177 1.9241 2.6944 1094.80
370 450.01 �292.32 �125.66 �1.9434 1.9600 2.7280 1070.59380 442.91 �267.55 �98.213 �1.8703 1.9963 2.7616 1047.70390 435.90 �242.49 �70.430 �1.7981 2.0331 2.7951 1026.11400 428.99 �217.14 �42.312 �1.7269 2.0701 2.8285 1005.78425 412.15 �152.54 29.432 �1.5529 2.1634 2.9107 960.17
450 396.00 �86.192 103.20 �1.3843 2.2567 2.9906 921.45475 380.58 �18.132 178.94 �1.2205 2.3494 3.0677 888.91500 365.92 51.602 256.56 �1.0613 2.4407 3.1419 861.82525 352.06 122.97 336.01 �0.906 25 2.5303 3.2132 839.48550 338.97 195.95 417.20 �0.755 18 2.6181 3.2820 821.26
575 326.66 270.49 500.09 �0.607 81 2.7037 3.3485 806.56600 315.10 346.59 584.61 �0.463 93 2.7872 3.4129 794.86625 304.25 424.21 670.72 �0.323 33 2.8686 3.4757 785.69650 294.08 503.35 758.38 �0.185 82 2.9478 3.5369 778.64675 284.54 583.97 847.55 �0.051 21 3.0248 3.5968 773.38
J. Phys. Chem. Ref. Data, Vol. 35, No. 1, 2006

260260 D. BUCKER and W. WAGNER
TABLE 30. Thermodynamic properties of ethane in the single-phase region—Continued
T�K�
�(kg m�3)
u(kJ kg�1)
h(kJ kg�1)
s(kJ kg�1 K�1)
cv
(kJ kg�1 K�1)cp
(kJ kg�1 K�1)w
(m s�1)
100 MPa
105.39a 668.55 �874.40 �724.83 �4.9286 1.6191 2.2184 2220.05110 664.69 �865.07 �714.62 �4.8338 1.6017 2.2113 2197.93115 660.52 �854.97 �703.57 �4.7356 1.5878 2.2076 2173.49120 656.37 �844.89 �692.54 �4.6416 1.5775 2.2066 2148.75125 652.25 �834.82 �681.51 �4.5515 1.5697 2.2071 2123.85130 648.15 �824.75 �670.47 �4.4650 1.5637 2.2084 2098.93
135 644.07 �814.68 �659.42 �4.3816 1.5589 2.2103 2074.07140 640.02 �804.61 �648.36 �4.3012 1.5550 2.2125 2049.36145 636.00 �794.53 �637.30 �4.2235 1.5519 2.2148 2024.83150 632.00 �784.44 �626.22 �4.1484 1.5495 2.2172 2000.54155 628.03 �774.35 �615.12 �4.0756 1.5477 2.2198 1976.50
160 624.08 �764.25 �604.02 �4.0051 1.5464 2.2225 1952.73165 620.15 �754.15 �592.90 �3.9367 1.5456 2.2254 1929.24170 616.25 �744.04 �581.76 �3.8702 1.5454 2.2285 1906.04175 612.37 �733.91 �570.61 �3.8055 1.5458 2.2319 1883.13180 608.51 �723.78 �559.44 �3.7426 1.5467 2.2356 1860.50
185 604.67 �713.63 �548.26 �3.6813 1.5483 2.2397 1838.17190 600.86 �703.47 �537.05 �3.6215 1.5505 2.2442 1816.13195 597.07 �693.30 �525.81 �3.5631 1.5532 2.2491 1794.38200 593.30 �683.10 �514.55 �3.5061 1.5566 2.2545 1772.91210 585.81 �662.65 �491.95 �3.3959 1.5654 2.2667 1730.85
220 578.41 �642.10 �469.21 �3.2901 1.5766 2.2809 1689.94230 571.08 �621.43 �446.33 �3.1883 1.5904 2.2971 1650.19240 563.83 �600.62 �423.27 �3.0902 1.6066 2.3153 1611.61250 556.65 �579.66 �400.01 �2.9953 1.6252 2.3354 1574.23260 549.54 �558.52 �376.55 �2.9033 1.6461 2.3574 1538.04
270 542.50 �537.19 �352.86 �2.8139 1.6690 2.3811 1503.07280 535.54 �515.65 �328.92 �2.7268 1.6938 2.4064 1469.33290 528.64 �493.89 �304.73 �2.6419 1.7205 2.4332 1436.84300 521.82 �471.89 �280.25 �2.5590 1.7488 2.4613 1405.58310 515.07 �449.65 �255.50 �2.4778 1.7785 2.4904 1375.57
320 508.39 �427.14 �230.44 �2.3982 1.8096 2.5206 1346.80330 501.79 �404.37 �205.08 �2.3202 1.8418 2.5516 1319.26340 495.26 �381.32 �179.41 �2.2436 1.8750 2.5833 1292.93350 488.81 �357.99 �153.41 �2.1682 1.9091 2.6156 1267.80360 482.44 �334.38 �127.09 �2.0941 1.9439 2.6483 1243.84
370 476.14 �310.47 �100.45 �2.0211 1.9794 2.6813 1221.02380 469.93 �286.26 �73.468 �1.9491 2.0153 2.7145 1199.32390 463.81 �261.76 �46.156 �1.8782 2.0516 2.7479 1178.71400 457.76 �236.96 �18.510 �1.8082 2.0882 2.7813 1159.14425 443.04 �173.65 52.063 �1.6371 2.1804 2.8645 1114.60
450 428.87 �108.47 124.70 �1.4710 2.2729 2.9465 1075.84475 415.28 �41.429 199.37 �1.3095 2.3647 3.0269 1042.28500 402.26 27.435 276.03 �1.1523 2.4553 3.1051 1013.38525 389.83 98.091 354.61 �0.998 93 2.5443 3.1811 988.61550 377.98 170.50 435.07 �0.849 23 2.6315 3.2549 967.47
575 366.70 244.63 517.34 �0.702 96 2.7167 3.3263 949.52600 355.97 320.45 601.37 �0.559 92 2.7997 3.3957 934.37625 345.78 397.91 687.10 �0.419 93 2.8807 3.4631 921.64650 336.11 476.98 774.50 �0.282 82 2.9596 3.5285 911.04675 326.93 557.64 863.52 �0.148 45 3.0363 3.5923 902.26
200 MPa
118.64a 683.67 �859.03 �566.49 �4.8351 1.6550 2.1898 2394.54120 682.73 �856.46 �563.52 �4.8101 1.6530 2.1899 2388.92125 679.26 �847.00 �552.56 �4.7207 1.6470 2.1908 2368.17130 675.83 �837.54 �541.61 �4.6348 1.6425 2.1923 2347.41
J. Phys. Chem. Ref. Data, Vol. 35, No. 1, 2006

261261EQUATION OF STATE FOR THE THERMODYNAMIC PROPERTIES OF ETHANE
TABLE 30. Thermodynamic properties of ethane in the single-phase region—Continued
T�K�
�(kg m�3)
u(kJ kg�1)
h(kJ kg�1)
s(kJ kg�1 K�1)
cv
(kJ kg�1 K�1)cp
(kJ kg�1 K�1)w
(m s�1)
200 MPa
135 672.42 �828.07 �530.64 �4.5520 1.6391 2.1942 2326.78140 669.05 �818.60 �519.66 �4.4722 1.6363 2.1961 2306.34145 665.70 �809.11 �508.68 �4.3951 1.6342 2.1981 2286.15150 662.39 �799.62 �497.68 �4.3205 1.6325 2.2000 2266.24155 659.10 �790.12 �486.68 �4.2483 1.6312 2.2019 2246.63
160 655.85 �780.61 �475.67 �4.1784 1.6303 2.2038 2227.33165 652.62 �771.10 �464.64 �4.1106 1.6299 2.2058 2208.33170 649.42 �761.57 �453.61 �4.0447 1.6298 2.2080 2189.63175 646.25 �752.04 �442.56 �3.9806 1.6303 2.2104 2171.23180 643.11 �742.49 �431.50 �3.9183 1.6312 2.2131 2153.12
185 640.00 �732.93 �420.43 �3.8577 1.6327 2.2160 2135.29190 636.91 �723.36 �409.34 �3.7985 1.6347 2.2194 2117.73195 633.85 �713.77 �398.24 �3.7408 1.6373 2.2231 2100.44200 630.82 �704.16 �387.11 �3.6845 1.6404 2.2273 2083.40210 624.82 �684.88 �364.79 �3.5756 1.6484 2.2370 2050.07
220 618.93 �665.50 �342.36 �3.4713 1.6589 2.2486 2017.70230 613.13 �646.01 �319.81 �3.3710 1.6717 2.2623 1986.26240 607.42 �626.37 �297.11 �3.2744 1.6869 2.2781 1955.72250 601.80 �606.58 �274.24 �3.1811 1.7044 2.2958 1926.06260 596.26 �586.61 �251.19 �3.0906 1.7241 2.3155 1897.28
270 590.81 �566.44 �227.93 �3.0028 1.7459 2.3370 1869.37280 585.44 �546.06 �204.44 �2.9174 1.7695 2.3602 1842.33290 580.15 �525.45 �180.72 �2.8342 1.7950 2.3850 1816.16300 574.94 �504.60 �156.74 �2.7529 1.8220 2.4113 1790.84310 569.80 �483.49 �132.49 �2.6734 1.8505 2.4388 1766.37
320 564.73 �462.11 �107.96 �2.5955 1.8803 2.4676 1742.75330 559.74 �440.44 �83.132 �2.5191 1.9112 2.4973 1719.96340 554.82 �418.49 �58.006 �2.4441 1.9432 2.5279 1698.00350 549.96 �396.23 �32.571 �2.3704 1.9760 2.5593 1676.85360 545.18 �373.67 �6.8178 �2.2978 2.0096 2.5913 1656.49
370 540.46 �350.80 19.258 �2.2264 2.0438 2.6239 1636.91380 535.81 �327.61 45.661 �2.1560 2.0785 2.6568 1618.08390 531.22 �304.09 72.395 �2.0865 2.1136 2.6901 1599.98400 526.70 �280.26 99.464 �2.0180 2.1490 2.7236 1582.60425 515.67 �219.24 168.61 �1.8504 2.2384 2.8079 1542.13
450 505.02 �156.17 239.86 �1.6875 2.3281 2.8921 1505.62475 494.74 �91.049 313.20 �1.5289 2.4174 2.9755 1472.72500 484.82 �23.906 388.62 �1.3742 2.5057 3.0576 1443.10525 475.24 45.232 466.07 �1.2230 2.5925 3.1382 1416.43550 466.00 116.33 545.51 �1.0752 2.6777 3.2168 1392.44
575 457.08 189.34 626.90 �0.930 53 2.7610 3.2936 1370.86600 448.47 264.22 710.17 �0.788 77 2.8424 3.3683 1351.44625 440.17 340.92 795.30 �0.649 78 2.9218 3.4411 1333.98650 432.15 419.41 882.21 �0.513 44 2.9992 3.5118 1318.28675 424.41 499.63 970.87 �0.379 61 3.0746 3.5806 1304.17
400 MPa
141.42a 710.01 �825.38 �262.01 �4.6994 1.7552 2.2026 2663.73145 708.11 �819.00 �254.12 �4.6444 1.7543 2.2047 2652.58150 705.49 �810.07 �243.09 �4.5696 1.7531 2.2075 2637.26155 702.89 �801.12 �232.05 �4.4971 1.7521 2.2100 2622.24
160 700.32 �792.16 �220.99 �4.4269 1.7513 2.2124 2607.52165 697.77 �783.18 �209.92 �4.3588 1.7508 2.2147 2593.09170 695.24 �774.18 �198.84 �4.2927 1.7505 2.2171 2578.93175 692.74 �765.17 �187.75 �4.2284 1.7506 2.2196 2565.02180 690.26 �756.14 �176.65 �4.1658 1.7510 2.2222 2551.36
J. Phys. Chem. Ref. Data, Vol. 35, No. 1, 2006

262262 D. BUCKER and W. WAGNER
TABLE 30. Thermodynamic properties of ethane in the single-phase region—Continued
T�K�
�(kg m�3)
u(kJ kg�1)
h(kJ kg�1)
s(kJ kg�1 K�1)
cv
(kJ kg�1 K�1)cp
(kJ kg�1 K�1)w
(m s�1)
400 MPa
185 687.81 �747.09 �165.53 �4.1049 1.7519 2.2251 2537.92190 685.38 �738.01 �154.40 �4.0455 1.7533 2.2283 2524.70195 682.97 �728.92 �143.25 �3.9876 1.7552 2.2318 2511.68200 680.58 �719.81 �132.08 �3.9310 1.7576 2.2357 2498.85210 675.88 �701.50 �109.68 �3.8217 1.7641 2.2448 2473.73
220 671.26 �683.07 �87.174 �3.7171 1.7729 2.2558 2449.26230 666.72 �664.51 �64.553 �3.6165 1.7840 2.2687 2425.41240 662.25 �645.79 �41.793 �3.5196 1.7974 2.2837 2402.12250 657.87 �626.90 �18.873 �3.4261 1.8132 2.3006 2379.39260 653.56 �607.81 4.2260 �3.3355 1.8311 2.3195 2357.19
270 649.31 �588.51 27.523 �3.2476 1.8511 2.3402 2335.52280 645.14 �568.98 51.036 �3.1621 1.8730 2.3627 2314.37290 641.03 �549.21 74.783 �3.0787 1.8967 2.3868 2293.76300 636.99 �529.18 98.778 �2.9974 1.9220 2.4124 2273.66310 633.01 �508.87 123.04 �2.9178 1.9489 2.4394 2254.10
320 629.08 �488.28 147.57 �2.8400 1.9770 2.4675 2235.06330 625.22 �467.39 172.39 �2.7636 2.0064 2.4968 2216.55340 621.41 �446.19 197.51 �2.6886 2.0368 2.5270 2198.57350 617.66 �424.67 222.93 �2.6149 2.0681 2.5580 2181.11360 613.96 �402.84 248.67 �2.5424 2.1002 2.5897 2164.16
370 610.31 �380.68 274.73 �2.4710 2.1329 2.6219 2147.73380 606.71 �358.18 301.11 �2.4007 2.1661 2.6547 2131.79390 603.17 �335.35 327.82 �2.3313 2.1998 2.6878 2116.35400 599.67 �312.17 354.87 �2.2628 2.2339 2.7212 2101.39425 591.12 �252.73 423.95 �2.0953 2.3200 2.8055 2066.02
450 582.85 �191.14 495.14 �1.9325 2.4066 2.8901 2033.39475 574.83 �127.40 568.45 �1.7740 2.4930 2.9742 2003.29500 567.07 �61.537 643.84 �1.6194 2.5785 3.0572 1975.53525 559.54 6.4235 721.30 �1.4682 2.6627 3.1388 1949.92550 552.23 76.438 800.77 �1.3204 2.7455 3.2187 1926.26
575 545.14 148.46 882.22 �1.1755 2.8265 3.2969 1904.40600 538.25 222.45 965.60 �1.0336 2.9057 3.3732 1884.18625 531.55 298.35 1050.86 �0.894 40 2.9831 3.4475 1865.46650 525.04 376.12 1137.96 �0.757 76 3.0586 3.5199 1848.12675 518.71 455.70 1226.84 �0.623 59 3.1322 3.5904 1832.05
600 MPa
160.77a 732.73 �788.72 30.137 �4.6003 1.8345 2.2282 2885.11165 730.88 �781.36 39.568 �4.5423 1.8340 2.2309 2875.15170 728.71 �772.64 50.730 �4.4757 1.8336 2.2339 2863.60175 726.57 �763.89 61.907 �4.4109 1.8334 2.2370 2852.27180 724.44 �755.12 73.100 �4.3478 1.8336 2.2402 2841.14
185 722.33 �746.33 84.309 �4.2864 1.8341 2.2435 2830.20190 720.24 �737.52 95.535 �4.2265 1.8351 2.2470 2819.43195 718.17 �728.68 106.78 �4.1681 1.8365 2.2509 2808.81200 716.12 �719.81 118.04 �4.1111 1.8384 2.2551 2798.34210 712.06 �701.98 140.64 �4.0008 1.8439 2.2646 2777.79
220 708.07 �684.03 163.34 �3.8952 1.8516 2.2758 2757.70230 704.15 �665.92 186.17 �3.7938 1.8616 2.2890 2738.04240 700.30 �647.65 209.13 �3.6961 1.8739 2.3040 2718.75250 696.51 �629.19 232.25 �3.6017 1.8885 2.3210 2699.83260 692.77 �610.53 255.55 �3.5103 1.9053 2.3398 2681.25
270 689.10 �591.64 279.05 �3.4216 1.9242 2.3605 2663.02280 685.49 �572.52 302.77 �3.3353 1.9450 2.3829 2645.13290 681.93 �553.14 326.72 �3.2513 1.9676 2.4069 2627.59300 678.42 �533.49 350.91 �3.1693 1.9919 2.4323 2610.41310 674.97 �513.56 375.37 �3.0891 2.0177 2.4591 2593.59
J. Phys. Chem. Ref. Data, Vol. 35, No. 1, 2006
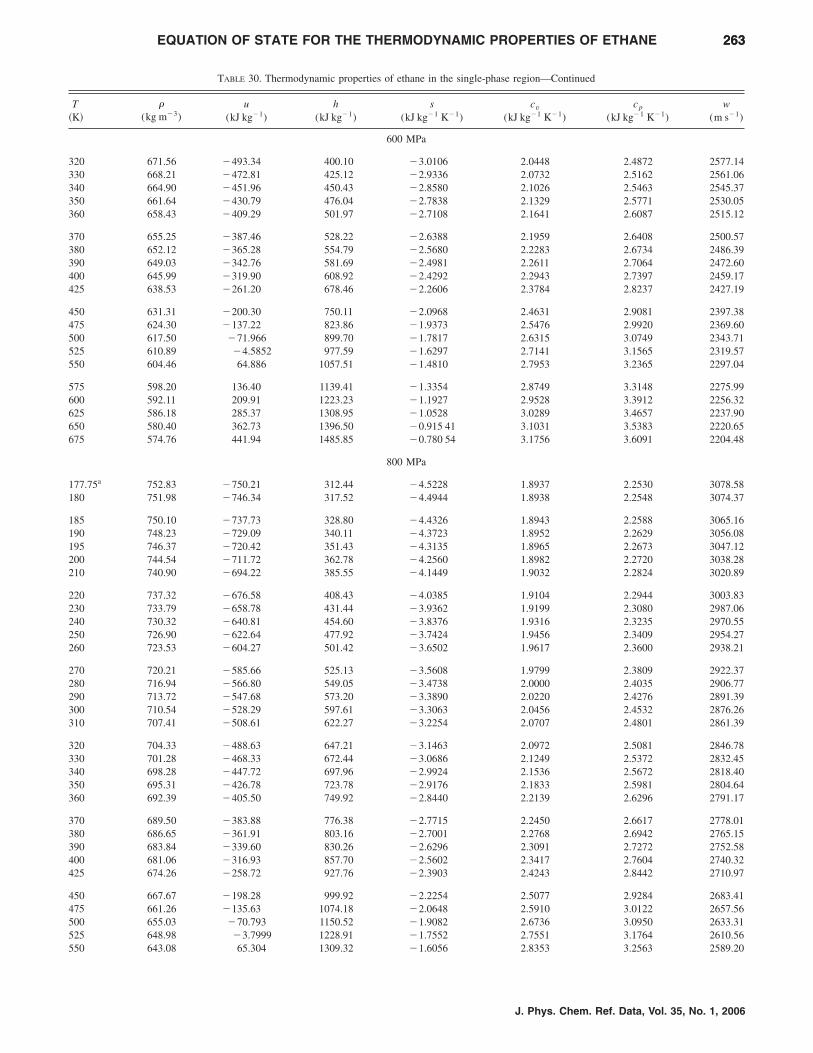
263263EQUATION OF STATE FOR THE THERMODYNAMIC PROPERTIES OF ETHANE
TABLE 30. Thermodynamic properties of ethane in the single-phase region—Continued
T�K�
�(kg m�3)
u(kJ kg�1)
h(kJ kg�1)
s(kJ kg�1 K�1)
cv
(kJ kg�1 K�1)cp
(kJ kg�1 K�1)w
(m s�1)
600 MPa
320 671.56 �493.34 400.10 �3.0106 2.0448 2.4872 2577.14330 668.21 �472.81 425.12 �2.9336 2.0732 2.5162 2561.06340 664.90 �451.96 450.43 �2.8580 2.1026 2.5463 2545.37350 661.64 �430.79 476.04 �2.7838 2.1329 2.5771 2530.05360 658.43 �409.29 501.97 �2.7108 2.1641 2.6087 2515.12
370 655.25 �387.46 528.22 �2.6388 2.1959 2.6408 2500.57380 652.12 �365.28 554.79 �2.5680 2.2283 2.6734 2486.39390 649.03 �342.76 581.69 �2.4981 2.2611 2.7064 2472.60400 645.99 �319.90 608.92 �2.4292 2.2943 2.7397 2459.17425 638.53 �261.20 678.46 �2.2606 2.3784 2.8237 2427.19
450 631.31 �200.30 750.11 �2.0968 2.4631 2.9081 2397.38475 624.30 �137.22 823.86 �1.9373 2.5476 2.9920 2369.60500 617.50 �71.966 899.70 �1.7817 2.6315 3.0749 2343.71525 610.89 �4.5852 977.59 �1.6297 2.7141 3.1565 2319.57550 604.46 64.886 1057.51 �1.4810 2.7953 3.2365 2297.04
575 598.20 136.40 1139.41 �1.3354 2.8749 3.3148 2275.99600 592.11 209.91 1223.23 �1.1927 2.9528 3.3912 2256.32625 586.18 285.37 1308.95 �1.0528 3.0289 3.4657 2237.90650 580.40 362.73 1396.50 �0.915 41 3.1031 3.5383 2220.65675 574.76 441.94 1485.85 �0.780 54 3.1756 3.6091 2204.48
800 MPa
177.75a 752.83 �750.21 312.44 �4.5228 1.8937 2.2530 3078.58180 751.98 �746.34 317.52 �4.4944 1.8938 2.2548 3074.37
185 750.10 �737.73 328.80 �4.4326 1.8943 2.2588 3065.16190 748.23 �729.09 340.11 �4.3723 1.8952 2.2629 3056.08195 746.37 �720.42 351.43 �4.3135 1.8965 2.2673 3047.12200 744.54 �711.72 362.78 �4.2560 1.8982 2.2720 3038.28210 740.90 �694.22 385.55 �4.1449 1.9032 2.2824 3020.89
220 737.32 �676.58 408.43 �4.0385 1.9104 2.2944 3003.83230 733.79 �658.78 431.44 �3.9362 1.9199 2.3080 2987.06240 730.32 �640.81 454.60 �3.8376 1.9316 2.3235 2970.55250 726.90 �622.64 477.92 �3.7424 1.9456 2.3409 2954.27260 723.53 �604.27 501.42 �3.6502 1.9617 2.3600 2938.21
270 720.21 �585.66 525.13 �3.5608 1.9799 2.3809 2922.37280 716.94 �566.80 549.05 �3.4738 2.0000 2.4035 2906.77290 713.72 �547.68 573.20 �3.3890 2.0220 2.4276 2891.39300 710.54 �528.29 597.61 �3.3063 2.0456 2.4532 2876.26310 707.41 �508.61 622.27 �3.2254 2.0707 2.4801 2861.39
320 704.33 �488.63 647.21 �3.1463 2.0972 2.5081 2846.78330 701.28 �468.33 672.44 �3.0686 2.1249 2.5372 2832.45340 698.28 �447.72 697.96 �2.9924 2.1536 2.5672 2818.40350 695.31 �426.78 723.78 �2.9176 2.1833 2.5981 2804.64360 692.39 �405.50 749.92 �2.8440 2.2139 2.6296 2791.17
370 689.50 �383.88 776.38 �2.7715 2.2450 2.6617 2778.01380 686.65 �361.91 803.16 �2.7001 2.2768 2.6942 2765.15390 683.84 �339.60 830.26 �2.6296 2.3091 2.7272 2752.58400 681.06 �316.93 857.70 �2.5602 2.3417 2.7604 2740.32425 674.26 �258.72 927.76 �2.3903 2.4243 2.8442 2710.97
450 667.67 �198.28 999.92 �2.2254 2.5077 2.9284 2683.41475 661.26 �135.63 1074.18 �2.0648 2.5910 3.0122 2657.56500 655.03 �70.793 1150.52 �1.9082 2.6736 3.0950 2633.31525 648.98 �3.7999 1228.91 �1.7552 2.7551 3.1764 2610.56550 643.08 65.304 1309.32 �1.6056 2.8353 3.2563 2589.20
J. Phys. Chem. Ref. Data, Vol. 35, No. 1, 2006

264264 D. BUCKER and W. WAGNER
TABLE 30. Thermodynamic properties of ethane in the single-phase region—Continued
T�K�
�(kg m�3)
u(kJ kg�1)
h(kJ kg�1)
s(kJ kg�1 K�1)
cv
(kJ kg�1 K�1)cp
(kJ kg�1 K�1)w
(m s�1)
800 MPa
575 637.33 136.47 1391.71 �1.4591 2.9138 3.3344 2569.13600 631.73 209.66 1476.03 �1.3156 2.9907 3.4107 2550.24625 626.26 284.81 1562.23 �1.1748 3.0659 3.4852 2532.46650 620.93 361.88 1650.27 �1.0367 3.1393 3.5578 2515.69675 615.72 440.81 1740.11 �0.901 11 3.2109 3.6285 2499.88
900 MPa
185.55a 762.11 �730.50 450.43 �4.4899 1.9186 2.2651 3167.17190 760.53 �722.87 460.52 �4.4362 1.9195 2.2692 3159.71195 758.76 �714.27 471.88 �4.3772 1.9208 2.2739 3151.42200 757.00 �705.64 483.26 �4.3195 1.9225 2.2789 3143.24210 753.53 �688.28 506.10 �4.2081 1.9275 2.2898 3127.12
220 750.10 �670.77 529.06 �4.1013 1.9347 2.3023 3111.30230 746.73 �653.11 552.15 �3.9986 1.9440 2.3163 3095.71240 743.40 �635.26 575.40 �3.8997 1.9556 2.3322 3080.32250 740.12 �617.21 598.80 �3.8042 1.9693 2.3498 3065.11260 736.89 �598.95 622.40 �3.7116 1.9853 2.3692 3050.09
270 733.71 �580.45 646.19 �3.6218 2.0033 2.3903 3035.23280 730.57 �561.71 670.21 �3.5345 2.0232 2.4130 3020.56290 727.48 �542.70 694.46 �3.4494 2.0449 2.4373 3006.08300 724.42 �523.41 718.96 �3.3663 2.0683 2.4630 2991.80310 721.41 �503.83 743.72 �3.2851 2.0932 2.4899 2977.73
320 718.45 �483.94 768.76 �3.2056 2.1194 2.5180 2963.88330 715.52 �463.75 794.09 �3.1277 2.1469 2.5472 2950.27340 712.63 �443.23 819.71 �3.0512 2.1754 2.5773 2936.91350 709.77 �422.38 845.63 �2.9761 2.2049 2.6081 2923.80360 706.96 �401.19 871.87 �2.9022 2.2352 2.6397 2910.95
370 704.18 �379.66 898.43 �2.8294 2.2661 2.6718 2898.38380 701.43 �357.78 925.31 �2.7577 2.2977 2.7043 2886.07390 698.72 �335.55 952.52 �2.6871 2.3297 2.7373 2874.03400 696.04 �312.97 980.06 �2.6173 2.3621 2.7705 2862.27425 689.49 �254.95 1050.36 �2.4469 2.4442 2.8543 2834.04
450 683.13 �194.70 1122.77 �2.2813 2.5271 2.9385 2807.48475 676.94 �132.22 1197.28 �2.1202 2.6099 3.0222 2782.49500 670.93 �67.552 1273.87 �1.9631 2.6920 3.1049 2759.00525 665.07 �0.717 90 1352.52 �1.8096 2.7730 3.1863 2736.90550 659.37 68.236 1433.17 �1.6595 2.8527 3.2661 2716.10
575 653.81 139.26 1515.80 �1.5126 2.9309 3.3441 2696.52600 648.39 212.31 1600.36 �1.3687 3.0074 3.4204 2678.05625 643.10 287.33 1686.81 �1.2276 3.0821 3.4948 2660.62650 637.93 364.28 1775.09 �1.0891 3.1552 3.5673 2644.15675 632.88 443.09 1865.16 �0.953 11 3.2264 3.6380 2628.58
aTemperature on the melting curve.bSaturated liquid.cSaturated vapor.
10. ReferencesAbdulagatov, I. M., S. B. Kiselev, L. N. Levina, Z. R. Zakaryaev, and O. N.
Mamchenkova, Int. J. Thermophys. 17, 423 �1996�.Ambrose, D. and C. Tsonopoulos, J. Chem. Eng. Data 40, 531 �1995�.Atack, D. and W. G. Schneider, J. Phys. Colloid Chem. 54, 1323 �1950�.Atake, T. and H. Chihara, Chem. Lett. 1976, 683 �1976�.Barclay, D. A., J. L. Flebbe, and D. B. Manley, J. Chem. Eng. Data 27, 135
�1982�.Beattie, J. A., C. Hadlock, and N. Poffenberger, J. Chem. Phys. 3, 93 �1935�.Beattie, J. A., G.-J. Su, and G. L. Simard, J. Am. Chem. Soc. 61, 924
�1939a�.
J. Phys. Chem. Ref. Data, Vol. 35, No. 1, 2006
Beattie, J. A., G.-J. Su, and G. L. Simard, J. Am. Chem. Soc. 61, 926�1939b�.
Bedford, R. E. and C. G. M. Kirby, Metrologia 5, 83 �1969�.Bedford, R. E., G. Bonnier, H. Maas, and F. Pavese, Metrologia 20, 145
�1984�.Bell, T. N., C. M. Bignell, and P. J. Dunlop, Physica A 181, 221 �1992�.Bender, R., Dissertation, Universitat Karlsruhe, Germany, 1982.Berestov, A. T., M. S. Giterman, and N. G. Shmakov, Zh. Eksp. Teor. Fiz.
64, 2232 �1973�; �Sov. Phys.-JETP 37, 1128 �1973��.Besserer, G. J. and D. B. Robinson, J. Chem. Eng. Data 18, 137 �1973�.Bier, K., J. Kunze, G. Maurer, and H. Sand, J. Chem. Eng. Data 21, 5
�1976a�.

265265EQUATION OF STATE FOR THE THERMODYNAMIC PROPERTIES OF ETHANE
Bier, K., J. Kunze, and G. Maurer, J. Chem. Thermodyn. 8, 857 �1976b�.Boyes, S. J., Ph.D. thesis, University of London, U.K., 1992.Brachthauser, K., R. Kleinrahm, H. W. Losch, and W. Wagner, Fortschr.-Ber.
VDI, Reihe 8, Nr. 371, VDI-Verlag, Dusseldorf, 1993.Brown, T. S., A. J. Kidnay, and E. D. Sloan, Fluid Phase Equilib. 40, 169
�1988�.Brunner, E., J. Chem. Thermodyn. 19, 823 �1987�.Brunner, E., J. Chem. Thermodyn. 20, 273 �1988�.Buhner, K., G. Maurer, and E. Bender, Cryogenics 21, 157 �1981�.Bulavin, L. A., Yu. M. Ostanevich, A. P. Simkina, and A. V. Stelkov, Ukr.
Fiz. Zh. �Ukr. Ed.� 16, 90 �1971�.Bulavin, L. A. and Yu. L. Shimanskii, Pis’ma Zh. Eksp. Teor. Fiz. 29, 482
�1979�.Burnett, L. J. and B. H. Muller, J. Chem. Eng. Data 15, 154 �1970�.Burrell, G. A. and G. W. Jones, Bureau of Mines, Rep. of Investigation, No.
2276, 1921.Burrell, G. A. and I. W. Robertson, J. Am. Chem. Soc. 37, 1893 �1915�.Burton, M. and D. Balzarini, Can. J. Phys. 52, 52 �1974�.Byun, H.-S., T. P. DiNoia, and M. A. McHugh, J. Chem. Eng. Data 45, 810
�2000�.Cardoso, E. and R. Bell, J. Chim. Phys. 10, 497 �1912�.Carruth, G. F. and R. Kobayashi, J. Chem. Eng. 18, 115 �1973�.Chao, J., R. C. Wilhout, and B. J. Zwolinski, J. Phys. Chem. Ref. Data 2,
427 �1973�.Chashkin, Yu. R., V. A. Smirnov, and A. V. Voronel, Teplofiz. Svoistva
Veshchestv Mater. 21, 139 �1970�.Chui, C.-H. and F. B. Canfield, Trans. Faraday. Soc. 67, 2933 �1971�.Claus, P., R. Kleinrahm, and W. Wagner, J. Chem. Thermodyn. 35, 159
�2003�.Clusius, K. and K. Weigand, Z. Phys. Chem. Abt. B 46, 1 �1940�.Colgate, S. O., A. Sivaraman, and C. Dejsupa, Fluid Phase Equilib. 76, 175
�1992�.Coplen, T. B., J. Phys. Chem. Ref. Data 30, 701 �2001�.Dailey, B. P. and W. A. Felsing, J. Am. Chem. Soc. 65, 42 �1943�.Dana, L. I., A. C. Jenkins, J. N. Burdick, and R. C. Timm, Ref. Eng. 12, 387
�1926�.Dewar, J., Philos. Mag. 18, 210 �1884�.Djordjevich, L. and R. A. Budenholzer, J. Chem. Eng. Data 15, 10 �1970�.Douslin, D. R. and R. H. Harrison, J. Chem. Thermodyn. 5, 491 �1973�.Dymond, J. H. and E. B. Smith, The Virial Coefficients of Pure Gases: A
Critical Compilation �Clarendon, Oxford, 1980�.Eggers, D. F. Jr., J. Phys. Chem. 79, 2116 �1975�.Ernst, G. and U. E. Hochberg, J. Chem. Thermodyn. 21, 407 �1989�.Esper, G., W. Lemming, W. Beckermann, and F. Kohler, Fluid Phase
Equilib. 105, 173 �1995�.Estrada-Alexanders, A. F. and J. P. M. Trusler, J. Chem. Thermodyn. 29, 991
�1997�.Eucken, A. and F. Hauck, Z. Phys. Chem. 134, 161 �1928�.Eucken, A. and A. Parts, Z. Phys. Chem. 20, 184 �1933�.Fredenslund, A. and J. Mollerup, J. Chem. Soc. Faraday Trans. I, 1653
�1974�.Friend, D. G., H. Ingham, and J. F. Ely, J. Phys. Chem. Ref. Data 20, 275
�1991�.Funke, M., R. Kleinrahm, and W. Wagner, J. Chem. Thermodyn. 34, 2001
�2002a�.Funke, M., R. Kleinrahm, and W. Wagner, J. Chem. Thermodyn. 34, 2017
�2002b�.Furtado, A., Ph.D. thesis, University of Michigan, Ann Arbor, Michigan,
1973.Geijsel. J. I., J. A. Schouten, and N. J. Trappeniers, ‘‘The phase diagram of
ethane under high pressure,’’ in High Pressure Science & Technology,Vol. 2, edited by B. Vodar and Ph. Marteau �Pergamon, Oxford, 1979�, p.645.
Golovskii, Y. A., E. P. Mitsevich, and V. A. Tsymarnyy, VNIIE GazpromDepos. No. 39M, 1978.
Goodwin, R. D., H. M. Roder, and G. C. Straty, Thermophysical Propertiesof Ethane from 90 to 600 K at Pressures to 700 bar, NBS Technical Note684 �NBS Boulder, 1976�.
Grini, P. G., Dr.-Ing. thesis, Norwegian Institute of Technology, Trondheim,Norway, 1994.
Grini, P. G., H. S. Mæhlum, E. Brendeng, and G. A. Owren, J. Chem Ther-modyn. 28, 667 �1996�.
Gugnoni, R. J., J. W. Eldrige, V. C. Okay, and T. J. Lee, AIChE J. 20, 357�1974�.
Gunn, R. D., M.Sc. thesis, University of California, Berkeley, California,1958.
Guo, X.-Y., R. Kleinrahm, and W. Wagner, Research Report, Lehrstuhl furThermodynamik, Ruhr-Universitat Bochum, 1992.
Gurvich, L. V., I. V. Veyts, and C. B. Alcock, Thermodynamic Properties ofIndividual Substances 4th ed., Vol. 2 �Hemisphere, Washington, 1991�.
Haase, R. and W. Tillmann, Z. Phys. Chem. 186, 99 �1994�.Handel, G., R. Kleinrahm, and W. Wagner, J. Chem. Thermodyn. 24, 685
�1992�.Hahn, R., K. Schafer, and B. Schramm, Ber. Bunsenges. Phys. Chem. 78,
287 �1974�.Hainlen, A., Justus Liebigs Ann. Chem. 282, 229 �1894�.Hamann, S. D. and W. J. McManamey, Trans. Faraday Soc. 49, 149 �1953�.Haynes, W. M. and M. J. Hiza, J. Chem. Thermodyn. 9, 179 �1977�.Heuse, W., Ann. Phys. 59, 86 �1919�.Hirschfelder, J. O., F. T. McClure, and I. F. Weeks, J. Chem. Phys. 10, 201
�1942�.Holcomb, C. D., J. W. Magee, and W. M. Haynes, Research Report RR-147,
Gas Processors Association, Tulsa, 1995.Holste, J. C., J. G. Young, P. T. Eubank, and K. R. Hall, AIChE J. 28, 807
�1982�.Hoover, A. E., L. Nagata, T. W. Leland, and R. Kobayashi, J. Chem. Phys.
48, 2633 �1968�.Hou, H., J. C. Holste, and K. R. Hall, J. Chem. Eng. Data 41, 344 �1996�.Huff, J. A. and T. M. Reed, J. Chem. Eng. Data 8, 306 �1963�.Jaeschke, M. and A. E. Humphreys �private communication�. Data pub-
lished in extracts in GERG Technical Monograph 4 �VDI-Verlag, Dus-seldorf, 1990�.
Jensen, R. H. and F. Kurata, J. Petrol. Tech. 21, 683 �1969�.Kahre, L. C., J. Chem. Eng. Data 18, 267 �1973�.Kay, W. B., Ind. Eng. Chem. 30, 459 �1938�.Kay, W. B., J. Phys. Chem. 68, 827 �1964�.Kay, W. B. and R. E. Albert, Ind. Eng. Chem. 48, 422 �1956�.Kay, W. B. and D. B. Brice, Ind. Eng. Chem. 45, 615 �1953�.Kay, W. B. and T. D. Nevens, Chem. Eng. Prog. Symp. Ser. 48, 108 �1952�.Kerl, K. and H. Hausler, Ber. Bunsenges. Phys. Chem. 88, 992 �1984�.Khazanova, N. E. and E. E. Sominskaya, J. Phys. Chem. 45, 88 �1971�.Khodeeva, S. M., Russ. J. Phys. Chem. �Engl. Transl.� 40, 1061 �1966�.Kistiakowski, G. B. and W. W. Rice, J. Chem. Phys. 7, 281 �1939�.Kleinrahm, R. and W. Wagner, J. Chem. Thermodyn. 18, 739 �1986�.Klimeck, R. �private communication, 2000�.Klosek, J. and C. McKinley, C., Densities of liquefied natural gas and of low
molecular weight hydrocarbons, Proc. 1st Int. Conference of LNG, Chi-cago, 1968.
Kuenen, J. P. and W. G. Robson, Philos. Mag. 6, 622 �1902a�.Kuenen, J. P. and W. G. Robson, Philos. Mag. 6, 149 �1902b�.Lambert, J. D., G. A. H. Roberts, J. S. Rowlinson, and V. J. Wilkinson, Proc.
R. Soc. A 196, 113 �1949�.Lammers, J. N. J. J., P. H. G. van Kasteren, G. F. Kroon, and H. Zeldenrust,
Enthalpy measurements of natural gas components and mixed refriger-ants with a flow calorimeter, Proc. 57th Ann. Conf. Gas Proc. Assoc.,1978, p. 18.
Lau, W.-W. R., Ph.D. thesis, Texas A&M University, Texas, 1986.Lau, W.-W. R., C.-A. Hwang, J. C. Holste, K. R. Hall, B. E. Gammon, and
K. N. Marsh, J. Chem. Eng. Data 42, 900 �1997�.Leadbetter, A. J., D. J. Taylor, and B. Vincent, Can. J. Chem. 42, 2930
�1964�.Lemming, W., Fortschr.-Ber. VDI, Reihe 19, Nr. 32, VDI-Verlag Dusseldorf,
1989.Lichtenthaler, R. N. and K. Schafer, Ber. Bunsenges. Phys. Chem. 73, 42
�1969�.Loomis, A. G. and J. E. Walters, J. Am. Chem. Soc. 48, 2051 �1926�.Lu, H., D. M. Newitt, and M. Ruhemann, Proc. R. Soc. London A 178, 506
�1941�.Luo, C. C. and R. C. Miller, Cryogenics 21, 85 �1981�.Maass, O. and C. H. Wright, J. Am. Chem. Soc. 43, 1098 �1921�.Mansoorian, H., K. R. Hall, J. C. Holste, and P. T. Eubank, J. Chem. Ther-
modyn. 13, 1001 �1981�.Mason, S. G., S. N. Naldrett, and O. Maass, Can. J. Res. 18, 103 �1940�.Mason, E. A. and T. H. Spurling, ‘‘The virial equation of state,’’ in The Int.
J. Phys. Chem. Ref. Data, Vol. 35, No. 1, 2006

266266 D. BUCKER and W. WAGNER
Enc. of Phys. Chem. and Chem. Phys. �Pergamon, Oxford, 1969�.McClune, C. R., Cryogenics 16, 289 �1976�.Michels, A. and W. Nederbragt, Physica VI, 656 �1939�.Michels, A., W. van Straaten, and J. Dawson, Physica XX, 17 �1954�.Miniovich, V. M. and G. A. Sorina, Russ. J. Phys. Chem. 45, 306 �1971�.Miyazaki, T., A. V. Hejmadi, and J. E. Powers, J. Chem. Thermodyn. 12,
105 �1980�.Mohr, P. J. and B. N. Taylor, J. Phys. Chem. Ref. Data 28, 1713 �1999�.Morrison, G. and J. M. Kincaid, AIChE J. 30, 257 �1984�.Murray, F. E. and C. G. Mason, Can. J. Chem. 30, 550 �1952�.Noury, J., Comptes Rendus 234, 303 �1952�.Ohgaki, K. and T. Katayama, Fluid Phase Equilib. 1, 27 �1977�.Olszewski, K., Philos. Mag. 39, 188 �1895�.Orrit, J. E. and J. M. Laupretre, Adv. Cryog. Eng. 23, 573 �1978�.Pal, A. K., G. A. Pope, Y. Arai, N. F. Carnahan, and R. Kobayashi, J. Chem.
Eng. Data 21, 394 �1976�.Palmer, H. B., J. Chem. Phys. 22, 625 �1954�.Pamidimukkala, K. M., D. Rogers, and G. B. Skinner, J. Phys. Chem. Ref.
Data 11, 83 �1982�.Pavese, F., J. Chem. Thermodyn. 10, 369 �1978�.Parrish, W. R., Fluid Phase Equilib. 18, 279 �1984�.Pestak, M. W., R. E. Goldstein, M. H. W. Chan, J. R. de Bruyn, D. A.
Balzarini, and N. W. Ashcroft, Phys. Rev. B 36, 599 �1987�.Poole, G. R. and R. A. Aziz, Can. J. Phys. 50, 721 �1972�.Pope, G. A., Ph.D. thesis, Rice University, Houston, 1972.Porter, F., J. Am. Chem. Soc. 48, 2055 �1926�.Preston-Thomas, H., Metrologia 27, 3 �1990�.Prins, A., Proc. Acad. Sci. Amsterdam 17, 1095 �1915�.Quint, N., Z. Phys. Chem. 39, 14 �1902�.Reamer, H. H., R. H. Olds, B. H. Sage, and W. N. Lacey, Ind. Eng. Chem.
36, 956 �1944�.Regnier, J., J. Chim. Phys. Phys.-Chim. Biol. 69, 942 �1972�.Rigby, M., J. H. Dymond, and E. B. Smith, ‘‘Second virial coefficients,’’ in
The Virial Coefficients of Pure Gases: A Critical Compilation, edited byJ. H. Dymond and E. B. Smith �Clarendon, Oxford, 1980�.
Roder, H. M., J. Chem. Phys. 65, 1371 �1976a�.Roder, H. M., J. Res. NBS, 80A, 739 �1976b�.Rodosevich, J. B. and R. C. Miller, AIChE J. 19, 729 �1973�.Rossini, F. D., K. S. Pitzer, R. L. Arnett, R. M. Braun, and G. C. Pimentel,
Selected Values of Physical and Thermodynamic Properties of Hydro-carbons and Related Compounds �American Petroleum Institute, Carn-egie Press, Pittsburgh, 1953�.
Rusby, R. L., J. Chem. Thermodyn. 23, 1153 �1991�.Sage, B. H., D. C. Webster, and W. N. Lacey, Ind. Eng. Chem. 29, 658
�1937�.Schafer, K. and W. Auer, Werte der Thermodynamischen Funktionen bei
Standarddrucken in Abhangigkeit von der Temperatur fur AusgewahlteStoffe, Landolt-Bornstein �Springer, Berlin, 1961�, Vol. 2.
Schafer, K., B. Schramm, and J. S. Urieta Navarro, Z. Phys. Chem. 93, 203�1974�.
Schmidt, E. and W. Thomas, Forsch. Geb. Ingenieurwes. 20B, 161 �1954�.Schmidt, E. and W. Wagner, Fluid Phase Equilib. 19, 175 �1985�.Schutte, W. H. M., K. O. Prins, and N. J. Trappeniers, ‘‘A high pressure
NMR investigation of phase transition in solid ethane,’’ in MagneticResonance and Related Phenomena, edited by E. Kundla, Proceedingsof the XXth Congress Ampere, Tallinn, 1978 �Springer, Berlin, 1979�.
Setzmann, U. and W. Wagner, Int. J. Thermophys. 10, 1103 �1989�.Setzmann, U. and W. Wagner, J. Phys. Chem. Ref. Data 20, 1061 �1991�.Shinsaka, K., N. Gee, and G. R. Freeman, J. Chem. Thermodyn. 17, 1111
�1985�.
J. Phys. Chem. Ref. Data, Vol. 35, No. 1, 2006
Shmakov, N. G., Teplofiz. Svoistva Veshestv Material. Moskau GSSSD 7155 �1973�.
Sliwinski, P., Z. Phys. Chem. Neue Folge 63, 263 �1969�.Span, R., Multiparameter Equations of State—An Accurate Source of Ther-
modynamic Property Data �Springer, Berlin, 2000�.Span, R. and W. Wagner, J. Phys. Chem. Ref. Data 25, 1509 �1996�.Span, R., E. W. Lemmon, R. T Jacobsen, W. Wagner, and A. Yokozeki, J.
Phys. Chem. Ref. Data 29, 1361 �2000�.Span, R. and W. Wagner, Int. J. Thermophys. 18, 1415 �1997�.Span, R. and W. Wagner, Int. J. Thermophys. 24, 1 �2003a�.Span, R. and W. Wagner, Int. J. Thermophys. 24, 41 �2003b�.Straty, G. C. and R. Tsumura, J. Chem. Phys. 64, 859 �1976a�.Straty, G. C. and R. Tsumura, J. Res. NBS 80A, 35 �1976b�.Strein, K., R. N. Lichtenthaler, B. Schramm, and K. Schafer, Ber. Bunsen-
ges. Phys. Chem. 75, 1308 �1971�.Strumpf, H. J., A. F. Collings, and C. J. Pings, J. Chem. Phys. 60, 3109
�1974�.Sychev, V. V., A. A. Vasserman, A. D. Kozlov, V. A. Zagoruchenko, G. A.
Spiridonov, and V. A. Tsymarny, Thermodynamic Properties of Ethane�Hemisphere, Washington, D.C., 1987�.
Tanneberger, H., Z. Phys. 153, 445 �1959�.Tegeler, C., R. Span, and W. Wagner, Fortschr.-Ber. VDI, Reihe 3, Nr. 480,
VDI-Verlag, Dusseldorf, 1997.Teja, A. S. and A. Singh, Cryogenics 17, 591 �1977�.Terres, E., W. Jahn, and H. Reissmann, Brennstoff-Chemie 38, 129 �1957�.Thompson, H. W., Trans. Faraday Soc. 37, 344 �1941�.Tickner, A. W., F. P. Lossing, J. Phys. Colloid Chem. 55, 733 �1951�.Tomlinson, J. R., Tech. Pub. TP-1, Natural Gas Processors Assoc., Tulsa,
1971.Trusler, J. P. M., Physical Acoustics and Metrology of Fluids �Adam Hilger,
Bristol, 1991�.Trusler, J. P. M. and M. F. Costa Gomez, Research report for the GERG-
project ‘‘Fundamental equations for calorific properties,’’ London, 1996.Tsiklis, D. S. and V. M. Prokhorov, Zh. Fiz. Khim. 41, 2195 �1967�.Tsiklis, D. S., A. I. Semenova, S. S. Tsimmermann, and E. A. Emel’yanova,
Russ. J. Phys. Chem. 46, 1677 �1972�.Tsumura, R. and G. C. Straty, Cryogenics 17, 195 �1977�.van der Putten, L., J. A. Schouten, and N. J. Trappeniers, High Temp.-High
Press. 17, 533 �1985�.Vangeel, E., private communication with NBS, Boulder. Data published in
Goodwin et al. �1976�.Van Hook, W. A., J. Chem. Phys. 44, 234 �1966�.van Kasteren, P. H. G. and H. Zeldenrust, Ind. Eng. Chem. Fundam. 18, 339
�1979�.Wagner, W., Cryogenics 12, 214 �1972�.Wagner, W., K. Brachthauser, R. Kleinrahm, and H. W. Losch, Int. J. Ther-
mophys. 16, 399 �1995�.Wagner, W. and A. Pruß, J. Phys. Chem. Ref. Data 31, 387 �2002�.Wagner, W. and R. Kleinrahm, Metrologia 41, S24 �2004�.Wallace, C. B., L. H. Silberberg, and J. J. McKetta, Hydrocarbon Processes
43, 177 �1964�.Weber, L. A., Int. J. Thermophys. 13, 1011 �1992�.Whiteway, S. G. and S. G. Mason, Can. J. Chem. 31, 569 �1953�.Wiebe, R., K. H. Hubbard, and M. J. Brevoort, J. Am. Chem. Soc. 52, 611
�1930�.Wieldraaijer, H., J. A. Schouten, and N. J. Trappeniers, High Temp.-High
Press. 15, 87 �1983�.Witt, R. K. and J. D. Kemp, J. Am. Chem. Soc. 59, 273 �1937�.Young, J. G., M.Sc. thesis, Texas A&M University, Texas, 1978.Younglove, B. A. and J. F. Ely, J. Phys. Chem. Ref. Data 16, 577 �1987�.
Related Documents