~ Giorgio Guariso Kingsley E. Haynes Dale Whittington, and Mohammed Younis* A Real-Time Management Model for the Aman High Dam with Policy Implications INTRODUCTION Many resource management problems can be characterized as special issues in queuing, When the queue is dynamic and not appropriately characterized by a fitted Poisson distribution, simulation can provide a useful method for operationally assessing alternatives. In this paper, we expand the analysis of the basic over-year storage operations for the Aswan High Dam in order to evaluate the proposed Tushka (also Toshka) canal construction on the west side of Lake Nasser. We do this with the use of a real-time management model. Until recently, the primary consideration in the operation of the dam was the supply of water for downstream imgation needs with all surpluses used to fill the reservoir. However in 1975, the dam reached its operating range and the managers were faced with a new situation of allocating reservoir waters in order to ensure the most beneficial use of Nile waters for Egypt. Demand for water in agriculture and for energy production has been considered elsewhere (Guariso et al. 1980). In expanding the analysis of the over-year operation problem, we include two addi- tional considerations: (1) the objective of avoiding degradation of the channel and scouring damages to the barrages-a barrage is a submersible dam used to raise the level of water for a gravity fed irrigation system; (2) the reservoir managers’ lack of knowledge of future inflows. The usual approach to the reservoir operation problem in the engineering profession, and in the water resources literature, is to define a certain “operating rule.” This is a relationship between the discharge from the reservoir and the reservoir storage at a certain time (Revelle et al. 1969), or the storage plus some other variable such as the inflow to the reservoir during the specified time period *The authors express their appreciation to the Egyptian Academy of Scientific Research and Technology and the National Research Center, Cairo, the Ford Foundation’s Office of Resources and Environment and the International Division of the US. Environmental Protection Agency. This work could not have been completed without the support of the Nile River-Lake Nasser Water Quality Project directed by K. H. Mancy and M. Hafez. Authors are listed alphabetically and are fully responsible for any errors of conceptualization or interpretation. Giorgio Guariso is lecturer in the Center for Systems Analysis, Polytechnical Institute, Milan. Kingsley E. Haynes is director, Center for Urban and Regional Analysis, School of Public and Environmental Affairs, and a member of the Department of Geography, Indiana University, Bloomington. Dale Whittington is assistant professor, Department of Urban and Regional Planning, University of North Carolina at Chapel Hill. Mohammed Younis is associate professor and director, Systems and Information Science Laboratory, National Research Center, Cairo. 00167363/81/10814355$00.50/0 GEOGRAPHICAL ANALYSIS, vol. 13, no. 4 (October 1981) 0 1981 Ohio State University Press

Welcome message from author
This document is posted to help you gain knowledge. Please leave a comment to let me know what you think about it! Share it to your friends and learn new things together.
Transcript
~
Giorgio Guariso Kingsley E. Haynes
Dale Whittington, and Mohammed Younis*
A Real-Time Management Model for the Aman High Dam with Policy Implications
INTRODUCTION
Many resource management problems can be characterized as special issues in queuing, When the queue is dynamic and not appropriately characterized by a fitted Poisson distribution, simulation can provide a useful method for operationally assessing alternatives. In this paper, we expand the analysis of the basic over-year storage operations for the Aswan High Dam in order to evaluate the proposed Tushka (also Toshka) canal construction on the west side of Lake Nasser. We do this with the use of a real-time management model.
Until recently, the primary consideration in the operation of the dam was the supply of water for downstream imgation needs with all surpluses used to fill the reservoir. However in 1975, the dam reached its operating range and the managers were faced with a new situation of allocating reservoir waters in order to ensure the most beneficial use of Nile waters for Egypt. Demand for water in agriculture and for energy production has been considered elsewhere (Guariso et al. 1980). In expanding the analysis of the over-year operation problem, we include two addi- tional considerations: (1) the objective of avoiding degradation of the channel and scouring damages to the barrages-a barrage is a submersible dam used to raise the level of water for a gravity fed irrigation system; (2) the reservoir managers’ lack of knowledge of future inflows.
The usual approach to the reservoir operation problem in the engineering profession, and in the water resources literature, is to define a certain “operating rule.” This is a relationship between the discharge from the reservoir and the reservoir storage at a certain time (Revelle et al. 1969), or the storage plus some other variable such as the inflow to the reservoir during the specified time period
*The authors express their appreciation to the Egyptian Academy of Scientific Research and Technology and the National Research Center, Cairo, the Ford Foundation’s Office of Resources and Environment and the International Division of the US. Environmental Protection Agency. This work could not have been completed without the support of the Nile River-Lake Nasser Water Quality Project directed by K. H. Mancy and M. Hafez. Authors are listed alphabetically and are fully responsible for any errors of conceptualization or interpretation.
Giorgio Guariso is lecturer in the Center for Systems Analysis, Polytechnical Institute, Milan. Kingsley E. Haynes is director, Center for Urban and Regional Analysis, School of Public and Environmental Affairs, and a member of the Department of Geography, Indiana University, Bloomington. Dale Whittington i s assistant professor, Department of Urban and Regional Planning, University of North Carolina at Chapel Hill. Mohammed Younis is associate professor and director, Systems and Information Science Laboratory, National Research Center, Cairo.
00167363/81/10814355$00.50/0 GEOGRAPHICAL ANALYSIS, vol. 13, no. 4 (October 1981)
0 1981 Ohio State University Press
356 / Geographical Analysis
Ian Feb Mar AprMay Jun Iul AugSepOctNovDec
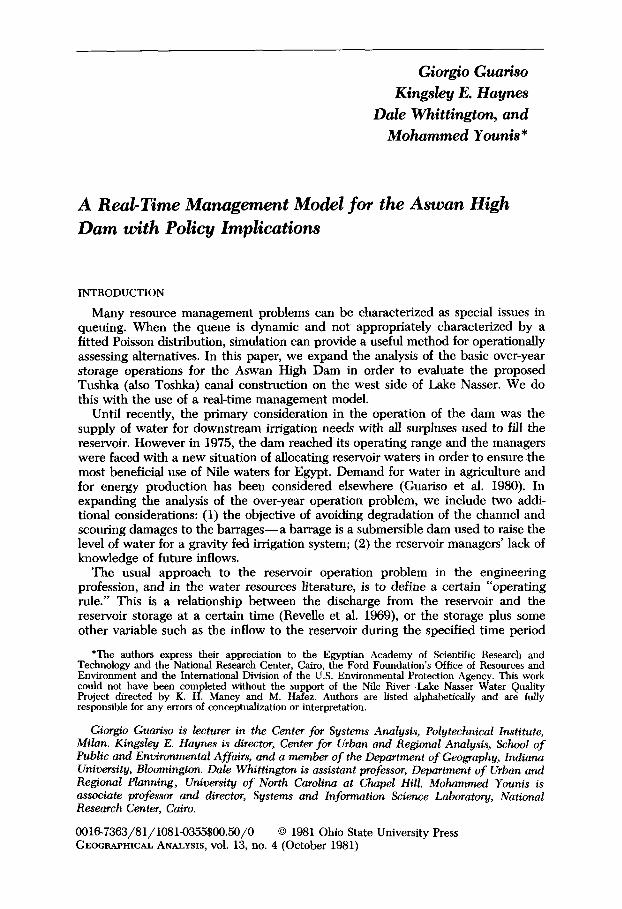
FIG. 1. Seasonal Pattern of Agricultural Water Requirements and Electricity Consumption
(normal operating rule.) In Egypt, the official operating rule was suggested by Hurst (1966). It brings the lake back down to 175 meters each year prior to the armval of the next flood. By so doing the reservoir can accept most large floods and distribute its release of surpluses during the next twelve months. These surpluses, of course, are over and above needs for agriculture and electrical production which must also be distributed (Fig. 1). The lake is then returned to 175 meters to begin 1 he cycle again.
A real-time management approach to the reservoir management problem, on the other hand, does not define a fixed operating rule. Instead, the discharge from the reservoir is computed every time that a decision on releases from the reservoir must be made by solving a mathematical programming problem which characterizes the lzurrent situation. With this approach it is easier to consider factors in addition to storage which better define the situation of the reservoir-such as the forecast of future inflows for rivers with long persistence effects or information on rainfall or evaporation. The results of the real-time management model presented in this paper raise several interesting issues regarding the current operating policy for the High Dam based on the Hurst operating rule, and the wisdom of the Tushka canal spillway project.
FLOOD CONTROL AND DEGRADATION
Although water released from the High Dam is clearly beneficial for downstream users and for hydroelectric power generation, the release of too much water from the reservoir could result in flood damages. The Aswan High Dam ireservoir and the channel capacity of the Nile downstream of the High Dam are, in fact, sufficiently large to eliminate the past threat of flood waters cresting the banks of the Nile and inundating the agricultural areas and villages. The damages incurred from “excess” releases from the reservoir are now of a more subtle kind.
Over long periods of time the Nile has continually transported eroded sediments from the Ethiopian and equatorial highlands to the Mediterranean. The annual flood not only camed large quantities of silt, but also eroded the river channel and embankments. This river bed erosion was countered by deposition of the silt in flood waters so that, from a shorter time perspective, some stability was achieved between the regime of the river and its channel.
After the construction of the High Dam, this stability was disrupted. The silt which was previously carried by the flood waters now settled in ,the reservoir, and the discharges from the High Dam are clear water. This release of silt-free water erodes, or “scours” the channel and embankments, but now there is no countervail-
Guariso, Haynes, Whittington, and Younis / 357
ing process of silt deposition. This process of degradation threatens the barrages in two ways. Not only does it lower the river bed, and thus increase the stress on the barrages, but also the discharges from the barrages creates "scour holes" on the downstream side of the barrages. If a barrage collapsed from such scouring damages, it would be very difficult-if not impossible-to irrigate the area it served.
The threat from scouring and degradation has long been recognized-it was certainly not an unforeseen side effect of the High Dam (Waterbury 1979). The release of any amount of water from the High Dam will, however, result in some degradation, so that the objective of the reservoir management was never to avoid scouring damages entirely, but rather to find a pattern of releases which would result in a new equilibrium and an associated acceptable level of degradation.
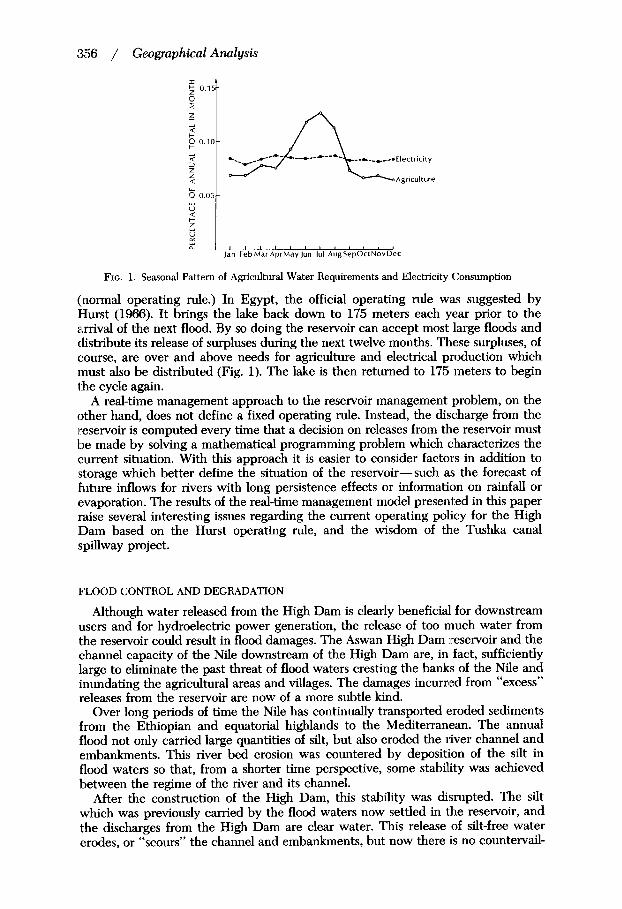
The process of degradation of the river bed under the present pattern of releases from the High Dam appears to be proceeding very slowly. The degree of degrada- tion varies along the river, but even in the steeper reaches of upper Egypt, degradation has not reached anything like the proportions some experts feared (Simaika 1970; El-Darwish and My 1970; USSR Hydroproject 1977; Mohammed 1965; Khalil 1975; Mobarek 1975). Said and Shalash (1974) reported that between 1963 and 1972, the degradation downstream of the Aswan Dam resulted in a lowering of the river bed by 17 cm, downstream of the Esna Barrage by 31 cm, downstream of the Nag Hammadi Barrage by 24 cm, and downstream of the Assuit Barrage by 9 cm (Fig. 2). Estimates available for the last five years do not alter this general picture (Waterbury 1979; Gasser and Wahby 1979; Chu and Mostafa 1979).
The fear, however, was that such insignificant levels of degradation would increase dramatically, if the velocity of the river increased due to the additional release of excess flood waters from the reservoir. Various observers have debated the magnitude of the likely damages associated with different levels of discharge, but the relationship between scouring damages and the velocity and volume of the river discharge remains uncertain. An experiment was reportedly carried out by the
Managed Ni le
Aswan High I)am
EGYPT SUDAN _ _ _ _ _ - Reservoir
I* Wadi Halfa J
FIG. 2. Schematic of the Egyptian Nile
358 / Geographical Analysis
Ministry of Irrigation after the completion of the High Dam in which releases were increased for a short time to 500 million m3 per day, and river bed erosion increased tat “unacceptable” levels (Waterbury 1979). But the current peak agricultural discharges during summer are on the order of 235 million m3 per dary. This would increase to close to 300 million m3 per day if the existing ambitious desert land reclamation plans are carried out. The Ministry of Irrigation has at least implicitly dlecided that this level of peak discharge does not pose unacceptable risks in terms of scouring. How much in excess of this level of peak discharge can be tolerated remains unclear. Indeed, the present uncertainty surrounding the relationship between scouring damages and the velocity and duration of releases from the High 1)am presents a major difficulty for the development of appropriate operating policies for the High Dam.
There are two positions on this issue. The first is that scouring damages are primarily a function of peak discharges, or of the velocity or rapid fluctuations in the velocity of the flow. The appropriate objective in this case would be to avoid peak discharges-or to minimize the maximum discharge from the reservoir over the period of concern. The second is that the scouring damages are primarily a function of the total water released, and that the pattern of the release for a given quantity of water is not terribly important. In this case the only possible solution is to decrease the water to be discharged-either by evaporation losses or by spilling water into the western desert before release from the High Dam. The appropriate objective here would simply be to avoid releases when “possible,” i.e., to effectively balance the benefits to downstream users of hydropower and water from additional releases with the damages resulting in terms of degradation. These are, however, difficult calculations because the assessment of the probability of a given barrage collapsing from a certain level of releases tends to be very subjective.
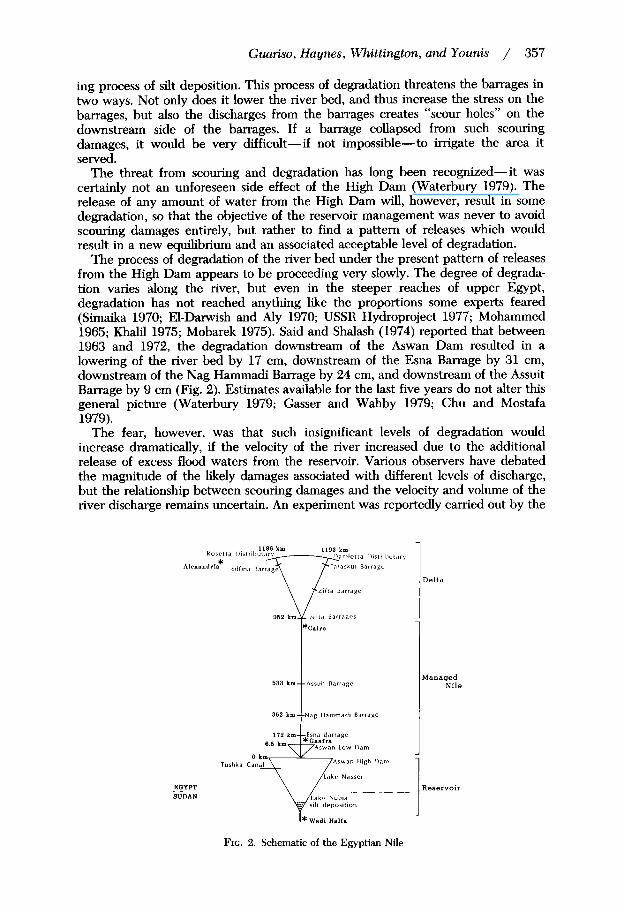
The available evidence, however, does not seem to support the view that ldegradation increases exponentially with increases in discharge. Figure 3 presents data on monthly discharges at the High Dam, and the difference in suspended solids concentration in the water passing Gaafra (near the High Dam) and the Delta barrage over the period 1966-72. The expected temporal autocorrelation down- stream is not apparent since we are working with monthly means but the downstream time lag is only about ten days. Suspended solids concentration does increase with increases in discharge, and the overall relationship appears to be
0 100 200 300 RELEASE FROM ASWAN HIGH D A M - 1O6mg/day lmonfhly mean)
0
FIG. 3. Relationship Between Discharges from the High Dam and the Difference in Suspended Solids Concentration at Gaafra and the Delta Barrage (monthly means 1966-72)
Guariso, Haynes, Whittington, and Younis / 359
approximately linear. An overall linear monthly relationship between discharges and degradation does not, of course, imply that the relationship between discharges and damages from degradation is linear.
Scouring damages cannot only be altered by changing the pattern and level of releases from the High Dam, but also by preventive measures such as strengthening the existing barrages and embankments, or constructing new barrages to reduce the velocity of the flow. Which course of action is most effective is a question for analysis, but clearly the barrages are aging structures and were weakening before the construction of the High Dam.
THE TUSHKA CANAL
As Lake Nasser reached its operating range, the press and the public, as well as the Ministry of Irrigation itself, became concerned about the ability of the reservoir to handle a high flood without “substantial” scouring damages to the main channel, barrages, and bridge foundations from high, silt-free discharges. The problem was that if the reservoir was full and if the official operating policy was used to handle a flood of, say, the size of the one which occurred in 1878, the releases downstream of the High Dam would greatly exceed their “normal” levels throughout the water year.
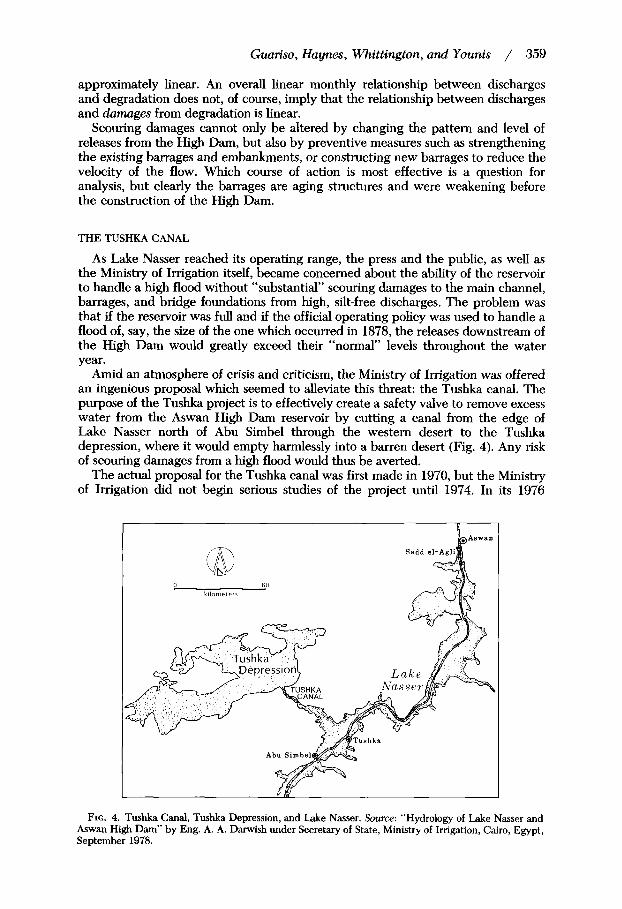
Amid an atmosphere of crisis and criticism, the Ministry of Irrigation was offered an ingenious proposal which seemed to alleviate this threat: the Tushka canal. The purpose of the Tushka project is to effectively create a safety valve to remove excess water from the Aswan High Dam reservoir by cutting a canal from the edge of Lake Nasser north of Abu Simbel through the western desert to the Tushka depression, where it would empty harmlessly into a barren desert (Fig. 4). Any risk of scouring damages from a high flood would thus be averted.
The actual proposal for the Tushka canal was first made in 1970, but the Ministry of Irrigation did not begin serious studies of the project until 1974. In its 1976
FIG. 4. Tushka Canal, Tushka Depression, and Lake Nasser. Source: “Hydrology of Lake Nasser and Aswan High Dam” by Eng. A. A. Darwish under Secretary of State, Ministry of Imgation, Cairo, Egypt, September 1978.
360 / Geographical Analysis
report, The High Dam and Its Effects, the Commission on Agricultural Production, afliliated to the National Councils, expressed its concern about the consequences of a high flood for downstream degradation, and this work probably encouraged the Ministry of Imgation to accelerate its research on the Tushka project.
The ministry’s studies on the feasibility of the Tushka project were completed in the short span of approximately one year, and a summary report was published in January 1976. The need for the construction of the Tushka canal was demonstrated on1 the basis of a set of monthly simulations of the reservoir similar to those presented by Hurst in 1966. The ministry’s calculations were, in fact, more refined. Evaporation losses were calculated monthly as a function of the surface area in that month and monthly estimates of evaporation rates. The spills were spread more evenly over the year in order to reduce the peak daily discharges. T h e allocation of the total annual spill between months did, however, assume that the managers of the reservoir had perfect knowledge of the size of the total inflows over the water year.
These studies seem, however, to have overlooked the appropriateness of Hurst’s operating guideline. Although Hurst’s suggestion for operating the High Dam was not based upon any explicit optimization problem, it seems to hlave gradually become sacrosanct. The ministry’s 1976 analysis was, in fact, simply based upon the inlstructions for handling a very high flood issued in 1970 by the Soviet Union’s All Union, Designing, Surveying, and Research Institute’s Hydroproject. This set of operating instructions also seems to have accepted Hurst’s operating guideline for h,mdling a series of high floods.
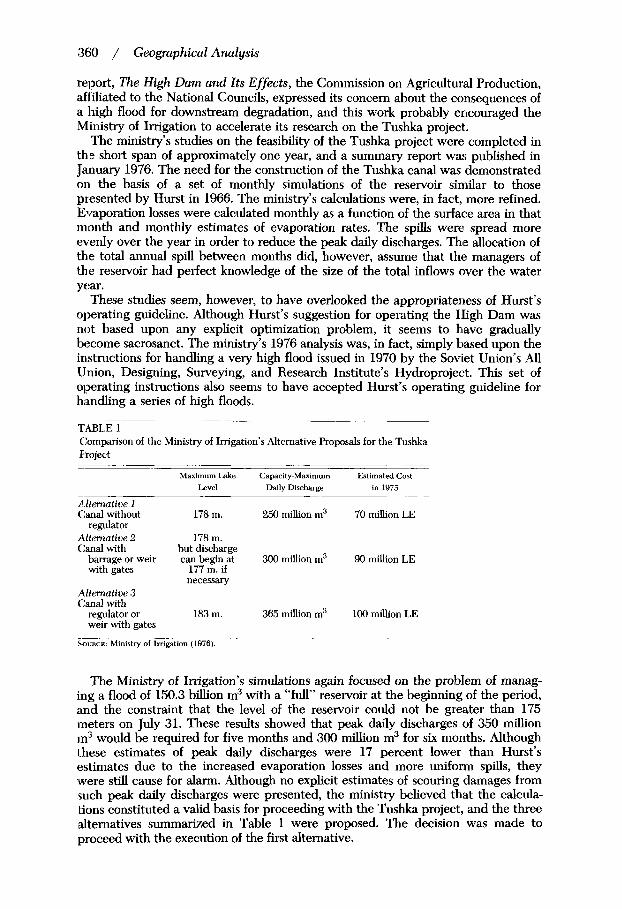
TABLE 1 Comparison of the Ministry of Irrigation’s Alternative Proposals for the Tushka Froject
~
~
Maximum Lake Capacity-Maximum Estimated Cost Level Daily Discharge in 1975
A.ltemative 1 C:anal without 178 m. 250 million m3 70 million LE
regulator Alternatioe 2 178 m. Canal with but discharge
barrage or weir can begin at 300 million m3 90 million LE with gates 177 m. if
necessary Alternative 3 Canal with
regulator or 183 m. 365 million m3 100 million LE weir with gates
SOURCE: Ministry of Irrigation (1976).
The Ministry of Imgation’s simulations again focused on the problem of manag- ing a flood of 150.3 billion m3 with a “full” reservoir at the beginning of the period, and the constraint that the level of the reservoir could not be greater than 175 meters on July 31. These results showed that peak daily discharges of 350 million in3 would be required for five months and 300 million m3 for six months. Although these estimates of peak daily discharges were 17 percent lower than Hurst’s estimates due to the increased evaporation losses and more uniform spills, they were still cause for alarm. Although no explicit estimates of scouring damages from ,such peak daily discharges were presented, the ministry believed that the calcula- tions constituted a valid basis for proceeding with the Tushka project, and the three alternatives summarized in Table 1 were proposed. The decision was made to proceed with the execution of the first alternative.
Guariso, Haynes, Whittington, and Younis / 361
In June 1978, the Ministry of Irrigation began the excavation of the Tushka canal (A2 Ahram January 6, 1979). It is a huge and complicated engineering project. The canal was initially designed to be 350 meters wide, to have a capacity of 365 million m3 per day, and to run for 22 kilometers until it emptied into the Tushka depression. The first phase of the Tushka project called for an ungated spillway at 178 meters above sea level. This stage of the project does preclude the possibility of scouring damages from a high flood. If a regulator is eventually installed at the entrance of the canal, the Tushka project will increase the options which the managers have for operating the reservoir. The complete Tushka project was estimated in 1976 to cost approximately 100 million LE. Maintenance costs to keep the channel clear are not yet known but are likely to be high due to filling of the channel by wind-blown sand. Whether or not the Tushka canal was a wise investment, however, is open to question. As illustrated in the subsequent sections of this paper, the investment planning calculations upon which the Tushka canal was originally justified were flawed.
MODEL
The real-time management problem, presented in this section, is solved by a computer program which uses two basic components: (1) a forecasting model, and (2) a water budget simulation model. The forecasting model is a mathematical representation of the stochastic process of the inflows, which is utilized to predict future inflows from knowledge about the present and past ones. Since the focus of this study is not the precise representation of the stochastic process of the Nile flows, one of the simplest was used-an ordinary cyclostationary first-order autore- gressive model-because of its limited data requirements and ease of parameter estimation. This lag-one Markov model has been widely used in the analysis of hydrological processes and is well known throughout the water resources literature (Maass et al. 1962; Fiering 1967; Yevdjevich 1965; Ambrosino et al. 1979).
To illustrate the use of this stochastic model for forecasting purposes, consider the variable Z (t), the inflow in the tth month of the yth year. The stochastic process { Zy( t)Tt, (I is characterized by twelve distinct probability distributions, one for each month of the year. These twelve distributions were checked with the Kolmogorov-Smirnov test, and each proved to be log-normal at more than the 5 percent significance level. The transformed variable In ZJt) can thus be considered normally distributed. This new variable was standardized to a process with zero mean and standard deviation equal to one.
The transformed, standardized variable ill( t ), where
and pt is the mean of the transformed inflow, and a, is the standard deviation of the transformed inflow, was assumed to belong to the following first-order autoregres- sive process:
i y ( t + 1) = p t i v ( t ) + E Y ( t + l ) , (2)
where pt equals the correlation between month t and t + 1, and cy(t + 1) is a normally distributed uncorrelated random error term with zero mean and standard deviation equal to /-, and where
362 / Geographical Analysis
i i 1 9 2 6 - 1975 8 1 8 7 1 - 1 9 2 5 Rl
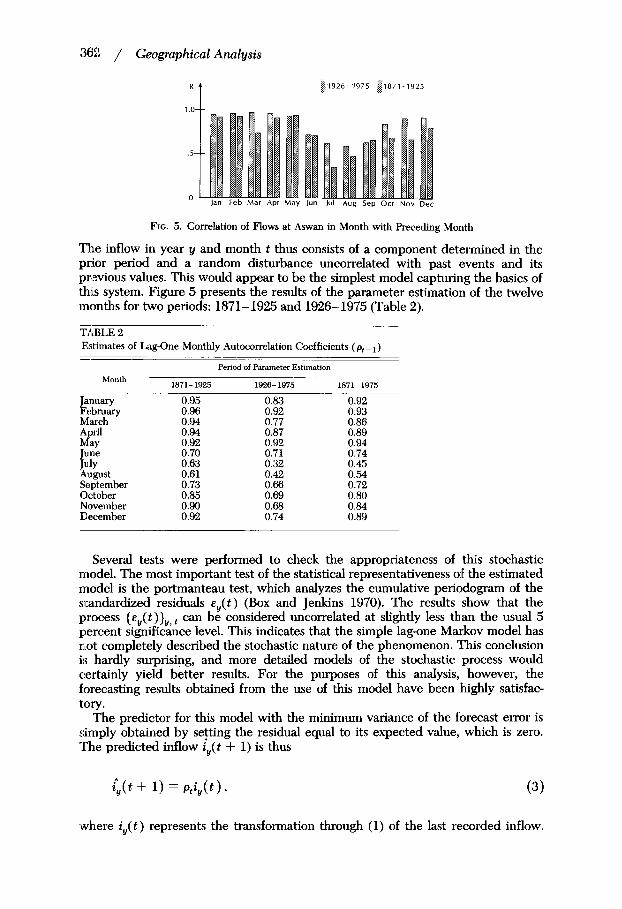
FIG. 5. Correlation of Flows at Aswan in Month with Preceding Month
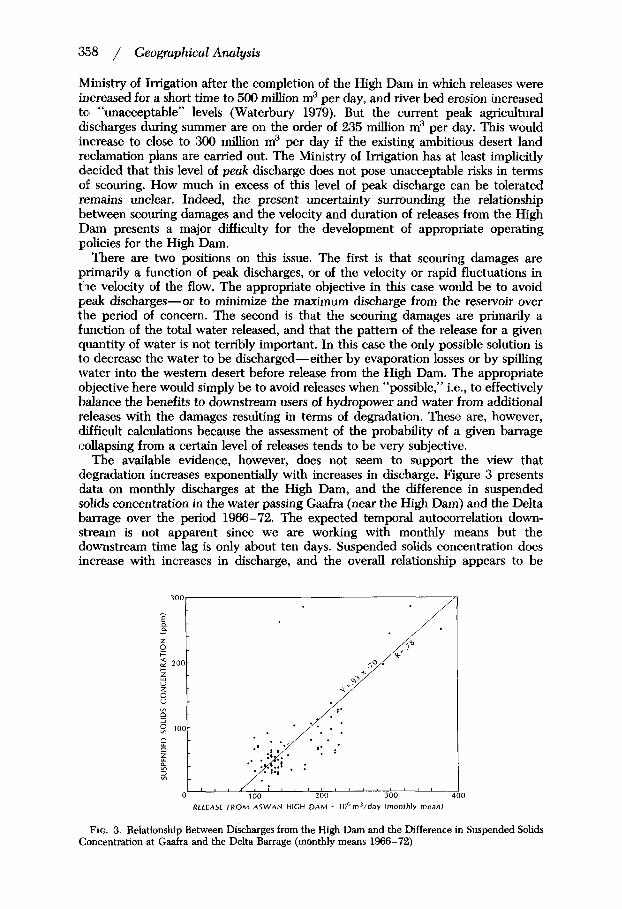
Thle inflow in year y and month t thus consists of a component deteimined in the prior period and a random disturbance uncorrelated with past events and its praevious values. This would appear to be the simplest model capturing the basics of this system. Figure 5 presents the results of the parameter estimation of the twelve months for two periods: 1871- 1925 and 1926- 1975 (Table 2). - TABLE 2 Estimates of Lag-One Monthly Autocorrelation Coefficients ( pt- I ) - -
Period of Parameter Estimation
1871- 1925 1926- 1975 1871- 1975 Month
- anuary 0.95 0.83 0.92
kt:bruary 0.96 0.92 0.93 March 0.94 0.77 0.86
May 0.92 0.92 0.94 0.70 0.71 0.74 0.63 0.32 0.45 0.61 0.42 0.54 August
September 0.73 0.66 0.72 October 0.85 0.69 0.80 November 0.90 0.68 0.84 December 0.92 0.74 0.89
April 0.94 0.87 0.89
1:;;”
Several tests were performed to check the appropriateness of this stochastic model. The most important test of the statistical representativeness of the estimated model is the portmanteau test, which analyzes the cumulative periodogram of the standardized residuals ey(t) (Box and Jenkins 1970). The results show that the process {ey(t)}y,t can be considered uncorrelated at slightly less than the usual 5 percent significance level. This indicates that the simple lag-one Markov model has not completely described the stochastic nature of the phenomenon. This conclusion i:j hardly surprising, and more detailed models of the stochastic process would certainly yield better results. For the purposes of this analysis, however, the forecasting results obtained from the use of this model have been highly satisfac- tory.
The predictor for this model with the minimum variance of the forecast error is simply obtained by se!ting the residual equal to its expected value., which is zero. ‘The predicted inflow iy( t + 1) is thus
/y(t + 1) = p t i y ( t ) , (3)
,where i y ( t ) represents the transformation through (1) of the last recorded inflow.

Guariso, Haynes, Whittington, and Younis / 363
The prediction N periods into the future is similarly given by
t+N--I
i ^ , ( t + N ) = i = t n p i i y ( t ) . (4)
For any predicted value [y( t ) , the expected value of the forecast inflow is given by the inverse transformation
The performance of this predictor (3)-(5) was measured in several ways. First, the mean difference between the red and forecast values was negligible--0.8 percent of the mean of the process for lag-one predictions, 1.4 percent for the lag-two, and a very slow increase for greater-order lags. Second, the standard deviation of the difference between actual and forecast values was 19 percent of the mean of the actual inflows for the lag-one predictions and 26 percent for the lag-two predictions. Third, the correlation between the forecast and actual values was extremely high--0.96 for the lag one and 0.95 for the lag two.
Figure 6 illustrates the differences between the lag-one forecasts and real inflows for the most stringent cases for the model, i.e., the prediction of the extreme events for the entire period 1871- 1975. In this example, the parameters are estimated on the perid 1926- 1975, and then the verification is done on the period 1871- 1925.
The forecasting model is used as part of the water budget simulation model of the reservoir with the following modified mass balance equation:
v,(t + 1) = VY( t ) + i , ( t ) - s y ( t ) - E y ( t ) - Dy(t) , (6)
where f&t) = forecast inflows in month t of year y, and the other variables are volume of the reservoir, V; seepage, S; evaporation, E; and discharge, D.
Using the Hurst guidelines, the monthly discharges from the High Dam are assumed to follow a fixed pattern of releases (Table 3-approximately the 1976 discharge program of the High Dam Authority) unless more water must be released over the water year (August 1- July 31) in order for the lake level to be down to 175 meters by July 31 as suggested by Hurst. This discharge program is assumed to
O FORECAST VALUES - ACTUAL VALUES MILLIONS
M’ PER Only ‘.* in vertical column indicates forcart - Actual within specifled range of accuracy MONTH
FIG. 6. Actual Values Forecast Monthly Inflows for Selected Years (1878-1880 & 1912-1914); Scenario No. 5 Future Conditions: Parameter Estimation 1926- 1975; Verification 1871- 1925.
3641 / Geographical Analysis
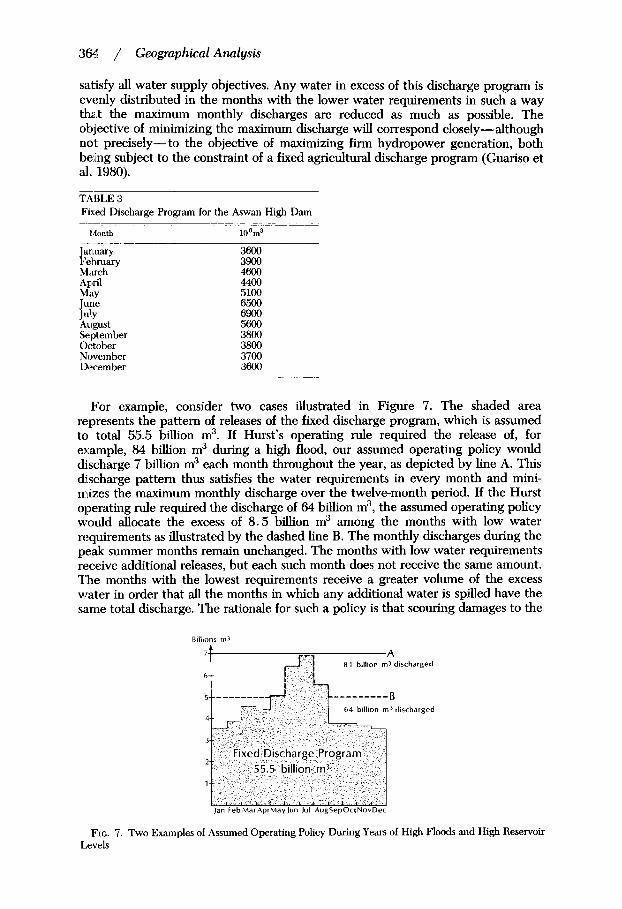
satisfy all water supply objectives. Any water in excess of this discharge program is evenly distributed in the months with the lower water requirements in such a way thart the maximum monthly discharges are reduced as much as possible. The objective of minimizing the maximum discharge will correspond closely- although not precisely- to the objective of maximizing firm hydropower generation, both being subject to the constraint of a fixed agricultural discharge program (Guariso et al. 1980).
TABLE 3 Fixed Discharge Program for the Aswan High Dam
Month 1 0 % ~
March
May April
August September October November December
3600 3900 4600 4400 5100 6500 6900 5600 3800 3800 3700 3600
For example, consider two cases illustrated in Figure 7. The shaded area represents the pattern of releases of the fixed discharge program, which is assumed to total 55.5 billion m3. If Hurst's operating rule required the release of, for example, 84 billion m3 during a high flood, our assumed operating policy would djscharge 7 billion m3 each month throughout the year, as depicted by line A. This discharge pattern thus satisfies the water requirements in every month and mini- mizes the maximum monthly discharge over the twelvemonth period. If the Hurst operating rule required the discharge of 64 billion m3, the assumed operating policy would allocate the excess of 8.5 billion m3 among the months with low water requirements as illustrated by the dashed line B. The monthly discharges during the peak summer months remain unchanged. The months with low water requirements receive additional releases, but each such month does not receive the same amount. ?he months with the lowest requirements receive a greater volume of the excess water in order that all the months in which any additional water is spilled have the same total discharge. The rationale for such a policy is that scouring damages to the
A 81 billion m3 discharged
B - - - - - --- - 64 billion m 3 discharged
FIG. 7. Two Examples of Assumed Operating Policy During Years of High Floods and High Reservoir Levels

Guariso, Haynes, Whittington, and Younis / 36s
river channel and barrages will be reduced most effectively by the avoidance, to the extent possible, of very large discharges.
In the real-time management model, the objective in scheduling releases from the High Dam is still to minimize the scouring damages to the river channel and barrages subject to the constraint that the same fixed minimum discharge program is met. At the beginning of each month, the real-time management model forecasts inflows twelve months in advance using the lag-one Markovian coefficients, and plans a twelvemonth discharge program on the basis of this forecast which minimizes the maximum discharge.
Of course this is subject to the constraints on the minimum agricultural dis- charges, the continuity equation, and the working level of the reservoir. The discharge for the first month in this program is then released, and the remainder of the plan is discarded. The water budget simulation proceeds to the next month, and the model again forecasts inflows twelve months in advance. A new twelve-month discharge plan is made, and the discharge of the first month of the second plan is released. The real-time management model continues this monthly simulation for the entire sequence of inflows; twelve hundred separate discharge programs are thus calculated during a onehundred-year simulation. A schematic of the model is presented in Figure 8.
More formally, the twelvemonth release program can be planned by solving the following mathematical programming problem:
min(max ~ , ( t ) )
{D,(t > > Jy(13) (7)
V,(t + 1) = V,(t) + f , ( t ) - E , ( t ) - S , ( t ) - D,( t ) ; ( 8 )
D,(t) a at; t = 1 , . . . , 1 2 (9) m d V , ( t ) < M ; t = 1, ..., 12 (10)
Vy(l) fixed, (11)
subject to
t = 1, ..., 12
I - - - - - - - - - ~ - - 7 1 Lag-one Autoregressive Model
Forcast Inflows t o Reservoir 12 mo.
in Advance I I _ _ _ _ _ _ _ _ _ _ - - - J
I - r - - - ~ - _ - _ _ _ _ _ ~
- - ~ S o l u t l o n of Mathematical I I Optimization Problem I L- ----___ _ _ _ _ _I
Make a 12 mo. Discharge Plan Which
Minimizes The Maximum Discharge I ! Over The 12 mo. Period
~ _ _ _ ~ ~ _ ~ _ _ - - _ _
I _ _ _ _ - - _ _ _ _ _ _ J
Stmulate The Monthly Behavior of The Reservorr
Using The Release For ! I The 1st Month of The Plan
w a t e r sudget 1
(Discard the remaining 11 mo of the plan)
FIG. 8. Schematic of Real-Time Management Model
3661 / Geographical Analysis
whlere
at = water requirement in month t
rn = dead storage volume
M = maximum volume of the reservoir.
’This problem has a sblution only if
Otherwise, a deficit situation occurs, and the discharge is set according to the solution of a different problem. In this case the objective function (7) and the constraint (9) are replaced respectively by
min r
where T is a percentage reduction in the fixed discharge program and the other constraints (8), (lo), and (11) remain as before. This means that in case of a deficit the discharge program is reduced by the minimum percentage which satisfies the constraint on the minimum storage. This reduction policy is preferred to the simple minimization of the deficit peak because the agricultural production functions are approximated by fixed factor input proportions in each time period, as discussed in VVhittington and Haynes (1980). A certain reduction in one month {can thus cause the loss of the crop, or, if forecast, a shift to a less water-intensive crop.
Furthermore, problem (7)-(11) must be solved for y = 1,. . . , (12 times the number of years of the sequence). In this case
v,(1) = Vy-dl) + Z y - l W - Ey-l(l) - S y - d l ) - D,-l(l> 9 (15)
and V,(1) must then be checked again to ensure that constraint (9) can be satis- fied with the actual inflow I, - 1( 1).
The problem (7)-(11) is nonlinear because of the relation between discharges and evaporation losses as demonstrated in Smith‘s (1978) lake area assessment results. The standard solution procedure for this type of problem would be to use a dynamic programming algorithm to choose separately each of the twelve decision variables D,(t) and Vy(13) (Hall et al. 1968; Sobel 1975; Loucks 1976; Fults let al. 1976; Ambrosino et al. 1979; El-Assouti 1979). This computation must be repeated every month.
In this analysis the following alternative solution procedure was used instead: a fixed pattern of V,(13) was determined through an empirical search, and then problem (7)-(11) was solved assuming Vy(13) was fixed and not a decision variable. In this case the solution of problem (7)-(11) can be found by solving a nonlinear equation in one variable. The pattern of V,(13) which achieves the best result is to plan the discharge program in a certain month so that the level of the lake twelve
Guariso, Haynes, Whittington, and Younis / 367
months later does not exceed 176.5 meters during the flood season (November, December, January, February) and 175 meters for all other months. The sensitivity of the final solution to variations of the assumed pattern of V,(13) turned out to be relatively small.
When coupled with the simple Markov forecasting model, this solution procedure is certainly not as technically precise as the standard stochastic dynamic program- ming approach to the reservoir management problem. The basic thrust of the policy conclusions, however, is not sensitive to the choice of the solution procedure. Moreover, this approach does permit the subsequent incorporation of a more appropriate forecasting model, which would make the stochastic dynamic program- ming model computationally unmanageable.
RESULTS
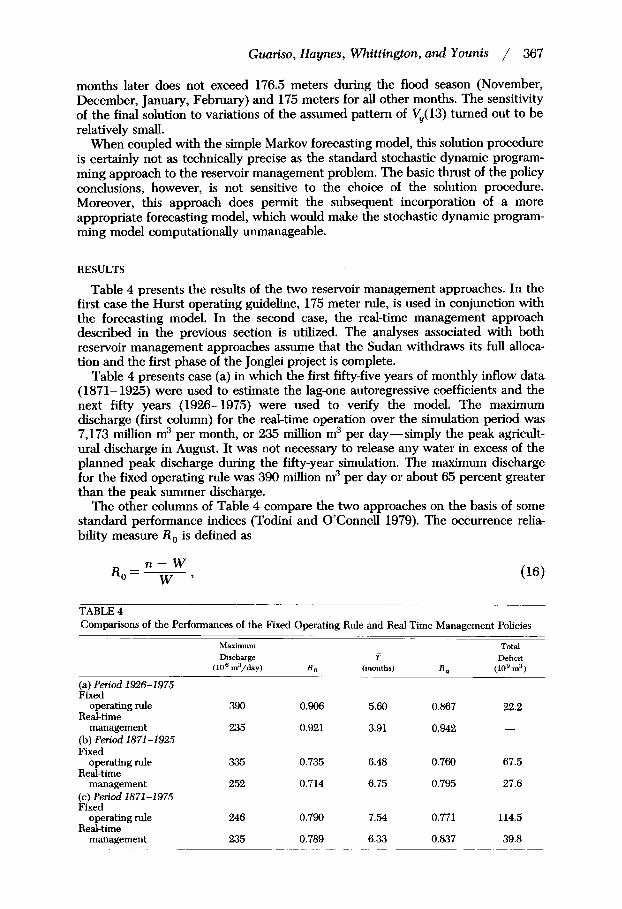
Table 4 presents the results of the two reservoir management approaches. In the first case the Hurst operating guideline, 175 meter rule, is used in conjunction with the forecasting model. In the second case, the real-time management approach described in the previous section is utilized. The analyses associated with both reservoir management approaches assume that the Sudan withdraws its full alloca- tion and the first phase of the Jonglei project is complete.
Table 4 presents case (a) in which the first fifty-five years of monthly inflow data (1871- 1925) were used to estimate the lag-one autoregressive coefficients and the next fifty years (1926-1975) were used to verify the model. The maximum discharge (first column) for the real-time operation over the simulation period was 7,173 million m3 per month, or 235 million m3 per day-simply the peak agricult- ural discharge in August. It was not necessary to release any water in excess of the planned peak discharge during the fifty-year simulation. The maximum discharge for the fixed operating rule was 390 million m3 per day or about 65 percent greater than the peak summer discharge.
The other columns of Table 4 compare the two approaches on the basis of some standard performance indices (Todini and O’Connell 1979). The occurrence relia- bility measure R , is defined as
n - W R , = ~ W ’
Maximum Discharge
(10’ m3/day) 8 0
TABLE 4 Comparisons of the Performances of the Fixed Operating Rule and Red-Time Management Policies
~
~
Total T Deficit -
(months) R , (lo9 m3)
(a) Period 1926-1975 Fixed
Real-time operating rule
management (b) Period 1871-1925 Fixed
Real-time operating rule
management (c) Period 1871-1975
390 0.906
235 0.921
335 0.735
252 0.714
Fixed omratinn rule 246 0.790
Red-time - management 235 0.789
5.60 0.867 22.2
3.91 0.942 -
6.48 0.760 67.5
6.75 0.795 27.6
7.54 0.771 114.5
6.33 0.837 39.8
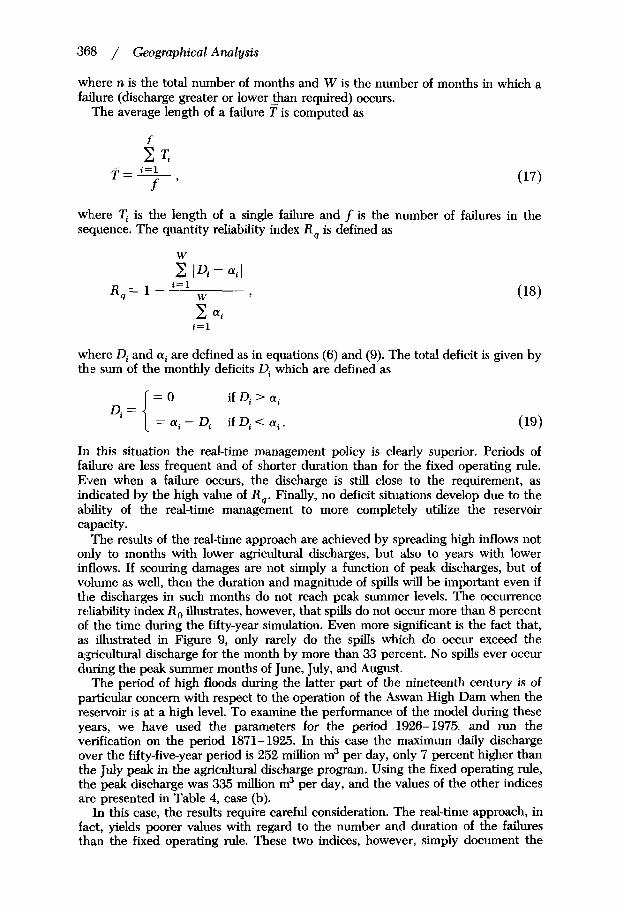
3688 / Geographical Analysis
where n is the total number of months and W is the number of months in which a failure (discharge greater or lower than required) occurs.
The average length of a failure T is computed as
whlere Ti is the length of a single failure and f is the number of fsdures in the sequence. The quantity reliability index R , is defined as
where Di and ai are defined as in equations (6) and (9). The total deficit is given by the sum of the monthly deficits Di which are defined as
if Di > ai
if Di < ai. = ai - Di Di =
In this situation the real-time management policy is clearly superior. Periods of failure are less frequent and of shorter duration than for the fixed operating rule. Even when a failure occurs, the discharge is still close to the reiquirement, as indicated by the high value of R,. Finally, no deficit situations develop due to the ability of the real-time management to more completely utilize the reservoir calpacity.
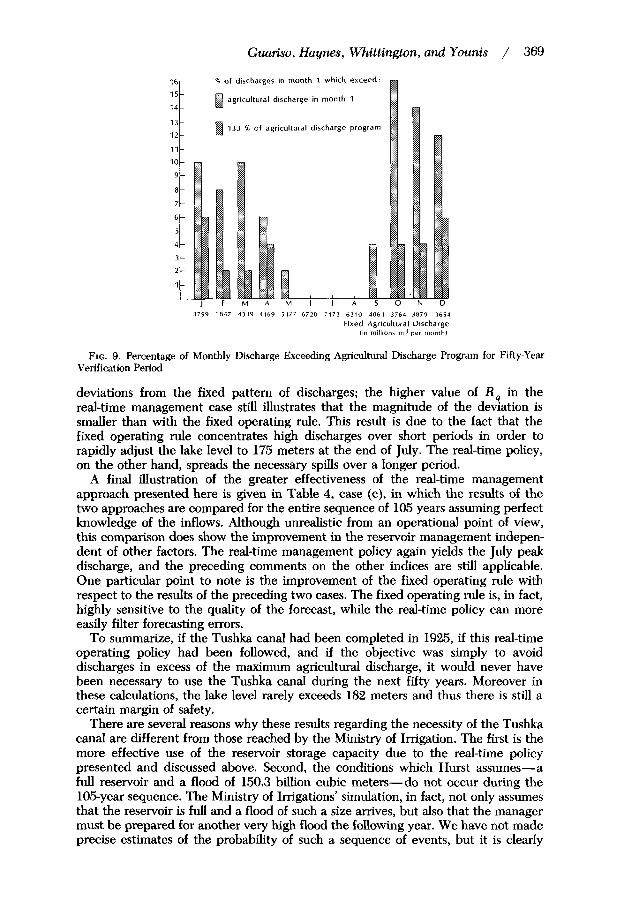
The results of the real-time approach are achieved by spreading hi,& inflows not only to months with lower agricultural discharges, but also to years with lower inflows. If scouring damages are not simply a function of peak discharges, but of volume as well, then the duration and magnitude of spills will be important even if the discharges in such months do not reach peak summer levels. The Occurrence reliability index R , illustrates, however, that spills do not occur more than 8 percent of the time during the fifty-year simulation. Even more significant is the fact that, a!$ illustrated in Figure 9, only rarely do the spills which do occur exceed the a;;ricultural discharge for the month by more than 33 percent. No spills ever occur during the peak summer months of June, July, and August.
The period of high floods during the latter part of the nineteenth century is of particular concern with respect to the operation of the Aswan High Dam when the reservoir is at a high level. To examine the performance of the model during these years, we have used the parameters for the period 1926-1975 and run the verification on the period 1871-1925. In this case the maximum daily discharge aver the fifty-five-year period is 252 million m3 per day, only 7 percent higher than the July peak in the agricultural discharge program. Using the fixed operating rule, the peak discharge was 335 million m3 per day, and the values of the other indices are presented in Table 4, case (b).
In this case, the results require careful consideration. The real-time approach, in fact, yields poorer values with regard to the number and duration of the failures than the fixed operating rule. These two indices, however, simply document the
Guariso, Haynes, Whittington, and Younis / 369
1 6 ~ % of discharges in month 1 which exceed:
10
9
8
7
6
5
4
3
2
1
I
@ agricultural discharge in month
4 133 % of agrtcultural discharge
3799 3847 4319 4169 5177 6 7 2 8 7173 6310 4061 3764 3879 3 6 5 4
Fixed Agricultural Discharge 11" million^ m3 per month1
FIG. 9. Percentage of Monthly Discharge Exceeding Agricultural Discharge Program for Fifty-Year Verification Period
deviations from the fixed pattern of discharges; the higher value of R , in the real-time management case still illustrates that the magnitude of the deviation is smaller than with the fixed operating rule. This result is due to the fact that the fixed operating rule concentrates high discharges over short periods in order to rapidly adjust the lake level to 175 meters at the end of July. The real-time policy, on the other hand, spreads the necessary spills over a longer period.
A final illustration of the greater effectiveness of the real-time management approach presented here is given in Table 4, case (c), in which the results of the two approaches are compared for the entire sequence of 105 years assuming perfect knowledge of the inflows. Although unrealistic from an operational point of view, this comparison does show the improvement in the reservoir management indepen- dent of other factors. The real-time management policy again yields the July peak discharge, and the preceding comments on the other indices are still applicable. One particular point to note is the improvement of the fixed operating rule with respect to the results of the preceding two cases. The fixed operating rule is, in fact, highly sensitive to the quality of the forecast, while the real-time policy can more easily filter forecasting errors.
To summarize, if the Tushka canal had been completed in 1925, if this real-time operating policy had been followed, and if the objective was simply to avoid discharges in excess of the maximum agricultural discharge, it would never have been necessary to use the Tushka canal during the next fifty years. Moreover in these calculations, the lake level rarely exceeds 182 meters and thus there is still a certain margin of safety.
There are several reasons why these results regarding the necessity of the Tushka canal are different from those reached by the Ministry of Irrigation. The first is the more effective use of the reservoir storage capacity due to the real-time policy presented and discussed above. Second, the conditions which Hurst assumes-a full reservoir and a flood of 150.3 biUion cubic meters-do not occur during the 105-year sequence. The Ministry of Irrigations' simulation, in fact, not only assumes that the reservoir is fulI and a flood of such a size arrives, but also that the manager must be prepared for another very high flood the following year. We have not made precise estimates of the probability of such a sequence of events, but it is clearly
3701 / Geographical Analysis
R - Correlation Coefficient t
i t Year
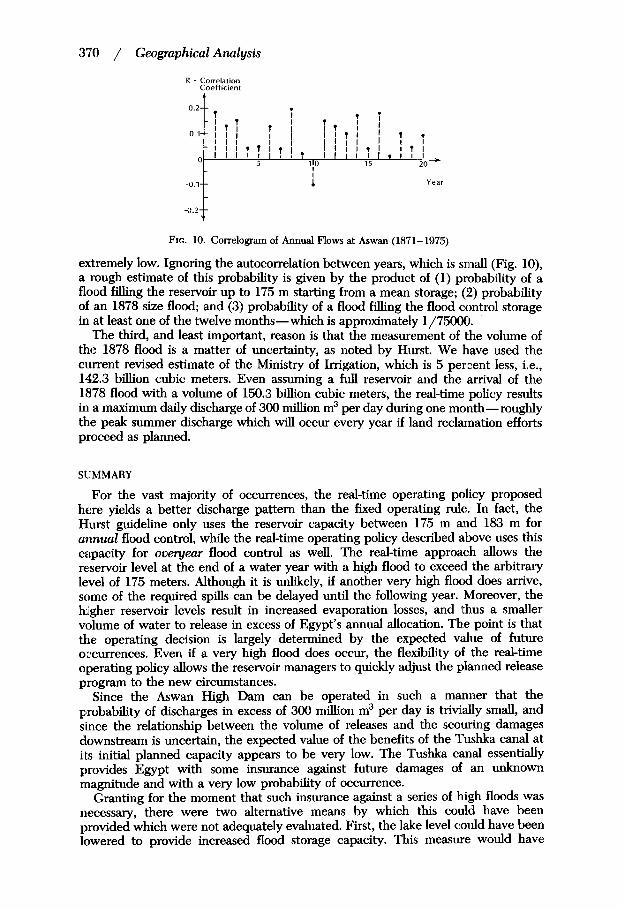
FIG. 10. Correlogram of Annual Flows at Aswan (1871-1975)
extremely low. Ignoring the autocorrelation between years, which is snnall (Fig. lo), a rough estimate of this probability is given by the product of (1) probability of a flood filling the reservoir up to 175 m starting from a mean storage; (2) probability of an 1878 size flood; and (3) probability of a flood filling the flood control storage in at least one of the twelve months- which is approximately 1/75000.
The third, and least important, reason is that the measurement of the volume of the 1878 flood is a matter of uncertainty, as noted by Hurst. We hlave used the current revised estimate of the Ministry of Imgation, which is 5 percent less, i.e., 142.3 billion cubic meters. Even assuming a full reservoir and the amval of the 1878 flood with a volume of 150.3 billion cubic meters, the real-time policy results in a maximum daily discharge of 300 million m3 per day during one month- roughly the peak summer discharge which will occur every year if land reclamation efforts proceed as planned.
SLMMARY
For the vast majority of occurrences, the real-time operating policy proposed here yields a better discharge pattern than the fixed operating rule. In fact, the Hurst guideline only uses the reservoir capacity between 175 m and 183 m for atinual flood control, while the real-time operating policy described above uses this capacity for overyear flood control as well. The real-time approach allows the reservoir level at the end of a water year with a high flood to exceed the arbitrary level of 175 meters. Although it is unlikely, if another very high flood does amve, some of the required spills can be delayed until the following year. Moreover, the higher reservoir levels result in increased evaporation losses, and thus a smaller volume of water to release in excess of Egypt’s annual allocation. The point is that the operating decision is largely determined by the expected value of future occurrences. Even if a very high flood does occur, the flexibility of the real-time operating policy allows the reservoir managers to quickly adjust the planned release program to the new circumstances.
Since the Aswan High Dam can be operated in such a manner that the probability of discharges in excess of 300 million m3 per day is trivially small, and since the relationship between the volume of releases and the scouring damages downstream is uncertain, the expected value of the benefits of the Tushka canal at its initial planned capacity appears to be very low. The Tushka canal essentially provides Egypt with some insurance against future damages of an unknown magnitude and with a very low probability of occurrence.
Granting for the moment that such insurance against a series of high floods was necessary, there were two alternative means by which this could have been provided which were not adequately evaluated. First, the lake level could have been lowered to provide increased flood storage capacity. This measwe would have
GuaTiso, Haynes, Whittington, and Younis / 371
entailed a slightly reduced head on the turbines, but would only have been required for an interim period of a very few years until the Sudan increased its withdrawals to its full allocation, and thus further reduced the possibility of discharges greatly in excess of Egypt’s annual allocation.
Second, since the chief threat of such excess discharges was to the stability of the Esna barrage, the funds allocated to the Tushka canal project could have been spent on the first steps toward replacing the Esna barrage. Coupled with a lowering of the lake level, this would have probably been a more cost effective plan for minimizing the scouring damages from a series of high floods because the Esna barrage will have to be replaced in the near future in any case.
The analysis presented in this paper certainly does not constitute a proper evaluation of the Tushka canal for investment planning purposes. At the very least, however, the results indicated that the canal as initially planned was oversized. Considering the many pressing national needs in Egypt today, the Tushka canal would seem to have been a very low investment priority.
POSTSCRIPT
The resdts of this analysis were presented to the Ministry of Irrigation in late 1978. A review committee of the Ministry of Imgation strongly objected to these conclusions and the analysis upon which they were based, however the capacity of the first phase of the Tushka canal was subsequently reduced to about one half of its originally planned size. This smaller version of the Tushka canal was completed in the summer of 1980.
LITERATURE CITED
Ambrosino, G., G. Fronza, and G. Guariso (1979). “Real-Time Predictor Versus Synthetic Hydrology for Sequential Reservoir Management.” Water Resources Research, 15, 885-90.
Box, G. E. P., and G. M. Jenkins (1970). Time Series Anulysis: Forecasting and ControZ. San Francisco: Holden-Day .
Chu, H., and G. Mostafa (1979). “A Mathematical Model for Nile River Degradation.” Presented at the Conference on Water Resources Planning in Egypt, June 25-27. Sponsored by Cairo University/M.I.T. Technological Planning Program and the Ministry of Irrigation.
El-Assouti, I., M. M. Abou-Seida, and H. T. Dorrah (1979). Towards an Optimal Policy for the High Aswan Dam. TPP/EWPS 79/1. Cairo University/M.I.T. Technological Planning Program. Cairo, Egypt.
El-Darwish, A. A., and H. W. M. Aly (1970). “Nile River Degradation below High Aswan Dam after the Historical Closure of the River in May 14, 1964.” International Congress on Large Dams; loth, Trans.; Montreal, Canada, June 1-5.
Fiering M. (1967). Stream Flow Synthesis. Cambridge: Harvard University Press. Fiering, M., and B. Jackson (1971). Synthetic Streamflows. American Geophysical Union, Water
Resources Monograph 1. Washington, D.C. Fults, M., L. Hancock, and G. R. Logan (1976). “A Practical Monthly Optimum Operations Model.”
Journal of the Water Resources Planning and Management Division, April, 63-75. Gasser, M, and H. Wahby (1979). “The Process of Nile River Degradation.” Presented at the Conference
on Water Resources Planning in Egypt, June 25-27. Sponsored by Cairo University/M.I.T. Techno- logical Planning Program and the Ministry of Irrigation.
Guariso, G., K. E. Haynes, D. Whittington, and M. Younis (1980). “Energy, Agriculture and Water: A Multiobjective Programming Analysis of the Operations of the Aswan High Dam.” Wuironment and Planning A, 12,389-79.
Guariso, G., D. Whittington, M. E. Abdel-Samie, and C. Kramer (1980). “A Salt Balance Simulation Model of Lake Nasser.” Water Supply and Manugement, 4,73-80.
High Dam and its Effects, The (1976). Commission of Agricultural Production. Al-Ahram Al-Iktissadi: Al-Ahram Press.
Hall, W. A., W. S. Butcher, and A. Esogbue (1968). “Optimization of the Operation of a Multi-Purpose Reservoir.” Water Resources Research, June, 471-521.
Hufschmidt, M. M., and M. B. Fiering (1966). Simulation Techniques for Design of Water Resource Systems. London: Macmillan.

372 / Geographical Analysis
Hurst, H. E., R. P. Black, and Y. M. Simaika (1966). The Nile Basin, Vol. X : The Maim Nile Prqects. Cairo: General Organization for Government Printing Office.
Khalil, M. B. (1975). “River Regime with Special Reference to River Nile.” Joumul of Hydraulic Research, 13, 149-70.
bucks, D. P. (1976). “Surfacewater Quantity Management Models.” In Systems Approach to Water Management, edited by A. Biswas. New York: American Elsevier.
Maass, A. (1962). Design of Water Resource Systems-“New Techniques for Relating Economic Cbbjectives, Engineering Analysis, and Government Planning.” Cambridge, Mass.: Harvard University Press.
Ministry of Irrigation (1976). “Studies and Researches of Toshka Spillway Project.” Aswan, Egypt. Moharek, I. E. (1975). “Effect of River Nile Structures on Delta Zone.” International Association for the
Physical Sciences of the Ocean General Assembly. Grenoble, France, August 26-September 6. Mohammed, M. (1965). “Expected Degradation Behind the High Dam.” Cairo: Dar Al Maarf Press. Revelle, C., E. Hoeres, and W. Kirby (1969). “The Linear Decision Rule in Reservoir Management and
Design: 1. Development of the Stochastic Model.” Water Resources Research, 5, 767-77. Revelle, C. S., and W. Kirby,{1970). “Linear Decision Rule in Reservoir Management and Design: 2.
Performance Optimization. Water Resources Research, 6, 1033-44. Sail$ N. F., and S. Shalash, (1974). Facts About Degradation and its Problems Downstream of the Aswan
Ilaam. Cairo: Ministry of Irrigation, Department of Hydrology. Simaika, Y. M. (1970). “Degradation of the Nile Bed Due to the Interception of Silt in the High Aswan
Reservoir.” Q. 38, R. 60. International Congress on Large Dams, loth, trans. Montreal. Smith, S. (1978). The Assessment of Surface Area, Siltation and Plant Production of Lake Nasser
iqeserooir. Unpublished Master’s thesis. Ann. Arbor: University of Michigan. Sol~el, M. J. (1975). “Reservoir Management Models.” Water Resources Research, 11, 767-76. Sterling, C. (1971). “The Aswan Disaster.” National Parks Conseroation Magazine, 45, 10.
Todini, E., and P. E. OConnell (eds.) (1979). Hydrological Simulation of Lake Nasser-Volume I-Analysis and Results. IBM Italia Scientific Centers, Institute of Hydrology, U.K.
USSR All-Union, Designing, Surveying, and Research Institute (1977). “Hydroproject.” Measures on Protecting the Rioer Against Pollution-Comprehensioe Scheme of Utilimtion of the Nile Rioer, Moscow: USSR All-Union Designing, Surveying, and Research Institute.
. (1971). “Aswan Dam Looses a Flood of Problems.” Life, February.
Waterbury, J. (1979). Hydropolitics of the Nile Valley. New York: Syracuse University Press. Whittington, D., and K. E. Haynes (1980). “Valuing Water in the Agricultural Environment of Egypt:
Some Estimation and Policy Considerations.” Regional Science Perspectioes, 10, 109-22. Yevdjevich, V. (1965). “Stochastic Problems and Design of Reservoirs.” In Water Research, edited by A.
V. Kneese and V. K. Smith. Baltimore: Johns Hopkins University Press.
Related Documents