1 How you ask the question really matters: A randomized comparison of four questionnaire delivery modes to assess validity and reliability of self-reported socially censured data in rural Zimbabwean youth Thesis submitted in accordance with the requirements of University College London for the degree of Doctor of Philosophy in Public Health Lisa Fox Langhaug 2009

Welcome message from author
This document is posted to help you gain knowledge. Please leave a comment to let me know what you think about it! Share it to your friends and learn new things together.
Transcript
1
How you ask the question really matters:
A randomized comparison of four questionnaire
delivery modes to assess validity and reliability of
self-reported socially censured data
in rural Zimbabwean youth
Thesis submitted in accordance with the requirements of University College London for the degree of Doctor of Philosophy in Public Health
Lisa Fox Langhaug
2009

2
I, Lisa Fox Langhaug, confirm that the work presented in this thesis is my own. Where
information has been derived from other sources, I confirm that this has been indicated in the
thesis.
3
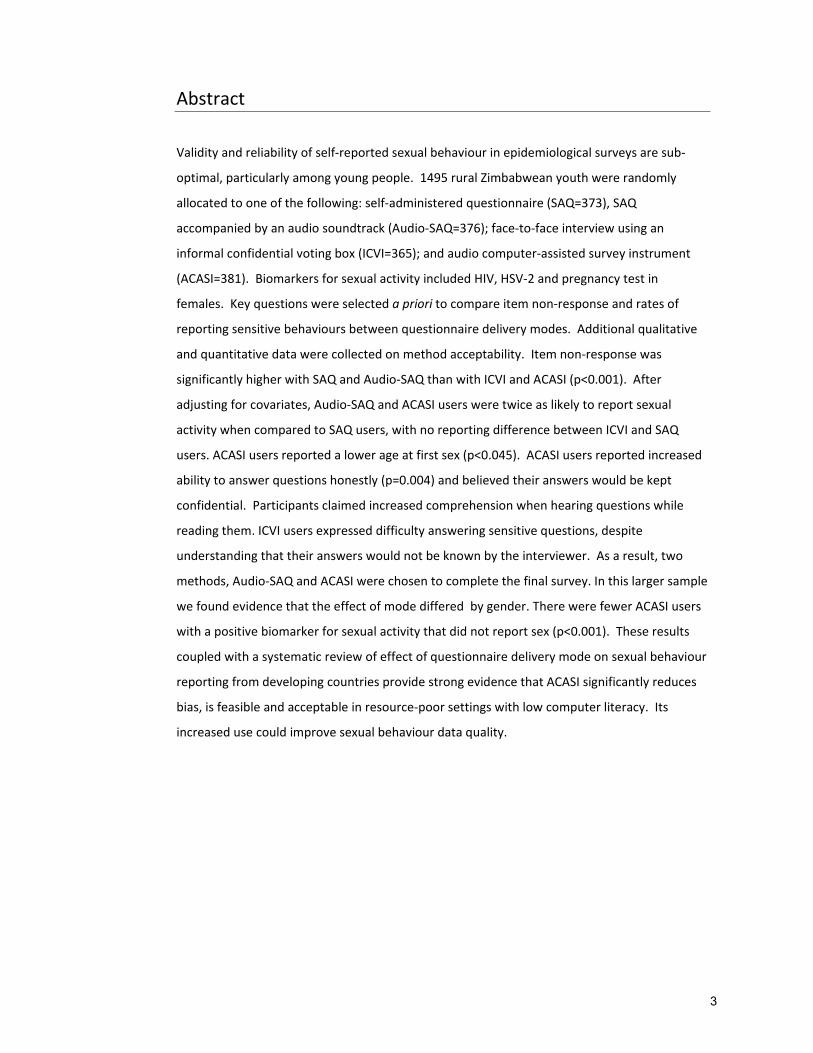
Abstract
Validity and reliability of self‐reported sexual behaviour in epidemiological surveys are sub‐
optimal, particularly among young people. 1495 rural Zimbabwean youth were randomly
allocated to one of the following: self‐administered questionnaire (SAQ=373), SAQ
accompanied by an audio soundtrack (Audio‐SAQ=376); face‐to‐face interview using an
informal confidential voting box (ICVI=365); and audio computer‐assisted survey instrument
(ACASI=381). Biomarkers for sexual activity included HIV, HSV‐2 and pregnancy test in
females. Key questions were selected a priori to compare item non‐response and rates of
reporting sensitive behaviours between questionnaire delivery modes. Additional qualitative
and quantitative data were collected on method acceptability. Item non‐response was
significantly higher with SAQ and Audio‐SAQ than with ICVI and ACASI (p<0.001). After
adjusting for covariates, Audio‐SAQ and ACASI users were twice as likely to report sexual
activity when compared to SAQ users, with no reporting difference between ICVI and SAQ
users. ACASI users reported a lower age at first sex (p<0.045). ACASI users reported increased
ability to answer questions honestly (p=0.004) and believed their answers would be kept
confidential. Participants claimed increased comprehension when hearing questions while
reading them. ICVI users expressed difficulty answering sensitive questions, despite
understanding that their answers would not be known by the interviewer. As a result, two
methods, Audio‐SAQ and ACASI were chosen to complete the final survey. In this larger sample
we found evidence that the effect of mode differed by gender. There were fewer ACASI users
with a positive biomarker for sexual activity that did not report sex (p<0.001). These results
coupled with a systematic review of effect of questionnaire delivery mode on sexual behaviour
reporting from developing countries provide strong evidence that ACASI significantly reduces
bias, is feasible and acceptable in resource‐poor settings with low computer literacy. Its
increased use could improve sexual behaviour data quality.
4
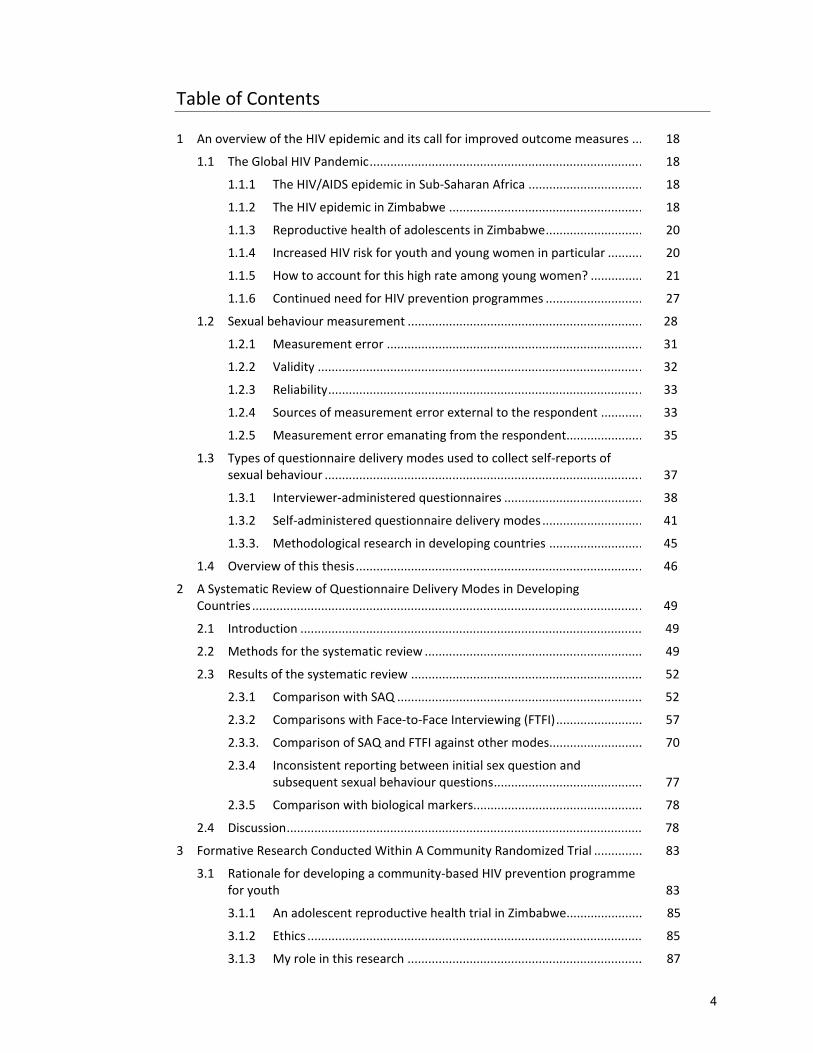
Table of Contents
1 An overview of the HIV epidemic and its call for improved outcome measures ... 18
1.1 The Global HIV Pandemic............................................................................... 18
1.1.1 The HIV/AIDS epidemic in Sub‐Saharan Africa ................................. 18
1.1.2 The HIV epidemic in Zimbabwe ........................................................ 18
1.1.3 Reproductive health of adolescents in Zimbabwe............................ 20
1.1.4 Increased HIV risk for youth and young women in particular .......... 20
1.1.5 How to account for this high rate among young women? ............... 21
1.1.6 Continued need for HIV prevention programmes ............................ 27
1.2 Sexual behaviour measurement .................................................................... 28
1.2.1 Measurement error .......................................................................... 31
1.2.2 Validity .............................................................................................. 32
1.2.3 Reliability........................................................................................... 33
1.2.4 Sources of measurement error external to the respondent ............ 33
1.2.5 Measurement error emanating from the respondent...................... 35
1.3 Types of questionnaire delivery modes used to collect self‐reports of sexual behaviour ............................................................................................ 37
1.3.1 Interviewer‐administered questionnaires ........................................ 38
1.3.2 Self‐administered questionnaire delivery modes ............................. 41
1.3.3. Methodological research in developing countries ........................... 45
1.4 Overview of this thesis................................................................................... 46
2 A Systematic Review of Questionnaire Delivery Modes in Developing Countries ................................................................................................................. 49
2.1 Introduction ................................................................................................... 49
2.2 Methods for the systematic review ............................................................... 49
2.3 Results of the systematic review ................................................................... 52
2.3.1 Comparison with SAQ ....................................................................... 52
2.3.2 Comparisons with Face‐to‐Face Interviewing (FTFI)......................... 57
2.3.3. Comparison of SAQ and FTFI against other modes........................... 70
2.3.4 Inconsistent reporting between initial sex question and subsequent sexual behaviour questions........................................... 77
2.3.5 Comparison with biological markers................................................. 78
2.4 Discussion....................................................................................................... 78
3 Formative Research Conducted Within A Community Randomized Trial .............. 83
3.1 Rationale for developing a community‐based HIV prevention programme for youth 83
3.1.1 An adolescent reproductive health trial in Zimbabwe...................... 85
3.1.2 Ethics ................................................................................................. 85
3.1.3 My role in this research .................................................................... 87
5
3.2 Formative research in the feasibility study.................................................... 87
3.2.1 Questionnaire development and design........................................... 88
3.2.2 Feasibility Study Methods................................................................. 88
3.2.3 Feasibility Study Results.................................................................... 89
3.2.4 Implications of these results for the parent trial design.................... 90
3.3. Overview of the RDS parent trial design........................................................ 90 3.3.1 Regai Dzive Shiri Intervention .......................................................... 92 3.3.2 Regai Dzive Shiri community selection, mobilization, and
randomization 93 3.3.3 The baseline survey of the trial cohort ............................................ 93 3.4 Use of Interim Survey to compare four Questionnaire Delivery Modes ....... 1024 Methods for the Regai Dzive Shiri Interim Survey Comparing Four
Questionnaire Delivery Modes ................................................................................ 105 4.1 Questionnaire Design..................................................................................... 106 4.1.1 Orphaning ........................................................................................ 108 4.1.2 Poverty ............................................................................................. 108 4.1.3 Psychological Well Being: the Shona Symptom Questionnaire ....... 109 4.1.4 Stigma ............................................................................................. 109 4.1.5 Caregiver Support: the Parent Bonding Instrument ....................... 110 4.1.6 Mobility ........................................................................................... 110 4.1.7 Alcohol and Drug Use...................................................................... 111 4.1.8 Sexual Behaviour............................................................................. 111 4.1.9 Gender Relations Scales.................................................................. 114 4.1.10 STI Diagnosis and Treatment ........................................................... 114 4.2 Development of Four Questionnaire Delivery Modes ................................... 114 4.2.1 Summary of Four Questionnaire Delivery Modes ........................... 114 4.2.2 Randomization to One of Four Questionnaire Delivery Modes
and Questionnaire Completion........................................................ 117 4.2.3. Issues Pertaining to the Audio Recording for Audio‐SAQ and
ACASI ................................................................................................ 117 4.2.4 The Initial Sexual Behaviour Question ............................................. 119 4.2.5 Instructions and Practice ................................................................. 121 4.2.6 Differences Between Questionnaire Delivery Modes...................... 121 4.2.7 Variations in Skip Patterns Across Questionnaire Delivery
Modes .............................................................................................. 121 4.3 Preparatory work leading up to the Implementation of the Interim
Survey............................................................................................................. 121 4.3.1 Study Population.............................................................................. 122 4.3.2 Sample Size Considerations ............................................................. 122 4.3.3 Survey Site Selection........................................................................ 123 4.3.4 Letters of Invitation.......................................................................... 124 4.3.5 Survey Team Training....................................................................... 124 4.4 Methods for the Interim Survey .................................................................... 125 4.4.1 Identification, Registration, and Consent ........................................ 125 4.4.2 Collection and Testing of Biological Samples................................... 126 4.5 Statistical Analysis Plan .................................................................................. 126
6
4.5.1 Data Handling................................................................................... 126 4.5.2 Statistical Analysis for A Priori Questions ........................................ 127 4.5.3 Analysis of Skip Patterns .................................................................. 128 4.5.4 Comparisons with Biological Markers.............................................. 128 4.5.5 Internal Comparisons Between Round 1 and Round 2.................... 128 4.5.6 Time to Completion of Questionnaire ............................................. 129 4.5.7 Self‐reported Honesty...................................................................... 129 4.5.8 Statistical Analysis for Other Sensitive Questions ........................... 129 4.6 Summary ........................................................................................................ 1295 Experimental Results from the QDM Trial Nested Within the Regai Dzive Shiri
Interim Survey Comparing Four Questionnaire Delivery Modes.............................131
5.1 Analysis and effects of clustering.................................................................... 131 5.2 Demographic data........................................................................................... 131 5.2.1 Comparison of completion times by questionnaire delivery mode.... 133 5.3 Comparison of item response rates of pre‐specified sexual behaviours by
questionnaire delivery mode ..........................................................................133
5.4 Comparison of response rates of pre‐specified sexual behaviour questions.........................................................................................................
134
5.4.1 Difference between response to questions answered in Round 1 and Round 2 ........................................................................................
134
5.5 Comparison of self‐reported sexual behaviours with biomarkers of sexual activity.............................................................................................................
137
5.6 Results from additional sensitive and socially censured questions................ 138 5.6.1 Skip patterns ....................................................................................... 138 5.6.2 The value of asking a sensitive question a second time ..................... 139 5.6.3 Additional sensitive questions ............................................................ 140 5.6.4 Psychological well being: the Shona Symptom Questionnaire........... 140 5.6.5 Poverty ................................................................................................ 143 5.6.6 Orphaning ........................................................................................... 145 5.6.7 Alcohol and Drug Abuse...................................................................... 147 5.6.8 Circumcision........................................................................................ 147
5.6.9 Self‐reported honesty ......................................................................... 148 5.7 Summary ......................................................................................................... 1486 Additional results from the RDS Interim Survey Comparing Four Questionnaire
Delivery Modes ........................................................................................................ 150 6.1 Methods .......................................................................................................... 150 6.1.1 Quantitative Anonymous Post Survey Questionnaire ........................ 150 6.1.2 Qualitative Data Collection ................................................................. 150 6.2 Post Survey questionnaire results................................................................... 151 6.2.1 Survey environment............................................................................ 151 6.2.2 Survey environment, feasibility, and acceptability of
questionnaire delivery modes ............................................................ 152 6.2.3 Relationship between maintaining confidentiality at baseline and
belief in this at interim........................................................................ 152 6.3 Qualitative Data Results.................................................................................. 154 6.3.1 Comparisons with baseline survey environment between
anonymous post‐survey questionnaire and the qualitative interviews............................................................................................ 154
7
6.3.2 Ability to sue the questionnaire delivery mode.................................. 156 6.3.3 The novelty of ACASI ........................................................................... 156 6.3.4 Increased sense of privacy with ACASI ............................................... 157 6.3.5 Use of a voice increases comprehension............................................ 157 6.3.6 Ability to report on other sensitive issues .......................................... 158 6.4 Summary ......................................................................................................... 1597 Use of Final Survey to Compare Two Questionnaire Delivery Modes..................... 160 7.1 Criteria used to inform the questionnaire delivery mode for final survey ..... 160 7.2 Questionnaire development for the final survey............................................ 162 7.2.1 Questionnaire adaptation for final survey.......................................... 162 7.2.2 Comparisons of sexual behaviour questions ...................................... 162 7.2.3 Comparisons of questionnaire acceptability and reported honesty .. 163 7.2.4 Inconsistent reporting......................................................................... 163 7.2.5 Data analysis ....................................................................................... 164 7.2.6 Study population for the RDS final survey .......................................... 169 7.3 Results ............................................................................................................. 169 7.3.1 Demographic characteristics of final survey respondents.................. 169 7.3.2 Comparison of response rates between Audio‐SAQ and ACASI ......... 170 7.3.3 Comparison of sexual behaviour questions between Audio‐SAQ
and ACASI ............................................................................................ 171 7.3.4 Comparison of biomarkers with self‐reported behaviours................. 173 7.3.5 Comparison around ease of questionnaire completion and
questionnaire comprehension............................................................ 175 7.3.6 Reporting honestly.............................................................................. 175 7.4 Summary ......................................................................................................... 1768 Discussion................................................................................................................. 177 8.1 Summary of thesis........................................................................................... 177 8.2 Validity of self‐reported data.......................................................................... 179 8.3 Cognitive Influences........................................................................................ 179 8.3.1 Recall ................................................................................................... 179 8.3.2 The role of skip patterns ..................................................................... 180 8.3.3 Implications of controlling skips in ACASI ........................................... 182 8.3.4 Terminology and use of an audio component .................................... 182 8.3.5 Level of literacy and its impact on ACASI............................................ 183 8.4 Situational Influences...................................................................................... 185 8.4.1 Privacy ................................................................................................. 186 8.4.2 Confidentiality..................................................................................... 188 8.4.3 Reliability............................................................................................. 192 8.4.4 External Assessment of Validity .......................................................... 195 8.4.5 Summary ............................................................................................. 197 8.5 Strengths ......................................................................................................... 198 8.6 Limitations....................................................................................................... 199 8.6.1 Generalizability of results ................................................................... 200 8.6.2 Need for more research...................................................................... 202 8.7 Conclusion....................................................................................................... 203Bibliography ................................................................................................................ 205
8
Appendices
Appendix A Systematic Review Search Terms........................................................ 232
Appendix B RDS Project Ethics Approvals .............................................................. 234
Appendix C RDS Interim Questionnaire ................................................................. 239
Appendix D RDS Interim ACASI Flow Chart ............................................................ 267
Appendix E RDS Interim Ballot Sheet ..................................................................... 268
Appendix F RDS Interim Welcome & Practice Instructions ................................... 271
Appendix G RDS Interim Survey – Sample Participant Invitation Letter ................ 277
Appendix H RDS Interim Survey‐ Booklet Covers ................................................... 280
Appendix I RDS Interim Survey – Information Sheet & Consent Form ................. 281
Appendix J RDS Interim Survey Method Codes..................................................... 285
Appendix K RDS Post Survey Questionnaire .......................................................... 286
Appendix L RDS Post Survey Interview Topic Guide .............................................. 289
Appendix M Additional Qualitative Quotes............................................................. 293
Appendix N ACASI Practice Instruction................................................................... 296
Appendix O Papers Published................................................................................. 302
9
List of Figures
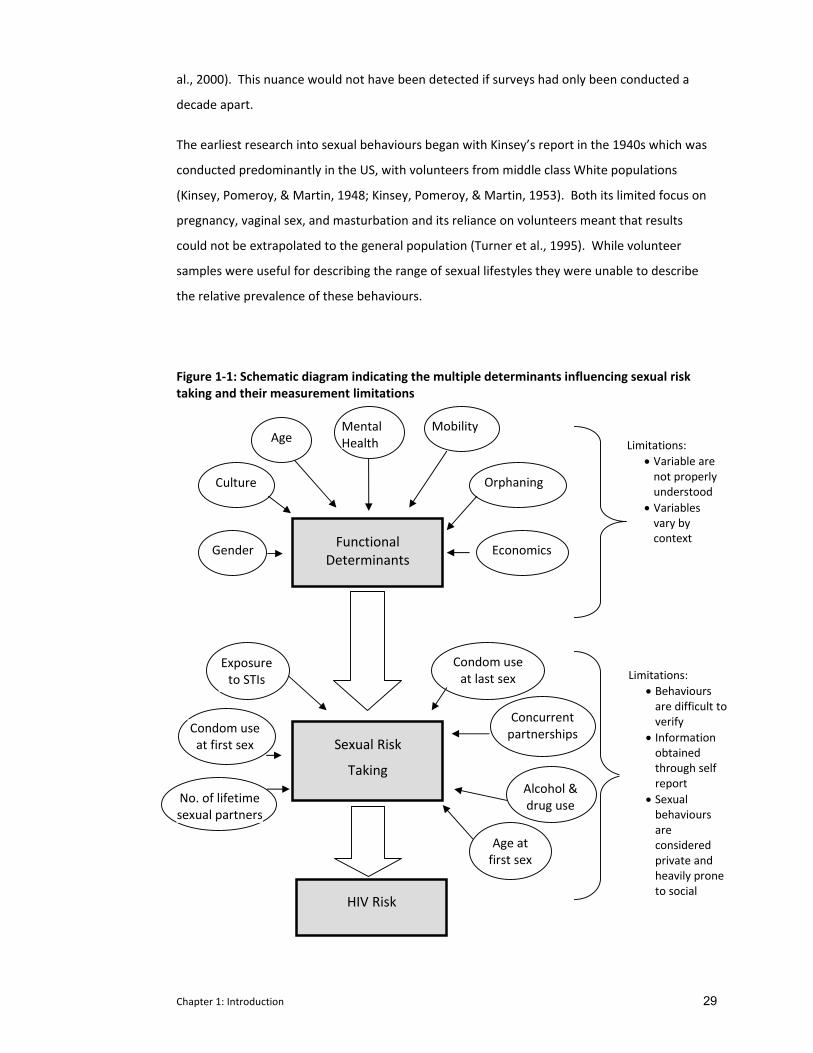
Figure 1‐1 Schematic Diagram Indicating the Multiple Determinants Influencing
Sexual Risk Taking and Their Limitations................................................. 29
Figure 2‐1 Diagram of Systematic Review ................................................................ 53
Figure 2‐2 Comparison of the Timeframe When Research Was Conducted
Against Publications ................................................................................ 54
Figure 3‐1 Overview of the RDS Trial Design............................................................ 86
Figure 3‐2 Map of the RDS Trial Communities ......................................................... 94
Figure 4‐1 Sample Answer Card for Question 52, Males Round 1 ........................... 116
Figure 4‐2 Interim Survey Questionnaire Mode Permutations ............................... 118
Figure 4‐3 Sample of Transcript for One Track of Audio‐SAQ Reading .................... 120
Figure 4‐4 Sample of Question 10 From SAQ. Round 1, Showing Possible Skip
Instructions.............................................................................................. 122
Figure 5‐1 Flow Chart Indication Interim Survey Participation ................................ 132
List of Tables
Table 2‐1 Medline Search Strategy ......................................................................... 51
Table 2‐2 Comparisons with Self‐Administered Questionnaires (SAQ) .................. 55
Table 2‐3 Comparisons with Face‐To‐Face Administered Questionnaires (FTFI) ... 59
Table 2‐4 Multiple Comparisons (SAQ, FTFI, And Others) ...................................... 72
Table 3‐1 Item Response And Answers Recoded by Participants Completing
the Questionnaire in Group (ASCQ) and Tape‐Recorded (Audio‐SAQ)
Settings .................................................................................................... 100
Table 3‐2 Description of Questionnaire Delivery Modes Used in This Evaluation.. 104
Table 4‐1 Summary Of Domains For Interim Survey Questionnaire ....................... 107
Table 4‐2 List of Interim Survey Communities and the Number of Cohort
Members in Each Community by Province and Trial Status.................... 123
Table 4‐3 Field Differentiation of Four Questionnaire Delivery Modes.................. 125
Table 5‐1 Characteristics of Interim Survey Respondents by Questionnaire
Delivery Mode ......................................................................................... 133
Table 5‐2 Non‐Response Rate (95% CI) for Pre‐Specified Sexual Behavior
Questions ib Parallel Group Comparison ................................................ 135
10
Table 5‐3 Reported Prevalence (95% CI) of Pre‐Specified Sexual Behavior
Questions in Parallel Group Comparison ................................................ 136
Table 5‐4 Response Conversions Between Rounds 1 And 2 ................................... 137
Table 5‐5 Proportion of Respondents Who Positively Converted Their Answers
to ‘Ever Had Sex’ Within the Same Questionnaire ................................. 140
Table 5‐6 ICVI Ballot Status for Sensitive Questions ............................................... 140
Table 5‐7 Percentages of Respondents Giving Affirmative Responses to Shona
Symptom Questionnaire ......................................................................... 142
Table 5‐8 Response Rates for Poverty Questions by Questionnaire Delivery
Mode ....................................................................................................... 144
Table 5‐9 Response Rates for Orphan Status by Questionnaire Delivery Mode 146
Table 5‐10 Response Rate for Drug And Alcohol Use by Questionnaire Delivery
Mode ....................................................................................................... 146
Table 6‐1 Anonymous Post Survey Questionnaire.................................................. 153
Table 7‐1 Summary of Advantages and Disadvantages of Methods Evaluated in
the QDM Trial .......................................................................................... 161
Table 7‐2 Questions Compared in Audio‐SAQ And ACASI in RDS Final Survey
Delivery Modes........................................................................................ 165
Table 7‐3 Proportion Reporting Specified Sexual Behaviour Questions
Compared by Questionnaire ................................................................... 172
Table 7‐4 Positive and Negative Conversions from Audio‐SAQ to ACASI for
Sexual Behaviour Questions .................................................................... 174
11
Acknowledgements
For my mother, who would have agreed with Martha Grimes when she wrote "We don't know
who we are until we see what we can do."
There is a Shona proverb which claims that:
If you can walk, you can dance.
If you can talk, you can sing!
… and I would add that if you can write, someone might suggest you pursue a PhD!
They say that part of the process of writing a thesis is that upon its completion, the author
should feel that the product belongs to them, that they ‘own it’. I couldn’t disagree more. At
no point during this process did I ever think that I could have achieved this on my own. While I
take full responsibility for the work presented here, I could not begin to feel that the effort was
solely mine. Academic, moral, and financial support were ever‐present in a number of
individuals.
I would like to start by thanking Dr Frances Cowan who has been more than a supervisor in this
process. I have had the privilege of working with Frances for almost ten years. I continue to
feel honoured to work with her and inspired by the true dedication she shows in conducting
rigorous research that will benefit humanity. I began this endeavour at her suggestion; I never
would have considered undertaking this task without her encouragement and support. And I
would never have finished it without her unerring faith in my abilities. Frances worked
tirelessly to find additional funding that granted me time to devote solely to writing, provided
quick and valuable feedback; without her involvement I am sure I could not have finished this.
Dr Lorraine Sherr kindly agreed to become my second supervisor after this research had
already begun; for this I am deeply indebted as she brought to this enquiry a psychological
perspective that had previously been lacking. I hope that I have done justice to her outlook.
Yin Bun Cheung, for kindly agreeing to take time out of his busy schedule to run the a priori
analysis which provided the core for this thesis but also the motivation – and courage ‐ for me
to examine the data in more depth. Sophie Pascoe who as a colleague held my hand and
patiently (and painstakingly) guided me through many statistical analyses, and as a friend

12
provided constant encouragement as well as a continuous supply of dark chocolate to
Zimbabwe, all of which were wholly appreciated. Sophie, it has been an absolute pleasure
working with you throughout the main trial. Angela Young, the wonderful librarian whom I
met first on‐line and then in person, was a delight to learn from as she assisted me in
structuring the systematic review. I am indebted to Tom Peterman who kindly spoke to me in
between meetings at the ISSTDR conference in 2005 and provided the invaluable suggestion
that we include the same method in the second round of questionnaires.
I am very grateful to Webster Mavhu and the social science team (Petronella Chirawu, Oliver
Gore, Tinoda Katsande, Memory Masiyiwa, Oliver Mutanga) without whom none of the
valuable data garnered from the cognitive interviewing and post survey interviews would have
been collected. Jeffrey Dirawo for his patience in teaching me the finer points of Stata and
Edward Matsikire for listening (intently) and organizing the audio components of the
questionnaires.
During this project, I lived and worked full time in Zimbabwe. In the writing up of this thesis,
there have been a few times when it was necessary to visit UCL to take advantage of resources
on‐site. I am deeply grateful to the generous hospitality of Lynton and Judith Jones and David
Anthony and Liz Harding during my sojourns to London. They graciously opened up their
homes and forgave my horrible manners as I left early each morning and returned late each
evening.
Last but certainly not least, I would also like to thank my partner, Robin Wigmore, for his
absolute trust in my ability throughout this emotional roller coaster ride. My daughter,
Lauren, for understanding that I am a better mother when I can help others. Their
encouragement to finish has been an incredible motivator; thank you both for the extra love
and support you provided when I needed it most. I would like to conclude by thanking all the
young men and women from the study communities who took part in our surveys and shared
intimate aspects of their lives; learning from them continues to be a lesson in humility. I only
hope that this work improves how we continue to learn from you.
13
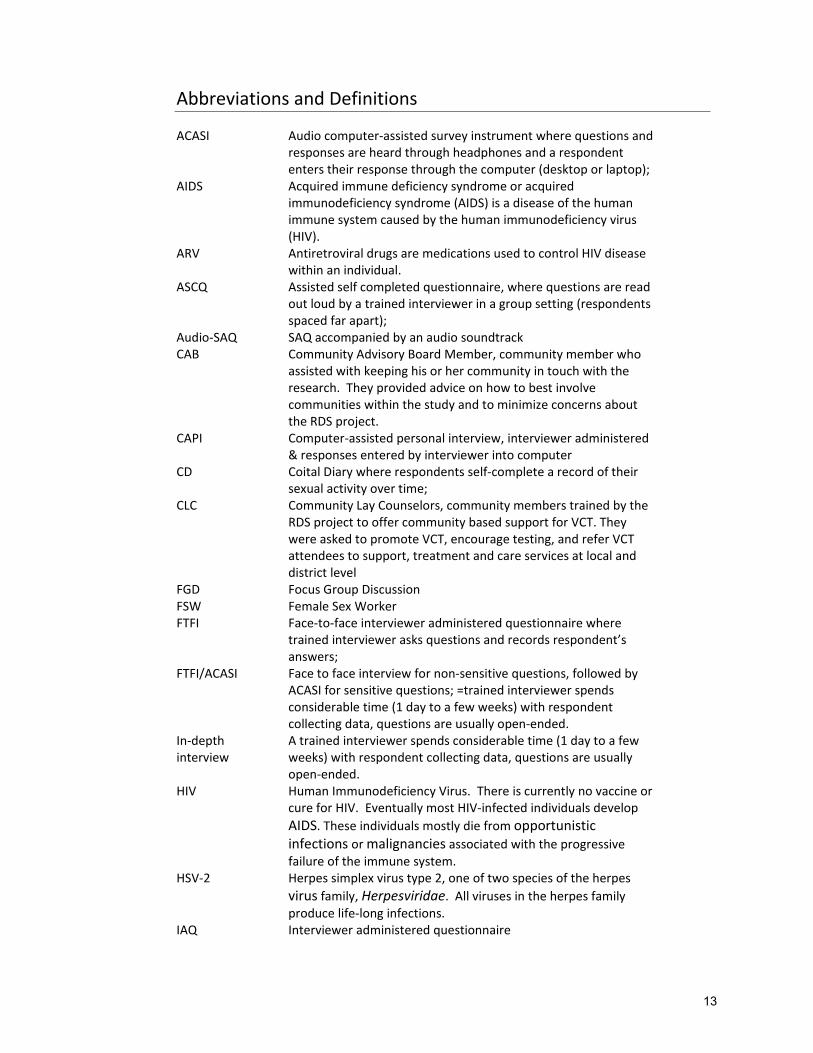
Abbreviations and Definitions
ACASI Audio computer‐assisted survey instrument where questions and responses are heard through headphones and a respondent enters their response through the computer (desktop or laptop);
AIDS Acquired immune deficiency syndrome or acquired immunodeficiency syndrome (AIDS) is a disease of the human immune system caused by the human immunodeficiency virus (HIV).
ARV Antiretroviral drugs are medications used to control HIV disease within an individual.
ASCQ Assisted self completed questionnaire, where questions are read out loud by a trained interviewer in a group setting (respondents spaced far apart);
Audio‐SAQ SAQ accompanied by an audio soundtrack CAB Community Advisory Board Member, community member who
assisted with keeping his or her community in touch with the research. They provided advice on how to best involve communities within the study and to minimize concerns about the RDS project.
CAPI Computer‐assisted personal interview, interviewer administered & responses entered by interviewer into computer
CD Coital Diary where respondents self‐complete a record of their sexual activity over time;
CLC Community Lay Counselors, community members trained by the RDS project to offer community based support for VCT. They were asked to promote VCT, encourage testing, and refer VCT attendees to support, treatment and care services at local and district level
FGD Focus Group Discussion FSW Female Sex Worker FTFI Face‐to‐face interviewer administered questionnaire where
trained interviewer asks questions and records respondent’s answers;
FTFI/ACASI Face to face interview for non‐sensitive questions, followed by ACASI for sensitive questions; =trained interviewer spends considerable time (1 day to a few weeks) with respondent collecting data, questions are usually open‐ended.
In‐depth interview
A trained interviewer spends considerable time (1 day to a few weeks) with respondent collecting data, questions are usually open‐ended.
HIV Human Immunodeficiency Virus. There is currently no vaccine or cure for HIV. Eventually most HIV‐infected individuals develop AIDS. These individuals mostly die from opportunistic infections or malignancies associated with the progressive failure of the immune system.
HSV‐2 Herpes simplex virus type 2, one of two species of the herpes virus family, Herpesviridae. All viruses in the herpes family produce life‐long infections.
IAQ Interviewer administered questionnaire
14
ICVI Iinterviewer controlled voting instrument where sensitive questions are recorded by respondent onto a sheet and placed in locked ballot box.
Interactive interview
FTFI with several audio‐visual aids (5 segment audio drama; male and female dolls, confidential response sheet);
MOHCW Ministry of Health and Child Welfare, Zimbabwe MSM Men having sex with men PASI/Audio‐PASI Palm‐assisted self interviewing which is a derivative of ACASI
using a hand‐held minicomputer or palmtop; PDA/Audio‐PDA Personal digital assistant is a hand‐held computer where
questions and responses are read (and/or heard) and respondents enter responses directly into computer
Phone interview Trained interviewers asks questions over a telephone Phone‐ACASI Survey conducted over the phone using computerized data entry
system (phone keypad used to enter responses QDM trial Questionnaire delivery mode trial ; the experimental evaluation
presented within this thesis. RDS The Regai Dzive Shiri Project. RRT Random response technique: interviewer administered where
respondent is randomly asked either a sensitive question or a non‐sensitive question and the interviewer records the response but does not know which question is being answered
SAQ Self‐Completed Questionnaire using paper and pen UK United Kingdom UNAIDS The Joint United Nations Programme on HIV and AIDS, or
UNAIDS, is the main advocate for accelerated, comprehensive and coordinated global action on the HIV epidemic.
US United States of America VCT Voluntary Counseling and Testing for HIV.
15
Executive Summary
This thesis reports on the results of a randomised trial which compared the reliability and
validity of sexual behaviour data collected from young Zimbabweans using four questionnaire
delivery methods. This trial was nested within a larger cluster randomised trial designed to test
the effectiveness of an adolescent HIV and reproductive health intervention to prevent HIV,
HSV2, pregnancy and unsafe sexual behaviour that was conducted in rural Zimbabwe between
2003‐2007.
In the first chapter, I describe the extent and correlates of the HIV epidemic, particularly as it
relates to young people in Southern Africa, the region most severely affected by the global
pandemic. Within this region, the majority of HIV is transmitted sexually, which puts young
people, who often become sexually active during their adolescent years (either willingly or
unwillingly), at the forefront of the epidemic. Sexual behaviours are heavily influenced by
cultural norms, deviance from which can be heavily penalised.
With the onset of the HIV epidemic, the need to maximise the validity of sexual behaviour data
has become increasingly recognised. Measuring sexual behaviours becomes problematic
because strong pressure to conform to these societal norms results in self‐reports being biased
specifically in relation to social desirability bias. This is particularly problematic in young
people, in part because society holds ‘even stronger’ views about what sexual behaviours (if
any) are acceptable and unacceptable for young people than it does for adults.
The ensuing under‐reporting of sexual behaviours renders it difficult to interpret trends in HIV
prevalence/incidence in this age group, to design appropriate behavioural interventions and to
interpret their effects. This requires greater attention be given to improving measurement
techniques. The scope for change is vast and ranges from questionnaire wording, ensuring
privacy and confidentiality, to improving questionnaire delivery modes. Traditionally, the field
has relied on interviewer‐administered questionnaires to collect self‐reported sexual
behaviour information. Increased concern for improved validity prompted researchers to
begin improving and exploring alternative questionnaire delivery modes. This picture has been
most radically transformed with the recent advent of computer programming in questionnaire
design.
Unfortunately, while considerable research has occurred in industrialised countries much less
comparative work has occurred in developing countries and in particular, among young people
where the disease burden is greatest. At the time this experimental evaluation was designed,
16
published research in this area was relatively sparse. In the second chapter, I report on the
results of a systematic review which I conducted to explore the relative advantages and
disadvantages of different questionnaire delivery modes on reporting of sexual behaviour in
developing country settings. While this review was initiated during this thesis’ formative work,
much of this data was not available at the time this thesis was initiated in 2004. Of the 28
publications reviewed, seven were published before 2004 and five in 2004. All 12 of these
early studies focussed on improvements to interviewer‐administered questionnaires or coital
diaries; at the time the research for this thesis was begun, there were no published
comparative studies on computer self‐administered questionnaires outside North America and
Western Europe. However, during the course of this research, conducted between 2005 and
2008, 16 studies were published, only three of which did not compare a computer‐
administered mode. This suggests the timely nature of this work.
In the third chapter, I provide an overview of the Regai Dzive Trial within which the work for
this thesis, a randomized comparison of questionnaire delivery modes, was nested. In the
formative work for this trial, I explored the nature of sexual behaviour reporting, quantifying
its inconsistencies in two surveys (the feasibility study and the baseline survey). One
important conclusion from the preparatory work for this trial was the considerable
underreporting of sexual behaviour, particularly by young girls. Given the dearth of
information on questionnaire delivery modes amongst youth outside North America and
Western Europe available at the time, direct involvement in this initial research was
instrumental in the development (including the choice of modes) of the random comparison.
The subsequent three chapters (chapters 4, 5, and 6) outline the methodology and
quantitative and qualitative results of this experimental evaluation. Comparison of item
response rates and rates of reporting risky sexual behaviours amongst the four questionnaire
delivery modes was supplemented by biomarker evidence of sexual activity used to examine
the validity of these self‐reports. Internal comparison within the questionnaires and between
two rounds of the same questionnaire strengthened mode assessment. Finally post‐survey
questionnaires and qualitative interviews provided additional information on each mode’s
acceptability and feasibility.
Taken in its entirety, all of this information, including the quantitative assessments between
the four modes, coupled with the rates of responses between the two questionnaire rounds
and against biomarkers, all supplemented by the analysis on mode acceptability, was applied
holistically to determine the questionnaire delivery modes employed in the final evaluation
survey of the parent trial. In chapter 7 I took advantage of the decision to use two modes to
17
conduct some additional comparative analysis on sexual behaviours. I used the opportunity to
further explore issues of self‐reported reliability; given a large sample size and a higher
prevalence of biomarkers, I was able to report on differences by gender and compare self‐
reported response rates against biomarkers.
I conclude in chapter 8 with an analysis of these findings and how they relate to the broader
context of sexual behavioural research in developing countries. This research strongly
supports evidence that misreporting of sensitive questions in young people is situational and,
as such, affected by questionnaire delivery mode. In particular I emphasize a need for a
paradigm shift away from our traditional reliance on interview‐administered questionnaires to
self‐administered ones, while retaining an oral component which remains essential to this
setting where the terms for sexual behaviours are not well recognized and literacy can be less
than optimal. I also encourage researchers to re‐examine their reluctance to conduct
comparative research within a trial setting. This shift is supported by the recent expansion in
comparative research in resource poor settings where increased reporting of sexual
behaviours repeatedly occurs in self‐administered questionnaires, most often in computer‐
administered ones. Coupled with the evidence collected within this experimental evaluation,
which supports the data from the review, and given the continued urgency for improved
understanding of the behaviours driving the epidemic, this new information should goad us
into reconsidering our old habits.
Chapter 1: Introduction 18
1 AN OVERVIEW OF THE HIV EPIDEMIC AND ITS CALL FOR IMPROVED
OUTCOME MEASURES.
1.1 The Global HIV Pandemic
Almost 30 years after its discovery, the HIV pandemic remains the most serious of infectious
disease challenges for public health. As of December 2007, there were 33.2 million people
globally living with HIV, an estimated 2.5 million of which were new infections in that year
(UNAIDS, 2008). This translates to 6800 people becoming newly infected every day across the
globe (UNAIDS, 2008). Young people remain disproportionately affected with around 45% of
new infections occurring among 15‐24 year olds (UNAIDS, 2006). However youth hold
tremendous potential for change. As sexual behaviours begin in adolescence, there are
enormous possibilities to instil new healthier sexual lifestyles in future generations of
adolescents (Harrison, 2005; Fortenberry, 2009; UNAIDS Interagency Task Team on Young
People, 2006)
1.1.1 The HIV/AIDS epidemic in Sub‐Saharan Africa
Sub‐Saharan Africa is the worst affected region, with more than two‐thirds (68%) of all HIV
positive people living there. This includes over six million HIV positive young people, 76% of
whom are female. In 2007, more than three‐quarters (76%) of all the AIDS deaths globally
occurred in sub‐Saharan Africa, making AIDS the leading cause of death in this region (UNAIDS,
2008). Moreover, within sub‐Saharan Africa, it is the 12 countries in southern Africa which
continue to bear the brunt of the disease and are the epicentre of the epidemic (Stirling, Rees,
Kasedde, & Hankins, 2008). Southern Africa accounted for 35% of all people living with HIV
and more than one‐third (35%) of all new infections in 2007. Nine of the twelve countries
have the highest HIV prevalence rates in the world with HIV prevalence rates of over 12%
among individuals aged 15‐49 years (Stirling et al., 2008; UNAIDS, 2008). These countries are
all experiencing generalized epidemics sustained within the general population (UNAIDS,
2008).
1.1.2 The HIV Epidemic in Zimbabwe
Zimbabwe, one of the countries in southern Africa, has one of the largest and most sustained
HIV epidemics in the world, with the first case of infection diagnosed in 1985. Within five
years, antenatal surveillance demonstrated that 10% of clinic attendees were infected. By
1998, prevalence rates in this population had reached 35% (Zimbabwe Ministry of Health,
2007). The first national estimate, produced in 2003, found 24.6% (95% CI 20‐28%) of all
Chapter 1: Introduction 19
adults 15‐49 years were HIV positive (Mahomva et al., 2006). While this peaked in 2001 at
33.7%, the most recent surveillance data indicate that 15.6% (95% CI 14.0‐16.3) of
Zimbabweans aged 15‐49 are infected nationally (Zimbabwe Ministry of Health, 2007). This
translates to more than one in seven Zimbabweans living with the disease. These very high
HIV prevalence rates have been accompanied by severe impacts on morbidity and mortality,
which strain the social fabric of the country (Foster, 2006; Foster, 2002). Over 2200 adults and
240 children (aged 0‐14 years) die each week (Zimbabwe Ministry of Health, 2007). As a result
of the epidemic, life expectancy has dropped from 62 years in 1990 to 33 years in 2006
(Makwiza et al., 2006). Data from the most recent Zimbabwe DHS conducted in 2005‐2006
calculates that one quarter of children under the age of 18 are orphans, 77% of whom are
orphaned as a result of one or both parents having died of AIDS (Central Statistical Office &
Macro International Inc., 2007). Rates of orphaning have more than doubled in the past ten
years; in 1994, 9% of children were orphaned (Central Statistical Office et al., 2007). In 2003,
baseline survey data from a community randomized trial in rural Zimbabwean youth found
that 35% of a school‐going cohort were orphans who were at an increased risk for HIV
(AOR=3.4; 95% CI 1.9‐6.1, p<0.001) (Cowan et al., 2008).
1.1.2.1 Rates of HIV infection starting to fall in Zimbabwe
Despite the severity of the HIV epidemic in Zimbabwe, there is encouraging evidence that the
prevalence of infection is starting to fall. Data collected through the national antenatal
surveillance program found 32.1% of women aged 15‐44 were infected in 2000 declining to
23.9% in 2004 (p<0.001) (Mahomva et al., 2006). Among 15‐19 year olds, prevalence fell from
24.9% to 13.7% over that same period (Mahomva et al., 2006).
There is some evidence to suggest that the decline in HIV prevalence reported in Zimbabwe
and elsewhere is in part due to behaviour change in young people (Mahomva et al., 2006)
(Gregson et al., 2006). Earlier reports of declines from Uganda were treated with caution
when two studies reported declines in HIV prevalence without attendant declines in HIV
incidence (Wawer et al., 1997; Kamali et al., 2000). However, a large community‐based study
(the Manicaland study) which has followed a cohort of rural Zimbabweans since 1998 has
demonstrated declining HIV prevalence and incidence coupled with evidence of recent
behaviour change, notably delay in sexual debut and reduction in number of non‐regular
partnerships (Gregson et al., 2006). Prevalence of HIV in 17‐24 year old men fell from 4.9% to
2.7% (age adjusted OR 0.55 p=0.002) and from 15.9% to 7.9% in 15‐24 year old women (age
adjusted OR 0.51 p<0.001) between 1998‐2000 and 2001‐2003 (Gregson et al., 2006).
Chapter 1: Introduction 20
This evidence was strengthened in a review from Mahomva et al. which compiled data from
Zimbabwe antenatal clinic surveillance as well as several general population and smaller
studies which confirmed a decline in HIV prevalence and reported sexual behaviours among
young people (Mahomva et al., 2006). In particular there was a reduction in reported onset of
sexual experience before age 15 in youth aged 15‐19 years. As in Gregson’s data there was
also a reduction in the reporting of non‐regular sexual partners in youth aged 15‐29 years
(Mahomva et al., 2006). The strength of these combined data provides increased confidence
that behaviour change has occurred. Other evidence from the region supports youth as being
most likely to be amenable to change (Pettifor et al., 2005a; Jackson et al., 1999; Whitworth et
al., 2002; Fylkesnes et al., 2001). In addition, mathematical modelling also suggests that the
observed decline in HIV prevalence cannot be solely attributed to natural disease progression
(Hallett et al., 2006).
1.1.3 Reproductive health of adolescents in Africa
Within the life cycle, adolescence is a powerfully transformative stage characterised by
physical and emotional changes (Hazen, Schlozman, & Beresin, 2008; Harrison, 2005; Mshana
et al., 2006). As young people move through this time becoming more independent,
experimentation, including sexual experimentation, plays a central role. Moreover, as the
period between puberty and marriage lengthens this has also lead to more opportunities for
multiple sexual partnerships. (Harrison, 2005; Haram, 2005; Blanc & Way, 1998)
1.1.4 Increased HIV risk for youth and young women in particular
While this recent decline in Zimbabwe is encouraging, rates of infection remain unacceptably
high. In particular, young women remain at greatly increased risk of infection when compared
to young men. Studies across southern Africa indicate that HIV prevalence peaks in young
women at a lower age and at a higher level than in their male peers (Gregson & Garnett, 2000;
Glynn et al., 2001; Laga, Schwartlander, Pisani, Salif Sow, & Carael, 2001; Gregson et al., 2002a;
MacPhail, Williams, & Campbell, 2002;Gouws, Stanecki, Lyerla, & Ghys, 2008). Young women
aged 15‐24 are three to six times more likely to be at risk of HIV infection than their male
counterparts (Pettifor et al., 2005b; Leclerc‐Madlala, 2008; Auvert et al., 2001; Jewkes et al.,
2008; Pascoe et al., 2007). Data from a nationally representative sample of youth conducted
in Zimbabwe in 2001 found sexually experienced females and males aged 15‐19 had HIV
prevalence rates of 11.0% and 2.0% respectively (Ministry of Health & Child Welfare
(Zimbabwe), Zimbabwe National Family Planning Council, National AIDS Council (Zimbabwe), &
U.S.Centers for Disease Control and Prevention, 2004). HIV prevalence in females aged 20‐24
rose to 26% peaking in females aged 25‐29 at 35%; males had prevalence of 9% and 24% for
Chapter 1: Introduction 21
these two age groups respectively; note that at 25‐29 years, male prevalence was similar to
prevalence rates of females five years their junior (Ministry of Health & Child Welfare
(Zimbabwe) et al., 2004). In a representative population‐based survey carried out in 2006
among youth aged 18‐21 years in three provinces in south‐eastern Zimbabwe, risk of HIV was
five times higher in 21 year old females than it was in 18 year olds (17% c.v. 3%) (Pascoe et al.,
2007). While 18 year old males had a similar prevalence to females, the absolute increase over
the subsequent 4 years was much smaller at 4.2%. (Pascoe et al., 2007).
These data from Zimbabwe corroborate other data within the region. In a study among youth
aged 14‐24 in a mining town (Carletonville) in South Africa in 1999, HIV prevalence was 9.4%
for men and 34.4% for women (Auvert et al., 2001). Moreover, rates of infection in young
women more than quadrupled between 15 and 24 years. Rates of infection were 6.1% for
females aged 14‐15 but reached 66.7% by the time they were 24 years of age. Similar
disparities were also found by Pettifor et al. in a nationally representative study in South Africa
in 2003 (Pettifor et al., 2005b). HIV prevalence among 15‐19 year old females was 11.9% (95%
CI 10.0‐14.1), more than twice that of their male peers (4.6%; 95% CI 3.4‐6.2). Rates among
women aged 20‐24 years rose to 30.7% (95% CI 27.2‐34.4) (Pettifor et al., 2005a). This gender
disparity in young people is reflected in other studies and countries in southern Africa (Haram,
2005; Stirling et al., 2008). Data from the Stepping Stones trial in South Africa indicated that
young women had an annual HIV incidence exceeding six percent (Jewkes et al., 2008). HIV
prevalence in Malawi and Swaziland among males aged 15‐24 years is 2% and 4% respectively,
whereas with females in the same age group their prevalence is 9% and 22% respectively
(Stirling et al., 2008). In Tanzania, among 15‐19 year olds, 4.8% of young women versus 1.5%
of young men were HIV infected (Haram, 2005). This pattern is emulated in the next age
group, where among 20‐24 year olds, 17.9% of women versus 7.7% of men were found to be
HIV positive.
1.1.5 How to account for this high rate among young women?
This gender disparity among young people has received wide attention. In 2005, the United
Nation’s Secretary General’s Force on Women, Girls and HIV prioritized the importance of
prevention among young women and girls in southern Africa (Stirling et al., 2008). Young
women’s increased risk was originally attributed to their earlier age of sexual debut, a greater
number of partners and riskier sexual behaviours. However evidence from existing research
disputes these early assumptions. Young women begin sexual activity at the same time as
their male peers. Data from across the region suggest that a substantial proportion of young
people aged 15‐24 report being sexually active (Jewkes et al., 2008; Auvert et al., 2001;
Chapter 1: Introduction 22
Ministry of Health & Child Welfare (Zimbabwe) et al., 2004; Pettifor et al., 2005b). Half of the
men (52.3%) and women (53.6%) aged 15‐19 years reported being sexually active in a national
survey in South Africa (Pettifor et al., 2005b). In another community‐based sample in South
Africa, over 90% of young people aged 15‐23 reported having ever had sex (Jewkes et al.,
2008). In Zimbabwe, just over 30% of 15‐19 year old youth reported being sexual active,
increasing to over 75% in youth aged 20‐24 years (Ministry of Health & Child Welfare
(Zimbabwe) et al., 2004). In this survey and the one in Carletonville, South Africa, the majority
of youth had experienced their first sex before they were married (Auvert et al., 2001; Ministry
of Health & Child Welfare (Zimbabwe) et al., 2004).
There is strong evidence that having multiple partners puts you at increased risk of HIV.
Analysis by Pettifor et al. found that if a young person reported more than one lifetime partner
they were two times more likely to be infected than those reporting one partner (AOR 1.98;
95% CI 1.55‐2.53) (Pettifor et al., 2005b). For each additional partner, their risk of HIV
increased by 1.04 (95% CI 1.01‐1.34; p=0.003) (Pettifor et al., 2005b). In Uganda, youth aged
13‐19 who reported two to four lifetime partners were three times as likely to be infected with
HIV than those who reported one partner (AOR 3.0; 95% CI 1.3‐6.7) (Carpenter et al., 2002).
However, despite the increased risk of HIV with greater numbers of partnerships, male youth
across the region report more partnerships than their female peers but remain with lower
rates of infection. In South Africa, mean lifetime partners in females aged 15‐24 was 1.8
compared with males who reported a mean of four (p<0.05) (Pettifor et al., 2005a). In another
study in South Africa, 9.4% (95% CI 7.9‐11.0) of females compared with 46.4% (95% CI 43.7‐
49.1) of males aged 13‐24 reported more than two partners in the past 12 months (Jewkes et
al., 2008). In Zimbabwe, 5.0% of males compared with 1.1% of females aged 15‐19 years
reported four lifetime partners (Ministry of Health & Child Welfare (Zimbabwe) et al., 2004).
Despite the possibility of young women underreporting their multiple partnerships, their risks
of infection remain greater.
However, even with fewer reported sexual partnerships, young women remain at higher risk
within those partnerships. In Carletonville youth, HIV prevalence was 56.0% among female
youth who reported three or more partners, compared with 18.8% of male youth who
reported 8 to 10 partners (Auvert et al., 2001). Increased research in this arena provides
compelling evidence that young women’s increased risk is more complex and is determined by
both biological and socio‐economic factors. These include biological vulnerability, STI co‐
infections, gender sexual violence, particularly at the onset of sexual debut, age disparity of
sexual partnerships, and concurrent partnerships.
Chapter 1: Introduction 23
The biological immaturity of a young woman’s genital tract and cervix, made more vulnerable
by possible trauma during sexual activity, increases a young woman’s chance of acquiring a
sexually transmitted infection (Harrison, 2005; Leclerc‐Madlala, 2008; Kristensen, Sinkala, &
Vermund, 2002; Andersson, Cockcroft, & Shea, 2008). There is substantial evidence from
incidence studies to support the findings that STIs, particularly Herpes Simplex Virus type 2
(HSV‐2) make an individual more susceptible to HIV. In a recent meta‐analysis of HSV‐2 and
HIV risk, HSV‐2 was found to be a significant risk factor for HIV acquisition in generalized
populations, providing a three‐fold increased risk of infection (Freeman et al., 2006). In the
Carletonville survey, 17.0% of males aged 14‐24 were HSV‐2 infected compared with 53.3% of
females (Auvert et al., 2001). HSV‐2 prevalence among females also increased steeply with
age; from 18.6% (95% CI 11.4‐25.8) in females aged 14‐15 rising to 94% (95% CI 87.6‐100) by
aged 24 years (Auvert et al., 2001). In this survey, having HSV‐2 was an independent risk factor
for HIV (ORmales=5.3 (95% CI 2.7‐10.3; ORfemales=8.4; 95% CI 4.9 – 14.2) (Auvert et al., 2001).
Pettifor et al. also found a similarly strong association among youth aged 15‐24 (female youth
who reported an unusual discharge AOR=1.75; 95% CI 1.26‐2.44 and males who reported a
genital ulcer in the past 12 months AOR=1.91; 95% CI 1.04‐3.49) (Pettifor et al., 2005b). This
association was also true for N gonorrhoeae (OR 1.96; 95% CI 2.51‐6.15%).
Defined broadly to include sexual and non‐sexual violence, emotional abuse, and child sexual
abuse, Andersson and colleagues reviewed the sizable literature published in peer reviewed
journals and found gender‐based violence is widespread in southern Africa and linked to HIV
infection (Andersson et al., 2008). Moreover, HIV‐positive women report more interpersonal
violence than their non‐infected peers (Haram, 2005). Across eight countries in southern
Africa, they found 18% of women reported intimate partner violence in the past year
(Andersson et al., 2008). Sexual violence often occurs at the time of sexual debut which for
many occurs during adolescence. In the Zimbabwe DHS in 2005‐2006, more than one in five
women reported that their first sexual experience had been forced (Central Statistical Office et
al., 2007). In another survey in Zimbabwe, 23.8% of sexually active women aged 15‐29
reported having been forced to have sex, 19.7% of whom were younger than 16 when it
occurred (Ministry of Health & Child Welfare (Zimbabwe) et al., 2004). In Lesotho 25% of
women aged 18‐35 reported experiencing forced sex (Brown, Thurman, Bloem, & Kendall,
2006). Forty‐four percent described their first sexual experience a result of being tricked
(32.7%), forced (9.7%), or raped (1.4%). In the Carletonville study in South Africa, almost half
of the females (48%) aged 14‐24 reported forced sex (Auvert et al., 2001). In their review,
Andersson et al. found that gender based violence both directly and indirectly contributed to
HIV infection (Andersson et al., 2008). While the trauma of the sexual violence directly
Chapter 1: Introduction 24
impacts on the biological ability of the virus to penetrate the body, more sobering is the reality
that for many survivors the increased feelings of low self‐worth remain with them for a long
time, decreasing their ability to negotiate safer sex and increasing their exposure to sexual risk
behaviours (Andersson et al., 2008). In Kenya, a population‐based survey of young people
aged 10‐24 reported that 21% of females and 11% of males had experienced sexual coercion
where the majority of perpetrators had been intimate partners (Erulkar, 2004). Females who
had ever been married were two times more likely (OR 2.6) to have experienced coercion,
suggesting a high prevalence of coercion within marriage. Males who had been coerced into
sex were significantly more likely (82.9%) to have had a first partner who was older by at least
five years than those who had not (Erulkar, 2004).
Increased quantitative and qualitative research conducted more recently have identified age‐
mixing as another important source of increased HIV prevalence among young women
(Leclerc‐Madlala, 2008; Hallett et al., 2006; Luke, 2003; Luke, 2005; MacPhail et al., 2002).
While young women have limited numbers of partnerships, they are more likely to have
partners who are older than them. Age‐disparity (where a partner is five or more years older)
and intergenerational relationships (when a partner is 10 or more years) are more common
among younger women than men. A review by Luke of more than 45 qualitative and
quantitative studies throughout sub‐Saharan Africa indicated that sexual partnerships between
older men and younger women were common and were associated with unsafe sexual
behaviours and an increased risk of HIV infection (Luke, 2003). Data collected from a
nationally representative sample of 15‐29 year old young people in Zimbabwe indicate that
32.9% of women reported their first partner was 5‐9 years older than them and 11.8%
reported a first partner who was ten or more years older (Ministry of Health & Child Welfare
(Zimbabwe) et al., 2004). The majority of young men (73%) reported partners who were
younger than themselves. Recent work continues to highlight the strength of association
between age‐mixing and HIV prevalence in young women. In South Africa 15‐24 year old
females were more than one and half times more likely to be HIV infected if they reported
their partner was five or more years older when compared against those whose partners were
the same age or younger (Pettifor et al., 2005b) In Zimbabwe in 2005‐2006, HIV infection
among females 15‐24 years was 23.4% for those who reported having a partner 10 or more
years older than them compared to 16.0% for those whose partners were less than 10 years
older (Central Statistical Office et al., 2007). (Note that there were no young men in this age
group who reported their first sexual partner as being ten or more years older than
themselves.) In a study in Manicaland, Zimbabwe, Gregson et al. report that older age of
sexual partners was associated with increased risk of HIV infection (males OR 1.13; 95% CI
Chapter 1: Introduction 25
1.02‐1.25; females OR 1.04; 95% CI 1.01‐1.07) and that young women tend to form
partnerships with men who are five to ten years older than themselves (Gregson et al., 2002a).
In Botswana, Langeni found a 28% increase in the odds of having unprotected sex for every
year of age difference between partners (Langeni, 2007).
The cultural construction and social organization of gender has disempowered women and
girls in many settings, making them vulnerable to HIV. Throughout much of sub‐Saharan Africa
conservative social mores dominate the cultural landscape (Ansell, 2001; Haram, 2005;
Maticka‐Tyndale et al., 2005). Christian churches (predominantly evangelical) promote sexual
abstinence before marriage, do not condone condom use, and in some cases encourage
virginity testing among adolescent girls. Within Shona culture in Zimbabwe there are strong
taboos against women having extra‐marital relationships (Duffy, 2005; Nyanzi, Nyanzi, Wolff, &
Whitworth, 2005; Haram, 2005; Ansell, 2001). Social norms for pre‐marital sexual
relationships are gender specific. While young men are encouraged to be sexually experienced
before marriage, young women are expected to enter marriage as virgins. This gender
disparity is strongly evidenced with regards to unintended pregnancy in adolescence. Schools
often expel girls discovered to be pregnant but generally allow the male student responsible to
continue his education.
Research in Tanzania also highlights the mixed messages given to youth around their emerging
sexuality. Despite acknowledging that sexual activity is inevitable, the cultural framework does
not sanction sexual relationships amongst youth rendering them invisible (Wight et al., 2006;
Haram, 2005). However even within this conservative cultural milieu, normally restrictive
attitudes are relaxed during festivals and village congregations (e.g. funerals) (Wight et al.,
2006). This scenario mimics qualitative data collected in rural Zimbabwe where youth were
found drinking openly at village gatherings which is a behaviour that is not traditionally
sanctioned (unpublished data from Regai Dzive Shiri parent trial).
Mathematical models, which simulate HIV epidemics, indicate that age and sexual mixing, as
well as concurrency are likely to be more important determinants of HIV spread than absolute
number of partners (Hallett et al., 2006; Halperin & Epstein, 2007). Recently epidemiological
evidence has brought to the fore concurrent sexual partnerships as a primary contributor that
can explain the continued rapid spread of HIV infection in southern African countries
compared to the rest of the globe where prevalence has stabilized (Halperin & Epstein, 2004;
Potts et al., 2008). In a WHO study 53%, 18% and 22% of men from Lesotho, Tanzania, and
Zambia (Lusaka) respectively, reported two or more regular ongoing partnerships (lasting over
one year) in the previous 12 months (Halperin et al., 2004). However only 3% and 2% of men
Chapter 1: Introduction 26
in Thailand and Sri Lanka reported similar types of partnerships. This pattern is similar in
women with 39%, 9% and 11% in Lesotho, Tanzania, and Zambia (Lusaka) reporting two or
more regular ongoing partnerships in the past 12 months while their counterparts in Thailand
and Sri Lanka report 0.2% and 1.0% respectively. This occurrence is mirrored in young people;
in the Nelson Mandela survey conducted in South Africa in 2005, 40% of males and 25% of
females aged 15‐24 reported more than one concurrent partner (Halperin et al., 2007). When
compared against serial monogamy, mathematical modelling found HIV transmission created
an epidemic which was ten times greater with long‐term concurrency (Morris & Kretzschmar,
1997). This is primarily a result of the high infectiousness which is so much greater during the
initial weeks and months after infection. In a serial monogamous relationship this high rate of
infectivity remains within the unique partnership but moves rapidly within sexual networks
defined by concurrent partnerships. This rapid spread is compounded by the greater difficulty
men and women have negotiating condom use within these lasting relationships which are
predicated on trust (Haram, 2005; Nyanzi et al., 2005; Gregson et al., 2002a). So while the
number of lifetime partners remains similar in Southern Africa compared to the rest of the
globe, the fact that they occur in parallel renders them much more risky (Halperin et al., 2007).
So while women are at increased biological risk of HIV, this is not the only explanatory factor
that puts them at higher risk. Women are more likely to report socioeconomic factors
including not being in school, increased sexual activity (not necessarily with different partners
and which may not be consensual), less condom use, and having older partners (Pettifor et al.,
2005a). This is supported by others who report that women are at increased risk because of
more frequent sexual activity and inconsistent condom use with older male partners (Gregson
et al., 2002a; MacPhail et al., 2002). Older males are more likely to be HIV infected so these
women are at an increased and consistent risk of HIV infection with these older men having
unprotected sex with them more often than their male peers are having sex.
Behavioural reports and extensive qualitative research reveal that our early assumptions of
women as victims in these partnerships is too simplistic (Leclerc‐Madlala, 2008; Gammeltoft,
2002). The complexity of young women’s reasons for engaging in concurrent partnerships
involving age‐disparate and intergenerational relationships entails material and financial gain
(ranging from school fees and snacks for poor young women to cell phones and social standing
for more affluent young women), increased social power, access to jobs, a desire for love and
affection, attracting a future husband (either the older partner or a younger boyfriend),
increasing their self‐esteem and having fun (Leclerc‐Madlala, 2008; Ansell, 2001; Gregson et
al., 2002a). These relationships are better understood within the cultural context of eastern
and southern African societies which include a patrilineal system that promotes
Chapter 1: Introduction 27
bride‐wealth exchange and polygamy (Duffy, 2005) (Leclerc‐Madlala, 2008; Ansell, 2001) (for
an overview of the colonial input on redefining bride wealth see (Ranchod‐Nilsson, 2001)).
1.1.6 Continued need for HIV prevention programmes
Despite 25 years of research there is still no HIV cure nor a vaccine that can protect us against
it (Jewkes et al., 2008; Padian, Buve, Balkus, Serwadda, & Cates, 2008). And while enormous
progress has been made in the development of antiretroviral drugs (ARVs) which can stem the
onset of AIDS, populations in the most affected areas of the globe are still the least likely to
have access to them. For example, in Zimbabwe, an estimated 340,000 (70,000 of whom are
children) were considered to be in need of antiretroviral treatment in 2006 (this figure peaked
in 2004 at 510,000) (Makwiza et al., 2006). In 2004, the Ministry of Health and Child Welfare
launched its national rollout and by 2007, an estimated 15.7% of those in need of ART were
receiving it (n=102,566) (Zimbabwe Ministry of Health, 2007).
Globally, in 2007, this lack of access to treatments translates to six people becoming newly
infected for everyone started on treatment (UNAIDS, 2007). This has led to a renewed
commitment to the importance of HIV prevention coupled with a reminder that there is no
single global epidemic, but a host of diverse ones (Padian et al., 2008; Wilson & Halperin, 2008;
Asamoah‐Odei, Garcia‐Calleja, & Ties Boerma, 2004). In southern Africa as elsewhere in sub‐
Saharan Africa, HIV continues to be predominantly transmitted through unprotected
penetrative heterosexual intercourse, although there continues to be a dearth of data
regarding the specific mode (vaginal, oral, or anal) of this sexual transmission (UNAIDS
Interagency Task Team on Young People, 2006). While the number of available biological
interventions has increased recently (male condoms, STI treatment, male circumcision, ARV
treatment) they will only achieve success if fully integrated into programmes that include
behavioural and structural components (Padian et al., 2008). Therefore, the bulk of our efforts
to halt the epidemic remain with behavioural interventions that encourage and support an
individual’s ability to decrease risky sexual behaviours while increasing protective ones. The
development of effective interventions to protect the next generation from infection remains
a major public health priority.
Specifically, prevention work with adolescents offers a window of opportunity to increase
reproductive health knowledge, decrease the risk associated with sexual activity and promote
healthy sexual behaviours. Young people are often more open and flexible in their attitudes
than adults, and more willing to give critical consideration to health promotion messages. This
is particularly true of sexually naïve adolescents who are more likely to benefit from health
promotion messages than adults with established patterns of sexual behaviour (Kirby et al.,
Chapter 1: Introduction 28
1994). Our knowledge of the impact of HIV prevention programmes in developing country
settings remains very limited with almost no information of its impact on HIV (Pettifor et al.,
2005a; UNAIDS Interagency Task Team on Young People, 2006).
As is evident from the preceding discussion, being able to explore and describe sexual
behaviour accurately is key to being able to understand the HIV epidemic, develop appropriate
prevention interventions and measure their effectiveness (Turner, Danella, & Rogers, 1995).
The next section explores the role of sexual behavioural measurement within the context of
the HIV epidemic.
1.2 Sexual behaviour measurement
As highlighted above, sexual behaviour is complex and influenced by many factors including
socioeconomic, cultural, biological, and psychological conditions. These determinants affect a
host of risky sexual behaviours (e.g. age‐mixing or having multiple partners coupled with low
or inconsistent condom use) which in turn lead to increased risks of HIV infection. The
relationship between these determinants although recognised is not well understood (Cohen
& Dent, 1992; Carael & Holmes, 2001). Equally frustrating is that the determinants and risky
sexual behaviours cannot be easily externally validated or objectively measured (Kreuter,
Presser, & Tourangeau, 2008; Brener, Billy, & Grady, 2003; Tourangeau & Yan, 2007).
Implicit in the above description of the epidemic is the centrality of gathering information at a
population level to gain a more in‐depth understanding of the relationships between the
determinants of risky sexual behaviours and HIV acquisition through qualitative and
quantitative research (Turner et al., 1995). Without representative data, taken repeatedly, it is
not possible to monitor and understand trends or track the progress of appropriate
interventions (Carballo, Cleland, Carael, & Albrecht, 1989; Padian et al., 2008). The lack of
accurate population level data on sexual behaviour resulted in the early projections of the HIV
epidemic often being wildly inaccurate as a result of inaccurate ‘guestimates’ (Wellings et al.,
2001; Turner et al., 1995). A more recent example of the value of population‐based
information comes from UNAIDS whose global predictions in 2006 for 2007 were reduced by
16% when actual figures were obtained (UNAIDS, 2008). One primary reason for this large
discrepancy (these are global figures so small differences in percentages reflect large
differences in actual numbers) was the result of an intensive exercise to asses India’s epidemic,
a country with a population of 1,097 million (World Health Organization, 2009). Likewise,
analysis from repeated surveys in Zambia spanning 10 years suggested that prevalence
declines in the population had occurred early on but had stagnated more recently (Bloom et
Chapter 1: Introduction 29
al., 2000). This nuance would not have been detected if surveys had only been conducted a
decade apart.
The earliest research into sexual behaviours began with Kinsey’s report in the 1940s which was
conducted predominantly in the US, with volunteers from middle class White populations
(Kinsey, Pomeroy, & Martin, 1948; Kinsey, Pomeroy, & Martin, 1953). Both its limited focus on
pregnancy, vaginal sex, and masturbation and its reliance on volunteers meant that results
could not be extrapolated to the general population (Turner et al., 1995). While volunteer
samples were useful for describing the range of sexual lifestyles they were unable to describe
the relative prevalence of these behaviours.
Figure 1‐1: Schematic diagram indicating the multiple determinants influencing sexual risk taking and their measurement limitations
Functional Determinants
Mental Health
Culture
Age
Economics
Orphaning
Mobility
Gender
Exposure to STIs
Sexual Risk
Taking
Condom use at last sex
Age at first sex
Concurrent partnerships Condom use
at first sex
Alcohol & drug use No. of lifetime
sexual partners
HIV Risk
Limitations:• Variable are not properly understood
• Variables vary by context
Limitations:• Behaviours are difficult to verify
• Information obtained through self report
• Sexual behaviours are considered private and heavily prone to social
Chapter 1: Introduction 30
In the 50 years since Kinsey’s seminal work, researchers have continued to conduct sexual
behavioural surveys and improve the non‐response and reporting errors around these
sensitive questions. In the 1970s, survey research began to focus more on cognitive processes
of the individual respondent (Sudman, Bradburn, & Schwartz, 1996b). However this work was
often conducted in experimental settings within universities and remained unrepresentative
(Turner et al., 1995). With the onset of the HIV epidemic researchers realized how little was
known about sexual behaviours more generally (Martin & Vance, 1984). Two types of
information were vital: i) prevalence and incidence rates to track the epidemic’s expansion at
regional, national, and sub‐population level; ii) behavioural surveys to help us appreciate the
complexities surrounding the risk behaviours driving the epidemic (again at different regional
and population levels). The early 1990s saw the beginnings of larger scale studies that tracked
prevalence and examined behavioural risk factors. These early researchers were also
confronted by others as to the feasibility of conducting sexual behaviour research at a
population level (e.g. Would people volunteer and be truthful about intimate sexual
behaviours? Could these answers be considered scientific measurements?) (Turner et al.,
1995). The first of these that surveyed nationally representative samples took place in the UK
and France (with two smaller population‐specific studies in the US and Europe) (Rogers &
Turner, 1991; Johnson, Wadsworth, Wellings, Bradshaw, & Field, 1992; ACSF investigators,
1992; Sundet, Magnus, Kvalem, Groennesby, & Bakketeig, 1989). These were followed by the
first prevalence surveys in developing countries where it became quickly apparent the extent
of the epidemic lie (Schopper, Doussantousee, & Orav, 1993; Koenig, Jejeebhoy, Singh, &
Sridhar, 1998). Initial prevalence data were collected from pregnant women attending
antenatal clinics. However it was soon evident that this was not the best proxy of population
prevalence (Gregson et al., 2006). Firstly it was quickly understood that HIV positive women
were not as fertile as their negative peers. Secondly, the prevalence rates of older women
who had completed childbearing but were still sexually active could not be established through
these pregnancy clinics. Thirdly, they were not representative of all young sexually active
women, just those that became pregnant. Slowly, developing countries began conducting
population‐based surveys. As seen earlier, the results of Zimbabwe’s first nationally
representative behavioural survey were published in 2003. This was followed by a national
prevalence survey in 2004. In the late 1990s, Demographic Health Surveys, conducted every
decade in the majority of countries around the world, began introducing sexual risk behaviour
questions (Carballo et al., 1989) (Macro International Inc., 2009). As seen in the previous
section, initial information emerging from these larger, more representative surveys provided
an increased recognition that sexual behaviours are not conducted in isolation but take place
within a broader framework of cultural values, economic issues, and gender (in)equity.
Chapter 1: Introduction 31
However, these early surveys also made us increasingly aware that we were still in our infancy
when it came to an in‐depth understanding of sexual behaviours (Martin et al., 1984; Catania,
Gibson, Chitwood, & Coates, 1990; Wellings et al., 2001; Turner et al., 1995). What had been
the sole domain of a small select group of social scientists was suddenly in huge demand as
key areas of inquiry into the understanding of sexual behaviours were expanded. Sexual
behavioural research acknowledged the need for a broader research agenda including an
increase in geographic breadth (minority populations within the US and an increase in global
research), an interest in high risk sub‐populations (e.g. drug injecting populations, migrant
populations, and commercial sex workers), and an expansion of sexual behaviours (e.g. anal
and oral sex) to be examined (Catania et al., 1990; Carballo et al., 1989).
An added measurement challenge surrounds the private aspect of sexual behaviours. As they
cannot ethically be observed directly, it becomes necessary for individuals to self‐report their
sexual experiences. Moreover, while cultural norms may differ around the world, most sexual
behaviours are socially censured, making their reporting difficult for the individual. The strong
pressure to conform to societal norms causes these self‐reports to be fraught with bias
particularly around recall and social desirability (Tourangeau et al., 2007; Brener et al., 2003).
In the early 1990s, Catania and his colleagues published a thoughtful review focussing renewed
attention on the myriad of methodological challenges faced by sexual behavioural researchers
(Catania et al., 1990). Improving measurement was seen as essential in order to fully
understand these sensitive and often culturally censured behaviours. They concluded with a
call for more rigorous research into the assessments of sexual behaviours and emphasized that
the foundation lay in improving the reliability and validity of its measurement.
Clearly understanding and describing sexual behaviour is particularly important for sub‐
Saharan Africa where the majority of HIV transmission is sexually transmitted. Inherent within
this is our understanding of what makes young people particularly vulnerable to HIV.
1.2.1 Measurement error
Accurate measurement is central to our ability to assess the extent of the epidemic and our
appreciation of the risk behaviours and how they drive the epidemic in different sub‐
populations. There are two important considerations when attempting to measure a variable
accurately, its validity and its reliability. Over the past two decades a wide range of studies
have explored the relationship between risky behaviours and their impact on HIV. And in
these diverse studies directed at condom usage, condom negotiations by gender and type of
relationship, couples in discordant relationships (where one person is infected and the other is
Chapter 1: Introduction 32
not), researchers have noted a gap between the validity and reliability of the self‐reported
measure and other outcomes (Gallo et al., 2006; Gallo et al., 2007; Zenilman et al., 1995;
Peterman et al., 2000; Cowan et al., 2002; Cowan et al., 2008; Plummer et al., 2004a; Plummer
et al., 2004b; Hewett et al., 2008; Auvert et al., 2001).
1.2.2 Validity
Validity reflects how accurately a measure records the actual event. Clearly maximizing the
validity of data relating to sexual behaviour and other sensitive information is important.
While improving validity has been of longstanding concern, its gravity was heightened with the
onset of the HIV epidemic.
One way to identify lack of validity in self‐reported sexual behaviours is to compare self‐
reported sexual behaviour with biological markers of sexual activity. While a number of
biological markers exist that can be objectively measured and are themselves associated with
unprotected sexual activity (e.g. presence of sperm using PSA antigen, presence of sexually
transmitted infections using antibodies, and pregnancy tests) some offer limited timeframes or
fail to track past sexual activity (Cowan & Plummer, 2003; Gallo et al., 2006; Gallo et al., 2007).
(Note this dilemma is not limited to sexual behaviours; Murphy et al. report on the inaccuracy
of urine testing for marijuana when respondents are asked about recent drug use. (Murphy,
Durako, Muenz, & Wilson, 2000)). In addition, the relationship between these markers and
behaviour is not absolute (not every act of intercourse results in pregnancy or an STD for
example) (Peterman et al., 2000; Schachter, 2000). Yet, their presence or absence can be used
to strengthen the assessment of self‐reported behavioural risks (MacLachlan et al., 2001). In
particular, their strength is unidirectional offering the ability to compare self‐reports of sexual
behaviour against the presence of biomarkers for sex. However while they might give
evidence of risk, they are not substitutes for measuring behavioural frequencies, partnership
characteristics, and co‐occurrence of behaviours. As shown in the first section of this chapter,
these are critical aspects in our understanding of sexual behaviours and their impact on the
epidemic.
Furthermore, even if validity could be established through biomarkers, accuracy of self‐
reported data is insufficient as researchers need to know not only the magnitude of the
inaccuracy but its likely sources which relies on self‐reported information. As measuring
validity is hindered by the lack of external measures for sexual behaviours, researchers
exploring measurement of social issues are forced to assume that higher prevalence estimates
of sensitive issues are more ’valid’ than lower estimates (Brener et al., 2003; Kreuter et al.,
2008).
Chapter 1: Introduction 33
1.2.3 Reliability
The reliability of a measurement focuses on response consistency: does a respondent whose
actual behaviour has not changed answer a question in the same way over time. And while
reliability is a pre‐requisite for validity, its presence cannot ensure validity. For example,
participants can repeatedly report that they are not sexually active achieving high reliability,
when in fact, the presence of a sexually transmitted infection questions the validity of their
responses.
Reliability can be evaluated using two approaches. The first is to ask a respondent to answer
the same set of questions twice (test‐retest) in two different surveys and compare their
answers. Assuming that the time frame between the two questions is not long enough to have
produced a change in the respondent’s behaviour, a replicable answer in the test‐retest
implies reliability. However, because it is possible for sexual behaviour to change over time,
much debate surrounds what constitutes a ‘reasonable’ gap in time. Researchers try to
achieve a balance between a time frame that is long enough to ensure the respondent has not
re‐answered based on a recollection of their previous answer, but short enough to make it
unlikely that a change in behaviour will have taken place. And because sexual behaviours vary
across sub‐populations, so too does the ‘appropriateness’ of the time frame (e.g. the sexual
behaviour of a 12 year old is less likely to change in a week than for an older adolescent or a
commercial sex worker). Traditionally, researchers have tried to keep the time frame between
three days and two weeks (des Jarlais et al., 1999b; Catania et al., 1990; Carey, Carey, Maisto,
Gordon, & Weinhardt, 2001; Fenton, Johnson, McManus, & Erens, 2001; Vanable et al., 2009).
A second technique to check reliability looks at internal consistency within a questionnaire.
Here, the same set of questions are incorporated within two sections of one questionnaire and
their responses are compared. While this negates the concern about behaviour changing over
time, it offers less control over an individual remembering their previous response.
Cohen’s Kappa is used to measure the agreement between two classificatory variables
adjusting for any agreement that could happen by chance (Murphy et al., 2000). A Kappa of 1
is considered perfect agreement and 0 is agreement that occurs solely by chance. As discussed
above, Kappa requires a narrow time‐frame.
1.2.4 Sources of measurement error external to the respondent
In all research, sampling error is reduced by ensuring that populations at risk have been
accurately represented. Sample sizes also need to be sufficiently large to detect the level of
difference (e.g. change in prevalence) required by the study. Once an appropriate sampling
Chapter 1: Introduction 34
frame has been devised, it remains to ensure that the majority of those invited to participate
do so. Given high levels of discomfort surrounding sexual behaviours, obtaining high response
rates is a constant threat to the representativeness of this type of research.
Apart from errors resulting from poor research design, measurement error can be introduced
into self‐reported sexual behaviour in a number of ways including refusal to report (social
desirability), deliberate under reporting or concealment (social desirability), inaccurate
answers (recall), misunderstanding (question wording), and faulty time references (Carballo et
al., 1989; Fenton et al., 2001). This section briefly outlines various types of measurement
error.
1.2.4.1 Questionnaire construction Sexual behaviours are often not discussed in a public setting. As a result our terminology is
inadequate and often inappropriate (Wellings et al., 2001; Mitchell et al., 2007; Mavhu,
Langhaug, Manyonga, Power, & Cowan, 2008). With the expansion of survey research into
sexual behaviours, it has become increasingly apparent that the terms used to define these
behaviours need to be well understood and similarly understood by all participants. Debate
continues around whether to use informal or colloquial terms to describe sexual behaviours or
to use more formal biological terminology (Ford & Norris, 1991; Wellings et al., 2001). Studies
have found that while it is possible to use colloquial terms with specific populations (Halkitis,
Parsons, & Wilton, 2003; Halkitis, Wilton, & Wolitski, 2005) that when working with the
general population, it is generally more appropriate to use more formal terms (Mitchell et al.,
2007). Even within specific populations, informal terms are sometimes considered
inappropriate. In an article examining the behaviours of gay men, while the term
‘barebacking’ is used in the article to describe unprotected anal intercourse, the questionnaire
used more formal phrasing such as ‘anal sex without a condom’ (Elford, Bolding, Davis, Sherr,
& Hart, 2007). Even when clinical language is more appropriate, language around specific
sensitive behaviours such as anal and oral sex, can remain sensitive (Ford et al., 1991). More
important is the understanding that even standard terms can be differently understood
(Catania, Binson, Canchola, Pollack, & Hauck, 1996). For example, formative research for the
first NATSAL study in the UK, found that married men thought the term ‘sexual partner’ was
too casual to be used as a reference for their wives, while single participants thought the term
implied a steady relationship rather than a casual one (Fenton et al., 2001); Spencer et al.,
1988). A significant minority also failed to understand basic clinical terms such as
heterosexual, penetration, and vaginal (Wellings et al., 2001). Time periods can also be
understood differently. In the Regai Dzive Shiri trial in Zimbabwe, cognitive interviewing with
participants, conducted in preparation for the final survey, highlighted the multiple ways in
Chapter 1: Introduction 35
which ‘in the last year’ was understood (unpublished data). For some it meant starting at the
beginning of the calendar year while for others it meant the 12 months prior to the current
month (e.g. April to April). Qualitative research using cognitive interviews conducted prior to
questionnaire administration can highlight these differences in understanding and ensure all
terms and concepts are properly described and so commonly understood (Mavhu et al., 2008)
(Mitchell et al., 2007; Wellings et al., 2001; Elam & Fenton, 2003).
1.2.5 Measurement error emanating from respondents
While some measurement error is due to poor research design numerous reporting errors are
a result of sexual behaviour being by nature a private activity that is not readily disclosed. Two
main types of reporting bias emanate directly from respondents and contribute to
measurement error. The first is recall bias where, through no fault of the participant, they fail
to recall the information requested. A number of factors can hinder recall in sexual behaviour
research including the frequency of the behaviour and the length of time frame over which
recall is required. Equally critical is social desirability bias where, due to the sensitive or
socially censured nature of the behaviour being researched, participants feel nervous about
revealing their engagement in them.
1.2.5.1 Recall bias Sexual behavioural research commonly asks participants to recall sexual behaviour over a long
period of time (e.g. number of lifetime sexual partnerships). A number of factors influence a
participant’s ability to accurately recall these sensitive behaviours. Incidence (e.g. ‘have you
ever had sex?’) has been found to be easier to recall than the frequency of a sexual behaviour
(e.g. ‘how often have you had sex in the past month?’) (Catania et al., 1990; Wellings et al.,
2001; Fenton et al., 2001). Recalling frequency is improved if questions are focused on people
(e.g. sexual partners) rather than events. Thus participants are generally more accurate in
recalling the numbers of different partners they report than in their number of sexual acts
(Catania et al., 1990). Shorter time frames are also easier to recall than longer time frames
(Lagarde, Enel, & Pison, 1995). However, longer time frames are less problematic if the
questions relate to the occurrence of rare events (e.g. anal versus vaginal sex) which are more
unique and therefore easier to recall. Age at first sex is felt to be recalled relatively accurately
due to the uniqueness of the event. In the first NATSAL, less than 2% of participants couldn’t
recall their age at first sex (Wellings et al., 2001). An exception to this would occur in those
populations less aware of their exact age, a situation that is more common in Africa but less so
in younger populations such as adolescents.
Chapter 1: Introduction 36
Unfortunately, despite the known difficulties of recalling events over longer time frames, this
information is required for sexual behavioural measurement. Seasonal patterns of migration
and limited contacts with higher risk groups (e.g. injecting drug users, commercial sex workers)
might constrain sex to happen in chunks of time. Limiting questions to more recent
timeframes which are easier to recall would fail to pick up on these important sexual patterns
(Carballo et al., 1989).
A number of techniques have been developed to assist participants in recalling their sexual
behaviour, including the use of sexual or coital diaries where data are recorded prospectively
and regularly (Hensel, Fortenberry, Harezlak, Anderson, & Orr, 2004), the time‐follow back
method which uses a specific point in time to assist participants in recalling events (Carey et
al., 2001; Crosby, Stall, Paul, & Barrett, 1996) and the use of a monthly calendar where
participants can record their behaviours (Goldman, Moreno, & Westoff, 1989; Becker & Sosa,
1992).
1.2.5.2 Social desirability bias Social desirability bias is when a respondent answers a question in order to provide others
with a favourable impression of themselves. One of the first challenges in minimizing social
desirability bias is to ensure that participants answer the questions that are asked of them.
Item non‐response rates examine the number of questions or the prevalence of a particular
question not being answered by participants. Having low item non‐response rates improves
the chance that survey results remain representative of the sampled population. While some
researchers point out that item non‐response rates are not significantly different in sexual
behavioural surveys compared to surveys asking other sensitive questions, the fact remains
that it is important in all instances to aim for a low item‐response rate for all questions
(Wellings et al., 2001).
Social desirability bias impacts on self‐reports in two ways: over‐reporting of socially desirable
behaviours and underreporting of socially undesirable behaviours (Tourangeau et al., 2007;
Kreuter et al., 2008). For example, cocaine use is not socially sanctioned within any sub‐
population so one would expect under‐reporting of this behaviour. Likewise, voting in the US
is considered a citizen’s obligation, therefore researchers would expect this behaviour to be
over‐reported (which they traditionally do). Unfortunately, measuring the direction of social
desirability bias is less straightforward for sexual behaviours. As it is generally considered a
private behaviour which is rarely spoken of in public, researchers generally assume they will
find sexual behaviours to be under‐reported. As noted earlier, girls and young women fall into
this category. And while this can be generally assumed to be true, there are some sub‐
Chapter 1: Introduction 37
populations where over‐reporting is possible. For example, in many cultures, young males are
expected to be sexually experienced, so they may exaggerate their activity in order to conform
to this expectation (Brener et al., 2003; Mensch, Hewett, & Erulkar, 2003). Likewise, this
would be true of married couples trying to match their reported sexual activity to a societal
expectation. Given that social desirability bias causes over‐reporting of desirable behaviours
and underreporting of undesirable behaviours, the question for researchers exploring sexual
behaviours is to understand what behaviour is considered desirable within that sub‐population
under consideration. Without sound knowledge of these population specific norms it is
difficult to interpret the results, particularly in comparative studies.
When sexual behaviour is used to assess the impact of behavioural intervention programmes
in affecting behaviour change an additional challenge is that social desirability bias is likely to
be differential between intervention recipients (who should know the ‘right’ answer) and non‐
recipients. This distorts the apparent effects of the intervention indicating behaviour change
has occurred when it has not.
The literature is replete with evidence documenting systematic and intentional
misrepresentation in surveys, showing people are more willing to report socially embarrassing
behaviours when they are assured anonymity, feel emotionally comfortable, or when they
believe the researchers have access to information revealing truth of their thoughts or actions
(Holbrook, Green, & Krosnick, 2003; Tourangeau et al., 2007; Catania et al., 1996; Roese &
Jamieson, 1993; Buve et al., 2001).
A number of mechanisms can help to decrease social desirability bias including improving the
privacy of the space in which a questionnaire is answered, reassuring the participant that their
confidentiality will be respected, and ensuring high quality interviewers who can gain the
participant’s trust. Choosing how the questionnaire is delivered to the participant is also
influential and further research is needed into the role that questionnaire delivery modes play
in countering social desirability bias (Catania et al., 1990; Weinhardt, Forsyth, Carey, Jaworski,
& Durant, 1998; Wellings et al., 2001; Tourangeau et al., 2007). At the end of the 1990s, a
systematic review examined the comparative evidence relating to questionnaire delivery mode
(Weinhardt et al., 1998). Despite novel developments in the field (described in more detail
below) Weinhardt and colleagues believed that comparative research of questionnaire delivery
modes remained limited (Weinhardt et al., 1998).
Chapter 1: Introduction 38
1.3 Types of questionnaire delivery modes used to collect self‐reports of sexual behaviour
Questionnaire delivery modes designed to capture self‐reported sexual behaviour fall into two
broad categories, those administered by an interviewer (interviewer‐administered) and those
completed by the respondent (self‐administered). Researchers have traditionally tried to
balance gains made around probing and ensuring clarity when using an interviewer against the
respondent’s increased sense of privacy when using a self‐administered questionnaire delivery
method. It is generally hypothesized that the quality of sexual behaviour data are improved as
the level of privacy and standardization is increased (Tourangeau, Rips, & Rasinski, 2000;
Tourangeau et al., 2007; Kreuter et al., 2008).
The list below, while not exhaustive, provides an illustrative overview of the most common
questionnaire delivery modes.
1.3.1 Interviewer‐administered questionnaires:
An interviewer‐administered questionnaire in its most elementary form employs a trained
researcher to administer the questionnaire to the respondent. Data can be captured using pen
and paper or the interviewer can enter a respondent’s response directly into a computer
database. This latter technique is referred to as computer‐assisted personal interviewing
(CAPI) and can considerably reduce data entry time and error (Caceres et al., 2007; Bernabe‐
Ortiz et al., 2008). However, CAPI does not alter the basic interviewer‐respondent interaction
(Gribble, Miller, Rogers, & Turner, 1999).
Broadly speaking interviewer‐administered questionnaires have the advantage that the
interviewer can clarify questions with the respondent, or probe to ensure that all relevant
information is gathered. Skilled interviewers can ensure all questions are asked and answered,
improve the consistency of reporting by checking answers with respondents (e.g. “did you
mean you last had sex with your wife because earlier you said that you were not married?”),
and provide reassurance to the respondent. As someone is recording responses, it also offers
the possibility of asking open‐ended questions which can impart important detail or context to
a closed‐ended, categorical answer.
However, the quality of the interviewer‐administered questionnaire is contingent on the
interviewer’s inherent personal skills supplemented by the quality of their instruction (Elam et
al., 2003). Training must ensure interviewers are equipped to read sensitive questions in a
non‐judgemental and reassuring manner and are able to build rapport with a respondent so as
to establish confidence in the interview process. A key component of sexual behaviour
Chapter 1: Introduction 39
questionnaires is their ability to accurately document multiple and concurrent partnerships as
well as to record risk behaviours (e.g. condom use at first and last sex with partner, sexual
coercion, sexual partner’s age) for each of the respondent’s sexual partners (Carballo et al.,
1989; UNAIDS, 1998). This requires interviewers to be skilled in managing sometimes
complicated skip patterns.
Nevertheless all of these strengths may be outweighed by the respondent being unwilling to
reveal certain information or behaviours to an interviewer. Some research suggests an
interviewer’s gender can be an influential factor, with evidence suggesting that irrespective of
the respondent’s gender, sensitive behaviours are more often reported to female interviewers
(Konings, Bantebya, Carael, Bagenda, & Mertens, 1995; Wellings et al., 2001; Becker,
Feyisetan, & Makinwa‐Adebusoye, 1995). Female respondents are also more likely to be
affected by the gender of the interviewer than their male peers. Yet, other evidence suggests
that a non‐judgemental manner outweighs the gender of the interviewer (Wellings et al.,
2001). Evidence from Ghana suggests that interviewer characteristics (e.g. marital status and
age) were associated with different responses but not with more accurate answers (Blanc &
Croft, 1992). Research also examined the impact of offering the respondent the choice of
interviewer’s gender, believing that the ability to choose would increase a respondent’s sense
of control in an otherwise potentially threatening environment. However, this hypothesis did
not hold up; instead, as in other studies cited here, findings argued the importance of
matching the gender of interviewers and respondents (Catania et al., 1996).
One particular use of interviews is around its application in cognitive interviewing. This is
traditionally performed during the formative stage of questionnaire design to isolate response
errors from poor question wording that inhibits the respondent from accurately recalling and
reporting their experiences (Sudman, Bradburn, & Schwartz, 1996a). The cognitive approach
to questionnaire development has generated a substantial body of knowledge (for a
comprehensive review of taxonomy and procedures see (Forsyth & Lessler, 1991)).
Interviewers applying cognitive interviewing try to gain entry into the respondent’s thought
processes in order to tease out where errors can occur. A general mode for cognitive theory
assumes the following key processes: i) what does the respondent understand by the question;
ii) how does the respondent retrieve necessary information to answer the question; iii) how
much influence do normative concerns play; iv) can the respondent match their own answer to
the possible response options provided in the survey question (Tourangeau, 1984). Cognitive
interviewing uses specific questions and extensive probing to untangle these four underlying
thought process and resembles an in‐depth interview. However, the one additional distinction
Chapter 1: Introduction 40
in this process compared to standard interview‐administered questionnaires is the training
provided to the respondent to assist them in opening up their thought processes.
Several adaptations have been made to the standard interviewer‐administered questionnaire
which are described below.
1.3.1.1 Telephone surveys:
Telephone surveys offer the respondent greater anonymity while maintaining the opportunity
for the interviewer to clarify and probe. However, one review of comparative research using
telephone surveys and face‐to‐face interviewing found those surveyed over the phone were
less cooperative, less engaged during the interview, more likely to express dissatisfaction with
the survey length (despite it taking a shorter length of time) and being more suspicious of the
process (Holbrook et al., 2003). Telephone surveys tend to have to be shorter and cannot take
advantage of visual aids. These have gained wider popularity in the US but have not been used
as extensively elsewhere, in part because in many countries coverage of the telephone
network is not universal, making it more difficult to survey a representative sample (Fenton et
al., 2001). Telephone surveys are not viable in most developing countries where the majority
of the population do not have access to phones.
1.3.1.2 Use of visual aids
During development of the first national survey in the UK (NATSAL), Johnson and colleagues
recognized early on the inherent limitations of answering a sensitive sexual behavioural
question to a person, even when well trained. For a number of sensitive questions, they
provided the respondent with a show card listing the answers and the respondent only had to
report the number or letter linked to their specific response (Johnson et al., 1992; Wellings et
al., 2001).
1.3.1.3 Informal confidential voting interviews (ICVI)
Gregson and colleagues adapted the interviewer‐administered questionnaire by providing a
mechanism for some questions to be answered by the respondent in private (Gregson,
Zhuwau, Ndlovu, & Nyamukapa, 2002b). As with innovative techniques developed in the
NATSAL survey, they strived to maintain the advantages of using an interviewer while
improving the privacy of responses around sensitive questions. Respondents self‐completed
answers to sensitive questions onto strips of paper labelled with their study ID. Upon
completion of all the sensitive questions, the respondent posted the strip into a locked box
which the interviewer was unable to access (Gregson et al., 2002b). These sensitive questions
were only introduced part way through the interview after the interviewer had built rapport
Chapter 1: Introduction 41
with the respondent. Hanck and her colleagues adapted this method further by including
voting picture cards for their illiterate respondents in India (Hanck, Blankenship, Irwin, West, &
Kershaw, 2008).
1.3.1.4 Random Response Technique (RRT)
While the random response technique (RRT) is an indirect survey method, it is often used to
capture prevalence estimates of sensitive behaviours (for a review of a meta‐analysis of RRT
conducted, see Tourangeau et al., 2007). RRT requires the presence of an interviewer and is
limited to reporting of a dichotomous variable. Respondents are randomly assigned to answer
one of two questions, one of which is sensitive (e.g. ‘have you ever had an abortion?’) and the
other which is non‐sensitive and has a known probability of occurrence within the population
being studied (e.g. ‘were you born in April?’). The answers to both questions must be of a
similar format (e.g. yes/no) so that the answer does not give away which question is being
answered. The respondent is asked to randomly pick a question and answer it without
revealing the content of the question to the interviewer. The interviewer is not aware which
question is being answered and only records the answer given by the respondent. Using
assumptions about the probability of picking one question over the other and the probability
of the non‐sensitive question occurring within the population, it is possible to generate an
estimate of the prevalence of the sensitive behaviour within the population surveyed (Lara,
Strickler, Olavarrieta Diaz, & Ellerston, 2004). When compared with other self‐reports this
method can generate higher prevalence of sensitive behaviours (Lara et al., 2004). However
the method is limited in that it can only ask the one question, and the data from that question
cannot be analysed in conjunction with other questionnaire data (Tourangeau et al., 2007).
For example, while prevalence on abortion can be estimated, it is not possible to ask additional
questions surrounding the abortion because the interviewer can ascertain if it is the abortion
question which has been answered.
1.3.2 Self‐administered questionnaire delivery modes
The most basic format for self administered questionnaires (SAQ) asks the respondent to write
the answers to the questions themselves directly onto the questionnaire. Its biggest
advantage over interviewer‐administered questionnaires is its increased sense of privacy
(Turner et al., 1995). As such, SAQ has been used in conjunction with interviewer‐
administered questionnaires when highly sensitive sexual behavioural questions are asked
(Johnson et al., 1992). However self‐administered questionnaires have a number of
disadvantages. As it requires a minimal level of literacy it is less useful in poorly literate
populations (Turner et al., 1995). Lack of an interviewer means there are no checks which
Chapter 1: Introduction 42
makes it more difficult to ensure that all questions are answered (item response rate) and
answered consistently (reliability). Self‐administered questionnaires using paper forms are
also less able to handle questions that require complex skip patterns, an important aspect of
sexual behaviour reporting (see section 1.3.1 above).
As with interviewer‐administered modes, there have been a number of adaptations to this
mode.
1.3.2.1 Audio‐assisted interviewing.
Qualitative data from countries which are primarily oral suggest that respondents rarely see
sexual behavioural terms in print potentially increasing their difficulty to comprehend them
(Elam et al., 2003). Offering an oral element can increase their sense of understanding
(Langhaug et al., 2009). Adding an audio component to self‐administered questionnaires can
take two forms. In one, the respondent listens to the questions and responses being read
aloud through a tape recorder, CD player or MP3 player while reading and responding to the
questions on a paper version of the questionnaire (Liu & Detels, 1999; Le, Blum, Magnani,
Hewett, & Do, 2006). The second format uses a trained researcher who reads the questions
and responses aloud in a group setting while respondents record their responses individually
(assisted self‐completed questionnaire) (Plummer et al., 2004a; Plummer et al., 2004b; Cowan
et al., 2002; Cowan et al., 2008).
Both of these forms improve SAQ’s applicability within less literate populations. When the
audio element is pre‐recorded it provides the additional advantage of standardizing the voice
that reads the questions out loud for all respondents eliminating potential bias that could be
introduced using the interviewer‐administered format. Additionally, it also allows the
respondents to answer their questionnaires in private, less observed by their peers in the same
room. Little comparative research has occurred between SAQ and Audio‐SAQ. In one study
among STD clinic attendees in the US, respondents using Audio‐SAQ had less missing
responses and increased reporting of unprotected vaginal sex and sex with someone they
suspected had HIV (Boekeloo et al., 1994).
1.3.2.2 Computer‐assisted survey instrument (CASI)
Tremendous progress has been made over the past 20 years in the development of computer
assisted questionnaire technologies. At a minimum, as described above (see section 1.3.1)
interviewers can use computers to enter a respondent’s data directly into a data base.
However respondents can also use computers to answer questions on their own.
Chapter 1: Introduction 43
The use of computer programmes emerged as a direct response for questionnaire delivery
modes that might reduce social desirability bias in self‐reports. While traditional paper and
pen self‐completion questionnaires partially reduced this bias, their use was limited to literate
populations. In addition, self‐administered questionnaires, had the disadvantage of lower item
response‐rates and poor performance in complex skips (Kreuter et al., 2008; Al‐Tayyib, Rogers,
Gribble, Villarroel, & Turner, 2002).
While there was some initial work conducted in the 1980s (Millstein & Irwin, Jr., 1983), audio
computer‐assisted survey instruments (ACASI) were first comparatively tested in the US in the
early 1990s (Kurth, Spielberg, Rossini, & UW ACASI Working Group, 2001; Johnston & Walton,
1995; Turner et al., 1998; Fu, Darroch, Henshaw, & Kolb, 1998). The technique offers
respondents the opportunity to listen to questions and responses through headphones while
reading them on a computer screen. Respondents use a mouse or an external keypad to click
on the response choices. There are a number of minor variations to this method. For
example, in some instances, researchers forgo the computer screen and have respondents just
listen to the questions and responses before entering their answers using a small keypad
(Mensch et al., 2003). In this instance, the respondent listens (but cannot see) questions and
response choices. This method is more suited for questions with limited response choices that
are easy to remember. Some researchers have selected a limited number of keys on the
keyboard, colour coding them for the respondent to use (e.g. green key represents ‘yes’, red
key represents ‘no’). As technology has improved some surveys replaced keyboards and mice
with touch screens (Gribble et al., 1999). And, as computers themselves have improved,
researchers have begun to use personal digital assistants to replace more bulky desk tops and
laptops (Jaspan et al., 2007; Seebregts et al., 2008; Lane, Heddle, Arnold, & Walker, 2006). In
some instances, picture codes and video were added (Gerich, 2008; Gerich & Lehner, 2006) to
assist less literate populations (Kissinger et al., 1999) or the deaf (Bisol, Sperb, & Brewer, 2008)
or children (Gerich & Bergmair, 2008).
Beyond its potential to decrease social desirability bias, computer programming offers a
number of additional advantages. Where a number of languages are commonly‐used among a
population, a different questionnaire with the appropriate language can be switched to quickly
(Turner, Rogers, Hendershot, Miller, & Thornberry, 1996). Complex skip patterns can be
executed more smoothly as they are pre‐programmed so there is no reliance on the
respondent (or interviewer) to move from one question to the other. Computer programming
also allows for immediate checks into data inconsistencies across related questions (e.g.
comparing the respondent’s age against their reported age of first sexual activity). While this
is possible using interviewers, it is more cumbersome and can get forgotten when there are
Chapter 1: Introduction 44
time restrictions. As with all variations of computer generated data, data files are
automatically generated, significantly reducing data time and entry errors.
Early work with ACASI began in the US with promising results from three nationals surveys: the
1995 National Survey of Family Growth and the 1995 National Survey of Adolescent Males
(ACASI vs personal interview followed by self‐administered questionnaire) and the National
Longitudinal Study of Adolescent Health (Turner et al., 1998; Fu et al., 1998; Fu et al., 1998;
Modi, 2000). With adolescent males, estimates of the prevalence of male‐male sex, injection
drug use, and sexual contact with intravenous drug users were higher by factors of three or
more when collected using ACASI compared to standard self‐administered questionnaires
(Turner et al., 1998). ACASI was then used successfully in specialized populations including gay
men, injecting drug users and women at increased risk of HIV (des Jarlais et al., 1999a; Metzger
et al., 2000b). When HIV positive and HIV negative respondents were compared greater
differences in reporting HIV risk behaviours were also noted (Macalino, Celentano, Latkin,
Stathdee, & Vlahov, 2002). In the early stages, ACASI was compared against face‐to‐face
interviewing and against different versions of itself (Newman et al., 2002; Tourangeau & Smith,
1996). For example, Tourrageau and Smith compared three related computer‐assisted
methods: i) computer‐assisted person interviewing (CAPI), using a trained interviewer, against
ii) computer‐assisted self‐administered interviewing, where the respondent answers the
questions themselves (CASI), against iii) audio computer‐assisted self‐administered
interviewing (Tourangeau et al., 1996). They found that while response rates did not differ
between these three modes, there was a reduced disparity between the males and females in
terms of number of partners reported using the two self‐administered modes (CASI and
ACASI). There was also an increased reporting of illicit drug use with ACASI.
However as computers were used more frequently by respondents themselves, reports on its
ability to consistently report increased reporting of sensitive behaviours became more varied.
In a methodological comparison in a generalized population sample in the UK, Johnson et al.
found no consistent evidence of an increase in reporting of risk behaviours when comparing
CASI against pen and paper although there was an improvement in item response and in data
consistency with CASI (Johnson et al., 2001). More recent comparative research in
industrialized countries have found it more difficult to match the large differences found by
Turner and others when it was first used (Testa, Livingston, & VanZile‐Tamsen, 2005; Ellen et
al., 2002; Kissinger et al., 1999; Morrison‐Beedy, Carey, & Tu, 2006).
As computer technology has improved and programming become more sophisticated there
has been a proliferation of spin‐offs to computer administered questionnaires. One such
Chapter 1: Introduction 45
derivative is to incorporate the use of computers within telephone surveys, often referred to
as phone‐ACASI (Lau, Thomas, & Liu, 2000; Lau, Tsui, & Wang, 2003). This method involves
interactive voice recording (IVR) where the interviewer is replaced with a recorded voice and
the respondent uses the phone keypad to enter their responses. With the growth of personal
digital assistants, researchers have explored their feasibility as smaller versions of laptops (van
Griensven et al., 2006; Lane et al., 2006; Seebregts et al., 2008; Jaspan et al., 2007). One
immediate advantage is their long battery power allowing them to remain in the field for
considerable time. In addition, they cost less and are smaller and lighter than laptops. Finally,
as the internet has expanded across North America and Western Europe, surveyors have
exploited its potential and created web‐based surveys (Knapp & Kirk, 2003; Elford et al., 2007;
Kreuter et al., 2008). With the arrival of video feed as a common phenomenon within the web
page, web surveys have also begun to explore how to use them to personalize the survey
experience (Tourangeau, Couper, & Steiger, 2003).
1.3.2.3 Coital diaries
Sexual or coital diaries are used to collect data prospectively and have been shown to increase
reporting of some behaviours (Ramjee, Weber, & Morar, 1999; Ferguson, Morris, & Kariuki,
2006; Allen et al., 2007; Hensel et al., 2004) (see (Bolger, Davis, & Rafaeli, 2003) for a good
review of diary methodology). Even though they can include visual aids, they also rely on a
minimal level of literacy. Unlike the other modes described above, coital diaries are completed
by the respondent prospectively as the behaviours occur and are not administered in a one‐off
survey. This makes them a useful mode for recording activities that occur with relative
frequency where recall would be hindered (Fortenberry, Harezlak, Katz, & Orr, 2001) or when
trying to break down a specific behaviour such as condom use (de Visser & Smith, 2000). As
they also require a regular commitment from the respondent (as opposed to a one‐off
commitment with a survey) they can be prone to participation bias. There is some concern
that because data are collected continuously, it raises sexual behaviour to the front of the
respondent’s consciousness, allowing the possibility for the research method to influence the
respondent’s sexual behaviour. Coital diaries have been less used in developing country
settings where there is a less reliable postal service and increased logistical complications in
recovering the diaries for analysis (Ramjee et al., 1999; Ferguson et al., 2006; Allen et al.,
2007).
1.3.3 Methodological Research in Developing Countries
Considerable methodological literature derived from developed country populations
comparing questionnaire delivery modes exist, generally indicating that self‐completion
Chapter 1: Introduction 46
computer‐assisted modes improve completeness and data consistency and may increase
disclosure of socially censured behaviours (Tourangeau et al., 1996; Turner et al., 1998; des
Jarlais et al., 1999b; Fu et al., 1998; Johnson et al., 2001). However, at the time the
preparatory work for this thesis began in 2004, few studies had rigorously compared
questionnaire delivery modes in developing countries (van de Wijgert, Padian, Shiboski, &
Turner, 2000; Lau et al., 2000; Lau et al., 2003; Gregson et al., 2002b) particularly among young
people (Mensch et al., 2003; Plummer et al., 2004a; Plummer et al., 2004b; Rumakom, Guest,
Chinvarasopak, Utarmat, & Sontanakanit, 2005; Hewett, Mensch, & Erulkar, 2004) or among
semi‐literate populations (Lara et al., 2004; Potdar & Koenig, 2005). While the need for
improved measurement validity and reliability was well recognized (Eggleston, Leitch, &
Jackson, 2000; Nnko, Boerma, Urassa, Mwaluko, & Zaba, 2004; Zaba, Pisani, Slaymaker, &
Boerma, 2004; Gregson et al., 2004; Curtis & Sutherland, 2004), the relative paucity of
comparative research remained.
1.4 Overview of this thesis
This thesis sets out to explore the most effective methodology for measurement of sensitive
behaviours among rural Zimbabwean youth in a developing country setting. The opportunity
for this research presented itself during the course of a community randomized trial where I
was working as the evaluation manager. The Regai Dzive Shiri Project (RDS) was a community
randomized trial of a multi‐component adolescent reproductive health intervention conducted
in rural Zimbabwe between 2003 and 2007. In 2006, the interim survey for this trial provided
the ideal opportunity to conduct a robust evaluation of several questionnaire delivery modes,
triangulated against biological markers of sexual behaviour. Rates of non‐response to
questions could be compared between delivery modes (item response) as could the reporting
of socially censured behaviours. Quantitative and qualitative data were included to compare
the feasibility and acceptability of the different methods. These comprehensive data informed
data collection procedure for the final survey.
The primary aims of the work reported in this thesis are:
• To conduct an experimental comparison of four questionnaire delivery
methods to determine the most valid means of collecting socially censured
information from young people in rural Zimbabwe. The most valid method
would then be used in the final outcomes survey for the parent trial.
Chapter 1: Introduction 47
• To use quantitative and qualitative research methods to refine and assess the
feasibility and acceptability of the questionnaire delivery modes among rural
Zimbabwean youth.
The specific objectives of the work reported in this thesis are:
• To use cognitive interviewing to develop and refine an existing self‐completion
questionnaire.
• To compare self‐reports of socially censured data including sexual behaviours,
poverty, orphaning, and psychological morbidity, between four questionnaire
delivery modes.
• To determine the reliability of sexual behavioural data collection through the
triangulation of self‐reported sexual behavioural data collected by four
questionnaire delivery modes against biological markers of sexual activity such
as HIV and HSV‐2 antibody status and current pregnancy in females.
• To determine the reliability of sexual behavioural data through the comparison
of responses by the same individual between two short time intervals using
two different questionnaire delivery modes.
• To use quantitative and qualitative data to assess young people’s acceptability
towards the four questionnaire delivery modes.
• To compare item non‐response rate and response rates of sexual behaviours
between the two modes used in the final survey.
In summary:
• HIV is an important public health concern that dominates the health agenda in
sub‐Saharan Africa where is it primarily transmitted through unprotected
heterosexual intercourse.
• Young people are at the centre of this epidemic and urgently require
interventions to help them change their norms and behaviours before and
after they become sexually active.
• Being able to measure sexual behaviour accurately is key to
o understanding the sexual lifestyles that put people at risk of HIV;
Chapter 1: Introduction 48
o developing appropriate sexual behaviour interventions, and;
o having robust tools to measure impact of sexual behaviour
interventions.
• Due to its private nature, measurement of sexual behaviour relies on self‐
report.
• As a result of its private nature and cultural social censuring, self‐reported
sexual behaviour is fraught with bias; methods to reduce recall and social
desirability bias, particularly in young people, are required.
• A variety of questionnaire delivery modes exist to capture self‐reported
behaviours. Appropriate choice of questionnaire delivery mode may reduce
these biases although little is known about their relative advantages and
disadvantages in developing country settings.
• In this thesis I report on a trial of questionnaire delivery methods that was
nested within a larger community randomized trial designed to evaluate the
effectiveness of an innovative community‐based adolescent reproductive
health intervention.
In the following chapter, I assess the evidence from a systematic review of mode comparison
around sexual behaviour reporting in developing countries. At the time this experimental
evaluation was being designed, there were few comparative studies in non‐industrialized
countries and amongst young people in particular. However, during the time this research was
carried out, interest in this field emerged and by the time this research was concluded there
were a sufficient number of studies on which to make a more informed choice about
questionnaire method selection.
Chapter 2: Systematic Review 49
2 A SYSTEMATIC REVIEW OF QUESTIONNAIRE DELIVERY MODES IN
DEVELOPING COUNTRIES FOCUSED ON SEXUAL BEHAVIOUR
2.1 Introduction
Two decades into the HIV pandemic we are now aware that there is no single global epidemic,
but rather a host of diverse ones (Wilson et al., 2008; UNAIDS, 2008). For countries in sub‐
Saharan Africa, who are host to generalized epidemics sustained within the population as a
whole, the disease is primarily spread sexually. However our understanding of the sexual
behaviours that drive this spread are limited by our ability to measure them. Measuring sexual
behaviours is heavily reliant on self‐reports which, due to the social taboos and sensitivity that
surrounds them, are prone to social desirability bias. One important mechanism for improving
our measurement of self‐reported sexual behaviours is through the improvement of the
questionnaire delivery mode used. Until recently, comparative research in this field has been
dominated by studies conducted in North America or Western Europe. Interviewer‐
administered modes continue to govern the field in sub‐Saharan Africa. This chapter presents
the results of a systematic review of comparative studies from developing countries that
assess the advantages and disadvantages of various questionnaire delivery modes for the
measurement of sexual behaviours. At the time the experimental evaluation reported in this
thesis was designed (2004), there were very few method comparisons from developing
countries. This review assesses the evidence around questionnaire delivery modes, the results
of which can be compared against this thesis’ research results. An initial review was
conducted during the formative development of the study which was subsequently updated to
a more formal systematic review to reflect the current status in the field of methodological
research.
2.2 Methods for the systematic review
Inclusion criteria: Studies were selected for review if they met the following criteria. Articles
published or cited in peer‐reviewed journals that compared two or more questionnaire
delivery modes, had been conducted in a developing country, included data that reported on
sexual behaviour (vaginal, anal, or oral sex, condom use, risky sexual behaviours, contraceptive
use), and had been published between 1 January 1980 and 31 December 2008. While there is
no established convention for the designation of a ‘developed’ or ‘developing’ country, the
term is loosely defined to include those countries with lower standards of democratic
governments, industrialization, social programmes, and human rights guarantees(Wikepedia,
2009; World Bank, 2009). In this review the countries listed as having ‘emerging’ or
Chapter 2: Systematic Review 50
‘developing economies’ by the International Monetary Fund World Economic Outlook report
were considered a ‘developing’ country (International Monetary Fund, 2009). Studies were
included if they were evaluated in an experimental (RCT), quasi‐experimental (i.e. had non‐
randomised comparison group) or test‐retest design. Studies were excluded if they were
conducted in an industrialized country, compared one questionnaire delivery mode against a
biological marker, or compared the impact of interviewer gender on questionnaire responses.
Articles were also not included if studies compared data reported by married couples rather
than between questionnaire methods.
Search strategy: Three databases were searched: Medline, EMbase, and PsychINFO. The
search began using Medline Key MeSH terms and text words (see Table 2‐1). These
references, including their abstracts and key words, were imported into Reference Manager
10.0. Two additional searches in Embase and PsychINFO were conducted using key MeSH
terms and text words relevant to each database (See Appendix A). These references were
merged into the existing database that included the Medline references. Duplicates were
manually discarded and the initial reference was kept1. This resulted in a total of 6822
references to be examined (Medline=3261; Embase=1761; PsycINFO=1800). Initial literature
searches were downloaded between 7 and 12 September 2008. Each literature search was
saved and any new articles that fit these search definitions were sent weekly to the author’s
email address. These additional searches were examined for any additional relevant articles
until 31 December 2008 when the search was closed. In addition, the abstracts for the
conference proceedings from the International Congress of Sexually Transmitted Infections
(ISSTDR) were examined from 2001 onwards (2001, 2003, 2005 and 2007). Unpublished
studies emanating from references of published articles and studies published in non‐English
language journals were considered for inclusion.
Analysis: Titles and abstracts were used to screen for relevance to the literature review. If
questionnaire delivery method was not mentioned in the abstract, it was assumed only one
method was used in the study. Likewise, if there was no abstract and the title did not mention
a method, it was assumed there was no method comparison. For those articles where the title
or abstract were not sufficient to make a determination, the article was downloaded and read.
Reference lists for all included articles were also examined for additional relevant publications.
Three percent of articles were re‐examined blind by a co‐investigator (Frances Cowan) to
check that inclusion criterion were being met (there were no discrepancies during this check).
1 Duplicates were checked against the authors, and article and journal title, but not against publication data as Ovid sometimes merged publication data with the journal title. As such, the more conservative approach was used and publication dates were checked manually in the generated duplicate list.
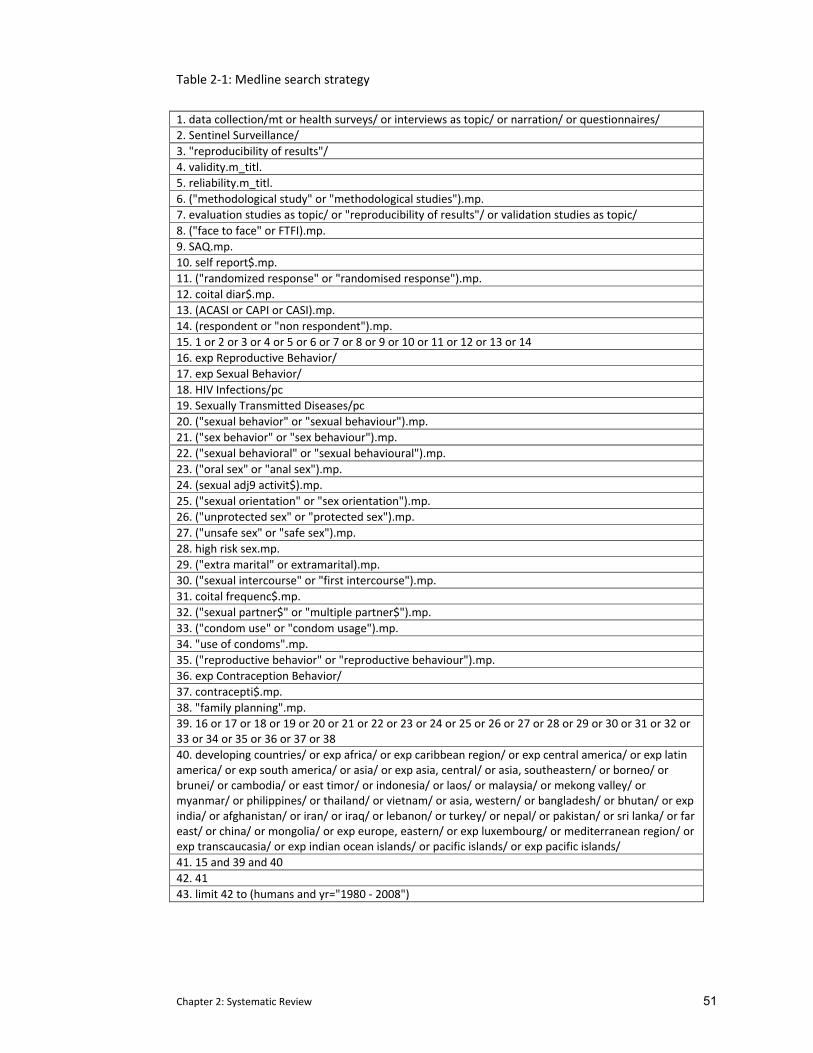
Chapter 2: Systematic Review 51
Table 2‐1: Medline search strategy
1. data collection/mt or health surveys/ or interviews as topic/ or narration/ or questionnaires/ 2. Sentinel Surveillance/ 3. "reproducibility of results"/ 4. validity.m_titl. 5. reliability.m_titl. 6. ("methodological study" or "methodological studies").mp. 7. evaluation studies as topic/ or "reproducibility of results"/ or validation studies as topic/ 8. ("face to face" or FTFI).mp. 9. SAQ.mp. 10. self report$.mp. 11. ("randomized response" or "randomised response").mp. 12. coital diar$.mp. 13. (ACASI or CAPI or CASI).mp. 14. (respondent or "non respondent").mp. 15. 1 or 2 or 3 or 4 or 5 or 6 or 7 or 8 or 9 or 10 or 11 or 12 or 13 or 14 16. exp Reproductive Behavior/ 17. exp Sexual Behavior/ 18. HIV Infections/pc 19. Sexually Transmitted Diseases/pc 20. ("sexual behavior" or "sexual behaviour").mp. 21. ("sex behavior" or "sex behaviour").mp. 22. ("sexual behavioral" or "sexual behavioural").mp. 23. ("oral sex" or "anal sex").mp. 24. (sexual adj9 activit$).mp. 25. ("sexual orientation" or "sex orientation").mp. 26. ("unprotected sex" or "protected sex").mp. 27. ("unsafe sex" or "safe sex").mp. 28. high risk sex.mp. 29. ("extra marital" or extramarital).mp. 30. ("sexual intercourse" or "first intercourse").mp. 31. coital frequenc$.mp. 32. ("sexual partner$" or "multiple partner$").mp. 33. ("condom use" or "condom usage").mp. 34. "use of condoms".mp. 35. ("reproductive behavior" or "reproductive behaviour").mp. 36. exp Contraception Behavior/ 37. contracepti$.mp. 38. "family planning".mp. 39. 16 or 17 or 18 or 19 or 20 or 21 or 22 or 23 or 24 or 25 or 26 or 27 or 28 or 29 or 30 or 31 or 32 or 33 or 34 or 35 or 36 or 37 or 38 40. developing countries/ or exp africa/ or exp caribbean region/ or exp central america/ or exp latin america/ or exp south america/ or asia/ or exp asia, central/ or asia, southeastern/ or borneo/ or brunei/ or cambodia/ or east timor/ or indonesia/ or laos/ or malaysia/ or mekong valley/ or myanmar/ or philippines/ or thailand/ or vietnam/ or asia, western/ or bangladesh/ or bhutan/ or exp india/ or afghanistan/ or iran/ or iraq/ or lebanon/ or turkey/ or nepal/ or pakistan/ or sri lanka/ or far east/ or china/ or mongolia/ or exp europe, eastern/ or exp luxembourg/ or mediterranean region/ or exp transcaucasia/ or exp indian ocean islands/ or pacific islands/ or exp pacific islands/ 41. 15 and 39 and 40 42. 41 43. limit 42 to (humans and yr="1980 ‐ 2008")
Chapter 2: Systematic Review 52
Any articles where I was unclear about inclusion were discussed with Dr Cowan. All articles
included in the review were jointly discussed by both investigators.
2.3 Results of the systematic review
Of the 6824 references, 28 articles reporting on 26 studies met the inclusion criteria for this
review (see Figure 2‐1). While the bulk (14/26) of studies reviewed here were conducted
between 2000 and 2004, almost two‐thirds of them (18/26) were published between 2005 and
2008 (Figure 2‐2). Some articles reported results from more than one study which were
analysed separately here. Other studies were reported in more than one article; these were
combined for analysis. Studies ranged geographically (from China, to Hanoi, to rural Malawi)
and in their selection of respondents (from female sex workers to South African students).
SAQ was used as the comparison in five studies (see Table 2‐2) whereas interviewer‐
administered questionnaires were the comparison in 16 studies (see Table 2‐3). There were
seven studies that included SAQ, an interviewer‐administered mode, and at least one other
mode for comparison (see Table 2‐4.)
Before reporting on the results of this comparative review it should be noted that I have made
the general assumption that an increase in reporting of a socially censured behaviour indicates
more accurate reporting (reducing social desirability bias and increasing validity) (Durant &
Carey, 2000; Weinhardt et al., 1998; Kreuter et al., 2008; Brener et al., 2003).
2.3.1 Comparison with SAQ
There were five studies that compared another method against SAQ and they all used ACASI or
a derivative thereof (e.g. PDA or phone‐ACASI) (see Table 2‐2). Two of the studies were
conducted in Asia (China and Thailand) with one study from Peru and two from South Africa.
Of the five studies, two were conducted as randomized controlled trials (Rumakom et al.,
2005; Seebregts et al., 2008), one was quasi‐experimental (Fielding, Lam, & Hedley, 2006), and
two focused on test‐retest (Jaspan et al., 2007; Bernabe‐Ortiz et al., 2008). Three of the
studies included youth (Jaspan et al., 2007; Seebregts et al., 2008; Rumakom et al., 2005), all of
whom were selected from a school going population (as young as 11 years and as old as
second year of college).
2.3.1.1 Comparison of response rates
In the two studies where non‐response rates were reported, SAQ performed poorly against
ACASI and its derivatives in terms of item non‐response rates. In the study by Jaspan et al.
from South Africa, SAQ respondents were seven times more likely to have missing items than
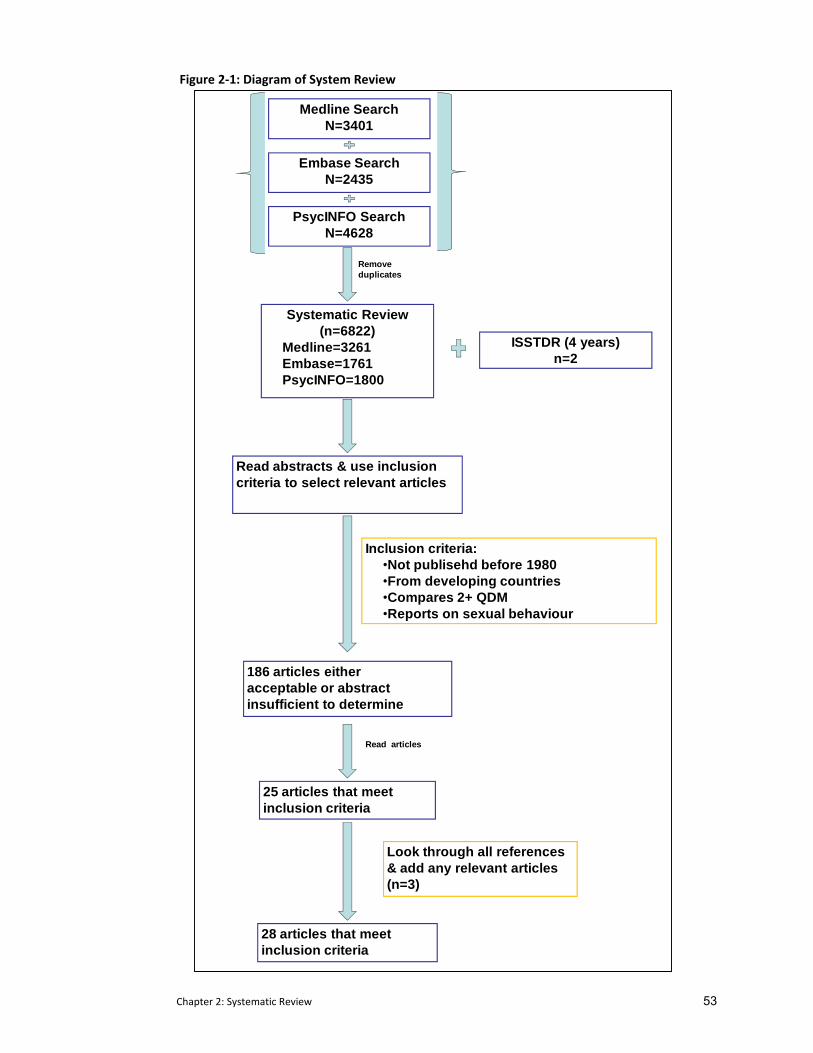
Chapter 2: Systematic Review 53
Figure 2‐1: Diagram of System Review
Remove duplicates
Systematic Review(n=6822)
Medline=3261Embase=1761PsycINFO=1800
Read abstracts & use inclusion criteria to select relevant articles
Inclusion criteria:•Not publisehd before 1980•From developing countries•Compares 2+ QDM•Reports on sexual behaviour
186 articles either acceptable or abstract insufficient to determine
Read articles
25 articles that meet inclusion criteria
Look through all references & add any relevant articles (n=3)
28 articles that meet inclusion criteria
Medline SearchN=3401
PsycINFO SearchN=4628
Embase SearchN=2435
ISSTDR (4 years)n=2
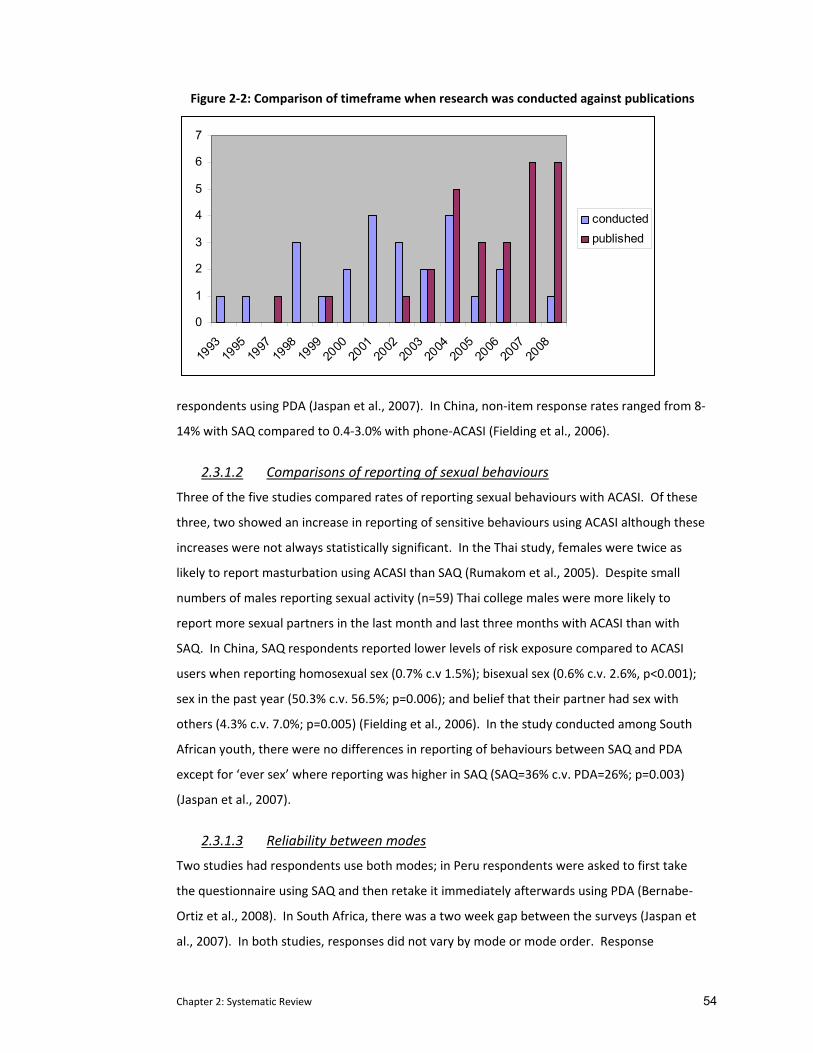
Chapter 2: Systematic Review 54
Figure 2‐2: Comparison of timeframe when research was conducted against publications
0
1
2
3
4
5
6
7
1993
1995
1997
1998
1999
2000
2001
2002
2003
2004
2005
2006
2007
2008
conductedpublished
respondents using PDA (Jaspan et al., 2007). In China, non‐item response rates ranged from 8‐
14% with SAQ compared to 0.4‐3.0% with phone‐ACASI (Fielding et al., 2006).
2.3.1.2 Comparisons of reporting of sexual behaviours
Three of the five studies compared rates of reporting sexual behaviours with ACASI. Of these
three, two showed an increase in reporting of sensitive behaviours using ACASI although these
increases were not always statistically significant. In the Thai study, females were twice as
likely to report masturbation using ACASI than SAQ (Rumakom et al., 2005). Despite small
numbers of males reporting sexual activity (n=59) Thai college males were more likely to
report more sexual partners in the last month and last three months with ACASI than with
SAQ. In China, SAQ respondents reported lower levels of risk exposure compared to ACASI
users when reporting homosexual sex (0.7% c.v 1.5%); bisexual sex (0.6% c.v. 2.6%, p<0.001);
sex in the past year (50.3% c.v. 56.5%; p=0.006); and belief that their partner had sex with
others (4.3% c.v. 7.0%; p=0.005) (Fielding et al., 2006). In the study conducted among South
African youth, there were no differences in reporting of behaviours between SAQ and PDA
except for ‘ever sex’ where reporting was higher in SAQ (SAQ=36% c.v. PDA=26%; p=0.003)
(Jaspan et al., 2007).
2.3.1.3 Reliability between modes
Two studies had respondents use both modes; in Peru respondents were asked to first take
the questionnaire using SAQ and then retake it immediately afterwards using PDA (Bernabe‐
Ortiz et al., 2008). In South Africa, there was a two week gap between the surveys (Jaspan et
al., 2007). In both studies, responses did not vary by mode or mode order. Response
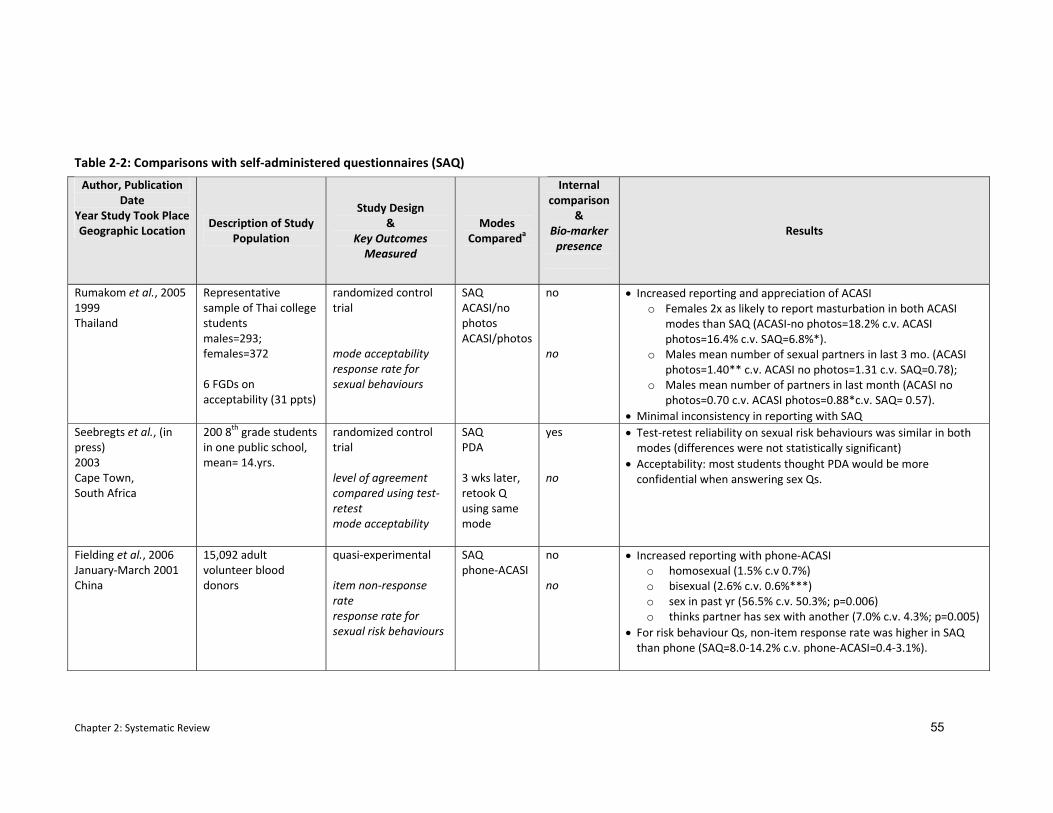
Chapter 2: Systematic Review 55
Author, Publication Date
Year Study Took Place Geographic Location
Description of Study Population
Study Design &
Key Outcomes Measured
Modes Compareda
Internal comparison
& Bio‐marker presence
Results
Rumakom et al., 2005 1999 Thailand
Representative sample of Thai college students males=293; females=372 6 FGDs on acceptability (31 ppts)
randomized control trial mode acceptability response rate for sexual behaviours
SAQ ACASI/no photos ACASI/photos
no no
• Increased reporting and appreciation of ACASI o Females 2x as likely to report masturbation in both ACASI
modes than SAQ (ACASI‐no photos=18.2% c.v. ACASI photos=16.4% c.v. SAQ=6.8%*).
o Males mean number of sexual partners in last 3 mo. (ACASI photos=1.40** c.v. ACASI no photos=1.31 c.v. SAQ=0.78);
o Males mean number of partners in last month (ACASI no photos=0.70 c.v. ACASI photos=0.88*c.v. SAQ= 0.57).
• Minimal inconsistency in reporting with SAQ Seebregts et al., (in press) 2003 Cape Town, South Africa
200 8th grade students in one public school, mean= 14.yrs.
randomized control trial level of agreement compared using test‐retest mode acceptability
SAQ PDA 3 wks later, retook Q using same mode
yes no
• Test‐retest reliability on sexual risk behaviours was similar in both modes (differences were not statistically significant)
• Acceptability: most students thought PDA would be more confidential when answering sex Qs.
Fielding et al., 2006 January‐March 2001 China
15,092 adult volunteer blood donors
quasi‐experimental item non‐response rate response rate for sexual risk behaviours
SAQ phone‐ACASI
no no
• Increased reporting with phone‐ACASI o homosexual (1.5% c.v 0.7%) o bisexual (2.6% c.v. 0.6%***) o sex in past yr (56.5% c.v. 50.3%; p=0.006) o thinks partner has sex with another (7.0% c.v. 4.3%; p=0.005)
• For risk behaviour Qs, non‐item response rate was higher in SAQ than phone (SAQ=8.0‐14.2% c.v. phone‐ACASI=0.4‐3.1%).
Table 2‐2: Comparisons with self‐administered questionnaires (SAQ)
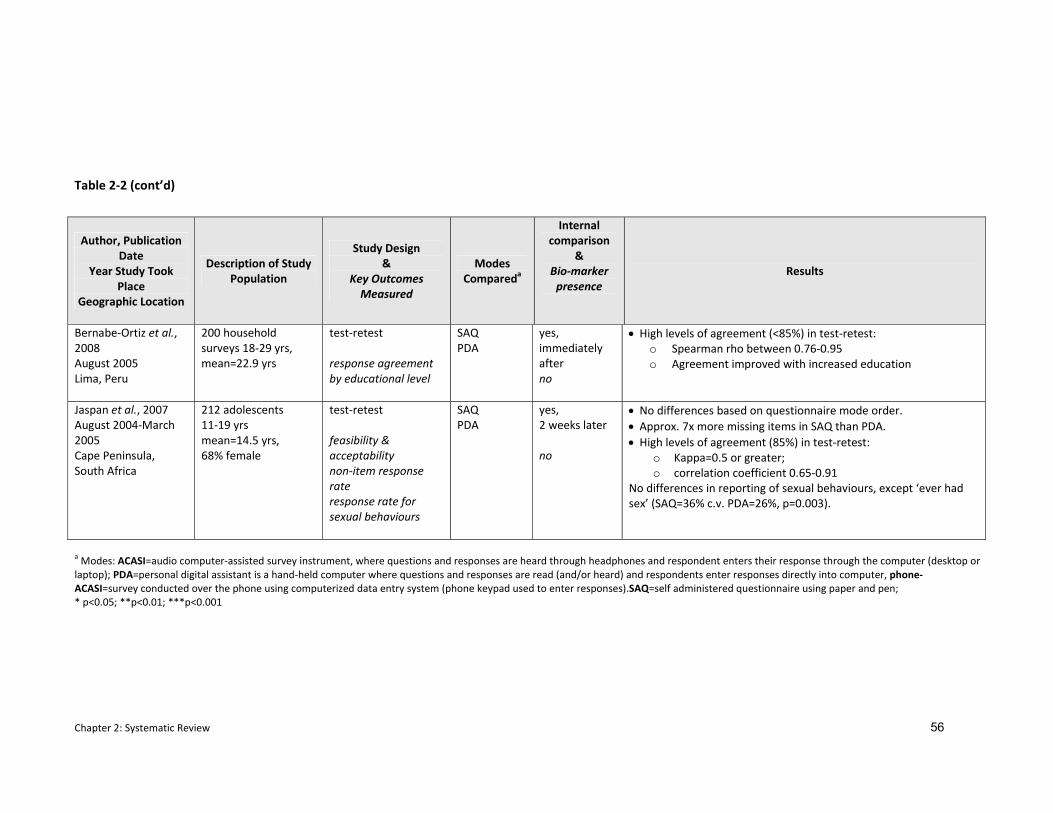
Chapter 2: Systematic Review 56
Table 2‐2 (cont’d)
Author, Publication Date
Year Study Took Place
Geographic Location
Description of Study Population
Study Design &
Key Outcomes Measured
Modes Compareda
Internal comparison
& Bio‐marker presence
Results
Bernabe‐Ortiz et al., 2008 August 2005 Lima, Peru
200 household surveys 18‐29 yrs, mean=22.9 yrs
test‐retest response agreement by educational level
SAQ PDA
yes, immediately after no
• High levels of agreement (<85%) in test‐retest: o Spearman rho between 0.76‐0.95 o Agreement improved with increased education
Jaspan et al., 2007 August 2004‐March 2005 Cape Peninsula, South Africa
212 adolescents 11‐19 yrs mean=14.5 yrs, 68% female
test‐retest feasibility & acceptability non‐item response rate response rate for sexual behaviours
SAQ PDA
yes, 2 weeks later no
• No differences based on questionnaire mode order. • Approx. 7x more missing items in SAQ than PDA. • High levels of agreement (85%) in test‐retest:
o Kappa=0.5 or greater; o correlation coefficient 0.65‐0.91
No differences in reporting of sexual behaviours, except ‘ever had sex’ (SAQ=36% c.v. PDA=26%, p=0.003).
a Modes: ACASI=audio computer‐assisted survey instrument, where questions and responses are heard through headphones and respondent enters their response through the computer (desktop or laptop); PDA=personal digital assistant is a hand‐held computer where questions and responses are read (and/or heard) and respondents enter responses directly into computer, phone‐ACASI=survey conducted over the phone using computerized data entry system (phone keypad used to enter responses).SAQ=self administered questionnaire using paper and pen; * p<0.05; **p<0.01; ***p<0.001
Chapter 2: Systematic Review 57
agreement between the two modes was high at 85% and a Kappa of 0.5 or greater. In a
second South African study, school‐going youth were asked to retake the questionnaire three
weeks later but used the same mode as before (Seebregts et al., 2008). For both modes, test‐
retest reliability was similar.
2.3.1.4 Acceptability of modes
When asked about the acceptability of the two questionnaire delivery modes (SAQ and ACASI),
respondents were more likely to report that ACASI and its derivatives were more confidential
when answering sexual behavioural questions. In the Thai study, 7.8% of college females who
used SAQ reported feeling embarrassed answering the sexual behaviour questions compared
with less than 1.5% of female ACASI respondents (Rumakom et al., 2005). In South Africa,
students reported little difficulty using the PDA; however, while 70% reported enjoying it, an
equally large proportion (57%) also found SAQ highly acceptable (Jaspan et al., 2007).
2.3.2 Comparisons with Face‐to‐Face Interviewing (FTFI)
A total of 16 studies compared face‐to‐face interviewing against another mode; eight of which
were against ACASI (see Table 2‐3). Four studies explored an adaptation of face‐to‐face
interviewing which allowed respondents to self‐report sensitive questions on a ballot card
(Hanck et al., 2008; Gregson et al., 2002b; Gregson et al., 2004; Phillips et al., 2007). One study
from India compared an additional mode which they termed ‘interactive interviewing’ (Jaya,
Hindin, & Ahmed, 2008). This mode included a five segment tape‐recorded drama intended to
desensitise respondents around sensitive issues. Interviewers also used dolls to ask questions
about same‐sex behaviours. As in the three studies above, respondents also used a
confidential ballot sheet to record their answers to sensitive questions. Four other studies
compared face‐to‐face interviewing against in‐depth interviewing (n=1) (Konings et al., 1995),
coital diaries (n=2) (Allen et al., 2007; Ramjee et al., 1999) or used a derivative of SAQ where
the questions were read aloud in a group setting (n=1) (Plummer et al., 2004a; Plummer et al.,
2004b). A wide geographical scope was covered with four studies from Central and South
America (Peru=2; Brazil=2), nine studies from East and Southern Africa (Tanzania=2;
Zimbabwe=4; Uganda, Malawi, and South Africa), and six studies from Asia (India=4, China, and
Indonesia).
As shown in Table2‐3, eight studies were conducted as randomized controlled trials (Phillips et
al., 2007; Caceres et al., 2007; Minnis et al., 2007; Simoes, Bastos, Moreira, Lynch, & Metzger,
2006; Jaya et al., 2008; Mensch, Hewett, Gregory, & Helleringer, 2008; Hewett et al., 2008;
Allen et al., 2007), five as quasi‐experimental studies (Konings et al., 1995; Gregson et al.,
Chapter 2: Systematic Review 58
2002b; Gregson et al., 2004; Bernabe‐Ortiz et al., 2008; Hanck et al., 2008) , and three focused
solely on test‐retest (Sedyaningsih‐Mamahit & Gortmaker, 2003; Plummer et al., 2004a;
Plummer et al., 2004b; Ramjee et al., 1999). Four studies focussed exclusively on youth
(Plummer et al., 2004a; Plummer et al., 2004b; Mensch et al., 2008; Jaya et al., 2008). Some of
the adult studies included young people (starting at either 15, 16, or 18 years), but results
were not disaggregated by age.
2.3.2.1 Comparison of response rates
Only three of the 15 studies reported item non‐response rates. Researchers may have omitted
reporting this because the inherent advantage of interviewer‐administered questionnaires is
that by default interviewer presence renders it more difficult for respondents to ignore a
question. In Gregson’s initial study in Zimbabwe, while there was a lower item non‐response
rate in face‐to‐face interviewing when compared with ICVI , it remained below 5% (Gregson et
al., 2002b). In India, low item non‐response rates were also reported (Jaya et al., 2008). In
Peru, where data entry was handled manually (FTFI) or directly into a PDA, the number of
inconsistencies and missing responses was significantly higher in the FTFI (p<0.001) (Bernabe‐
Ortiz et al., 2008).
2.3.2.2 Comparisons of reporting of sexual behaviours
Overall, respondents using face‐to‐face interviewing reported lower rates of sensitive
behaviours when compared against respondents using other questionnaire delivery modes. Of
the seven studies that compared face‐to‐face with ACASI, all but one of which were conducted
as RCTs, six of them showed increased reporting of various sexual behaviours in ACASI
compared to face‐to‐face. In Brazil, among urban women, STI risk behaviours were
consistently higher in ACASI; however this difference was only statistically significant for three
behaviours (anal sex in the last six months: 33% versus 24%; p<0.01; no condom use with
vaginal sex in the last month: 59% versus 51%;p<0.01; number of sex acts in last month with
no condom: 7% versus 6%; p<0.05) (Hewett et al., 2008). In a second study from Brazil,
respondents seeking drug treatment were randomly allocated to complete their questionnaire
using either ACASI or FTFI (Simoes et al., 2006). In general, the adjusted odds ratio for sexual
risk behaviours were higher among those using ACASI, with the exception of reports of sexual
activity in the past six months and having multiple partners, where no differences were
reported. In three instances the differences were statistically significant at the 0.05 level
(MSM behaviour AOR=2.52 (95% CI 1.38‐4.61); sex for drugs AOR=1.88 (95% CI 1.20‐2.94);
money for sex AOR=1.37 (95% CI 0.95‐1.98)). Although not statistically significant, ACASI users
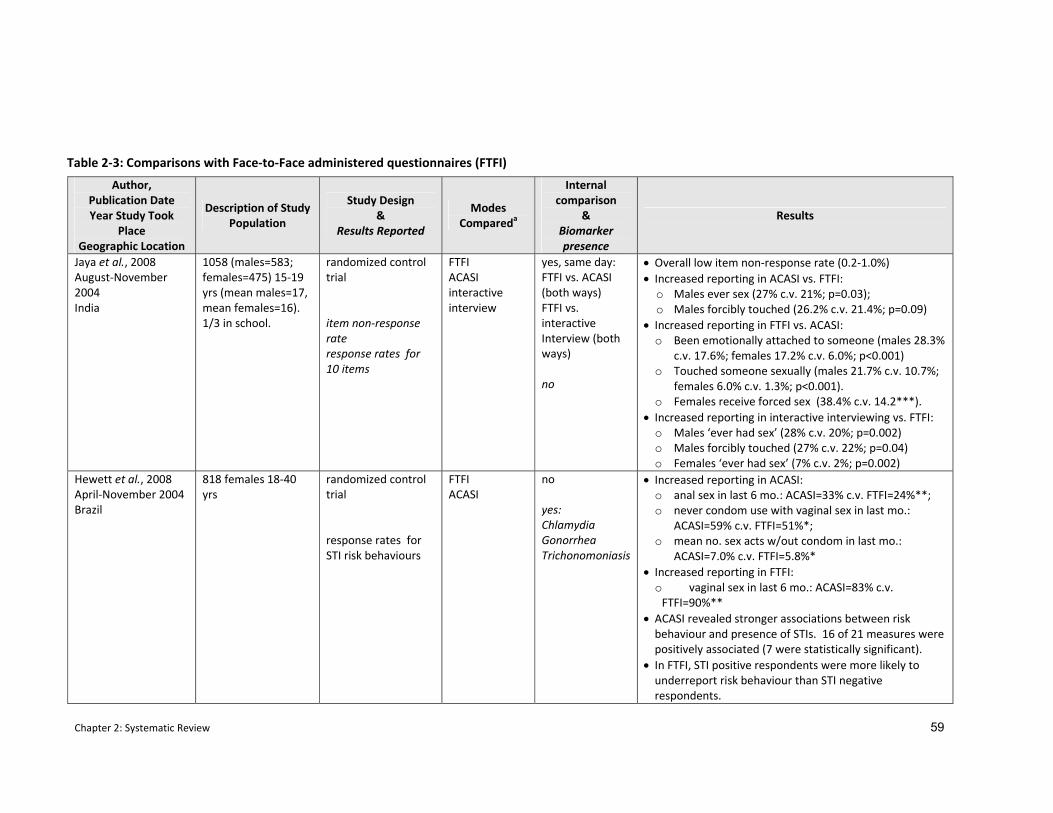
Chapter 2: Systematic Review 59
Author, Publication Date Year Study Took
Place Geographic Location
Description of Study Population
Study Design &
Results Reported
Modes Compareda
Internal comparison
& Biomarker presence
Results
Jaya et al., 2008 August‐November 2004 India
1058 (males=583; females=475) 15‐19 yrs (mean males=17, mean females=16). 1/3 in school.
randomized control trial item non‐response rate response rates for 10 items
FTFI ACASI interactive interview
yes, same day: FTFI vs. ACASI (both ways) FTFI vs. interactive Interview (both ways) no
• Overall low item non‐response rate (0.2‐1.0%) • Increased reporting in ACASI vs. FTFI:
o Males ever sex (27% c.v. 21%; p=0.03); o Males forcibly touched (26.2% c.v. 21.4%; p=0.09)
• Increased reporting in FTFI vs. ACASI: o Been emotionally attached to someone (males 28.3%
c.v. 17.6%; females 17.2% c.v. 6.0%; p<0.001) o Touched someone sexually (males 21.7% c.v. 10.7%;
females 6.0% c.v. 1.3%; p<0.001). o Females receive forced sex (38.4% c.v. 14.2***).
• Increased reporting in interactive interviewing vs. FTFI: o Males ‘ever had sex’ (28% c.v. 20%; p=0.002) o Males forcibly touched (27% c.v. 22%; p=0.04) o Females ‘ever had sex’ (7% c.v. 2%; p=0.002)
Hewett et al., 2008 April‐November 2004 Brazil
818 females 18‐40 yrs
randomized control trial response rates for STI risk behaviours
FTFI ACASI
no yes: Chlamydia Gonorrhea Trichonomoniasis
• Increased reporting in ACASI: o anal sex in last 6 mo.: ACASI=33% c.v. FTFI=24%**; o never condom use with vaginal sex in last mo.:
ACASI=59% c.v. FTFI=51%*; o mean no. sex acts w/out condom in last mo.:
ACASI=7.0% c.v. FTFI=5.8%* • Increased reporting in FTFI:
o vaginal sex in last 6 mo.: ACASI=83% c.v. FTFI=90%**
• ACASI revealed stronger associations between risk behaviour and presence of STIs. 16 of 21 measures were positively associated (7 were statistically significant).
• In FTFI, STI positive respondents were more likely to underreport risk behaviour than STI negative respondents.
Table 2‐3: Comparisons with Face‐to‐Face administered questionnaires (FTFI)
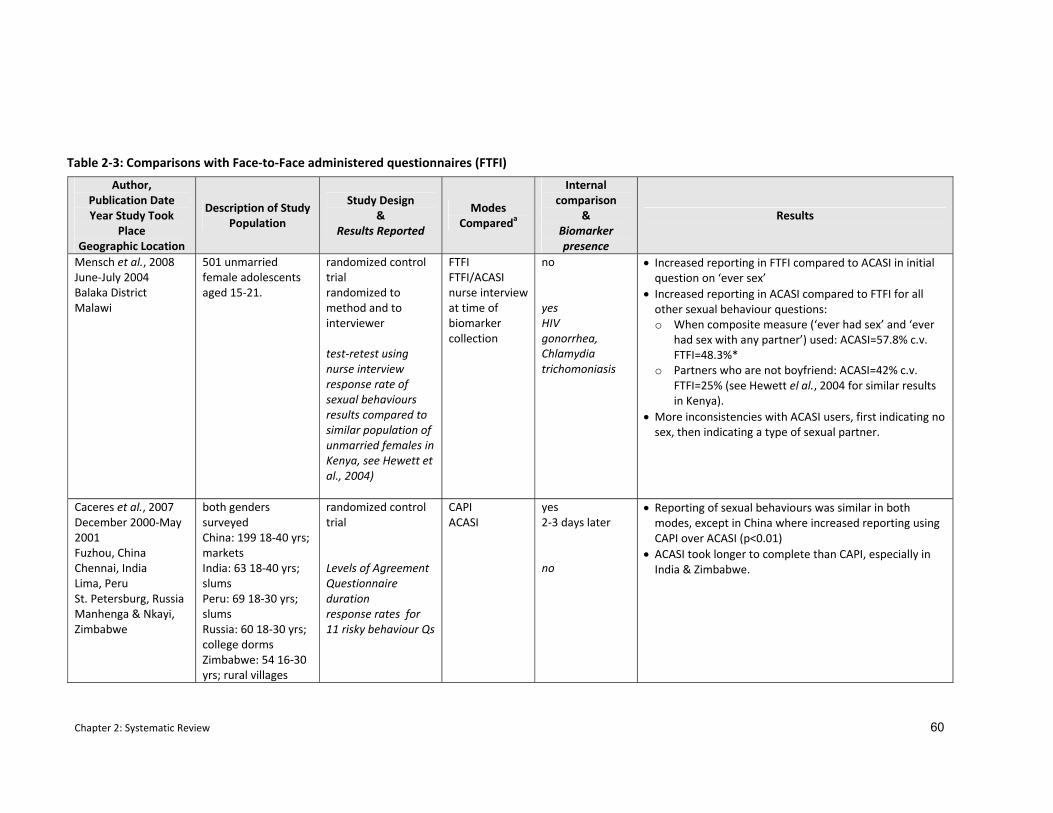
Chapter 2: Systematic Review 60
Author, Publication Date Year Study Took
Place Geographic Location
Description of Study Population
Study Design &
Results Reported
Modes Compareda
Internal comparison
& Biomarker presence
Results
Mensch et al., 2008 June‐July 2004 Balaka District Malawi
501 unmarried female adolescents aged 15‐21.
randomized control trial randomized to method and to interviewer test‐retest using nurse interview response rate of sexual behaviours results compared to similar population of unmarried females in Kenya, see Hewett et al., 2004)
FTFI FTFI/ACASI nurse interview at time of biomarker collection
no yes HIV gonorrhea, Chlamydia trichomoniasis
• Increased reporting in FTFI compared to ACASI in initial question on ‘ever sex’
• Increased reporting in ACASI compared to FTFI for all other sexual behaviour questions: o When composite measure (‘ever had sex’ and ‘ever
had sex with any partner’) used: ACASI=57.8% c.v. FTFI=48.3%*
o Partners who are not boyfriend: ACASI=42% c.v. FTFI=25% (see Hewett el al., 2004 for similar results in Kenya).
• More inconsistencies with ACASI users, first indicating no sex, then indicating a type of sexual partner.
Caceres et al., 2007 December 2000‐May 2001 Fuzhou, China Chennai, India Lima, Peru St. Petersburg, Russia Manhenga & Nkayi, Zimbabwe
both genders surveyed China: 199 18‐40 yrs; markets India: 63 18‐40 yrs; slums Peru: 69 18‐30 yrs; slums Russia: 60 18‐30 yrs; college dorms Zimbabwe: 54 16‐30 yrs; rural villages
randomized control trial Levels of Agreement Questionnaire duration response rates for 11 risky behaviour Qs
CAPI ACASI
yes 2‐3 days later no
• Reporting of sexual behaviours was similar in both modes, except in China where increased reporting using CAPI over ACASI (p<0.01)
• ACASI took longer to complete than CAPI, especially in India & Zimbabwe.
Table 2‐3: Comparisons with Face‐to‐Face administered questionnaires (FTFI)
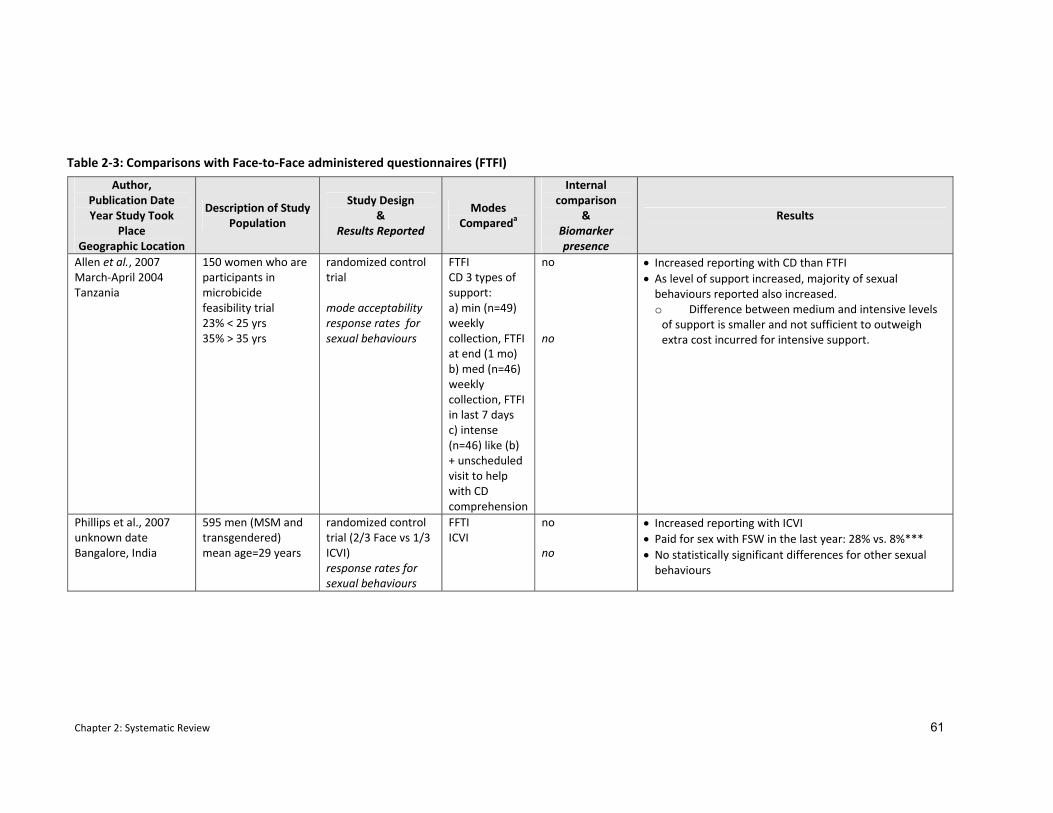
Chapter 2: Systematic Review 61
Author, Publication Date Year Study Took
Place Geographic Location
Description of Study Population
Study Design &
Results Reported
Modes Compareda
Internal comparison
& Biomarker presence
Results
Allen et al., 2007 March‐April 2004 Tanzania
150 women who are participants in microbicide feasibility trial 23% < 25 yrs 35% > 35 yrs
randomized control trial mode acceptability response rates for sexual behaviours
FTFI CD 3 types of support: a) min (n=49) weekly collection, FTFI at end (1 mo) b) med (n=46) weekly collection, FTFI in last 7 days c) intense (n=46) like (b) + unscheduled visit to help with CD comprehension
no no
• Increased reporting with CD than FTFI • As level of support increased, majority of sexual behaviours reported also increased. o Difference between medium and intensive levels of support is smaller and not sufficient to outweigh extra cost incurred for intensive support.
Phillips et al., 2007 unknown date Bangalore, India
595 men (MSM and transgendered) mean age=29 years
randomized control trial (2/3 Face vs 1/3 ICVI) response rates for sexual behaviours
FFTI ICVI
no no
• Increased reporting with ICVI • Paid for sex with FSW in the last year: 28% vs. 8%*** • No statistically significant differences for other sexual behaviours
Table 2‐3: Comparisons with Face‐to‐Face administered questionnaires (FTFI)
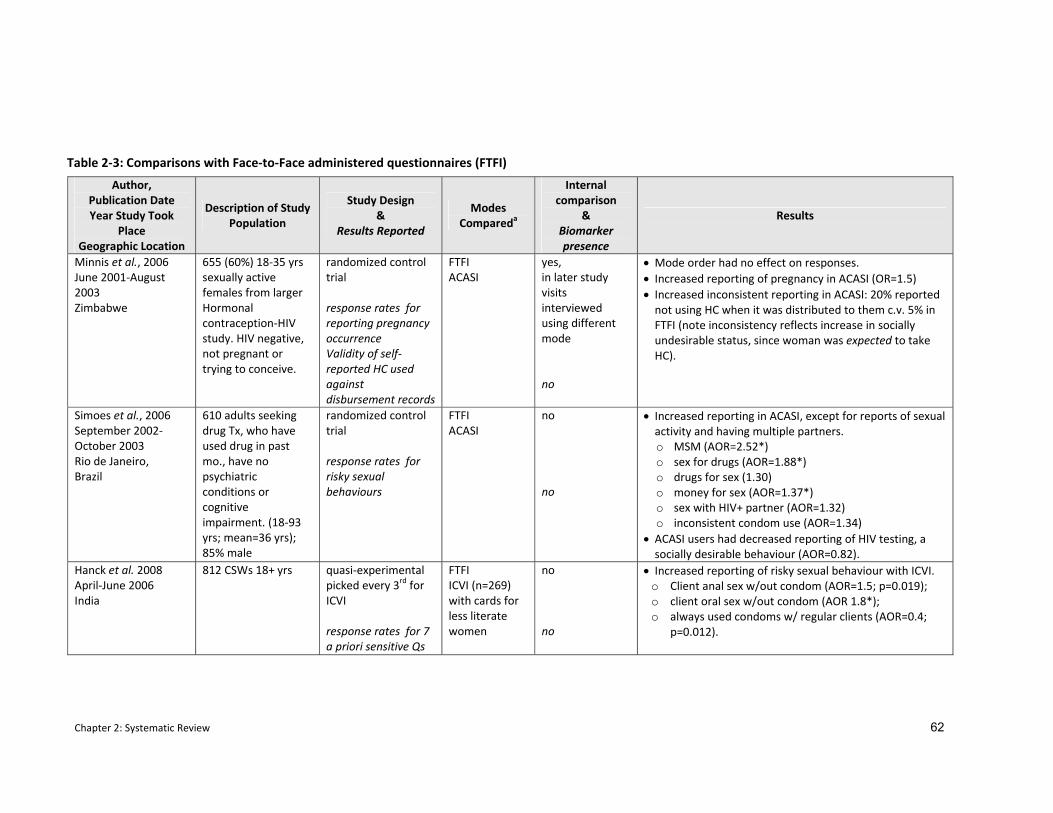
Chapter 2: Systematic Review 62
Author, Publication Date Year Study Took
Place Geographic Location
Description of Study Population
Study Design &
Results Reported
Modes Compareda
Internal comparison
& Biomarker presence
Results
Minnis et al., 2006 June 2001‐August 2003 Zimbabwe
655 (60%) 18‐35 yrs sexually active females from larger Hormonal contraception‐HIV study. HIV negative, not pregnant or trying to conceive.
randomized control trial response rates for reporting pregnancy occurrence Validity of self‐reported HC used against disbursement records
FTFI ACASI
yes, in later study visits interviewed using different mode no
• Mode order had no effect on responses. • Increased reporting of pregnancy in ACASI (OR=1.5) • Increased inconsistent reporting in ACASI: 20% reported not using HC when it was distributed to them c.v. 5% in FTFI (note inconsistency reflects increase in socially undesirable status, since woman was expected to take HC).
Simoes et al., 2006 September 2002‐October 2003 Rio de Janeiro, Brazil
610 adults seeking drug Tx, who have used drug in past mo., have no psychiatric conditions or cognitive impairment. (18‐93 yrs; mean=36 yrs); 85% male
randomized control trial response rates for risky sexual behaviours
FTFI ACASI
no no
• Increased reporting in ACASI, except for reports of sexual activity and having multiple partners. o MSM (AOR=2.52*) o sex for drugs (AOR=1.88*) o drugs for sex (1.30) o money for sex (AOR=1.37*) o sex with HIV+ partner (AOR=1.32) o inconsistent condom use (AOR=1.34)
• ACASI users had decreased reporting of HIV testing, a socially desirable behaviour (AOR=0.82).
Hanck et al. 2008 April‐June 2006 India
812 CSWs 18+ yrs quasi‐experimental picked every 3rd for ICVI response rates for 7 a priori sensitive Qs
FTFI ICVI (n=269) with cards for less literate women
no no
• Increased reporting of risky sexual behaviour with ICVI. o Client anal sex w/out condom (AOR=1.5; p=0.019); o client oral sex w/out condom (AOR 1.8*); o always used condoms w/ regular clients (AOR=0.4;
p=0.012).
Table 2‐3: Comparisons with Face‐to‐Face administered questionnaires (FTFI)
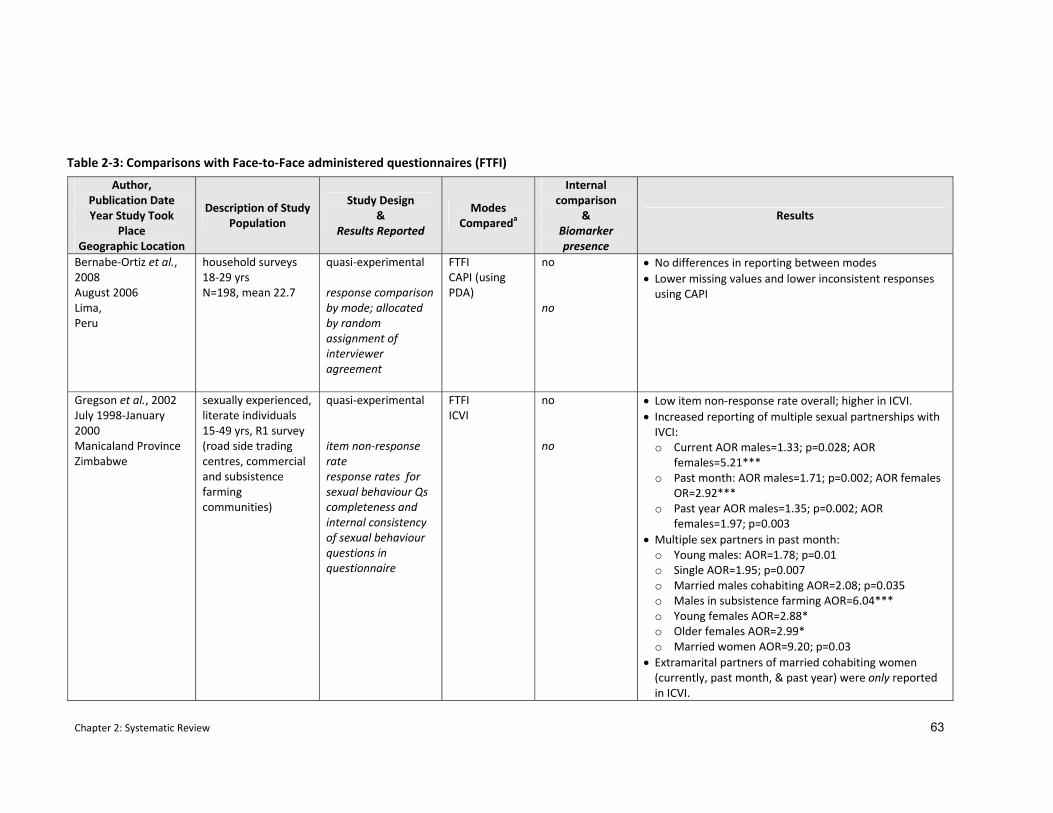
Chapter 2: Systematic Review 63
Author, Publication Date Year Study Took
Place Geographic Location
Description of Study Population
Study Design &
Results Reported
Modes Compareda
Internal comparison
& Biomarker presence
Results
Bernabe‐Ortiz et al., 2008 August 2006 Lima, Peru
household surveys 18‐29 yrs N=198, mean 22.7
quasi‐experimental response comparison by mode; allocated by random assignment of interviewer agreement
FTFI CAPI (using PDA)
no no
• No differences in reporting between modes • Lower missing values and lower inconsistent responses using CAPI
Gregson et al., 2002 July 1998‐January 2000 Manicaland Province Zimbabwe
sexually experienced, literate individuals 15‐49 yrs, R1 survey (road side trading centres, commercial and subsistence farming communities)
quasi‐experimental item non‐response rate response rates for sexual behaviour Qs completeness and internal consistency of sexual behaviour questions in questionnaire
FTFI ICVI
no no
• Low item non‐response rate overall; higher in ICVI. • Increased reporting of multiple sexual partnerships with IVCI: o Current AOR males=1.33; p=0.028; AOR
females=5.21*** o Past month: AOR males=1.71; p=0.002; AOR females
OR=2.92*** o Past year AOR males=1.35; p=0.002; AOR
females=1.97; p=0.003 • Multiple sex partners in past month:
o Young males: AOR=1.78; p=0.01 o Single AOR=1.95; p=0.007 o Married males cohabiting AOR=2.08; p=0.035 o Males in subsistence farming AOR=6.04*** o Young females AOR=2.88* o Older females AOR=2.99* o Married women AOR=9.20; p=0.03
• Extramarital partners of married cohabiting women (currently, past month, & past year) were only reported in ICVI.
Table 2‐3: Comparisons with Face‐to‐Face administered questionnaires (FTFI)
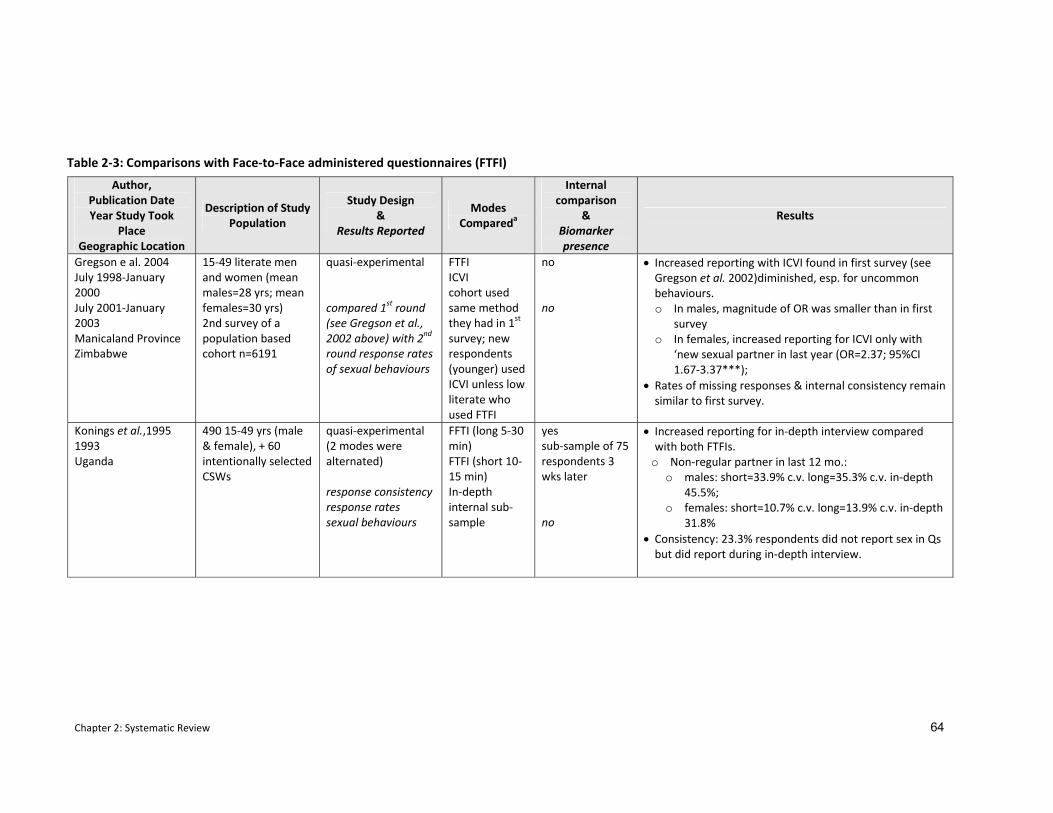
Chapter 2: Systematic Review 64
Author, Publication Date Year Study Took
Place Geographic Location
Description of Study Population
Study Design &
Results Reported
Modes Compareda
Internal comparison
& Biomarker presence
Results
Gregson e al. 2004 July 1998‐January 2000 July 2001‐January 2003 Manicaland Province Zimbabwe
15‐49 literate men and women (mean males=28 yrs; mean females=30 yrs) 2nd survey of a population based cohort n=6191
quasi‐experimental compared 1st round (see Gregson et al., 2002 above) with 2nd round response rates of sexual behaviours
FTFI ICVI cohort used same method they had in 1st survey; new respondents (younger) used ICVI unless low literate who used FTFI
no no
• Increased reporting with ICVI found in first survey (see Gregson et al. 2002)diminished, esp. for uncommon behaviours. o In males, magnitude of OR was smaller than in first
survey o In females, increased reporting for ICVI only with
‘new sexual partner in last year (OR=2.37; 95%CI 1.67‐3.37***);
• Rates of missing responses & internal consistency remain similar to first survey.
Konings et al.,1995 1993 Uganda
490 15‐49 yrs (male & female), + 60 intentionally selected CSWs
quasi‐experimental (2 modes were alternated) response consistency response rates sexual behaviours
FFTI (long 5‐30 min) FTFI (short 10‐15 min) In‐depth internal sub‐sample
yes sub‐sample of 75 respondents 3 wks later no
• Increased reporting for in‐depth interview compared with both FTFIs.
o Non‐regular partner in last 12 mo.: o males: short=33.9% c.v. long=35.3% c.v. in‐depth
45.5%; o females: short=10.7% c.v. long=13.9% c.v. in‐depth
31.8% • Consistency: 23.3% respondents did not report sex in Qs but did report during in‐depth interview.
Table 2‐3: Comparisons with Face‐to‐Face administered questionnaires (FTFI)
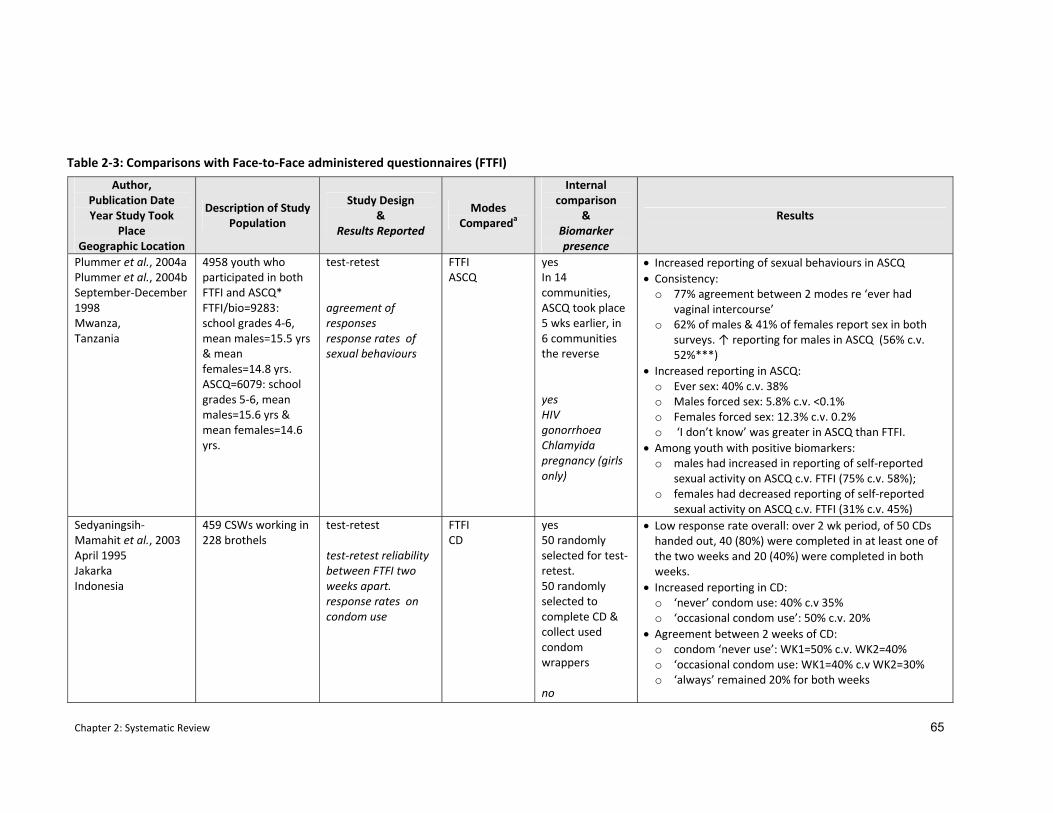
Chapter 2: Systematic Review 65
Author, Publication Date Year Study Took
Place Geographic Location
Description of Study Population
Study Design &
Results Reported
Modes Compareda
Internal comparison
& Biomarker presence
Results
Plummer et al., 2004a Plummer et al., 2004b September‐December 1998 Mwanza, Tanzania
4958 youth who participated in both FTFI and ASCQ* FTFI/bio=9283: school grades 4‐6, mean males=15.5 yrs & mean females=14.8 yrs. ASCQ=6079: school grades 5‐6, mean males=15.6 yrs & mean females=14.6 yrs.
test‐retest agreement of responses response rates of sexual behaviours
FTFI ASCQ
yes In 14 communities, ASCQ took place 5 wks earlier, in 6 communities the reverse yes HIV gonorrhoea Chlamyida pregnancy (girls only)
• Increased reporting of sexual behaviours in ASCQ • Consistency:
o 77% agreement between 2 modes re ‘ever had vaginal intercourse’
o 62% of males & 41% of females report sex in both surveys. ↑ reporting for males in ASCQ (56% c.v. 52%***)
• Increased reporting in ASCQ: o Ever sex: 40% c.v. 38% o Males forced sex: 5.8% c.v. <0.1% o Females forced sex: 12.3% c.v. 0.2% o ‘I don’t know’ was greater in ASCQ than FTFI.
• Among youth with positive biomarkers: o males had increased in reporting of self‐reported
sexual activity on ASCQ c.v. FTFI (75% c.v. 58%); o females had decreased reporting of self‐reported
sexual activity on ASCQ c.v. FTFI (31% c.v. 45%) Sedyaningsih‐Mamahit et al., 2003 April 1995 Jakarka Indonesia
459 CSWs working in 228 brothels
test‐retest test‐retest reliability between FTFI two weeks apart. response rates on condom use
FTFI CD
yes 50 randomly selected for test‐retest. 50 randomly selected to complete CD & collect used condom wrappers no
• Low response rate overall: over 2 wk period, of 50 CDs handed out, 40 (80%) were completed in at least one of the two weeks and 20 (40%) were completed in both weeks.
• Increased reporting in CD: o ‘never’ condom use: 40% c.v 35% o ‘occasional condom use’: 50% c.v. 20%
• Agreement between 2 weeks of CD: o condom ‘never use’: WK1=50% c.v. WK2=40% o ‘occasional condom use: WK1=40% c.v WK2=30% o ‘always’ remained 20% for both weeks
Table 2‐3: Comparisons with Face‐to‐Face administered questionnaires (FTFI)
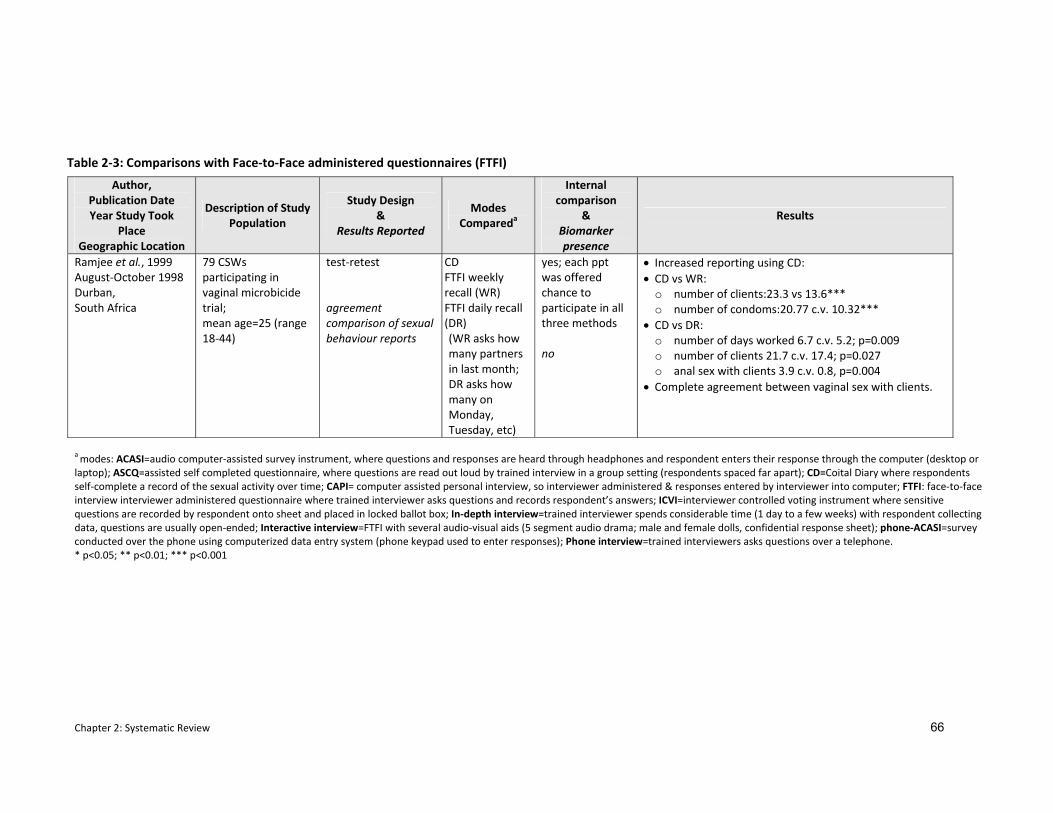
Chapter 2: Systematic Review 66
Author, Publication Date Year Study Took
Place Geographic Location
Description of Study Population
Study Design &
Results Reported
Modes Compareda
Internal comparison
& Biomarker presence
Results
Ramjee et al., 1999 August‐October 1998 Durban, South Africa
79 CSWs participating in vaginal microbicide trial; mean age=25 (range 18‐44)
test‐retest agreement comparison of sexual behaviour reports
CD FTFI weekly recall (WR) FTFI daily recall (DR) (WR asks how many partners in last month; DR asks how many on Monday, Tuesday, etc)
yes; each ppt was offered chance to participate in all three methods no
• Increased reporting using CD: • CD vs WR:
o number of clients:23.3 vs 13.6*** o number of condoms:20.77 c.v. 10.32***
• CD vs DR: o number of days worked 6.7 c.v. 5.2; p=0.009 o number of clients 21.7 c.v. 17.4; p=0.027 o anal sex with clients 3.9 c.v. 0.8, p=0.004
• Complete agreement between vaginal sex with clients.
a modes: ACASI=audio computer‐assisted survey instrument, where questions and responses are heard through headphones and respondent enters their response through the computer (desktop or laptop); ASCQ=assisted self completed questionnaire, where questions are read out loud by trained interview in a group setting (respondents spaced far apart); CD=Coital Diary where respondents self‐complete a record of the sexual activity over time; CAPI= computer assisted personal interview, so interviewer administered & responses entered by interviewer into computer; FTFI: face‐to‐face interview interviewer administered questionnaire where trained interviewer asks questions and records respondent’s answers; ICVI=interviewer controlled voting instrument where sensitive questions are recorded by respondent onto sheet and placed in locked ballot box; In‐depth interview=trained interviewer spends considerable time (1 day to a few weeks) with respondent collecting data, questions are usually open‐ended; Interactive interview=FTFI with several audio‐visual aids (5 segment audio drama; male and female dolls, confidential response sheet); phone‐ACASI=survey conducted over the phone using computerized data entry system (phone keypad used to enter responses); Phone interview=trained interviewers asks questions over a telephone. * p<0.05; ** p<0.01; *** p<0.001
Table 2‐3: Comparisons with Face‐to‐Face administered questionnaires (FTFI)
Chapter 2: Systematic Review 67
were less likely to report having been tested for HIV, a behaviour which is encouraged
(AOR=0.85 95% CI 0.6‐1.2).
Data from young people in India produced less consistent results where face‐to‐face
interviewing was used as the comparison against both ACASI and interactive interviewing
which included tools (e.g. drama, dolls) to help de‐sensitise sensitive topics (see explanation in
2.3.2 above) (Jaya et al., 2008). More sexual behaviours were reported using interactive
interviewing than face‐to‐face interviewing. When face‐to‐face interviewing was compared
against ACASI, female respondents consistently reported fewer sexual behaviours in ACASI
than FTFI. Females were two times as likely to report having been forcibly touched using FTFI
(38.4% c.v. 14.2%; p<0.001). Reporting by males was more varied. While males were more
likely to report having had sex (26.9% c.v. 21.4%; p=0.03) and having been forcibly touched
(26.2% c.v. 21.4%; p=0.09) using ACASI, both male and females were more likely to report
being emotionally attached to someone (males 28.3% c.v. 17.6%; females 17.2% c.v. 6.0%;
p<0.001) or having touched someone sexually (males 21.7% c.v. 10.7%; females 6.0% c.v. 1.3%;
p<0.001) using FTFI. For a number of other behaviours, there were no statistically significant
differences in reporting between ACASI and FTFI.
In a study in Zimbabwe on hormonal contraception where eligibility of respondents was
conditional on specific behaviours, ACASI users were more likely to report an undesirable study
behaviour (Minnis et al., 2007). For example, it was a study condition not to get pregnant
during the study and more pregnancies were reported in ACASI interviews than in face‐to‐face
ones (OR=1.5; 95% CI 1.1‐1.9). Likewise, the study asked some respondents to use hormonal
contraception and 20% of ACASI users who had been given hormonal contraception reported
not using it at the next study visit compared with only 5% of those who used FTFI. ACASI users
were also more likely to report multiple partners than FTFI users (OR=5.7; 95% CI 2.1‐15.2).
In two studies there were no reported differences using ACASI when compared against
interviewer data collected using a computer (CAPI) (Caceres et al., 2007; Bernabe‐Ortiz et al.,
2008). In the five countries covered in these studies, a greater reporting of sexual behaviours
using CAPI over ACASI was found only in China which the authors attribute to having a larger
sample size (China n=199 c.v. <70 in the other countries) (Caceres et al., 2007). In the other
four countries, where smaller numbers of respondents were recruited, no statistically
significant differences were found (Caceres et al., 2007; Bernabe‐Ortiz et al., 2008).
In the eight studies which compared face‐to‐face interviewing with a non‐ACASI mode (ICVI,
coital diaries, in‐depth interviewing, and assisted self‐completed questionnaires), all of them
Chapter 2: Systematic Review 68
found increased rates of reporting of sensitive behaviours against face‐to‐face interviewing.
This was true for both socially desirable and socially undesirable behaviours.
Three studies compared FTFI against coital diaries, one in Indonesia (Sedyaningsih‐Mamahit et
al., 2003), one in South Africa (Ramjee et al., 1999) and one in Tanzania (Allen et al., 2007). In
the two studies from Africa, women were respondents in a microbicide feasibility trial. In all
three studies coital diaries provided increased reporting of sensitive behaviours. In Tanzania,
increased reporting using coital diaries (p<0.001) were found for reports of vaginal cleaning
(52.9% c.v. 36.4%), sex during menstruation (10.7% c.v. 0.7% ), and sex with an irregular
partner (28.4% c.v. 6.4%) when compared against FTFI (Allen et al., 2007). In Indonesia and in
South Africa, which studied commercial sex workers, greater numbers of clients were recorded
in coital diaries (South Africa) and there were increased reports of never using condoms (and a
decrease in reports of always using condoms, a socially desirable status) (Indonesia) (Ramjee
et al., 1999; Sedyaningsih‐Mamahit et al., 2003). However, in South Africa, 36% (15/42) of the
respondents reported forgetting to complete their diary at some point and all respondents
reported keeping the diary hidden from their clients and regular partners. Diary loss was an
even greater problem with the study in Indonesia, where only 20% of the 50 diaries were
completed during the two week period asked of them (Sedyaningsih‐Mamahit et al., 2003).
There were four studies that examined the use of an interviewer‐controlled voting instrument
(ICVI), where respondents marked their responses to sensitive questions privately and then
posted them into a locked box. Two studies were in rural Zimbabwe which were run in the
same cohort at two different time points, one was with commercial sex workers in India, and
one with transgendered men and men having sex with men in India (Phillips et al., 2007; Hanck
et al., 2008; Gregson et al., 2002b; Gregson et al., 2004). In Zimbabwe, while the differences
were smaller in the second survey conducted three years later, sexual behaviours were more
likely to be reported with ICVI than with a traditional FTFI. In the first survey, ICVI users were
more likely to report multiple sex partners currently (males OR=1.33; p=0.028; females
OR=5.21; p<0.001), in the past month (males OR=1.71; p=0.002, females OR=2.92; p<0.001),
and in the past year (males OR=1.35; p=0.002, females OR=1.97; p=0.003). Married cohabiting
women only reported extramarital partners when using ICVI. In both studies in India increased
reporting of sensitive behaviours was also found with ICVI (Phillips et al., 2007; Hanck et al.,
2008). This was true among commercial sex workers even when respondents breached the
protocol (65/112) and disclosed their answers to the interviewer (Hanck et al., 2008). In the
study from Bangalore, there was increased reporting among males of injecting drug use (4% vs
1%, p=0.008) and paying for sex with female sex worker (28% vs. 8%, p=0.001). However there
Chapter 2: Systematic Review 69
was no difference in reporting of sexual risk behaviours (never used a condom, non‐condom
use with main female partner, and selling sex to other men).
Mode order was only examined in one study where no difference were found (Minnis et al.,
2007).
2.3.2.3 Comparison of respondent responses in two questionnaire delivery modes
Three studies examined agreement between a respondent’s responses when they were asked
the same questions using two different questionnaire delivery modes (Plummer et al., 2004a;
Plummer et al., 2004b; Konings et al., 1995; Mensch et al., 2008). In Tanzanian school‐going
young people, respondents were administered the same questionnaire in two different modes
(FTFI or ASCQ where respondents had the questions read aloud to them in a single gender
group setting) five weeks apart (Plummer et al., 2004b; Plummer et al., 2004a). Sixty‐two
percent of males and 41% of females reported having sex in both surveys (Plummer et al.,
2004a). There was 64.4% agreement in reporting of age at first sex and 47.3% agreement
around the number of sexual partners (Plummer et al., 2004b). When differences in individual
responses occurred, males were significantly more likely to report having had sex in ASCQ than
in FTFI (p<0.001) (Plummer et al., 2004b). For questions on risky behaviours, such as condom
use, forced sex, and pregnancy, respondents were more likely to report these behaviours in
ASCQ. For example, while only one female reported being pregnant in both questionnaires,
1.4% reported pregnancy in ACSQ only compared to just 0.2% in FTFI only. Similarly, forced
sex was reported by only one female in both surveys, but it was reported by 12.3% of females
in ACSQ only compared with 0.2% in FTFI only (Plummer et al., 2004b). Similar findings were
reported among males none of whom reported forced sex in both questionnaires but 5.8%
reported it in ASCQ only and less than 0.1% reported it in FTFI only (Plummer et al., 2004b).
There was also increased reporting of socially less desirable partnerships in ASCQ
(stranger=4.4% c.v. 0.2%, p<0.001).
In Uganda, 23.3% of respondents reported not engaging in sex when asked in the face‐to‐face
interview but then reported sexual activity in an in‐depth interview (Konings et al., 1995).
There was also a statistically significant difference (p<0.01) in reporting non‐regular partners
where differences were 10% higher in in‐depth interviews among all three sub‐samples (men,
women, and female sex workers). In Malawi, amongst unmarried female adolescents, while
not statistically significant, a larger proportion (8.2%; 95% CI 2.7‐18.1) of ACASI users changed
their response about sex from ‘yes’ to ‘no’ in a subsequent FTFI with a nurse than respondents
who initially took an interviewer‐administered questionnaire (6.5%; 95% CI 2.7‐13.0) (Mensch
et al., 2008).
Chapter 2: Systematic Review 70
2.3.3 Comparison of SAQ and FTFI against other modes
There were seven studies that compared both SAQ and FTFI with at least one other mode
(including ACASI and its derivatives and random response technique). Six of these were
conducted as randomized controlled trials (Langhaug et al., 2007; Potdar et al., 2005; Le et al.,
2006; Mensch et al., 2003; Hewett et al., 2004; van Griensven et al., 2006), one used a quasi‐
experimental design (Lara et al., 2004) (see Table 2‐4). Studies ranged geographically (Mexico,
India, Viet Nam, Thailand, and Kenya) and five out of six of them focussed on youth (ranging
from 15‐24 years).
2.3.3.1 Comparison of response rates
Item non‐response rates were reported in two studies (Langhaug et al., 2007; van Griensven et
al., 2006). The study from Thailand found 80% of self‐administered questionnaires had missing
data and inconsistencies, this compared with 14% in those which were interviewer‐
administered (van Griensven et al., 2006). In this study no missing data or inconsistencies
were found in ACASI and its derivative, PASI, questionnaires. In the study from Zimbabwe,
item non‐response was significantly higher with SAQ and Audio‐SAQ than with ICVI and ACASI
(p<0.001) (Langhaug et al., 2007).
2.3.3.2 Comparisons of reporting of sexual behaviours
Data on rates of reporting sexual behaviours are somewhat less clear. In India, two
populations were studied, male college students who were asked to complete using SAQ,
ACASI or undergo an interview, and similarly aged adolescent males living in slums who were
asked to complete using either ACASI or undergo an interview (Potdar et al., 2005). In college
males, there was increased reporting of sexual behaviours among ACASI users for heterosexual
sex (AOR=1.8,p<0.05), oral sex with a female (AOR=2.08; p<0.05), homosexual sex (AOR=8.1;
p<0.05) and having experienced coercive sex (AOR=11.35;0<0.01). In male youth living in
slums, masturbation (AOR=22.53; p<0.001) and oral sex with a woman (AOR=2.4;p<0.010) was
also higher among ACASI users. However, males residing in slums were less likely to report
vaginal sex (AOR=0.23, p<0.001) when using ACASI compared with FTFI.
Data from youth in two districts in Kenya were also inconclusive. In both districts, youth
reported more premarital sex to an interviewer than when using SAQ or ACASI (males ‘ever
sex’ OR=0.58 against FTFI; females ‘ever sex’ OR 0.66 against SAQ). (Mensch et al., 2003). In
addition, ACASI suffered from inconsistent reporting. Among unmarried 15‐21 year old
females, when they added a ‘refuse to answer’ button with ACASI, 14.7% of ACASI respondents
refused to answer at least one sensitive question (Hewett et al., 2004). However, among
females in Kisumu, when ACASI was compared against face‐to‐face interviews, researchers
Chapter 2: Systematic Review 71
found statistically significant (p<0.001) increased reporting for subsequent sexual behaviour
questions around partnerships and types of sexual activity (sex with friend OR=6.26; sex with
stranger OR=3.45; sex with male >10 years older OR 3.55) (Hewett et al., 2004). Part of this
inconsistency may be attributed to study limitations, primarily political tension in one of the
districts (Nyeri) which could have caused mistrust around data collection in these rural
communities (Mensch et al., 2003).
Mensch and colleagues also report that in this same district, they experienced a lower
assignment to ACASI, which would not be expected with randomization. Anecdotal data
suggests that some interviewers might have over‐allocated face‐to‐face interviews to
themselves in the ‘hope that by conducting more interviews, they would be looked upon
favourably for possible future employment.” ((Hewett, Erulkar, & Mensch, 2003), p.20). In
countries where jobs are scarce, it may be necessary for researchers to be aware of the
possible threat that ACASI holds for local field staff.
In addition to studying sexual behaviours, the study in Viet Nam also explored young people’s
attitudes and norms around sexual behaviours and their self‐efficacy around condom use
comparing SAQ, FTFI, and ACASI (Le et al., 2006). Respondents using ACASI were more likely to
report liberal attitudes around premarital sex (a socially censured norm) and to report less
confidence in their ability to access condoms (a socially condoned behaviour). More females
refused to answer questions about condom use and refusals were greatest amongst SAQ and
FTFI users. With regards to self‐reports, ACASI users were more likely to report having
experienced sex before marriage, and unmarried males were twice as likely to report having
had sex with a commercial sex worker (OR=2.8, p<0.05). Younger males aged 15‐19 were also
two times more likely to report having had sex using ACASI (OR=2.79, p<0.05).
In both the Zimbabwean and Thai study, four modes (SAQ, FTFI, ACASI, PASI) were compared
(van Griensven et al., 2006; Langhaug et al., 2007). In the Thai study, data generally showed
no difference in reporting of sexual behaviours between SAQ, ACASI, and PASI when compared
against each other. There was also no statistically significant difference between ACASI and its
derivative PASI around reporting of sexual behaviours. However, regarding self‐reports of the
most sensitive behaviours, there was a statistically significant difference (p<0.001) between
PASI when compared against FTFI (history of oral sex 37.3% c.v. 13.2%; sex today/yesterday
19.3% c.v. 6.1%; sold sex 8.2% c.v. 0.9%; bought sex 8.2% c.v. 2.5%). In the Zimbabwean study,
after adjusting for covariates, Audio‐SAQ and ACASI users were twice as likely to report sexual
activity when compared to SAQ users (Audio‐SAQ AOR=2.05 [95% CI: 1.2‐3.4]; ACASI AOR=2.0
[95% CI: 1.2‐3.2]), with no reporting difference between ICVI and SAQ users (ICVI AOR=1.0
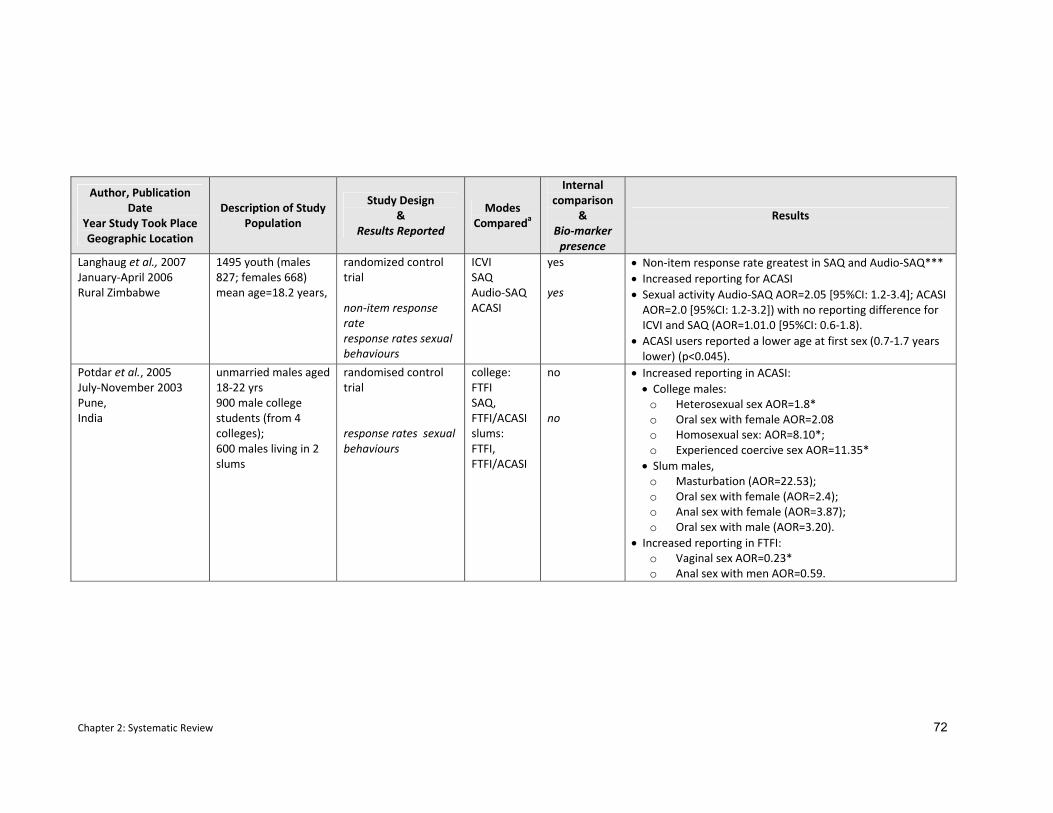
Chapter 2: Systematic Review 72
Author, Publication Date
Year Study Took Place Geographic Location
Description of Study Population
Study Design &
Results Reported
Modes Compareda
Internal comparison
& Bio‐marker presence
Results
Langhaug et al., 2007 January‐April 2006 Rural Zimbabwe
1495 youth (males 827; females 668) mean age=18.2 years,
randomized control trial non‐item response rate response rates sexual behaviours
ICVI SAQ Audio‐SAQ ACASI
yes yes
• Non‐item response rate greatest in SAQ and Audio‐SAQ*** • Increased reporting for ACASI • Sexual activity Audio‐SAQ AOR=2.05 [95%CI: 1.2‐3.4]; ACASI AOR=2.0 [95%CI: 1.2‐3.2]) with no reporting difference for ICVI and SAQ (AOR=1.01.0 [95%CI: 0.6‐1.8).
• ACASI users reported a lower age at first sex (0.7‐1.7 years lower) (p<0.045).
Potdar et al., 2005 July‐November 2003 Pune, India
unmarried males aged 18‐22 yrs 900 male college students (from 4 colleges); 600 males living in 2 slums
randomised control trial response rates sexual behaviours
college: FTFI SAQ, FTFI/ACASI slums: FTFI, FTFI/ACASI
no no
• Increased reporting in ACASI: • College males:
o Heterosexual sex AOR=1.8* o Oral sex with female AOR=2.08 o Homosexual sex: AOR=8.10*; o Experienced coercive sex AOR=11.35*
• Slum males, o Masturbation (AOR=22.53); o Oral sex with female (AOR=2.4); o Anal sex with female (AOR=3.87); o Oral sex with male (AOR=3.20).
• Increased reporting in FTFI: o Vaginal sex AOR=0.23* o Anal sex with men AOR=0.59.
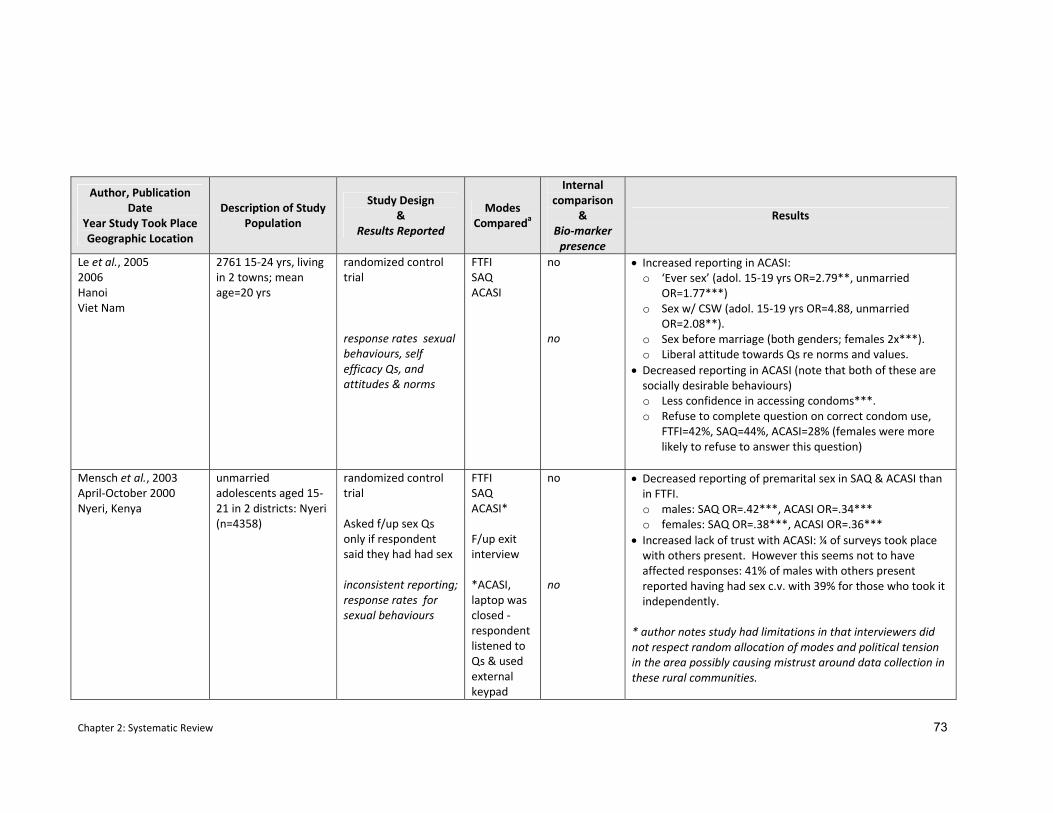
Chapter 2: Systematic Review 73
Author, Publication Date
Year Study Took Place Geographic Location
Description of Study Population
Study Design &
Results Reported
Modes Compareda
Internal comparison
& Bio‐marker presence
Results
Le et al., 2005 2006 Hanoi Viet Nam
2761 15‐24 yrs, living in 2 towns; mean age=20 yrs
randomized control trial response rates sexual behaviours, self efficacy Qs, and attitudes & norms
FTFI SAQ ACASI
no no
• Increased reporting in ACASI: o ‘Ever sex’ (adol. 15‐19 yrs OR=2.79**, unmarried
OR=1.77***) o Sex w/ CSW (adol. 15‐19 yrs OR=4.88, unmarried
OR=2.08**). o Sex before marriage (both genders; females 2x***). o Liberal attitude towards Qs re norms and values.
• Decreased reporting in ACASI (note that both of these are socially desirable behaviours) o Less confidence in accessing condoms***. o Refuse to complete question on correct condom use,
FTFI=42%, SAQ=44%, ACASI=28% (females were more likely to refuse to answer this question)
Mensch et al., 2003 April‐October 2000 Nyeri, Kenya
unmarried adolescents aged 15‐21 in 2 districts: Nyeri (n=4358)
randomized control trial Asked f/up sex Qs only if respondent said they had had sex inconsistent reporting;response rates for sexual behaviours
FTFI SAQ ACASI* F/up exit interview *ACASI, laptop was closed ‐ respondent listened to Qs & used external keypad
no no
• Decreased reporting of premarital sex in SAQ & ACASI than in FTFI. o males: SAQ OR=.42***, ACASI OR=.34*** o females: SAQ OR=.38***, ACASI OR=.36***
• Increased lack of trust with ACASI: ¼ of surveys took place with others present. However this seems not to have affected responses: 41% of males with others present reported having had sex c.v. with 39% for those who took it independently.
* author notes study had limitations in that interviewers did not respect random allocation of modes and political tension in the area possibly causing mistrust around data collection in these rural communities.
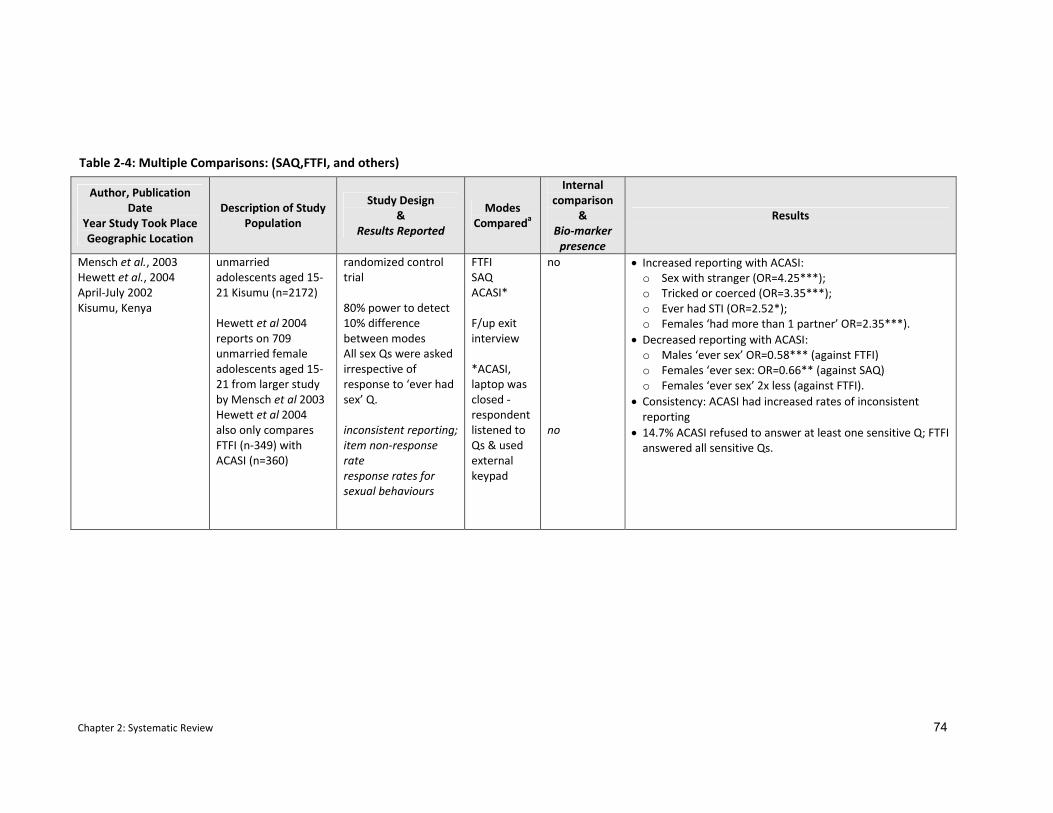
Chapter 2: Systematic Review 74
Author, Publication Date
Year Study Took Place Geographic Location
Description of Study Population
Study Design &
Results Reported
Modes Compareda
Internal comparison
& Bio‐marker presence
Results
Mensch et al., 2003 Hewett et al., 2004 April‐July 2002 Kisumu, Kenya
unmarried adolescents aged 15‐21 Kisumu (n=2172) Hewett et al 2004 reports on 709 unmarried female adolescents aged 15‐21 from larger study by Mensch et al 2003 Hewett et al 2004 also only compares FTFI (n‐349) with ACASI (n=360)
randomized control trial 80% power to detect 10% difference between modes All sex Qs were asked irrespective of response to ‘ever had sex’ Q. inconsistent reporting;item non‐response rate response rates for sexual behaviours
FTFI SAQ ACASI* F/up exit interview *ACASI, laptop was closed ‐ respondent listened to Qs & used external keypad
no no
• Increased reporting with ACASI: o Sex with stranger (OR=4.25***); o Tricked or coerced (OR=3.35***); o Ever had STI (OR=2.52*); o Females ‘had more than 1 partner’ OR=2.35***).
• Decreased reporting with ACASI: o Males ‘ever sex’ OR=0.58*** (against FTFI) o Females ‘ever sex: OR=0.66** (against SAQ) o Females ‘ever sex’ 2x less (against FTFI).
• Consistency: ACASI had increased rates of inconsistent reporting
• 14.7% ACASI refused to answer at least one sensitive Q; FTFI answered all sensitive Qs.
Table 2‐4: Multiple Comparisons: (SAQ,FTFI, and others)
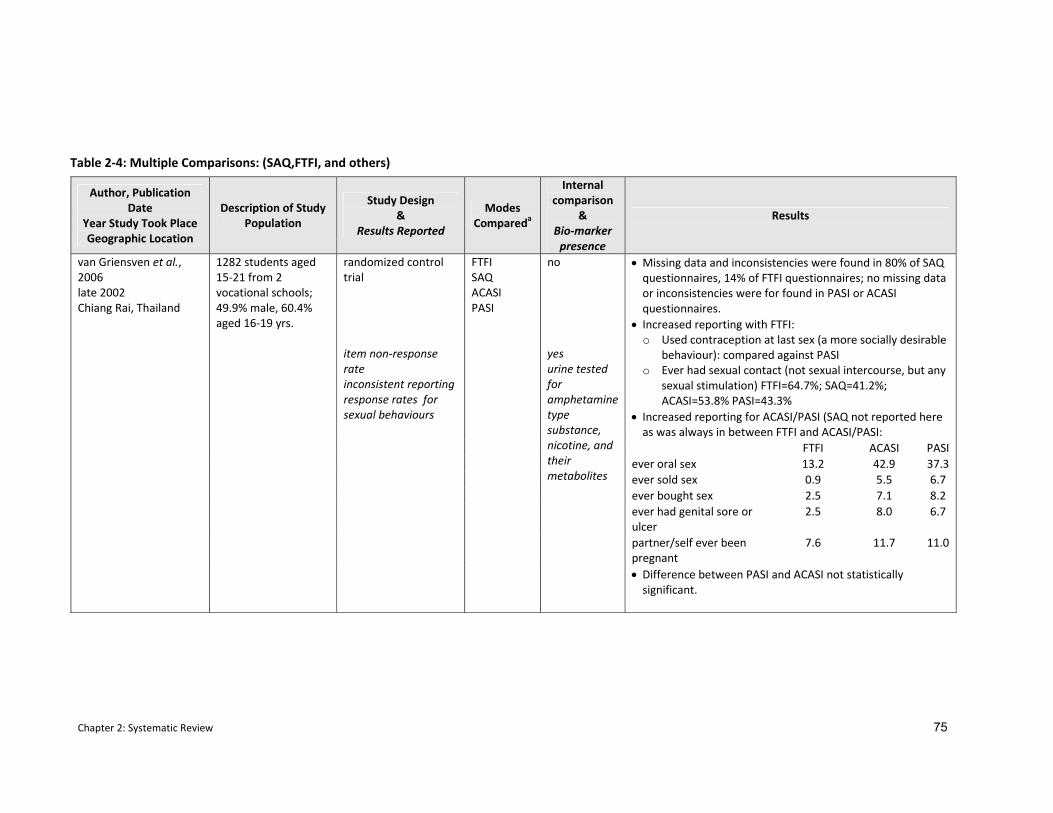
Chapter 2: Systematic Review 75
Author, Publication Date
Year Study Took Place Geographic Location
Description of Study Population
Study Design &
Results Reported
Modes Compareda
Internal comparison
& Bio‐marker presence
Results
• Missing data and inconsistencies were found in 80% of SAQ questionnaires, 14% of FTFI questionnaires; no missing data or inconsistencies were for found in PASI or ACASI questionnaires.
• Increased reporting with FTFI: o Used contraception at last sex (a more socially desirable
behaviour): compared against PASI o Ever had sexual contact (not sexual intercourse, but any
sexual stimulation) FTFI=64.7%; SAQ=41.2%; ACASI=53.8% PASI=43.3%
• Increased reporting for ACASI/PASI (SAQ not reported here as was always in between FTFI and ACASI/PASI:
FTFI ACASI PASI ever oral sex 13.2 42.9 37.3 ever sold sex 0.9 5.5 6.7 ever bought sex 2.5 7.1 8.2 ever had genital sore or ulcer
2.5 8.0 6.7
partner/self ever been pregnant
7.6 11.7 11.0
van Griensven et al., 2006 late 2002 Chiang Rai, Thailand
1282 students aged 15‐21 from 2 vocational schools; 49.9% male, 60.4% aged 16‐19 yrs.
randomized control trial item non‐response rate inconsistent reporting response rates for sexual behaviours
FTFI SAQ ACASI PASI
no yes urine tested for amphetamine type substance, nicotine, and their metabolites
• Difference between PASI and ACASI not statistically significant.
Table 2‐4: Multiple Comparisons: (SAQ,FTFI, and others)
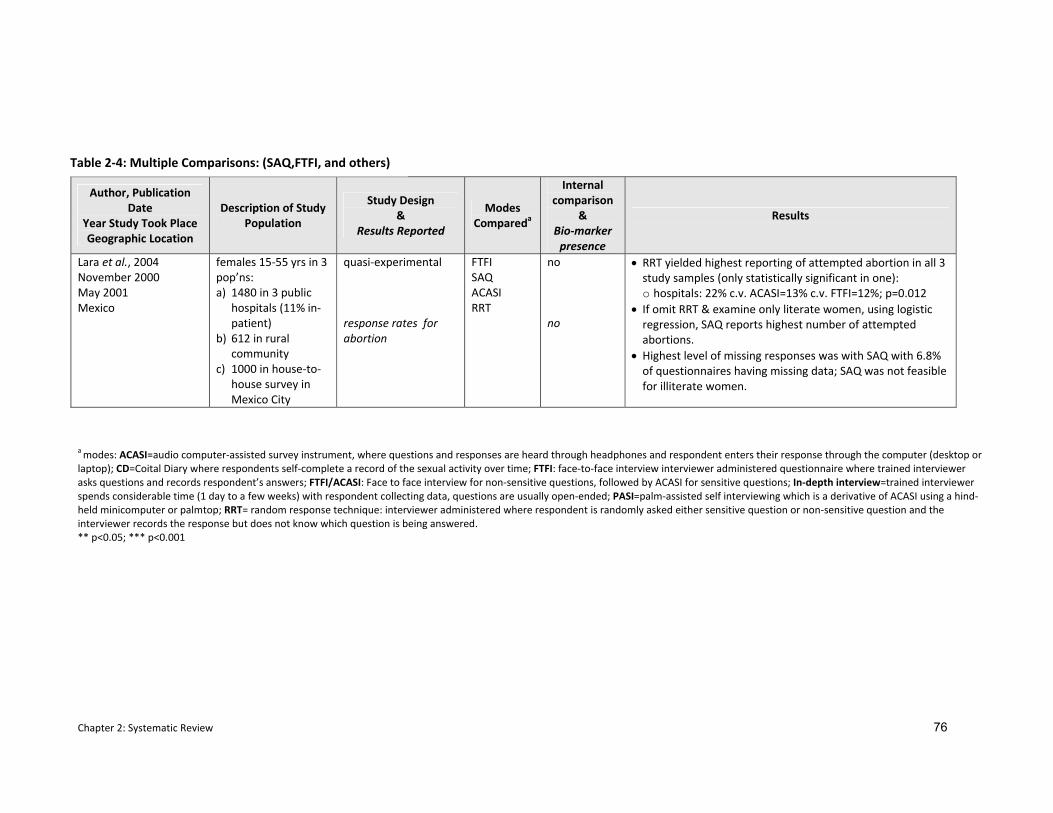
Chapter 2: Systematic Review 76
Author, Publication Date
Year Study Took Place Geographic Location
Description of Study Population
Study Design &
Results Reported
Modes Compareda
Internal comparison
& Bio‐marker presence
Results
Lara et al., 2004 November 2000 May 2001 Mexico
females 15‐55 yrs in 3 pop’ns: a) 1480 in 3 public
hospitals (11% in‐patient)
b) 612 in rural community
c) 1000 in house‐to‐house survey in Mexico City
quasi‐experimental response rates for abortion
FTFI SAQ ACASI RRT
no no
• RRT yielded highest reporting of attempted abortion in all 3 study samples (only statistically significant in one): o hospitals: 22% c.v. ACASI=13% c.v. FTFI=12%; p=0.012
• If omit RRT & examine only literate women, using logistic regression, SAQ reports highest number of attempted abortions.
• Highest level of missing responses was with SAQ with 6.8% of questionnaires having missing data; SAQ was not feasible for illiterate women.
a modes: ACASI=audio computer‐assisted survey instrument, where questions and responses are heard through headphones and respondent enters their response through the computer (desktop or laptop); CD=Coital Diary where respondents self‐complete a record of the sexual activity over time; FTFI: face‐to‐face interview interviewer administered questionnaire where trained interviewer asks questions and records respondent’s answers; FTFI/ACASI: Face to face interview for non‐sensitive questions, followed by ACASI for sensitive questions; In‐depth interview=trained interviewer spends considerable time (1 day to a few weeks) with respondent collecting data, questions are usually open‐ended; PASI=palm‐assisted self interviewing which is a derivative of ACASI using a hind‐held minicomputer or palmtop; RRT= random response technique: interviewer administered where respondent is randomly asked either sensitive question or non‐sensitive question and the interviewer records the response but does not know which question is being answered. ** p<0.05; *** p<0.001
Table 2‐4: Multiple Comparisons: (SAQ,FTFI, and others)
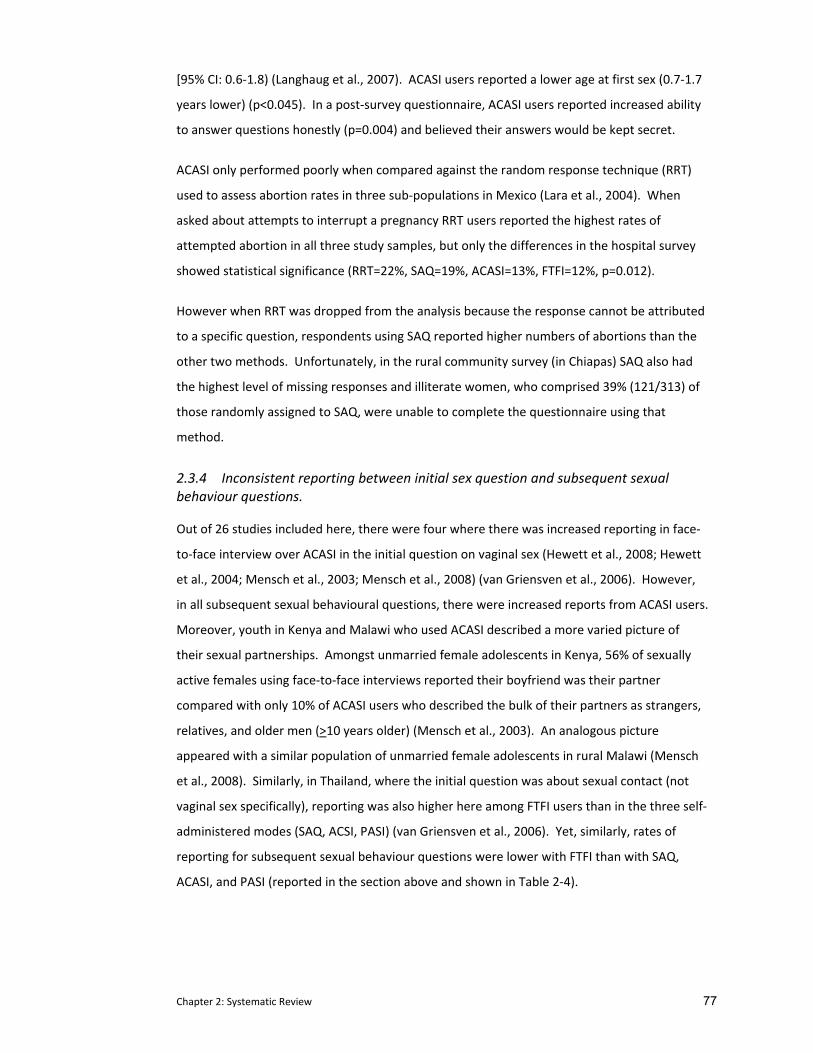
Chapter 2: Systematic Review 77
[95% CI: 0.6‐1.8) (Langhaug et al., 2007). ACASI users reported a lower age at first sex (0.7‐1.7
years lower) (p<0.045). In a post‐survey questionnaire, ACASI users reported increased ability
to answer questions honestly (p=0.004) and believed their answers would be kept secret.
ACASI only performed poorly when compared against the random response technique (RRT)
used to assess abortion rates in three sub‐populations in Mexico (Lara et al., 2004). When
asked about attempts to interrupt a pregnancy RRT users reported the highest rates of
attempted abortion in all three study samples, but only the differences in the hospital survey
showed statistical significance (RRT=22%, SAQ=19%, ACASI=13%, FTFI=12%, p=0.012).
However when RRT was dropped from the analysis because the response cannot be attributed
to a specific question, respondents using SAQ reported higher numbers of abortions than the
other two methods. Unfortunately, in the rural community survey (in Chiapas) SAQ also had
the highest level of missing responses and illiterate women, who comprised 39% (121/313) of
those randomly assigned to SAQ, were unable to complete the questionnaire using that
method.
2.3.4 Inconsistent reporting between initial sex question and subsequent sexual behaviour questions.
Out of 26 studies included here, there were four where there was increased reporting in face‐
to‐face interview over ACASI in the initial question on vaginal sex (Hewett et al., 2008; Hewett
et al., 2004; Mensch et al., 2003; Mensch et al., 2008) (van Griensven et al., 2006). However,
in all subsequent sexual behavioural questions, there were increased reports from ACASI users.
Moreover, youth in Kenya and Malawi who used ACASI described a more varied picture of
their sexual partnerships. Amongst unmarried female adolescents in Kenya, 56% of sexually
active females using face‐to‐face interviews reported their boyfriend was their partner
compared with only 10% of ACASI users who described the bulk of their partners as strangers,
relatives, and older men (>10 years older) (Mensch et al., 2003). An analogous picture
appeared with a similar population of unmarried female adolescents in rural Malawi (Mensch
et al., 2008). Similarly, in Thailand, where the initial question was about sexual contact (not
vaginal sex specifically), reporting was also higher here among FTFI users than in the three self‐
administered modes (SAQ, ACSI, PASI) (van Griensven et al., 2006). Yet, similarly, rates of
reporting for subsequent sexual behaviour questions were lower with FTFI than with SAQ,
ACASI, and PASI (reported in the section above and shown in Table 2‐4).
Chapter 2: Systematic Review 78
2.3.5 Comparison with biological markers
While five of the 26 studies used biological markers as external comparators, only four of them
examined sexual biomarkers (Langhaug et al., 2007; Mensch et al., 2008; Hewett et al., 2008;
Plummer et al., 2004a; Plummer et al., 2004b), with one study evaluating drug use (van
Griensven et al., 2008). Sexual biomarkers included Chlamydia, gonorrhoea, trichomoniasis,
HIV, and current pregnancy in females. While prevalence of biological markers varied among
studies involving adolescents, absolute numbers were relatively small. In Malawi where 84%
of the study population was tested for biomarkers, one percent of the study population tested
positive for Chlamydia (n=4), two percent for trichomoniasis (n=8), and six percent for both
HIV (n=25) and gonorrhoea (n=23) (Mensch et al., 2008). Multiple STIs were rare. In Tanzania,
only one percent of adolescents (males n=12 and females n=49) tested positively for one of
the biological markers (HIV, Chlamydia, gonorrhoea, or pregnancy in females) (Plummer et al.,
2004a). In Zimbabwe, seven young women (1.06%, 95% CI 0.28‐1.84%) had acquired HIV since
the baseline survey in 2003 as had one young man (0.12%, 95% CI 0.0‐0.36%). Eight
participants (males=1; females=7) were HSV‐2 positive (0.54%; 95% CI: 0.2 – 0.9%). Sixteen
young women were pregnant at the time of the survey. (Langhaug et al., 2007)
In the study from Brazil among urban women, those who used ACASI had stronger associations
between their reported risk behaviours and STIs, with positive associations among 16 of the 21
self‐reported sexual behavioural measures (seven of which were statistically significant)
(Hewett et al., 2008). STI positive respondents using FTFI were more likely to underreport
sexual behaviours than their STI negative peers. Among youth in Tanzania, fifty‐eight percent
of males and 29% of females with biomarkers reported being sexually active in both surveys. In
the study from Malawi, the proportion of unmarried female adolescents who tested positive
for a sexual biomarker but reported no sexual activity was similar between FTFI and ACASI; this
occurred 8‐10% of the time (Mensch et al., 2008). This lack of mode association may be
because the absolute numbers of youth with positive biomarkers was very small and there
were too few to demonstrate a difference.
2.4 Discussion
The results outlined here reaffirm data from elsewhere that questionnaire delivery modes do
affect self‐reported sexual behaviour (Tourangeau et al., 1996; Tourangeau et al., 2007; Turner
et al., 1998; des Jarlais et al., 1999b; Metzger et al., 2000a). This systematic review however, is
the first to examine data from developing countries that compares self‐reports of sexual
behaviours between various questionnaire delivery modes. Despite wide variation in
geography and populations sampled, we found strong evidence that computer‐assisted self‐
Chapter 2: Systematic Review 79
administered interviewing decreases item non‐response rates and increases rates of reporting
of sexual behaviours. This was true when ACASI and its derivatives (PASI, phone‐ACASI, CAPI)
were compared against other self‐administered and interviewer‐administered questionnaire
delivery modes. Data entry errors were also reduced when controlled by a computer
programme: in studies where there were no differences in reporting of sexual behaviours,
ACASI remained able to improve the quality of data entry (Jaspan et al., 2007; Bernabe‐Ortiz et
al., 2008; Seebregts et al., 2008).
Validation of self‐reports against biomarkers for sexual activity were rarely available. And
while small sample sizes amongst youth make it difficult to generate conclusions, the study
among women in Brazil suggests more accurate reporting using ACASI than face‐to‐face
interviewing.
These studies also support the acceptability and feasibility of using computers in developing
country settings. In those studies where it was examined, ACASI and its derivatives were
found acceptable, easy to use, and respondents, particularly female youth, reported feeling
more comfortable using a computer to report sensitive behaviours than they did with other
methods (Le et al., 2006; Rumakom et al., 2005) (Langhaug et al., 2007). A frequently cited
randomised controlled trial that compared response agreement for non‐sensitive questions
between face‐to‐face interviewing and ACASI among three economic groups of women in
Zimbabwe also supports the evidence found in this review (van de Wijgert et al., 2000) (It was
excluded from this review on the basis that it only examined ‘non‐sensitive’ endpoints.) In that
study, women from all educational levels reported in qualitative data that they found ACASI
easy to use and preferred it to FTFI. They reported feeling less embarrassed as there was no
need for eye contact with ACASI and believed that individuals would be less likely to hesitate
reporting sensitive behaviours using ACASI. Where acceptability has been examined, similar
findings have emerged from the US (Metzger et al., 2000a; Millstein et al., 1983; Kissinger et
al., 1999; Kurth et al., 2004). Acceptability of computer technologies may vary geographically
and be related to level of exposure. Generally, an increased sense of trust and sense of privacy
is expressed by those who live in countries where computers are less commonly used. An
exception to this was found in the study from Kenya where youth in one district expressed
distrust and suspicion of the technology. Here, qualitative data attributed this lack of trust to
the existing political tension in the area.
Results of studies that did not compare ACASI emphasize that any effort made to improve the
environment (e.g. providing increased privacy or an impression that confidentiality is being
maintained) when answering sensitive questions increases the reporting of sexual behaviours
Chapter 2: Systematic Review 80
(Jaya et al., 2008; Hanck et al., 2008; Gregson et al., 2002b). This includes work conducted by
Gregson and Hanck using informal confidential voting boxes and interactive interviewing
assessed in India (Gregson et al., 2002b; Hanck et al., 2008; Jaya et al., 2008). ACASI has not
been compared to interactive interviewing and more research comparing these modes are
needed in order to better establish their comparative strengths and limitations. Additional
research probing respondent’s reactions around the comparative acceptability of these modes
would also increase our understanding of any differences found. In particular it could help
ascertain how the alterations made to face‐to‐face interviewing are perceived by the
respondent. For example with ICVI or interactive interviewing, do respondents experience an
increased sense of privacy or find that an increased sense of confidentiality is being
maintained ‐ or both – when compared to interviewer‐administered modes? Recent research
has highlighted the need for more data on the opinions of users which should be incorporated
into randomized controlled trials of questionnaire delivery mode comparisons (Kaplan, 2001;
Kushniruk, 2002).
The two studies that compared coital diaries also demonstrated increased reporting of
sensitive behaviours (Ramjee et al., 1999; Allen et al., 2007). Given that data from coital
diaries is collected prospectively, it is possible that the increase noted is due to less reliance on
recall, decreasing the impact of this bias. Authors however, highlighted a number of
limitations to using coital diaries. Firstly, they require more logistical support than other
methods. Ensuring appropriate completion requires respondents to be trained and diaries
need to be dropped off and collected within certain time periods. Secondly, coital diaries have
a low completion rate (20% in one study). Finally, additional time must be factored in for data
entry. One approach to balancing their increased administrative requirements against their
enhanced reporting possibilities is to include coital diary data from a sub‐sample of a study
population to complement the data collected from a larger survey.
One of the strengths of this review is that a number of the studies reported both socially
censured and socially sanctioned behaviours (Hanck et al., 2008; Le et al., 2006; Lau et al.,
2003; Potdar et al., 2005; Sedyaningsih‐Mamahit et al., 2003; Minnis et al., 2007; Simoes et al.,
2006). Conclusions drawn from these studies are strengthened when users of a mode are
found to report not only an increase in socially censured behaviours but also a decrease in
reporting of socially acceptable behaviours (Tourangeau et al., 2007). Reports for computer
self‐administered questionnaires followed this pattern. In a study in India, more college men
using ACASI reported engaging in violent behaviour after drinking than those using FTFI (3.0 vs.
1.7%) (Potdar et al., 2005). Similarly, in a study in Zimbabwe where hormonal contraceptive
Chapter 2: Systematic Review 81
use was a study prerequisite women were more likely to report that they were not using them
in ACASI compared to FTFI (Minnis et al., 2007).
Equally heartening is the growing comparative literature around questionnaire delivery modes
in developing countries. As shown in Figure 2‐1 above, over 50% of studies reviewed here
were conducted between 2000 and 2004, however, almost two‐thirds of them were published
between 2005 and 2008, after the QDM trial was already underway. There has also been an
increased interest in ACASI and its derivatives: of the 28 studies reported here, 20 of them
included ACASI in their comparison (and 17 of those have been published since 2003).
There are however, some limitations to this review. A number of studies did not show
statistically significant differences around reporting of sexual behaviours between
questionnaire delivery modes. This is in part attributable to the small sample size of these
studies, or when youth were sampled, the small number who reported sexual behaviours
overall. Studies did not report the same sexual behaviour outcomes, nor did they always
disaggregate their data by gender or age. This made it difficult to make comparisons across
studies or to conduct a meta‐analysis. There were only three studies that included biological
markers of sexual behaviour as part of their analysis. Biological markers offer complimentary
evidence that can be used to explore directions of effect. For most sexual behaviour variables,
it is assumed that higher levels of reporting represents more valid reporting, but the ability to
triangulate against objective data improves our understanding of the differences in self‐
reported sexual behaviours between questionnaire delivery modes. Researchers are
encouraged to incorporate biological markers (or other externally valid outcomes) into these
evaluations whenever possible so as to broaden the evidence within these comparative
studies.
There is one anomaly that emerged within this review that bears comment. When FTFI was
compared against ACASI (and its derivatives) a number of studies noted increased rates of
reporting in the initial sexual behaviour question using FTFI, a pattern which was subsequently
reversed in the following sexual behaviour questions (Hewett et al., 2004; van Griensven et al.,
2006; Jaspan et al., 2007; Mensch et al., 2008). It bears noting that this discrepancy took place
in studies where respondents were youth, and two of the studies focussed only on unmarried
adolescent females for whom this behaviour is highly censured. These discrepancies seem
plausible when you consider the greater difficulty around changing your response in front of a
person compared with an inanimate object such as a computer. As reported above, qualitative
data on acceptability of ACASI emphasizes that it decreases embarrassment around answering
sensitive questions. As such, these initially lower rates of reporting could be attributed to an
Chapter 2: Systematic Review 82
initial hesitation in reporting sexual activity, where, once primed, a respondent might find it
easier to answer subsequent questions. This possibility is supported by data from Hewett et
al. who report that a large majority of their discrepancies in ACASI came from those
respondents who initially denied being sexually active and then selected a sexual partner or
acknowledged experiencing coerced sex (Hewett et al., 2004).
In 2003, a technical meeting on “Measurement of Trends in Sexual Behaviour” called for more
rigorous comparative studies to be conducted before anything more definitive could be
concluded (Cleland, Boerma, Carael, & Weir, 2004). Since then, there has been a noteworthy
increase in the number of published articles in peer‐reviewed journals reporting on
comparisons of questionnaire delivery modes. For this review, which focussed exclusively on
research performed in development country settings, the majority of articles were published
after 2003 (n=21/28). Data here strongly suggest the use of computer assisted methods.
This is important when we realise that the principal data collection tool for sexual behaviours
in developing countries remains the interviewer‐administered questionnaire. Despite the
continued need for more rigorous comparative research, it would seem detrimental to
research goals to continue to employ interviewer‐administered questionnaires when such a
wide variety of self‐administered options are available.
Others are also echoing for this shift. Macro Inc, responsible for the Demographic Health
Surveys conducted globally, have recently begun to use computer‐administered questionnaires
(Macro International Inc., 2009). And if we look beyond the narrow confines of sexual
behaviour research, a recent review from South Africa on the use of hand held computers in
resource poor settings presents compelling data from seven studies and over 90,000
interviews that the advantages to the respondent and researcher outweigh the initial outlay
costs (Seebregts et al., 2008). It seems we owe it to ourselves and our respondents to move in
this direction.
Chapter 3: Formative Research 83
3 FORMATIVE RESEARCH CONDUCTED WITHIN COMMUNITY
RANDOMIZED TRIAL
3.1 Rationale for developing a community‐based HIV prevention programme for youth
As outlined in Chapter 1, young people remain at the centre of the HIV epidemic. Those living
in southern Africa, and young girls in particular remain at greatest risk. Interventions are
urgently needed to help young people engage in safer sexual behaviours (Shaw & Aggleton,
2002; UNAIDS Interagency Task Team on Young People, 2006). While numerous programmes
aimed at adolescents have been developed over the course of the epidemic, relatively few
have been rigorously evaluated, particularly in sub‐Saharan Africa (Kirby et al., 1994; Hughes &
McCauley, 1998; UNAIDS Interagency Task Team on Young People, 2006; Ross et al., 2007;
Jewkes et al., 2008). This chapter outlines the rationale for developing a multi‐component
adolescent reproductive health intervention for Zimbabwean youth and details the formative
research that took place within the two surveys prior to the experimental evaluation that is
this thesis.
Goaded by UNAIDS, through their rallying cry, “know your epidemic, know your response”,
there has been a wider recognition that there are a host of diverse epidemics that make up the
global HIV/AIDS pandemic (Wilson et al., 2008; Mshana et al., 2006; Sherr et al., 2008). Its
complexity is reflected in the dissimilar needs of varying age groups (adolescents emerging
sexuality coupled with longer gap before marriage versus concurrency within married couples),
target groups (needs of vulnerable populations such as injecting drug users, sex workers, and
migrants versus countries hosting a generalized epidemic affecting the entire population), and
sociological and biological effects of gender (intergenerational age of partnerships coupled
with unequal gender relations). Moreover, the theoretical underpinnings of most
interventions are not explicitly stated. In 2004 the Joint United Nations Programme on
HIV/AIDS (UNAIDS) commissioned a series of systematic reviews to provide policy makers with
evidence on the effectiveness of HIV prevention for young people (UNAIDS Interagency Task
Team on Young People, 2006). Evidence was assembled for interventions conducted in
schools, focused on specific vulnerable populations (e.g. injecting drug users), using mass
media, improving young people’s access to health services, and working within communities.
There was good evidence that school‐based interventions can reduce reported sexual risk
taking, with the caveat that social desirability bias which is associated with self‐reported sexual
behaviour, can, in this context potentially lead to differential misclassification of behaviours
between trial arms (Kirby & Obasi, 2006). There was also evidence that facility‐based
Chapter 3: Formative Research 84
programmes or ones that use outreach are effective in assisting young people specifically at
risk (e.g. injecting drug users, commercial sex workers) (Hoffmann, Boler, & Dick, 2006).
Interventions that used mass media demonstrated an increase in knowledge and condom use
self‐efficacy, and could positively influence social norms and inter personal communication
(Bertrand & Anhang, 2006). There was also evidence that providing training to make health
clinics more ‘youth friendly’ increased clinic usage by young people (Dick et al., 2006).
However, this review found relatively sparse data to support or argue against the
implementation of broader, more community‐based approaches, which aim to change societal
norms in order to support individual behaviour change (Maticka‐Tyndale & Brouillard‐Coyle,
2006).
Four types of community programmes were examined: those targeting youth through new or
existing organizations and those targeting the community as a whole, either through kinship
networks or through the entire community. Twenty two programmes met their inclusion
criteria which included targeting 15‐24 year olds, ensuring the programme was delivered in a
developing country, describing the evaluation process and specifying one of the following
outcome measures: HIV/AIDS knowledge, skills or reported behaviour related to preventing
sexual transmission of HIV, HIV prevalence/incidence, and community awareness of the
conditions that contribute to youth’s vulnerability (Maticka‐Tyndale et al., 2006).
Specific weaknesses within community‐based studies included the lack of articulated
theoretical frameworks (n=3/22) and lack of rigorous evaluation (only 9 of the 22 were
experimentally designed). This made it difficult to assess many of the studies stringently. In
the one study where HIV prevalence was evaluated it was not reduced significantly. In
summary, none of the studies produced strong, unequivocal evidence of positive effects, but
this was in large part due to their inability to be rigorously evaluated. Subsequent to the
publication of this review, additional publications re‐emphasized how young people’s sexual
risk behaviours needed to be understood and tackled within the broader socio‐economic context
in which they lived (Leclerc‐Madlala, 2008; Luke, 2005; Wight et al., 2006).
In 1999, prior to the publication of this review, Zimbabwe’s HIV epidemic was at its peak, with
HIV rates among antenatal clinic attendees reaching over 35% (Ministry of Health & Child
Welfare (Zimbabwe), Health Information and Surveillance Unit, & Dept of Disease Prevention
and Control, 2000). Young people also had high risks of HIV infection. Among 15‐19 year old
female antenatal clinic attendees, 27% were infected with HIV. At that time, models predicted
that 70% of 15 year old Zimbabwean males were expected to die of AIDS during their lifetime
(UNAIDS, 1999). These high levels of HIV were compounded by the fact that nearly half of the
Chapter 3: Formative Research 85
population was aged under 15, fuelling concerns that the epidemic was still growing. And yet,
while HIV rates for older adolescents were high, rates in younger people aged 10‐14 remained
low. This gap between older and younger adolescents was seen by many as a ‘window of
opportunity’ in which programmes could be implemented to prevent this population from
becoming infected. It was within this context that the Regai Dzive Shiri trial was conceived
(Power et al., 2004).
3.1.1 An adolescent reproductive health trial in Zimbabwe
In this chapter I describe the Regai Dzive Shiri2 (RDS) parent trial that ran in rural Zimbabwe
from 2002 ‐ 2007 (NIMH RO1 MH65570 and RO1 MH 66570‐04S2), following in‐depth feasibility
work conducted between 1999‐2001 (funded by the Wellcome Trust GR058481AIA) (see
Figure 3‐1 for an overview of all RDS research). The overall aim of the RDS trial was to
measure the effectiveness of a four year multi‐component HIV prevention adolescent
reproductive health programme in reducing the incidence of HIV‐ 1, Herpes simplex virus type
2 (HSV‐2), and unintended pregnancy in females among a cohort of rural Zimbabwean young
people. The intervention worked directly with young people to improve their reproductive
health knowledge and promote safer sexual behaviours. The community at large was engaged
by working with adults and clinic staff within these communities (see section 3.3.1 below).
During both of these surveys particular attention was paid to exploring and improving the
validity of self‐reported sensitive behaviours. This formative research framed the
development of the experimental evaluation of the four questionnaire delivery modes (the
QDM trial) which was nested within the interim survey of the RDS parent trial (see Figure 3‐1).
3.1.2 Ethics
Both the feasibility study, the parent RDS trial and its ancillary studies all received approval
from the ethics committees at University College London, the London School of Hygiene and
Tropical Medicine, and from the Medical Research Council of Zimbabwe (see Appendix B for
copy of ethics approvals). Participants were told that they would not be given the results of
their HIV or HSV‐2 tests during the survey but that free voluntary counselling and testing
services would be provided by research staff at community clinics for any community members
wishing to know their HIV status, throughout the four years that the trial was underway.
2 The trial’s name is the first part of a Shona proverb “Regai dzive shiri mazaii haana muto” which literally translates as “give the eggs a chance to hatch because juicy birds are better to eat than eggs which have no sauce. The proverb is used to support the notion of giving young people time to group up. The name was suggested by pupils during formative focus group discussions in pilot study. The trial has become widely known as the Regai Dzive Shiri Project, and community members in study communities will often greet staff asking them, “how are your birds doing?”
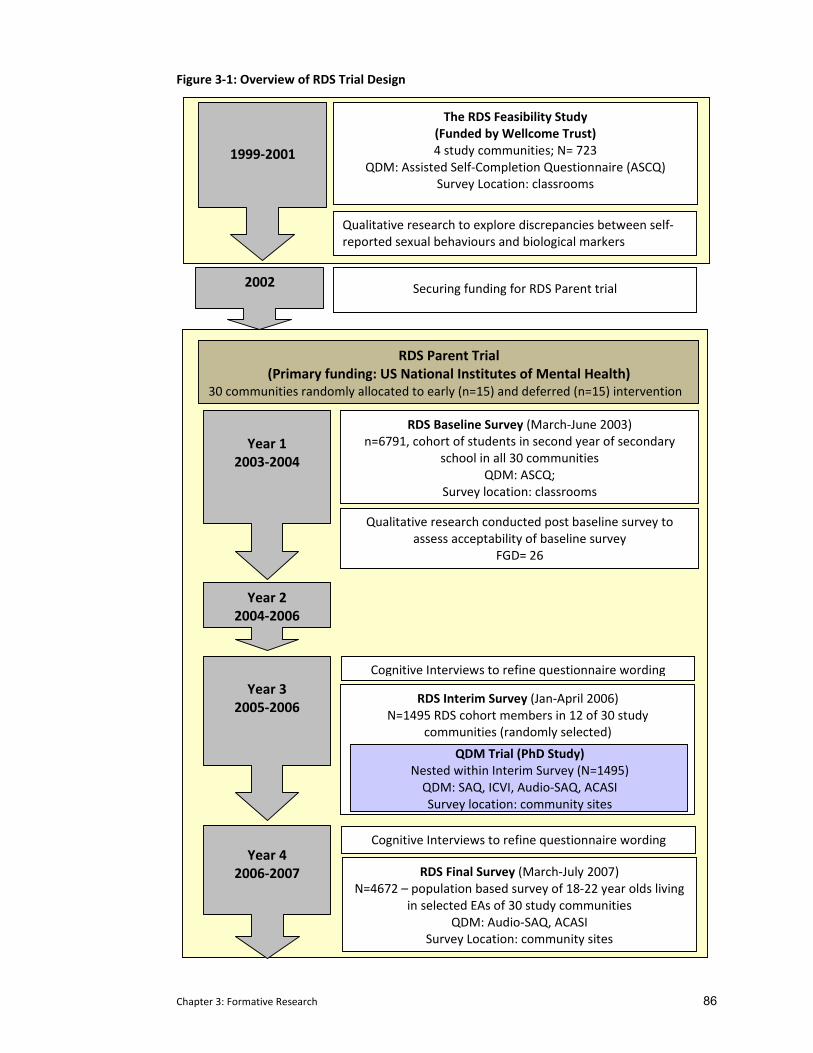
Chapter 3: Formative Research 86
Figure 3‐1: Overview of RDS Trial Design
The RDS Feasibility Study (Funded by Wellcome Trust) 4 study communities; N= 723
QDM: Assisted Self‐Completion Questionnaire (ASCQ) Survey Location: classrooms
1999‐2001
Year 1
2003‐2004
Year 4 2006‐2007
Year 2 2004‐2006
Year 3
2005‐2006
RDS Baseline Survey (March‐June 2003) n=6791, cohort of students in second year of secondary
school in all 30 communities QDM: ASCQ;
Survey location: classrooms
RDS Parent Trial (Primary funding: US National Institutes of Mental Health)
30 communities randomly allocated to early (n=15) and deferred (n=15) intervention
Qualitative research conducted post baseline survey to assess acceptability of baseline survey
FGD= 26
Cognitive Interviews to refine questionnaire wording
RDS Interim Survey (Jan‐April 2006) N=1495 RDS cohort members in 12 of 30 study
communities (randomly selected)
RDS Final Survey (March‐July 2007) N=4672 – population based survey of 18‐22 year olds living
in selected EAs of 30 study communities QDM: Audio‐SAQ, ACASI
Survey Location: community sites
Cognitive Interviews to refine questionnaire wording
Qualitative research to explore discrepancies between self‐reported sexual behaviours and biological markers
QDM Trial (PhD Study) Nested within Interim Survey (N=1495) QDM: SAQ, ICVI, Audio‐SAQ, ACASI Survey location: community sites
2002 Securing funding for RDS Parent trial
Chapter 3: Formative Research 87
3.1.3 My role in this research
This thesis emerged through my work with the RDS trial both as the assistant project director
during the feasibility study and the evaluation manager during the parent trial. In both
capacities, I oversaw the day‐to‐day running of all research activities providing on‐site
management for the project in the office and in the field when research was being conducted.
I was responsible for research administration including protocol and questionnaire
development (conceptual frameworks and design of the four quantitative surveys and all
qualitative research) and staff training and supervision (field surveyors and the qualitative
research team). My direct involvement in all aspects of the RDS trial’s research provided me
with a more in‐depth understanding of the specific challenges researchers face in accessing
sensitive information from young people in the broader context of rural southern African life.
The quality of the research that led to the experimental evaluation was enhanced by my full
involvement in the trial from its onset during the feasibility study through to its conclusion.
Specifically, by living and working full time in Zimbabwe, I was able to be in the field
throughout the process which provided an invaluable contribution to the rigour of this work.
I formulated the specific research questions addressed here, designed and conducted the
literature and systematic review that provides that background for this work, designed the
variations of the questionnaires for each delivery mode, was highly involved in developing the
analysis plan, conducted secondary analysis, interpreted the results, and wrote this thesis. In
doing this, I received valuable advice from numerous individuals who were connected to this
the RDS trial; primarily Frances Cowan (project director and principal investigator for the RDS
project, who provided overall guidance), Robert Power (development of qualitative research),
Lorraine Sherr (qualitative analysis) and Richard Hayes (research design and statistical
analysis). Statistical expertise was provided for the RDS parent trial by Sophie Pascoe, the RDS
trial statistician and by Yin Bun Cheung for the comparative methods analysis. As the author of
this work, I take sole responsibility for the content presented herein.
3.2 Formative research in the feasibility study.
In 1999, funding was awarded by the Wellcome Trust to a collaborative group of researchers3
to undertake a 20‐month feasibility study in four rural communities in Masvingo Province,
Zimbabwe, 300 km south of Harare. The specific objectives of this feasibility study were to:
3 Collaborative group: Dr Frances Cowan, Professor Anne Johnson, Professor Judith Stephenson, Professor Robert Power, Dept of HIV and Sexual Research, University College London; Professor Richard Hayes, Dr Shabbar Jaffar.
Chapter 3: Formative Research 88
• develop and pre‐test an enhanced adolescent reproductive health program for HIV/STI
prevention that was acceptable to pupils, parents, teachers and community leaders.
• assess the acceptability and feasibility of undertaking a community randomized trial of the
program using biological outcome measures of effectiveness complimented by self‐reported
sexual behaviour.
• develop a salivary and or urinary assay for HSV‐2 antibody.
Study communities were chosen by the Provincial Ministry of Education as representative for
the province. Beyond meeting the specified objectives, this feasibility study enabled the group
to develop a strong research team, build strong linkages with relevant ministries and local
stakeholders, and develop the logistics for administering a large community randomized trial in
rural Zimbabwe. The development, pre‐testing and refinement of both educational materials
and specific quantitative and qualitative research instruments were also undertaken.
3.2.1 Questionnaire development and design
At the onset of the feasibility study for the parent trial in 2000, focus group discussions (FGDs)
were held with young people to uncover the most appropriate term to use in questionnaires
when referring to sexual intercourse. Young people suggested the term kusangana pabonde
(literally translated, it means ‘sleeping on the mat’). They also indicated that questions should
be written in their indigenous language (Shona). During the feasibility study our choice of
questionnaire delivery method was primarily guided by what was feasible and appropriate for
this rural Zimbabwean adolescent population. A useful format had been developed in a similar
trial evaluating an adolescent reproductive health programme in Mwanza, Tanzania, where a
trained surveyor had read their questionnaire aloud to a group of around 25 single gender
pupils ‘under exam conditions’ (with the pupils sitting individually and well separated from
each other). Personal communication with their survey team indicated that this questionnaire
delivery mode (which they termed ‘Assisted Self Completion Questionnaire’ (ASCQ)) had
performed well in a similar population of youth (rural sub‐Saharan Africa) (Angela Obasi and
Mary Plummer 1999, personal communication 2 December).
3.2.2 Feasibility Study Methods
Informed written consent was received from parents/guardians of eligible school‐registered
youth in their 8th (n=530) or 9th (n=197) years of schooling in the four study schools. Trained
Infectious Disease Epidemiology Unit, Dept. of Epidemiology and Population Health, at the London School of Hygiene and Tropical Medicine; Dr Mary Bassett, Dept of Community Medicine, University of Zimbabwe
Chapter 3: Formative Research 89
surveyors who were recent school leavers (approx 4 years older) and resident outside these
rural communities conducted the survey. Behavioural data were collected using a self‐
completed questionnaire read aloud to participants in a single‐gender exam setting within
school classrooms. Questionnaire administration was conducted solely in front of the research
team. Questionnaire booklets were collected by the surveyor and placed in sealed envelopes
in front of the pupils.
First void urine samples were collected from participants to test for biological markers of
sexual activity (HIV antibody ,Chlamydia trachomatis (CT) and Neisseria gonorrhoeae (NG)).
Those identified with a treatable STI received free antibiotic treatment (Cowan et al., 2002).
All survey documentation (questionnaires and biological samples) was numbered with a study
ID and kept securely by the research team.
A few months following the feasibility survey, pupils who had completed the questionnaire
were invited to take part in eight focus group discussions (with single gender groups of 10
pupils) and eight in‐depth interviews to investigate discrepancies between self‐reports of
sexual behaviours and presence of biological markers found in the survey (see Results below).
Groups were facilitated by a trained qualitative researcher. Notes were transcribed and
translated (from Shona to English) before being coded manually using an inductive framework
(Glaser & Strauss, 1967).
3.2.3 Feasibility Study Results
3.2.3.1 Measurements of self‐reported sexual behaviour in this feasibility study
Eighty‐three percent (748/900) of parents/guardians consented to have their child participate.
A total of 714 school‐going youth from the four schools took part (males n=406; females
n=308). Rates of sexually transmitted infection were high with 3.5% (95% CI 2.3‐5.3%) of
participants who tested positive for HIV, 0.4% (95% CI 0.01‐1.3%) who were CT positive, and
1.9% (95% CI 1.0‐3.3%) who were NG positive. Fewer girls reported having had sexual
intercourse than boys (4.8% [95% CI 2.7‐7.7%] c.v. 17.8% [95% CI 14.1‐21.5%]). Among those
who did, 67% (95% CI 31‐89%) of girls and 10% (95% CI 4.0%‐18.8%) of boys said they were
either pressured by their partner or had been forced to have sex. Despite concerted efforts to
ensure privacy, confidentiality and the use of appropriate sexual terminology, very few of the
adolescents who had biological evidence of being infected with gonorrhoea, Chlamydia or HIV
reported having had sex in the feasibility study questionnaire (Cowan et al., 2002); only one of
16 pupils (6.3%; 95% CI 2‐30%) who tested positive for HIV and four of the 16 pupils (25%; 95%
CI 7‐52%) with either Chlamydia or gonorrhoea had reported having ever had sex on the
questionnaire.
Chapter 3: Formative Research 90
3.2.3.2 Qualitative results Follow‐up focus group discussions with the participants indicated that while still considered
appropriate, many participants reserved the term kusangana pabonde for consensual sex, a
socially censured behaviour for youth. For young women particularly, admitting to wanting to
have sex is considered culturally inappropriate and they suggested this may have affected the
validity of their responses. In addition, they expressed concern about confidentiality and
believed that teachers, who took attendance registers before the start of survey delivery, may
have been able to access their questionnaire responses. For this reason participants admitted
that they had sometimes given conflicting answers within the questionnaire in order to
confuse the researchers (and teachers, who did not have access to the completed
questionnaires, nor to the qualitative data). Qualitative data collection was not able to
establish how often this occurred.
3.2.4 Implications of these results for the parent trial design
The results of the feasibility study supported the viability and acceptability of conducting an
adolescent reproductive health program among young people using a community randomized
trial. We demonstrated that it was possible to achieve high participation rates and to conduct
biological surveys even in young adolescents where individual parental consent was necessary.
Yet, despite feasibility around questionnaire administration, rates of inaccurate reporting of
sexual behaviours (i.e. 15‐fold inaccuracy among HIV positive adolescents) highlighted
researchers’ concerns on how to interpret the findings. This study also clearly demonstrated
that evaluations that rely on self‐reports of sexual behaviour are likely to be biased in this
setting, emphasizing the importance of using externally validated outcome measures and
appropriate questionnaire delivery modes. The feasibility study also emphasized the
importance of ensuring that confidentiality, as perceived by the pupils, is maximized within a
school survey setting. This had two important implications for the subsequent design of the
parent trial; firstly, programme effectiveness must be primarily determined using biological
outcome measures; secondly, validity of self‐reported sexual behaviour data needed to be
maximised. To this end, renewed attention was paid towards the development of tools to
more accurately measure self‐reported sexual behaviour in Zimbabwean adolescents.
3.3 Overview of the RDS parent trial design
The RDS parent trial received funding from the United States National Institutes of Mental
Health (R01 MH66570‐01; Current Controlled Trials Number: ISRCTN70775692) to start in
September 2002 (see Figure 3‐1 above). As mentioned earlier, the main aim of the RDS trial
Chapter 3: Formative Research 91
was to measure the effectiveness of a multi‐component HIV prevention intervention delivered
to secondary school pupils, out‐of‐school youth and the wider community in reducing the
incidence of HIV‐1, the incidence of Herpes simplex virus type 2 (HSV‐2), and the incidence and
prevalence of unintended pregnancy among young Zimbabweans after four years of intervention
delivery.
The secondary objectives of the RDS parent trial were to:
i) estimate the impact of the intervention on reported sexual behaviour, knowledge
and attitudes regarding reproductive and sexual health, gender empowerment, and
self‐efficacy around condom use.
ii) use process evaluation to assess the delivery of the three intervention components
and the feasibility and acceptability of providing VCT in rural community settings.
iii) use quantitative and qualitative research methods to describe the evolution of
sexual behaviour in adolescents in rural Zimbabwe.
iv) refine and assess the validity of research instruments for measuring sexual
behaviour among Zimbabwean adolescents
The RDS trial was designed as a cluster randomised trial of a multi‐component HIV prevention
intervention for adolescents based in rural Zimbabwe. In brief, a cohort of young people
enrolled in their ninth year of schooling (Form 2) at study schools were recruited at the
beginning of 2003. Thirty communities were randomized to either early (n=15) or deferred
intervention status (n=15). The baseline survey was conducted between March and June of
2003, prior to programme implementation (Cowan et al., 2002). The interim survey was
conducted in 2006 among cohort members in 12 of the 30 randomly selected study
communities in order to ascertain the likely power of the trial by determining HIV prevalence
and rates of loss to follow‐up in year 3. The final evaluation was run in 2007, after four years
of programme implementation. At each survey, participants completed a questionnaire and
provided a blood sample which was tested for HIV and HSV‐2. Young women provided a urine
sample which was tested for pregnancy.
Data for the research which forms the basis of this thesis, the trial comparing questionnaire
delivery modes (the QDM trial), was primarily collected during the interim survey run in 2006
(Chapters 3‐5). Item response rates and rates of reporting socially censured behaviours were
compared in four questionnaire delivery modes. Biological markers were compared against
self‐reports of sexual activity. Quantitative and qualitative data from respondents on the
feasibility and acceptability of the four modes were also analysed. Results from this extensive
Chapter 3: Formative Research 92
analysis formed the basis for deciding on the questionnaire delivery mechanism in the final
survey. Additional comparative data were collected during the final evaluation survey
conducted in 2007, analysing item response rates and rates of reporting sexual behaviours in
two questionnaire delivery modes (Chapter 6). All research took place in both early and
deferred study communities.
3.3.1 Regai Dzive Shiri Intervention
The intervention was theoretically based in social learning theory and the stages of change
model and aimed to promote safe sexual behaviours in young people and challenge social
norms in communities that leave young people vulnerable to infection (Prochaska &
DiClemente, 1992; Bandura, Adams, & Beyer, 1997). The intervention was comprised of three
components (Cowan et al., 2008):
The youth programme for in‐and out of school youth, was delivered by carefully selected and
trained Zimbabwean school leavers in their year between leaving school and starting university
(a one day selection meeting which used a wide variety of participatory exercises identified
highly motivated youth with strong participatory leadership skills). These volunteers lived in
the rural study communities for 8‐10 months of the year. They acted as both role models for
young people and as a bridge between adults and youth. As professional peer educators, they
used well‐structured, theoretically based materials which they delivered in a highly
participatory manner. The programme was delivered not just to those enrolled in the trial
cohort but to all pupils and those out‐of‐school youth who wanted to take part.
The community programme ran a 22 session community‐based programme which aimed to
improve reproductive health knowledge, intergenerational communication and community
support for adolescent reproductive health. This component arose from focus group
discussions held with parents during the feasibility study where they lamented the collapse of
traditional communication structures and acknowledged their limited communication skills
(Cowan et al., 2002; Power et al., 2004). The community intervention comprised two ten
session modules and it was only possible to progress to module 2 after attending the majority
(75%) of module 1 sessions.
The clinic programme aimed to improve the accessibility of clinics for youth including improved
diagnosis and treatment of STIs and information and access to condoms.

Chapter 3: Formative Research 93
The three components were highly integrated. For example trained nurses ran sessions in the
youth and community components. Likewise, the professional peer educators ran youth
corners in the clinics and facilitated sessions within the community programme. No specific
intervention was introduced in the deferred study arm but standard HIV prevention activities
were implemented through the District AIDS Action Committees by local and international
governmental and non‐governmental organisations across both early and deferred
implementation communities. The RDS trial intervention was delivered to deferred
communities after the final survey was completed in 2007.
3.3.2 Regai Dzive Shiri community selection, mobilization and randomization
At the end of 2002, thirty communities in seven districts within three provinces of south‐
eastern Zimbabwe were selected for inclusion in the RDS parent trial (see Figure 3‐2 below). A
“community” was defined as a rural health clinic, its catchment’s population and the
secondary schools serving this population. Communities selected had at least 250 Form 2
pupils4, an absence of adolescent HIV prevention programmes, and willingness from the
community leadership to participate.
Community sensitization took place at national, provincial, and district levels. Strong links
were established with other relevant ministries and community stakeholders. In each
community, five people were trained as community advisory board (CAB) members (150 in all)
and were instrumental to successful community sensitization and cohort recruitment. Eligible
study participants were drawn from study school registers. Community meetings ensured
communities were informed about the study and parents/guardians of eligible pupils could
provide written informed consent. Survey teams visited the homes of those who failed to
attend these meetings.
In February 2003 the 30 communities were allocated to the two arms of the trial using
restricted randomization (Cowan et al., 2008). This process was carried out in front of meeting
attendees who judged it to be transparent.
3.3.3 The baseline survey of the trial cohort
The purpose of the baseline survey was to recruit the cohort in which the impact of the
intervention would subsequently be evaluated and determine the prevalence of HIV, HSV‐2
and pregnancy (in young women only), self‐reported sexual behavioural knowledge and
attitudes. It also assessed if there was balance between the two arms of the trial.
4 Pupils in Form 2 are in their ninth year of schooling.
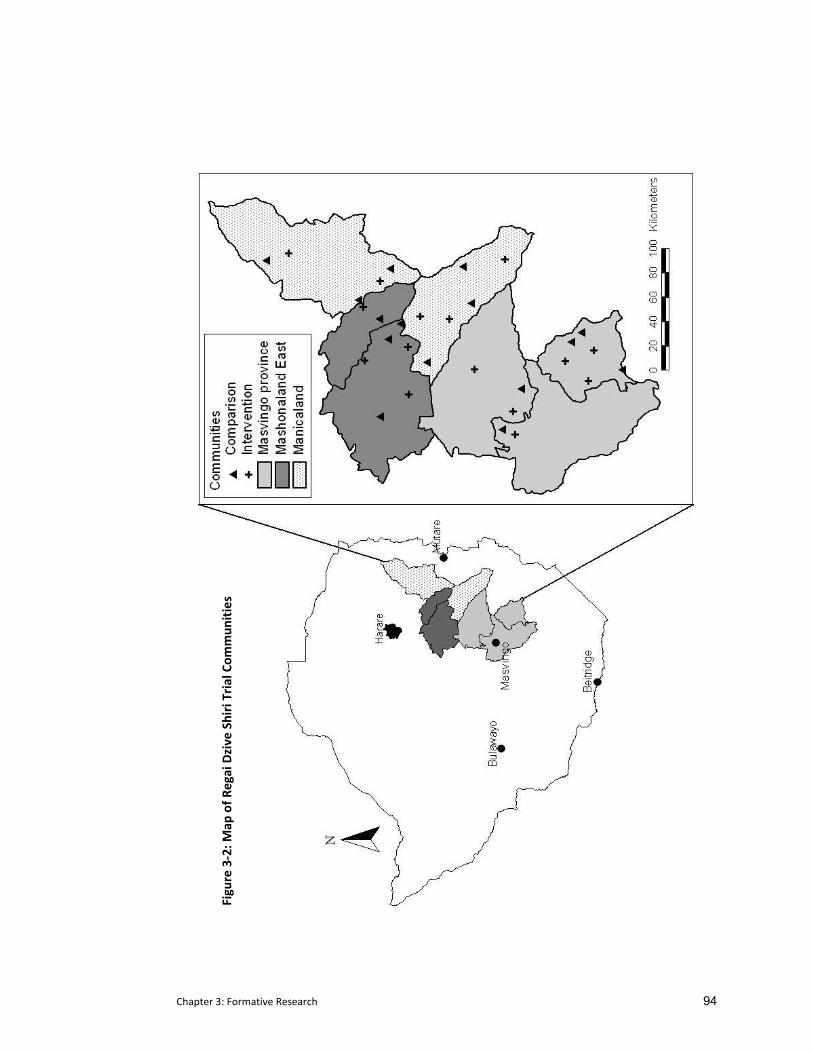
Chapter 3: Formative Research 94
Figure 3‐2: M
ap of R
egai Dzive Shiri Trial Com
mun
ities
Chapter 3: Formative Research 95
3.3.3.1 Methods for the Regai Dzive Shiri trial baseline survey
Young people whose parents/guardians had consented were invited to take part in the RDS
baseline survey. After reading an information sheet they were asked to sign an assent form to
confirm their agreement or refusal to participate in the study. This assent form assured pupils
that the confidentiality of their study ID and identifying details would be strictly maintained.
Participants in the baseline survey were asked to self‐complete a questionnaire in a classroom
setting under exam conditions (similar to the procedure outlined in the feasibility study,
section 3.2.2). They completed the questionnaire in a single gender setting as it was read out
loud to them in Shona (the indigenous language) by a trained surveyor of the same gender.
Participants provided a finger prick blood sample for HIV and HSV‐2 antibody testing and girls
additionally provided a urine sample for pregnancy testing. The questionnaire collected
information on socio‐demographic characteristics, self‐esteem and mattering (i.e. the
respondent’s perception of how much they matter to others), sexual knowledge and attitudes,
sexual behaviour including sexual intercourse, other risky behaviours, condom use self efficacy
and future aspirations.
In response to the data from the RDS feasibility study described above (see Section 3.2), steps
were taken when designing the baseline survey for the RDS parent trial to both increase the
privacy of participants and to improve the wording of sexual behaviour questions. In order to
broaden its definition beyond consensual sex, the term kusangana pabonde was expanded to
include forced sex. The initial question on sexual activity was rephrased to read:
‘When you made love [sleeping on the mat] for the FIRST time, (even if it was forced),
with whom did you make love?’
This broadening of the definition was highlighted during the introduction that was read out to
the respondents just prior to the section covering sexual activity and was repeated in each
question that referred to sexual activity.
As cohort members were recruited through secondary schools, classrooms were still
considered the most appropriate venue in which to deliver the questionnaire. However, every
attempt was made to reassure the participants about the confidentiality of the data.
Classrooms used by the survey teams were cordoned off using ropes in order to ensure that
only members of the research team were allowed into the survey area. (Pupils witnessed the
Chapter 3: Formative Research 96
research team politely escorting teachers and CAB5 members away from the designated survey
area.) As in the feasibility study, all survey documentation (questionnaires and biological
samples) was numbered with a study ID. The study ID was linked to the cohort member’s
name on their assent form and on the Cohort Register, both of which were kept in locked
trunks whose access was strictly supervised by the research team (also witnessed by the
pupils).
3.3.3.2 Methods for a sub‐study investigating QDM nested within the baseline survey
As part of the process of improving the validity of sexual behaviour measurement, we nested a
sub‐study within the baseline survey comparing item response rate and rates of reporting of
socially censured behaviours using two questionnaire delivery modes. Ten percent of
participants were randomly selected to self‐complete the questionnaire whilst listening to a
tape‐recorded version through headphones (Audio‐SAQ) while the remainder self‐completed
the questionnaire in a single‐gender setting where the questionnaire was read aloud by a same
gender trained surveyor (ASCQ) (described above in Section 3.2.1 above). Audio‐SAQ
participants sat in a room with both male and female participants in widely spaced seating
arrangements similar to that of the group reading. However because they were far fewer of
them (less than 10 per school), they sat at desks by themselves and the distance between each
pupil was much greater. Both groups provided their responses in a questionnaire booklet;
upon completion, each booklet was placed in its own individual envelope and sealed by the
surveyor in front of the pupil.
Item response rates and rates of reporting of sensitive behaviours were compared between
the two delivery modes. In addition to comparing responses directly, focus group discussions
held after the baseline survey were conducted to explore the acceptability of the two
questionnaire delivery modes with participants. These questions were part of a larger
discussion centred on obtaining feedback about the baseline survey and exploring participants’
understanding of the consent process and their appreciation of the baseline survey. Two
same‐gender qualitative researchers ran each discussion with one acting as facilitator and the
other as note‐taker. Field notes were transcribed electronically at the office. Data were
analysed within an inductive framework, according to the general principles of Grounded
Theory (Glaser et al., 1967) using Nvivo, a qualitative data retrieval and analysis software
programme.
5 Community Advisory Board (CAB) members are adults in study communities who were selected and trained by RDS to be our study representatives at community level.
Chapter 3: Formative Research 97
3.3.3.2.1 Laboratory analysis
Blood samples were collected onto cotton‐fibre‐based paper (No. 903, Schleicher and Schuell)
The samples were tested for HIV‐1 antibody at the National Microbiology Reference
Laboratory in Harare using a validated testing algorithm (U.S.Department of Health and Human
Services, Public Health Services, & Center for Disease Control and Prevention, 2000). All
specimens were tested using two ELISA tests (Vironostika® HIV Microelisa System BioMerieux,
Inc., Durham NC and AniLabsytems EIA kit (AniLabsystems Ltd, Oy Toilette 3, FIN‐01720,
Vantaa, Finland), with western blot used in the case of discrepant results. Dried blood spot
(DBS) samples were also tested for antibodies to HSV‐2 using a type specific HSV‐2 assay
[Focus HerpeSelect EIA, Focus Technologies, Cypress CA). Urine samples were tested on site
for pregnancy using Cortez OneStep hCG Rapidip InstaTest®.
3.3.3.2.2 Data Analysis
All questionnaire data from the baseline survey were double‐entered into an Access database
and range and consistency checks were performed. All statistical analyses were performed
using Stata 9.2 (College Station, TX).
3.3.3.3 Results from the baseline survey
3.3.3.3.1 Participation rates
Seven thousand eight hundred and eighty five Form 2 pupils were eligible for inclusion in the
study cohort. Parents/guardians of 91.5% (n=7,215) of these pupils agreed to their child’s
participation, 8.1% declined (almost all due to religious beliefs around blood draw) and 0.2% of
parents were not contactable. The assent rate among young people was high; for those whose
parents had given consent, 94.1% agreed to participate (n=6791) giving an overall consent rate
of 86.3% (Cowan et al., 2008).
3.3.3.3.2 Demographic characteristics
The baseline characteristics of study participants are described here. Boys were six months
older than girls (males=15.5 years, females= 14.9 years; p<0.001). While both girls and boys
reported relatively low levels of knowledge about sexual matters, girls reported poorer
knowledge than boys (p<0.05). For example, 78% of girls compared with 71% of boys (p<0.001)
said they knew little or nothing about preventing pregnancy (including two of the girls who
were pregnant); 70% of girls compared with 62% of boys (p<0.001) said they knew little or
nothing about HIV (including 32 (63%) of those infected); and 81% of girls compared with 68%
of boys (p<0.001) said they knew little or nothing about other sexually transmitted infections.
Girls were also significantly less likely than boys (p<0.001) to report that they would find it easy
to access condoms (7% compared with 24%), or to use a condom in the future (17% compared
Chapter 3: Formative Research 98
with 46%), or to tell their partner they must use condoms (24% compared with 49%) {Pascoe,
2009 7711 /id}.
Twenty (0.6%) boys and 31 (1.0%) girls had HIV‐1 antibody detected. Twelve participants
(0.2%) tested positive for HSV‐2 {Cowan, 2008 168 /id}. Four (0.12%) girls were pregnant.
Overall 64 (1%) had at least one biomarker (HIV, HSV‐2 or positive pregnancy test), 40 girls
(1.2%) and 24 boys (0.7%). Three percent of girls and 11.9% of boys (p<0.001) reported that
they were sexually active with a median age at first intercourse of 12 years for both males
(range 3‐21 years) and females (range 3‐16 years). There was excellent balance between early
and deferred implementation arms in terms of rates of HIV‐1 and HSV‐2 infection and other
behavioural and socio‐demographic variables.
3.3.3.3.3 Comparison of self‐reported activity with biomarkers of sexual activity
Results from the sexual behaviour data suggest that young people continued to remain
reluctant to report their sexual behaviour accurately (Cowan et al., 2008). Inconsistent self‐
reports were found in all four pregnant girls who reported they had never had sex. There were
also high levels of inconsistency between self‐reports of sexual activity and presence of HSV‐2
which can only be sexually acquired. Of the eight HSV‐2 positive girls (two of whom were co‐
infected with HIV), five consistently reported not having sex. Only two of the four HSV‐2
positive males reported that they had ever had sex (Pascoe et al., 2009). In addition, of the 51
HIV positive participants, only one of the girls (1/31) and 20% (4/20) of the boys reported
having had sex. While the possibility of long term survival following mother‐to‐child‐
transmission among some of the HIV positive orphans cannot be dismissed, other factors
suggest infection is a result of sexual acquisition. More than half of HIV positive orphans had
lost their father, but not their mother or both parents. Recent research in South Africa
attributes HIV infection in children with HIV negative mothers to breast‐feeding from non‐
biological women or exposure through dental visits. However the actual numbers of such
cases are few (n=7/3471) and the age range was much lower (ages 2‐9). Moreover, in the RDS
baseline survey, there was an increased reporting of sexual risk taking by orphans, particularly
females, providing additional supportive evidence that HIV transmission among these youth
occurred primarily through sexual encounters (for a more detailed discussion, see Pascoe et
al., 2009).
Due to the low prevalence of biomarkers within this population and that their interpretation in
this younger population can be more challenging, another approach is to explore internal
consistency within self‐reports of sexual activity. We found internal consistency in self‐
reporting of sexual behaviours was high. Only 13% percent of the girls and 28% of the boys
Chapter 3: Formative Research 99
answered the 14 sexual behaviour questions inconsistently, answering some questions as
sexually active individuals but then selecting the response option ‘I have never had sex’ in
other sexual behaviour questions. The two HSV‐2 positive girls who initially reported being
sexually active, indicated that they had never had sex in later sexual behaviour questions. As
mentioned in Chapter 1, while internal consistency provides evidence of reliability, it cannot
guarantee validity, illustrated well by the fact that three of the four pregnant girls consistently
reported never having had sex.
3.3.3.4 Results for the comparison of socially censured behaviours by questionnaire delivery modes:
3.3.3.4.1 Quantitative data
During the evaluation of sensitive questions by mode, all questions where the questionnaire
delivery mode was clearly recorded were included in the analysis. Ninety‐one percent
(n=6,189, 2958 girls and 3231 boys) of the cohort completed the questionnaire using ASCQ and
5% (n=362, 188 girls and 174 boys) using Audio‐SAQ. (The questionnaire delivery mode for the
remaining four percent was unknown.) The item response rate and the proportion of pupils
reporting a socially censured behaviour were compared for several questions and are shown in
Table 3‐1.
Overall, pupils in both delivery modes answered almost all the questions. Comparison of
response rates for some sensitive behaviours was variable and the numbers are too small to
justify use of statistical testing. There was a trend towards increased reporting of marijuana
use in boys when they used Audio‐SAQ ( 10.1% vs. 6.6%) and experiencing forced sex in girls
(3.2% vs. 1.6%). Boys also reported higher rates of having had two or more sexual partners
(4.6% vs. 3.8%). This sub‐study highlighted the need to explore the impact of questionnaire
delivery modes on the reporting of sensitive behaviours more rigorously.
3.3.3.4.2 Qualitative data collection regarding the two questionnaire delivery modes
Twenty‐six focus group discussions (nmales=14; nfemales=12;) were held at 15 of the 82 study
schools to ask participants about the relative merits of the two questionnaire delivery modes.
What emerged from the qualitative data was the separation between the utility of reading
aloud and its acceptability within this group setting. While many less‐literate participants
reported that their comprehension was improved by hearing the questionnaire read out loud,
there were some participants who reported difficulty listening while reading along. Moreover,
ASCQ pupils listening to the questionnaire in a group setting felt uncomfortable asking for
clarification, as they were acutely aware that each query slowed down the whole group.

Chapter 3: Formative Research 100
Table 3‐1: Item response and answers recorded by participants completing the questionnaire in group (ASCQ) or tape‐recorded (A‐SAQ) settings.
Instead, they claimed marking any response so as to keep up. One pupil stated, “But it is
embarrassing to raise your hand and say, ‘I don’t understand this [question].’ A person would
never raise their hand.’ (she laughs) (female, sch54). This was less of a concern for those that
used Audio‐SAQ, although they also stated they did not always pause and replay the tape if
they had a query.
Despite repeated reassurances that there were no right or wrong answers, some participants
continued to be confused about the rationale for the survey. Some thought that the
questionnaire was to be used to establish their eligibility to participate in the programme. One
boy reported, “others were not telling the truth, especially on questions to do with sexual life,
because they thought they would be sacked from the programme [for being sexually active]
(male, sch15). So, while the exam setting in ASCQ allowed us to maximize each pupil’s privacy
by separating them as much as possible within the classroom, it is possible that this setup also
allowed them to equate the environment to an exam and not a questionnaire; encouraging
them to assume that there was a ‘right’ answer, as you might expect in an exam. In our case, it
seems they may have translated the concept of ‘right’ answer to a ‘socially correct’ one.
Chapter 3: Formative Research 101
3.3.3.4.3 Privacy of questionnaire delivery setting
In the focus group discussions following the baseline survey, participants could identify and
were appreciative of measures taken by the researchers to increase their privacy and keep the
survey area secure. Most important to them was the significant spacing between themselves
in the classroom. Despite this, some pupils reported being able to ‘guess’ which multiple‐
choice box had been selected by others. They attributed this to the fact that all pupils were
completing the questionnaire in unison, making it possible to ‘know’ which response option
was being marked by others. This belief caused anxiety as some participants were thought to
have spread rumours about an individual’s sexual experience based on these guesses. Pupils
using ASCQ were more inclined than Audio‐SAQ users to suspect another pupil of looking at
their answers. One girl commented, ‘… it was not possible to write ‘Yes’ [I had sex] instead of
‘No’ [I didn’t] because the one beside you would see your actions. (She exchanges looks with
another participant and laughs.)’ (female, sch41). Reading the questionnaire aloud also
increased the level of embarrassment within the group setting. Despite enormous efforts
taken by the research team to read questions in a neutral tone, and confirmation from pupils
that the term itself was not offensive, pupil’s still maintained it was ‘embarrassing’ to
repeatedly hear the term kusangana pabonde (‘sexual intercourse) read out loud.
This feeling of embarrassment was less pronounced among Audio‐SAQ users; they instead
spoke of how the headphones made them feel ‘alone.’ Even though they had not experienced
the group setting, after listening to comments from others in the group discussions, they
believed that the tape recorded version increased their ability to answer sensitive questions
honestly. One girl commented,
“The tape [recorded method] would make people tell the truth because you are
[working independently] … but with the group [setting] you cannot tell the truth
because other people [will] laugh at some of the [responses to] questions and you
[would] automatically change your answer.” (female, sch50)
3.3.3.4.4 Study identification numbers:
While most pupils appreciated the use of study ID numbers, some thought it interfered with
their ability to answer questions honestly. For example one male pupil remarked,
“On the [questionnaire] you said we should not write our names but there was a
number [study ID]. You were going to [know] that ‘this one smoked mbanje
[marijuana]’ and have me expelled from school.” (male, sch15)
Chapter 3: Formative Research 102
This was reiterated by another male who said, ‘I didn’t answer freely because there was a
number [study ID] that was assigned against our names [and which was also] on the
[questionnaire].’ (male, sch28)
As described earlier in Chapters 1 and 2, the penalty for disclosing sexual activity is high and
includes corporal punishment and school expulsion. Anxiety about the possibility of disclosure
naturally decreases the likelihood that someone who is sexually active will admit to it. An
additional cultural barrier is found within the Shona proverb ‘a secret cannot be kept by two
people’ which challenges entirely the notion of confidentiality . Within a broader context, the
political climate within which these surveys took place was not conducive to trusting
researchers’ promises to maintain confidentiality. While young people were not voting
themselves, they were witnessing the anonymity of the process being compromised through
public voting, missing and tampered ballot boxes, and fear and intimidation around the polling
area (which were often schools).
Throughout the FGDs, young people gave the impression that they have little experience with
their privacy/confidentially being respected. They assumed that knowing something was
tantamount to revealing it to someone, which in these instances could result in serious
negative repercussions. Despite researchers concerted efforts to maximize confidentiality,
young people still face many barriers. While they reaffirmed that researchers had told them
their answers would not be revealed, respondents reiterated having an underlying fear of
‘being cheated.”
3.4 Use of Interim Survey to compare four Questionnaire Delivery Modes
Given what we learned in the feasibility study and baseline survey of the parent trial we
decided to conduct an experimental comparison of four questionnaire delivery modes to
determine the most valid means of collecting sexual behaviour information from young people
in rural Zimbabwe. Additional funding was sought and granted from the United States
National Institute of Mental Health (competitive supplement RO1 MH066570‐04S2) to conduct
a randomized controlled trial evaluating four questionnaire delivery modes. The interim
survey for Regai Dzive Shiri provided the ideal opportunity to conduct a robust evaluation of
several different questionnaire delivery modes triangulated against biological markers of
behaviour. Rates of item non‐response and reporting of pre‐selected sexual behaviours could
be compared between delivery modes. These data, combined with information from
participants concerning the acceptability of these modes would help frame the selection of
questionnaire delivery mode for use in the final survey of the parent trial.
Chapter 3: Formative Research 103
During the development of the questionnaire delivery methods trial in 2004 and 2005, there
was little published research on this topic. While considerable methodological literature
existed in developed countries (e.g. North America and Western Europe), there was almost no
data available from developing countries (Lara et al., 2004; Gregson et al., 2002b; van de
Wijgert et al., 2000) and specifically on youth (Mensch et al., 2003; Plummer et al., 2004b;
Rumakom et al., 2005). Recent research by a colleague in Zimbabwe working in similar
conditions to us, suggested an improved version of face‐to‐face interviewing using a
confidential voting box for responding to sensitive questions(Gregson et al., 2002b). When
compared with standard face‐to‐face interviewing, they found an increase in reporting of
sensitive sexual behaviours when these data were collected using the voting box. A few
studies had been conducted in developing countries around the use of computer methods
which had received significant attention in the US and Europe (Rumakom et al., 2005; Mensch
et al., 2003). While not conclusive, these data suggested increased reporting of sensitive
behaviours with computer methods.
Therefore, when considering the methods to be evaluated, we relied on the limited published
data available and on our own information from the feasibility study and the baseline survey of
the parent trial. We wanted to compare questionnaire delivery modes that could be used by
young people in a survey environment where data were collected at a single time point.
Modes such as coital diaries and random response techniques, discussed in Chapter 1, were
not applicable within this framework. The following four questionnaire delivery modes were
considered valid modes to be explored in this rigorous manner: i) self‐administered
questionnaire (SAQ), ii) SAQ accompanied by an audio soundtrack (Audio‐SAQI); iii) face‐to‐
face interview with responses to sensitive questions placed in a confidential voting box (ICVI);
and iv) audio computer‐assisted survey instrument (ACASI). They are outlined below in Table
3‐2.
Evaluation for this study was divided into three phases i) questionnaire design ii) experimental
comparison of questionnaire delivery methods; iii) qualitative and quantitative data collection
on method acceptability. Methods for obtaining these are described in more detail in the next
chapter.
In summary
The Regai Dzive Shiri trial was designed to rigorously evaluate a community‐based
adolescent HIV prevention intervention carried out amongst young people in rural
Zimbabwe.
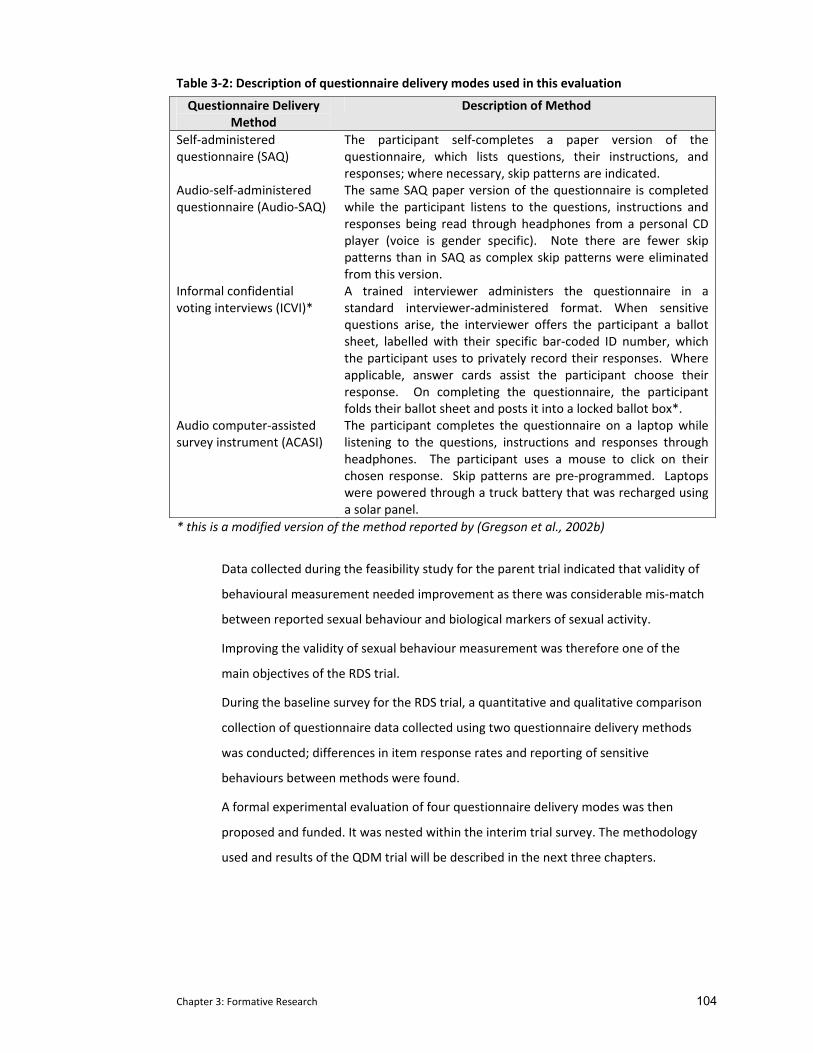
Chapter 3: Formative Research 104
Table 3‐2: Description of questionnaire delivery modes used in this evaluation
Questionnaire Delivery Method
Description of Method
Self‐administered questionnaire (SAQ)
The participant self‐completes a paper version of the questionnaire, which lists questions, their instructions, and responses; where necessary, skip patterns are indicated.
Audio‐self‐administered questionnaire (Audio‐SAQ)
The same SAQ paper version of the questionnaire is completed while the participant listens to the questions, instructions and responses being read through headphones from a personal CD player (voice is gender specific). Note there are fewer skip patterns than in SAQ as complex skip patterns were eliminated from this version.
Informal confidential voting interviews (ICVI)*
A trained interviewer administers the questionnaire in a standard interviewer‐administered format. When sensitive questions arise, the interviewer offers the participant a ballot sheet, labelled with their specific bar‐coded ID number, which the participant uses to privately record their responses. Where applicable, answer cards assist the participant choose their response. On completing the questionnaire, the participant folds their ballot sheet and posts it into a locked ballot box*.
Audio computer‐assisted survey instrument (ACASI)
The participant completes the questionnaire on a laptop while listening to the questions, instructions and responses through headphones. The participant uses a mouse to click on their chosen response. Skip patterns are pre‐programmed. Laptops were powered through a truck battery that was recharged using a solar panel.
* this is a modified version of the method reported by (Gregson et al., 2002b)
Data collected during the feasibility study for the parent trial indicated that validity of
behavioural measurement needed improvement as there was considerable mis‐match
between reported sexual behaviour and biological markers of sexual activity.
Improving the validity of sexual behaviour measurement was therefore one of the
main objectives of the RDS trial.
During the baseline survey for the RDS trial, a quantitative and qualitative comparison
collection of questionnaire data collected using two questionnaire delivery methods
was conducted; differences in item response rates and reporting of sensitive
behaviours between methods were found.
A formal experimental evaluation of four questionnaire delivery modes was then
proposed and funded. It was nested within the interim trial survey. The methodology
used and results of the QDM trial will be described in the next three chapters.
Chapter 4: QDM Methods 105
4 METHODS FOR REGAI DZIVE SHIRI INTERIM SURVEY COMPARING
FOUR QUESTIONNAIRE DELIVERY MODES
As outlined in Chapter 3, following concerns about the validity of sexual behaviour data and
the comparative results collected using two questionnaire delivery methods in the baseline
survey, a formal experimental evaluation of four questionnaire delivery methods was
proposed and funded for the interim survey (a competitive supplement from the US National
Institute of Mental Health NIMH (R01 MH06657‐0‐04S2).
The primary objective of this evaluation was to conduct an experimental comparison of four
questionnaire delivery modes to determine the most valid means of collecting socially
censured information from young people in rural Zimbabwe. The most valid of these was to be
used in the final outcomes survey for the parent trial.
The detailed objectives of this evaluation were:
i) To use cognitive interviewing to develop and refine an existing self completion
questionnaire (Chapter 4 ).
ii) To compare self reports of socially censured data including sexual behaviours,
poverty, psychological morbidity, and stigma between four questionnaire delivery
modes (Chapter 5).
iii) To determine the reliability of sexual behavioural data collection through the
triangulation of self‐reported sexual behavioural data collected by four
questionnaire delivery modes against biological markers of sexual activity such as
HIV and HSV‐2 antibody status and current pregnancy in females (Chapter 5).
iv) To determine the reliability of sexual behavioural data through the comparison of
responses by the same individual within a short time interval using two different
questionnaire delivery modes (Chapter 5).
v) To use quantitative and qualitative data to assess young people’s acceptability
towards the four questionnaire delivery modes (Chapter 6).
This chapter describes the methods used to conduct the experimental evaluation. This first
section focuses on questionnaire design. The second section focuses on the development of
the experimental evaluation and provides a detailed description of the four questionnaire
delivery modes. Particular attention is paid to how the questions were adapted to
Chapter 4: QDM Methods 106
compensate for each method’s uniqueness while maintaining the integrity of the
questionnaire as a whole. This chapter concludes with a summary of the field survey
methodology and a description of the statistical analysis used in this experimental evaluation.
The results of the randomized controlled trial are presented in full in Chapter 5. Methods used
to assess the acceptability of the different questionnaire delivery modes (objective (v)) are
described in chapter 6.
4.1 Questionnaire design
The RDS interim survey questionnaire evolved over the course of the trial. The content and
format of the questionnaire was initially devised as part of the feasibility study and
subsequently modified for the baseline survey of the parent trial. Questions were developed
based on a review of similar local and regional surveys including The Zimbabwe Demographic
Household Survey – 1999 (Central Statistical Office & Macro International Inc., 2000), the
Zimbabwe Young Adult Survey (Ministry of Health & Child Welfare (Zimbabwe) et al., 2004),
the Shaping the Health of Adolescents in Zimbabwe 2006 Survey (Kang, Dunbar, Roley, &
Laver, 2006), UNAIDS global guidelines ((UNAIDS, 1998) and from a national sexual behavioural
youth survey in South Africa (Reproductive Health and HIV Research Unit, 2003). Additional
questions were developed using UNICEF guidelines for monitoring and evaluating vulnerable
children(United Nations Children's Educational Fund (UNICEF), 2005). Several new scales were
included and are described in more detail below (Dunkle et al., 2004; Qadir, Stewart, Khan, &
Prince, 2005; Patel, Simunyu, Gwanzura, Lewis, & Mann, 1997).
The baseline survey questionnaire collected information on socio‐demographic characteristics,
self‐esteem and mattering (i.e. the respondent’s perception of how much they matter to
others), sexual knowledge and attitudes, sexual behaviours including sexual intercourse, other
risky behaviours, condom use self efficacy and future aspirations. Results from this survey
indicated that 34% of the cohort were orphans who were at greatly increased risk of HIV (age‐
sex adjusted odds ratio 3.4; 95% CI: 1.9‐6.1) (Cowan et al., 2008). Qualitative data collected
through a series of in‐depth interviews with cohort members suggested that poverty, lack of
psychological well‐being, mobility, caregiver support and stigma were likely to be associated
with this increased risk. As a result, domains covered by the interim survey questionnaire were
expanded from those at the baseline survey to allow us to explore and quantify these and
other factors.
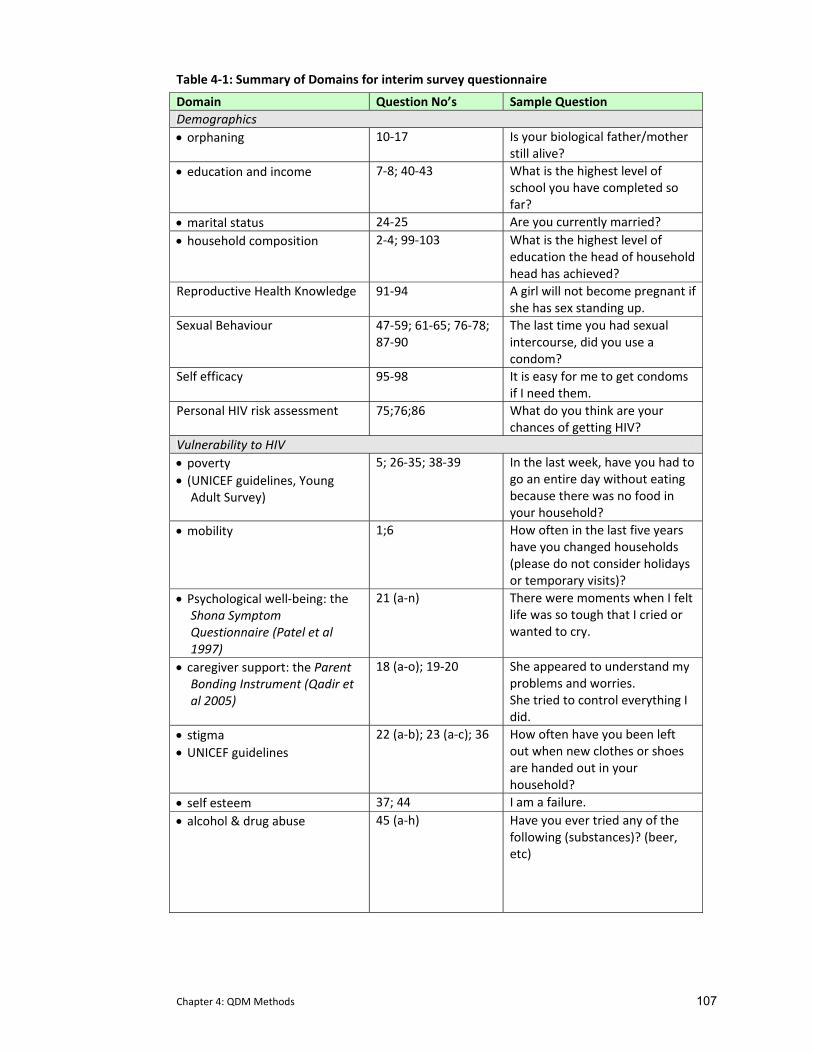
Chapter 4: QDM Methods 107
Table 4‐1: Summary of Domains for interim survey questionnaire
Domain Question No’s Sample Question Demographics • orphaning 10‐17 Is your biological father/mother
still alive? • education and income 7‐8; 40‐43 What is the highest level of
school you have completed so far?
• marital status 24‐25 Are you currently married? • household composition 2‐4; 99‐103 What is the highest level of
education the head of household head has achieved?
Reproductive Health Knowledge 91‐94 A girl will not become pregnant if she has sex standing up.
Sexual Behaviour 47‐59; 61‐65; 76‐78; 87‐90
The last time you had sexual intercourse, did you use a condom?
Self efficacy 95‐98 It is easy for me to get condoms if I need them.
Personal HIV risk assessment 75;76;86 What do you think are your chances of getting HIV?
Vulnerability to HIV • poverty • (UNICEF guidelines, Young
Adult Survey)
5; 26‐35; 38‐39 In the last week, have you had to go an entire day without eating because there was no food in your household?
• mobility 1;6 How often in the last five years have you changed households (please do not consider holidays or temporary visits)?
• Psychological well‐being: the Shona Symptom Questionnaire (Patel et al 1997)
21 (a‐n) There were moments when I felt life was so tough that I cried or wanted to cry.
• caregiver support: the Parent Bonding Instrument (Qadir et al 2005)
18 (a‐o); 19‐20 She appeared to understand my problems and worries. She tried to control everything I did.
• stigma • UNICEF guidelines
22 (a‐b); 23 (a‐c); 36 How often have you been left out when new clothes or shoes are handed out in your household?
• self esteem 37; 44 I am a failure. • alcohol & drug abuse 45 (a‐h) Have you ever tried any of the
following (substances)? (beer, etc)
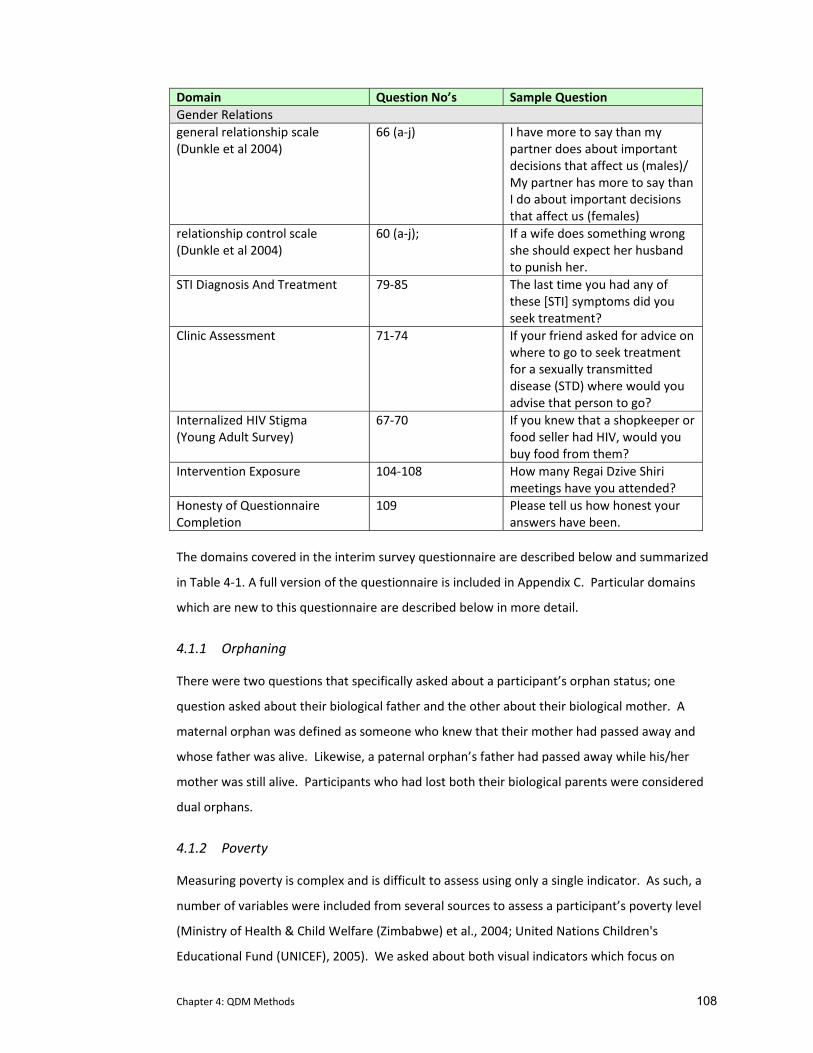
Chapter 4: QDM Methods 108
Domain Question No’s Sample Question Gender Relations general relationship scale (Dunkle et al 2004)
66 (a‐j) I have more to say than my partner does about important decisions that affect us (males)/ My partner has more to say than I do about important decisions that affect us (females)
relationship control scale (Dunkle et al 2004)
60 (a‐j); If a wife does something wrong she should expect her husband to punish her.
STI Diagnosis And Treatment 79‐85 The last time you had any of these [STI] symptoms did you seek treatment?
Clinic Assessment 71‐74 If your friend asked for advice on where to go to seek treatment for a sexually transmitted disease (STD) where would you advise that person to go?
Internalized HIV Stigma (Young Adult Survey)
67‐70 If you knew that a shopkeeper or food seller had HIV, would you buy food from them?
Intervention Exposure 104‐108 How many Regai Dzive Shiri meetings have you attended?
Honesty of Questionnaire Completion
109 Please tell us how honest your answers have been.
The domains covered in the interim survey questionnaire are described below and summarized
in Table 4‐1. A full version of the questionnaire is included in Appendix C. Particular domains
which are new to this questionnaire are described below in more detail.
4.1.1 Orphaning
There were two questions that specifically asked about a participant’s orphan status; one
question asked about their biological father and the other about their biological mother. A
maternal orphan was defined as someone who knew that their mother had passed away and
whose father was alive. Likewise, a paternal orphan’s father had passed away while his/her
mother was still alive. Participants who had lost both their biological parents were considered
dual orphans.
4.1.2 Poverty
Measuring poverty is complex and is difficult to assess using only a single indicator. As such, a
number of variables were included from several sources to assess a participant’s poverty level
(Ministry of Health & Child Welfare (Zimbabwe) et al., 2004; United Nations Children's
Educational Fund (UNICEF), 2005). We asked about both visual indicators which focus on
Chapter 4: QDM Methods 109
household structures and access to utilities (type of toilet, water source, number sleeping in
the primary sleeping room) as well as asset‐based indicators which examined the affordability
of essential needs (cooking oil, medications, school fees) or ownership of essential assets
(tables, chairs, blankets, radio, fridge).
In addition, data were collected relating to income including a participant’s primary economic
activity over last 12 months, frequency of paid employment and level of participant’s
involvement in the decision process for spending money earned.
A total of three scores were created: one each for the visual indicators and the asset based
indicators respectively and then a score combining both scales. Each item in each scale was
coded on a scale of 0 to 1 where 0 was the item considered to be the lowest SES category and
1 the highest SES category. Scores in each scale were then added and the sum of each scale
used to calculate a mean score for each participant. This mean score distribution was then
divided into 5 categories with approximately equal numbers for each participant in each
category (Pascoe et al., 2005).
4.1.3 Psychological Well Being: the Shona Symptom Questionnaire
We used the Shona Symptom Questionnaire (SSQ) to describe the mental health burden of
young people participating in the survey. The SSQ is a locally validated, 14 item, indigenous
measure of common mental disorders (Patel et al., 1997) and was developed and validated
among patients attending primary care clinics and attending traditional medical practitioners
in Harare. Importantly, it combines items that are both etic (those that reflect the concerns of
the health care provider) and emic (those that are socio‐culturally meaningful to the patient)
(Patel & Mann, 1997). The aim of the SSQ is to measure psychiatric morbidity. It was originally
validated against a gold standard that was defined as a patient being diagnosed as having a
mental disorder by a health care worker and scoring 12 or more on the Revised Clinical
Interview Schedule (CISR)(Lewis, Pelosi, & Araya, 1992). Compared with this gold standard,
using the cut off of 8 or more out of 14 items, the sensitivity of the SSQ for common mental
disorder was 63% and specificity 83%.
4.1.4 Stigma
Psychological well‐being is also associated with a person’s perception of being stigmatized.
We developed questions using guidelines developed by UNICEF on assessing levels of
community stigma (United Nations Children's Educational Fund (UNICEF), 2005). To
supplement these global definitions of stigma, we conducted 11 focus group discussions with
youth (n=6: in‐ and out‐of school) and adults (n=5: local community, clinic staff, local RDS
Chapter 4: QDM Methods 110
Intervention staff) in our trial communities to establish local knowledge on how a child was
‘known’ to be stigmatized. This qualitative analysis highlighted other, more locally pertinent
aspects of stigma ranging from referring to someone as an inanimate object to specific
treatment in a household (being asked to work more than peers, being given food on a
separate plate, always being given second hand items when new items were provided to
others). Additional questions on stigma were created using this information. Similarly phrased
questions have subsequently been used by other researchers examining stigma in children and
young people in Zimbabwe (Howard, Matinhure, McCurdy, & Johnson, 2006; Nyamukapa et
al., 2008)
4.1.5 Caregiver Support: The Parent Bonding Instrument
Caregiver support was evaluated using the Parent Bonding Instrument (PBI) which explores the
relationship between parents and their children (Qadir et al., 2005). This instrument consists
of 25 items which are divided into two sub‐scales, one assessing a care‐giver’s level of
attention/supervision (12 items score range 0‐36) and the other assessing their overprotective
nature (13 items (score range 0‐39). While developed for use in developed country settings,
this scale has been used in Asian cultures, where parents are traditionally revered by their
children (Qadir et al., 2005). While parental authority is also a strong aspect of Shona culture,
the scale had not been tested in Zimbabwe, nor had it been used with populations where a
child’s primary caregiver is often someone from their extended family or where there might be
a sequence of primary caregivers over time. Therefore, in our setting, rather than assume the
primary caregiver is the biological mother, we applied the PBI to the participant’s primary
female care giver (which could have been their biological mother).
4.1.6 Mobility
As a result of orphaning and/or poverty, children are often moved from one extended family
household to another, sometimes ending up in child‐headed households (Nyamukapa et al.,
2008; Howard et al., 2006; Central Statistical Office et al., 2007). Sixty in‐depth interviews with
cohort members revealed that this mobility was often accompanied by high levels of distress
(one girl was transferred five times in seven years, moving after the death of each of her
primary caregivers). We therefore included questions to establish the length of time a
participant had been living in their current home as well as the number of times they had
moved in the previous year.
Chapter 4: QDM Methods 111
4.1.7 Alcohol and Drug Use
There were seven questions on alcohol and drug abuse which explored alcohol consumption
(beer, wine and locally brewed alcohol) and inhaling of marijuana, tobacco or glue. Frequency
of use ranged from never having tried a substance to using it regularly. Participants were asked
about their lifetime exposure to these various substances. Response options ranged from
never use, through to occasional use, to regular use.
4.1.8 Sexual Behaviour
As already emphasized in Chapter 3, initial wording of questions relating to sexual behaviour
arose from data collected during focus group discussions held as part of the feasibility study
which were revised for the baseline survey following further qualitative investigation of
wording.
Given our experiences in the feasibility study and the baseline survey, extensive formative
research was carried at the time of the interim survey to further refine our sexual behavioural
questions (Mavhu et al., 2008). Seven qualitative researchers with broad experience in sexual
behavioural research held 65 gender specific cognitive interviews with a random sample of
study participants (aged 16‐20 years). Participants were selected from two study communities
that were not included in the interim survey. This was done to avoid the possibility of interim
survey participants incurring a bias from being too familiar with the questions in advance.
4.1.8.1 Cognitive interviewing methods
Our cognitive interviewing examined four basic cognitive stages that influence the question‐
answering process: question comprehension, information retrieval from memory, decision
processes used when answering, and processes for response generation (Tourangeau, 1984;
Tourangeau & Rasinski, 1988). Interviewers read our questions and response choices to the
respondents before engaging their cognition using two standard techniques (Willis, 1999;
Sudman et al., 1996b; Willis, 2005). During the ‘think‐aloud’ technique, the respondent was
trained in advance to verbally articulate their thought processes for answering each question.
These were recorded by the interviewer who interjected little. During verbal probing, the
interviewer asked the participant to provide additional information they thought was relevant
to the question.
After the resulting initial rephrasing, a second round of interviewing asked ten respondents to
complete the questionnaire. They were then interviewed retrospectively to ensure rephrased
questions were correctly interpreted and to ensure they could successfully complete skip
patterns.
Chapter 4: QDM Methods 112
After each round of interviews, interviewers shared respondents’ comments and suggestions.
These were reviewed by myself and the senior social scientist and analyzed thematically
following general principles of grounded theory (Glaser et al., 1967).
4.1.8.2 Results from cognitive interviews
Culturally, Shona women and especially young women, are not expected to initiate any aspect
of sexual activity. Young women emphasized they would not admit to these activities if
questions were phrased such that they were seen as the initiators. As such, our initial
question, ‘have you ever kissed a boy or a man?’ was rephrased to emphasize the passive
tense: ‘have you ever been kissed by a boy or a man?’
As mentioned in Chapter 3, formal terms for vaginal sex in Shona are euphemistic; they focus
on sleeping together and not on the actual sexual act. While slang terms exist, they are
colloquial and geographically specific. Cognitive interviewing confirmed two acceptable formal
terms: kusangana pabonde ‘meeting on the reed (sleeping) mat’ (used in the feasibility study
and the baseline survey) and kurara mese ‘sleeping together’. While participants concurred
that both were acceptable, they recommended the latter term as less archaic and one which
could be more easily formatted to include forced sex. However, due to its euphemistic nature,
female respondents highlighted that without further elaboration, sexually active girls could
easily take advantage of the term’s vagueness. One female respondent mentioned that,
‘otherwise it could mean that I was sleeping next to my brother.’ Female respondents
recommended describing vaginal sex within the question to make it less elusive.
Despite agreeing that consensual sex exists, participants noted that is it culturally
inappropriate for young women, to consent to sex (especially first sex) without a struggle, as
this was equated with being ‘loose’. This cultural expectation makes it extremely difficult to
draw a distinction between consensual and non‐consensual sex. As a result of these two
contextual requirements, our baseline question ‘have you ever had sex?’ was rephrased to
“have you ever slept together with a boy or a man (meaning that his private part entered your
private part) with you or without you consenting to it?’
Despite this, some female respondents claimed they would still be hesitant to answer this
question affirmatively. In our baseline questionnaire, forced sex was asked about in its various
manifestations including threats, coercion or rape. Cognitive interviewing highlighted the
distinction between ‘forced sex’ which takes place within a consenting relationship and rape
which is defined as forced sex with a family member or stranger. Given this heightened
Chapter 4: QDM Methods 113
cultural sensitivity to girls being allowed to ‘want’ sex, two additional questions were included,
one on forced sex and one on rape (which has it own specific term ‘chibaro’ in Shona).
Cognitive interviewing also suggested that young women find it difficult to divulge their
number of lifetime sexual partners. While male respondents claimed no difficulty in writing a
numerical answer to this question, female respondents asked for categorical response choices
which would help sanction reporting greater numbers of partners.
Another ambiguous concept relates to the term ‘regular sexual partner’ which can convey the
frequency of sexual encounters or its level of emotional attachment. Cognitive interviewing
linked the term to emotional attachment, and the question was phrased, ‘someone whom you
really regard as your sexual partner’.
Data from across Africa suggest that young people engage in anal sex because it is perceived to
protect against pregnancy and HIV (Matasha et al., 1998; Lane, Pettifor, Pascoe, Fiamma, &
Rees, 2006). Given its high risk of STI transmission, we felt it important to determine the
prevalence of anal sex within rural Zimbabwean youth. However, cognitive interviewing
highlighted young people’s tremendous discomfort with questions on anal sex. As no formal
term exists the question resulted in a graphic, anatomical description. With the added
sensitivity around the illegality of homosexual behaviour within Zimbabwe, the anal sex
question was omitted from this survey as it became apparent that it could compromise the
questionnaire’s overall acceptability. (This was, however, revisited for the final survey and
included there. See Chapter 7).
Subsequent cognitive interviewing revealed that using the passive tense in all our sexual
questions allowed young women to affirm their participation in sexual activity. All other
rephrased questions were equally well understood. As outlined in the previous chapter,
appropriate wording was originally developed following several focus group discussions and in‐
depth interviews with young people. We used phrasing that is commonly used by sexual
health researching in Zimbabwe in national and regional surveys (Ministry of Health & Child
Welfare (Zimbabwe) et al., 2004; Central Statistical Office et al., 2000) (Kang et al., 2006). The
new subtleties that emerged here emphasise the value of cognitive interviewing in the
development of questionnaire wording, the relative importance of open‐ended versus
categorical responses and the trade‐off between accuracy of formal terminology and
acceptably of euphemistic phrases.
As in the baseline survey, the section on sexual behaviour was introduced by a paragraph
reminding participants of the importance of answering these questions honestly and
Chapter 4: QDM Methods 114
reassuring them again that confidentiality would be maintained. Less sensitive questions
about dating, kissing and fondling were asked before proceeding to ask about each
participant’s experience with sexual intercourse. Participants who responded affirmatively to
the initial question on sexual activity were then asked about their sexual partners, condom use
at first and last sex, and numbers of lifetime partners.
4.1.9 Gender Relations Scales
We used two scales developed in South Africa to explore participant’s gender attitudes within
their sexual partnerships: the general relationship scale (10 items, score range 0‐40) which
assessed overall sexual partner attitudes which was answered by all participants irrespective of
their current sexual behaviour and the relationship control scale (10 items, score range 0‐40)
which was asked of those who currently had a regular sexual partner. (Dunkle et al., 2004).
Survey participants were asked to rank their agreement to various statements using a four
point (strong agree to strongly disagree) Likert Scale.
4.1.10 STI Diagnosis and Treatment
There were a series of questions that enquired about exposure to sexually transmitted
infections (STI). The set of six trigger symptoms were outlined (i) penile/vaginal discharge, ii)
itching or burning in penile/vaginal area, iii) pain on urination, iv) penile/vaginal sore or ulcer,
v) wart on anus or vulva, and vi) genital swelling and participants were asked to state whether
they had ever experienced them. If participants acknowledged personal exposure to an STI,
they were asked about their access to clinical diagnosis and treatment and whether condom
use had been suggested at that clinical visit.
4.2 Development of Four Questionnaire Delivery Modes
As was outlined at the end of Chapter 3 (see Table 4‐2) , four questionnaire delivery modes
were chosen to be assessed in this experimental evaluation. A brief description is provided
below that emphasizes the similarities and differences between the methods themselves.
4.2.1 Summary of Four Questionnaire Delivery Modes
4.2.1.1 Self‐Administered Questionnaire (SAQ):
This questionnaire delivery mode required the questionnaire to be printed in booklet form.
Each question was numbered, included an instruction on how to complete the response
options printed in italics underneath, and finished with a set of response options from which
the participant chose.
Chapter 4: QDM Methods 115
4.2.1.2 Audio Self‐Administered Questionnaire (Audio‐SAQ)
This questionnaire delivery mode builds on the method described above and includes an audio
player which participants used to listen to a gender specific voice read the questions,
instructions, and answers to each of the questions printed in the booklet. By replacing the
tape recorders used in the baseline survey with CD players, we were able to improve the
sound quality of this delivery mode. Equally important, by using a CD player, we were able to
use skip patterns (see more on the importance of this below). Key buttons on the CD players
were painted red.
4.2.1.3 Informal Confidential Voting Instrument (ICVI)
This questionnaire booklet was printed in two parts. ICVI interviewers were carefully selected ,
trained and supported. Interviewers used the first booklet to read the questions and response
options to the participant and completed the booklet on their behalf. Questions on orphaning,
poverty, and drug and alcohol abuse were asked in this section. In the second booklet, the
questions were read aloud by the trained interviewer but the participant marked their
responses on a private ballot sheet.
At three separate points during questionnaire administration, different questions requiring an
answer using the ballot (including questions on sexual behaviour, exposure to STI and possible
treatment and diagnosis, and self‐reported honesty in completing the questionnaire) were
asked. Upon questionnaire completion, the ballot paper was folded and placed into a locked
ballot box made of heavy wood. Keys to the ballot boxes were kept by the data team at the
office in Mutare.
4.2.1.3.1 Development of the Ballot Sheet for ICVI
As originally designed by Gregson and colleagues, responses to sensitive questions were all
numerical and recorded on a strip of paper (identified using a study ID) which was then placed
into a locked ballot box (Gregson et al., 2002b). In order to maximize the similarity between all
four questionnaire delivery modes in this survey, we were required to develop a more complex
ballot sheet which allowed participants to respond with non‐numerical answers (see Appendix
D). Answer cards were printed for those questions where there were several responses and
where it might be difficult for the participant to remember all possible response options. For
example, in the question categorizing their first sexual partner, there were a total of nine
response options (see Figure 4‐1 below).
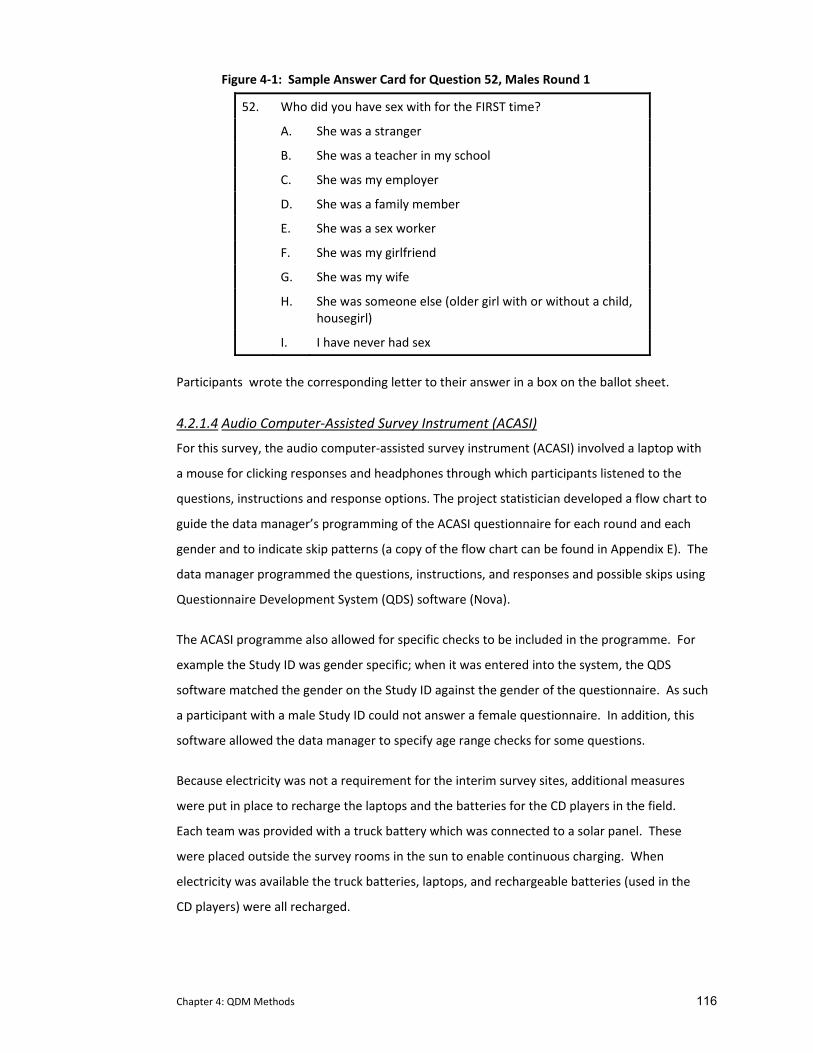
Chapter 4: QDM Methods 116
Figure 4‐1: Sample Answer Card for Question 52, Males Round 1
52. Who did you have sex with for the FIRST time?
A. She was a stranger
B. She was a teacher in my school
C. She was my employer
D. She was a family member
E. She was a sex worker
F. She was my girlfriend
G. She was my wife
H. She was someone else (older girl with or without a child, housegirl)
I. I have never had sex
Participants wrote the corresponding letter to their answer in a box on the ballot sheet.
4.2.1.4 Audio Computer‐Assisted Survey Instrument (ACASI)
For this survey, the audio computer‐assisted survey instrument (ACASI) involved a laptop with
a mouse for clicking responses and headphones through which participants listened to the
questions, instructions and response options. The project statistician developed a flow chart to
guide the data manager’s programming of the ACASI questionnaire for each round and each
gender and to indicate skip patterns (a copy of the flow chart can be found in Appendix E). The
data manager programmed the questions, instructions, and responses and possible skips using
Questionnaire Development System (QDS) software (Nova).
The ACASI programme also allowed for specific checks to be included in the programme. For
example the Study ID was gender specific; when it was entered into the system, the QDS
software matched the gender on the Study ID against the gender of the questionnaire. As such
a participant with a male Study ID could not answer a female questionnaire. In addition, this
software allowed the data manager to specify age range checks for some questions.
Because electricity was not a requirement for the interim survey sites, additional measures
were put in place to recharge the laptops and the batteries for the CD players in the field.
Each team was provided with a truck battery which was connected to a solar panel. These
were placed outside the survey rooms in the sun to enable continuous charging. When
electricity was available the truck batteries, laptops, and rechargeable batteries (used in the
CD players) were all recharged.

Chapter 4: QDM Methods 117
4.2.2 Randomization to One of Four Delivery Modes and Questionnaire Completion
Using a random permuted block design, cohort members were randomized to one of four
questionnaire delivery modes: SAQ, Audio‐SAQ, ICVI and ACASI in Round 1. In order to allow
for internal comparison, thirty five percent of Round 1 participants were randomised to
complete the questionnaire on a second occasion (Round 2), when they completed a
shortened version of the questionnaire (using one of the same four modes). This resulted in
20 different permutations to which participants could be allocated (see Figure 4‐2 below).
Random permutated blocks of 112 were used taking into account order of the delivery mode
in each round. Each method permutation was then assigned a block number and order with its
code. These codes were placed into sequentially numbered opaque envelopes in block and
number order. Following written, informed consent, each study participant picked the next
envelope in the block sequence. Checks were made to ensure that envelopes were allocated
sequentially (e.g. spot checks in the field and back at the office when the field staff checked
in). If a participant was assigned to complete the questionnaire in both Round 1 and Round 2,
they were asked to return to the survey site one week later to complete their Round 2 version.
The start and end time for completing each questionnaire was recorded.
A shorter version of the questionnaire was created for those participants assigned to Round 2
which included key sensitive questions. In total, 16 versions of the questionnaire were
created: one male and one female version for each of the four questionnaire delivery modes
for use in Round 1 (long version n=8) and Round 2 (short version n= 8). There was an English
and Shona translation for each of these 16 questionnaire versions (see Appendix C for a copy
of the questionnaire that combines all versions).
4.2.3 Issues Pertaining to the Audio Recording for Audio‐SAQ and ACASI
Research conducted in the US by Nass et al. indicates that the use of synthetic speech hinders
disclosure of personal information and that women are more perceptive of this nuance than
men (Nass, Robles, Heenan, Bienstock, & Treinen, 2003). This research already had planned to
use the voices of two real people, one male and one female for the audio recording. (It would
not have been possible to use a synthetic voice as the software could only read in English.)
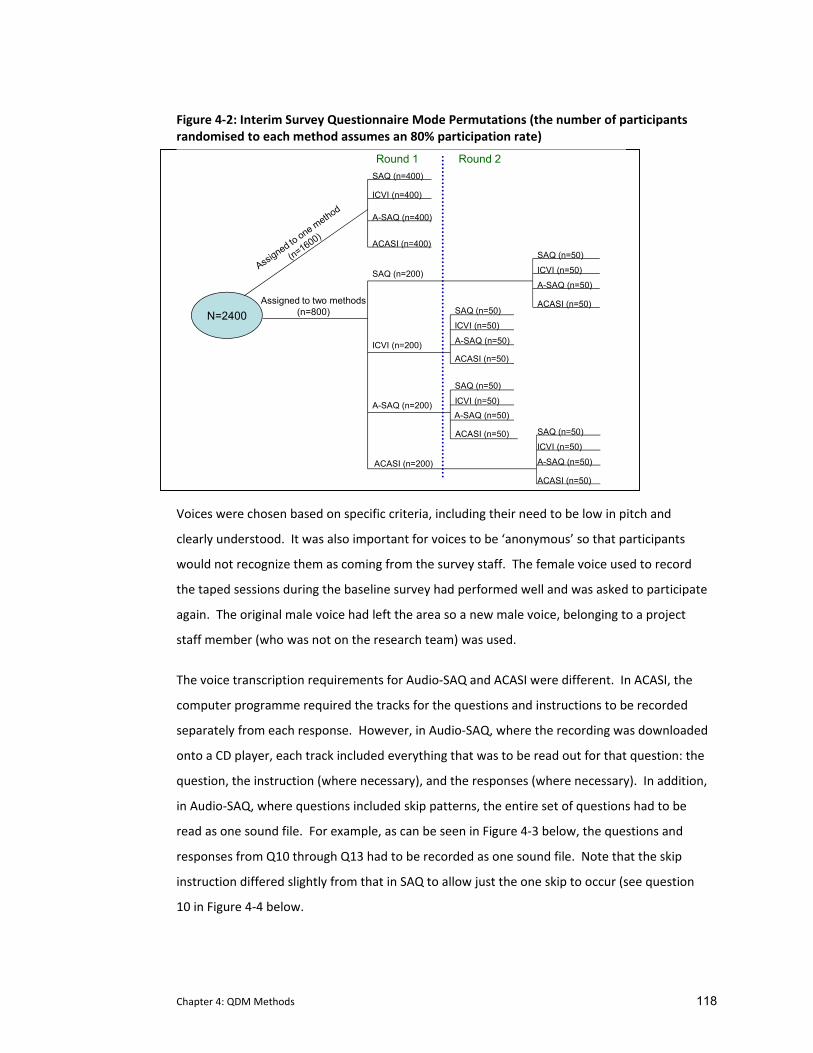
Chapter 4: QDM Methods 118
Figure 4‐2: Interim Survey Questionnaire Mode Permutations (the number of participants randomised to each method assumes an 80% participation rate)
N=2400
SAQ (n=400)
ACASI (n=400)
A-SAQ (n=400)
ICVI (n=400)
SAQ (n=50)
ACASI (n=50)
A-SAQ (n=50)
ICVI (n=50)
SAQ (n=50)
ACASI (n=50)
A-SAQ (n=50)
ICVI (n=50)
SAQ (n=50)
ACASI (n=50)
A-SAQ (n=50)
ICVI (n=50)
SAQ (n=50)
ACASI (n=50)
A-SAQ (n=50)ICVI (n=50)
Assigned to two methods (n=800)
SAQ (n=200)
ICVI (n=200)
A-SAQ (n=200)
ACASI (n=200)
Round 1 Round 2
Voices were chosen based on specific criteria, including their need to be low in pitch and
clearly understood. It was also important for voices to be ‘anonymous’ so that participants
would not recognize them as coming from the survey staff. The female voice used to record
the taped sessions during the baseline survey had performed well and was asked to participate
again. The original male voice had left the area so a new male voice, belonging to a project
staff member (who was not on the research team) was used.
The voice transcription requirements for Audio‐SAQ and ACASI were different. In ACASI, the
computer programme required the tracks for the questions and instructions to be recorded
separately from each response. However, in Audio‐SAQ, where the recording was downloaded
onto a CD player, each track included everything that was to be read out for that question: the
question, the instruction (where necessary), and the responses (where necessary). In addition,
in Audio‐SAQ, where questions included skip patterns, the entire set of questions had to be
read as one sound file. For example, as can be seen in Figure 4‐3 below, the questions and
responses from Q10 through Q13 had to be recorded as one sound file. Note that the skip
instruction differed slightly from that in SAQ to allow just the one skip to occur (see question
10 in Figure 4‐4 below.
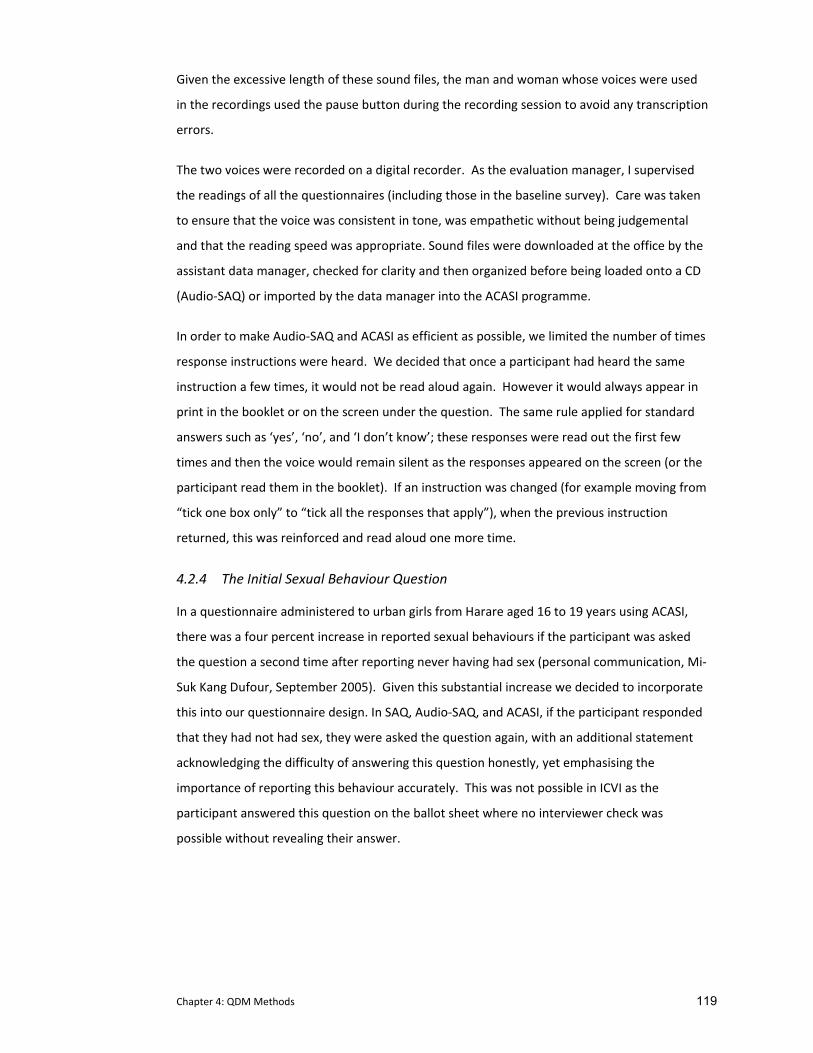
Chapter 4: QDM Methods 119
Given the excessive length of these sound files, the man and woman whose voices were used
in the recordings used the pause button during the recording session to avoid any transcription
errors.
The two voices were recorded on a digital recorder. As the evaluation manager, I supervised
the readings of all the questionnaires (including those in the baseline survey). Care was taken
to ensure that the voice was consistent in tone, was empathetic without being judgemental
and that the reading speed was appropriate. Sound files were downloaded at the office by the
assistant data manager, checked for clarity and then organized before being loaded onto a CD
(Audio‐SAQ) or imported by the data manager into the ACASI programme.
In order to make Audio‐SAQ and ACASI as efficient as possible, we limited the number of times
response instructions were heard. We decided that once a participant had heard the same
instruction a few times, it would not be read aloud again. However it would always appear in
print in the booklet or on the screen under the question. The same rule applied for standard
answers such as ‘yes’, ‘no’, and ‘I don’t know’; these responses were read out the first few
times and then the voice would remain silent as the responses appeared on the screen (or the
participant read them in the booklet). If an instruction was changed (for example moving from
“tick one box only” to “tick all the responses that apply”), when the previous instruction
returned, this was reinforced and read aloud one more time.
4.2.4 The Initial Sexual Behaviour Question
In a questionnaire administered to urban girls from Harare aged 16 to 19 years using ACASI,
there was a four percent increase in reported sexual behaviours if the participant was asked
the question a second time after reporting never having had sex (personal communication, Mi‐
Suk Kang Dufour, September 2005). Given this substantial increase we decided to incorporate
this into our questionnaire design. In SAQ, Audio‐SAQ, and ACASI, if the participant responded
that they had not had sex, they were asked the question again, with an additional statement
acknowledging the difficulty of answering this question honestly, yet emphasising the
importance of reporting this behaviour accurately. This was not possible in ICVI as the
participant answered this question on the ballot sheet where no interviewer check was
possible without revealing their answer.
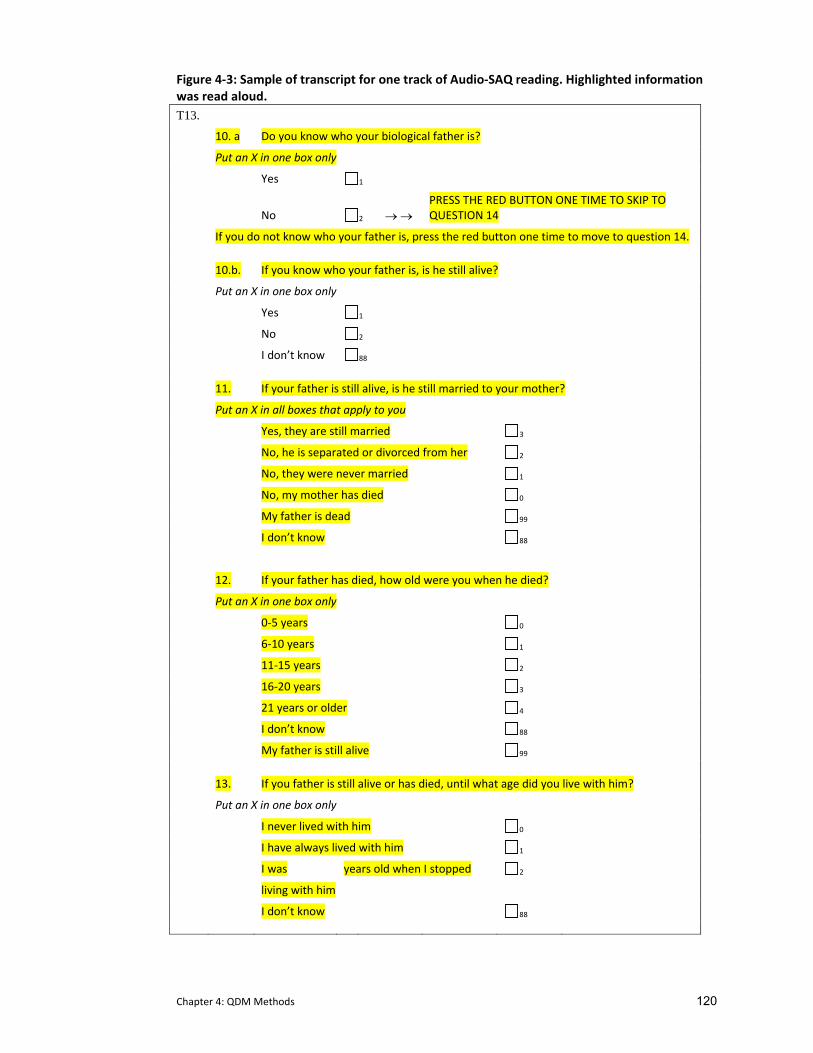
Chapter 4: QDM Methods 120
Figure 4‐3: Sample of transcript for one track of Audio‐SAQ reading. Highlighted information was read aloud. T13. 10. a Do you know who your biological father is?
Put an X in one box only
Yes 1
No 2 → →
PRESS THE RED BUTTON ONE TIME TO SKIP TO QUESTION 14
If you do not know who your father is, press the red button one time to move to question 14.
10.b. If you know who your father is, is he still alive?
Put an X in one box only
Yes 1
No 2
I don’t know 88
11. If your father is still alive, is he still married to your mother?
Put an X in all boxes that apply to you
Yes, they are still married 3
No, he is separated or divorced from her 2
No, they were never married 1
No, my mother has died 0
My father is dead 99
I don’t know 88
12. If your father has died, how old were you when he died?
Put an X in one box only
0‐5 years 0
6‐10 years 1
11‐15 years 2
16‐20 years 3
21 years or older 4
I don’t know 88
My father is still alive 99
13. If you father is still alive or has died, until what age did you live with him?
Put an X in one box only
I never lived with him 0
I have always lived with him 1
I was years old when I stopped 2
living with him
I don’t know 88
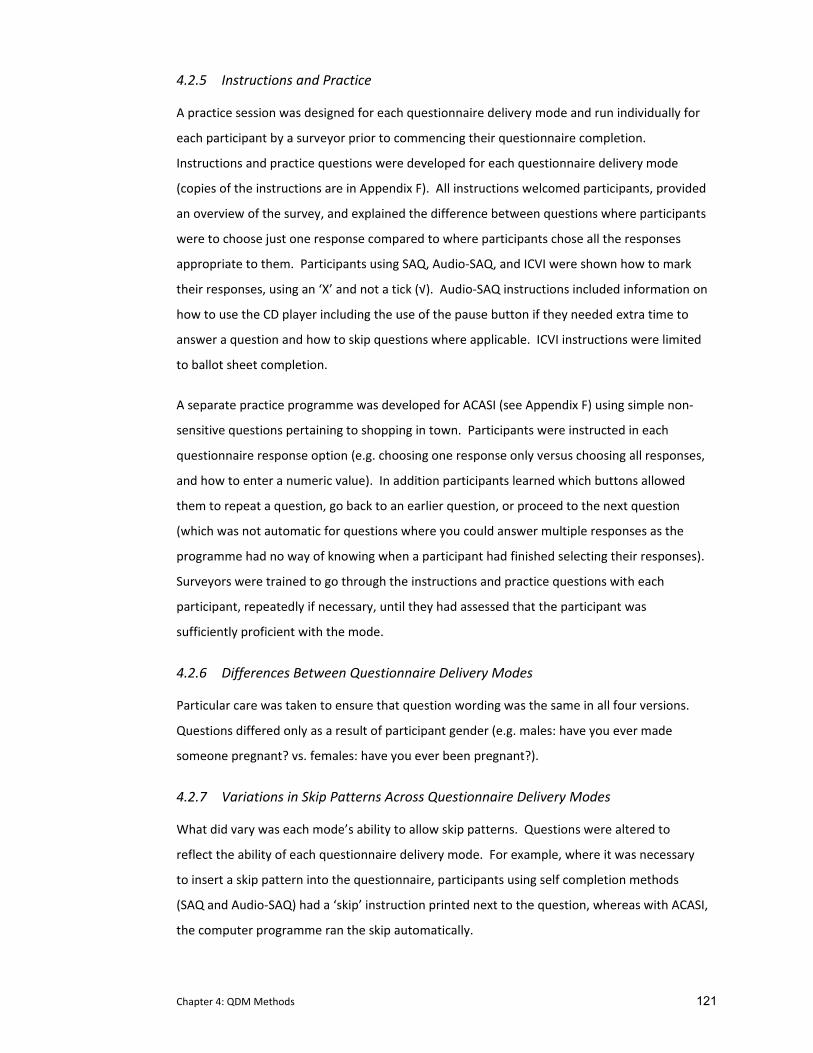
Chapter 4: QDM Methods 121
4.2.5 Instructions and Practice
A practice session was designed for each questionnaire delivery mode and run individually for
each participant by a surveyor prior to commencing their questionnaire completion.
Instructions and practice questions were developed for each questionnaire delivery mode
(copies of the instructions are in Appendix F). All instructions welcomed participants, provided
an overview of the survey, and explained the difference between questions where participants
were to choose just one response compared to where participants chose all the responses
appropriate to them. Participants using SAQ, Audio‐SAQ, and ICVI were shown how to mark
their responses, using an ‘X’ and not a tick (√). Audio‐SAQ instructions included information on
how to use the CD player including the use of the pause button if they needed extra time to
answer a question and how to skip questions where applicable. ICVI instructions were limited
to ballot sheet completion.
A separate practice programme was developed for ACASI (see Appendix F) using simple non‐
sensitive questions pertaining to shopping in town. Participants were instructed in each
questionnaire response option (e.g. choosing one response only versus choosing all responses,
and how to enter a numeric value). In addition participants learned which buttons allowed
them to repeat a question, go back to an earlier question, or proceed to the next question
(which was not automatic for questions where you could answer multiple responses as the
programme had no way of knowing when a participant had finished selecting their responses).
Surveyors were trained to go through the instructions and practice questions with each
participant, repeatedly if necessary, until they had assessed that the participant was
sufficiently proficient with the mode.
4.2.6 Differences Between Questionnaire Delivery Modes
Particular care was taken to ensure that question wording was the same in all four versions.
Questions differed only as a result of participant gender (e.g. males: have you ever made
someone pregnant? vs. females: have you ever been pregnant?).
4.2.7 Variations in Skip Patterns Across Questionnaire Delivery Modes
What did vary was each mode’s ability to allow skip patterns. Questions were altered to
reflect the ability of each questionnaire delivery mode. For example, where it was necessary
to insert a skip pattern into the questionnaire, participants using self completion methods
(SAQ and Audio‐SAQ) had a ‘skip’ instruction printed next to the question, whereas with ACASI,
the computer programme ran the skip automatically.
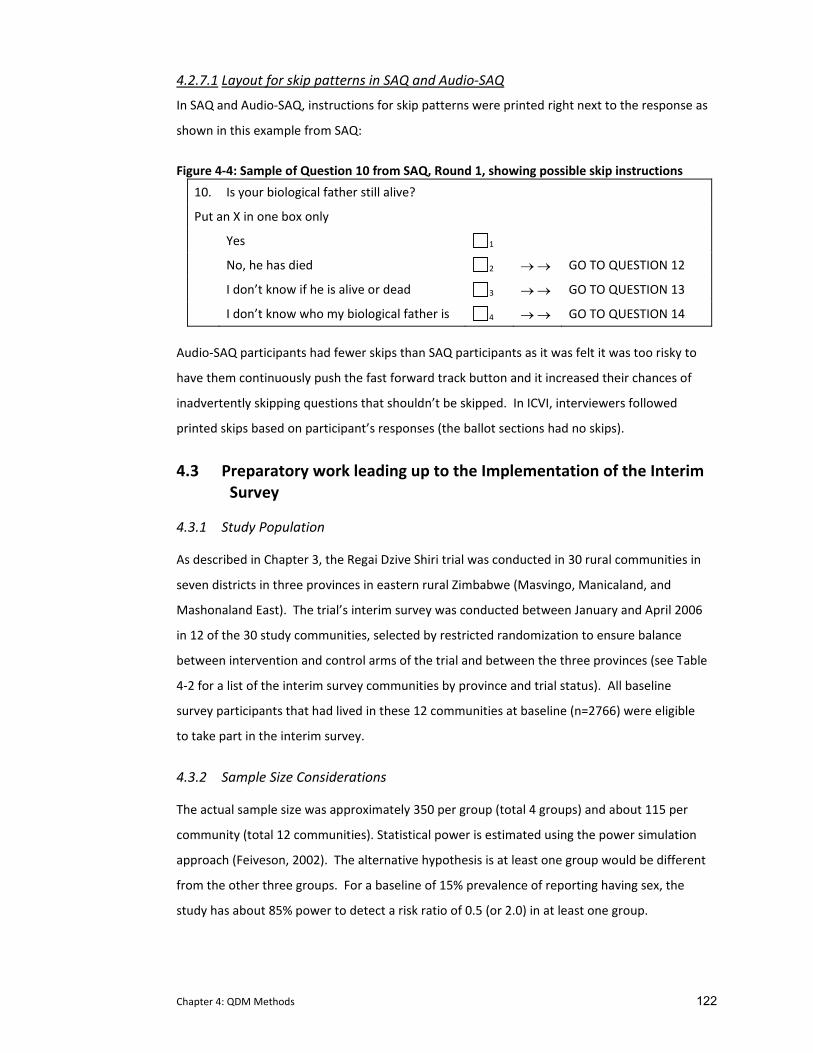
Chapter 4: QDM Methods 122
4.2.7.1 Layout for skip patterns in SAQ and Audio‐SAQ In SAQ and Audio‐SAQ, instructions for skip patterns were printed right next to the response as
shown in this example from SAQ:
Figure 4‐4: Sample of Question 10 from SAQ, Round 1, showing possible skip instructions
10. Is your biological father still alive?
Put an X in one box only
Yes 1
No, he has died 2 → → GO TO QUESTION 12
I don’t know if he is alive or dead 3 → → GO TO QUESTION 13
I don’t know who my biological father is 4 → → GO TO QUESTION 14
Audio‐SAQ participants had fewer skips than SAQ participants as it was felt it was too risky to
have them continuously push the fast forward track button and it increased their chances of
inadvertently skipping questions that shouldn’t be skipped. In ICVI, interviewers followed
printed skips based on participant’s responses (the ballot sections had no skips).
4.3 Preparatory work leading up to the Implementation of the Interim Survey
4.3.1 Study Population
As described in Chapter 3, the Regai Dzive Shiri trial was conducted in 30 rural communities in
seven districts in three provinces in eastern rural Zimbabwe (Masvingo, Manicaland, and
Mashonaland East). The trial’s interim survey was conducted between January and April 2006
in 12 of the 30 study communities, selected by restricted randomization to ensure balance
between intervention and control arms of the trial and between the three provinces (see Table
4‐2 for a list of the interim survey communities by province and trial status). All baseline
survey participants that had lived in these 12 communities at baseline (n=2766) were eligible
to take part in the interim survey.
4.3.2 Sample Size Considerations
The actual sample size was approximately 350 per group (total 4 groups) and about 115 per
community (total 12 communities). Statistical power is estimated using the power simulation
approach (Feiveson, 2002). The alternative hypothesis is at least one group would be different
from the other three groups. For a baseline of 15% prevalence of reporting having sex, the
study has about 85% power to detect a risk ratio of 0.5 (or 2.0) in at least one group.
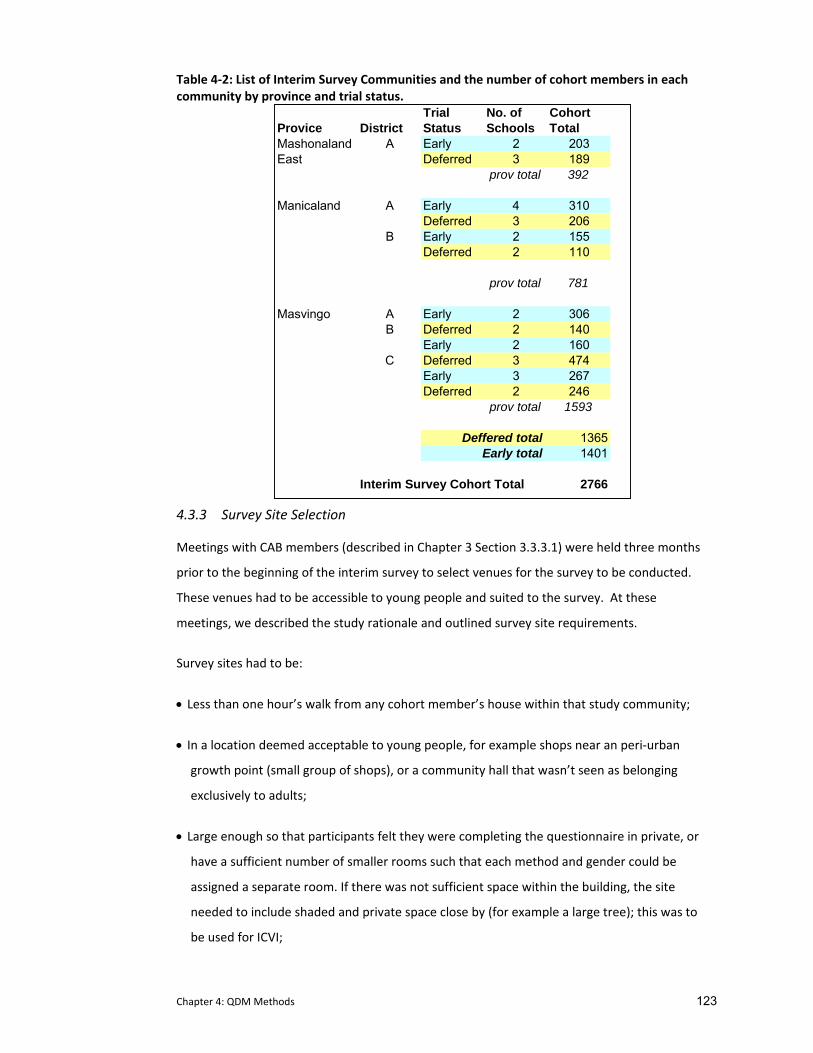
Chapter 4: QDM Methods 123
Table 4‐2: List of Interim Survey Communities and the number of cohort members in each community by province and trial status.
Trial No. of CohortProvice District Status Schools TotalMashonaland A Early 2 203East Deferred 3 189
prov total 392
Manicaland A Early 4 310Deferred 3 206
B Early 2 155Deferred 2 110
prov total 781
Masvingo A Early 2 306B Deferred 2 140
Early 2 160C Deferred 3 474
Early 3 267Deferred 2 246
prov total 1593
13651401
Interim Survey Cohort Total 2766
Deffered totalEarly total
4.3.3 Survey Site Selection
Meetings with CAB members (described in Chapter 3 Section 3.3.3.1) were held three months
prior to the beginning of the interim survey to select venues for the survey to be conducted.
These venues had to be accessible to young people and suited to the survey. At these
meetings, we described the study rationale and outlined survey site requirements.
Survey sites had to be:
• Less than one hour’s walk from any cohort member’s house within that study community;
• In a location deemed acceptable to young people, for example shops near an peri‐urban
growth point (small group of shops), or a community hall that wasn’t seen as belonging
exclusively to adults;
• Large enough so that participants felt they were completing the questionnaire in private, or
have a sufficient number of smaller rooms such that each method and gender could be
assigned a separate room. If there was not sufficient space within the building, the site
needed to include shaded and private space close by (for example a large tree); this was to
be used for ICVI;
Chapter 4: QDM Methods 124
• Relatively close to public toilets so female participants could provide us with a urine sample
discreetly;
• As the survey was scheduled to take place during the rainy season, we asked that buildings
have a roof. However, it was not essential to have complete walls that went from the floor
to the ceiling as this would have eliminated many possible buildings.
Electricity was not a requirement as this would again have eliminated most public buildings in
rural areas.
CAB members were asked to select appropriate sites which were reviewed and the final
selection was conducted by myself and the field coordinator between December 2005 and
January 2006. Based on the above specifications, we found suitable survey sites in newly built
shops at business centres and growth points, community halls, churches, abandoned buildings,
and clinics6. To ensure that all cohort members could reach a study site in less than an hour’s
walk, all study communities were allocated more than one survey site. All community and
government officials were duly notified.
4.3.4 Letters of Invitation
Personalized invitation letters were printed at the project office in Mutare (a copy of this can
be found in Appendix G) and were distributed in communities one month prior to the survey
being run in that community. Each letter invited the cohort member to attend the interim
survey, listed the dates and locations of survey sites specific to their community and requested
them to bring a form of photo ID ( e.g. birth certificate or national ID) and their invitation
letter. Project field staff worked with school administrations and CAB members to distribute
the letters in study communities. In addition, posters advertising the survey site locations
were placed around the community in youth centric locations (such as the grinding mill) two
weeks prior to our arrival.
4.3.5 Survey Team Training
A three day training was held prior to survey administration which reviewed the detailed
Interim Survey Standard Operating Procedures (available from the author). The training
covered study rationale, ensured that each survey staff had practical experience with each of
the four questionnaire delivery modes, and emphasised the importance of ensuring
6 Our most unique site was an unused piggery, where the different stalls could be used to house the different questionnaire delivery modes.
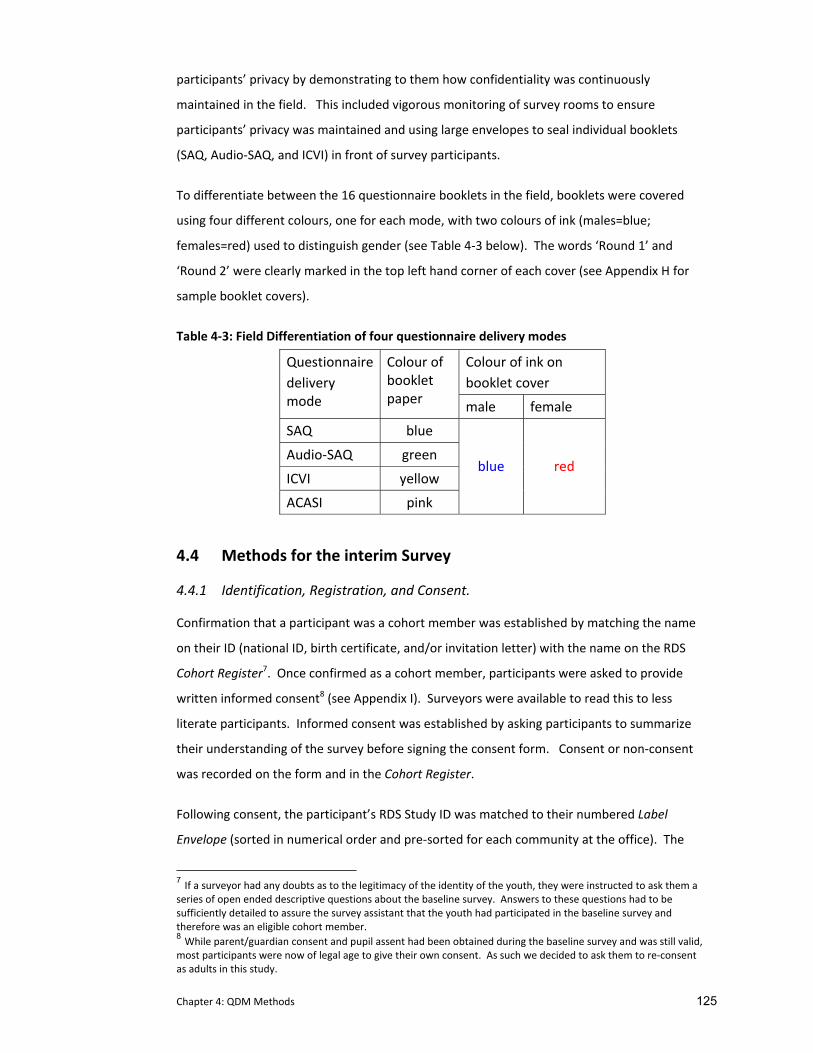
Chapter 4: QDM Methods 125
participants’ privacy by demonstrating to them how confidentiality was continuously
maintained in the field. This included vigorous monitoring of survey rooms to ensure
participants’ privacy was maintained and using large envelopes to seal individual booklets
(SAQ, Audio‐SAQ, and ICVI) in front of survey participants.
To differentiate between the 16 questionnaire booklets in the field, booklets were covered
using four different colours, one for each mode, with two colours of ink (males=blue;
females=red) used to distinguish gender (see Table 4‐3 below). The words ‘Round 1’ and
‘Round 2’ were clearly marked in the top left hand corner of each cover (see Appendix H for
sample booklet covers).
Table 4‐3: Field Differentiation of four questionnaire delivery modes
Colour of ink on booklet cover
Questionnairedelivery mode
Colour of booklet paper male female
SAQ blue
Audio‐SAQ green
ICVI yellow
ACASI pink
blue red
4.4 Methods for the interim Survey
4.4.1 Identification, Registration, and Consent.
Confirmation that a participant was a cohort member was established by matching the name
on their ID (national ID, birth certificate, and/or invitation letter) with the name on the RDS
Cohort Register7. Once confirmed as a cohort member, participants were asked to provide
written informed consent8 (see Appendix I). Surveyors were available to read this to less
literate participants. Informed consent was established by asking participants to summarize
their understanding of the survey before signing the consent form. Consent or non‐consent
was recorded on the form and in the Cohort Register.
Following consent, the participant’s RDS Study ID was matched to their numbered Label
Envelope (sorted in numerical order and pre‐sorted for each community at the office). The
7 If a surveyor had any doubts as to the legitimacy of the identity of the youth, they were instructed to ask them a series of open ended descriptive questions about the baseline survey. Answers to these questions had to be sufficiently detailed to assure the survey assistant that the youth had participated in the baseline survey and therefore was an eligible cohort member. 8 While parent/guardian consent and pupil assent had been obtained during the baseline survey and was still valid, most participants were now of legal age to give their own consent. As such we decided to ask them to re‐consent as adults in this study.
Chapter 4: QDM Methods 126
Label Envelope included all of the requisite study labels for the survey (consent form, cohort
register, questionnaire delivery mode allocation and questionnaire, biological specimens, and
lab forms) and had a pre‐printed checklist on the front that ensured that participants
completed all survey stations and that all study labels were used.
Following positive consent, participants were then asked to select and open the next envelope
which randomly allocated them to a questionnaire delivery mode (this was described earlier
(in section 4.2.2 see Appendix J for a copy of the code sheet). If the participant selected a code
that allocated them to complete a questionnaire in Round 2, the specified booklet for that
mode was labelled with the participant’s study ID and placed in a large labelled envelope and
set aside for completion in the following week.
The participant’s relevant questionnaire for Round 1 was labelled and they were escorted to a
room where they could complete their questionnaire. If the participant has been allocated
ICVI, Audio‐SAQ or ACASI and the method was not available (e.g. all interviewers were busy, all
laptops were occupied), the participant was asked to proceed to the nurse’s station and
provide their biological samples first.
4.4.2 Collection and Testing of Biological Samples
All participants were asked to provide a finger prick blood specimen which was collected,
processed and analysed as described previously in Chapter 3. Female participants were also
asked to supply a urine sample for pregnancy testing, which again were tested, processed and
analysed as described previously.
4.5 Statistical analysis plan
4.5.1 Data Handling
All interim survey data was kept in lockable containers until they were returned to the project
office in Mutare.
Questionnaire data that were collected on paper (SAQ, Audio‐SAQ, and ICVI) were coded by
trained data clerks prior to data entry. ACASI data was downloaded from each laptop and
imported directly into the database. Data were entered into an MS Access database (10%
double entered) and cleaned. Data range and consistency checks were performed and
preliminary analyses undertaken.
Chapter 4: QDM Methods 127
4.5.2 Statistical Analysis For A Priori Questions
The statistical analysis plan was developed by myself, Frances Cowan (PI), Sophie Pascoe
(project statistician) and Yin Bun Cheung, a senior statistician at the London School of Hygiene
and Tropical Medicine. Yin Bun Cheung undertook all pre‐planned statistical analyses. I
undertook some additional analyses with support from the project statistician (Sophie Pascoe).
All statistical analyses were performed using Stata 10 (College Station, TX).
Global null hypotheses of parameters, being identical across all four methods, was tested at
the 5% level. If the global null hypothesis was not rejected, no pair wise test of difference
between pairs of individual methods was undertaken. Otherwise, pair wise comparisons were
conducted between methods and tested at the 5% level.
4.5.2.1 Non‐item response rate
An overall item non‐response rate was calculated for all questions in the questionnaire. This
‘global’ item non‐response was defined as the number of questions applicable to all
participants but not answered. “I don’t know” was considered a valid response. In addition,
six sensitive questions were pre‐selected prior to analysis to compare item non‐response rates
and reporting of sexual behaviours between the four questionnaire delivery modes. These
included ever been kissed, ever had sex, age at first sex, condom use at last sex, lifetime
number of sexual partners, and experiencing (or having a female partner experience) an
abortion. Item non‐response rates were calculated as the proportion not answering each
question (excluding those participants where the question was not applicable).
4.5.2.2 Prevalence of sexual behaviours Participants with missing values for the six sensitive questions were excluded from prevalence
analysis. The prevalence of reporting kissing and ever having sexual intercourse were
compared between the four methods. For those who reported ever having sex, prevalence of
age at first sex, number of lifetime partners and condom use at last sex were compared
between the four methods. As discussed earlier (see 4.2.4 above) the question ‘have you ever
had sex?’ was asked twice (Q50 and then again in Q63) for those using SAQ, Audio‐SAQ and
ACASI. In the primary analysis, only the response to Q50 was used in the comparison; in the
secondary analysis while the figure for ICVI remained unchanged, prevalence estimates were
based on the response to Q50 and Q63, with the response to Q63 replacing any missing or
negative responses to Q50. For secondary analysis of number of lifetime partners and condom
use at last sex, positive responses from Q63 were included from SAQ and ACASI (but remain
Chapter 4: QDM Methods 128
unchanged for ICVI and Audio‐SAQ because the respondent could not go back to those
questions).
For binary variables, binomial distribution was used to estimate 95% confidence intervals (CI)
for the proportion parameter for each interview method separately. For continuous variables,
the mean age at first sex and mean number of lifetime partners were calculated and 95% CI
estimated. Logistic regression which accounted for clustering was used to compare the
proportions between the four methods. The Wald test was used to test the null hypothesis of
no interview method effect. The correlation between reported sexual behaviour and
biomarkers of sexual activity were also compared between the methods. Analyses were
adjusted for the following a priori covariates: gender, education, orphaning, marital status, HIV
and HSV‐2 status, and pregnancy (females only).
4.5.3 Analysis of Skip Patterns
There were a possible 20 skip patterns included in the questionnaire (dependent on method).
Data from SAQ and Audio‐SAQ (where participants were independently responsible for skip
patterns) were analysed to see how successfully participants completed each of their skips. A
successful completion was defined as a participant answering the next appropriate question
after the skip was established (e.g. if they answered ‘yes’ to sex in Q50, they should proceed to
the next question, and if they answered ‘no’ they should skip to a later question).
4.5.4 Comparisons with Biological Markers
For males and females, a positive HSV‐2 test and/or incident HIV (acquired since the baseline
survey) and for females positive pregnancy test was taken as biological evidence of ever having
had sex. Among participants who had biological evidence of having had sex, the proportion
reporting ‘no’ to the question on having had sex in the questionnaire constituted a false reply.
In the primary analysis, only responses to Q50 were used to compare the four methods. In the
secondary analysis, positive responses to Q63 in SAQ, Audio‐SAQ and ACASI were used to
replace the missing or negative reply in Q50.
4.5.5 Internal Comparisons Between Round 1 and Round 2
Answers to the question ‘have you ever had sex?’ were compared between Round 1 and
Round 2 (completed one week later). Those participants who responded ‘no’ to this question
in Round 1 but changed their response to ‘yes’ in Round 2 were defined as ‘positive
conversions.’ Likewise, those participants who responded ‘yes’ in Round 1 but ‘no’ in Round 2
were defined as ‘negative conversions.’ McNemar’s chi square test was used to assess the
Chapter 4: QDM Methods 129
effect of answering this sensitive question using an alternative method in Round 2. Discordant
pairs of answers (i.e. positive and negative conversions) between Rounds 1 and 2 were
compared separately for each Round 2 method against combined Round 1 methods. Those
who had completed the same method in both rounds were excluded from the analysis. For
example, the answers given by those who completed using SAQ in Round 2, were compared to
answers given by those who completed using ICVI, Audio‐SAQ or ACASI in Round 1, and those
completing using SAQ in both round 1 and 2 were excluded.
4.5.6 Time to Completion of Questionnaire:
Times were rounded to their nearest five minutes for comparison of the start and end times.
Mean and 95% CI of completion time by questionnaire were calculated. If global test of no
difference across four interview methods was rejected at the 0.050 level, P‐values for the
pairwise comparison were examined.
4.5.7 Self‐reported Honesty
At the end of the questionnaire, participants were asked to report on their level of honesty
when answering questions throughout the questionnaire. Self reported honesty around
questionnaire completion was compared across all five ordered categories between the four
methods. The five point scale was collapsed into a three point scale (completely and very
honest, fairly honest, and not very honest and not honest at all). ICVI users were asked to
assess their level of honesty both overall (which was compared against the other three
methods) as well as specifically on the ballot sheet. For ICVI respondents, an additional
comparison of the differences between these two honesty reports was analyzed.
4.5.8 Statistical Analysis for Other Sensitive Questions
Additional questions on other sensitive issues including mental health, poverty, drug and
alcohol use, orphaning, and circumcision were also compared across questionnaire delivery
modes. This was done as a post hoc analysis. Both item non‐response rates and proportion
reporting these factors were examined. No adjustments were carried out for these analysis.
Participants who failed to answer any questions in the questionnaire were excluded from this
analysis.
4.6 Summary
This chapter has outlined the development of the questionnaire’s contents, has provided a
detailed description of the development of the four questionnaire delivery modes, and
outlined the design of the experimental evaluation. Specifically it has focused on how the
Chapter 4: QDM Methods 130
questions were adapted to compensate for each method’s uniqueness while maintaining the
integrity of the questionnaire as a whole. This chapter concludes with a summary of the field
survey methodology and a description of the statistical analysis used to evaluate differences in
the four questionnaire delivery modes.
The following two chapters present the results of this experimental evaluation. In the next
chapter, item non‐response and reporting of socially censured behaviours are compared
between questionnaire delivery modes. Analysis of biological markers is also included. The
following chapter (Chapter 6) examines the qualitative and quantitative data used to assess
the acceptability and feasibility of the questionnaire delivery modes.
Chapter 5:QDM Trial Results 131
5 EXPERIMENTAL RESULTS FROM THE QDM TRIAL NESTED WITHIN
THE REGAI DZIVE SHIRI INTERIM SURVEY COMPARING FOUR QUESTIONNAIRE DELIVERY MODES
In this chapter I present the quantitative results of the experimental comparison of socially
censured data collected using four questionnaire delivery modes. I begin by presenting
demographic characteristics of the interim survey respondents. In the second section, I report
on the results from the pre‐specified sexual behavioural data, including item non‐response
rates, prevalence of reported sexual behaviours, and the correlation between biomarkers and
self‐reported sexual behaviour data by questionnaire delivery mode. I then look at changes in
responses to self‐reported sexual behaviour data when the same respondent is asked the
question a second time in a separate round. I conclude this chapter by examining comparative
data from post hoc analysis of other socially censured behaviours including psychological well‐
being, poverty, orphaning, drug and alcohol use, and circumcision.
5.1 Analysis and effects of clustering
Initial random effects analyses showed no evidence of community clustering (p ranging from
0.253 to 1.000 in various outcomes). The analyses taking account of clustering were
comparable to those assuming no community clustering. Therefore the analyses reported here
do not take account of community clustering for simplicity and for availability of robust choices
(e.g. Fisher’s exact test).
5.2 Demographic data
Fourteen hundred and ninety five respondents from the original cohort took part in the
interim survey (827 males and 668 females). This represented 54% of those eligible to
participate from the baseline survey but 96% of those eligible who were still living in study
communities (n=1557) at the time of this survey (see Figure 5‐1). When baseline
characteristics were compared between respondents and non‐respondents, interim survey
respondents were more likely to be male than non respondents (55% c.v. 48%; p<0.001), were
younger (26% < 15 years c.v. 20%; p<0.001) and less likely to be orphaned (64% c.v. 66%
p=0.016). However, they were no more or less likely to have reported being sexually active
(6% c.v. 8%; p=0.088). There was an equal proportion of interim survey respondents from each
study arm.
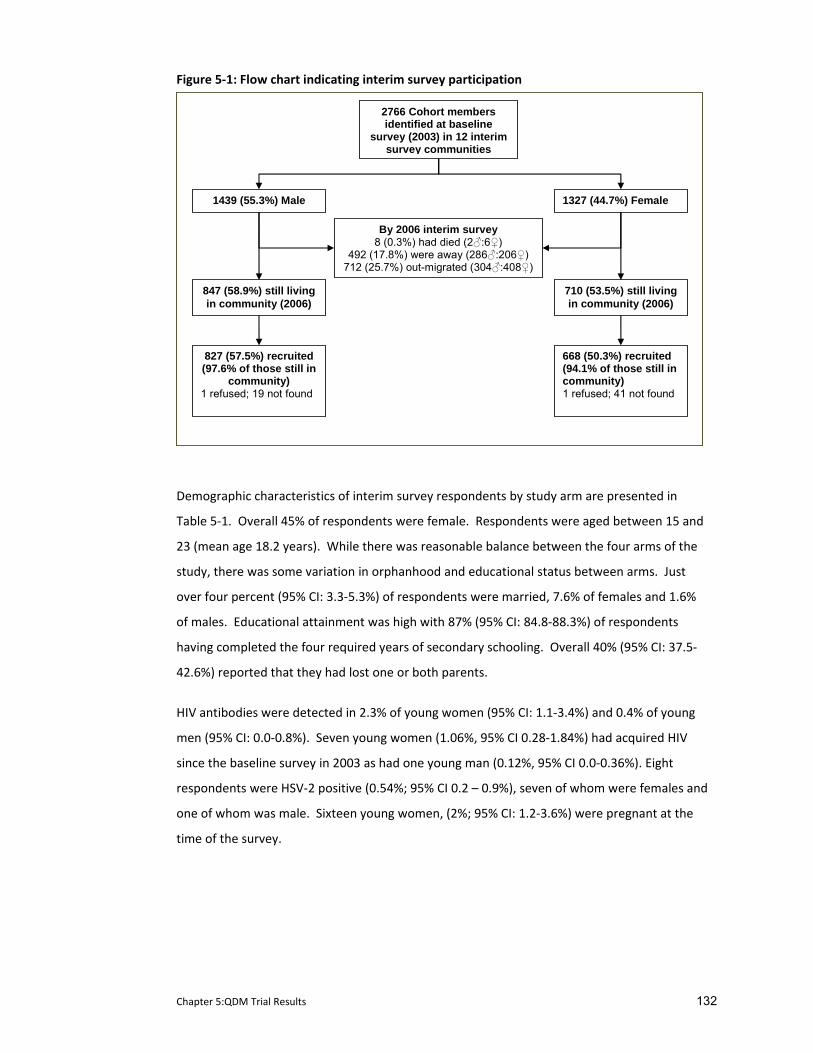
Chapter 5:QDM Trial Results 132
Figure 5‐1: Flow chart indicating interim survey participation
2766 Cohort membersidentified at baseline
survey (2003) in 12 interim survey communities
1439 (55.3%) Male 1327 (44.7%) Female
847 (58.9%) still living in community (2006)
827 (57.5%) recruited (97.6% of those still in
community) 1 refused; 19 not found
668 (50.3%) recruited(94.1% of those still in community) 1 refused; 41 not found
By 2006 interim survey8 (0.3%) had died (2♂:6♀)
492 (17.8%) were away (286♂:206♀) 712 (25.7%) out-migrated (304♂:408♀)
710 (53.5%) still living in community (2006)
Demographic characteristics of interim survey respondents by study arm are presented in
Table 5‐1. Overall 45% of respondents were female. Respondents were aged between 15 and
23 (mean age 18.2 years). While there was reasonable balance between the four arms of the
study, there was some variation in orphanhood and educational status between arms. Just
over four percent (95% CI: 3.3‐5.3%) of respondents were married, 7.6% of females and 1.6%
of males. Educational attainment was high with 87% (95% CI: 84.8‐88.3%) of respondents
having completed the four required years of secondary schooling. Overall 40% (95% CI: 37.5‐
42.6%) reported that they had lost one or both parents.
HIV antibodies were detected in 2.3% of young women (95% CI: 1.1‐3.4%) and 0.4% of young
men (95% CI: 0.0‐0.8%). Seven young women (1.06%, 95% CI 0.28‐1.84%) had acquired HIV
since the baseline survey in 2003 as had one young man (0.12%, 95% CI 0.0‐0.36%). Eight
respondents were HSV‐2 positive (0.54%; 95% CI 0.2 – 0.9%), seven of whom were females and
one of whom was male. Sixteen young women, (2%; 95% CI: 1.2‐3.6%) were pregnant at the
time of the survey.
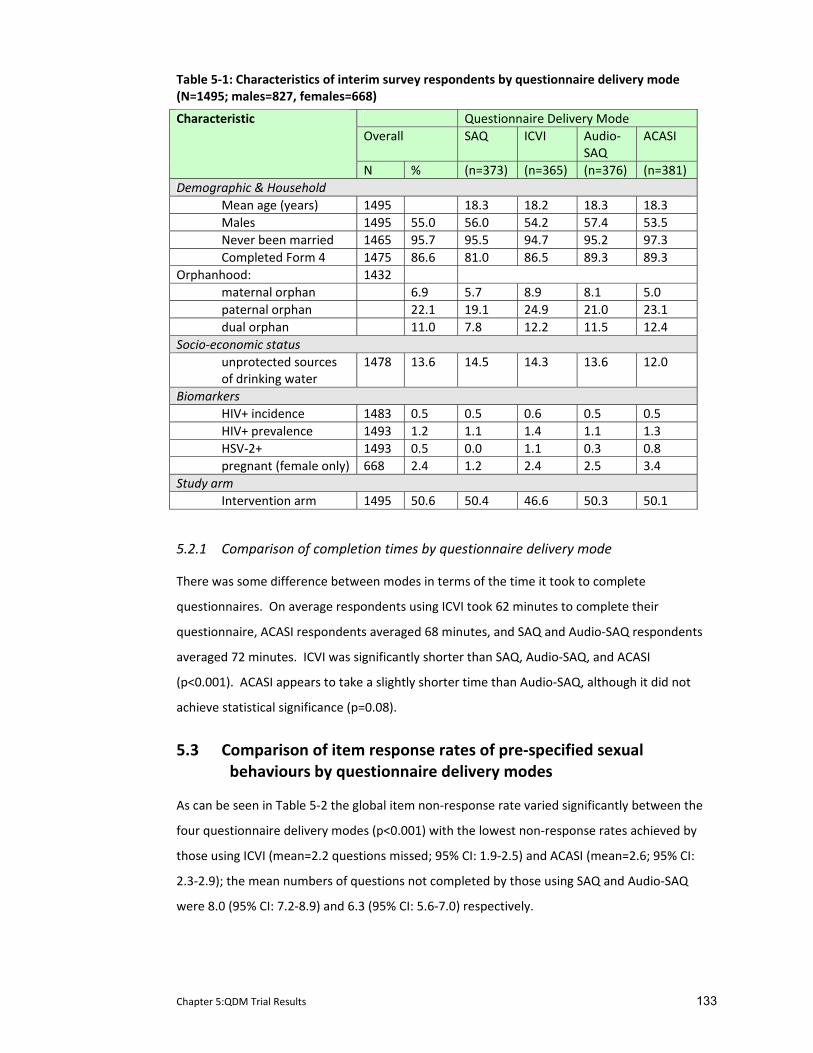
Chapter 5:QDM Trial Results 133
Table 5‐1: Characteristics of interim survey respondents by questionnaire delivery mode (N=1495; males=827, females=668)
Questionnaire Delivery Mode Overall SAQ ICVI Audio‐
SAQ ACASI
Characteristic
N % (n=373) (n=365) (n=376) (n=381) Demographic & Household Mean age (years) 1495 18.3 18.2 18.3 18.3 Males 1495 55.0 56.0 54.2 57.4 53.5 Never been married 1465 95.7 95.5 94.7 95.2 97.3 Completed Form 4 1475 86.6 81.0 86.5 89.3 89.3 Orphanhood: 1432 maternal orphan 6.9 5.7 8.9 8.1 5.0 paternal orphan 22.1 19.1 24.9 21.0 23.1 dual orphan 11.0 7.8 12.2 11.5 12.4 Socio‐economic status unprotected sources of drinking water
1478 13.6 14.5 14.3 13.6 12.0
Biomarkers HIV+ incidence 1483 0.5 0.5 0.6 0.5 0.5 HIV+ prevalence 1493 1.2 1.1 1.4 1.1 1.3 HSV‐2+ 1493 0.5 0.0 1.1 0.3 0.8 pregnant (female only) 668 2.4 1.2 2.4 2.5 3.4 Study arm Intervention arm 1495 50.6 50.4 46.6 50.3 50.1
5.2.1 Comparison of completion times by questionnaire delivery mode
There was some difference between modes in terms of the time it took to complete
questionnaires. On average respondents using ICVI took 62 minutes to complete their
questionnaire, ACASI respondents averaged 68 minutes, and SAQ and Audio‐SAQ respondents
averaged 72 minutes. ICVI was significantly shorter than SAQ, Audio‐SAQ, and ACASI
(p<0.001). ACASI appears to take a slightly shorter time than Audio‐SAQ, although it did not
achieve statistical significance (p=0.08).
5.3 Comparison of item response rates of pre‐specified sexual behaviours by questionnaire delivery modes
As can be seen in Table 5‐2 the global item non‐response rate varied significantly between the
four questionnaire delivery modes (p<0.001) with the lowest non‐response rates achieved by
those using ICVI (mean=2.2 questions missed; 95% CI: 1.9‐2.5) and ACASI (mean=2.6; 95% CI:
2.3‐2.9); the mean numbers of questions not completed by those using SAQ and Audio‐SAQ
were 8.0 (95% CI: 7.2‐8.9) and 6.3 (95% CI: 5.6‐7.0) respectively.
Chapter 5:QDM Trial Results 134
5.4 Comparison of response rates for pre‐specified sexual behaviour questions
Table 5‐3 shows the difference between modes by reported prevalence of sexual behaviours.
There is some evidence that Audio‐SAQ and ACASI users were more likely to report sexual
behaviours than those using other modes. For example, respondents using Audio‐SAQ and
ACASI were more likely to report having kissed someone or having had sex than respondents
using the other modes, although this relationship is only of borderline significance (p=0.051
and p=0.068 respectively). After adjusting for covariates, adjusted odds ratio for reporting
ever having had sex indicated that Audio‐SAQ and ACASI users were twice as likely to report
having had sex compared to those who completed the questionnaire using SAQ; there was no
apparent difference in reporting between ICVI and SAQ users (ICVI adjusted OR (AOR) =1.0
[95% CI: 0.6‐1.8]; Audio‐SAQ AOR=2.05 [95% CI: 1.2‐3.4]; ACASI AOR=2.0 [95% CI: 1.2‐3.2]).
Those using ACASI also reported starting sex between 0.7‐1.7 years earlier than those using
the other modes (p=0.045) and also reported more partners than those using other modes
(mean number of partners for ACASI=2.6 versus SAQ=1.7; ICVI=1.5; Audio‐SAQ=1.8; p=0.047).
This trend in reporting of sensitive behaviours was not found for the question on abortion.
5.4.1 Difference between response to questions answered in Round 1 and Round 2
A total of 395 of the 641 respondents randomly allocated to complete the questionnaire twice
(Rounds 1 and 2) did so. There were no differences in gender, age, marital status, educational
level, employment status or reporting of sexual activity between respondents who completed
Round 2 and those respondents who were allocated to Round 2 but failed to return to the
survey site a week later. Respondents were more likely to have attended Round 2 if they were
from a control community (71.8% were from control communities c.v. 51.1% from intervention
communities; p<0.001).
Table 5‐4 (a and b) presents the number of conversions by direction of change between the
rounds by questionnaire method at each round. Of the 331 respondents who reported that
they had never had sex in Round 1, 21 (6.3%) changed their answer and reported that they had
had sex in Round 2 (positive conversion). This happened more commonly among those using
ACASI as their Round 2 method (16.1% positively converted their answer vs. 1.2% of those who
used SAQ and ICVI and 6.6% of those who used Audio‐SAQ). Of the 52 respondents who
reported ‘yes’ to having sex in Round 1, 12 (23.1%) changed their answer to a negative
response in Round 2 (negative conversion). This happened more commonly in those who used
SAQ or Audio‐SAQ as their Round 2 method (46.7% and 33.3% vs. 8.3% of those completing
ICVI in Round 2 and 0% of those using ACASI).
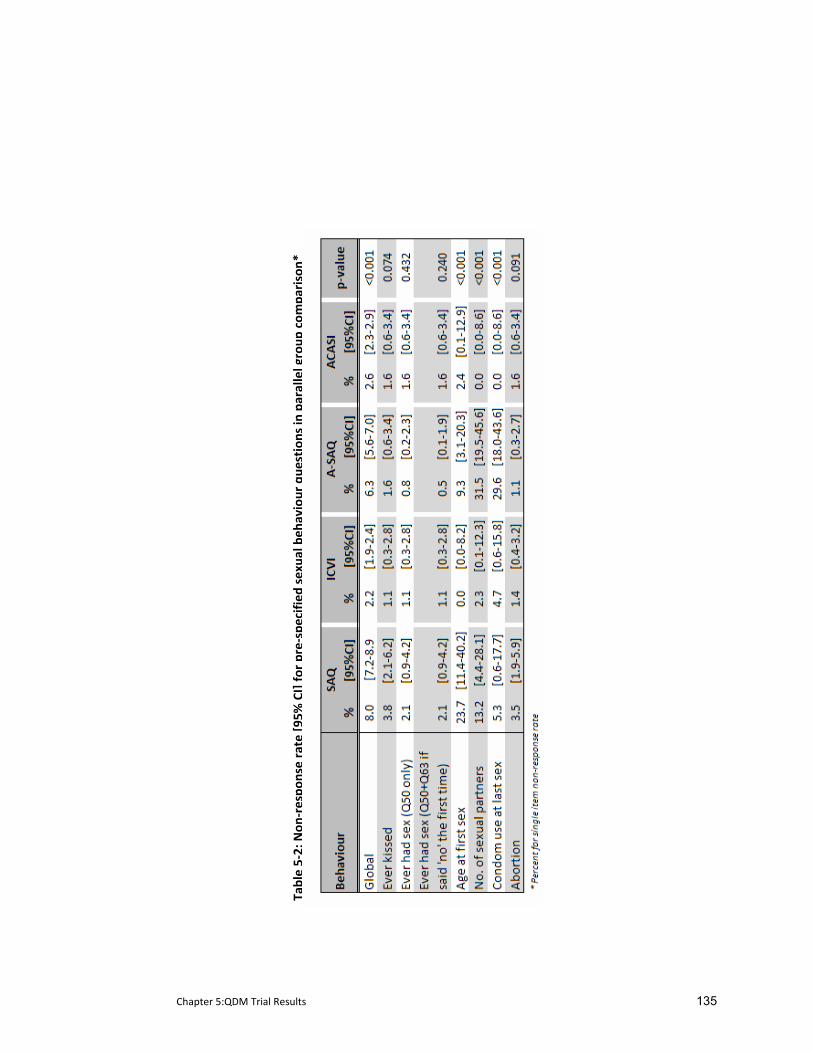
Chapter 5:QDM Trial Results 135
Tab
le 5‐2: N
on‐respo
nse rate [9
5% CI] fo
r pre‐specified
sexua
l beh
aviour que
stions in
parallel group
com
parison*
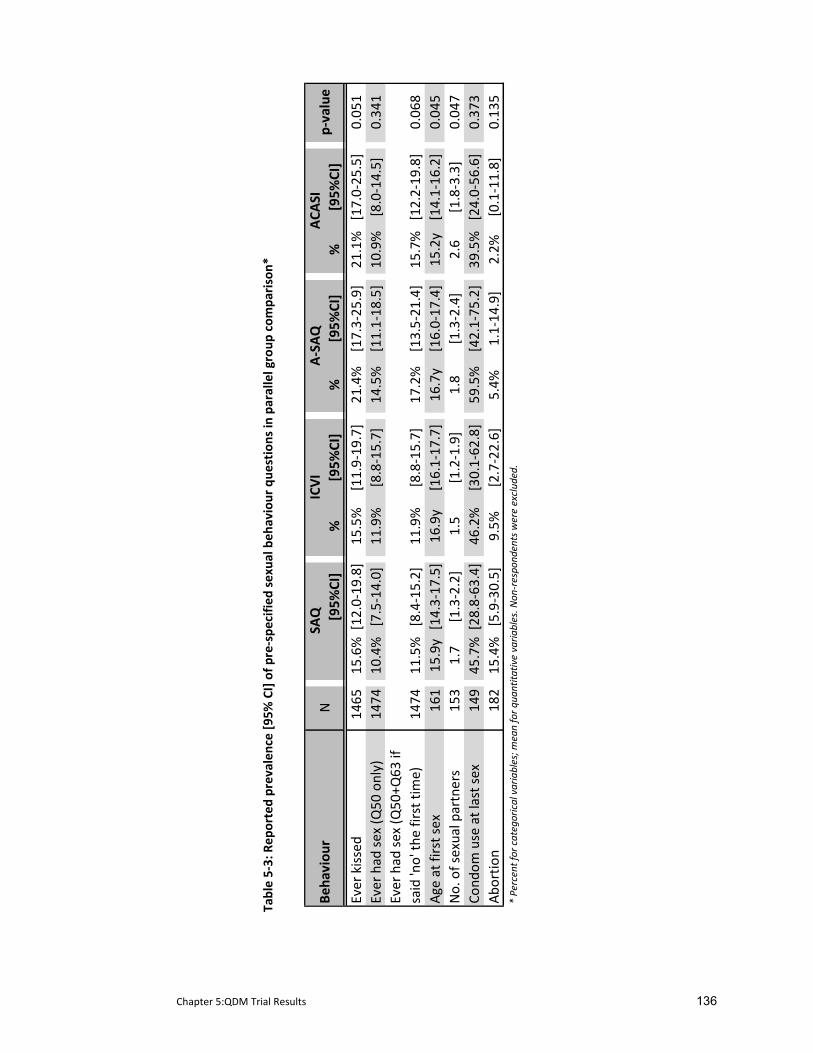
Chapter 5:QDM Trial Results 136
Tab
le 5‐3: R
eported prevalen
ce [9
5% CI] of p
re‐spe
cifie
d sexual beh
aviour que
stions in
parallel group
com
parison*
[95%
CI]
%[95%
CI]
%[95%
CI]
%[95%
CI]
Ever kissed
1465
15.6%
[12.0‐19
.8]
15.5%
[11.9‐19
.7]
21.4%
[17.3‐25
.9]
21.1%
[17.0‐25
.5]
0.05
1Ever had
sex (Q
50 only)
1474
10.4%
[7.5‐14.0]
11.9%
[8.8‐15.7]
14.5%
[11.1‐18
.5]
10.9%
[8.0‐14.5]
0.34
1Ever had
sex (Q
50+Q
63 if
said 'no' th
e first time)
1474
11.5%
[8.4‐15.2]
11.9%
[8.8‐15.7]
17.2%
[13.5‐21
.4]
15.7%
[12.2‐19
.8]
0.06
8Ag
e at first sex
161
15.9y
[14.3‐17
.5]
16.9y
[16.1‐17
.7]
16.7y
[16.0‐17
.4]
15.2y
[14.1‐16
.2]
0.04
5No. of sexual partners
153
1.7
[1.3‐2.2]
1.5
[1.2‐1.9]
1.8
[1.3‐2.4]
2.6
[1.8‐3.3]
0.04
7Co
ndom
use at last sex
149
45.7%
[28.8‐63
.4]
46.2%
[30.1‐62
.8]
59.5%
[42.1‐75
.2]
39.5%
[24.0‐56
.6]
0.37
3Ab
ortio
n18
215
.4%
[5.9‐30.5]
9.5%
[2.7‐22.6]
5.4%
1.1‐14
.9]
2.2%
[0.1‐11.8]
0.13
5* Percent for categorical variables; m
ean for q
uantita
tive varia
bles. N
on‐respond
ents were exclud
ed.
Np‐value
Beha
viou
rSA
QICVI
A‐SAQ
ACA
SI
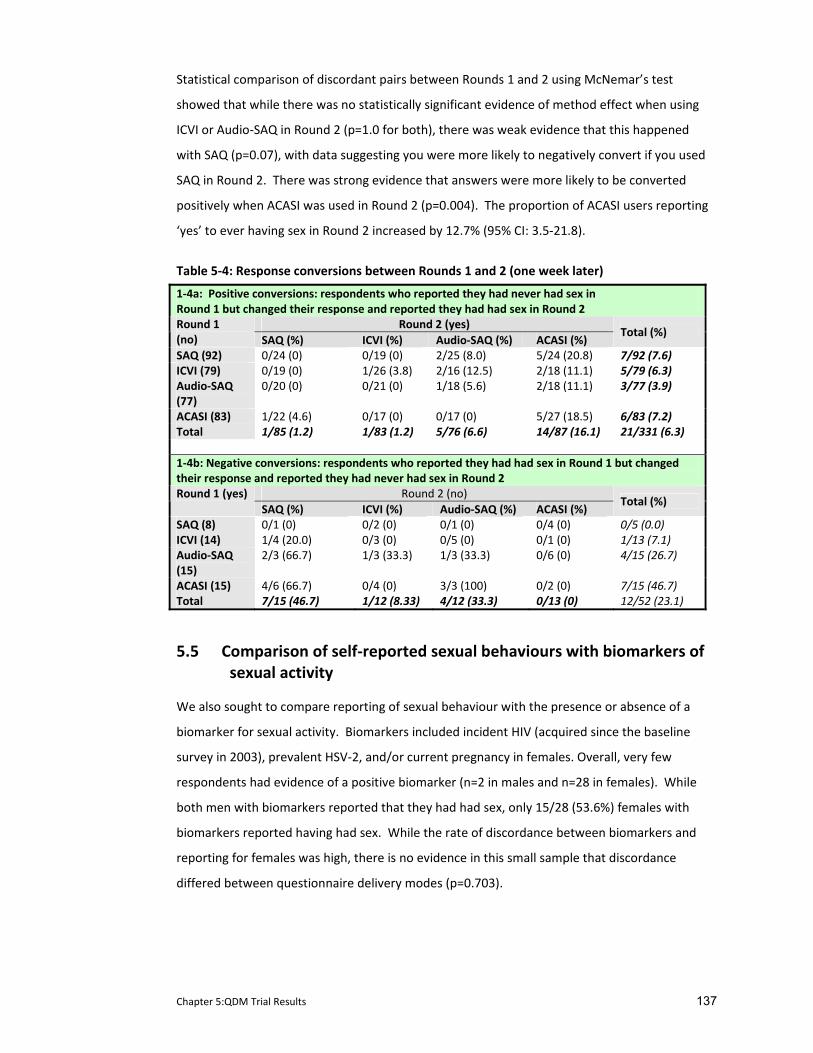
Chapter 5:QDM Trial Results 137
Statistical comparison of discordant pairs between Rounds 1 and 2 using McNemar’s test
showed that while there was no statistically significant evidence of method effect when using
ICVI or Audio‐SAQ in Round 2 (p=1.0 for both), there was weak evidence that this happened
with SAQ (p=0.07), with data suggesting you were more likely to negatively convert if you used
SAQ in Round 2. There was strong evidence that answers were more likely to be converted
positively when ACASI was used in Round 2 (p=0.004). The proportion of ACASI users reporting
‘yes’ to ever having sex in Round 2 increased by 12.7% (95% CI: 3.5‐21.8).
Table 5‐4: Response conversions between Rounds 1 and 2 (one week later)
1‐4a: Positive conversions: respondents who reported they had never had sex in Round 1 but changed their response and reported they had had sex in Round 2
Round 2 (yes) Round 1 (no) SAQ (%) ICVI (%) Audio‐SAQ (%) ACASI (%)
Total (%)
SAQ (92) 0/24 (0) 0/19 (0) 2/25 (8.0) 5/24 (20.8) 7/92 (7.6) ICVI (79) 0/19 (0) 1/26 (3.8) 2/16 (12.5) 2/18 (11.1) 5/79 (6.3) Audio‐SAQ (77)
0/20 (0) 0/21 (0) 1/18 (5.6) 2/18 (11.1) 3/77 (3.9)
ACASI (83) 1/22 (4.6) 0/17 (0) 0/17 (0) 5/27 (18.5) 6/83 (7.2) Total 1/85 (1.2) 1/83 (1.2) 5/76 (6.6) 14/87 (16.1) 21/331 (6.3) 1‐4b: Negative conversions: respondents who reported they had had sex in Round 1 but changed their response and reported they had never had sex in Round 2
Round 2 (no) Round 1 (yes) SAQ (%) ICVI (%) Audio‐SAQ (%) ACASI (%)
Total (%)
SAQ (8) 0/1 (0) 0/2 (0) 0/1 (0) 0/4 (0) 0/5 (0.0) ICVI (14) 1/4 (20.0) 0/3 (0) 0/5 (0) 0/1 (0) 1/13 (7.1) Audio‐SAQ (15)
2/3 (66.7) 1/3 (33.3) 1/3 (33.3) 0/6 (0) 4/15 (26.7)
ACASI (15) 4/6 (66.7) 0/4 (0) 3/3 (100) 0/2 (0) 7/15 (46.7) Total 7/15 (46.7) 1/12 (8.33) 4/12 (33.3) 0/13 (0) 12/52 (23.1)
5.5 Comparison of self‐reported sexual behaviours with biomarkers of sexual activity
We also sought to compare reporting of sexual behaviour with the presence or absence of a
biomarker for sexual activity. Biomarkers included incident HIV (acquired since the baseline
survey in 2003), prevalent HSV‐2, and/or current pregnancy in females. Overall, very few
respondents had evidence of a positive biomarker (n=2 in males and n=28 in females). While
both men with biomarkers reported that they had had sex, only 15/28 (53.6%) females with
biomarkers reported having had sex. While the rate of discordance between biomarkers and
reporting for females was high, there is no evidence in this small sample that discordance
differed between questionnaire delivery modes (p=0.703).
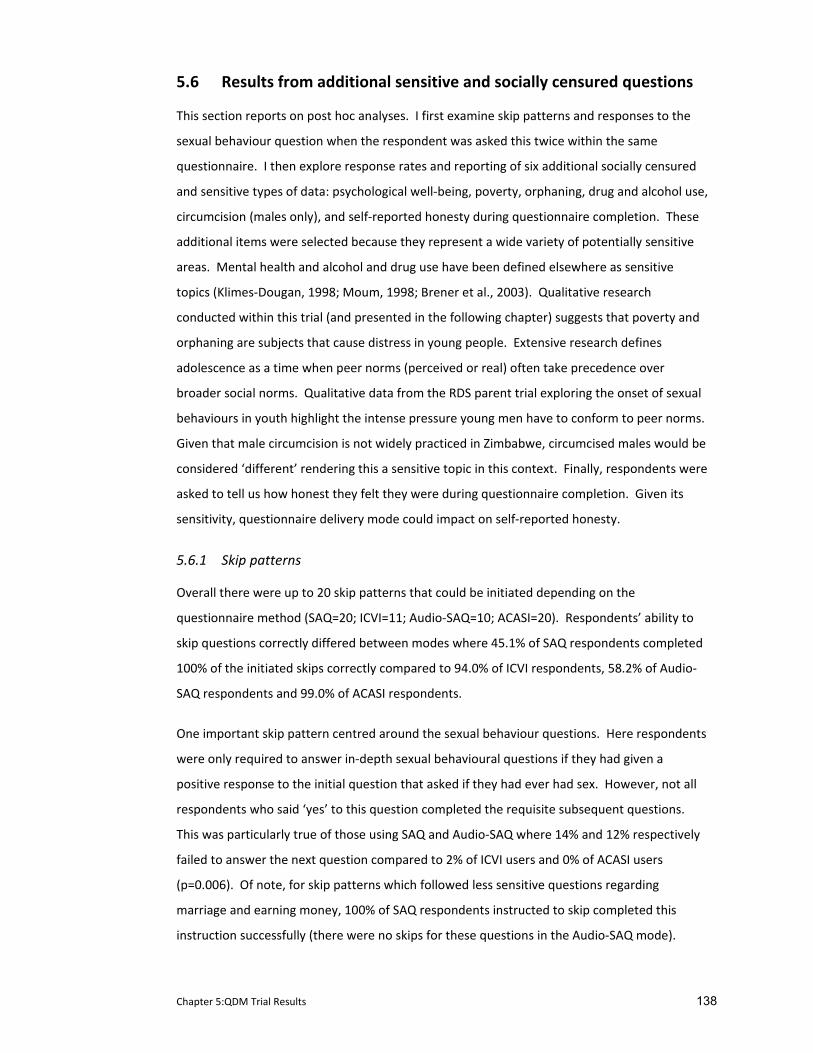
Chapter 5:QDM Trial Results 138
5.6 Results from additional sensitive and socially censured questions
This section reports on post hoc analyses. I first examine skip patterns and responses to the
sexual behaviour question when the respondent was asked this twice within the same
questionnaire. I then explore response rates and reporting of six additional socially censured
and sensitive types of data: psychological well‐being, poverty, orphaning, drug and alcohol use,
circumcision (males only), and self‐reported honesty during questionnaire completion. These
additional items were selected because they represent a wide variety of potentially sensitive
areas. Mental health and alcohol and drug use have been defined elsewhere as sensitive
topics (Klimes‐Dougan, 1998; Moum, 1998; Brener et al., 2003). Qualitative research
conducted within this trial (and presented in the following chapter) suggests that poverty and
orphaning are subjects that cause distress in young people. Extensive research defines
adolescence as a time when peer norms (perceived or real) often take precedence over
broader social norms. Qualitative data from the RDS parent trial exploring the onset of sexual
behaviours in youth highlight the intense pressure young men have to conform to peer norms.
Given that male circumcision is not widely practiced in Zimbabwe, circumcised males would be
considered ‘different’ rendering this a sensitive topic in this context. Finally, respondents were
asked to tell us how honest they felt they were during questionnaire completion. Given its
sensitivity, questionnaire delivery mode could impact on self‐reported honesty.
5.6.1 Skip patterns
Overall there were up to 20 skip patterns that could be initiated depending on the
questionnaire method (SAQ=20; ICVI=11; Audio‐SAQ=10; ACASI=20). Respondents’ ability to
skip questions correctly differed between modes where 45.1% of SAQ respondents completed
100% of the initiated skips correctly compared to 94.0% of ICVI respondents, 58.2% of Audio‐
SAQ respondents and 99.0% of ACASI respondents.
One important skip pattern centred around the sexual behaviour questions. Here respondents
were only required to answer in‐depth sexual behavioural questions if they had given a
positive response to the initial question that asked if they had ever had sex. However, not all
respondents who said ‘yes’ to this question completed the requisite subsequent questions.
This was particularly true of those using SAQ and Audio‐SAQ where 14% and 12% respectively
failed to answer the next question compared to 2% of ICVI users and 0% of ACASI users
(p=0.006). Of note, for skip patterns which followed less sensitive questions regarding
marriage and earning money, 100% of SAQ respondents instructed to skip completed this
instruction successfully (there were no skips for these questions in the Audio‐SAQ mode).
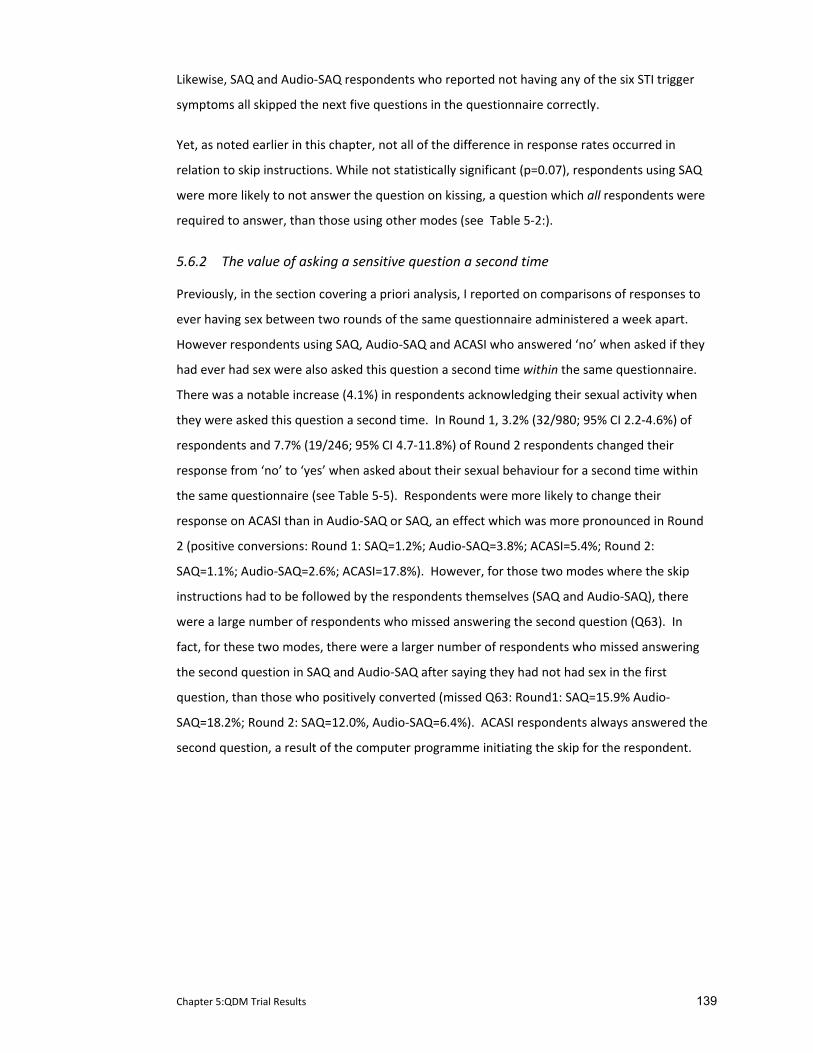
Chapter 5:QDM Trial Results 139
Likewise, SAQ and Audio‐SAQ respondents who reported not having any of the six STI trigger
symptoms all skipped the next five questions in the questionnaire correctly.
Yet, as noted earlier in this chapter, not all of the difference in response rates occurred in
relation to skip instructions. While not statistically significant (p=0.07), respondents using SAQ
were more likely to not answer the question on kissing, a question which all respondents were
required to answer, than those using other modes (see Table 5‐2:).
5.6.2 The value of asking a sensitive question a second time
Previously, in the section covering a priori analysis, I reported on comparisons of responses to
ever having sex between two rounds of the same questionnaire administered a week apart.
However respondents using SAQ, Audio‐SAQ and ACASI who answered ‘no’ when asked if they
had ever had sex were also asked this question a second time within the same questionnaire.
There was a notable increase (4.1%) in respondents acknowledging their sexual activity when
they were asked this question a second time. In Round 1, 3.2% (32/980; 95% CI 2.2‐4.6%) of
respondents and 7.7% (19/246; 95% CI 4.7‐11.8%) of Round 2 respondents changed their
response from ‘no’ to ‘yes’ when asked about their sexual behaviour for a second time within
the same questionnaire (see Table 5‐5). Respondents were more likely to change their
response on ACASI than in Audio‐SAQ or SAQ, an effect which was more pronounced in Round
2 (positive conversions: Round 1: SAQ=1.2%; Audio‐SAQ=3.8%; ACASI=5.4%; Round 2:
SAQ=1.1%; Audio‐SAQ=2.6%; ACASI=17.8%). However, for those two modes where the skip
instructions had to be followed by the respondents themselves (SAQ and Audio‐SAQ), there
were a large number of respondents who missed answering the second question (Q63). In
fact, for these two modes, there were a larger number of respondents who missed answering
the second question in SAQ and Audio‐SAQ after saying they had not had sex in the first
question, than those who positively converted (missed Q63: Round1: SAQ=15.9% Audio‐
SAQ=18.2%; Round 2: SAQ=12.0%, Audio‐SAQ=6.4%). ACASI respondents always answered the
second question, a result of the computer programme initiating the skip for the respondent.
Chapter 5:QDM Trial Results 140
Table 5‐5: Proportion of respondents who positively converted their answer to ‘ever had sex’ within the same questionnaire (‘no’ in q50 and ‘yes’ in q63)*
SAQ Audio‐SAQ ACASI Total Round 1
M F total M F total M F total M F ‘no’ in q50 175 152 327 182 137 319 178 156 334 535 445 ‘yes’ in q63 2 2 4 7 3 10 10 8 18 19 13 missed q63 28 24 52 44 14 58 0 0 0 72 38 % positive conversions
1.1% 1.3% 1.2% 5.1% 2.4% 3.8% 5.6% 5.1% 5.4% 3.6% 2.9%
SAQ Audio‐SAQ ACASI Total Round 2 M F total M F total M F total M F
‘no’ in q50 61 31 92 44 34 78 42 48 90 147 99 ‘yes’ in q63 1 0 1 1 1 2 14 2 16 16 3 missed q63 9 2 11 1 4 5 0 0 0 24 8 % positive conversions
1.6% 0.0% 1.1% 2.2% 2.9% 2.6% 33.3% 4.2% 17.8% 10.9% 3.0%
* % positive conversions are those who said ‘no’ in Q50 but ‘yes’ when asked a second time in Q63.
5.6.3 Additional sensitive questions
Comparisons described in this section are not identical to those described in the a priori
analysis above. Whereas all of the sexual behavioural questions were answered using the
ballot sheet, some questions in this section were answered using the standard interviewer
administered format (IAQ), with the respondent answering the interviewer directly. The table
below details the ballot status for each question analysed in this section.
Table 5‐6: ICVI ballot status for sensitive questions
Sensitive topic ICVI Ballot status
Psychological well‐being no ballot (IAQ)
Poverty no ballot (IAQ)
Orphaning no ballot (IAQ)
Drug & alcohol use no ballot (IAQ)
Circumcision ballot (ICVI)
Honesty in questionnaire completion
ballot (ICVI)
In the analysis of these seven sensitive issues, twelve respondents were removed from the
analysis in Round 1 and one respondent from Round 2 due to data capture errors. All data
were analysed using Stata 10.
5.6.4 Psychological well‐being: the Shona Symptom Questionnaire
The Shona Symptom Questionnaire (SSQ) is a 14 item locally validated indigenous scale that
assesses risk of affective disorders such as anxiety and depression. Respondents scoring 8 or
Chapter 5:QDM Trial Results 141
more are considered at risk while those who scored greater than 11 are considered severely at
risk. The internal consistency of the SSQ scale was assessed by calculating the intra‐class
correlation coefficient (Cronbach’s alpha) to ensure that the SSQ psychometric properties with
this population‐based sample were what we would expect from its use in other settings (high
internal consistency is defined as alpha >0.7). The Cronbach’s alpha was maximal when all 14
items from the scale were included (α=0.83).
Respondents with missing values for any of the SSQ items were excluded from this analysis.
Chi‐square test was used to assess the association between mode of administration and
common affective disorders and affirmative response to each of the 14 SSQ statements. In the
event of expected frequency smaller than 5, an extension of the Fisher’s exact test was used
instead (Mehta & Patel, 1983; Mehta et al., 1983). Given 16 tests of hypothesis, a nominal P‐
value <0.05/16=0.0031 was considered statistically significant according to the Bonferroni
adjustment. Risk ratios (RR) were estimated for being at risk of common affective disorders
using SAQ as the reference group.
Response rates for completion of the SSQ mental health scale were high; 93.9% of survey
respondents completed the entire scale (Langhaug, Cheung, Pascoe, Hayes, & Cowan, 2009).
Overall 91 (6.1%) respondents failed to complete one or more SSQ items; this varied by
method (SAQ=41 (11.1%); Audio‐SAQ=45 (12.0%); IAQ=5 (1.4%); ACASI=0 (0.0%); p=0.002).
As shown in Table 5‐7,the prevalence of being at risk for common affective disorders as
estimated by SAQ, Audio‐SAQ, IAQ, and ACASI were 52.3%, 48.6%, 41.5%, and 63.6%
respectively (p<0.001). There was no significant difference in prevalence between Audio‐SAQ
and SAQ (RR=0.93; 95% CI: 0.80 to 1.08), whereas IAQ was associated with a lower prevalence
(RR=0.79; 95% CI: 0.68 to 0.93) and ACASI with a higher prevalence (RR=1.21; 95% CI: 1.07 to
1.38).
Estimates of prevalence of probable severe cases (score>11) were 19.6%, 23.6%, 14.2%, and
36.8% for SAQ, Audio‐SAQ, IAQ, and ACASI respectively (p<0.001). Again there was no
significant difference between Audio‐SAQ and SAQ (RR=1.20; 95% CI: 0.90 to 1.61), and as
before IAQ gave a lower prevalence (RR=0.73; 95% CI: 0.52 to 1.02) and ACASI a significantly
higher reported prevalence than SAQ (RR=1.88; 95% CI: 1.45 to 2.43).
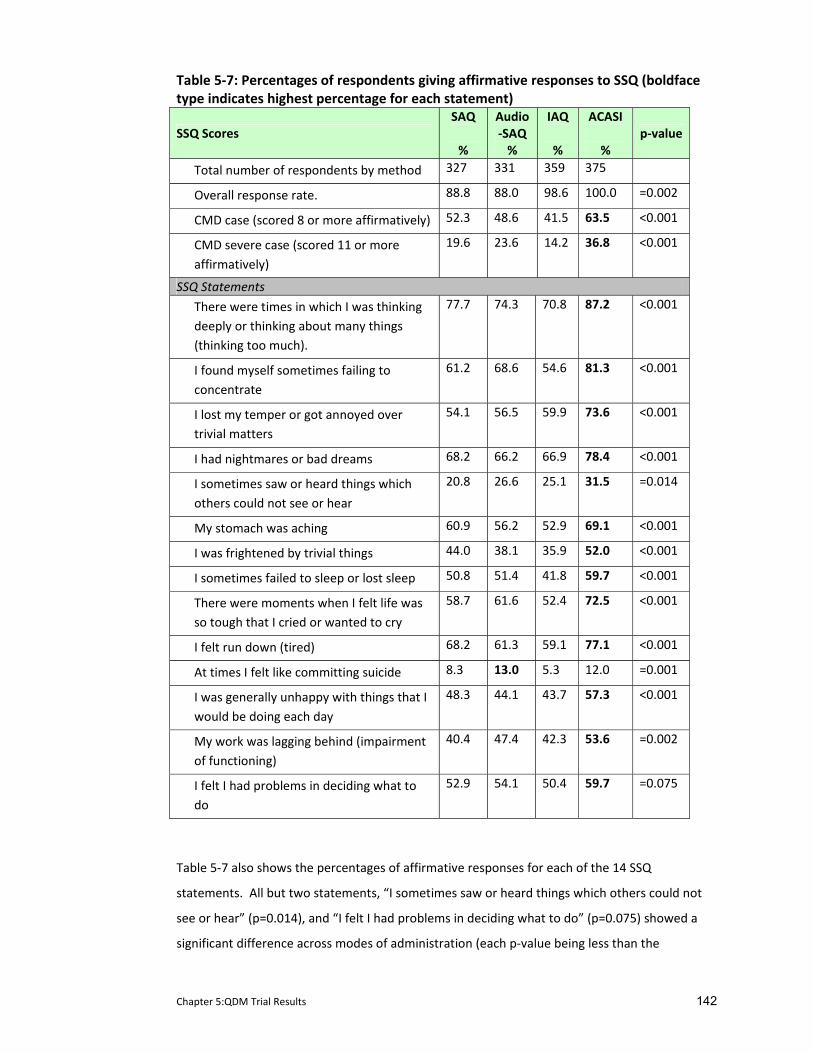
Chapter 5:QDM Trial Results 142
Table 5‐7: Percentages of respondents giving affirmative responses to SSQ (boldface type indicates highest percentage for each statement)
SSQ Scores SAQ %
Audio‐SAQ %
IAQ %
ACASI %
p‐value
Total number of respondents by method 327 331 359 375
Overall response rate. 88.8 88.0 98.6 100.0 =0.002
CMD case (scored 8 or more affirmatively) 52.3 48.6 41.5 63.5 <0.001
CMD severe case (scored 11 or more affirmatively)
19.6 23.6 14.2 36.8 <0.001
SSQ Statements
There were times in which I was thinking deeply or thinking about many things (thinking too much).
77.7 74.3 70.8 87.2 <0.001
I found myself sometimes failing to concentrate
61.2 68.6 54.6 81.3 <0.001
I lost my temper or got annoyed over trivial matters
54.1 56.5 59.9 73.6 <0.001
I had nightmares or bad dreams 68.2 66.2 66.9 78.4 <0.001
I sometimes saw or heard things which others could not see or hear
20.8 26.6 25.1 31.5 =0.014
My stomach was aching 60.9 56.2 52.9 69.1 <0.001
I was frightened by trivial things 44.0 38.1 35.9 52.0 <0.001
I sometimes failed to sleep or lost sleep 50.8 51.4 41.8 59.7 <0.001
There were moments when I felt life was so tough that I cried or wanted to cry
58.7 61.6 52.4 72.5 <0.001
I felt run down (tired) 68.2 61.3 59.1 77.1 <0.001
At times I felt like committing suicide 8.3 13.0 5.3 12.0 =0.001
I was generally unhappy with things that I would be doing each day
48.3 44.1 43.7 57.3 <0.001
My work was lagging behind (impairment of functioning)
40.4 47.4 42.3 53.6 =0.002
I felt I had problems in deciding what to do
52.9 54.1 50.4 59.7 =0.075
Table 5‐7 also shows the percentages of affirmative responses for each of the 14 SSQ
statements. All but two statements, “I sometimes saw or heard things which others could not
see or hear” (p=0.014), and “I felt I had problems in deciding what to do” (p=0.075) showed a
significant difference across modes of administration (each p‐value being less than the
Chapter 5:QDM Trial Results 143
Bonferroni‐adjusted P‐value cut‐off of 0.003). Out of the 12 statements that were significantly
associated with questionnaire delivery mode, nine showed lowest prevalence when assessed
by IAQ and 11 showed highest prevalence when assessed by ACASI.
5.6.5 Poverty
Response rates for completion of the poverty questions were high with less than 2% non‐
response rate. Overall levels of reported poverty were high with over 55% unable to afford
cooking oil, 21% unable to afford soap to wash their clothes, 41% who could not afford clinic
fees if they were sick, and 55% reporting school absenteeism due to lack of money for fees.
There were 11% who did not own any everyday items (i.e. no tables, chairs or sufficient
blankets) and over 18% reported going a day without food in the past week as there was no
food in the household.
Error! Reference source not found. presents the proportion of respondents reporting each
item by questionnaire delivery mode and adjusted odds ratios (AOR) adjusted for age and
gender. For the majority of items respondents who answered the questionnaire using self‐
administered modes (SAQ, Audio‐SAQ and ACASI) reported higher levels of poverty than those
using the interview‐administered mode (IAQ).
Differences in reporting of essential items were statistically significant (p<0.05) for all but three
items (the ability to afford paraffin (p=0.87); the ability to afford meat or fish four times/week
(p=0.20); the ability to afford to be able to drink tea at least once/day (p=0.46)). There was
only one item where the proportion of respondents reported higher levels of poverty using
IAQ (school absenteeism due to lack of fees) but the difference between the questionnaire
delivery modes for this item was not statistically significant (p=0.94).
Those using self‐administered modes to complete the questionnaire were between two and
four times more likely to report not owning blankets, tables and chairs (SAQ AOR 4.2; 95% CI
2.28‐7.75; Audio‐SAQ AOR 2.46; 95% CI 1.29‐4.68; ACASI AOR 3.51; 95% CI 1.89‐6.53), and
between two and three times more likely to report adults having to skip meals (SAQ AOR 3.10;
95% CI 2.05‐4.70; Audio‐SAQ AOR 2.56; 95% CI 1.68‐3.90; ACASI AOR 2.48; 95% CI 1.63‐3.78)
and going a day without food in the last week (SAQ AOR 3.10, 95% CI 2.05‐4.70; Audio‐SAQ
AOR 2.56; 95% CI 1.68‐3.90; ACASI AOR 2.48; 95% CI 1.63‐3.78), and three to five times more
likely to report living in the poorest type of house built of poles and mud (SAQ AOR 5.36; 95%
CI 1.54‐18.63; Audio‐SAQ AOR 3.65; 95% CI 1.00‐13.22; ACASI AOR 4.41; 95% CI 1.24‐15.69)
than those using the interview‐administered mode.
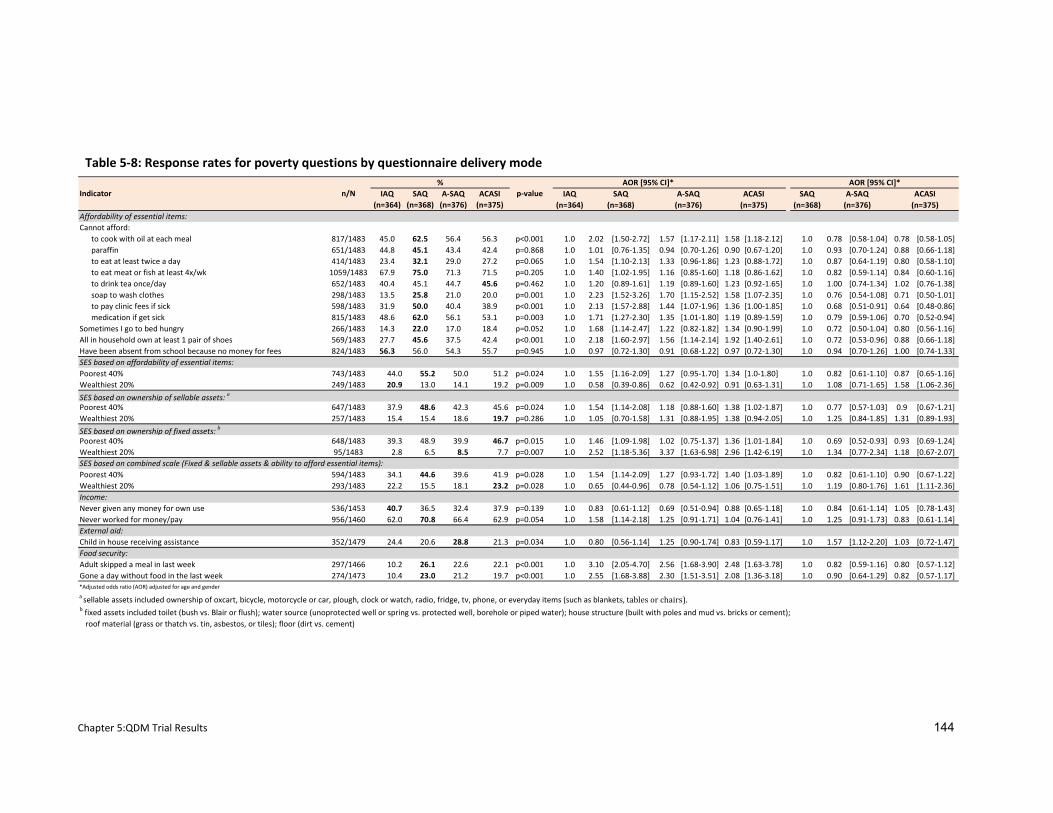
Chapter 5:QDM Trial Results 144
IAQ SAQ A‐SAQ ACASI IAQ SAQ(n=364) (n=368) (n=376) (n=375) (n=364) (n=368)
Affordability of essential items:Cannot afford:
to cook with oil at each meal 817/1483 45.0 62.5 56.4 56.3 p<0.001 1.0 2.02 [1.50‐2.72] 1.57 [1.17‐2.11] 1.58 [1.18‐2.12] 1.0 0.78 [0.58‐1.04] 0.78 [0.58‐1.05]paraffin 651/1483 44.8 45.1 43.4 42.4 p=0.868 1.0 1.01 [0.76‐1.35] 0.94 [0.70‐1.26] 0.90 [0.67‐1.20] 1.0 0.93 [0.70‐1.24] 0.88 [0.66‐1.18]to eat at least twice a day 414/1483 23.4 32.1 29.0 27.2 p=0.065 1.0 1.54 [1.10‐2.13] 1.33 [0.96‐1.86] 1.23 [0.88‐1.72] 1.0 0.87 [0.64‐1.19] 0.80 [0.58‐1.10]to eat meat or fish at least 4x/wk 1059/1483 67.9 75.0 71.3 71.5 p=0.205 1.0 1.40 [1.02‐1.95] 1.16 [0.85‐1.60] 1.18 [0.86‐1.62] 1.0 0.82 [0.59‐1.14] 0.84 [0.60‐1.16]to drink tea once/day 652/1483 40.4 45.1 44.7 45.6 p=0.462 1.0 1.20 [0.89‐1.61] 1.19 [0.89‐1.60] 1.23 [0.92‐1.65] 1.0 1.00 [0.74‐1.34] 1.02 [0.76‐1.38]soap to wash clothes 298/1483 13.5 25.8 21.0 20.0 p=0.001 1.0 2.23 [1.52‐3.26] 1.70 [1.15‐2.52] 1.58 [1.07‐2.35] 1.0 0.76 [0.54‐1.08] 0.71 [0.50‐1.01]to pay clinic fees if sick 598/1483 31.9 50.0 40.4 38.9 p<0.001 1.0 2.13 [1.57‐2.88] 1.44 [1.07‐1.96] 1.36 [1.00‐1.85] 1.0 0.68 [0.51‐0.91] 0.64 [0.48‐0.86]medication if get sick 815/1483 48.6 62.0 56.1 53.1 p=0.003 1.0 1.71 [1.27‐2.30] 1.35 [1.01‐1.80] 1.19 [0.89‐1.59] 1.0 0.79 [0.59‐1.06] 0.70 [0.52‐0.94]
Sometimes I go to bed hungry 266/1483 14.3 22.0 17.0 18.4 p=0.052 1.0 1.68 [1.14‐2.47] 1.22 [0.82‐1.82] 1.34 [0.90‐1.99] 1.0 0.72 [0.50‐1.04] 0.80 [0.56‐1.16]All in household own at least 1 pair of shoes 569/1483 27.7 45.6 37.5 42.4 p<0.001 1.0 2.18 [1.60‐2.97] 1.56 [1.14‐2.14] 1.92 [1.40‐2.61] 1.0 0.72 [0.53‐0.96] 0.88 [0.66‐1.18]Have been absent from school because no money for fees 824/1483 56.3 56.0 54.3 55.7 p=0.945 1.0 0.97 [0.72‐1.30] 0.91 [0.68‐1.22] 0.97 [0.72‐1.30] 1.0 0.94 [0.70‐1.26] 1.00 [0.74‐1.33]SES based on affordability of essential items:Poorest 40% 743/1483 44.0 55.2 50.0 51.2 p=0.024 1.0 1.55 [1.16‐2.09] 1.27 [0.95‐1.70] 1.34 [1.0‐1.80] 1.0 0.82 [0.61‐1.10] 0.87 [0.65‐1.16]Wealthiest 20% 249/1483 20.9 13.0 14.1 19.2 p=0.009 1.0 0.58 [0.39‐0.86] 0.62 [0.42‐0.92] 0.91 [0.63‐1.31] 1.0 1.08 [0.71‐1.65] 1.58 [1.06‐2.36]
SES based on ownership of sellable assets: a
Poorest 40% 647/1483 37.9 48.6 42.3 45.6 p=0.024 1.0 1.54 [1.14‐2.08] 1.18 [0.88‐1.60] 1.38 [1.02‐1.87] 1.0 0.77 [0.57‐1.03] 0.9 [0.67‐1.21]Wealthiest 20% 257/1483 15.4 15.4 18.6 19.7 p=0.286 1.0 1.05 [0.70‐1.58] 1.31 [0.88‐1.95] 1.38 [0.94‐2.05] 1.0 1.25 [0.84‐1.85] 1.31 [0.89‐1.93]
SES based on ownership of fixed assets: b
Poorest 40% 648/1483 39.3 48.9 39.9 46.7 p=0.015 1.0 1.46 [1.09‐1.98] 1.02 [0.75‐1.37] 1.36 [1.01‐1.84] 1.0 0.69 [0.52‐0.93] 0.93 [0.69‐1.24]Wealthiest 20% 95/1483 2.8 6.5 8.5 7.7 p=0.007 1.0 2.52 [1.18‐5.36] 3.37 [1.63‐6.98] 2.96 [1.42‐6.19] 1.0 1.34 [0.77‐2.34] 1.18 [0.67‐2.07]SES based on combined scale (Fixed & sellable assets & ability to afford essential items):Poorest 40% 594/1483 34.1 44.6 39.6 41.9 p=0.028 1.0 1.54 [1.14‐2.09] 1.27 [0.93‐1.72] 1.40 [1.03‐1.89] 1.0 0.82 [0.61‐1.10] 0.90 [0.67‐1.22]Wealthiest 20% 293/1483 22.2 15.5 18.1 23.2 p=0.028 1.0 0.65 [0.44‐0.96] 0.78 [0.54‐1.12] 1.06 [0.75‐1.51] 1.0 1.19 [0.80‐1.76] 1.61 [1.11‐2.36]Income:Never given any money for own use 536/1453 40.7 36.5 32.4 37.9 p=0.139 1.0 0.83 [0.61‐1.12] 0.69 [0.51‐0.94] 0.88 [0.65‐1.18] 1.0 0.84 [0.61‐1.14] 1.05 [0.78‐1.43]Never worked for money/pay 956/1460 62.0 70.8 66.4 62.9 p=0.054 1.0 1.58 [1.14‐2.18] 1.25 [0.91‐1.71] 1.04 [0.76‐1.41] 1.0 1.25 [0.91‐1.73] 0.83 [0.61‐1.14]External aid:Child in house receiving assistance 352/1479 24.4 20.6 28.8 21.3 p=0.034 1.0 0.80 [0.56‐1.14] 1.25 [0.90‐1.74] 0.83 [0.59‐1.17] 1.0 1.57 [1.12‐2.20] 1.03 [0.72‐1.47]Food security:Adult skipped a meal in last week 297/1466 10.2 26.1 22.6 22.1 p<0.001 1.0 3.10 [2.05‐4.70] 2.56 [1.68‐3.90] 2.48 [1.63‐3.78] 1.0 0.82 [0.59‐1.16] 0.80 [0.57‐1.12]Gone a day without food in the last week 274/1473 10.4 23.0 21.2 19.7 p<0.001 1.0 2.55 [1.68‐3.88] 2.30 [1.51‐3.51] 2.08 [1.36‐3.18] 1.0 0.90 [0.64‐1.29] 0.82 [0.57‐1.17]*Adjusted odds ratio (AOR) adjusted for age and gender
a sellable assets included ownership of oxcart, bicycle, motorcycle or car, plough, clock or watch, radio, fridge, tv, phone, or everyday items (such as blankets, tables or chairs).b fixed assets included toilet (bush vs. Blair or flush); water source (unoprotected well or spring vs. protected well, borehole or piped water); house structure (built with poles and mud vs. bricks or cement); roof material (grass or thatch vs. tin, asbestos, or tiles); floor (dirt vs. cement)
(n=376) (n=375)Indicator n/N
%p‐value
AOR [95% CI]*
(n=368) (n=376) (n=375)
AOR [95% CI]*SAQ A‐SAQ ACASI A‐SAQ ACASI
Table 5‐8: Response rates for poverty questions by questionnaire delivery mode
Chapter 5:QDM Trial Results 145
However when the three self administered modes were compared against each other, no one
mode appeared to consistently increase reporting above the others. Audio‐SAQ or ACASI users
were three to four times more likely to report living in a house built of poles and mud (Audio‐
SAQ AOR 3.69; 95% CI 1.01‐13.4; ACASI AOR 4.53; 95% CI 1.27‐16.15) and over one and a half
times more likely to report living in houses with dirt floors (Audio‐SAQ AOR 1.89; 95% CI 1.22‐
2.91; ACASI AOR 1.62; 95% CI 1.05‐2.52) than those using SAQ. When Audio‐SAQ and SAQ
users were compared, respondents using Audio‐SAQ were less likely to report being poor
(0.69; 95% CI 0.52‐0.93), but more likely to report having a child needing food assistance than
SAQ users (1.57; 95% CI 1.12‐2.20).
5.6.6 Orphaning
Orphans were examined as an overarching category and specifically as maternal, paternal or
dual orphaning. When specific orphaning was compared, it was against non‐orphans (and not
against other categories of orphans).
Non‐item response rates around orphaning were low. However, all of the 24 (1.6%)
respondents who failed to answer the two questions establishing paternal and maternal
orphanhood (and by default dual orphaning) used either SAQ (n=11) or Audio‐SAQ (n=13,) the
two methods where the respondent could passively miss a question. There were also a small
number (n=55; 3.7%) of respondents who said that they did not know if their parents were
alive or reported that they did not know their parents at all.
Table 5‐9 presents data on reported orphan status by questionnaire delivery mode and
adjusted odds ratios (AOR) adjusted for gender. Overall, 38.0% of respondents reported being
an orphan (maternal, paternal, or dual). There was a significant difference in prevalence of
reporting being orphaned between the questionnaire delivery modes. However, unlike in
previous analyses, respondents interviewed by a surveyor were more likely to report being
orphaned than the other three self‐administered modes (SAQ=30.8%; IAQ=45.6%; Audio‐
SAQ=38.8%; ACASI=39.2%, p=<0.001).
When all three self‐administered questionnaire delivery modes are compared separately
against the interviewer‐administered one, only respondents using SAQ were less likely to
report orphaning. However when all three modes were combined and compared against the
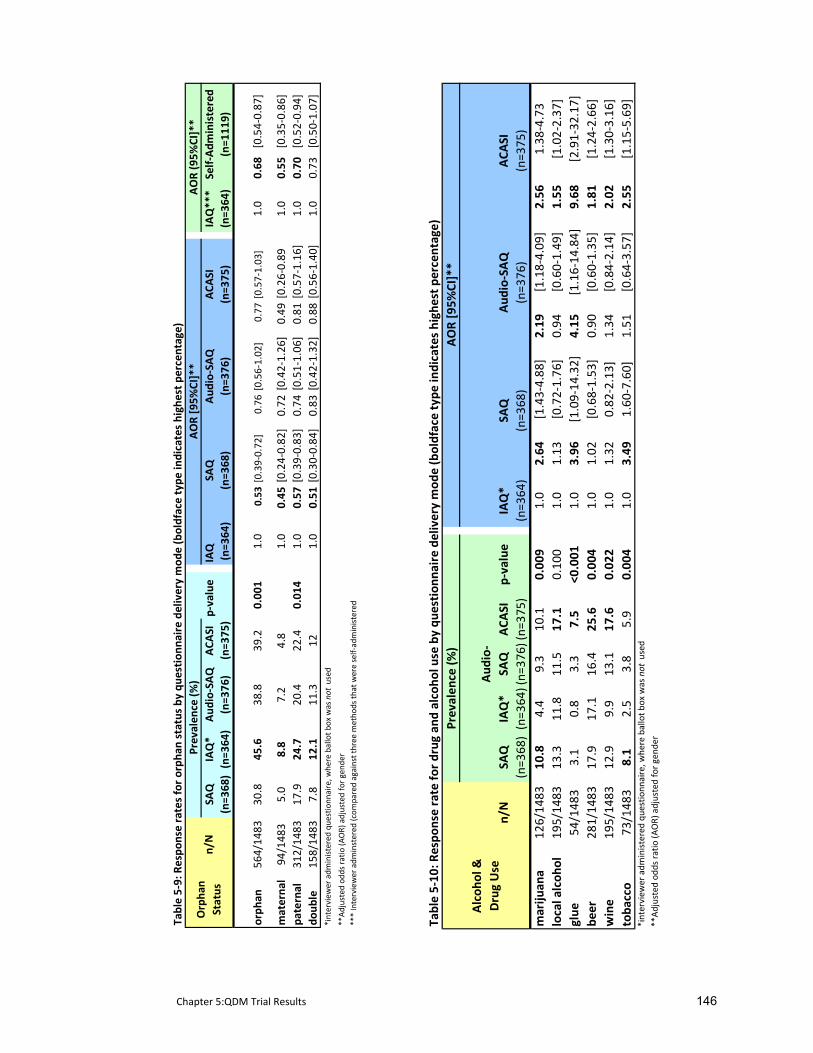
Chapter 5:QDM Trial Results 146
Table 5‐9: Respo
nse rates for orph
an status by
que
stionn
aire delivery mod
e (boldface type
indicates highest pe
rcen
tage)
SAQ
IAQ*
Aud
io‐SAQ
ACA
SIp‐value
IAQ
IAQ***
(n=3
68)(n=3
64)
(n=3
76)
(n=3
75)
(n=3
64)
(n=3
64)
orph
an56
4/14
8330
.845
.638
.839
.20.00
11.0
0.53
[0.39‐0.72]
0.76
[0.56‐1.02
]0.77
[0.57‐1.03
]1.0
0.68
[0.54‐0.87
]
materna
l94
/148
35.0
8.8
7.2
4.8
1.0
0.45
[0.24‐0.82
]0.72
[0.42‐1.26
]0.49
[0.26‐0.89
1.0
0.55
[0.35‐0.86
]pa
ternal
312/14
8317
.924
.720
.422
.40.01
41.0
0.57
[0.39‐0.83
]0.74
[0.51‐1.06
]0.81
[0.57‐1.16
]1.0
0.70
[0.52‐0.94
]do
uble
158/14
837.8
12.1
11.3
121.0
0.51
[0.30‐0.84
]0.83
[0.42‐1.32
]0.88
[0.56‐1.40
]1.0
0.73
[0.50‐1.07
]*interview
er adm
inistered qu
estio
nnaire, w
here ballot b
ox was not used
**Adjusted od
ds ra
tio (A
OR) adjusted for gend
er*** Interviewer adm
instered
(com
pared against three
metho
ds th
at were self‐administered
(n=368
)(n=3
76)
(n=375
)
Orpha
n Status
(n=111
9)n/N
Prevalen
ce (%
)AOR (95%
CI]**
AOR [95%
CI]**
Self‐Adm
inistered
SAQ
Aud
io‐SAQ
ACA
SI
Table 5‐10
: Respo
nse rate fo
r drug
and
alcoh
ol use by qu
estion
naire de
livery mod
e (boldface type
indicates high
est pe
rcen
tage)
n/N
SAQ
IAQ*
Aud
io‐
SAQ
ACA
SIp‐value
IAQ*
(n=3
68)(n=3
64)(n=
376 )
(n=3
75)
(n=364
)mariju
ana
126/14
8310
.84.4
9.3
10.1
0.00
91.0
2.64
[1.43‐4.88
]2.19
[1.18‐4.09
]2.56
1.38
‐4.73
local alcoh
ol19
5/14
8313
.311
.811
.517
.10.10
01.0
1.13
[0.72‐1.76
]0.94
[0.60‐1.49
]1.55
[1.02‐2.37
]glue
54/148
33.1
0.8
3.3
7.5
<0.001
1.0
3.96
[1.09‐14
.32]
4.15
[1.16‐14
.84]
9.68
[2.91‐32
.17]
beer
281/14
8317
.917
.116
.425
.60.00
41.0
1.02
[0.68‐1.53
]0.90
[0.60‐1.35
]1.81
[1.24‐2.66
]wine
195/14
8312
.99.9
13.1
17.6
0.02
21.0
1.32
0.82
‐2.13]
1.34
[0.84‐2.14
]2.02
[1.30‐3.16
]toba
cco
73/148
38.1
2.5
3.8
5.9
0.00
41.0
3.49
1.60
‐7.60]
1.51
[0.64‐3.57
]2.55
[1.15‐5.69
]*interview
er adm
inistered qu
estio
nnaire, w
here ballot b
ox was not used
**Adjusted od
ds ra
tio (A
OR) adjusted for g
ende
r
Alcoh
ol &
Drug Use
(n=3
68)
(n=376
)(n=375
)
Prevalen
ce (%
)AOR [9
5%CI]**
SAQ
Aud
io‐SAQ
ACA
SI
Chapter 5:QDM Trial Results 147
interviewer‐administered mode, respondents using the interviewer‐administered mode are
1.4 to 1.8 times more likely to report orphaning (overall orphaning AOR 1.47; 95% CI 1.15‐1.87;
maternal orphaning AOR 1.82; 95% CI 1.16‐2.88; paternal orphaning AOR 1.42; 95% CI 1.06‐
1.90).
5.6.7 Drug and alcohol use
There were two questions on locally brewed alcohol which were either made from fermented
fruits or a specific plant’s roots and leaves. As their potency was the same these two questions
were combined here for analysis. Frequency of use ranged from never having tried a
substance to using it regularly. Given the young age of this survey population, where any use
would not have been culturally sanctioned, reporting any use of a substance was compared
against never having tried it.
Non‐response rates were less than three percent for all seven questions on drug and alcohol
use. The bulk (95%; n=180/189) of these missing responses were found in questionnaires of
SAQ (62%) and Audio‐SAQ (33%) users. There were no missing responses in ACASI. The
majority of respondents reported never having tried alcohol or drugs ranging from 80.1% (95%
CI 78.6‐82.7%) who said they have never tried beer to 96.3% (95% CI 95.2‐97.2%) claiming to
have never sniffed glue. Not surprisingly, young males had higher rates of reporting these
behaviours than young females. While the numbers were small, increased reporting of drug
and alcohol was seen predominantly by ACASI users (see Table 5‐10). The prevalence of
reporting using marijuana, glue, locally brewed alcohol, beer, and wine, was higher amongst
ACASI users with only the differences in reporting locally brewed alcohol not being statistically
significant.
As shown in Table 5‐10, there was a marked difference in reporting between ACASI and IAQ
users. Specifically, ACASI users were nine times more likely to report having tried glue (ACASI
AOR 9.68; 95% CI 2.91‐32.17), over two times as likely to report having used marijuana (ACASI
AOR 2.56; 95% CI 1.38‐4.78), wine (ACASI AOR 2.02; 95% CI 1.30‐3.16) and tobacco (ACASI AOR
2.55; 95% CI 1.55‐5.69) and over one and a half times more likely to report drinking beer
(ACASI AOR 1.8; 95% CI 1.24‐2.66).
5.6.8 Circumcision
All ICVI and ACASI users answered the circumcision question, while 10 SAQ (4.8%; 95% CI 2.4‐
8.7%) and 15 Audio‐SAQ users (6.9%; 95% CI 3.9‐11.2%) failed to provide an answer. Overall,
4.0% (95% CI 2.8‐5.6) of males reported being circumcised. While the numbers were small,
Chapter 5:QDM Trial Results 148
reporting of circumcision did differ by questionnaire delivery mode. ACASI users were 11
times more likely to report being circumcised than IAQ respondents (OR 11.4 (95% CI 2.6‐49.2).
5.6.9 Self‐reported honesty
At the end of the questionnaire, we asked respondents to report how honest they had been
throughout their responses. Almost 96% of respondents reported answering the
questionnaire completely or very honestly (n=1398/1457) with only a few respondents
reporting answering fairly honestly (3.2%; 46/1457) and even fewer reporting they had not
answered honestly at all (0.8%;13/1457). There were no differences in respondents’ self‐
assessment of their honesty between questionnaire delivery modes (p=0.2)
5.6.9.1 Comparison of self‐reported honesty against biomarker/self‐report agreement
There were 30 respondents who could be categorized as ‘sexually active’ using a biomarker,
having either a positive biomarker for HSV‐2, pregnancy, or new HIV infection since the
baseline survey. Of these 30, 13 of them reported that they had never had sex in the
questionnaire; and all of them claimed to have been ‘completely honest’ or ‘very honest’
throughout their questionnaire responses.
5.7 Summary
In summary:
• There was an appreciable and statistically significant difference between the four
questionnaire delivery modes in both item response rates and rates of reporting sensitive
behaviours and topics.
• Item response rates were lowest in ICVI and ACASI, where the respondent was externally
prompted (interviewer or computer) for a response. This was true for both a priori and post
hoc analysis. Respondents’ inability to correctly follow skip instructions in SAQ and Audio‐
SAQ particularly contributed to this development.
• When compared against the interviewer‐administered questionnaire, the three self‐
administered questionnaires (SAQ, Audio‐SAQ, and ACASI) produced higher rates of
reporting for a number of sensitive topics.
• In particular, ACASI users were more likely to report sexual intercourse, increased number of
partners, younger age at first sex, experiencing symptoms which placed them at risk of
common affective disorders, alcohol and drug use, and circumcision (among males).
Chapter 5:QDM Trial Results 149
• Reports of these behaviours by Audio‐SAQ users were often similar to those of ACASI. SAQ
had the lowest levels of reporting for these sexual behaviours.
• Round 2 comparative data suggests a trend towards sexual behaviour reporting increasing
with ACASI and decreasing with SAQ.
• Despite the use of a ballot box to increase respondents’ sense of privacy and control over
their responses, ICVI users had lower levels of reporting for most behaviours and topics
covered in the a priori and post hoc analysis. Increased reporting from interviewer‐
administered questionnaires was only found for questions related to orphaning.
• Evidence of positive biomarkers for sexual activity was too small to record a difference
between questionnaire delivery modes. However, comparison of biomarkers against self
reports highlights young people’s difficulty in reporting sexual activity, especially for young
women.
In the next chapter, I examine the feasibility and acceptability of these questionnaire delivery
modes as described by the respondents.
Chapter 6: QDM Trial Post Survey Results 150
6 ADDITIONAL RESULTS FROM RDS INTERIM SURVEY COMPARING
FOUR QUESTIONNAIRE DELIVERY METHODS
In the previous chapter, I presented data from the experimental evaluation of sexual
behaviours as well as ad hoc analysis on a range of other socially censured behaviours and
issues. Two additional sets of data were collected that explored respondents’ opinions of
completing the questionnaire using their specific questionnaire delivery mode. The methods
and results of this analysis are reported here.
6.1 Methods
6.1.1 Quantitative Anonymous Post Survey Questionnaire
Respondents from the last five communities were asked to complete a short anonymous
questionnaire that used a five point Likert Scale to explore their impressions of the
questionnaire delivery mode (see Appendix K). The questionnaire was administered after the
respondent had completed their questionnaire in Round 1 and took about five minutes to
complete. Questions covered respondents’ impressions of the staff, their perceived ease of
questionnaire completion, their sense of private space during questionnaire completion, and
maintenance of confidentiality. There were a total of 17 questions, 13 of which were relevant
to all four questionnaire delivery modes; the remaining 4 questions were method specific (see
Appendix K). In order to avoid the problem of a “response set”, a number of statements were
reversed in orientation, where a positive attitude towards the topic was expressed by
disagreeing with the statement. For example, if a respondent believed the survey staff
maintained confidentiality, they would disagree with the following statement. ‘I do not
believe9 the RDS staff when they say that the responses that I give are kept secret.’ (Q.6). The
five point Likert Scale was collapsed to a three point scale (strongly agree/agree, strongly
disagree/disagree, and don’t know) for analysis.
6.1.2 Qualitative Data Collection
Interim survey respondents from 10 of the 12 communities were randomly selected to be
interviewed after they had completed the questionnaire(s) where they were asked to assess
the acceptability of the method(s) they had used (see Appendix L for the topic guide). Where
feasible, focus groups discussions (FGDs) were also held with respondents (who were
purposively sampled to reflect all methods) to ascertain their views on the different
9 In Shona, the word ‘believe’ is a considered to be a very strong word usually reserved for conversations connected to faith. So the team suggested we use the word ‘agree’ instead.
Chapter 6: QDM Trial Post Survey Results 151
questionnaire delivery modes. Members of the social science team, already trained in
qualitative field work, and a part of the interim survey interview team, conducted the
interviews. Respondents were approached as they completed the survey and asked if they
were willing to share their survey experiences. As questions were not of a sensitive nature (we
were asking them about their impressions, not their actual responses), it was not deemed
necessary to match interviewers’ and respondents’ gender; however, interviewers did not
question a respondent they had just interviewed using ICVI. Discussions were designed to take
no longer than five to ten minutes. All qualitative data were transcribed electronically and
coded for thematic issues using Nvivo 7.0 (QSR, Australia).
6.2 Post survey questionnaire results
Out of the 697 respondents in the last five communities, 650 (93%) completed the anonymous
post survey questionnaires assessing their overall survey impressions. Similar numbers of
questionnaires were completed for all four survey methods (SAQ=168 (26%); Audio‐SAQ=159
(25%); ICV=162 (24%); ACASI=161 (25%)). Overall, fewer females completed the post‐survey
questionnaire (n=308; 48%) except for ACASI where they took part in slightly greater numbers
than their male peers (n=87/160 (54%)).
6.2.1 Survey environment
As described in Chapter 3, we went to great lengths to ensure single gender environments to
enhance the privacy of respondents in their survey environment. During the anonymous
questionnaire respondents were asked to describe their survey environment. They could
report that they had completed the questionnaire all alone (or under a tree with an
interviewer), in a room with only other males or only other females, or in a room with both
males and females together.
Just over 30% (32%; n=179/558) of the respondents reported taking the questionnaire in a
space by themselves; and half of these were ICVI users. Just under one‐third (28%; n=159/558)
took the survey in a room with both male and females. Almost 90% (89%; n=152/170) of
respondents reported being in a room with only their same gender; 11% (n=10/89)of females
and 10% (n=8/81) of males reported taking the survey in a room with members of the opposite
gender. Three of the 18 respondents, all SAQ users, who took the questionnaire in this setup
reported feeling others could see their answers. Irrespective of their specific survey
environment, the majority (90%; 571/634) of respondents reported feeling they had enough
privacy when completing the questionnaire.
Chapter 6: QDM Trial Post Survey Results 152
6.2.2 Survey environment, feasibility and acceptability of questionnaire delivery modes
Results from the post survey questionnaire are presented in Table 6‐1 which presents the
proportion who agreed or strongly agreed with each of the statements around the survey
environment. While there was no statistical difference between modes, between 13% (95% CI
8.4‐19.6) and 17% (95% CI 11.4‐23.6) of respondents across all four methods thought others
could see their responses (p=.0690). Despite staff assurances that their responses would be
kept secret, just over half of the respondents did not believe these guarantees and while not
statistically significant, there was greater reporting of this by ICVI respondents (65%; p=0.070).
Over 20% reported that they found some of the questions embarrassing (either to see in print
or to hear being read aloud) and this appeared to be higher for respondents using ACASI and
Audio‐SAQ (Audio‐SAQ, ACASI=29% c.v. ICV=23% and SAQ=19%; p=0.008). Despite reporting a
higher level of embarrassment, only four percent of ACASI users reported that they could not
answer questions honestly which was significantly lower than the other three methods
(p=0.004). Responses to the statement relating to length of questionnaire indicated that for
those methods that took longer to complete (SAQ and Audio‐SAQ, see Chapter 5, section
5.2.1), respondents were more likely to agree that there were too many questions and that
they became bored (p=0.038).
Respondents using CD players (Audio‐SAQ) and laptops (ACASI) were asked to assess their
difficulty in using this equipment during survey administration. More ACASI users reported
facing challenges than Audio‐SAQ users (Audio‐SAQ=28%, ACASI=45%, p<0.001).
6.2.3 Relationship between maintaining confidentiality at baseline and belief in this at interim
Most interim survey respondents (87.8%; 557/636) believed their answers were kept secret at
baseline. Yet, of those, only 39.0% (n=217/555) believed interim survey staff when they
assured them that confidentiality would be maintained. There were no differences by
questionnaire delivery mode (p=0.45)
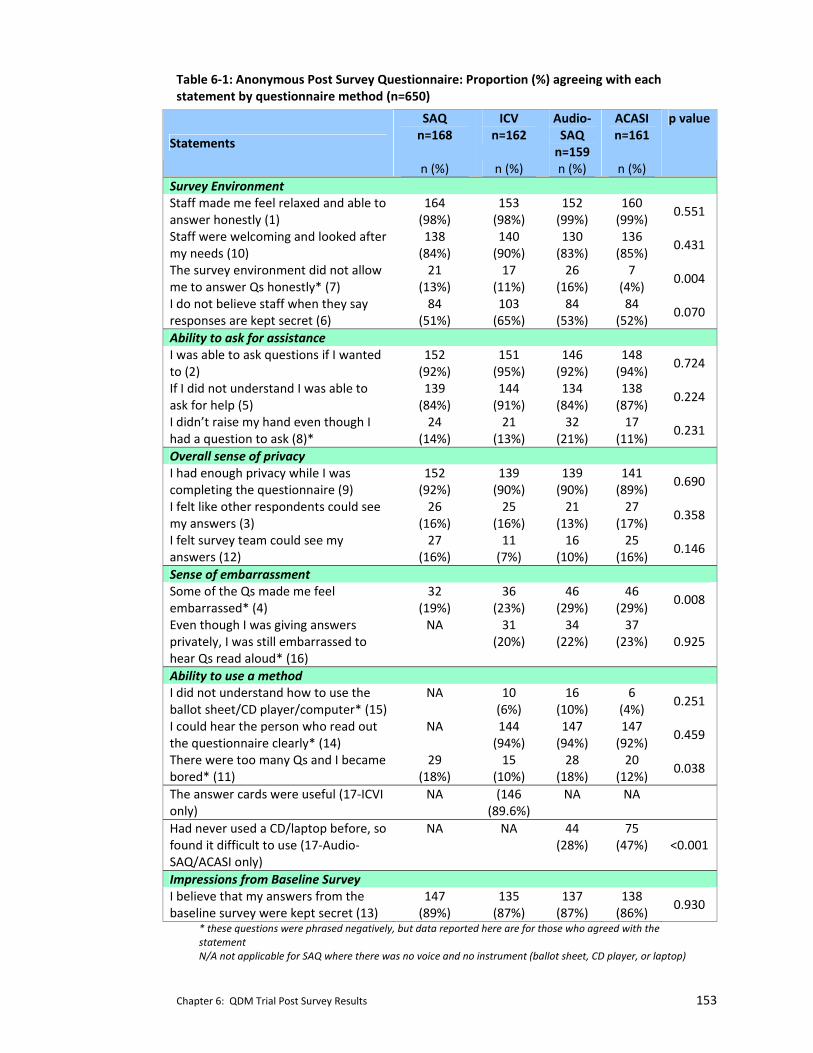
Chapter 6: QDM Trial Post Survey Results 153
Table 6‐1: Anonymous Post Survey Questionnaire: Proportion (%) agreeing with each statement by questionnaire method (n=650)
SAQ n=168
ICV n=162
Audio‐SAQ n=159
ACASI n=161
Statements
n (%) n (%) n (%) n (%)
p value
Survey Environment Staff made me feel relaxed and able to answer honestly (1)
164 (98%)
153 (98%)
152 (99%)
160 (99%)
0.551
Staff were welcoming and looked after my needs (10)
138 (84%)
140 (90%)
130 (83%)
136 (85%)
0.431
The survey environment did not allow me to answer Qs honestly* (7)
21 (13%)
17 (11%)
26 (16%)
7 (4%)
0.004
I do not believe staff when they say responses are kept secret (6)
84 (51%)
103 (65%)
84 (53%)
84 (52%)
0.070
Ability to ask for assistance I was able to ask questions if I wanted to (2)
152 (92%)
151 (95%)
146 (92%)
148 (94%)
0.724
If I did not understand I was able to ask for help (5)
139 (84%)
144 (91%)
134 (84%)
138 (87%)
0.224
I didn’t raise my hand even though I had a question to ask (8)*
24 (14%)
21 (13%)
32 (21%)
17 (11%)
0.231
Overall sense of privacy I had enough privacy while I was completing the questionnaire (9)
152 (92%)
139 (90%)
139 (90%)
141 (89%)
0.690
I felt like other respondents could see my answers (3)
26 (16%)
25 (16%)
21 (13%)
27 (17%)
0.358
I felt survey team could see my answers (12)
27 (16%)
11 (7%)
16 (10%)
25 (16%)
0.146
Sense of embarrassment Some of the Qs made me feel embarrassed* (4)
32 (19%)
36 (23%)
46 (29%)
46 (29%)
0.008
Even though I was giving answers privately, I was still embarrassed to hear Qs read aloud* (16)
NA 31 (20%)
34 (22%)
37 (23%) 0.925
Ability to use a method I did not understand how to use the ballot sheet/CD player/computer* (15)
NA 10 (6%)
16 (10%)
6 (4%)
0.251
I could hear the person who read out the questionnaire clearly* (14)
NA 144 (94%)
147 (94%)
147 (92%)
0.459
There were too many Qs and I became bored* (11)
29 (18%)
15 (10%)
28 (18%)
20 (12%)
0.038
The answer cards were useful (17‐ICVI only)
NA (146 (89.6%)
NA NA
Had never used a CD/laptop before, so found it difficult to use (17‐Audio‐SAQ/ACASI only)
NA NA 44 (28%)
75 (47%) <0.001
Impressions from Baseline Survey I believe that my answers from the baseline survey were kept secret (13)
147 (89%)
135 (87%)
137 (87%)
138 (86%)
0.930
* these questions were phrased negatively, but data reported here are for those who agreed with the statement N/A not applicable for SAQ where there was no voice and no instrument (ballot sheet, CD player, or laptop)
Chapter 6: QDM Trial Post Survey Results 154
6.3 Qualitative Data Results
None of the 115 respondents approached for an interview declined. More males (61%) were
interviewed than females. Seventy percent (n=81) of the interviews were held after
respondents had completed Round 1 (using only one method). Of the 34 interviews held with
respondents who had completed both rounds, 27 (79%) were with respondents who had used
2 different methods. In addition two focus group discussions were held with respondents who
had been purposefully sampled to represent all four methods.
Emerging core themes related to the importance of environment, the ease of method use, and
interviewer presence or absence, especially as it related to the broader nature of sensitive
questions and to questionnaire comprehension (see Appendix M for additional quotations not
found within the text). Where possible, I have compared qualitative responses with those
from the post survey questionnaire outlined in the section above.
6.3.1 Comparisons with baseline survey environment between anonymous post survey questionnaire and the qualitative interviews.
Given that all interim survey respondents had participated in the baseline survey, we used the
post–survey questionnaire to ask them to compare their experiences around the ease of
reporting honestly. Thirty percent of respondents stated that it was easier to be honest during
the interim survey while 63% reported their was no difference between the two surveys.
However, when asked about their experience during exit interviews respondents repeatedly
compared the interim survey environment against that of the baseline, and in particular the
negative aspects of completing the questionnaire in a group setting. They highlighted how
concerned they were during baseline that their peers would be able to “know their answers.”
References to “peeping” and other similar terms were common, giving the impression that
they felt less able to answer sensitive questions honestly during the baseline survey. Many of
the interim survey sites were located at clinics and small shops where rooms were small.
Respondents expressed appreciation that only a few youth participated in the interim survey
at the same time.
Overall respondents stressed the importance of being able to complete the questionnaire ‘on
their own’, so they could ensure that others couldn’t see (or ‘peep’ at) their responses. One
male noted, ‘Today’s method was the best because I was doing things on my own unlike at
baseline [where] everyone could see my responses’ (R1, male ACASI). Respondents who used
ICVI attributed their sense of privacy to the interviewer encouraging them to cover their ballot
Chapter 6: QDM Trial Post Survey Results 155
sheet as well as the opportunity for them to fold and place it into the locked ballot box. One
male, who took ICVI in both rounds stressed this importance: ‘The reader emphasized the fact
that I was supposed to guard what I was writing on the ballot sheet so that no one else could
see and this pleased me.’ (male, ICVI, ICVI).
The importance of a private setting was again highlighted by respondents who had completed
two different methods. While they sometimes reported there was no difference between the
methods, this was often said in the context of privacy and confidentiality. When these were
maintained, respondents claimed there were fewer differences between acceptability of
methods. For example, one respondent who used SAQ and then ACASI commented that they
‘were equally good as privacy was maintained in both cases.’ (male, SAQ, ACASI, italics mine)
In another instance a young man emphasized the similarities between Audio‐SAQ and ACASI
commenting that the difference, ‘was only in the manner in which you gave your answer
(paper versus clicking a mouse).’ (male, Audio‐SAQ, ACASI)
There were a number of instances when respondents mentioned that one of the reasons they
were more likely to tell the truth now than at baseline was that they were reassured that the
project had not released baseline results into the community. One respondent mentioned
that with the passing of time this made respondents more confident about the project’s
promise not to disclose individual survey results. ‘The outcomes of this exercise will not be
known by other people, [but] you only, will know our responses, and so nothing will make one
lie.’ (ICVI, female)
However, this project‐specific trust was counteracted by overarching community attitudes and
experiences that didn’t honour or respect adolescents’ privacy. During interviews,
respondents would often refer to other external experiences that made them doubt the
project’s ability to maintain their privacy. For example, despite the fact that parents (or any
other community members) were not welcomed to the site nor did survey staff have any
visible contact with them, respondents highlighted their overarching belief that private
matters would still get back to them. In addition, we asked respondents to sit far apart from
each other and to cover their responses with a blank sheet of paper to ensure that others
could not see their responses. However respondents commented that while these instructions
were similar to how they completed school exams that this ‘system’ was not foolproof and
hadn’t always kept their exam responses private.
Chapter 6: QDM Trial Post Survey Results 156
6.3.2 Ability to use the questionnaire delivery mode
Some SAQ and Audio‐SAQ respondents reported difficulties following the skip instructions.
Qualitative interviews with Audio‐SAQ respondents indicated they felt nervous about raising
their hand during the survey as they were uncertain whether pausing the CD player would
cause them to miss a question. As one respondent noted, “You may not know which button to
press to stop the CD player when you have a question. When you ask, you will find the CD
player on the next question.” (male ICVI, Audio‐SAQ)
With both Audio‐SAQ and ACASI, respondents expressed concern that they would ‘make
mistakes’ with the system and somehow give an answer that was not their own. One male
who took Audio‐SAQ and SAQ commented ‘[Audio‐SAQ] was fine but sometimes you …would
suddenly be asked to press a red button so it requires one to …grasp issues quickly.’ Field notes
from this interview showed that the respondent was ‘wary of making mistakes…or missing
some of the questions when using Audio‐SAQ, so he preferred SAQ.’ (field notes, male, Audio‐
SAQ, SAQ)
Despite staff being spoken of positively and that all respondents thought it possible to ask a
question of them, many respondents admitted that they did not actually do this when they
encountered a problem. In most cases, it was because they did not think their problem was
important enough and so they would hazard a guess and carry on. This was most often
mentioned from Audio‐SAQ and ACASI users. However, with ICVI, respondents also mentioned
that they would not ask questions of their interviewers because it got too embarrassing to
keep stopping and asking them. ‘It is uncomfortable to keep telling the interviewer that you
did not understand and you end up saying ‘yes’ even when that is not your answer.’ (female,
ACASI, ICVI, female.)
6.3.3 The novelty of ACASI
However, while more respondents expressed difficulty administering ACASI during the post‐
survey questionnaire, this was not reflected in the qualitative data where respondents
focussed on the excitement of using the laptop due to its novelty . ‘When they told me that I
was going to use ACASI and I entered the room and saw a computer, I was shocked at first and
I told myself that in our family, two of us have used the computer and I have done it whilst I am
still this young’ (ACASI, female).
Chapter 6: QDM Trial Post Survey Results 157
6.3.4 Increased sense of privacy with ACASI
Respondents who used ACASI perceived the method as more private and confidential because
they did not perceive the study ID, entered by survey staff at the onset and not visible
thereafter, to be linked to their identity “I was quite happy with this method because no one
had access to my answers.” (ACASI, female). Respondents who used ACASI reported a greater
likelihood of answering questions on sexual activity honestly when using this method. A
minority expressed concern that their responses on the computer screen might be visible to
others. One respondent who took Audio‐SAQ and then ACASI commented, “They [the
methods] are different; with [Audio‐SAQ] things are said into your ears and you write down
your answers. But [with ACASI] … there is a screen and so if someone is looking, they will be
able to see what’s being written” (male, Audio‐SAQ, ACASI). This was more true in situations
where the survey environment might not have been as private as we desired. In one instance
respondents who had completed the survey and were waiting outside re‐entered temporarily
during a short rain‐shower, temporarily crowding the rooms. One ACASI user felt his
responses might have been visible in this instance.
6.3.4.1 Ballot sheet appreciated but not sufficient All ICVI users appreciated the use of the ballot sheet and the ballot box. “[ICVI] is okay
because the interviewer writes down your response on the less important issues but when it
comes to sensitive questions, you provide responses on your own and so you can tell the truth
without feeling shy. You did well when you ensured that the ballot box would be opened in
Mutare.” (female, ICVI). However, for this same woman, and for others, the sense of privacy
found from the ballot sheet was not sufficient to ensure a total feeling of privacy. “I really
understood that I had to answer sensitive questions on my own and that the ballot box would
be opened in Mutare. However, it is just difficult to tell the truth in front of someone. I just had
that feeling that the interviewer would be able to ’know’ my responses”’ (female, ICVI)
6.3.5 Use of a voice increases comprehension
During qualitative interviews, respondents concurred with data from the post‐survey
questionnaire emphasizing how difficult it was to hear sexual concepts spoken aloud. As one
male respondent remarked, “my heart leapt a little” when he heard them (male, Audio‐SAQ).
Yet another woman noted “that the question ‘have you ever had sex’ made me panic as well as
feel uneasy.” (female, Audio‐SAQ, ACASI).
Respondents who completed the questionnaire using Audio‐SAQ, ICVI or ACASI believed it
helped their understanding to have the questions read aloud. “[Audio‐SAQ] is much faster in
Chapter 6: QDM Trial Post Survey Results 158
the sense that you would be reading and listening at the same time. As a result, you
understand quickly and give answers that are well‐thought through.” (male, Audio‐SAQ)
Respondents using Audio‐SAQ and ACASI often noted that it was easier to answer truthfully
because they did not have to give their responses in front of someone. One young woman
said, “I liked [Audio‐SAQ] a lot because ….I was able to divulge my private issues without any
embarrassment.” (female, Audio‐SAQ, ICVI)
Respondents using ICVI were divided about how beneficial they found having an interviewer.
A few highlighted the benefits of being able to seek instant clarification from the interviewer
(something they reported they failed to do when using another method). One young woman,
“insisted that she would prefer this method [ICVI] because it gave her an opportunity to get
clarification from the interviewer promptly. [She] added that there are times when she was
forced to give incorrect answers because she was embarrassed to raise her hand [with ACASI]
even though the survey assistant had told her to do so.” (field notes female ACASI, ICVI)
However, ICVI users predominantly reported feeling embarrassed having to respond to
sensitive questions in front of someone as illustrated in the following quotes. “With [Audio‐
SAQ], there is [no question] that you can’t answer [truthfully] because no one else ….knows
what you said. When you do not see any other person there is nothing to be afraid of, as you
would be with [an interviewer].” (male, Audio‐SAQ, ICVI) Another respondent explained, “but
with [an interviewer]. I was just thinking that somebody was watching me.” (female, Audio‐
SAQ, ICVI) By contrast, respondents reported feeling more comfortable using the self‐
completion methods: “I was telling the truth [with ACASI] because no one was ever going to
know what I had written or said.” (male, Audio‐SAQ, ICVI) This was particularly true for those
who were able to compare ICVI with another method: “When you are asked questions, for you
to tell the real truth, you need to be on your own and so I view this method [ACASI] as greatly
increasing someone’s chances of telling the truth, and also because there won’t be anyone to
be ashamed of or to fear.” (male, ACASI, ICVI).
6.3.6 Ability to report on other sensitive issues
In both focus group discussions and interviews, respondents noted that questions on poverty
and orphaning were just as sensitive as questions on sexual behaviour. ‘…your mother and
father are [deceased] and you can be distressed. [In ICVI] you will be facing someone… Tears
may drop out my friend. But when answering with a computer no one would be there so no
tears will come out and fall on the computer.’ (female ICVI, FGD, female). Respondents using
ICVI felt this most acutely; questions on poverty were not among those answered
confidentially through the ballot box. As one female noted, “For example, the question ‘Have
Chapter 6: QDM Trial Post Survey Results 159
you ever gone to bed hungry in your household?’ is difficult to answer when it is directed to you
because you may just feel embarrassed to say it’s true that in our household we sometimes go
to bed hungry.” (female, ICVI, ACASI) During debriefing sessions, interviewers reported
respondents breaking down during questions on orphaning and looking uncomfortable when
asked about poverty (interviewers were trained in how to handle emotionally charged
situations).
6.4 Summary
This chapter reports on the feasibility and acceptability of four questionnaire delivery modes
as described by the respondents. Data was collected from respondents after survey
administration through an anonymous questionnaire and during short interviews. This data
supports the results reported in Chapter 5 as well as in the systematic review (Chapter 2) that
self‐administered modes, and ACASI in particular, are appreciated by respondents who
recognize their increased ability to provide privacy in reporting of sensitive behaviours.
Respondents highlighted the importance of an audio component for added comprehension
and an augmented sense of privacy. Respondents also noted that sensitive questions were not
limited to those on sexual behaviours but included poverty and orphaning. Evidence
presented here and in the previous chapter formed the basis for deciding on modes for the
final survey of the parent trial which included the use of Audio‐SAQ and ACASI. This decision
and a few comparative results from the final survey are discussed in the next chapter.
Chapter 7: RDS Final Survey Comparisons 160
7 USE OF FINAL SURVEY TO COMPARE TWO QUESTIONNAIRE DELIVERY MODES
7.1 Criteria used to inform the questionnaire delivery mode for final survey
The primary aim of the experimental evaluation of four questionnaire delivery modes, which
forms the core of this thesis, was to inform the choice of mode to be used in the final survey of
the RDS parent trial held in 2007. Determining the mode most suitable in this context required
balancing information from numerous arenas. We assessed response rates and increased
prevalence of reported sensitive behaviours. In addition, we assessed a method’s feasibility
both in terms of participants’ ability to use the method and its viability in the specific field
environment. Participants’ opinions on the acceptability of a mode are also intrinsic to this
process.
Table 7‐1 below summarizes the advantages and disadvantages of the four questionnaire
delivery modes emanating from the results described in detail in the last two chapters. These
data strongly suggest the use of self‐administered modes that include an audio component
and advocates that skip patterns should be avoided when the respondent is responsible for
their completion.
After a thorough examination of all the available evidence, we decided to use a combined data
collection approach for the final survey. Participants were asked to complete the
questionnaire in two consecutive stages. Audio‐SAQ was used to collect the data for the
majority of questions, particularly data that did not require the use of skip patterns. Audio
quality was improved through the use of MP3 players which also allowed for easier movement
between questions. In the final survey we included a partner matrix to collect data about
concurrency and sexual networks. This matrix included very complex skips which would not
have been possible to self administer. The Audio‐SAQ questionnaire was followed by a shorter
ACASI questionnaire where participants completed questions relating to particularly sensitive
data and all questions that required the use of complex skip patterns. A few sexual behaviour
questions were included in both modes. By only collecting some of the data using ACASI we
were able to administer the final survey using fewer laptops than would have been required if
all questions were administered this way. The high initial cost of laptops and software was
thereby minimised.
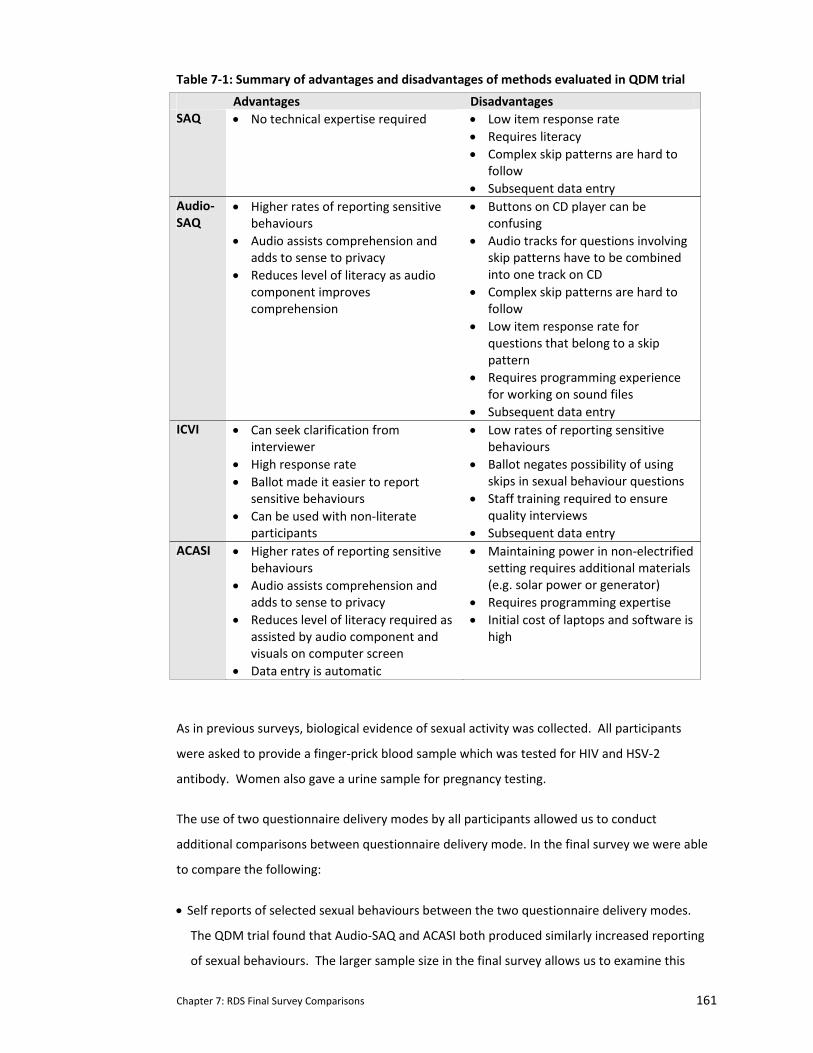
Chapter 7: RDS Final Survey Comparisons 161
Table 7‐1: Summary of advantages and disadvantages of methods evaluated in QDM trial
Advantages Disadvantages SAQ • No technical expertise required • Low item response rate
• Requires literacy • Complex skip patterns are hard to
follow • Subsequent data entry
Audio‐SAQ
• Higher rates of reporting sensitive behaviours
• Audio assists comprehension and adds to sense to privacy
• Reduces level of literacy as audio component improves comprehension
• Buttons on CD player can be confusing
• Audio tracks for questions involving skip patterns have to be combined into one track on CD
• Complex skip patterns are hard to follow
• Low item response rate for questions that belong to a skip pattern
• Requires programming experience for working on sound files
• Subsequent data entry ICVI • Can seek clarification from
interviewer • High response rate • Ballot made it easier to report
sensitive behaviours • Can be used with non‐literate
participants
• Low rates of reporting sensitive behaviours
• Ballot negates possibility of using skips in sexual behaviour questions
• Staff training required to ensure quality interviews
• Subsequent data entry ACASI • Higher rates of reporting sensitive
behaviours • Audio assists comprehension and
adds to sense to privacy • Reduces level of literacy required as
assisted by audio component and visuals on computer screen
• Data entry is automatic
• Maintaining power in non‐electrified setting requires additional materials (e.g. solar power or generator)
• Requires programming expertise • Initial cost of laptops and software is
high
As in previous surveys, biological evidence of sexual activity was collected. All participants
were asked to provide a finger‐prick blood sample which was tested for HIV and HSV‐2
antibody. Women also gave a urine sample for pregnancy testing.
The use of two questionnaire delivery modes by all participants allowed us to conduct
additional comparisons between questionnaire delivery mode. In the final survey we were able
to compare the following:
• Self reports of selected sexual behaviours between the two questionnaire delivery modes.
The QDM trial found that Audio‐SAQ and ACASI both produced similarly increased reporting
of sexual behaviours. The larger sample size in the final survey allows us to examine this
Chapter 7: RDS Final Survey Comparisons 162
again and by gender. In addition a higher proportion are likely to infected with HIV, HSV‐2
or to be pregnant providing more power to look at association between reported sexual
behaviour and presence of biomarkers.
7.2 Questionnaire development for the final survey
7.2.1 Questionnaire adaptation for final survey
The final survey questionnaire was adapted from the one developed for the interim survey
(see Chapter 4). Additional cognitive interviewing was conducted to refine certain new
questions (including one on anal sex). As before, questions were translated into Shona
(indigenous language).
A sexual partner matrix was developed and included in the ACASI component as it required
complex skips (copy of the sexual partner matrix in the ACASI questionnaire and the
accompanying flow chart available from the author). This required the practice questions in
ACASI be revamped substantially to reflect the increased complexity of the sexual partner
matrix. Non‐sensitive questions around shopping were developed to illustrate to a participant
how they could proceed through a cycle and be asked the same questions for different
situations (see Appendix N).
7.2.2 Comparisons of sexual behaviour questions
Some key sexual behaviour questions were asked in both Audio‐SAQ and ACASI in order to
ensure that we had these key endpoint data on all participants in the event of an ACASI failure.
Responses to these duplicate questions were compared during analysis (see Table 7‐2).
Participants were asked about their sexual behaviours including age of sexual debut, condom
use at last sex, and numbers of partners in the last 12 months and in their lifetime. Response
choices for numbers of partners was presented slightly differently in Audio‐SAQ and ACASI. In
Audio‐SAQ, participants could choose from categorical answers (e.g. 3‐4 partners, 5 or more
partners), whereas in ACASI, there was a unique response option for choosing partners ‘1’
through ‘10’ with a final categorical response option for ’10 or more partners’ (see Table 7‐2
Q13‐14B).
Data on sexual debut, condom use at last sex, and number of lifetime partners and partners in
the last 12 months were analysed for those participants who reported ever having had sex. In
the Audio‐SAQ version of the questionnaire the question on ever having sex was asked only
once. In the ACASI version of the questionnaire, participants who initially answered ‘no’ to the
‘ever sex’ question were asked the question a second time. We anticipate that this would
Chapter 7: RDS Final Survey Comparisons 163
increase the proportion who answered ‘yes’ to this question (in the QDM trial, the proportion
of participants answering ‘yes’ to this question in ACASI rose from 10% the first time it was
asked to 16% the second time). In Audio‐SAQ, ‘ever sex’ was defined as an affirmative
response to ever having had sex (asked once), whereas in ACASI, ‘ever sex’ included an
affirmative response to either the first (B5) or the second (B6) question asking the participant
if they had ever had sex. Data on age of sexual debut was collected immediately after the
question on ever having sex, and was analysed assuming the number who reported having had
sex in this question formed the denominator. However, data on numbers of sexual
partnerships and condom use were collected after the participant had also been asked
questions about engaging in forced sex in Audio‐SAQ and forced sex and anal sex in ACASI (see
Table 7‐2). Participants who responded affirmatively in any of these questions were included
in the denominator for the comparative analysis of sexual partners and condom use.
Participants’ responses were examined to see if they had changed their answer to specific
sexual behaviour questions between the two questionnaire delivery modes. A positive
conversion was a change that resulted in an increase in socially censured reporting (e.g.
changing from ‘never had sex’ to ‘ever had sex’ or reporting earlier age of sexual debut). A
negative conversion was a change that resulted in a decrease in socially censured reporting
(e.g. reporting a smaller number of lifetime partners).
7.2.3 Comparison of questionnaire acceptability and reported honesty
In addition, both questionnaires concluded with a series of questions relating to participants’
opinions of the method and how they had handled potentially distressing questions. Four
questions covered clarity of questions and responses, ease of method operation, and
usefulness of the audio component (see Table 7‐2, Audio‐SAQ Q95‐Q98). Both questionnaires
culminated with one question which asked participants how honest they had been when
completing the questionnaire. The ACASI version included one additional question that asked
if participants believed they would have given similar answers to the sexual behaviour
questions had they been asked them in Audio‐SAQ. This speculation is based on their
experience using both modes.
7.2.4 Inconsistent reporting
As the Audio‐SAQ and ACASI versions were designed to be run consecutively and very few
questions were asked using both modes there were few instances where responses to
Chapter 7: RDS Final Survey Comparisons 164
different questions could conflict by method. In ACASI, software programming controlled all
the skips making it difficult for participants to answer these inconsistently. In Audio‐SAQ there
were several instances where illogical answers were possible. Immediately after the two
questions that defined a participant as having engaged in sex (affirmative answer to ‘ever had
sex’ or ‘ever been forced’), there were four questions asking about condom use at first and last
sex and number of sexual partners in their lifetime and in the last 12 months. As we did not
include any skips in the Audio‐SAQ version, these four questions included a response option ‘I
have never had sex’ to cater for those participants who reported never having had consensual
or forced sex. Female participants could also respond inconsistently to questions on
pregnancy, claiming for example to have never been pregnant in one question and then
reporting an abortion in a subsequent question. Finally, in the two questions on experiencing
distress during the questionnaire (see Table 7‐2, Audio‐SAQ Q99‐100), participants who
reported no distress in the first question were provided with a response option ‘I did not have
any negative memories.’
7.2.5 Data analysis
Data collected using Audio‐SAQ were double‐entered onto a Microsoft Access password‐
protected database; ACASI data was downloaded directly into Access. Range and consistency
checks were preformed. Chi‐square test was used to assess the association between mode of
administration and responses to each of the questions detailed in Table 7‐2. McNemar’s chi
square test was used to assess the effect of answering these sensitive questions using an
alternative method. Biological samples for the final survey were collected and analysed in the
same manner as described in Chapters 3 and 4. A biological marker of sexual activity was
defined as testing positive for HIV or HSV‐2 or being currently pregnant as defined by a
positive pregnancy test (females only).
Response options for these sexual behaviour questions were converted into binary categories.
Age of sexual debut was categorized as 17 years or less (socially censured) versus 18 years and
above (socially approved). Number of sexual partners were categorized as having one partner
(socially approved) versus two or more (socially censured). Condom use was categorized as
ever use (socially approved) versus no use (socially censured).
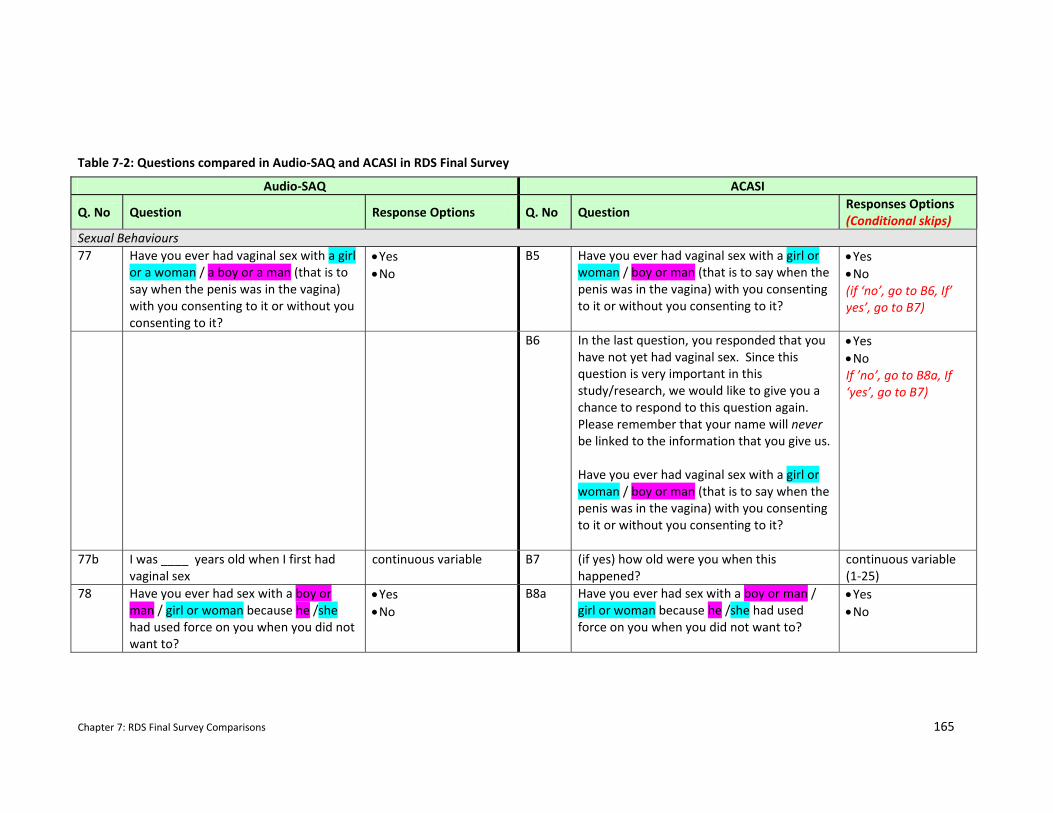
Chapter 7: RDS Final Survey Comparisons 165
Audio‐SAQ ACASI
Q. No Question Response Options Q. No Question Responses Options (Conditional skips)
Sexual Behaviours 77 Have you ever had vaginal sex with a girl
or a woman / a boy or a man (that is to say when the penis was in the vagina) with you consenting to it or without you consenting to it?
• Yes • No
B5 Have you ever had vaginal sex with a girl or woman / boy or man (that is to say when the penis was in the vagina) with you consenting to it or without you consenting to it?
• Yes • No (if ‘no’, go to B6, If’ yes’, go to B7)
B6 In the last question, you responded that you have not yet had vaginal sex. Since this question is very important in this study/research, we would like to give you a chance to respond to this question again. Please remember that your name will never be linked to the information that you give us. Have you ever had vaginal sex with a girl or woman / boy or man (that is to say when the penis was in the vagina) with you consenting to it or without you consenting to it?
• Yes • No If ’no’, go to B8a, If ‘yes’, go to B7)
77b I was ____ years old when I first had vaginal sex
continuous variable B7 (if yes) how old were you when this happened?
continuous variable (1‐25)
78 Have you ever had sex with a boy or man / girl or woman because he /she had used force on you when you did not want to?
• Yes • No
B8a Have you ever had sex with a boy or man / girl or woman because he /she had used force on you when you did not want to?
• Yes • No
Table 7‐2: Questions compared in Audio‐SAQ and ACASI in RDS Final Survey
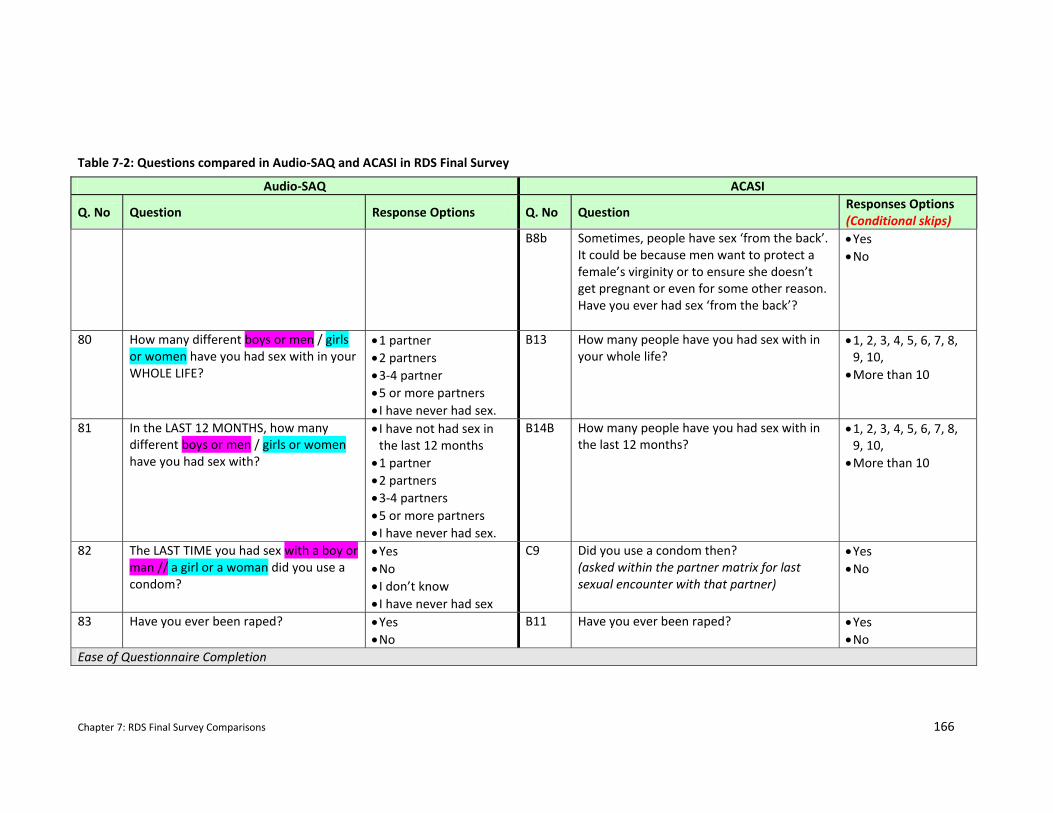
Chapter 7: RDS Final Survey Comparisons 166
Audio‐SAQ ACASI
Q. No Question Response Options Q. No Question Responses Options (Conditional skips)
B8b Sometimes, people have sex ‘from the back’. It could be because men want to protect a female’s virginity or to ensure she doesn’t get pregnant or even for some other reason. Have you ever had sex ‘from the back’?
• Yes • No
80 How many different boys or men / girls or women have you had sex with in your WHOLE LIFE?
• 1 partner • 2 partners • 3‐4 partner • 5 or more partners • I have never had sex.
B13 How many people have you had sex with in your whole life?
• 1, 2, 3, 4, 5, 6, 7, 8, 9, 10, • More than 10
81 In the LAST 12 MONTHS, how many different boys or men / girls or women have you had sex with?
• I have not had sex in the last 12 months • 1 partner • 2 partners • 3‐4 partners • 5 or more partners • I have never had sex.
B14B How many people have you had sex with in the last 12 months?
• 1, 2, 3, 4, 5, 6, 7, 8, 9, 10, • More than 10
82 The LAST TIME you had sex with a boy or man // a girl or a woman did you use a condom?
• Yes • No • I don’t know • I have never had sex
C9 Did you use a condom then? (asked within the partner matrix for last sexual encounter with that partner)
• Yes • No
83 Have you ever been raped? • Yes • No
B11 Have you ever been raped?
• Yes • No
Ease of Questionnaire Completion
Table 7‐2: Questions compared in Audio‐SAQ and ACASI in RDS Final Survey
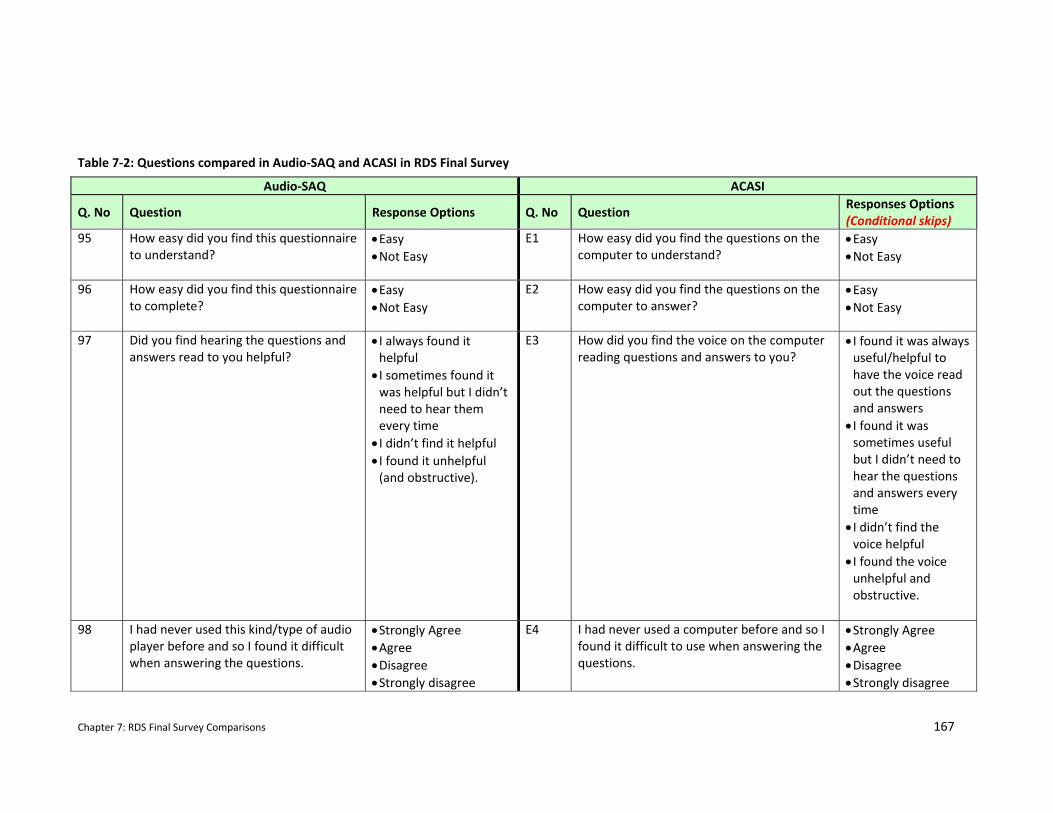
Chapter 7: RDS Final Survey Comparisons 167
Audio‐SAQ ACASI
Q. No Question Response Options Q. No Question Responses Options (Conditional skips)
95 How easy did you find this questionnaire to understand?
• Easy • Not Easy
E1 How easy did you find the questions on the computer to understand?
• Easy • Not Easy
96 How easy did you find this questionnaire to complete?
• Easy • Not Easy
E2 How easy did you find the questions on the computer to answer?
• Easy • Not Easy
97 Did you find hearing the questions and answers read to you helpful?
• I always found it helpful • I sometimes found it was helpful but I didn’t need to hear them every time • I didn’t find it helpful • I found it unhelpful (and obstructive).
E3 How did you find the voice on the computer reading questions and answers to you?
• I found it was always useful/helpful to have the voice read out the questions and answers • I found it was sometimes useful but I didn’t need to hear the questions and answers every time • I didn’t find the voice helpful • I found the voice unhelpful and obstructive.
98 I had never used this kind/type of audio
player before and so I found it difficult when answering the questions.
• Strongly Agree • Agree • Disagree • Strongly disagree
E4 I had never used a computer before and so I found it difficult to use when answering the questions.
• Strongly Agree • Agree • Disagree • Strongly disagree
Table 7‐2: Questions compared in Audio‐SAQ and ACASI in RDS Final Survey
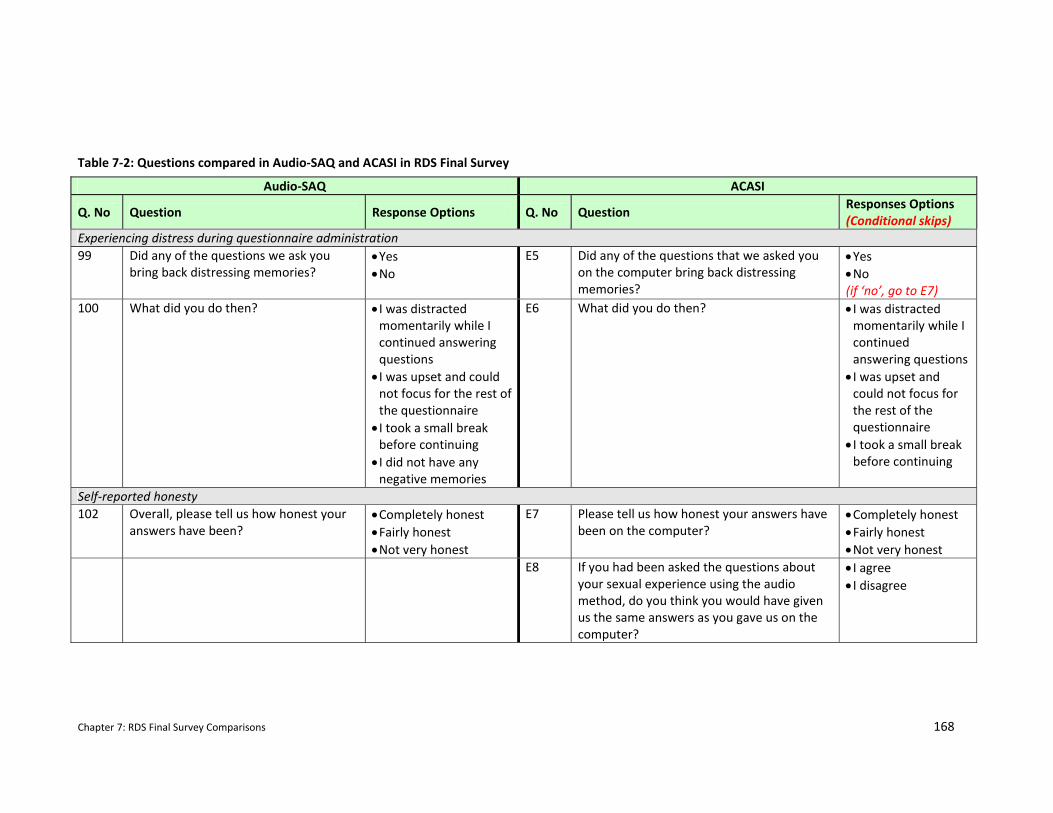
Chapter 7: RDS Final Survey Comparisons 168
Audio‐SAQ ACASI
Q. No Question Response Options Q. No Question Responses Options (Conditional skips)
Experiencing distress during questionnaire administration 99 Did any of the questions we ask you
bring back distressing memories? • Yes • No
E5 Did any of the questions that we asked you on the computer bring back distressing memories?
• Yes • No (if ‘no’, go to E7)
100 What did you do then? • I was distracted momentarily while I continued answering questions • I was upset and could not focus for the rest of the questionnaire • I took a small break before continuing • I did not have any negative memories
E6 What did you do then? • I was distracted momentarily while I continued answering questions • I was upset and could not focus for the rest of the questionnaire • I took a small break before continuing
Self‐reported honesty 102 Overall, please tell us how honest your
answers have been? • Completely honest • Fairly honest • Not very honest
E7 Please tell us how honest your answers have been on the computer?
• Completely honest • Fairly honest • Not very honest
E8 If you had been asked the questions about your sexual experience using the audio method, do you think you would have given us the same answers as you gave us on the computer?
• I agree • I disagree
Table 7‐2: Questions compared in Audio‐SAQ and ACASI in RDS Final Survey
Chapter 7: RDS Final Survey Comparisons 169
7.2.6 Study population for the RDS Final Survey
As outlined in Chapter 3, the RDS parent trial was conducted in 30 communities in seven
districts in South‐Eastern Zimbabwe. Communities were randomised to early intervention
implementation (from 2003) or delayed implementation (from 2007) using restricted
randomisation. Intervention impact was assessed after 4 years in 2007. However, during the
interim survey described in Chapters 3 through 5, it became clear that there had been
considerable out‐migration from trial communities (46%). Those who remained were likely to
be at lower risk than those who had left (HIV prevalence among remaining cohort was 1.2%
(95% CI:0.7‐1.9%)).
Therefore, the final survey was designed as an anonymous, house‐to‐house survey of a
representative sample of 18‐22 year olds living in the 30 rural study communities in Masvingo,
Manicaland and Mashonaland East in Zimbabwe. Six enumeration areas were selected in each
trial cluster. Enumeration areas were purposively selected to ensure that sites where
intervention activities had taken place were included (clinics, schools, community centres). All
18‐22 year olds who lived in the 180 enumeration areas selected were eligible for participation
in the final survey of the RDS parent trial.
7.3 Results
7.3.1 Demographic Characteristics of Final Survey Respondents
Of the 4822 eligible respondents, 97% participated in the survey (n=4672). Fifty‐five percent
were females (n=2593) (Cowan et al., 2009). The two trial arms were well balanced (49.6%
from early intervention communities). The mean age of respondents was 19.6 years which
was similar for males (mean=19.5 years) and females (mean=19.6 years). Overall, 12.9%
(605/4672) of respondents had completed primary school or less (males: 10.8%, females
14.7%). There were also lower proportions of respondents who had completed the required
four years of secondary school than in the interim survey (61.5% vs. 87%). HIV prevalence was
1.42% (95% CI: 0.94‐1.90;) for males and 7.86% (95% CI: 6.45‐9.28) for females. HSV‐2
prevalence was again lower for males at 1.60% (95% CI: 1.15‐2.04) than females at 11.32%
(95% CI: 9.63‐13.0). Eight percent of females were pregnant on the day of the survey (95% CI:
6.9‐9.0).
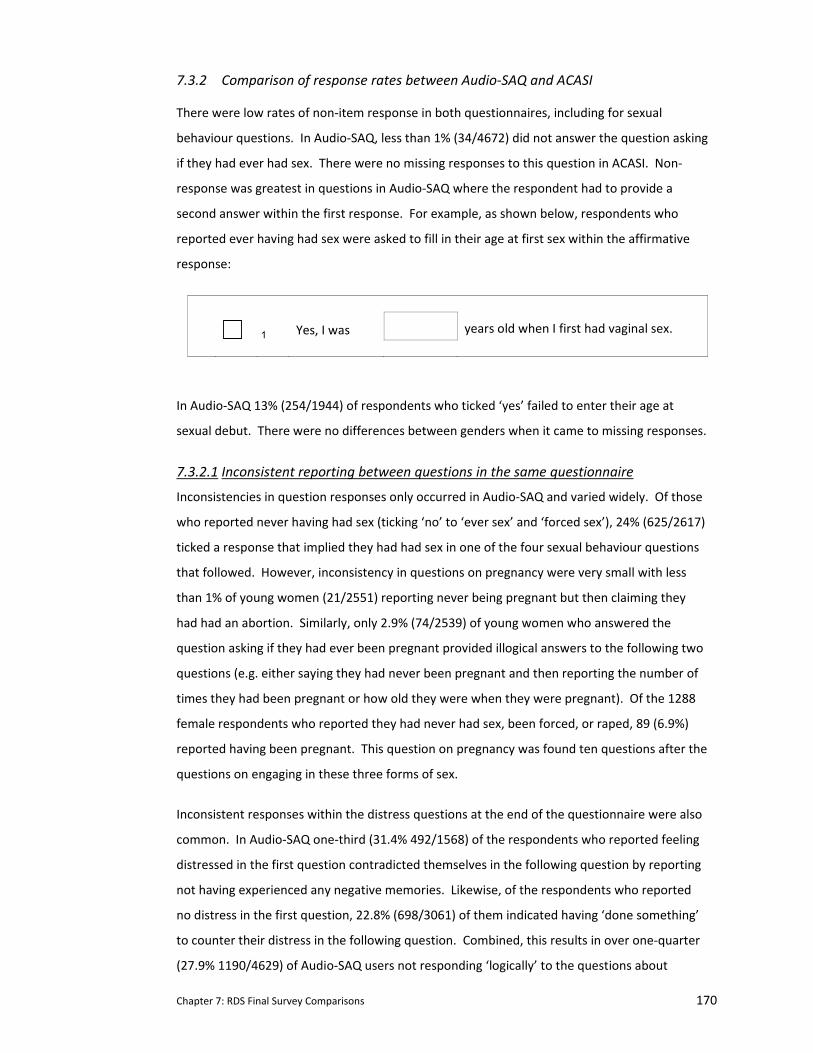
Chapter 7: RDS Final Survey Comparisons 170
7.3.2 Comparison of response rates between Audio‐SAQ and ACASI
There were low rates of non‐item response in both questionnaires, including for sexual
behaviour questions. In Audio‐SAQ, less than 1% (34/4672) did not answer the question asking
if they had ever had sex. There were no missing responses to this question in ACASI. Non‐
response was greatest in questions in Audio‐SAQ where the respondent had to provide a
second answer within the first response. For example, as shown below, respondents who
reported ever having had sex were asked to fill in their age at first sex within the affirmative
response:
1 Yes, I was years old when I first had vaginal sex.
In Audio‐SAQ 13% (254/1944) of respondents who ticked ‘yes’ failed to enter their age at
sexual debut. There were no differences between genders when it came to missing responses.
7.3.2.1 Inconsistent reporting between questions in the same questionnaire
Inconsistencies in question responses only occurred in Audio‐SAQ and varied widely. Of those
who reported never having had sex (ticking ‘no’ to ‘ever sex’ and ‘forced sex’), 24% (625/2617)
ticked a response that implied they had had sex in one of the four sexual behaviour questions
that followed. However, inconsistency in questions on pregnancy were very small with less
than 1% of young women (21/2551) reporting never being pregnant but then claiming they
had had an abortion. Similarly, only 2.9% (74/2539) of young women who answered the
question asking if they had ever been pregnant provided illogical answers to the following two
questions (e.g. either saying they had never been pregnant and then reporting the number of
times they had been pregnant or how old they were when they were pregnant). Of the 1288
female respondents who reported they had never had sex, been forced, or raped, 89 (6.9%)
reported having been pregnant. This question on pregnancy was found ten questions after the
questions on engaging in these three forms of sex.
Inconsistent responses within the distress questions at the end of the questionnaire were also
common. In Audio‐SAQ one‐third (31.4% 492/1568) of the respondents who reported feeling
distressed in the first question contradicted themselves in the following question by reporting
not having experienced any negative memories. Likewise, of the respondents who reported
no distress in the first question, 22.8% (698/3061) of them indicated having ‘done something’
to counter their distress in the following question. Combined, this results in over one‐quarter
(27.9% 1190/4629) of Audio‐SAQ users not responding ‘logically’ to the questions about
Chapter 7: RDS Final Survey Comparisons 171
experiencing a distressing memory. As a result of the computer software enforcing the skip
pattern, there were no inconsistencies in ACASI.
7.3.3 Comparison of sexual behaviour questions between Audio‐SAQ and ACASI
Of the 4672 respondents, 3.3% (n=154) completed only the Audio‐SAQ questionnaire while
96.7% (n=4518) completed both Audio‐SAQ and the subsequent ACASI questionnaire. Table 7‐
shows the rates of self‐reported sexual behaviours in both questionnaires. Table 7‐ shows the
proportion of respondents who changed their answers (in either direction) between Audio‐
SAQ and ACASI. Both tables are broken down by gender of respondent.
Respondents were more likely to report ever having had sex (males Audio‐SAQ 36.1%; 95% CI
34.0‐38.2; ACASI 42.0%; 95% CI 39.8‐44.1; females Audio‐SAQ 46.6%; 95% CI 44.6‐48.5; ACASI
53.0%; 95% CI 51.0‐55.0) and an earlier sexual debut (males who reported sexual debut age
<17 years: Audio‐SAQ 28.0%; 95% CI 24.8‐31.4; ACASI 46.2%; 95% CI 42.8‐49.6; females: Audio‐
SAQ: 27.5%; 95% CI 25.0‐30.1; ACASI 44.6%; 95% CI 41.9‐47.3) when using ACASI than Audio‐
SAQ. There was no significant difference between the two delivery modes in terms of
reporting condoms at last sex or numbers of sexual partners in their lifetime or in the last 12
months although in almost all cases it appeared that reporting of socially undesirable
responses was more common in ACASI.
7.3.3.1 Response Conversions between Audio‐SAQ and ACASI This section examines those participants who changed their response to questions asked first
in Audio‐SAQ and then in ACASI. Table 7‐ presents the number of conversions by direction of
change between the two questionnaire delivery modes. A total of 4484 respondents answered
the questions on ever engaging in sex (consensual and forced) in both questionnaire delivery
modes. Of the 11.3% (n=505) that changed their response to these questions between the
two methods, 78.4% (95% CI 74.6‐81.9%) of them positively converted their answer from ‘no’
to ‘yes’. When asked about their age of sexual debut, 30.2% (95% CI 28.0‐32.4%) positively
converted, reducing their age of sexual debut on ACASI, compared to 13.9% (95% CI 11.0‐
17.2%) of respondents who negatively converted increasing their age of sexual debut between
Audio‐SAQ and ACASI.
Whilst the proportion of respondents changing their answers looks quite different, this falsely
assumes that the observations are independent. Statistical comparison of discordant pairs
between the two methods using McNemar’s test indicated that there was no statistically
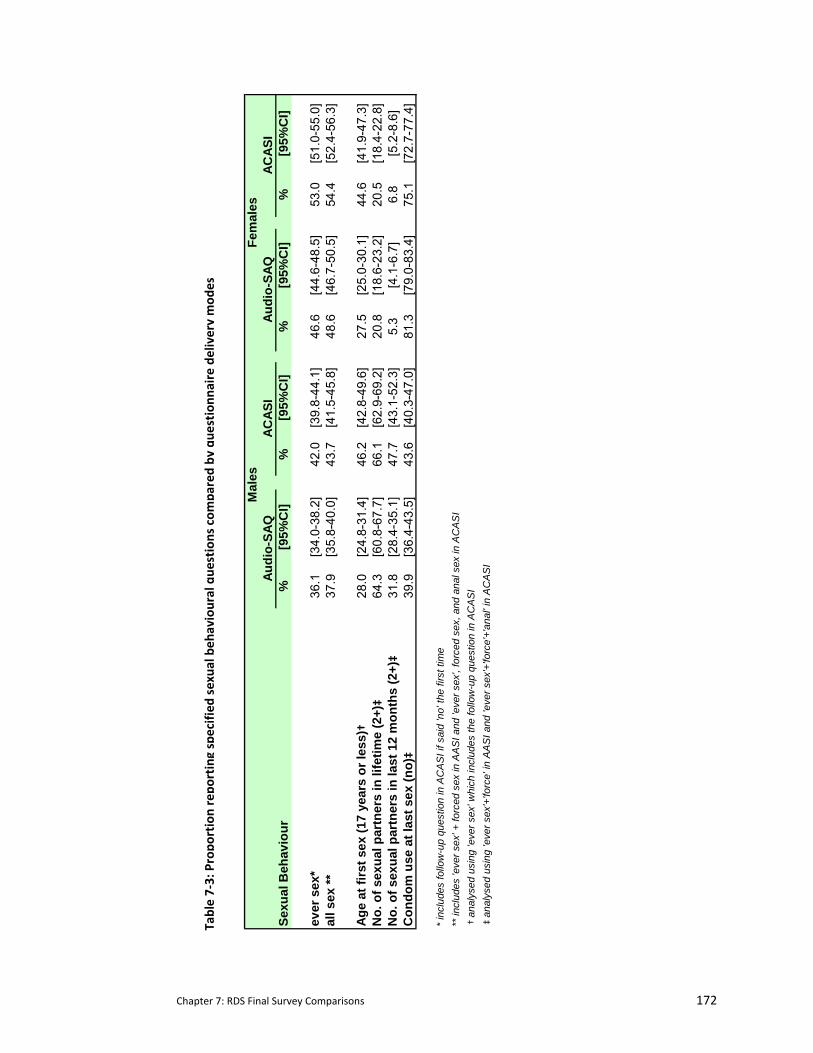
Chapter 7: RDS Final Survey Comparisons 172
Table 7‐3: Propo
rtion repo
rting specified
sexua
l beh
avioural que
stions com
pared by
que
stionn
aire delivery mod
es
Sexu
al B
ehav
iour
%[9
5%C
I]%
[95%
CI]
%[9
5%C
I]%
[95%
CI]
ever
sex
*36
.1[3
4.0-
38.2
]42
.0[3
9.8-
44.1
]46
.6[4
4.6-
48.5
]53
.0[5
1.0-
55.0
]al
l sex
**37
.9[3
5.8-
40.0
]43
.7[4
1.5-
45.8
]48
.6[4
6.7-
50.5
]54
.4[5
2.4-
56.3
]
Age
at fi
rst s
ex (1
7 ye
ars
or le
ss) †
28.0
[24.
8-31
.4]
46.2
[42.
8-49
.6]
27.5
[25.
0-30
.1]
44.6
[41.
9-47
.3]
No.
of s
exua
l par
tner
s in
life
time
(2+)‡
64.3
[60.
8-67
.7]
66.1
[62.
9-69
.2]
20.8
[18.
6-23
.2]
20.5
[18.
4-22
.8]
No.
of s
exua
l par
tner
s in
last
12
mon
ths
(2+)‡
31.8
[28.
4-35
.1]
47.7
[43.
1-52
.3]
5.3
[4.1
-6.7
]6.
8[5
.2-8
.6]
Con
dom
use
at l
ast s
ex (n
o)‡
39.9
[36.
4-43
.5]
43.6
[40.
3-47
.0]
81.3
[79.
0-83
.4]
75.1
[72.
7-77
.4]
* in
clud
es fo
llow
-up
ques
tion
in A
CA
SI i
f sai
d 'n
o' th
e fir
st ti
me
** in
clud
es 'e
ver s
ex' +
forc
ed s
ex in
AA
SI a
nd 'e
ver s
ex',
forc
ed s
ex, a
nd a
nal s
ex in
AC
AS
I†
anal
ysed
usi
ng 'e
ver s
ex' w
hich
incl
udes
the
follo
w-u
p qu
estio
n in
AC
AS
I‡
anal
ysed
usi
ng 'e
ver s
ex'+
'forc
e' in
AA
SI a
nd 'e
ver s
ex'+
'forc
e'+'
anal
' in
AC
AS
I
Mal
esFe
mal
esAu
dio-
SAQ
ACAS
IAu
dio-
SAQ
ACAS
I
Chapter 7: RDS Final Survey Comparisons 173
significant evidence of method effect for questions on lifetime number of partners, partners in
the last 12 months, and condom use at last sex among females (p=0.4558, 0.1409, 0.0169
respectively). However, for questions on ever sex and age of sexual debut, there was strong
evidence (p<0.001) of a difference in the proportion of discordant pairs. The proportion of
ACASI users reporting ‘ever sex’ increased by 6% (males 5.9%; 95% CI 4.3‐7.5, females 6.2%
95% CI 5.0‐7.4). Likewise, there was a 20% increase in reporting of age of sexual debut
(males=20.3%; 95% CI 17.0‐23.6; females=19.9%; 95% CI 17.4‐22.4). Males also showed strong
evidence of a difference in the proportion of discordant pairs (p<0.001) in numbers of partners
in the last 12 months and in their lifetime with reporting in ACASI increasing by 5.3% (95% CI
2.5‐8.1) for lifetime number of partners and 9.0% (95% CI 4.8‐13.2) for partners in the last 12
months.
7.3.3.2 Response conversion within ACASI There was one instance where participants could change their response within the
questionnaire. In ACASI, participants who answered ‘no’ to the question on ever having sex
were immediately asked this question a second time, emphasizing the difficulties in answering
this question but reminding participants of its importance. Nine percent (234/2579) of
respondents who reported not being sexually active changed their response when asked this
question a second time. There were no differences between genders (males 8.6% 95% CI 7.1‐
10.3; females 9.5% 95% CI 8.0‐11.2).
7.3.4 Comparison of biomarkers with self‐reported behaviours
There were 608 respondents with a positive biomarker for sexual activity, the majority of
whom (90.5%) were females. The proportion of respondents with a positive biomarker for
sexual activity who reported never having sex was greater in Audio‐SAQ than ACASI (Audio‐
SAQ 22.3%; 95% CI 18.9‐25.8 vs. ACASI 15.7%; 95% CI 12.7‐18.7; p<0.001). Despite larger
numbers of biomarkers among respondents in the final survey, the proportion of males
infected with HIV and/or HSV‐2 remained low (9.5%). Therefore while there was a trend
towards lower prevalence on ACASI, we were unable to detect a statistically significant
difference between biomarker prevalence among males who reported never having had sex on
Audio‐SAQ (38.1%; 95% CI 25.4‐52.3) and ACASI (33.9%; 95% CI 21.8‐47.8). By contrast we did
find a higher prevalence of biomarkers among young women who reported they had never
had sex on Audio‐SAQ (20.8%; 95% CI 17.2‐24.4) than ACASI (13.8%; 95% CI 11.0‐17.1)
suggesting that female Audio‐SAQ respondents were more likely to under‐report that they had
had sex.
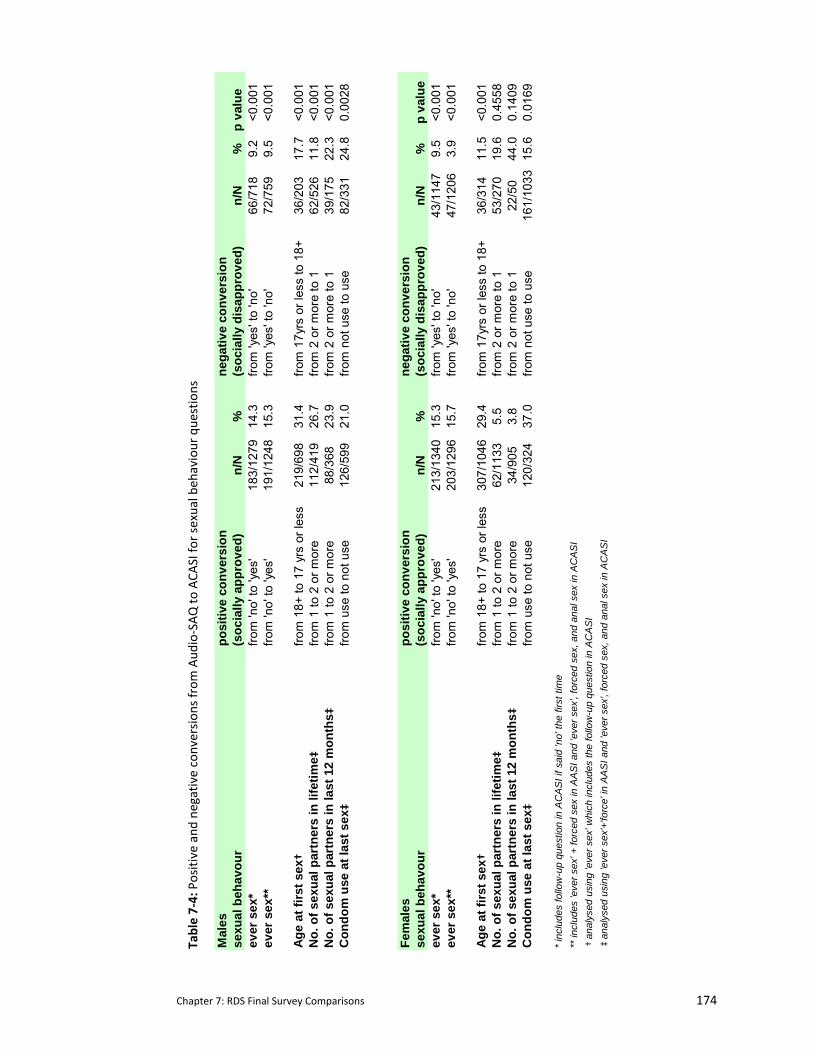
Chapter 7: RDS Final Survey Comparisons 174
Table 7‐4: Positive and
negative conversion
s from
Aud
io‐SAQ to
ACA
SI fo
r sexual beh
aviour que
stions
Mal
espo
sitiv
e co
nver
sion
nega
tive
conv
ersi
onse
xual
beh
avou
r(s
ocia
lly a
ppro
ved)
n/N
%(s
ocia
lly d
isap
prov
ed)
n/N
%p
valu
eev
er s
ex*
from
'no'
to 'y
es'
183/
1279
14.3
from
'yes
' to
'no'
66/7
189.
2<0
.001
ever
sex
**fro
m 'n
o' to
'yes
'19
1/12
4815
.3fro
m 'y
es' t
o 'n
o'72
/759
9.5
<0.0
01
Age
at fi
rst s
ex†
from
18+
to 1
7 yr
s or
less
219/
698
31.4
from
17y
rs o
r les
s to
18+
36/2
0317
.7<0
.001
No.
of s
exua
l par
tner
s in
life
time ‡
from
1 to
2 o
r mor
e11
2/41
926
.7fro
m 2
or m
ore
to 1
62/5
2611
.8<0
.001
No.
of s
exua
l par
tner
s in
last
12
mon
ths ‡
from
1 to
2 o
r mor
e88
/368
23.9
from
2 o
r mor
e to
139
/175
22.3
<0.0
01C
ondo
m u
se a
t las
t sex
‡fro
m u
se to
not
use
126/
599
21.0
from
not
use
to u
se82
/331
24.8
0.00
28
Fem
ales
posi
tive
conv
ersi
onne
gativ
e co
nver
sion
sexu
al b
ehav
our
(soc
ially
app
rove
d)n/
N%
(soc
ially
dis
appr
oved
)n/
N%
p va
lue
ever
sex
*fro
m 'n
o' to
'yes
'21
3/13
4015
.3fro
m 'y
es' t
o 'n
o'43
/114
79.
5<0
.001
ever
sex
**fro
m 'n
o' to
'yes
'20
3/12
9615
.7fro
m 'y
es' t
o 'n
o'47
/120
63.
9<0
.001
Age
at fi
rst s
ex†
from
18+
to 1
7 yr
s or
less
307/
1046
29.4
from
17y
rs o
r les
s to
18+
36/3
1411
.5<0
.001
No.
of s
exua
l par
tner
s in
life
time ‡
from
1 to
2 o
r mor
e62
/113
35.
5fro
m 2
or m
ore
to 1
53/2
7019
.60.
4558
No.
of s
exua
l par
tner
s in
last
12
mon
ths ‡
from
1 to
2 o
r mor
e34
/905
3.8
from
2 o
r mor
e to
122
/50
44.0
0.14
09C
ondo
m u
se a
t las
t sex
‡fro
m u
se to
not
use
120/
324
37.0
from
not
use
to u
se16
1/10
3315
.60.
0169
* in
clud
es fo
llow
-up
ques
tion
in A
CA
SI i
f sai
d 'n
o' th
e fir
st ti
me
** in
clud
es 'e
ver s
ex' +
forc
ed s
ex in
AA
SI a
nd 'e
ver s
ex',
forc
ed s
ex, a
nd a
nal s
ex in
AC
AS
I†
anal
ysed
usi
ng 'e
ver s
ex' w
hich
incl
udes
the
follo
w-u
p qu
estio
n in
AC
AS
I‡
anal
ysed
usi
ng 'e
ver s
ex'+
'forc
e' in
AA
SI a
nd 'e
ver s
ex',
forc
ed s
ex, a
nd a
nal s
ex in
AC
AS
I
Chapter 7: RDS Final Survey Comparisons 175
7.3.5 Comparison around ease of questionnaire completion and questionnaire comprehension.
As shown in Table 7‐2, there were four questions that addressed ease of comprehension and
mode operation for that questionnaire delivery mode. The majority of respondents in both
modes reported finding the questions asked of them easy to understand (87.8%; 95% CI 86.8‐
88.7%) and easy to complete (85.8%; 95% CI 84.8‐86.8%). Just under ten percent of
respondents reported finding Audio‐SAQ was not easy to complete but ACASI easy to complete
(8.5%; 95% CI 7.7‐9.4%). However, this question may not have been well understood. When
asked in a subsequent question if they had “found it difficult to use the audio player/laptop,” a
greater percentage of respondents reported difficulty using both modes (28.6%; 95% CI 27.3‐
30.0). Data suggests that if respondents found Audio‐SAQ difficult to use, they were more
likely to find ACASI challenging. Of the respondents who found Audio‐SAQ difficult to use,
79.3% also found ACASI problematic. However, the reverse scenario was not the case; only
56.1% of respondents who found Audio‐SAQ easy reported no difficulties with ACASI.
The presence of a voice accompanying the written script seemed beneficial to most. A large
proportion of respondents found the voice always assisted in comprehension in both
questionnaire delivery modes (Audio‐SAQ 87.4%; 95% CI 86.4‐88.4); ACASI 88.5%; 95% CI 87.5‐
89.4. About 8% found it sometimes helpful to have the voice present (Audio‐SAQ 8.3%; 95% CI
7.5‐9.1; ACASI 9.2%; 95% CI 8.4‐10.1). In ACASI, we asked one final additional question as to
whether respondents believed they would have answered questions similarly in the Audio‐SAQ
version (see Table 7‐2 QE8) The majority (82.5%) believed they would have. However, just
under 11% (401/3703) of them did change their answers in the question on ever having sex.
7.3.6 Reporting honestly
When asked how honest they had been in their self‐reports, most respondents stated that
they had been completely honest during both questionnaires (85.35%; 95% CI 85.4‐86.4%).
However, for those respondents who reported that they were not sexually active but who
possessed a biomarker for sexual activity, 83.6% (n=107/128) of Audio‐SAQ users and 85.9%
(n=79/92) of ACASI users reported being ‘completely honest’ on the questionnaire.
Chapter 7: RDS Final Survey Comparisons 176
7.4 Summary
In deciding to use two questionnaire delivery modes in the final survey, an opportunity arose
to examine some additional mode comparisons. Biomarkers were used in all previous RDS
surveys (including the feasibility study) to compare self‐reports against biological evidence of
sexual activity. Unfortunately, in the QDM trial, the low prevalence of positive biomarkers
coupled with the small sample size who completed the questionnaire twice rendered it
impossible to compare incongruities between the questionnaire delivery modes. However, in
the final survey, the opportunity for this comparison was again possible. Firstly all participants
completed both questionnaires which were taken immediately after each other and included a
few repeated questions on sexual behaviours. In addition, participants were slightly older
which offered the possibility of an increase in exposure to biological evidence.
We continued to find an increase in reporting sexual behaviours in ACASI over Audio‐SAQ. The
larger sample size allowed us to compare the direction of effect by gender; we found no
evidence that males are different from females.
There is a statistically significant difference between the two modes in the proportion of
respondents who had a positive biomarker and reported never having sex. The proportion of
Audio‐SAQ users producing this difference was greater than with ACASI users. In addition,
female respondents with evidence of a biomarker for sexual activity were less likely to report
not having had sex on ACASI.
Inconsistencies in reporting were still apparent in Audio‐SAQ. This was most often seen in
questions where additional information was requested. Respondents in Audio‐SAQ also
struggled with questions where an additional response was created to compensate for not
having a skip pattern, creating inconsistencies between the response to the first question and
those that followed.
As found in the QDM trial, the addition of an audio component was appreciated by almost all
respondents. Levels of self reported honesty were high; however this reporting seems less
reliable when the majority of respondents with positive biomarkers for sexual activity who
self‐reported not being sexually active claim to have been completely honest (83‐85%).
The following chapter concludes the research for this thesis by framing the results (the QDM
trial, final survey results and findings from the systematic review) within our broader
knowledge of the impact of questionnaire delivery mode on sensitive questions in
development country settings.
Chapter 8: Discussion 177
8 DISCUSSION
8.1 Summary of thesis
In this thesis I have explored one central question: does the interview mode affect a
participant’s ability to respond to sensitive questions, and if so, are we able to shed any light
on the determinants of this effect? In particular, I focus on adolescents’ reporting of sexual
behaviours living in rural Zimbabwe, where conservative cultural mores render it difficult for
youth to report engaging in sexual activity. I conducted a randomized control trial to compare
four questionnaire delivery modes (ICVI: interviewer administered questionnaire with
confidential voting interview, SAQ: self‐administered questionnaire using paper and pen,
Audio‐SAQ: audio self administered questionnaire, and ACASI: audio computer –assisted
survey instrument). Referred to here as the QDM trial, I examined item response rates and
rates of reporting for sensitive behaviours (seven sexual behaviours were measured a priori,
six other sensitive topics were measured post hoc). I was also able to examine reliability of
responses by having some participants take the questionnaire a second time a week later.
Biomarkers for sexual activity were collected which assisted in partially establishing the validity
of self‐reported sexual data. This experimental evaluation was supported by additional
quantitative and qualitative data that provided feedback from the participants on the
feasibility and acceptability of the different modes. A smaller follow‐up piece of research was
carried out comparing similar questions in the two modes used during the final survey of the
parent trial.
Research on comparative methodology from North America and Western Europe coupled with
what limited information was available on comparing methods in resource‐poor settings was
used to inform the design of this trial. Research for this thesis was conducted at a time when
there was an emerging interest in questionnaire delivery modes in developing country settings
where the HIV epidemic is at its worst and the burden of new infection remains greatest
amongst young people. Not only were delivery modes being improved and developed (Jaya et
al., 2008; Gregson et al., 2002b; Hanck et al., 2008), but methods previously ignored were
being evaluated in a small number of comparative studies. Upon completion of this trial, I
conducted a systematic review of comparative research on questionnaire delivery mode
administration in developing countries that reported on sexual behaviours to see how the field
had developed over the timeframe of the QDM trial. This research contributes to that
expanding body of knowledge.
Chapter 8: Discussion 178
The pattern of results from this QDM trial strongly suggest that Audio‐SAQ and ACASI offer a
number of advantages in assisting participants to honestly self‐disclose sensitive information.
Audio‐SAQ was relatively inexpensive and logistically straightforward to use. Audio‐SAQ’s
reporting of sensitive behaviours was similar to that of ACASI, which overall, provided the
highest levels of reporting of sensitive behaviours. While SAQ was the least expensive and
logistically simplest to administer, it had the worst item and global response rate and the
lowest levels of reporting of socially censured behaviours. One particular disadvantage for
both SAQ and Audio‐SAQ was that when skip patterns were used the item response rate fell
for those questions. As the potential for errors are greatest following a manual skip, SAQ and
Audio‐SAQ provided more opportunity for inconsistency between answers within different
parts of the questionnaire. Audio‐SAQ’s inability to effectively handle skip patterns also
hampered its collection of more complex data, something ACASI was able to accomplish with
fluency. Software programming in ACASI allowed inconsistent answers to be highlighted to the
respondent. ACASI’s additional advantage was that data were entered directly into the laptop
reducing subsequent data entry and processing time. While using the ballot sheet assisted
participants in answering sensitive questions in the interviewer‐administered mode, the rates
of reporting for many sensitive behaviours using this mode were still lower than those found in
the self‐administered modes, particularly ACASI. In addition, by using the ballot sheet to
increase the respondent’s sense of privacy, it simultaneously blinded the interviewer to the
participant’s responses making it impossible to ensure that questions were answered and also
to make use of skip patterns around sexual behaviours.
In addition to the a priori analyses on specified sexual behaviours that is the main focus of the
thesis I also conducted a post hoc analysis on questions relating to other issues also recognized
to be sensitive in nature. As shown in Chapter 5, use of Audio‐SAQ and ACASI versions of the
questionnaire increased reporting of other sensitive issues including those relating to mental
health, poverty, drug and alcohol use and circumcision.
Largely as a result of financial constraints, we used two QDMs for the final survey. We used
Audio‐SAQ to complete the majority of the questionnaire which did not require skip patterns.
Participants then completed a shorter questionnaire on ACASI which was used to collect that
data which required complex skips. As would be expected given these two modes had similar
rates of reporting sensitive behaviours in the QDM trial, we did not find large differences in
reporting of sensitive behaviours between these two modes. However, because of the larger
sample size in the final survey and the older age of the survey participants we were able to
explore the effect of gender on survey completion using the two methods. In addition we were
able to re‐explore the relationship between biomarkers, behaviour reporting and
Chapter 8: Discussion 179
questionnaire delivery mode. We found no gender effect around reporting of sensitive
behaviours. However, we did find a statistically significant difference between the two modes
for respondents who had a biomarker for sexual activity but reported never having had sex.
This inconsistency was lower in ACASI than in Audio‐SAQ. Results from the QDM trial and the
final survey concur with data from the systematic review, which strongly suggests that ACASI
improves the validity of reporting of sexual behaviours in developing country settings
8.2 Validity of self‐reported data
Sensitive questions are those that create a feeling of discomfort within the respondent.
Despite cultural and individual differences there are certain topics that are universally
considered to be sensitive (Tourangeau et al., 2007; Brener et al., 2003). Sexual behaviour is
one of these. One mechanism for establishing whether a topic is sensitive or not is to explore
whether there are differences in rates of reporting likely due to social desirability bias (Moum,
1998; Klimes‐Dougan, 1998). Using these guidelines, this research highlights that other topics
such as poverty, psychological wellbeing, and orphaning are also sensitive and prone to similar
reactions of discomfort from respondents.
One influential model outlining the survey response process put forth by Tourganeau argues
that there are four major components that drive a response (Tourangeau, 1984). The
respondent must first understand the question as it was intended by the researcher, retrieve
from personal memory the requisite information to answer the question, and finally, integrate
this information and report it with minimal distortion. Sensitive questions can impact the
respondent in all four of these components which are driven by two major theoretical
perspectives that dominate the field of validity measurement: cognitive and situational
theories (Brener et al., 2003; Tourangeau et al., 2007; Catania, 1999). Cognition focuses on the
intellectual processes that affect the accuracy of self‐reported behaviours. These include
individual recall or memory and the respondent’s ability to correctly follow skip patterns.
Situational theory concentrates its attention on the impact that social desirability and
interviewing conditions have on the respondent’s ability to answer sensitive questions. While
these theories are not mutually exclusive, they provide a useful framework in which to analyse
the data collected here.
8.3 Cognitive Influences
8.3.1 Recall
The literature is replete with studies demonstrating that recall ability is not consistent over
time and that frequency of behaviours is more difficult to recall than the behaviours
Chapter 8: Discussion 180
themselves. As with other populations, adolescents struggle more with recalling frequency of
sexual behaviours rather than the act itself (Catania et al., 1990; McFarlane & St.Lawrence,
1999; Hearn, O'Sullivan, & Dudley, 2003; Rodgers, Billy, & Udry, 1982). Our data were
collected from adolescents whose sexual experiences did not occur in the distant past
suggesting that information recall was likely to be less of a barrier to accurate responses here.
In our qualitative data, participants did not mention struggling to remember their sexual
experiences; they instead highlighted how awkward it was to report it and to read or hear the
words describing sexual behaviours.
8.3.2 The role of skip patterns:
One major critique of self‐administered questionnaires is the difficulty participants have in
following skip patterns within a questionnaire (Turner et al., 1995; Al‐Tayyib et al., 2002). My
research was able to examine the effect of skip patterns in detail in the QDM trial and found
that our participants also had trouble following skip instructions in self‐administered questions
recorded on paper. My analysis suggests that this may be in part due to social desirability bias
as skips on less sensitive questions were almost always handled correctly. However, it should
be noted that these less sensitive skips were also easier to complete as the skip normally
included only one additional follow‐up question. In a study from the U.S. among adults (18‐45
years), Al Tayyib and colleagues examined the association of literacy on skip errors and
logically inconsistent answers (Al‐Tayyib et al., 2002). Corroborating the results presented
here, skip errors were found to be more common on paper forms. And while literacy was
associated with correct skip performance, the complexity of the skip pattern was also
influential. The alcohol and sexual behaviour sections of their questionnaire contained the
most complicated skip patterns. Among those participants who exhibited high literacy
proficiency, 25% of them produced skip errors in the alcohol section and 40% of them
generated errors in the sexual behaviour section.
In Zimbabwe, students are exposed to skip patterns early on in their education when they take
their final primary school exams at the end of Grade 7 (year 7). Moreover, as outlined in
Chapter 4, all the skip patterns were pre‐tested and found to be clearly understood during the
formative cognitive interview process. However, as found in Al Tayyib’s study, our questions
on orphaning and sexual behaviour were the most complex and had the highest rates of skip
errors. Given that both of these topics are sensitive it is difficult to completely disentangle
participants’ technical inability to skip correctly from their reluctance to answer the question.
Our data showing that adolescents have trouble with manual skips is also supported by data
from Palen and her colleagues in South Africa which indicated higher rates of missing data in
Chapter 8: Discussion 181
SAQ (11.5%) than using PDAs (0.8%) (Palen et al., 2008a). Their data lend credence to the
possibility of the error emanating from technical inability. Another possibility is that questions
appearing individually on a screen are more difficult to ignore. More research is needed to
unravel the unique impact of these determinants. ACASI/PDAs is the one self‐administered
mode where skips are programmed automatically and are therefore removed from the
respondent’s control. Not surprisingly, as observed with Palen’s data in this mode, skips in the
QDM trial were always handled well.
In the final survey, where there were no skips administered during the first Audio‐SAQ
questionnaire, the inconsistency in reporting was of a different type to that seen in the QDM
trial, with participants providing illogical responses in follow‐up questions. For example, there
were four questions on sexual risk behaviours that followed the two questions on consensual
and forced sex. The most ‘logical’ choice for a participant who had reported never having had
either consensual or forced sex was to choose the last response option ‘I have never had sex’
in the following four questions. However, between 4‐9% reported having used a condom at
first or last sex or reported at least one lifetime partner or partner in the last 12 months.
Similar findings were observed by Plummer among youth in Tanzania where 7% of
respondents provided illogical responses in a question set (Plummer et al., 2004b). While this
inconsistency is not a result of an incorrect skip, it is not clear if the error is purely cognitive
and a result of a lack of understanding or if social desirability bias is also implicated. Again,
when follow‐up questions were asked in ACASI there were no illogical responses. This was not
because the respondent was more capable (they were the same respondents) but because the
programme did not allow the respondent to complete that question.
In addition, for those who had initially reported no sexual activity we asked them this question
a second time, re‐iterating the importance of the data being collected and reminding them
that confidentiality was being respected. When offered this second chance, reports of sexual
activity increased. However this increase differed by mode ranging from 1.1% in SAQ to 2.7%
in Audio‐SAQ, and 4.8% in ACASI. Again, it is not completely possible to disentangle the mode
effect from the respondent’s desire to be perceived to be abiding by the social norm. In SAQ
and Audio‐SAQ, the second question was found 13 questions and six to seven pages later in
the questionnaire booklet. Between 15.9% of SAQ users and 18.2% of Audio‐SAQ users who
reported no sexual experience in the first questions missed the second question entirely. This
large gap between the questions was necessary so as to ensure that those who reported
sexual activity in the first question could immediately proceed to the next set of questions
related to their sexual experiences. This situation highlights the sometimes difficult choices
made by researchers trying to maximise sexual behaviour information in the easiest manner
Chapter 8: Discussion 182
for different sub‐populations when administering questionnaires on paper. In ACASI, however,
the skip was pre‐programmed and did not engage the respondent’s cognitive abilities.
In the final survey, in the ACASI segment of the questionnaire, for those respondents who
responded initially that they had never had sex, we also asked them this question a second
time. Again, there was an increase in the reporting of this behaviour. However, can we say
that this increase makes the data ‘unreliable’ or just that it emphasises how difficult it is for
respondents to report their sexual activity? Certainly the context in which we phrased this
second question assumed that social desirability was playing a strong role in hindering
participants from answering this question accurately.
8.3.3 Implications of controlling skips in ACASI
It is important to note when skips are controlled, it doesn’t make the respondent more
reliable, it instead controls for their potential unreliability. That is to say that when we control
skip patterns within computer‐administered questionnaires we remain ignorant of the
cognitive reasons why individuals might report inconsistently because we don’t allow it to
happen. While pre‐programming allows our data and analysis to be ‘cleaner’ it does not
enlighten us as to the determinants of these inconsistencies which we witness in other self‐
administered modes. Future research could allow ACASI to incur inconsistent reporting,
notifying researchers of its occurrence which could then be explored qualitatively. Results of
this qualitative analysis would improve our understanding of the reasons underpinning
individuals inability to complete skips satisfactorily.
8.3.4 Terminology and use of an audio component
Considerable research has been conducted around what is perceived as appropriate sexual
behavioural terminology (Wellings et al., 2001; Elam et al., 2003; Michaud, Narring, & Ferron,
1999; Mavhu et al., 2008; Spencer, Faulkner, & Keegan, 1988; Ponce et al., 2009). What cuts
across all the research carried out among varied cultural contexts is that our sexual
terminology is limited and very formalized in comparison with the rest of our descriptive
vocabulary. In addition, in more conservative cultures these terms are rarely seen in print or
spoken aloud (Mavhu et al., 2008; Elam et al., 2003). As seen in Chapter 4, terms for vaginal
sex are vague in Shona and require the use of specific anatomical terms to render them
explicit. Substantial work was carried out during the course of the research for this thesis to
ensure that terminology for sexual behaviours was understandable for this population of
young Zimbabweans (Mavhu et al., 2008).
Chapter 8: Discussion 183
Qualitative data suggest that just as meaningful as correct terminology in improving
respondent’s cognition is the use of an audio component. Respondents repeatedly reiterated
how helpful it was to both hear and see the questions and responses. This was true for all
three methods (ICVI, Audio‐SAQ, and ACASI) which included an oral component. Moreover,
the only difference between SAQ and Audio‐SAQ was the audio component and in most cases
the rates of reporting for sensitive behaviours were greater among Audio‐SAQ users than SAQ
users. This sentiment was confirmed in the final survey with over 95% of respondents
expressing appreciation for the presence of the voice. These data support information from
other studies which emphasize the impact the auditory mechanism has on improving a
participant’s understanding of little used terms (Elam et al., 2003; Wellings et al., 2001; Pluhar
et al., 2007; Boekeloo et al., 1994).
The effect that the gender of the voice has on accuracy of reporting is less certain. In an
experimental lab study, Nass provides evidence that the gender of a voice, even computer‐
generated, carries with it societal gender stereotypes (Nass, Moon, & Green, 1997). In all of
the questionnaire surveys described within this thesis (feasibility, baseline, interim and final
surveys for the RDS parent trial) we chose to match the gender of the audio component to that
of the respondent’s. This decision was based on research which suggests that while the
evidence is less clear for men, women are more likely to report sensitive information to
women (Wellings et al., 2001; Konings et al., 1995). Apart from the fact that participants did
not specifically comment on the gender of the voice, our data do not broaden our knowledge
on this matter and more research into this area is required. This is particularly relevant in
developing country settings where the cultural influence of gender might render existing
research from the US less generalizable.
8.3.5 Level of literacy and its impact on ACASI
Data continue to suggest that literacy remains a limiting factor for all self‐administered modes
(Turner et al., 1995). This includes ACASI where in two studies in India, researchers were
concerned that poorer literacy would affect a participant’s ability to use ACASI (Jaya et al.,
2008; Potdar et al., 2005). In both studies, researchers failed to find uniformly higher reports
of reporting for all sensitive sexual behaviours. However, neither study assesses the reasons
behind this difference; they are just noted. Moreover, while not uniform, there were a
number of important sensitive questions where increased reporting was found. Potdar’s
conclusion that literacy affects responses is based on their comparison that reporting in
college‐educated males was uniformly increased whereas a similar consistency was lacking
among males living in slum areas. However there is no mention that males living in slums were
Chapter 8: Discussion 184
unable to use the computers or that their lower reporting of sexual behaviours was due to
having a lower literacy. So it is not necessarily literacy that is causing this difference in
reporting of sensitive behaviours.
Literacy does not seem to have been a limitation in the QDM trial where adolescents were
largely literate. In the interim survey within which the QDM trial was conducted, participants
were all members of the main trial cohort which recruited from Form 2 classes (in their ninth
year of schooling) at the start of the trial. When they took part in the interim survey in 2006,
the majority (86%) were either still in school or had completed the requisite four years of
secondary education. Similarly high literacy rates were found during the final survey, where
participants were recruited from the community at large which increased the possibility that a
larger proportion of survey participants would have been illiterate. However, the proportion
of adolescents who had completed Form 2 and more, while considerably less than at the
interim survey, remained high (73%). Zimbabwe has traditionally had relatively high rates of
secondary school attendance when compared to other countries in Africa (United Nations
Children's Educational Fund (UNICEF), 2008).
Another element of literacy is its practical aspect. One feature of this is illustrated in Al‐
Tayyib’s and supported by our research surrounding the inability of highly literate respondents
to correctly complete complex skip patterns in paper‐based self‐administered questionnaires
(Al‐Tayyib et al., 2002). Practical literacy can also be demonstrated through the competency of
questionnaire tools such as audio players (MP3 and CD players) or computers (desktops,
laptops, and PDAs). Overall, post‐survey data collected during the QDM trial suggest that
respondents generally felt capable using these tools with a minority of respondents reporting
having some difficulty using either the CD player or the laptop (Audio‐SAQ=10%; ACASI=4%
(see Table 6‐1). In addition, the practicality of Audio‐SAQ was improved with the use of MP3
players during administration of the final survey questionnaire. However final survey data also
suggests that there were still a considerable minority (28.6%) of respondents who reported
difficulties using the two methods. Additional qualitative data would assist in better
understanding how to support these respondents.
While post‐survey data suggests that most participants did not find using the laptop difficult,
given that computers were not so readily available in the study population (as evidenced by
the feelings of novelty they expressed qualitatively), it is possible that participants claimed
ACASI was easy to use because they thought it would reflect favourably upon them. Other
research from populations in the US where social desirability bias may be heightened (i.e.
injecting drug users) suggests that these respondents also thought computers were easy to
Chapter 8: Discussion 185
use, but the potential role of social desirability bias was not examined (NIMH Multisite
HIV/STD Prevention Trial for African American Couples Group, 2008; Metzger et al., 2000a). It
was also not possible within the confines of this QDM trial to conclusively determine whether
social desirability played a role in how respondents chose to answer the questions around ease
of use during the qualitative research and in the final survey questionnaire. What we can say is
that there were very few instances where the data from ACASI was unusable (six ACASI
questionnaires in the QDM trial). Greater clarity around this aspect would be useful if ACASI’s
use is to be encouraged.
8.4 Situational Influences
Social psychological research argues strongly that individuals tend to present an outward
image that equates with their cultural norm (Goffman, 1959). As such, questions about a
sensitive topic create discomfort on the part of the respondent. In methodological reviews
two reasons dominate the explanations given for decreased reporting of sensitive behaviours:
embarrassment from reporting a sensitive behaviour to an interviewer or feeling threatened
that its disclosure will induce punishment (Catania, 1999; Brener et al., 2003; Tourangeau et
al., 2007). In this study among rural Zimbabwean youth, both embarrassment and the threat
of retribution are factors that would make it difficult for youth to report their sexual
behaviour. This is particularly true of unmarried adolescent girls/women. All of the
respondents for this research came from the same cultural background, and, as rural Shona
adolescents, young women were expected to remain virgins until marriage while pre‐marital
sex was quietly condoned for their male peers. Chiefs in some areas still condone and
encourage virginity tests for girls, ‘rewarding’ young girls who remain virgins in a public
manner (e.g. by wearing a specific article or colour of clothing). The repercussions for
unmarried adolescents found to be sexually active are severe. Young girls who become
pregnant are expelled from school and often chased away from their home and expected to
move into the house of their male partner where the welcome is not guaranteed. In addition,
research conducted in the US indicates that telling untruths is part of a well practised
automatic editing process individuals employ to ensure our presentation of ‘self’ is consistent
and smooth (DePaulo, Kashby, Kirkenol, Wyer, & Epstein, 1996; DePaulo et al., 2003).
Tourangeau and Yin’s comprehensive analysis of sensitive questions indicates two main
mechanisms for easing a respondent’s difficulty in disclosing sensitive information: increasing
the privacy of the setting and increasing the privacy of the questionnaire delivery mode
(Tourangeau et al., 2007). By increasing a sense of privacy, the researcher in essence is placing
more control into the hands of the respondent (Catania, 1999). There are a number of
Chapter 8: Discussion 186
situational variables that affect the population in this QDM trial’s ability to report accurately.
Different theories concerning social desirability attribute varying degrees of importance to the
four components of a survey response mentioned earlier: comprehension, memory retrieval,
data integration and reporting of information requested (Tourangeau, 1984). The theories
differ in the main on whether they focus on the ‘psychology of the individual’ or the
‘psychology of the moment.’ This first group focuses on the psychological aspects of the
individual – how do the characteristics of an individual affect their reporting (e.g. some of us
are more affected by social desirability bias than others, some of us are jokesters, some of us
have a overly assured sense of self which makes us report with a bias but unintentionally.)
Research describing this aspect of reporting bias seem to predominantly be conducted by
researchers working out of university laboratory research settings in North America and
Europe, where funding has been allocated (Couper, Singer, & Tourangeau, 2003; Holbrook et
al., 2003; Crowne & Marlowe, 1964; Paulhus, 2002). To my knowledge, no research of this
type has occurred in resource‐poor settings where funds are limited and research occurs
predominantly in field‐based settings. This implies that we are unable to comment on the
psychology of the individual as it impacts on respondents’ answers to sensitive questions.
In contrast, work surrounding the ‘psychology of the moment’ focus instead on what
researchers can do to control the environment of the respondent overall, irrespective of a
participant’s individual characteristics. It asks, ‘how can we improve questionnaires overall so
that everyone can have an easier time answering our sensitive questions?” Work from the
QDM trial (and the final survey) fits within this arena as field‐based research is capable of
commenting on the psychology of the moment.
8.4.1 Privacy
Extensive research into social desirability indicates that respondents are more able to
acknowledge engaging in socially censured behaviours when their sense of privacy is increased
(Catania et al., 1990; Catania et al., 1996; Tourangeau et al., 2007; Boekeloo et al., 1994). Data
from this QDM trial indicates that participants appreciated the privacy they were afforded. In
this research, privacy was increased in two ways: by maximising privacy within the survey
setting and within the mode itself.
8.4.1.1 Privacy: Setting
Despite the assumption that questionnaire administration should take place in private, a
substantial number of surveys are not administered in this way. When asked, interviewers
taking part in large national American surveys report only between 40‐50% of interviews being
conducted in complete privacy with only the respondent and the interviewer present
Chapter 8: Discussion 187
(Gfroerer, Wright, & Kopstein, 1997; Silver, Abramson, & Anderson, 1986). Evidence collected
in the US suggests that an adolescent’s sense of privacy is harder to establish if the survey is
conducted in the home than in a classroom setting (Kann, Brener, Warren, Collins, & Giovino,
2002; Brener et al., 2006). While not perfect, classrooms, which we used in the feasibility and
baseline surveys of this trial, seem to offer a more suitable environment for adolescents
reporting on sensitive questions than their homes (Tourangeau et al., 2007). However, as
reported earlier in Chapter 3, Zimbabwean youth in the feasibility study and in the baseline
survey, also found classrooms a difficult environment in which they could feel private. In the
QDM trial, alternative community survey sites not linked to schools or homes were used. In
rural Zimbabwe it is difficult to find a location where each person can answer their
questionnaire in complete privacy away from everyone else; there are simply not enough
buildings to make this feasible. In the QDM trial, great attention was paid to maximizing
privacy within the setting, by having as few people as possible together and asking the
respondents to put their backs against the wall of the survey rooms minimizing any
opportunity for their responses to be visible to others. Post‐survey data from this trial
indicates that participants appreciated the privacy they were afforded even if it was not
complete. (Note that culturally, it is rare in Zimbabwe for anyone to be ‘alone’. Children sleep
in rooms with others until they get married, youth herd cattle together, etc).
Moreover, respondents taking part in this research highlighted the importance of privacy in
improving their ability to honestly self‐disclose sensitive information. Interim survey
participants were asked to compare these community‐based questionnaire settings against
those in baseline (classrooms set up in exam conditions) and were appreciative of the smaller
rooms used during the interim survey (a survey feature that was maintained during final
survey administration). As shown in Chapter 6, respondents who reported not having as much
privacy as they wanted were more likely to have been in survey rooms which included
participants of both genders.
Research in the US has shown that privacy can be influenced by the presence of others during
survey administration, particularly if the individual exerts power over the respondent’s life
(such as a parent) (Aquilino, Wright, & Supple, 2000). Research in Kenya however, suggests
that while a quarter of male youth had a family member present during questionnaire
administration, that their responses did not differ significantly from those who were able to
complete the questionnaire in private (Mensch et al., 2003).
This bystander effect described by Aquilino and colleagues was evident in the research
presented in Chapter 3 leading up to the QDM trial where data from the feasibility study
Chapter 8: Discussion 188
highlighted that teachers’ influence was so strong that even without being present they
affected how student’s responded. In addition, despite being widely spaced throughout the
classroom so that each respondent completed their questionnaire in ‘private’, pupils
repeatedly attributed the presence of other pupils as affecting their ability to accurately report
their sexual behaviour during the baseline survey. This supports data from Aquilino’s study
which indicates that in 80% of instances the bystander did not interfere with the survey, but
were just present in the room (Aquilino et al., 2000).
The only bystanders present during the QDM trial (and the final survey of the RDS main trial)
were surveyors and a small number of other survey participants. Surveyors were present at
the start of questionnaire completion, provided relevant training for each mode and were
available nearby throughout questionnaire completion to answer any questions. This was true
for all modes (although less relevant for the interviewer‐administered mode).
Surveyors trained each participant individually and only let them begin their questionnaire
once they felt confident the participant had demonstrated they were capable with their mode.
And yet, once started, qualitative data suggest that some would have liked to have had more
help but felt unable to raise their hands to seek assistance. This could be related to concerns
that seeking assistance would disclose their responses. However, one study conducted in the
U.S. which has focussed on the impact of interruption during questionnaire administration
found that in their experimental lab setting, interruption didn’t impact on a respondent’s
sense of privacy (Couper et al., 2003). However, in this scenario, unlike our surveyors, the
‘intruder’ was not part of the study so would not have imparted the same level of threat.
Qualitative data also underscores how some participants who failed to grasp how to use a
mode expressed distress about this. Research indicates that not understanding the meaning of
a question can cause a participant to become distressed (Catania, 1999). However, there is
little research into what happens to a participant who doesn’t understand how to operate a
questionnaire delivery method. We need more research into how to assist participants once
they have started and to assess this process better. This information would provide data on
the prevalence of its occurrence and allow us to create tools to better handle it when it takes
place.
8.4.2 Confidentiality
In conjunction with how privacy is maintained within the setting is how carefully the
respondent perceives the data are being guarded. Researchers traditionally offer statements
of confidentiality to respondents, guaranteeing that their names will not be linked to their
information and that the data will not be made available to others. The effectiveness of the
Chapter 8: Discussion 189
researcher’s statement is wholly reliant on the trust it has inspired in the respondent. A
respondent’s ability to believe confidentiality has been maintained is based not only on the
researcher’s actions but also on the cultural context in which the survey is taking place.
In this study, confidentiality was promised to the RDS cohort in the baseline and interim survey
and anonymity pledged to final survey participants. Study ID labels were used during survey
administration to create distance between the respondent’s name and their data. Qualitative
data suggests that this was perceived by respondents as only partially reassuring and
somewhat trustworthy. However this seemed to have less to do with the rigour of the study.
Despite the extensive efforts made by the survey team to ensure that school and/or
community members were not present during survey questionnaire administration, young
people still expressed difficulty believing that the data would remain solely in the hands of the
research team. This was in large part due to the lack of a cultural reference for respecting
young people’s confidentiality. Zimbabwe’s sense of community is so strong that it
(unintentionally) overrides an individual’s right to privacy over the greater community good.
This strong sense of community is inculcated into the most fundamental structures where daily
greetings require reciprocity (the response to ‘how are you’ is ‘I am fine if you are fine’) and
the congratulatory message at the birth of a child assumes that the celebration belongs to the
community). But it also conveys a message that means that privacy and confidentiality are less
respected, least so for youth who hold the most junior position in society.
We altered our interview setting in both interim and final surveys to make them smaller and
more private. While this shift proved beneficial, its impact was not as significant as might be
found in cultural contexts where a youth’s privacy is more respected. Yet questionnaire
delivery modes did impact on their sense of confidentiality. Qualitatively, those that used
ACASI expressed greater confidence that their answers would be kept ‘secret’. Study ID labels
were present on all paperwork for SAQ, Audio‐SAQ and ICVI as well as ACASI. And the
respondent’s study ID was entered into the laptop by the surveyor. Yet, ACASI was perceived
as being better able to maintain confidentiality than the other modes where data was
recorded on paper. This may be because the study ID was less visible and, once clicked,
answers also disappeared from the screen. Zimbabwean youth have a good deal of experience
with confidentiality of information provided on paper (a letter to a girlfriend or boyfriend,
exam papers) not being respected. The recent political climate where electoral votes have
taken place in public or sealed ballot boxes have been opened support youths’ distrust. This
would make it harder for them to believe that booklets, even when sealed in envelopes and
Chapter 8: Discussion 190
placed in locked trunks, might not find their way back to those with authority in their
community.
What did emerge was an equally important aspect which is that even in an overarching
environment lacking in trust, when researchers are true to their word and respect the
communities in which they work, participants can gain trust over time. Gregson et al.
attributes part of the smaller differences found between IVCI and FTFI in their second round of
surveying to the fact that participants trusted the research process more (Gregson et al.,
2004). Similarly, in the QDM trial, participants partially attributed their increased sense of
trust to the fact that baseline survey results had remained confidential and had not been
disclosed to anyone in the community.
8.4.2.1 Privacy: Impact of mode
8.4.2.1.1 Interviewer‐administered versus self‐administered modes
Beyond the setting itself, questionnaire delivery mode can affect a sense of privacy. At the
most basic level, interviewer‐administered questionnaires do not afford the same level of
privacy that self‐administered questionnaires do. In a review of US studies comparing the
measurement of self‐reported illicit drug use, all nine studies found higher rates of reporting
with self‐administered modes than with interviewer‐administered ones (Tourangeau et al.,
2000). Our data suggest that those who were interviewed were less likely to report risky
sexual behaviours, as well as poverty, psychological ill‐health, and alcohol and drug use. When
examining interviewer‐administered questionnaires, Catania believes this is due in part to the
premise of reciprocity that is inherent in self‐disclosure which is not adhered to in the
interview setting (Catania, 1999). In the traditional dynamic of an interviewer‐administered
questionnaire, while the interviewer is expected to make the respondent comfortable they are
not expected to disclose their own sexual behaviour in order to extract similar information
from the respondent. Instead, this interaction is very uni‐directional.
A good deal of research suggests that within an interview setting, it is assumed that the
researcher will have ensured that interviewers are fully qualified, well trained, able to put a
respondent at ease, and fluent and comfortable in speaking terminology related to sensitive
behaviours (sexual, orphaning, poverty). In addition, some research suggests that you can
increase a respondent’s sense of control and comfort by allowing them to choose their
interviewer (Catania et al., 1996). Limitations within the QDM trial did not permit the
respondent to choose their interviewer, but we did ensure that they were interviewed by
someone of the same gender. As mentioned earlier, research suggests that using the same
gender is appreciated, especially by women. We also chose interviewers who were within a
Chapter 8: Discussion 191
similar age range as the respondents so as to decrease the chance that they would perceive
the interviewer as someone who might disapprove of their behaviour. Anecdotal data from
the RDS main trial (VCT and youth intervention) suggests that young people appreciate the
distance provided by an ‘outsider’; all our interviewers were from outside the study
communities. Yet, despite maximizing the ‘privacy’ within the interviewer‐administered
setting, respondents overall disclosed less sensitive information. Here, it appears that the
interpersonal trust and rapport gained in a face‐to‐face interview is outweighed by the need
for privacy and sense of anonymity provided by self‐administered modes.
There remains considerable debate around the importance of maintaining the formality of the
interviewer‐administered questionnaire. Traditionally, research demands a level of
standardization which prohibits a conversational interviewer and where emphasis is placed on
ensuring that questions are read in a standardized manner to all respondents. However work
conducted by Conrad and Schober suggest that a more conversational approach yields an
increase in reporting of sensitive behaviours (Conrad & Schober, 2000). This is also supported
by research from Africa. Konings’ work in Uganda found increased reporting of sexual
behaviours during in‐depth interviews as did Plummer’s work among youth in Tanzania
(Konings et al., 1995; Plummer et al., 2004a). Data from Mitchell in the UK alludes to the
rationale behind this, as respondents reported feeling more comfortable disclosing
information during the in‐depth interview than during the questionnaire – mostly because
they could place context to their behaviours (admitting they were ‘wild back then’ or ‘that they
knew it was risky’) (Mitchell et al., 2007).
What emerges from this debate is the continued importance individuals place in being able to
provide context to their actions. This returns us to Catania’s point (1999) that people need to
feel in control of their statements and when they can ‘explain’ their actions this increases their
sense of control over the reporting process. The challenge is for this debate to cross over from
the interviewer‐administered arena to those working in self‐administered modes who should
continue to ask, ‘are there ways in which we can improve our ability to allow participants to
provide context to their statements?’
8.4.2.1.2 Value of earphones While Audio‐SAQ was completed in a booklet form and ACASI included a screen, both modes
used earphones to allow the participant to listen to the questions and responses while reading
along. By using earphones respondents were, in effect, ‘closed off’ from the others and placed
in their own ‘private’ world. Qualitative data from these participants stressed that the modes
themselves afforded greater privacy over SAQ and ICVI.
Chapter 8: Discussion 192
8.4.2.1.3 Impact of the screen in ACASI
In ACASI, participants were expected to use the laptop screen to read the questions and
choose their answers. At present research provides inconclusive evidence on the effects of the
laptop screen in terms of increasing or decreasing a respondent’s sense of privacy. In most
research, the screen does not seem to hinder a respondent’s sense of privacy. In Acquilino’s
study on bystander influence, they also controlled for questionnaire delivery mode comparing
SAQ with computer‐administered survey instrument (CASI) on a laptop (no audio component).
The use of CASI diminished the bystander interference suggesting that despite having a large
screen, respondents felt it afforded them more privacy than SAQ (Aquilino et al., 2000).
Results from the research conducted here support the notion that the screen is not a
hindrance as long as an overall sense of privacy is maintained. Qualitative data suggested that
on the rare occasions when the screen was not appreciated, the respondent’s privacy within
the setting had been diminished (they were sitting in a space where they felt it was possible
for others to see their screen).
8.4.3 Reliability
Reliability of a respondent’s responses is an important precursor to establishing the validity of
self‐reports. Reliability of data can be examined by asking the same question at two points
within the same questionnaire (internal comparison) or by asking respondents to retake the
question after a short time interval and comparing their responses to these same questions
(test‐retest). In this study reliability was measured in several ways. During the QDM trial, we
asked a random set of participants to complete a shortened version of the questionnaire a
second time. We were able to compare responses of the sexual behaviour questions in the
same participant completed a week apart. While the majority of respondents re‐took the
questionnaire using a different mode, there were some who were randomly allocated to re‐
take the questionnaire using the same mode. This allowed a comparison of the reliability
within mode versus between modes. For those who retook the questionnaire using the same
mode, responses were highly reliable with 92% providing consistent responses to questions
about their sexual activity. High rates of consistency (97%) were also found for those who
used a different mode in the second round. However, while there were high rates of
consistency overall, where responses were changed, questionnaire delivery mode did seem to
have an impact. While numbers were small, data here suggests that participants using modes
that were considered more private were more likely to change their response from ‘never sex’
to ‘ever sex’. The reverse was also true with participants using modes considered less private
being more likely to recant their initial reports of sexual activity.
Chapter 8: Discussion 193
There is another mechanism that can also be used to look at inconsistency in reporting. While
not looking at exactly the same question, it is possible to compare reports of the same topic
within a questionnaire. For example, if a participant reports they have never been pregnant, it
would be logical for them to also report they had never had an abortion. Likewise, if a
participant reports they have never had sex in one question, it would be logical for them to not
report being sexually active in another question (in our self‐administered questionnaires, there
was always a response option, ‘I have never had sex’ to cater for those who had previously
indicated they were not sexually active.) In our data, inconsistent reporting was relatively low.
In the final survey, less than 3% of young women inconsistently answered the two questions
which followed on from the one asking if they had ever been pregnant. When it occurred it
was most often the results of a respondent’s failure to complete a tick box and then provide
additional information about age or frequency within that same question.
Research into inconsistency in reporting of sexual behaviours has as yet to disentangle the
rationale behind the inconsistency. A number of factors, both cognitive and situational, may
result in inconsistent reports of sensitive questions including the effects of social desirability
bias or technical incompetence. When the time frame between the two questions is over
years, then the inconsistency might also be the result of a participant changing their contextual
framework moving into a new time period where behaviours previously answered are now
more likely to be condoned (say from adolescence into early adulthood).
Higher rates of inconsistency seem to be reported more often when studies compare results
collected over longer periods of time (Palen et al., 2008b; Rosenbaum, 2006; Lauritsen &
Swicegood, 1997). When Lauritsen and Swicegood compared age of sexual debut in US
adolescents and then as adults, seven years later, between 28‐32% of these reports were
inconsistent. A similar phenomenon was found by Rosenbaum where she examined
inconsistency in youth who pledged to remain virgins in two waves of the National
Longitudinal Study on Adolescent Health (Rosenbaum, 2006). Those who had started engaging
in sex during the period between the two surveys were three times more likely to deny having
made a virginity pledge in the first survey. Likewise, 28% of those who took the virginity
pledge in the second survey changed their sexual behaviour responses to reflect this new
outlook. Closer to home, in Cape Town, South Africa, Palen’s recent publication reports that
nearly 40% of survey respondents who were school‐going adolescents reported being virgins
after having reported sexual activity in an earlier assessment (Palen et al., 2008b).
However, it would seem possible (if not highly probable) that context was a dominant
contributor to the inconsistencies found in these studies outlined above. Social‐psychological

Chapter 8: Discussion 194
literature emphasizes that individuals change their reference points as they move through
time (Goffman, 1959). Numerous studies indicate that reporting a younger age of sexual
debut when the respondent is already an adult is less difficult than reporting it while the
respondent is still young. However, this difference does not automatically suggest that the
original data were ‘unreliable’. While Palen’s time frame is not as long as that in Lauritsen and
Swicegood’s study, the survey did take place over a two and half year period. More salient is
the fact that youth were surveyed between 8th and 10th grades, a time when adolescents are
highly susceptible to peer influences and external messages (Harrison, 2005). It would seem
very possible that young people’s context around sexual activity changes over this time period.
A study by Alexander et al. looked at a similar time frame in US adolescents and found greater
inconsistency between the 8th and 9th grades than the 9th and 10th grades suggesting the more
accommodating culture of these later secondary school years (Alexander, Somerfield,
Ensminger, Johnson, & Kim, 1993). All of these data support the social psychological literature
that emphasizes the contextual nature of everyday life which people continuously redefine as
it changes around them (Goffman, 1959)
In contrast to these comparisons across time where perspectives and context are highly
amenable to change, data found in studies where the test‐retest is analysed using data from
the same questionnaire (Vanable et al., 2009; Rodgers et al., 1982) or from a questionnaire
taken within a short time frame are moderately consistent (Brener et al., 2002). In two early
US studies, data collected from two rounds of a study found inconsistent responses to the
question on sexual intercourse within the questionnaire was 7.8% in the first round and
dropped to 4.3% in the second questionnaire administered a year later (Rodgers et al., 1982)
(Note that the drop in inconsistencies supports the notion presented above that young
people’s sexual context changes over time). And in a study where data were collected two
weeks apart, Kappa values for questions assessing sexual behaviours ranged from .4 to .9
(Brener et al., 2002). This was supported by more recent data among African American youth
in four US cities (questionnaires taken two weeks apart) in which 85% of the sexual
behavioural variables showed moderate or high levels of reliability (e.g. three‐month recall of
vaginal sex kappa=0.72; number of sexual partners intraclass correlation coefficient=0.68)
(Vanable et al., 2009). As discussed earlier, frequency of behaviours were less reliable (count
of unprotected sex acts intraclass correlation coefficient=0.44) (Vanable et al., 2009). This
suggests that for young people, reliability is not as dependent on recall as on social desirability
bias.
Test re‐test on data from two different modes strengthens this argument. If there is a
difference in reporting and the time frame is minimal then it can be more strongly argued that
Chapter 8: Discussion 195
differences are not due to recall but from social desirability bias something affected by
questionnaire delivery mode. Data from the QDM trial supported this.
8.4.3.1 Intentional misreporting
It should also be noted that when researchers such as Tourangeau and Yan talk of deliberate
misreporting they do so trying to differentiate cognitive errors from situational ones
(Tourangeau et al., 2007). There is another, poorly researched cadre of respondents who
deliberately misrepresent themselves not out of embarrassment or because disclosure makes
them feel threatened but because they want to misrepresent themselves. Fan and his
colleagues conducted a study in which they were able to identify some respondents as
‘jokesters’, those who misrepresented themselves on items that could be easily verified on
visual inspection and where misrepresentation was deemed unrelated to embarrassment and
threats. They looked at youth who misreported having an artificial limb, having been adopted,
and having been born in the US (Fan et al., 2006). Their study reassuringly notes that that the
presence of jokesters were low and that their responses did not significantly alter the response
rates of other sensitive data being collected. However, one study cannot reassure us wholly.
More recently and within the present context of developing countries and African cultures,
Palen’s work in South Africa documenting youth who recanted previous reports of sexual
activity examined a number of related questions. Those who recanted were more likely to
have inconsistently reported their gender, a non‐sensitive question (RO‐1.4; 95% CI 0.6‐3.3%)
(Palen et al., 2008b). These individuals would be considered ‘jokesters’ using the definition
laid out by Fan. These data reinforce the notion that despite having minimal statistical impact,
care should be taken to define those who could be classified as jokesters and remove them
from analysis so as to minimise their possible distortion of the data (Fan et al., 2006). No
research has been conducted comparing this effect using different questionnaire delivery
modes.
8.4.4 External Assessment of Validity
8.4.4.1 Role of biomarkers
As has been mentioned earlier, most risk behaviours, including sexual behavioural data, cannot
be verified independently (Minnis et al., 2007; Catania et al., 1990; Brener et al., 2003).
However, as biomarkers can provide a measure of validation, we cross‐tabulated sexual
behaviour data with biomarker data in both the QDM trial and final surveys (HIV, HSV‐2, and
current pregnancy in females). As none of these biomarkers have a one‐to‐one relationship
with the self‐reported behaviour it is only possible to use them to assess validity in the one
direction: while not all of those who are sexually active will have a biomarker detected, none
Chapter 8: Discussion 196
of those who report ‘never having had sex’ should have one. There were too few respondents
with positive biomarkers for sexual activity enrolled in the QDM trial which limited our ability
to statistically compare the data by questionnaire delivery mode. However in the final survey
there was a statistically significant difference between Audio‐SAQ and ACASI, with
respondents with biomarkers less likely to report never having had sex on ACASI.
Our data do suggest that self‐reports are influenced by social desirability bias, particularly
among young females. During the QDM trial, more than half of the females (15/28) with
positive biomarkers for sex reported that they had never had sex. This inconsistency was not
apparent in males, although there were far fewer of them who had biomarkers for sex (n=2).
Despite larger numbers of biomarkers among respondents in the final survey, the proportion
of males infected with HIV and/or HSV‐2 remained low (9.5%). As such it was not possible to
detect a statistically significant difference between biomarker prevalence among males who
said they never had sex on Audio SAQ (38.1%; 95% CI 25.4‐52.3) and ACASI (33.9%; 95% CI
21.8‐47.8) although there was a trend towards lower prevalence on ACASI. By contrast we did
find a higher prevalence of biomarkers among women who reported they had never had sex
on Audio SAQ (20.8%; 95% CI 17.2‐24.4) than ACASI (13.8%; 95% CI 11.0‐17.1) suggesting that
female Audio SAQ respondents were more likely to under‐report that they had had sex.
When the pregnancy test result is compared against self‐reported current pregnancy, the two
surveys found varying levels of consistency (interim=50% (8/16); final=77.7% (157/202). This
may be due to the fact that these young women were aware that we were running pregnancy
tests so felt less able to hide this information. There is evidence that shows that when
participants believe their answers can be compared against another indicator, they are less
likely to deviate from the truth (Campanelli, Dielman, & Shope, 1987; Werch, Gorman, &
Marty, 1987; Tourangeau, Smith, & Raskinski, 1997; Akers, Massey, Clarke, & Lauer, 1983). It
is also possible that the pregnancy biomarker can test for pregnancy before a woman will
know she is pregnant which would also result in inconsistencies.
8.4.4.2 Self‐reported honesty
There are few studies that examine self‐reported honesty of questionnaire completion,
particularly in adolescents (Newcomer & Udry, 1988; Stone, Shiffman, Schwartz, & Hufford,
2002). In one study from the US, males with discrepant data at two time points admitted to
over‐reporting their sexual experience in the initial survey (Siegel, Aten, & Roghmannn, 1998).
Other evidence contrasts with this. Compliance of diary completion was evaluated using a
light sensitive chip that recorded when the diary was opened. Participants were unaware that
their diaries were equipped with this feature. The light sensitive chip confirmed that 11% of
Chapter 8: Discussion 197
participants were compliant and completed their diaries in a timely fashion; however 90% of
participants reported being compliant suggesting that 80% were inaccurately reporting their
level of compliance (Stone et al., 2002). Both studies cited above were conducted in the US;
none of the comparative studies from developing countries reported on self‐reported honesty.
Our data are similar to that found by Stone and suggest that self‐reported honesty is also
impacted by social desirability bias. This was evidenced in the following manner: all the
participants with positive biomarkers for sexual activity who self‐reported not being sexually
active reported completing the questionnaire honestly, considerably weakening the credibility
of these data. We are limited therefore in our ability to understand the underlying significance
of our data on self‐reported honesty during questionnaire completion. However, it is possible
to speculate that honesty is influenced by social desirability.
8.4.5 Summary
Our evidence suggests that while both cognitive and situational aspects were at play, when
technical problems (such as skip patterns) were eliminated, situational characteristics (social
desirability bias) remained as outlined here. Situational misreporting found in sensitive
questions is almost always in one direction, that of increased socially desirable responses. This
comparative research supports this theory in two ways. Firstly reporting of sensitive questions
was in the one direction, with modes considered (and defined by participants) as less private
providing more socially desirable responses and more private modes providing more socially
undesirable replies. Secondly, although the evidence can only be used in the one direction,
irrespective of mode, there remained a difference in the proportion of young girls who did not
report sexual activity but who had biomarkers suggesting sexual activity had occurred.
Unfortunately, biomarker evidence cannot be used to examine those respondents who
reported sexual activity but were not telling the truth. The findings from Palen’s study in Cape
Town, South Africa showing a substantial proportion of youth recanting earlier sexual activity
could be seen as disputing this point. However, the majority of the youth who recanted were
males where it is possible that cultural expectations made it very important (e.g. socially
desirable) in the earlier surveys to be seen as sexually active. This possibility was not explored
in her discussion. In the QDM trial, it seems that cognitive issues did play a role, but not in
terms of memory or comprehension, but as a result of inability to follow complex skip
patterns.
Secondly, the procedures that seem most effective in reducing a respondent’s motivation to
misreport seem to affect sensitive questions but not non‐sensitive ones. Our data also support
this to some extent. What is interesting here is that researchers may have ignored areas that
Chapter 8: Discussion 198
are more sensitive that previously envisaged. This is true for orphaning and poverty both of
which had difference in reporting by mode. Researchers collecting poverty data traditionally
use interviewer‐administered questionnaires (James Hargreaves 2008, personal
communication 4 September). However reports of age, education, and other demographic
characteristics remained unaffected by mode.
8.5 Strengths
There are a number of strengths surrounding the data collected for this thesis. Firstly, we
tested the hypothesis that questionnaire delivery modes might influence validity of sexual
behaviour reporting in a randomized control trial. This remains the strongest manner in which
to control for confounders and strengthens the credibility of these results. Secondly, whereas
comparisons are more traditionally conducted between two modes, this study compared four
modes allowing for comparisons between both interviewer‐administered modes and between
self‐administered modes. In the systematic review presented in Chapter 2, out of 24 studies,
only five compared more than two modes (Le et al., 2006; Potdar et al., 2005; Mensch et al.,
2003; van Griensven et al., 2006; Lara et al., 2004). Thirdly, the study sample size was also
large enough to make comparisons between the four arms of the trial. Despite the out‐
migration during the interim survey which decreased the number of available participants
within survey communities, our sample size was still large enough to have about 85% power to
detect a risk ratio of 0.5 (or 2.0) in at least one group. The interim survey had high
participation rates for those within the survey area (95%) lowering the influence of non‐
participants response bias. Fourthly, while sexual behaviour reporting was the focus of our a
priori analysis, we were also able to examine a range of specified sensitive topics and found
that reporting in these other areas followed a similar trend to that found for reporting of
sexual behaviours, where modes with increased privacy produced greater reporting.
In questions on poverty, there was a greater difference between interviewer‐administered and
self‐administered than between any of the three self‐administered questionnaire delivery
modes. This could be a result of substantial increase in the level of privacy found among all
three self‐administered modes which outweighed any other specific benefits present within a
particular self‐administered mode.
The only exception to this trend was around the subject of orphaning where, in our post hoc
analysis of other sensitive topics, we found increased reporting in an interviewer‐administered
setting. These data seem contradictory to some of the qualitative data that suggests
participants found providing sensitive information to an individual difficult. However, it is
possible that what seems contradictory is in fact a reflection of the myriad of aspects that
Chapter 8: Discussion 199
affect reporting highlighted throughout this discussion. At the time of the interim survey, rural
Zimbabwe was faced with terrible poverty and food distribution was focussed on those
identified as vulnerable, a category which included orphans. Participants could have been
influenced by these socio‐economic circumstances. If participants believed they might benefit
from identifying themselves as an orphan, it is possible that their discomfort as outlined in the
qualitative data was outweighed by their need to ‘tell someone’ so as to qualify for assistance.
This emphasizes that while social desirability bias continues to play a prominent role, its
direction of impact can vary depending on the topic.
Reliability of data is strengthened when data are collected from the same participant twice.
Thus, the inclusion of the second round of surveying a random set of participants strengthened
the rigour of the interim survey and provided opportunities to examine inconsistencies in
reporting. These data are additionally made more rigorous by the inclusion of same mode
comparison in Round 2, allowing differences found in same mode reports of ‘ever having sex’
to be taken into account during the analysis of R1/R2 comparisons.
A final strength was the use of quantitative and qualitative post‐survey data from participants
which collected information on their impressions of each mode’s acceptability. This
information reinforced the quantitative data providing context and rationale for the increase
in reporting of sensitive topics that were found. Participants highlighted the importance of
privacy both in the setting (small rooms with fewer participants) and in the mode as well as the
importance of the audio component. Equally important is the point that despite the
qualitative data not being extensive, useful information was gathered which provided context
to the a priori analysis. This multi‐methodological approach is supported by others in the field
(Huygens, Kajura, Seeley, & Barton, 1996; Baum, 1995). This is reassuring and should
encourage others to use qualitative data wherever possible. Even small amounts collected
well and analysed rigorously can add valuable context to quantitative comparative data.
8.6 Limitations
Validity is traditionally measured using an external marker, often defined as the ‘gold
standard.’ When an outcome can be externally validated against an independent standard,
this is seen to represent ‘truth’, and defined as the ‘gold standard’ (Cowan et al., 2003). In a
similar vein, response rates can be measured against themselves with 100% completion
considered having reached a ‘gold’ standard. However, while there are many biological
outcome measures they all have limitations, which render them a good proximate but not
perfect gold standards. For example, researchers can test for the presence of Y chromosome
or PSA antigen and compare the presence of this in female respondents to their responses on
Chapter 8: Discussion 200
condom use ((Rose et al., 2009; Gallo et al., 2006; Gallo et al., 2007). Where women report
recent condom use yet there is presence of the Y chromosome or a PSA antigen, then it is
possible to conclude that the self‐report is not valid. However, because the biomarker can be
detected for a limited period (approx. two weeks), it can only compare those exposed to the Y
chromosome against their self‐report of recent condom use or recent sexual experience. In
many sexual behavioural surveys, researchers are interested in past sexual experiences that
may have affected a person’s risk but can not be assessed by this biological marker.
Additionally, biomarkers cannot assist with those who have had sex but report not having sex
on the questionnaire and don’t have a biomarker for sexual activity. In the QDM trial we
tested for HIV, HSV‐2 and pregnancy in females. Not only is pregnancy more central to young
people’s concerns but we also ran the tests on‐site. So it is possible there were fewer
discrepancies in these data compared to HIV and HSV‐2 because women were more aware of
this test during the survey so felt it was more possible to be ‘caught out’ (n=7/16 reported
never having sex but tested positive for pregnancy).
While response rates can be compared against a gold standard of 100% completion, a
limitation of this type of research is that there is rarely a gold standard for reporting of
sensitive behaviours with which to compare. So for example, when we witness an increase in
reporting of sexual behaviours we are assuming the increase is a reflection of more accurate
self‐disclosure. However this may be an incorrect assumption particularly with males where
exaggerated reporting might be the norm and a decrease in reporting would indicate more
accurate self‐disclosure (Mensch et al., 2003; Brener et al., 2003). In our final survey data, we
were able to examine differences in reporting between males and females on Audio‐SAQ and
ACASI compared with evidence of a biomarker. A larger proportion of males produced
discrepant results between their self report of never having sex and having a biomarker for
sexual activity. However, as mentioned earlier, the absolute number of males with biomarkers
was small making it difficult to compare.
There were several other limitations to this experimental evaluation.
8.6.1 Generalizability of these results
The research presented here makes a strong case for the use of ACASI (and Audio‐SAQ if
necessary) in the collection of sensitive information among adolescents in rural developing
country settings. It intimates that ACASI not only assists participants in accurately self‐
disclosing their behaviours but that it is feasible and acceptable within this rural population
that has limited computer experience.
Chapter 8: Discussion 201
However as mentioned earlier, both surveys included participants with high rates of literacy, a
product of a highly educated population within the country. This overall high literacy may
possibly limit the generalizability of these results to other developing countries with poorer
literacy rates. Unfortunately ACASI’s use in these settings is still relatively low. The work of
Mensch and her colleagues in Kenya and Malawi, both countries with lower literacy rates
suggests that literacy per se may not impact ACASI which was used successfully with rural
youth (Hewett et al., 2004; Mensch et al., 2008). In addition, Potdar used ACASI (and not SAQ)
amongst youth living in slums, where despite differences in reporting compared to their
college‐educated peers, no mention was made of their inability to use this system. However,
evidence from three studies is not sufficient to suggest that low literacy settings should or can
use ACASI. More research is required into the feasibility of ACASI in low literate adolescent
populations. What is encouraging is the increased use of PDAs, a computer administered
programme which continues to simplify the interface between respondents and the machine
(Seebregts et al., 2008).
The low prevalence of biomarkers made comparisons between the four arms of the trial
difficult. However the data were useful in being able to understand just how difficult it is for
young women in particular to accurately disclose their sexual activity. However, due to a
larger sample size and a slightly older adolescent population we were able to show a
difference between the two questionnaire delivery modes used in final survey. We found less
discrepancies among ACASI users.
An on‐going discussion surrounds the trade‐off between an interviewer’s ability to check for
errors and improve reliability contrasted with self‐administered modes increased ability to
maintain privacy but reduced ability to check for errors. There are two alternative viewpoints
which should be mentioned here. Firstly, I would argue that as programming techniques
improve computer self‐administered modes (CASI, ACASI, video‐CASI) are equally as able to
check data consistency at the time of questionnaire administration. Researchers could take
more advantage of the improved interface such that when data are found to be inconsistent
an oral or voice component could explain the inconsistency and ask the participant to rectify it.
And yet, the second concern is that as the interface becomes more sophisticated, it is tempting
to make computers more ‘human’. For example, researchers could take advantage of voice
recognition software and use it to help people name their partners in a partner matrix. If
desired, ACASI could include a video component which participants could elect to watch if they
needed more information about definitions for sexual activity. But given that it is the ‘human‐
ness’ within interviews that limits respondents’ ability to self‐disclose, we should remain wary
Chapter 8: Discussion 202
of improving computers to the extent that they are anthropomorphised. Unfortunately while
this concern exists, little research has been conducted in this area, the majority of it focussed
around web‐based surveys which are less relevant in developing country settings (Tourangeau
et al., 2007). Even less information about the impact of making computers sound more human
exists in the development country context.
One additional consideration that should be noted (or at least not ignored) is the possibility
that the perceived benefits of ACASI are associated with its novelty in these communities.
Computers, and more specifically, laptops, are uncommon in rural Zimbabwe and much of
rural developing country settings. In the QDM trial, young people repeatedly attributed the
laptop’s novelty as part of the reason they liked using them. For example, their belief in its
improved ability to maintain confidentiality is in part due to their ignorance of how computer
data can be accessed. They reported believing that because you couldn’t ‘see’ the study ID it
was more secret than the other two self‐administered modes. More recent comparative data
from the US and Europe have been less successful in showing the strong differences in
reporting of sensitive behaviours between different self‐administered modes as was done by
Turner and others when computers were first used and less common in those environments
(Webb, Zimet, Fortenberry, & Blythe, 1999; Johnson et al., 2001; Davoli, Perucci, Sangalli,
Brancato, & Dell'Uomo, 1992). This may be as a result of the fact that computers in these
countries permeate most aspects of life and their increased use in research (including web‐
based research). This saturation could result in computers seeming less novel to participants
in these later surveys. In a related situation, Gregson and colleagues report a less pronounced
effect using ICVI in their second round of surveying and postulate that it may be that the
interview using a confidential voting box is no longer novel (Gregson et al., 2004). So it cannot
be overruled that as computers gain more exposure in developing countries their novelty will
wear off causing a return to initial suspicions around confidentially and trust. Alternatively,
young people in developed countries could now be more adept at reporting sexual activity
than their peers in developing country settings.
8.6.2 Need for more research
Despite the recent increase of comparative mode studies in developing countries, there
remains much that needs to be explored and more attempts should be made to incorporate
comparative work into larger surveys (Becker et al., 1992). Currently, there is concern that
including a mode comparison within a survey will affect the rigour of the overall survey
analysis. However, if comparisons are conducted rigorously using randomization then the
Chapter 8: Discussion 203
differences in reporting of sensitive behaviours found by mode should be randomly spread
across the survey population.
Another big limitation is the continued reliance researchers working in developing country
settings have on US data. This is particularly true for laboratory controlled experiments
focussing on psychological differences around reporting of sensitive topics. While comparative
studies have increased in developing country settings, they are all field based. This allows us
to comment on situational variables but not so cogently on psychological ones. So we remain
mute on whether or how psychological factors play a role. In addition, research on sensitive
questions in the US has delved largely on drug and alcohol use and less on sexual behaviours
(Tourangeau et al., 2007). So the findings from this research conducted in industrialized
countries into sensitivity may be less translatable to development country settings where
sexual behaviours in adolescence are of primary interest.
8.7 Conclusion
This thesis provides strong evidence that Audio‐SAQ and ACASI, two self‐administered
questionnaire delivery modes comprising an audio component heard privately, increase a
respondent’s sense of privacy, allowing them to report socially censured behaviours. As the
study was conducted in Zimbabwe among rural adolescents, it adds its weight to the growing
literature emerging from developing countries that have begun to show that computerized
self‐administration is feasible and acceptable in resource poor settings. This evidence should
encourage researchers to employ ACASI (and its derivatives) in their research.
Catania warns against giving up our time‐honoured methods before adequate research
comparing the advantages and disadvantages of other methods is exhausted (Catania et al.,
1996). We believe the research reported in the QDM trial along with additional data from the
final survey, coupled with that from the systematic review, provide sufficient evidence to
discourage researchers from using interviewer‐administered modes for collection of sensitive
behaviour data. There is now good evidence of the superiority of self administered data
collection modes – particularly those that take advantage of computer technology.
Yet Catania is correct to warn us not to be complacent – we do need to continue to conduct
methodological research, comparative ones that will help us to better understand how to
assist disclosure of sensitive information, particularly in developing country settings where the
cultural context differs from where the majority of research has taken place. This research
also highlights a number of areas where additional qualitative data would improve our
understanding of the various nuances that occur within questionnaire completion. However,

Chapter 8: Discussion 204
these concerns should not delay the introduction of new modes as it is only though using them
that we will learn more about their strengths and limitations.
Bibliography 205
Bibliography
ACSF investigators (1992). AIDS and sexual behaviour in France. Nature, 360, 407‐409.
Akers, R. L., Massey, J., Clarke, W., & Lauer, R. M. (1983). Are self‐reports of adolescent
deviance valid? Biochemical measures, randomized response, and the bogus pipeline in
smoking behavior. Social Forces, 62, 234‐51.
Al‐Tayyib, A., Rogers, S. M., Gribble, J. N., Villarroel, M. A., & Turner, C. F. (2002). Effect of low
medical literacy on health survey instruments. American Journal of Public Health, 92, 1478‐
1481.
Alexander, C. S., Somerfield, M. R., Ensminger, M. E., Johnson, K. E., & Kim, Y. J. (1993).
Consistency of adolescents' self‐reports of sexual behaviour in a longitudinal study. Journal of
Youth and Adolescence, 22, 455‐471.
Allen, C. F., Lees, S. S., Desmond, N. A., Der, G., Chiduo, B., Hambleton, I. et al. (2007). Validity
of coital diaries in a feasibility study for the Microbicides Development Programme trial among
women at high risk of HIV/AIDS in Mwanza, Tanzania. Sexually Transmitted Infections, 83, 490‐
496.
Andersson, N., Cockcroft, A., & Shea, B. (2008). Gender‐based violence and HIV: relevance for
HIV prevention in hyperendemic countries of southern Africa. [Article]. AIDS, 22, S73‐S86.
Ansell, N. (2001). "Because it's our culture!" (Re)negotiating the meaning of lobola in Southern
African secondary schools. Journal of Southern African Studies, 27, 697‐716.
Aquilino, W. S., Wright, D. L., & Supple, A. J. (2000). Response effects due to bystander
presence in CASI and paper‐and‐pencil surveys of drug use and alcohol use. Substance Use and
Misuse, 35, 845‐867.
Asamoah‐Odei, E., Garcia‐Calleja, J. M., & Ties Boerma, J. (2004). HIV prevalence and trends in
sub‐Saharan Africa: no decline and large sub‐regional differences. Lancet, 264, 35‐40.
Auvert, B., Ballard, R., Campbell, C., Carael, M., Carton, M., Fehler, G. et al. (2001). HIV
infection among youth in a South African mining town is associated with herpes simplex virus‐
2 seropositivity and sexual behaviour. AIDS, 15, 885‐898.
Bibliography 206
Bandura, A., Adams, N., & Beyer, J. (1997). Cognitive processes mediating behavioral change.
Journal of Personality and Social Psychology, 35, 125‐139.
Baum, F. (1995). Researching public health: behind the qualitative‐quantitative methodolgical
debate. Social Science and Medicine, 40, 459‐468.
Becker, S., Feyisetan, K., & Makinwa‐Adebusoye, P. (1995). The effect of the sex of
interviewers on the quality of data in a Nigerian family planning questionnaire. Studies in
Family Planning, 26, 233‐240.
Becker, S. & Sosa, D. (1992). An experiment using a month‐by‐month calendar in a family
planning survey in Cosa Rica. Studies in Family Planning, 23, 386‐391.
Bernabe‐Ortiz, A., Curioso, W. H., Gonzales, M. A., Evangelista, W., Castagnetto, J. M.,
Carcamo, C. P. et al. (2008). Handheld computers for self‐administered sensitive data
collection: a comparative study in Peru. BMC Medical Informatics & Decision Making, 8, 11.
Bertrand, J. & Anhang, R. (2006). The effectiveness of mass media in changing HIV/AIDS‐
related behaviour among young people in developing countries. In D.A.Ross, B. Dick, & J.
Ferguson (Eds.), Preventing HIV/AIDS in Young People: a systematic review of the evidence
from developing countries (pp. 205‐241). Geneva: WHO.
Bisol, C. A., Sperb, T. M., & Brewer, T. H. (2008). HIV/AIDS knowledge and health‐related
attitudes and behaviors among deaf and hearing adolescents in Southern Brazil. American
Annals of the Deaf, 153, 349‐356.
Blanc, A. K. & Croft, T. N. (1992). The effect of the sex of the interviewer on responses in
fertility surveys: the case of Ghana. Annual Meeting of the Population Association of America,
Denver Colorado USA. 30‐4‐0092.
Blanc, A. K. & Way, A. A. (1998). Sexual behavior and contraceptive knowledge and use among
adolescents in developing countries. Studies in Family Planning, 29, 106‐116.
Bloom, S. S., Banda, C., Songolo, G., Mulendema, S., Cunningham, A. E., & Boerma, J. T. (2000).
Looking for change in response to the AIDS epidemic: Trends in AIDS knowledge and sexual
behavior in Zambia, 1990 through 1998. Journal of Acquired Immune Deficiency Syndromes, 25,
77‐85.
Bibliography 207
Boekeloo, B. O., Schiavo, L., Rabin, D. L., Conlon, R. T., Jordan, C. S., & Mundt, D. J. (1994). Self‐
reports of HIV risk factors by patients at a sexually transmitted disease clinic: audio vs written
questionnaires. Am.J.Public Health., 84, 754‐760.
Bolger, N., Davis, A., & Rafaeli, E. (2003). Diary methods: Capturing life as it is lived. Annual
Review of Psychology, 54, 579‐616.
Brener, N. D., Billy, J., & Grady, W. R. (2003). Assessment of factors affecting the validity of
self‐reported health‐risk behaviour among adolescents: evidence from the scientific literature.
Journal of Adolescent Health, 33, 436‐457.
Brener, N. D., Eaton, D. K., Kann, L., Gurnbaum, J., Gross, L. A., Kyle.T.M. et al. (2006). The
association of survey setting and mode with self‐reported health risk behaviors among high
school students. Public Opinion Quarterly, 70, 354‐374.
Brener, N. D., Kann, L., McManus, T., Kinchen, S. A., Sundberg, E. C., & Ross, J. G. (2002).
Reliability of the 1999 Youth Risk Behavior Survey Questionnaire. Journal of Adolescent Health,
31, 336‐342.
Brown, L., Thurman, T., Bloem, J., & Kendall, C. (2006). Sexual violence in Lesotho. Studies in
Family Planning, 37, 269‐280.
Buve, A., Lagarde, E., Carael, M., Rutenberg, N., Ferry, B., Glynn, J. R. et al. (2001). Inerpreting
sexual behaviour data: validity issues in the multicentre study on factors determinng the
differential spread of HIV in four African cities. AIDS, 15 , S117‐S126.
Caceres, C. F., Celentano, D. D., Coates, T. J., Hartwell, T. D., Kasprzyk, D., Kelly, J. A. et al.
(2007). The feasibility of audio computer‐assisted self‐interviewing in international settings.
AIDS, 21, S49‐S58.
Campanelli, P. C., Dielman, T. E., & Shope, J. T. (1987). Validity of adolescents' self‐reports of
alcohol use and misuse using a bogus pipeline procedure. Adolescence, 85, 7‐22.
Carael, M. & Holmes, K. K. (2001). Dynamics of HIV epidemics in sub‐Saharan Africa:
introduction. AIDS, 15 , S1‐S4.
Carballo, M., Cleland, J., Carael, M., & Albrecht, G. (1989). A cross national study of patterns of
sexual behaviour. The Journal of Sex Research, 26, 287‐299.
Bibliography 208
Carey, M. P., Carey, K. B., Maisto, S. A., Gordon, C. M., & Weinhardt, L. S. (2001). Assessing
sexual behaviour with the Timeline Followback (TLFB) approach: continued development and
psychometric evaluation with psychiatric patients. International Journal of STD & AIDS, 12,
365‐375.
Carpenter, L. M., Kamali, A., Payne, M., Kiwuuwa, S., Kintu, P., Nakiyingi, J. et al. (2002).
Independent effects of reported sexually transmitted Infections and sexual behavior on HIV‐1
prevalence among adult women, men, and teenagers in rural Uganda. Journal of Acquired
Immune Deficiency Syndromes, 29, 174‐180.
Catania, J. A., Gibson, D. R., Chitwood, D. D., & Coates, T. J. (1990). Methodological problems in
AIDS behavioral research: influences on measurement error and participation bias in studies of
sexual behavior. Psychological Bulletin, 108, 339‐362.
Catania, J. A., Binson, D., Canchola, J., Pollack, L. M., & Hauck, W. (1996). Effects of interviewer
gender, interviewer choice, and item wording on responses to questions concerning sexual
behavior. The Public Opinion Quarterly, 60, 345‐375.
Catania, J. A. (1999). A comment on advancing the frontiers of sexological methods. The
Journal of Sex Research, 36, 1‐2.
Central Statistical Office & Macro International Inc. (2000). Zimbabwe Demographic and Health
Survey 1999 Calverton, Maryland: Macro International Inc.
Central Statistical Office & Macro International Inc. (2007). Zimbabwe Demographic and Health
Survey 2005‐2006:preliminary report Calverton, Maryland: CSO and Macro International Inc.
Cleland, J., Boerma, J. T., Carael, M., & Weir, S. S. (2004). Monitoring sexual behaviour in
general populations: a synthesis of lessons of the past decade. Sexually Transmitted Infections,
80, 1‐7.
Cohen, D. A. & Dent, C. (1992). The validity of self‐reported condom use. American Journal of
Public Health, 82, 1563‐1564.
Conrad, F. G. & Schober, M. F. (2000). Clarifying question meaning in a household survey.
Public Opinion Quarterly, 64, 1‐28.
Couper, M. P., Singer, E. L. E. A., & Tourangeau, R. (2003). Understanding the Effects of Audio‐
CASI on Self‐Reports of Sensitive Behavior. Public Opinion Quarterly, 67, 385‐395.
Bibliography 209
Cowan, F. M., Langhaug, L. F., Mashungupa, G. P., Nyamurera, T., Hargrove, J. W., Jaffar, S. et
al. (2002). School based HIV prevention in Zimbabwe: feasibility and acceptability of evaluation
trials using biological outcomes. AIDS, 16, 1673‐1678.
Cowan, F. M. & Plummer, M. L. (2003). Biological, behavioural and psychosocial outcome
measures. In J.M.Stephenson, J. Imrie, & C. Bonell (Eds.), Effective Sexual Health Interventions:
Issues in Experimental Evaluation ( Oxford: Oxford University Press.
Cowan, F. M., Pascoe, S. J. S., Langhaug, L. F., Dirawo, J., Chidiya, S., Jaffar, S. et al. (2008). The
Regai Dzive Shiri Project: a cluster randomised controlled trial to determine the effectiveness
of a multi‐component community based HIV prevention intervention for rural youth in
Zimbabwe ‐ study design and baseline results. Tropical Medicine and International Health, 13,
1235‐1244.
Cowan, F. M., Pascoe, S. J. S., Langhaug, L. F., Dirawo, J., Mavhu, W., Chidiya, S. et al. (2009).
The Regai Dzive Shiri Project: the results of a cluster randomised trial of a multi‐component
HIV prevention intervention for young people in rural Zimbabwe. Lancet, submitted.
Crosby, G. M., Stall, R. D., Paul, J. P., & Barrett, D. C. (1996). Condom use among gay/bisexual
male substance abusers using the timeline follow‐back method. Addictive Behaviors, 21, 249‐
257.
Crowne, D. & Marlowe, D. (1964). The approval motive. New York: John Wiley.
Curtis, S. L. & Sutherland, E. G. (2004). Measuring sexual behaviour in the era of HIV/AIDS: The
experience of Demographic and Health Surveys and similar enquiries. Sexually Transmitted
Infections, 80, 22‐27.
Davoli, M., Perucci, C. A., Sangalli, M., Brancato, G., & Dell'Uomo, G. (1992). Reliability of
sexual behavior data among high school students in Rome. Epidemiology, 3, 531‐535.
de Visser, R. O. & Smith, M. A. (2000). When always isn't enough: implications of the late
application of condoms for the validity and reliability of self‐reported condom use. AIDS Care,
12, 221‐224.
DePaulo, B. M., Kashby, D. A., Kirkenol, S. E., Wyer, M. W., & Epstein, J. A. (1996). Lying in
everyday life. Journal of Personality and Social Psychology, 70, 979‐995.
DePaulo, B. M., Lindsay, J. J., Malone, B. E., Muhlenbruck, L., Charlton, K., & Cooper, H. (2003).
Cues to deception. Psychological Bulletin, 129, 74‐118.
Bibliography 210
des Jarlais, D. C., Paone, D., Milliken, J., Turner, C. F., Miller, H. G., Gribble, J. et al. (1999).
Audio‐computer interviewing to measure risk behaviour for HIV among injecting drug users:a
quasi‐randomised trial. The Lancet, 353, 1657‐1662.
Dick, B., Ferguson, J., Chandra‐Mouli, V., Brabin, L., Chatterjee, S., & Ross, D. A. (2006). Review
of the evidence for interventions to increase young people's use of health services in
developing countries. In D.A.Ross, B. Dick, & J. Ferguson (Eds.), Preventing HIV/AIDS in Young
People: a systematic review of the evidence from developing countries (pp. 151‐204). Geneva:
WHO.
Duffy, L. (2005). Culture and context of HIV prevention in rural Zimbabwe: the influence of
gender inequality. Journal of Transcultural Nursing, 16, 23‐31.
Dunkle, K. L., Jewkes, R. K., Brown, H. C., Gray, G. E., McIntryre, J. A., & Harlow, S. D. (2004).
Gender‐based violence, relationship power, and risk of HIV infection in women attending
antenatal clinics in South Africa. Lancet, 363, 1415‐1421.
Durant, L. E. & Carey, M. P. (2000). Self‐administered questionnaires versus face‐to‐face
interviews in assessing sexual behavior in young women. Archives of Sexual Behavior, 29, 309‐
322.
Eggleston, E., Leitch, J., & Jackson, J. (2000). Consistency of self‐reports on sexual activity
among young adolescents in Jamaica. International Family Planning Perspectives, 26, 79‐84.
Elam, G. & Fenton, K. A. (2003). Researching sensitive issues and ethnicity: lessons from sexual
health. Ethnicity and Health, 8, 15‐27.
Elford, J., Bolding, G., Davis, M., Sherr, L., & Hart, G. J. (2007). Barebacking among HIV‐positive
gay men in London. Sexually Transmitted Diseases, 34, 93‐8.
Ellen, J. M., Gurvey, J. E., Pasch, L., Tschann, J., Nanda, J. P., & Catania, J. A. (2002). A
randomized comparison of ACASI and phone interviews to assess STD/HIV‐related risk
behaviors in teens. Journal of Adolescent Health, 31, 26‐30.
Erulkar, A. S. (2004). The experience of sexual coercion among young people in Kenya.
International Family Planning Perspectives, 30, 182‐189.
Fan, X., Miller, B. C., Park, K., Winward, B. W., Christensen, M., Grotevant, H. D. et al. (2006).
An exploratory study about inaccuracy and invalidity in adolescent self‐report surveys. Field
Methods, 18, 223‐244.
Bibliography 211
Fenton, K. A., Johnson, A. M., McManus, S., & Erens, B. (2001). Measuring sexual behaviour:
methodological challenges in survey research. Sexually Transmitted Infections, 77, 84‐92.
Ferguson, A., Morris, C., & Kariuki, C. (2006). Using diaries to measure parameters of
transactional sex: an example from the Trans‐Africa highway in Kenya. Culture, Health and
Sexuality, 8, 175‐185.
Feiveson, A.H. (2002) Power by simulation. Stata Journal; 2,107‐124.
Fielding, R., Lam, T. H., & Hedley, A. (2006). Risk‐behavior reporting by blood donors with an
automated telephone system. Transfusion, 289‐297.
Ford, K. & Norris, A. (1991). Methodological Considerations for Survey Research on Sexual
Behavior: Urban African American and Hispanic Youth. Journal of Sex Research.
Forsyth, B. & Lessler, J. (1991). Cognitive laboratory methods: A taxonomy. In P.Biemer, P.
Groves, L. Lyberg, N. Mathiowetz, & S. Sudman (Eds.), Measurement errors in surveys ( New
York: Wiley.
Fortenberry, J. D., Harezlak, J., Katz, B. P., & Orr, D. P. (2001). Use of diaries to evaluate sexual
behavours of adolescent women. 14th ISSTDR, Berlin.
Fortenberry, J. D. (2009). Beyond validity and reliability: Meaning‐in‐context of adolescent's
self‐reports of sexual behavior. Journal of Adolescent Health, 44, 199‐200.
Foster, G. (2002). Supporting community efforts to assist orphans in Africa. New England
Journal of Medicine, 346, 1907‐1910.
Foster, G. (2006). Children who live in communities affected by AIDS. Lancet, 367, 700‐701.
Freeman, E. E., Weiss, H. A., Glynn, J. R., Cross, P. L., Whitworth, J. A., & Hayes, R. J. (2006).
Herpes simplex virus 2 infection increases HIV acquisition in men and women: Systematic
review and meta‐analysis of longitudinal studies. [Miscellaneous Article]. AIDS, 20, 73‐83.
Fu, H., Darroch, J. E., Henshaw, S. K., & Kolb, E. (1998). Measuring the extent of abortion
underreporting in the 1995 national survey of family growth. Family Planning Perspectives, 30,
128‐133.

Bibliography 212
Fylkesnes, K., Musonda, R., Sichone, M., Ndlovu, Z., Tembo, F., & Monze, M. (2001). Declining
HIV prevalance and risk behaviours in Zambia: Evidence from surveillance and population‐
based surveys. AIDS, 15, 907‐916.
Gallo, M. F., Behets, F. M., Steiner, M. J., Hobbs, M. M., Hoke, T. H., van Damme, K. et al.
(2006). Prostate‐specific antigen to ascertain reliability of self‐reported coital exposure to
semen. Sexually Transmitted Diseases, 33, 476‐479.
Gallo, M. F., Behets, F. M., Steiner, M. J., Thomsen, S., Ombidi, W., Luchters.S. et al. (2007).
Validity of self‐reported 'safe sex' among female sex workers in Mombasa, Kenya‐PSA analysis.
International Journal of STD & AIDS, 18, 33‐38.
Gammeltoft, T. (2002). Seeking trust and tanscendences: sexual risk‐taking among Vietnamese
youth. Social Science and Medicine, 55, 483‐496.
Gerich, J. (2008). Real or virtual? Response behavior in video‐enhanced self‐administered
computer interviews. Field Methods, 20, 356‐376.
Gerich, J. & Bergmair, F. (2008). The application of video‐enhanced self‐administered
computer interviews for social research with children. Zeitschrift fur Soziologie der erziehung
und sozialisation, 28, 56‐74.
Gerich, J. & Lehner, R. (2006). Video computer‐assisted self‐administered interviews for deaf
respondents. Field Methods, 18, 267‐283.
Gfroerer, J., Wright, D., & Kopstein, A. (1997). Prevalence of youth substance use: the impact
of methodological differences between two national surveys. Drug and Alcohol Dependence,
47, 19‐30.
Glaser, B. & Strauss, A. (1967). The discovery of grounded theory: strategies for qualitative
research. New York: Aldine.
Glynn, J. R., Carael, M., Auvert, B., Kahindo, M., Chege, J., Musonda, R. et al. (2001). Why do
young women have a much higher prevalence of HIV than young men? A study in Kisumu,
Kenya and Ndola, Zambia. AIDS, 15, S51‐S60.
Goffman, E. (1959). The presentation of self in everyday life. London: Anchor.
Goldman, N., Moreno, L., & Westoff, C. F. (1989). Collection of survey data on contraception:
an evaluation of an experiment in Peru. Studies in Family Planning, 20, 147‐157.
Bibliography 213
Gouws, E., Stanecki, K. A., Lyerla, R., & Ghys, P. D. (2008). The epidemiology of HIV infection
among young people aged 15‐24 years in southern Africa. [Article]. AIDS, 22, S5‐S16.
Gregson, S. A. & Garnett, G. P. (2000). Contrasting gender differentials in HIV‐1 prevalence and
associated mortality increase in eastern and southern Africa: artefact of data or natural course
of epidemics? AIDS, 14, S85‐S99.
Gregson, S. A., Garnett, G. P., Nyamukapa, C. A., Hallett, T. B., Lewis, G., Mason, P. R. et al.
(2006). HIV decline associated with behaviour change in eastern Zimbabwe. Science, 311, 664‐
666.
Gregson, S. A., Mushati, P., White, P. J., Mlilo, M., Mundandi, C., & Nyamukapa, C. (2004).
Informal confidential voting interview methods and temporal changes in reported sexual risk
behaviour for HIV transmission in sub‐Saharan Africa. Sexually Transmitted Infections, 80, ii36‐
ii42.
Gregson, S. A., Nyamukapa, C. A., Garnett, G. P., Mason, P. R., Zhuwau, T., Carael, M. et al.
(2002a). Sexual mixing patterns and sex‐differentials in teenage exposure to HIV infection in
rural Zimbabwe. Lancet, 359, 1896‐1903.
Gregson, S. A., Zhuwau, T., Ndlovu, J., & Nyamukapa, C. A. (2002b). Methods to reduce social
desirability bias in sex surveys in low‐development settings: Experience in Zimbabwe. Sexually
Transmitted Diseases, 29, 568‐75.
Gribble, J. N., Miller, H. G., Rogers, S. M., & Turner, C. F. (1999). Interview Mode and
Measurement of Sexual Behaviors: Methodological Issues. The Journal of Sex Research, 36, 16‐
24.
Halkitis, P. N., Parsons, J. T., & Wilton, L. (2003). Barebacking among gay and bisexual men in
New York City: Explanations for the emergence of intentional unsafe behavior. Archives of
Sexual Behavior, 32, 351‐357.
Halkitis, P. N., Wilton, L., & Wolitski, R. J. (2005). Barebacking identity among HIV‐positive gay
and bisexual men: Demographic, psychological, and behavioral correlates. AIDS, 19, S27‐S35.
Hallett, T. B., Aberle‐Grasse, J., Bello, G., Boulos, L.‐M., Cayemittes, M. P. A., Cheluget, B. et al.
(2006). Declines in HIV prevalance can be associated with changing sexual behaviour in
Uganda, urban Kenya, Zimbabwe, and urban Haiti. Sexually Transmitted Infections, 82 , i1‐i8.
Bibliography 214
Halperin, D. T. & Epstein, H. (2004). Concurrent sexual partnerships help explain Africa's high
HIV prevalence: implications for prevention. Lancet, 264, 4‐6.
Halperin, D. T. & Epstein, H. (2007). Why is HIV prevalence so severe in Southern Africa?
Southern African Journal of HIV Medicine, 8, 19‐25.
Hanck, S. E., Blankenship, K. M., Irwin, K. S., West, B. S., & Kershaw, T. (2008). Assessment of
self‐reported sexual behavior and condom use among female sex workers in India using a
polling box approach: a preliminary report. Sexually Transmitted Diseases, 35, 489‐494.
Haram, L. (2005). AIDS and risk:The handling of uncertainty in northern Tanzania. Culture,
Health and Sexuality, 7, 1‐11.
Harrison, A. (2005). Young people and HIV/AIDS in South Africa: Prevalence of infection, risk
factors and social context. In S.S.Abdool Karim & Q. Abdool Karim (Eds.), HIV/AIDS in South
Africa Oxford, Oxford University Press.
Hazen, E., Schlozman, S., & Beresin, E. (2008). Adolescent psychological development: a
review. Pediatrics in Review, 29, 161‐167.
Hearn, K. D., O'Sullivan, L. F., & Dudley, C. D. (2003). Assessing reliability of Early Adolescent
Girls' Reports of Romantic and Sexual Behavior. Archives of Sexual Behavior, 32, 513‐521.
Hensel, D. J., Fortenberry, J. D., Harezlak, J., Anderson, J. G., & Orr, D. P. (2004). A daily diary
analysis of vaginal bleeding and coitus among adolescent women. Journal of Adolescent
Health, 34, 391‐394.
Hewett, P. C., Erulkar, A. S., & Mensch, B. S. (2003). The feasibility of computer‐assisted survey
interviewing in Africa: Experience from two rural districts in Kenya (Rep. No. 168). New York:
Population Council.
Hewett, P. C., Mensch, B. S., & Erulkar, A. S. (2004). Consistency in the reporting of sexual
behaviour by adolescent girls in Kenya: A comparison of interviewing methods. Sexually
Transmitted Infections, 80, ii43‐ii48.
Hewett, P. C., Mensch, B. S., Ribeiro, M. C. S. D., Jones, H. E., Lippman, S. A., Montgomery, M.
R. et al. (2008). Using sexually transmitted infection biomarkers to validate reporting of sexual
behavior within a randomized, experimental evaluation of interviewing methods. American
Journal of Epidemiology, 168, 202‐211.
Bibliography 215
Hoffmann, O., Boler, T., & Dick, B. (2006). Achieving the global goals on HIV among young
people most at risk in developing countries: young sex workers, injecting drug users and men
who have sex with men. In D.A.Ross, B. Dick, & J. Ferguson (Eds.), Preventing HIV/AIDS in
Young People: a systematic review of the evidence from developing countries (pp. 287‐316).
Geneva: WHO.
Holbrook, A. L., Green, M. C., & Krosnick, J. A. (2003). Telephone versus Face‐to‐Face
Interviewing of National Probability Samples with Long Questionnaires: Comparisons of
Respondent Satisficing and Social Desirability Bias. Public Opinion Quarterly, 79‐125.
Howard, B., Matinhure, N., McCurdy, S. A., & Johnson, C. A. (2006). Psychosocial disadvantage:
Preparation, grieving, remembrance, and recovery for orphans in eastern Zimbabwe. African
Journal of AIDS Research, 5.
Hughes, J. P. & McCauley, A. P. (1998). Improving the fit: Adolescents' needs and future
programs for sexual and reproductive health in developing countries. Studies in Family
Planning, 29, 233‐245.
Huygens, P., Kajura, E., Seeley, J., & Barton, T. (1996). Rethinking methods for the study of
sexual behaviour. Social Science and Medicine, 42, 221‐231.
International Monetary Fund (2009). IMF Emerging and Developing Economies List: World
Economic Outlook Database.
www.imf.org/external/pubs/ft/weo/2009/01/wepdata/groupshtm#oem [On‐line].
Jackson, D. J., Ngugi, E., Plummer, F. A., Kirui, P., Kariuki, C., Ndinya‐Achola, J. O. et al. (1999).
Stable antenatal HIV‐1 seroprevalance with high population mobility and marked
seroprevalence variation among sentinel sites within Nairobi, Kenya. AIDS, 13, 583‐589.
Jaspan, H. B., Flisher, A. J., Myer, L., Mathews, C., Seebregts, C., Berwick, J. R. et al. (2007).
Brief report: Methods for collecting sexual behaviour information from South African
adolescents‐‐a comparison of paper versus personal digital assistant questionnaires. Journal of
Adolescence, 30, 353‐359.
Jaya, J., Hindin, M. J., & Ahmed, S. (2008). Differences in young people's reports of sexual
behaviors according to interview methodology: a randomized trial in India. American Journal of
Public Health, 98, 169‐174.
Bibliography 216
Jewkes, R. K., Nduna, M., Levin, J., Jama, N., Dunkle, K. L., Puren, A. et al. (2008). Impact of
Stepping Stones on incidence of HIV and HSV‐2 and sexual behaviour in rural South Africa:
Cluster randomised controlled trial. British Medical Journal, 337, a506‐doi:10.1136/bmj.a506.
Johnson, A. M., Copas, A. J., Erens, B., Mandalia, S., Fenton, K. A., Korovessis, C. et al. (2001).
Effect of computer‐assisted self‐interviews on reporting of sexual HIV risk behaviours in a
general population sample: A methodological experiment. AIDS, 15, 111‐115.
Johnson, A. M., Wadsworth, J., Wellings, K., Bradshaw, S., & Field, J. (1992). Sexual lifestyles
and HIV risk. Nature, 360, 410‐412.
Johnston, J. & Walton, C. (1995). Reducing Response Effects for Sensitive Questions: A
computer‐Assisted Self Interview with Audio. Social Science Computer Review, 13, 304‐319.
Kamali, A., Carpenter, L. M., Whitworth, J. A. G., Pool, R., Ruberanter, A., & Ojwiya, A. (2000).
Seven‐year trends in HIV‐1 infection rates, and changes in sexual behaviour, among adults in
rural Uganda. AIDS, 14, 427‐434.
Kang, M. S., Dunbar, M., Roley, J., & Laver, S. (2006). Shaping the Health of Adolescents in
Zimbabwe (SHAZ) Survey questionnaire. Harare, University of Zimbabwe‐University of
California San Francisco Research Project, February.
Kann, L., Brener, N. D., Warren, C. W., Collins, J. L., & Giovino, G. A. (2002). An assessment of
the effect of data collection setting n the prevalence of health risk behaviors among
adolescents. Journal of Adolescent Health, 31, 327‐335.
Kaplan, B. (2001). Evaluating informatics applications ‐ some alternative approaches: Theory,
social interactionism, and call for methodological pluralism. International Journal of Medical
Informatics, 64, 39‐56.
Kinsey, A. C., Pomeroy, W. B., & Martin, C. E. (1948). Sexual behavior in the human male.
Philadelphia: W.B. Saunders.
Kinsey, A. C., Pomeroy, W. B., & Martin, C. E. (1953). Sexual behavior in the human female.
Philadelphia: W.B. Saunders.
Kirby, D. & Obasi, A. I. (2006). The effectiveness of sex education and HIV education
interventions in schools in developing countries. In D.A.Ross, B. Dick, & J. Ferguson (Eds.),
Preventing HIV/AIDS in Young People: a systematic review of the evidence from developing
countries (pp. 103‐150). Geneva: WHO.
Bibliography 217
Kirby, D., Short, L., Collins, J., Rugg, D., Kolb, E., Howard, M. et al. (1994). School based
programmes to decrease sexual risk behaviours: a review of effectiveness. Public Health
Reports, 109, 339‐360.
Kissinger, P., Rice, J., Farley, T., Trim, S., Jewitt, K., Margavio, V. et al. (1999). Application of
computer‐assisted interviews to sexual behavior research. American Journal of Epidemiology,
149, 950‐954.
Klimes‐Dougan, B. (1998). Screening for suicidal ideation in children and adolescents:
methodological considerations. Journal of Adolescence, 21, 435‐444.
Knapp, H. & Kirk, S. A. (2003). Using pencil and paper, internet and touch‐tone phones for self‐
administered surveys: does methodology matter? Computers in Human Behavior, 19, 117‐134.
Koenig, M. A., Jejeebhoy, S., Singh, S., & Sridhar, S. (1998). Investigating women's
gynaecological morbidity in India: not just another KAP survey. Reproductive Health Matters, 6,
84‐97.
Konings, E., Bantebya, G., Carael, M., Bagenda, D., & Mertens, T. (1995). Validating population
surveys for the measurement of HIV/STD prevention indicators. AIDS, 9, 375‐82.
Kreuter, F., Presser, S., & Tourangeau, R. (2008). Social desirability bias in CATI, IVR, and web
surveys: the effects of mode and question sensitivity. Public Opinion Quarterly, 72, 847‐865.
Kristensen, S., Sinkala, M., & Vermund, S. (2002). Transmission of HIV. In M.Essex, S. Mboup, P.
Kanki, R. Marlink, & S. Tlou (Eds.), AIDS in Africa ( New York: Kluwer Academic Press.
Kurth, A., Spielberg, F., Rossini, A., & UW ACASI Working Group. (2001). STD/HIV risk: what
should we measure, and how shoudl we measure it>. 14th ISSTDR, Berlin.
Kurth, A. E., Martin, D. P., Golden, M. R., Weiss, N. S., Heagerty, P. J., Spielbery, F. et al. (2004).
A comparison between audio computer‐assisted self‐interviews and clinician interviews for
obtaining the sexual history. Sexually Transmitted Diseases, 31, 719‐726.
Kushniruk, A. (2002). Evaluation in the design of health information systems: Application of
approaches emerging from usability engineering. Computers in Biology and Medicine, 32, 141‐
149.
Laga, M., Schwartlander, B., Pisani, E., Salif Sow, P., & Carael, M. (2001). To stem HIV in Africa,
prevent transmission to young women. AIDS, 15, 931‐934.
Bibliography 218
Lagarde, E., Enel, C., & Pison, G. (1995). Reliability of reports of seuxal behavior: a study of
married couples in rural west Africa. American Journal of Epidemiology, 141, 1194‐1200.
Lane, S. J., Heddle, N. M., Arnold, E., & Walker, I. (2006). A review of randomized controlled
trials comparing the effectiveness of hand held computers with paper methods for data
collection. BMC Medical Informatics & Decision Making, 6.
Lane, T., Pettifor, A. E., Pascoe, S. J. S., Fiamma, A., & Rees, H. V. (2006). Heterosexual anal
intercourse increases risk of HIV infection among young South Africa men [Letter]. AIDS, 20,
123‐125.
Langeni, T. (2007). Contextual factors associated with treatment‐seeking and high‐risk sexual
behavior in Botswana among men with symptoms of sexually transmitted infections. African
Journal of AIDS Research, 6, 251‐269.
Langhaug, L. F., Cheung, Y. B., Pascoe, S. J. S., Mavhu, W., Chirawu, P., & Cowan, F. M. (2007).
Comparing four questionnaire delivery methods for collection of self‐reported sexual
behaviour data in rural Zimbabwean youth. 17th ISSTDR, Seattle.
Langhaug, L. F., Cheung, Y. B., Pascoe, S. J. S., Chirawu, P., Woelk, G., Hayes, R. J. et al. (2009).
How you ask the question really matters: a randomized comparison of four questionnaire
delivery modes to assess validity and reliability of self‐reported data on sexual behaviour in
young people in rural Zimbabwe. Sexually Transmitted Infections, submitted.
Langhaug, L. F., Cheung, Y. B., Pascoe, S. J. S., Hayes, R. J., & Cowan, F. M. (2009). Difference in
prevalence of common mental disorder as measured using four questionnaire delivery
methods among young people in rural Zimbabwe. Journal of Affective Disorders, (in press).
Lara, D., Strickler, J., Olavarrieta Diaz, C., & Ellerston, C. (2004). Measuring induced abortion in
Mexico: A comparison of four methodologies. Sociological Methods & Research, 21, 529‐558.
Lau, J. T. F., Thomas, J., & Liu, J. L. Y. (2000). Mobile phone and interactive computer
interviewing to measure HIV‐related risk behaviours: The impacts of data collection methods
on research results. [References]. AIDS, 14, 1277‐1279.
Lau, J. T. F., Tsui, H. Y., & Wang, Q. S. (2003). Effects of two telephone survey methods on the
level of reported risk behaviours. Sexually Transmitted Infections, 79, 325‐331.
Lauritsen, J. L. & Swicegood, C. G. (1997). The consistency of self‐reported initiation of sexual
activity. Family Planning Perspectives, 29, 215‐221.
Bibliography 219
Le, L. C., Blum, R. W., Magnani, R., Hewett, P. C., & Do, H. M. (2006). A pilot of audio computer‐
assisted self‐interview for youth reproductive health research in Vietnam. Journal of
Adolescent Health, 38, 740‐747.
Leclerc‐Madlala, S. (2008). Age‐disparate and intergenerational sex in southern Africa: the
dynamics of hypervulnerability. AIDS, 22, S17‐S25.
Lewis, G., Pelosi, A., & Araya, R. (1992). Measuring psychiatric disorder in the community: a
standard assessment for use by lay interviewers. Psychological Medicine, 22, 465‐486.
Liu, H. & Detels, R. (1999). An approach to improve valdiity of responses in a sexual behavior
study in a rural area of China. AIDS and Behavior, 3, 243‐249.
Luke, N. (2003). Age and economic asymmetries in the sexual relationships of adolescent girls
in Sub‐Saharan Africa. Studies in Family Planning, 34, 67‐86.
Luke, N. (2005). Confronting the 'Sugar Daddy' stereotype:age and economic asymmetries and
risky sexual behavior in urban Kenya. International Family Planning Perspectives, 31, 6‐14.
Macalino, G., Celentano, D., Latkin, C., Stathdee, C., & Vlahov, D. (2002). Risk behaviours by
audio‐computer‐assisted self interviews among HIV‐seropositive and HIV‐seronegative
injection drug users. AIDS Education and Prevention, 367‐378.
MacLachlan, E., Baganizi, E., Maiga, O., Bougoudogo, F., Castle, S., & Parker, K. (2001).
Feasibility of integrated biological and behavioral surveys. 14th ISSTDR, Berlin.
MacPhail, C., Williams, B. G., & Campbell, C. (2002). Relative risk of HIV infection among young
men and women in a South African township. International Journal of STD & AIDS, 13, 331‐342.
Macro International Inc. (2009). Demographic Health Surveys.
Mahomva, A., Greby, S., Dube, S., Mugurungi, O., Hargrove, O., Rosen, D. et al. (2006). HIV
prevalence and trends from data in Zimbabwe, 1997‐2004. Sexually Transmitted Infections, 82,
42‐47.
Makwiza, I., Nyirenda, L., Goma, F., Hassan, F., Chingombe, I., Bongololo, G. et al. (2006).
Equity and health system strengthening in ART role out: an analysis from literature review of
experiences from east and southern Africa. (Rep. No. EQUINET Discussion Paper Series 38).
Malawi: The REACH Trsut.
Bibliography 220
Martin, J. L. & Vance, C. S. (1984). Behavioral and psychosocial factors in AIDS. American
Psychologist, 39, 1303‐1308.
Matasha, E., Ntembelea, T., Mayaud, P., Saidi, W., Todd, J., Muyaya, B. et al. (1998). Sexual and
reproductive health among primary and secondary school pupils in Mwanza, Tanzania: need
for intervention. AIDS Care, 10, 571‐582.
Maticka‐Tyndale, E. & Brouillard‐Coyle, C. (2006). The effectiveness of community
interventions targeting HIV and AIDS prevention at young people in developing countries. In
D.A.Ross, B. Dick, & J. Ferguson (Eds.), Preventing HIV/AIDS in Young People: a systematic
review of the evidence from developing countries (pp. 243‐285). Geneva: WHO.
Maticka‐Tyndale, E., Gallant, M., Brouillard‐Coyle, C., Holland, D., Metcalfe, K., Wildish, J. et al.
(2005). The sexual scripts of Kenyan young people and HIV prevention. Culture, Health and
Sexuality, 7, 27‐41.
Mavhu, W., Langhaug, L. F., Manyonga, B., Power, R., & Cowan, F. M. (2008). What is 'sex'
exactly? Using cognitive interviewing to improve validity of sexual behaviour reporting among
young people in rural Zimbabwe . Culture, Health, and Sexuality, 10, 563‐572.
McFarlane, M. & St.Lawrence, J. S. (1999). Adolescent's Recall of Sexual Behavior: Consistency
of self‐report and effect of variations in recall duration. Journal of Adolescent Health, 25, 199‐
206.
Mehta, C. R. & Patel, N. R. (1983). A network algorithm for performing Fisher's exact test in r x
c contingency tables. Journal of American Statistics, 78, 427‐434.
Mensch, B. S., Hewett, P. C., & Erulkar, A. S. (2003). The reporting of sensitive behavior by
adolescents: a methodological experiment in Kenya. [Review] [76 refs]. Demography, 40, 247‐
268.
Mensch, B. S., Hewett, P. C., Gregory, R., & Helleringer, S. (2008). Sexual behavior and STI/HIV
status among adolescents in rural Malawi: an evaluation of the effect of interview mode on
reporting. Studies in Family Planning, 39, 321‐334.
Metzger, D. S., Koblin, B., Turner, C. F., Navaline, H., Valenti, F., Holte, S. et al. (2000a).
Randomized controlled trial of audio computer‐assisted self‐interviewing: Utility and
acceptability in longitudinal studies. American Journal of Epidemiology, 152, 99‐106.
Bibliography 221
Michaud, P. A., Narring, F., & Ferron, C. (1999). Alternative methods in the investigation of
adolescents' sexual life. Journal of Adolescent Health, 25, 84‐90.
Millstein, S. G. & Irwin, C. E., Jr. (1983). Acceptability of computer‐acquired sexual histories in
adolescent girls. Journal of Pediatrics, 103, 815‐819.
Ministry of Health & Child Welfare (Zimbabwe), Health Information and Surveillance Unit, &
Dept of Disease Prevention and Control (2000). National Survey of HIV and Syphilis Prevalance
among Antenatal Women in Zimbabwe.
Ministry of Health & Child Welfare (Zimbabwe), Zimbabwe National Family Planning Council,
National AIDS Council (Zimbabwe), & U.S.Centers for Disease Control and Prevention (2004).
The Zimbabwe Young Adult Survey 2001‐2002 Harare, Zimbabwe: Ministry of Health and Child
Welfare and U.S. Centers for Disease Control and Prevention.
Minnis, A. M., Muchini, A., Shiboski, S., Mwale, M., Morrison, C., Chipato, T. et al. (2007). Audio
computer‐assisted self‐interviewing in reproductive health research: reliability assessment
among women in Harare, Zimbabwe. Contraception, 75, 59‐65.
Mitchell, K., Wellings, K., Elam, G., Erens, B., Fenton, K. A., & Johnson, A. M. (2007). How can
we facilitate reliable reporting in surveys of sexual behaviour? Evidence from qualitative
research. Culture, Health and Sexuality, 9, 519‐531.
Modi, M. (2000). Surveys measuring well‐being: National Longitudinal Study of Adolescent
Health. http://www.wws.princeton.edu/~kling/surveys/AddHealth.html [On‐line].
Morris, M. & Kretzschmar, M. (1997). Concurrent partnerships and the spread of HIV. AIDS, 11,
681‐683.
Morrison‐Beedy, D., Carey, M. P., & Tu, X. (2006). Accuracy of audio computer‐assisted self‐
interviewing (ACASI) and self‐administered questionnaires for the assessment of sexual
behavior. AIDS Behavior, 10, 541‐552.
Moum, T. (1998). Mode of administration and interviewer effects in self‐reported symptoms of
anxiety and depression. Social Indicators Research, 45, 279‐318.
Mshana, G., Plummer, M. L., Wamoyi, J., Shigongo, Z. S., Ross, D. A., & Wight, D. (2006). 'She
was bewitched and caught an illness similar to AIDS': AIDS and sexually transmitted infection
causation beliefs in rural northern Tanzania. Culture, Health and Sexuality, 8, 45‐58.
Bibliography 222
Murphy, D. A., Durako, S., Muenz, L. R., & Wilson, C. M. (2000). Marijuana use among HIV‐
positive and high‐risk adolescents: a comparison of self‐report through audio computer‐
assisted self‐administered interviewing and urinalysis. American Journal of Epidemiology, 152,
805‐813.
Nass, C., Moon, Y., & Green, N. (1997). Are machines gender neutral? Gender‐sterotypic
responses to computers. Journal of Applied Social Psychology, 27, 864‐876.
Nass, C., Robles, E., Heenan, C., Bienstock, H., & Treinen, M. (2003). Speech‐based disclosure
systems: Effects of modality, gender of prompt, and gender of user. International Journal of
Speech Technology, 6, 113‐121.
Newcomer, S. & Udry, J. R. (1988). Adolescents' honesty in a survey of sexual behavior. Journal
of Adolescent Research, 3, 419‐423.
Newman, J. C., Des, J., Turner, C. F., Gribble, J. N., Cooley, P., & Paone, D. (2002). The
differential effects of face‐to‐face and computer interview modes. American Journal of Public
Health, 92, 294‐297.
NIMH Multisite HIV/STD Prevention Trial for African American Couples Group (2008).
Designing an audio computer‐assisted self‐Interview (ACASI) system in a multisite trial: A brief
report. Journal of Acquired Immune Deficiency Syndromes, 49, S52‐S58.
Nnko, S., Boerma, J. T., Urassa, M., Mwaluko, G., & Zaba, B. (2004). Secretive females or
swaggering males? An assessment of the quality of sexual partnership reporting in rural
Tanzania. Social Science and Medicine, 59, 299‐310.
Nyamukapa, C. A., Gregson, S. A., Lopman, B., Saito, S., Watts, H. J., Monasch, R. et al. (2008).
HIV‐associated orphanhood and children's psychosocial distress: theoretical framework tested
with data from Zimbabwe. American Journal of Public Health, 98, 133‐141.
Nyanzi, B., Nyanzi, S., Wolff, B., & Whitworth, J. A. G. (2005). Money, men and markets:
economic and sexual empowerment of market women in southwestern Uganda. Culture,
Health and Sexuality, 7, 13‐26.
Padian, N. S., Buve, A., Balkus, J., Serwadda, D., & Cates, W. (2008). Biomedical interventions to
prevent HIV infection: evidence, challenges, and way forward. Lancet, 372, 585‐99.
Bibliography 223
Palen, L. A., Graham, J. W., Smith, E. A., Caldwell, L. L., Mathews, C., & Flisher, A. J. (2008a).
Rates of missing responses in personal digital assistant (PDA) versus paper assessments.
Evaluation Review, 32, 257.
Palen, L. A., Smith, E. A., Caldwell, L. L., Flisher, A. J., Wegner, L., & Vergnani, T. (2008b).
Inconsistent reports of sexual intercourse among South Africa high school students. Journal of
Adolescent Health, 42, 221‐227.
Pascoe, S. J. S., Langhaug, L. F., Dirawo, J., Jaffar, S., Hayes, R. J., & Cowan, F. M. (2005). HIV
among orphans and vulnerable children in rural Zimbabwe: data from the Regai Dzive Shiri
Project adolescent reproductive health trial in rural Zimbabwe. 16th ISSTDR Amsterdam.
Pascoe, S. J. S., Langhaug, L. F., Tumbare, R., Mudzori, J., Musabaike, H., Burke, E. et al. (2007).
Is HIV prevalence declining in young Zimbabweans? Data from a population‐based survey. 16th
ISSTDR, Amsterdam.
Pascoe, S. J. S., Langhaug, L. F., Durawo, J., Woelk, G., Ferrand, R., Jaffar, S. et al. (2009).
Increased risk of HIV‐infection among school‐attending orphans in rural Zimbabwe. AIDS Care.
Patel, V. & Mann, A. (1997). Etic and emic criteria for non‐psychotic mental disorder: a study of
the CISR and care provider assessment in Harare. Social Psychiatry and Psychiatric
Epidemiology, 32, 84‐89.
Patel, V., Simunyu, E., Gwanzura, F., Lewis, G., & Mann, A. (1997). The Shona Symptom
Questionnaire: the development of an indigenous measure of common mental disorders in
Harare. Acta Psychiatrica Scandinavia, 95, 469‐475.
Paulhus, D. L. (2002). The role of constructs in psychological and educational measurement. In
H.I.Braun, D. N. Jackson, & D. E. Wiley (Eds.), Socially desirable responding: The evolution of a
construct (pp. 49‐69). Mahwah, New Jersey: Erlbaum.
Peterman, T. A., Lin, L. S., Newman, D. R., Kamb, M. L., Bolan, G., Zenilman, J. et al. (2000).
Does measured behavior reflect STD risk? An analysis of data from a randomized controlled
behavioral intervention study. Project RESPECT Study Group. Sexually Transmitted Diseases,
27, 446‐451.
Pettifor, A. E., Kleinschmidt, I., Levin, J., Rees, H. V., MacPhail, C., Hlonga‐Madikizela, L. et al.
(2005a). A community‐based study to examine the effect of a youth HIV prevention
Bibliography 224
intervention on young people aged 15‐24 in South Africa: results of the baseline survey.
Tropical Medicine & International Health, 10, 971‐980.
Pettifor, A. E., Rees, H. V., Kleinschmidt, I., Steffenson, A. E., MacPhail, C., Hlonga‐Madikizela, L.
et al. (2005b). Young people's sexual health in South Africa: HIV prevalance and sexual
behaviours from a nationally representative household survey. AIDS, 19, 1525‐1534.
Phillips, A. E., Lowndes, C. M., Boily, M. C., Gurav, K., Ramesh, B. M., Anthony, J. et al. (2007).
Comparison of informal confidential voting and face‐to‐face interviewing in collecting sexual
research data from men who have sex with men (MSM) and transgenders (HIJRA) in Bangalore.
17th ISSTDR, Seattle.
Pluhar, E., McDonnell Holstad, M., Yeager, K. A., Denzmore‐Nwagbara, P., Corkran, C., Fielder,
B. et al. (2007). Implementation of audio computer‐assisted interviewing software in HIV/AIDS
research. Journal of the Association of Nurses in AIDS Care, 18, 51‐63.
Plummer, M. L., Ross, D. A., Wight, D., Changalucha, J., Mshana, G., Wamoyi, J. et al. (2004a).
"A bit more truthful": the validity of adolescent sexual behaviour data collected in rural
northern Tanzania using five methods. Sexually Transmitted Infections, 80, ii49‐ii56.
Plummer, M. L., Wight, D., Ross, D. A., Balira, R., Anemona, A., Todd, J. et al. (2004b). Asking
semi‐literate adolescents about sexual behaviour: the validity of assisted self‐completion
questionnaire (ASCQ) data in rural Tanzania. Tropical Medicine & International Health, 9, 737‐
754.
Ponce, N. A., Lavarreda, S. A., Yen, W., Brown, E. R., DiSogra, C., & Satter, D. E. (2009). The
California Health Interview Survey 2001: Translation of a major survey for California's
multiethnic population. Public Health Reports, 119, 388‐395.
Potdar, R. & Koenig, M. A. (2005). Does Audio‐CASI improve reports of risky behavior?
Evidence from a randomized field trial among young urban men in India. Studies in Family
Planning, 36, 107‐116.
Potts, M., Halperin, D. T., Kirby, D., Swidler, A., Marseille, E., Klausner, J. D. et al. (2008).
Reassessing HIV prevention. Science, 320, 750.
Power, R., Langhaug, L. F., Nyamurera, T., Wilson, D., Bassett, M. T., & Cowan, F. M. (2004).
Developing complex interventions for rigorous evaluation ‐ a case study from rural Zimbabwe.
Health Education Research, 19, 570‐575.
Bibliography 225
Prochaska, J. & DiClemente, C. (1992). Stages of change in the modification of problem
behaviours. Progress in Behavior Modification, 28, 183‐218.
Qadir, F., Stewart, R., Khan, M., & Prince, M. (2005). The validity of the Parental Bonding
Instrument as a measure of maternal bonding among young Pakistani women. Social
Psychiatry and Psychiatric Epidemiology, 40, 276‐282.
Ramjee, G., Weber, A. E., & Morar, N. S. (1999). Recording sexual behavior: Comparison of
recall questionnaires with a coital diary. Sexually Transmitted Diseases, 26, 374‐380.
Ranchod‐Nilsson, S. (2001). Zimbabwe: Women's rights and African custom. In L.Walter (Ed.),
Women's Rights: A Global View (pp. 199‐212). London: Greenwood Press.
Reproductive Health and HIV Research Unit. National Youth Survey Questionnaire.
Johannesburg, South Africa, Reproductive Health and HIV Research Unit.
Rodgers, J. L., Billy, J. O. G., & Udry, J. R. (1982). The rescission of behaviours: inconsistent
responses in adolescent sexuality data. Social Science Research, 11, 280‐296.
Roese, N. J. & Jamieson, D. W. (1993). Twenty years of bogus pipeline research: A critical
review and meta‐analysis. Psychological Bulletin, 114, 363‐375.
Rogers, S. M. & Turner, C. F. (1991). Male‐male sexual contact in the U.S.A.: findings from five
sample surveys, 1970‐1990. The Journal of Sex Research, 28, 491‐519.
Rose, E., DiClemente, R. J., Wingoood, G. M., McDermott Sales, J., Latham, T. P., Crosby, R. A.
et al. (2009). The validity of teen's and young adults' self‐reported condom use. Archives of
Pediatrics and Adolescent Medicine, 163, 61‐64.
Rosenbaum, J. E. (2006). Reborn a virgin: Adolescents' retracting of virginity pledges and sexual
histories. American Journal of Public Health, 96, 1098‐1103.
Ross, D. A., Changalucha, J., Obasi, A. I., Todd, J., Plummer, M. L., Cleophas‐Mazige, B. et al.
(2007). Biological and behavioural impact of an adolescent sexual health intervention in
Tanzania: a community‐randomized trial. AIDS, 21, 1943‐1955.
Rumakom, P., Guest, P., Chinvarasopak, W., Utarmat, W., & Sontanakanit, J. (2005). Obtaining
accurate responses to sensitive questions among Thai students: a comparison of two data
collection techniques. In S. Jejeebhoy, I. Shah, & S. Thapa (Eds.), Sex without consent ( London:
Zed Books.
Bibliography 226
Schachter, J. (2000). Biologic versus behavioral endpoints‐‐the duet continues. Sex Transm Dis.,
27, 456‐457.
Schopper, D., Doussantousee, S., & Orav, J. (1993). Sexual behaviors relevant to HIV
transmission in a rural African population: how much can a KAP survey tell us? Social Science
and Medicine, 37, 401‐412.
Sedyaningsih‐Mamahit, E. & Gortmaker, S. (2003). Reproducibility and validity of self‐reported
condom use in Jakarta. Southeast Asian Journal of Tropical Medicine & Public Health, 34, 136‐
146.
Seebregts, C. J., Zwarenstein, M., Mathews, C., Fairall, L., Flisher, A. J., Seebregts, C. et al.
Handheld computers for survey and trial data collection in resource‐poor settings:
Development and evaluation of PDACT, a Palm Pilot interviewing system. International Journal
of Medical Informatics, (in press).
Shaw, C. & Aggleton, P. (2002). Preventing HIV/AIDS and promoting sexual health among
especially vulnerable young people (Rep. No. ISBN 0 85432 783 5; WHO/HIV/2002.23).
Southamptom, UK: University of Southampton.
Sherr, L., Fishbein, M., Spire, B., Moatti, J. P., Shisana, O., Prince, B. et al. (2008). Contexts and
complexity ‐special considerations in HIV and social science (editorial). AIDS Care, 20, 507‐508.
Siegel, D. M., Aten, M. J., & Roghmannn, K. J. (1998). Self‐reported honesty among middle and
high school students responding to a sexual behavior questionnaire. Journal of Adolescent
Health, 23, 20‐28.
Silver, B. D., Abramson, P. R., & Anderson, B. A. (1986). The presence of others and
overreporting of voting in American national elections. Public Opinion Quarterly, 50, 228‐239.
Simoes, A. A., Bastos, F. I., Moreira, R. I., Lynch, K. G., & Metzger, D. S. (2006). A randomized
trial of audio computer and in‐person interview to assess HIV risk among drug and alcohol
users in Rio De Janeiro, Brazil. Journal of Substance Abuse Treatment, 30, 237‐43.
Spencer, L., Faulkner, A., & Keegan, J. (1988). Talking about sex: Asking the public about sexual
behaviour and attitudes. London: Social and Community Planning Research (SCPR).
Stirling, M., Rees, H., Kasedde, S., & Hankins, C. (2008). Introduction: Addressing the
vulnerability of young women and girls to stop the HIV epidemic in southern Africa. AIDS, 22,
S1‐S3.
Bibliography 227
Stone, A. A., Shiffman, S., Schwartz, J. E., & Hufford, M. R. (2002). Patient non‐compliance with
paper diaries. British Medical Journal, 324, 1193‐1194.
Sudman, S., Bradburn, N., & Schwartz, N. (1996a). Methods for determining cognitive
processes and questionnaire problems. In S.Sudman, N. Bradburn, & N. Schwartz (Eds.),
Thinking about answers: The application of cognitive processes to survey methodology (pp. 15‐
54). San Francisco: Joey‐Bass.
Sudman, S., Bradburn, N., & Schwartz, N. (1996b). Thinking about Answers: The application of
cognitive processes to survey methodology. San Francisco: Jossey‐Bass.
Sundet, J. M., Magnus, P., Kvalem, I. L., Groennesby, J. K., & Bakketeig, L. S. (1989). Number of
sexual partners and the use of condoms in the population of Norway‐Relevance of HIV‐
infection. Health Policy, 13, 159‐167.
Testa, M., Livingston, J. A., & VanZile‐Tamsen, C. (2005). The impact of questionnaire
administration mode on response rate and reporting of consensual and non‐consensual sexual
behavior. Psychology of Women Quarterly, 29, 345‐352.
Tourangeau, R. (1984). Cognitive science and survey methods. In T.Jabine, Straf.M., J. Tanur, &
R. Tourangeau (Eds.), Cognitive aspects of survey design: building a bridge between disciplines
(pp. 73‐100). Washington D.C.: National Academic Press.
Tourangeau, R. & Rasinski, K. (1988). Cognitive process underlying context effects in attitude
measurement. Psychological Bulletin, 103, 299‐314.
Tourangeau, R. & Smith, T. W. (1996). The impact of data collection mode, question format,
and question context. Public Opinion Quarterly, 60, 275‐304.
Tourangeau, R., Smith, T. W., & Raskinski, K. A. (1997). Motivation to report sensitive behaviors
on surveys: Evidence from a bogus pipeline experiment. Journal of Applied Social Psychology,
27, 209‐222.
Tourangeau, R., Rips, LJ., & Rasinski, K. (2000). The Psychology of Survey Response. Cambridge:
Cambridge University Press.
Tourangeau, R., Couper, M. P., & Steiger, D. M. (2003). Humanizing self‐administered surveys:
Experiments on social presence in web and IVR surveys. Computers in Human Behavior, 19, 1‐
24.
Bibliography 228
Tourangeau, R. & Yan, T. (2007). Sensitive questions in surveys. Psychological Bulletin, 133,
859‐883.
Turner, C. F., Danella, R. D., & Rogers, S. M. (1995). Sexual behavior in the United States 1930‐
1990: trends and methodological problems. Sex Transm Dis., 22, 173‐190.
Turner, C. F., Ku, L., Rogers, S. M., Lindberg, L. D., Pleck, J. H., & Sonenstein, F. L. (1998).
Adolescent sexual behavior, drug use, and violence: Increased reporting with computer survey
technology. Science, 280, 867‐873.
Turner, C. F., Rogers, S. M., Hendershot, T. P., Miller, H. G., & Thornberry, J. P. (1996).
Improving representation of linguistic minorities in health surveys. Public Health Reports, 111,
276‐279.
U.S.Department of Health and Human Services, Public Health Services, & Center for Disease
Control and Prevention (2000). Serologic assays for human immunodeficiency virus antibody in
dried blood specimens collected on filter paper.
UNAIDS. (1998). Looking deeper into the HIV epidemic: A questionnaire for tracing sexual
networks.
UNAIDS (1999). AIDS epidemic update Geneva: Joint United Nations Programme on HIV/AIDS.
UNAIDS (2006). AIDS Epidemic Update: special report on HIV/AIDS: December 2006.
UNAIDS (2007). AIDS epidemic update: December 2006 Geneva: Joint United Nationsl
Programme on HIV/AIDS.
UNAIDS (2008). AIDS epidemic update: December 2007 (Rep. No. UNAIDS/07.27E/JC1322E).
UNAIDS Interagency Task Team on Young People (2006). Preventing HIV/AIDS in young people:
A systematic review of the evidence from developing countries. (WHO Technical Report Series
No. 938 ed.) Geneva: WHO.
United Nations Children's Educational Fund (UNICEF) (2005). Guide to monitoring and
evaluation of the national response for children orphaned and made vulnerable by HIV/AIDS
New York: UNICEF.
United Nations Children's Educational Fund (UNICEF) (2008). UNICEF: Information by Country.
http://www.unicef.org/infobycountry/index.html [On‐line].
Bibliography 229
van de Wijgert, J., Padian, N. S., Shiboski, S., & Turner, C. F. (2000). Is audio computer assited
interviewing a feasible method of surveying in Zimbabwe? International Journal of
Epidemiology, 29, 885‐890.
van Griensven, F., Naorat, S., Kilmarx, P. H., Jeeyapant, S., Manopaiboon, C., Chaikummao, S. et
al. (2006). Palmtop‐assisted self‐interviewing for the collection of sensitive behavioral data:
randomized trial with drug use urine testing. American Journal of Epidemiology, 163, 271‐278.
van Griensven, F., Supawitkul, S., Kilmarx, P. H., Limpakarnjanarat, K., Young, N. L.,
Manopaiboon, C. et al. (2008). Rapid assessment of sexual behavior, drug use, human
immunodeficiency virus, and sexually transmitted diseases in northern Thai youth using audio‐
computer‐assisted self‐interviewing and noninvasive specimen collection. Pediatrics, 108, E13.
Vanable, P. A., Carey, M. P., Brown, J. L., DiClemente, R. J., Salazar, L. F., Brown, L. K. et al.
(2009). Test‐retest of self‐reported HIV/STD‐related measures among African‐American
adolescents in four U.S. cities. Journal of Adolescent Health, 44, 214‐221.
Wawer, M. J., Serwadda, D., Gray, R. H., Sewankambo, N. K., Li, C., Nalugoda, F. et al. (1997).
Trends in HIV‐1 prevalence may not reflect trends in incidence in mature epidemics: data from
the Rakai population‐based cohort, Uganda. AIDS, 11, 1023‐1030.
Webb, P. M., Zimet, G. D., Fortenberry, J. D., & Blythe, M. J. (1999). Comparability of a
computer‐assisted versus written method for collecting health behavior information from
adolescent patients. Journal of Adolescent Health, 24, 383‐388.
Weinhardt, L. S., Forsyth, A. D., Carey, M. P., Jaworski, B. A., & Durant, L. E. (1998). Reliability
and validity of self report measures of HIV‐related sexual behavior: progress since 1990 and
recommendations for research and practice. Archives of Sexual Behavior, 27, 155‐180.
Wellings, K., Nanchahal, K., Macdowall, W., McManus, S., Erens, B., Mercer, C. H. et al. (2001).
Sexual behaviour in Britain: early heterosexual experience. The Lancet, 358, 1843‐1850.
Werch, C. E., Gorman, D. R., & Marty, P. J. (1987). Effects of the bogus‐pipeline on enhancing
validity of self‐reported adolescent drug use measures. Journal of School Health, 57, 232‐236.
Whitworth, J. A. G., Mahe, C., Mbulaiteye, S. M., Nakiyingi, J., Ruberantwari, A., Ojwiya.A. et al.
(2002). HIV‐1 epidemic trends in rural south‐west Uganda over a 10‐year period. Tropical
Medicine & International Health, 7, 1047‐1052.
Bibliography 230
Wight, D., Plummer, M. L., Mshana, G., Wamoyi, J., Shigongo, Z. S., & Ross, D. A. (2006).
Contradictory sexual norms and expectations for young people in rural Northern Tanzania.
Social Science and Medicine, 62, 987‐997.
Wikepedia (2009). Developing Country. http://en.wikepedia.org/wiki/Developing_country [On‐
line].
Willis, G. (2005). Cognitive Interviewing: A tool for improving questionnaire design. London:
Sage.
Willis, G. B. (1999). Cognitive interviewing: a 'how to' guide Washington, DC: Research Triangle
Institute.
Wilson, D. & Halperin, D. T. (2008). "Know your epidemic, know your response": a useful
approach, if we get it right. Lancet, 372, 423‐426.
World Bank (2009). Data and Statistics. go.worldbank.org/K2CKM78CC0 [On‐line].
World Health Organization (2009). India.
http://www.searo.who.int/LinkFiles/Country_Health_System_Profile_4‐India.pdf [On‐line].
Zaba, B., Pisani, E., Slaymaker, E., & Boerma, J. T. (2004). Age at first sex: understanding recent
trends in African demographic surveys. Sexually Transmitted Infections, 80, 28‐3.
Zenilman, J. M., Weisman, C. S., Rompalo, A. M., Ellish, N., Upchurch, D. M., Hook, E. W., III et
al. (1995). Condom use to prevent incident STDs: the validity of self‐reported condom use.
Sexually Transmitted Diseases, 22, 15‐21.
Zimbabwe Ministry of Health (2007). Zimbabwe National HIV and AIDS Estimates Harare:
Zimbabwe Ministry of Health.
231
Appendices
Appendix A Systematic Review Search Terms ................................................................ 232
Appendix B RDS Project Ethics Approvals ...................................................................... 234
Appendix C RDS Interim Questionnaire ......................................................................... 239
Appendix D RDS Interim ACASI Flow Chart .................................................................... 267
Appendix E RDS Interim Ballot Sheet ............................................................................ 268
Appendix F RDS Interim Welcome & Practice Instructions ............................................ 271
Appendix G RDS Interim Survey – Sample Participant Invitation Letter ......................... 277
Appendix H RDS Interim Survey‐ Booklet Covers ........................................................... 280
Appendix I RDS Interim Survey – Information Sheet & Consent Form .......................... 281
Appendix J RDS Interim Survey Method Codes ............................................................. 285
Appendix K RDS Post Survey Questionnaire .................................................................. 286
Appendix L RDS Post Survey Interview Topic Guide ...................................................... 289
Appendix M Additional Qualitative Quotes .................................................................... 293
Appendix N ACASI Practice Instruction .......................................................................... 296
Appendix O Papers Published ........................................................................................ 302
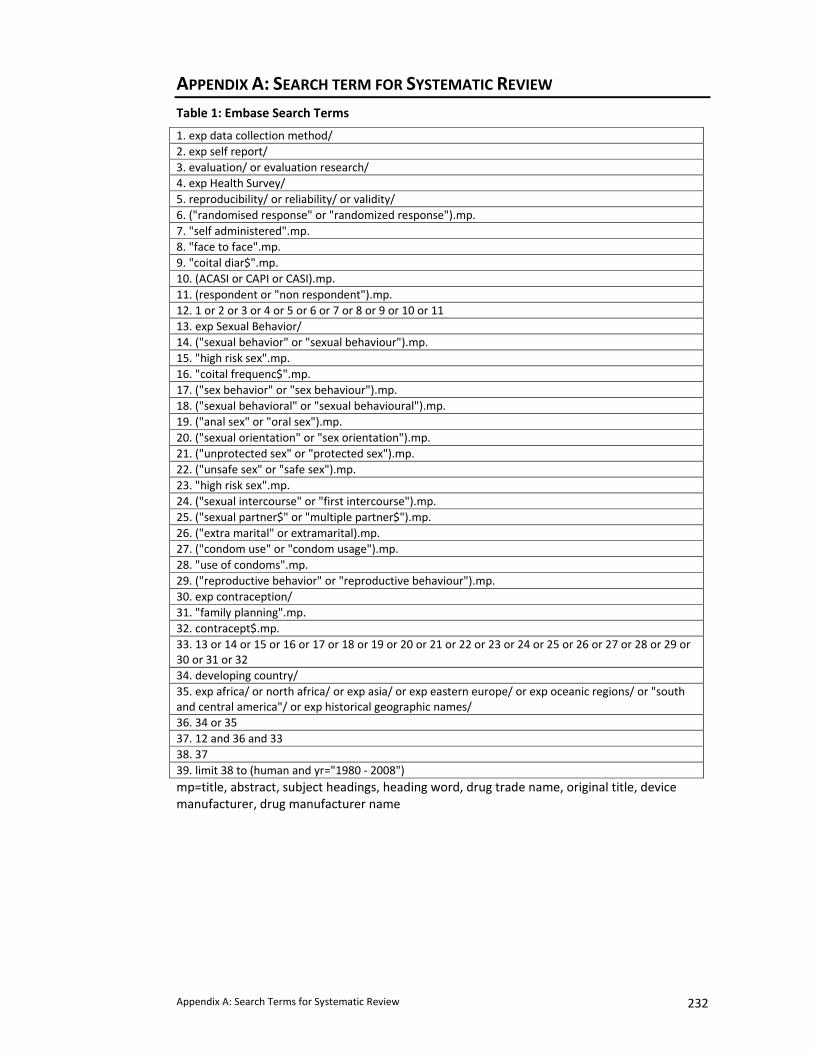
Appendix A: Search Terms for Systematic Review 232
APPENDIX A: SEARCH TERM FOR SYSTEMATIC REVIEW Table 1: Embase Search Terms
1. exp data collection method/ 2. exp self report/ 3. evaluation/ or evaluation research/ 4. exp Health Survey/ 5. reproducibility/ or reliability/ or validity/ 6. ("randomised response" or "randomized response").mp. 7. "self administered".mp. 8. "face to face".mp. 9. "coital diar$".mp. 10. (ACASI or CAPI or CASI).mp. 11. (respondent or "non respondent").mp. 12. 1 or 2 or 3 or 4 or 5 or 6 or 7 or 8 or 9 or 10 or 11 13. exp Sexual Behavior/ 14. ("sexual behavior" or "sexual behaviour").mp. 15. "high risk sex".mp. 16. "coital frequenc$".mp. 17. ("sex behavior" or "sex behaviour").mp. 18. ("sexual behavioral" or "sexual behavioural").mp. 19. ("anal sex" or "oral sex").mp. 20. ("sexual orientation" or "sex orientation").mp. 21. ("unprotected sex" or "protected sex").mp. 22. ("unsafe sex" or "safe sex").mp. 23. "high risk sex".mp. 24. ("sexual intercourse" or "first intercourse").mp. 25. ("sexual partner$" or "multiple partner$").mp. 26. ("extra marital" or extramarital).mp. 27. ("condom use" or "condom usage").mp. 28. "use of condoms".mp. 29. ("reproductive behavior" or "reproductive behaviour").mp. 30. exp contraception/ 31. "family planning".mp. 32. contracept$.mp. 33. 13 or 14 or 15 or 16 or 17 or 18 or 19 or 20 or 21 or 22 or 23 or 24 or 25 or 26 or 27 or 28 or 29 or 30 or 31 or 32 34. developing country/ 35. exp africa/ or north africa/ or exp asia/ or exp eastern europe/ or exp oceanic regions/ or "south and central america"/ or exp historical geographic names/ 36. 34 or 35 37. 12 and 36 and 33 38. 37 39. limit 38 to (human and yr="1980 ‐ 2008") mp=title, abstract, subject headings, heading word, drug trade name, original title, device manufacturer, drug manufacturer name
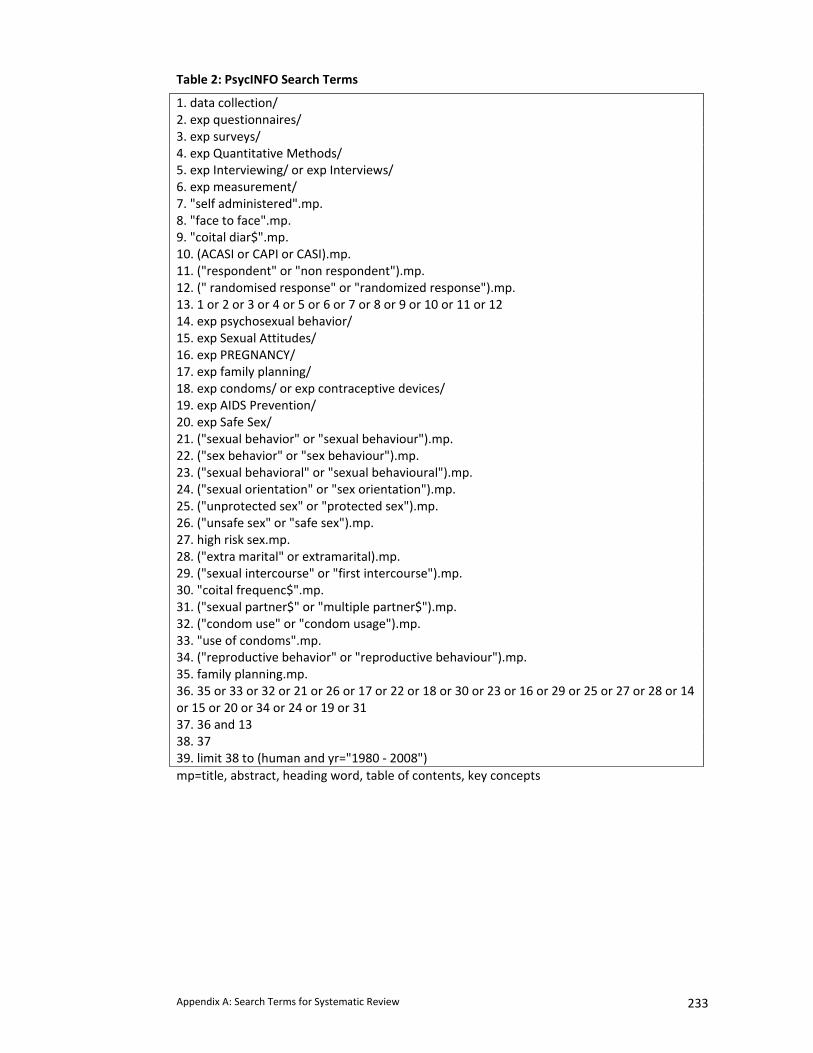
Appendix A: Search Terms for Systematic Review 233
Table 2: PsycINFO Search Terms
1. data collection/ 2. exp questionnaires/ 3. exp surveys/ 4. exp Quantitative Methods/ 5. exp Interviewing/ or exp Interviews/ 6. exp measurement/ 7. "self administered".mp. 8. "face to face".mp. 9. "coital diar$".mp. 10. (ACASI or CAPI or CASI).mp. 11. ("respondent" or "non respondent").mp. 12. (" randomised response" or "randomized response").mp. 13. 1 or 2 or 3 or 4 or 5 or 6 or 7 or 8 or 9 or 10 or 11 or 12 14. exp psychosexual behavior/ 15. exp Sexual Attitudes/ 16. exp PREGNANCY/ 17. exp family planning/ 18. exp condoms/ or exp contraceptive devices/ 19. exp AIDS Prevention/ 20. exp Safe Sex/ 21. ("sexual behavior" or "sexual behaviour").mp. 22. ("sex behavior" or "sex behaviour").mp. 23. ("sexual behavioral" or "sexual behavioural").mp. 24. ("sexual orientation" or "sex orientation").mp. 25. ("unprotected sex" or "protected sex").mp. 26. ("unsafe sex" or "safe sex").mp. 27. high risk sex.mp. 28. ("extra marital" or extramarital).mp. 29. ("sexual intercourse" or "first intercourse").mp. 30. "coital frequenc$".mp. 31. ("sexual partner$" or "multiple partner$").mp. 32. ("condom use" or "condom usage").mp. 33. "use of condoms".mp. 34. ("reproductive behavior" or "reproductive behaviour").mp. 35. family planning.mp. 36. 35 or 33 or 32 or 21 or 26 or 17 or 22 or 18 or 30 or 23 or 16 or 29 or 25 or 27 or 28 or 14 or 15 or 20 or 34 or 24 or 19 or 31 37. 36 and 13 38. 37 39. limit 38 to (human and yr="1980 ‐ 2008") mp=title, abstract, heading word, table of contents, key concepts
Appendix B: Ethics approvals for RDS Parent Trial 234
APPENDIX B: ETHICAL APPROVALS FOR RDS PARENT TRIAL
1. University College London (2 pages) 2. London School of Hygiene and Tropical Medicine (1 page)
3. Medical Research Council of Zimbabwe (1 page)
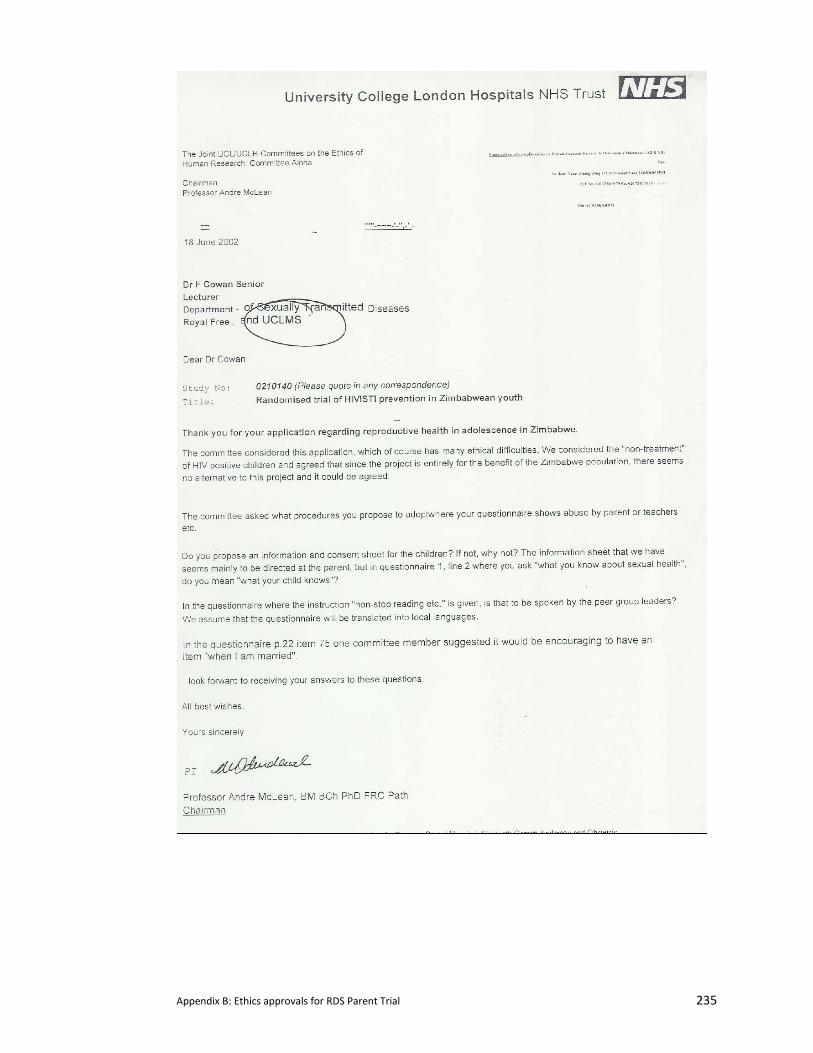
Appendix B: Ethics approvals for RDS Parent Trial 235
Appendix B: Ethics approvals for RDS Parent Trial 236

Appendix B: Ethics approvals for RDS Parent Trial 237

Appendix B: Ethics approvals for RDS Parent Trial 238
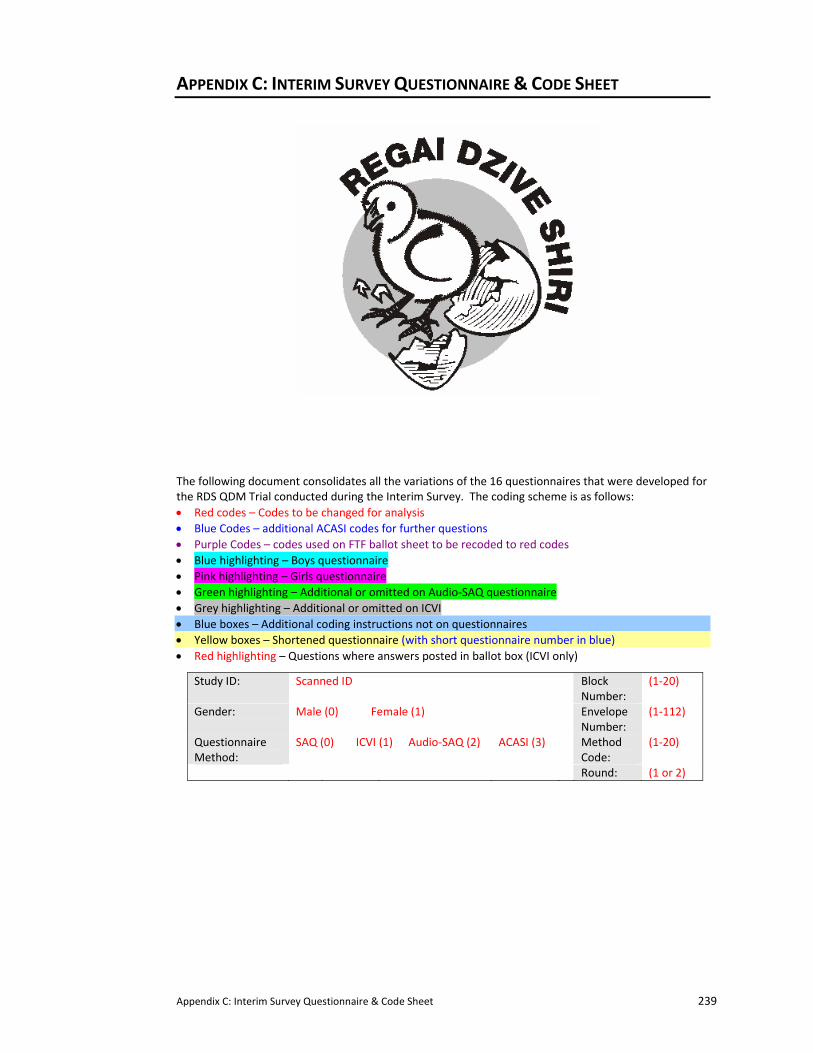
Appendix C: Interim Survey Questionnaire & Code Sheet 239
APPENDIX C: INTERIM SURVEY QUESTIONNAIRE & CODE SHEET
The following document consolidates all the variations of the 16 questionnaires that were developed for the RDS QDM Trial conducted during the Interim Survey. The coding scheme is as follows: • Red codes – Codes to be changed for analysis • Blue Codes – additional ACASI codes for further questions • Purple Codes – codes used on FTF ballot sheet to be recoded to red codes • Blue highlighting – Boys questionnaire • Pink highlighting – Girls questionnaire • Green highlighting – Additional or omitted on Audio‐SAQ questionnaire • Grey highlighting – Additional or omitted on ICVI • Blue boxes – Additional coding instructions not on questionnaires • Yellow boxes – Shortened questionnaire (with short questionnaire number in blue) • Red highlighting – Questions where answers posted in ballot box (ICVI only)
Study ID: Scanned ID Block Number:
(1‐20)
Gender: Male (0) Female (1) Envelope Number:
(1‐112)
Questionnaire Method:
SAQ (0) ICVI (1) Audio‐SAQ (2) ACASI (3) Method Code:
(1‐20)
Round: (1 or 2)
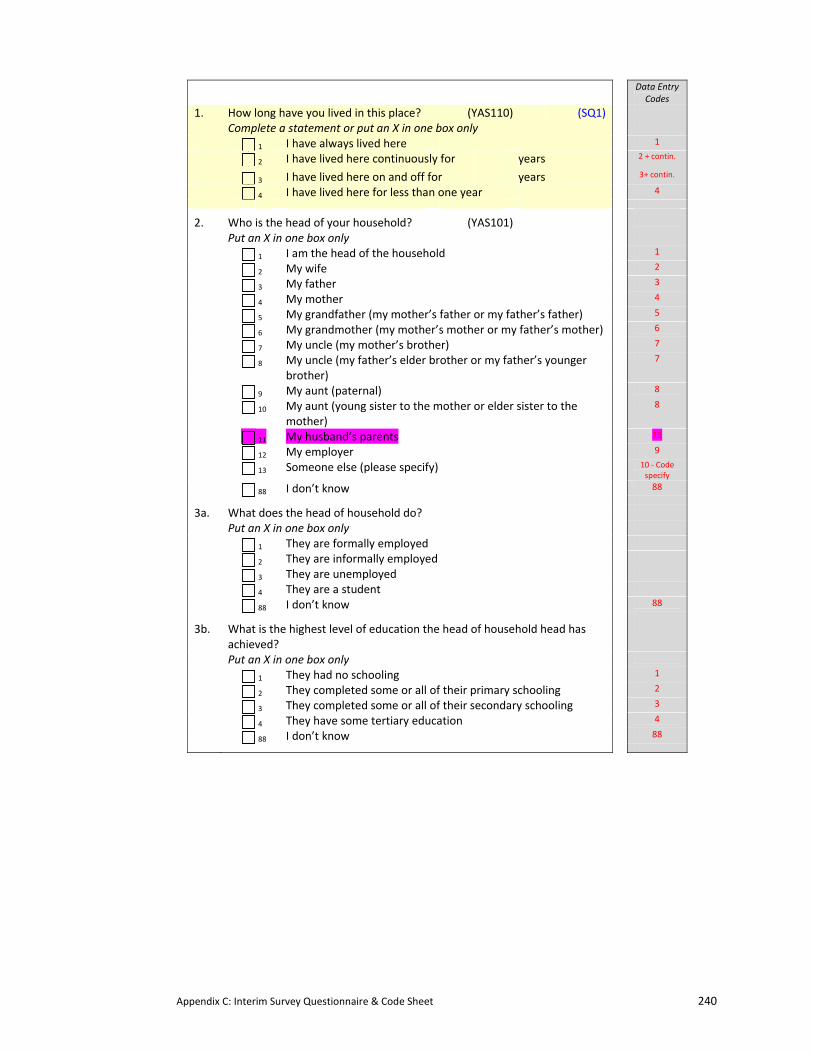
Appendix C: Interim Survey Questionnaire & Code Sheet 240
Data Entry Codes
1. How long have you lived in this place? (YAS110) (SQ1)
Complete a statement or put an X in one box only
1 I have always lived here 1
2 I have lived here continuously for years 2 + contin.
3 I have lived here on and off for years 3+ contin.
4 I have lived here for less than one year 4
2. Who is the head of your household? (YAS101)
Put an X in one box only
1 I am the head of the household 1
2 My wife 2
3 My father 3
4 My mother 4
5 My grandfather (my mother’s father or my father’s father) 5
6 My grandmother (my mother’s mother or my father’s mother) 6
7 My uncle (my mother’s brother) 7
8 My uncle (my father’s elder brother or my father’s younger brother)
7
9 My aunt (paternal) 8
10 My aunt (young sister to the mother or elder sister to the mother)
8
11 My husband’s parents 11
12 My employer 9
13 Someone else (please specify) 10 ‐ Code specify
88 I don’t know 88
3a. What does the head of household do?
Put an X in one box only
1 They are formally employed
2 They are informally employed
3 They are unemployed
4 They are a student
88 I don’t know 88
3b. What is the highest level of education the head of household head has achieved?
Put an X in one box only
1 They had no schooling 1
2 They completed some or all of their primary schooling 2
3 They completed some or all of their secondary schooling 3
4 They have some tertiary education 4
88 I don’t know 88
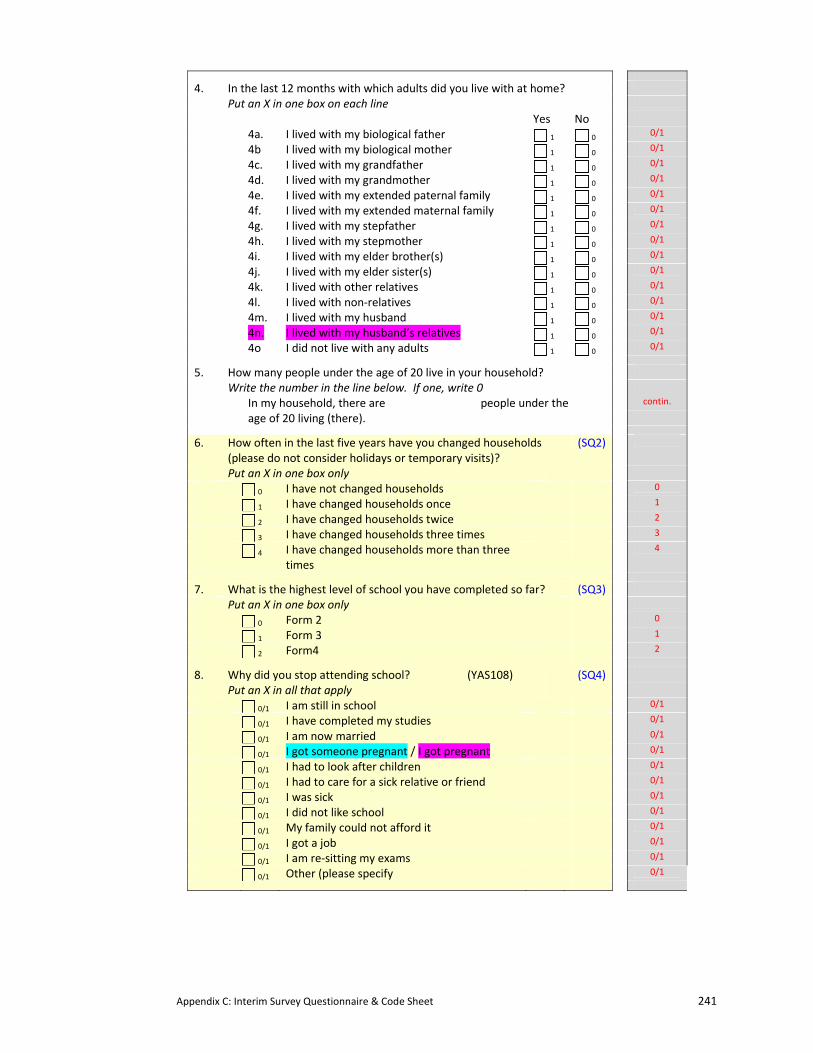
Appendix C: Interim Survey Questionnaire & Code Sheet 241
4. In the last 12 months with which adults did you live with at home?
Put an X in one box on each line
Yes No
4a. I lived with my biological father 1 0 0/1
4b I lived with my biological mother 1 0 0/1
4c. I lived with my grandfather 1 0 0/1
4d. I lived with my grandmother 1 0 0/1
4e. I lived with my extended paternal family 1 0 0/1
4f. I lived with my extended maternal family 1 0 0/1
4g. I lived with my stepfather 1 0 0/1
4h. I lived with my stepmother 1 0 0/1
4i. I lived with my elder brother(s) 1 0 0/1
4j. I lived with my elder sister(s) 1 0 0/1
4k. I lived with other relatives 1 0 0/1
4l. I lived with non‐relatives 1 0 0/1
4m. I lived with my husband 1 0 0/1
4n. I lived with my husband’s relatives 1 0 0/1
4o I did not live with any adults 1 0 0/1
5. How many people under the age of 20 live in your household?
Write the number in the line below. If one, write 0
In my household, there are people under the contin.
age of 20 living (there).
6. How often in the last five years have you changed households (please do not consider holidays or temporary visits)?
(SQ2)
Put an X in one box only
0 I have not changed households 0
1 I have changed households once 1
2 I have changed households twice 2
3 I have changed households three times 3
4 I have changed households more than three times
4
7. What is the highest level of school you have completed so far? (SQ3)
Put an X in one box only
0 Form 2 0
1 Form 3 1
2 Form4 2
8. Why did you stop attending school? (YAS108) (SQ4)
Put an X in all that apply
0/1 I am still in school 0/1
0/1 I have completed my studies 0/1 0/1 I am now married 0/1 0/1 I got someone pregnant / I got pregnant 0/1 0/1 I had to look after children 0/1 0/1 I had to care for a sick relative or friend 0/1 0/1 I was sick 0/1 0/1 I did not like school 0/1 0/1 My family could not afford it 0/1 0/1 I got a job 0/1 0/1 I am re‐sitting my exams 0/1 0/1 Other (please specify 0/1
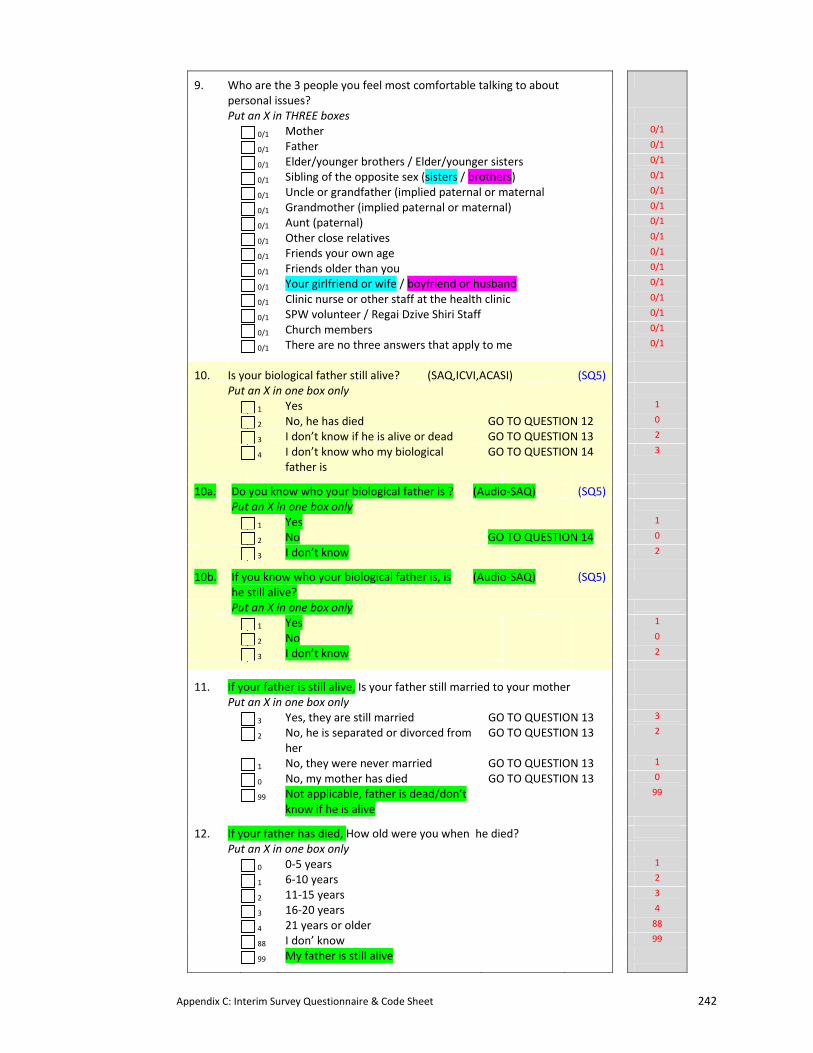
Appendix C: Interim Survey Questionnaire & Code Sheet 242
9. Who are the 3 people you feel most comfortable talking to about personal issues?
Put an X in THREE boxes
0/1 Mother 0/1 0/1 Father 0/1 0/1 Elder/younger brothers / Elder/younger sisters 0/1
0/1 Sibling of the opposite sex (sisters / brothers) 0/1 0/1 Uncle or grandfather (implied paternal or maternal 0/1
0/1 Grandmother (implied paternal or maternal) 0/1 0/1 Aunt (paternal) 0/1 0/1 Other close relatives 0/1
0/1 Friends your own age 0/1
0/1 Friends older than you 0/1 0/1 Your girlfriend or wife / boyfriend or husband 0/1 0/1 Clinic nurse or other staff at the health clinic 0/1 0/1 SPW volunteer / Regai Dzive Shiri Staff 0/1 0/1 Church members 0/1 0/1 There are no three answers that apply to me 0/1
10. Is your biological father still alive? (SAQ,ICVI,ACASI) (SQ5)
Put an X in one box only
1 Yes 1
2 No, he has died GO TO QUESTION 12 0
3 I don’t know if he is alive or dead GO TO QUESTION 13 2
4 I don’t know who my biological father is
GO TO QUESTION 14 3
10a. Do you know who your biological father is ? (Audio‐SAQ) (SQ5)
Put an X in one box only
1 Yes 1
2 No GO TO QUESTION 14 0
3 I don’t know 2
10b. If you know who your biological father is, is he still alive?
(Audio‐SAQ) (SQ5)
Put an X in one box only
1 Yes 1
2 No 0
3 I don’t know 2
11. If your father is still alive, Is your father still married to your mother
Put an X in one box only
3 Yes, they are still married GO TO QUESTION 13 3
2 No, he is separated or divorced from her
GO TO QUESTION 13 2
1 No, they were never married GO TO QUESTION 13 1
0 No, my mother has died GO TO QUESTION 13 0
99 Not applicable, father is dead/don’t know if he is alive
99
12. If your father has died, How old were you when he died?
Put an X in one box only
0 0‐5 years 1
1 6‐10 years 2
2 11‐15 years 3
3 16‐20 years 4
4 21 years or older 88
88 I don’ know 99
99 My father is still alive
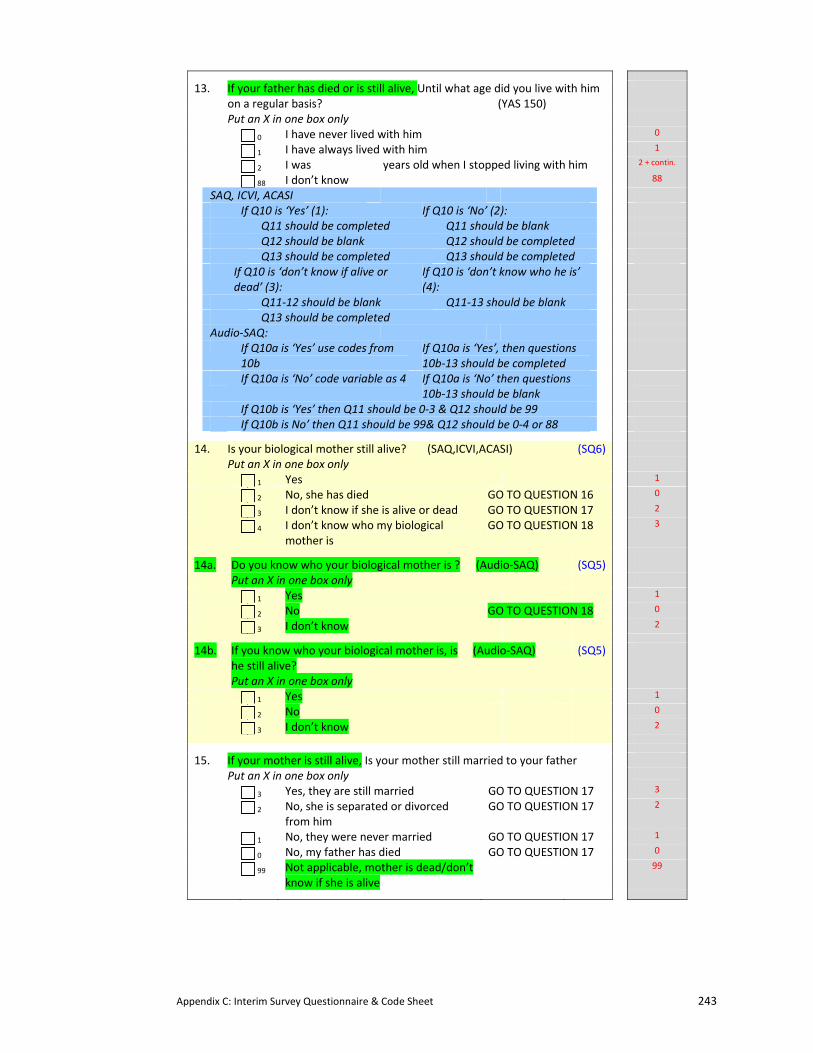
Appendix C: Interim Survey Questionnaire & Code Sheet 243
13. If your father has died or is still alive, Until what age did you live with him on a regular basis? (YAS 150)
Put an X in one box only
0 I have never lived with him 0
1 I have always lived with him 1
2 I was years old when I stopped living with him 2 + contin.
88 I don’t know 88
SAQ, ICVI, ACASI If Q10 is ‘Yes’ (1): If Q10 is ‘No’ (2): Q11 should be completed Q11 should be blank Q12 should be blank Q12 should be completed Q13 should be completed Q13 should be completed If Q10 is ‘don’t know if alive or
dead’ (3): If Q10 is ‘don’t know who he is’ (4):
Q11‐12 should be blank Q11‐13 should be blank Q13 should be completed Audio‐SAQ: If Q10a is ‘Yes’ use codes from
10b If Q10a is ‘Yes’, then questions 10b‐13 should be completed
If Q10a is ‘No’ code variable as 4 If Q10a is ‘No’ then questions 10b‐13 should be blank
If Q10b is ‘Yes’ then Q11 should be 0‐3 & Q12 should be 99 If Q10b is No’ then Q11 should be 99& Q12 should be 0‐4 or 88
14. Is your biological mother still alive? (SAQ,ICVI,ACASI) (SQ6)
Put an X in one box only
1 Yes 1
2 No, she has died GO TO QUESTION 16 0
3 I don’t know if she is alive or dead GO TO QUESTION 17 2
4 I don’t know who my biological mother is
GO TO QUESTION 18 3
14a. Do you know who your biological mother is ? (Audio‐SAQ) (SQ5)
Put an X in one box only
1 Yes 1
2 No GO TO QUESTION 18 0
3 I don’t know 2
14b. If you know who your biological mother is, is he still alive?
(Audio‐SAQ) (SQ5)
Put an X in one box only
1 Yes 1
2 No 0
3 I don’t know 2
15. If your mother is still alive, Is your mother still married to your father
Put an X in one box only
3 Yes, they are still married GO TO QUESTION 17 3
2 No, she is separated or divorced from him
GO TO QUESTION 17 2
1 No, they were never married GO TO QUESTION 17 1
0 No, my father has died GO TO QUESTION 17 0
99 Not applicable, mother is dead/don’t know if she is alive
99
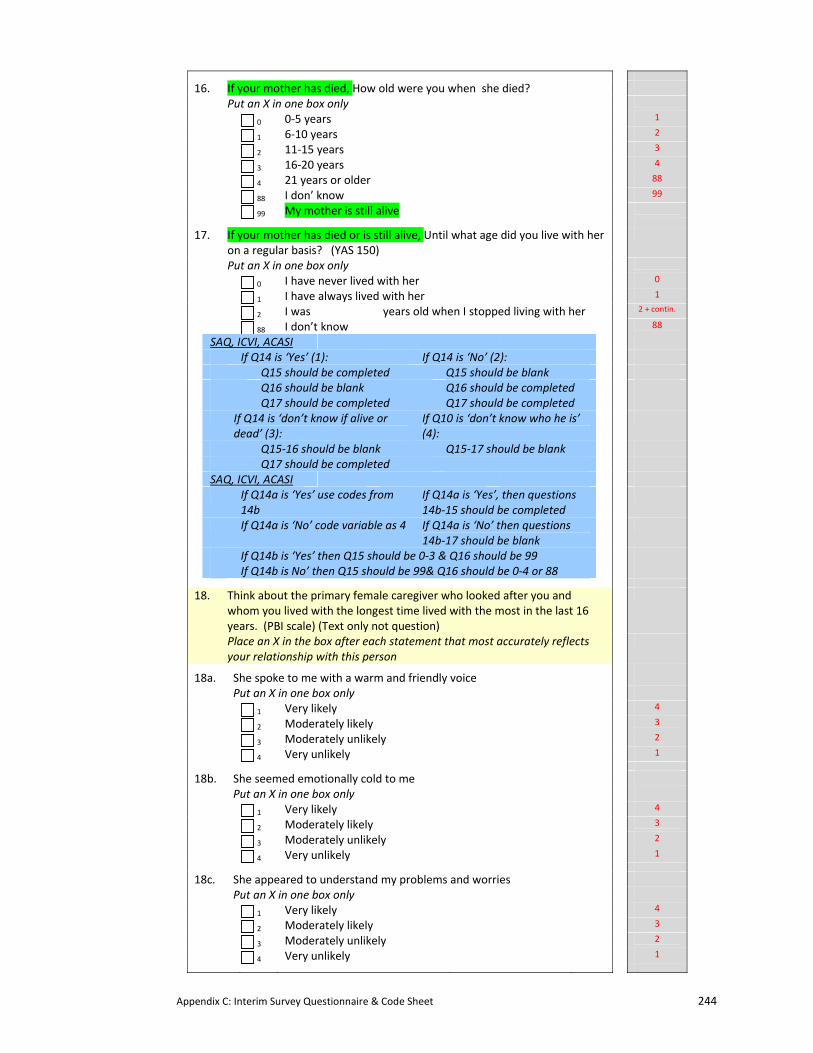
Appendix C: Interim Survey Questionnaire & Code Sheet 244
16. If your mother has died, How old were you when she died?
Put an X in one box only
0 0‐5 years 1
1 6‐10 years 2
2 11‐15 years 3
3 16‐20 years 4
4 21 years or older 88
88 I don’ know 99
99 My mother is still alive
17. If your mother has died or is still alive, Until what age did you live with her on a regular basis? (YAS 150)
Put an X in one box only
0 I have never lived with her 0
1 I have always lived with her 1
2 I was years old when I stopped living with her 2 + contin.
88 I don’t know 88
SAQ, ICVI, ACASI If Q14 is ‘Yes’ (1): If Q14 is ‘No’ (2): Q15 should be completed Q15 should be blank Q16 should be blank Q16 should be completed Q17 should be completed Q17 should be completed If Q14 is ‘don’t know if alive or
dead’ (3): If Q10 is ‘don’t know who he is’ (4):
Q15‐16 should be blank Q15‐17 should be blank Q17 should be completed SAQ, ICVI, ACASI If Q14a is ‘Yes’ use codes from
14b If Q14a is ‘Yes’, then questions 14b‐15 should be completed
If Q14a is ‘No’ code variable as 4 If Q14a is ‘No’ then questions 14b‐17 should be blank
If Q14b is ‘Yes’ then Q15 should be 0‐3 & Q16 should be 99 If Q14b is No’ then Q15 should be 99& Q16 should be 0‐4 or 88
18. Think about the primary female caregiver who looked after you and whom you lived with the longest time lived with the most in the last 16 years. (PBI scale) (Text only not question)
Place an X in the box after each statement that most accurately reflects your relationship with this person
18a. She spoke to me with a warm and friendly voice
Put an X in one box only
1 Very likely 4
2 Moderately likely 3
3 Moderately unlikely 2
4 Very unlikely 1
18b. She seemed emotionally cold to me
Put an X in one box only
1 Very likely 4
2 Moderately likely 3
3 Moderately unlikely 2
4 Very unlikely 1
18c. She appeared to understand my problems and worries
Put an X in one box only
1 Very likely 4
2 Moderately likely 3
3 Moderately unlikely 2
4 Very unlikely 1
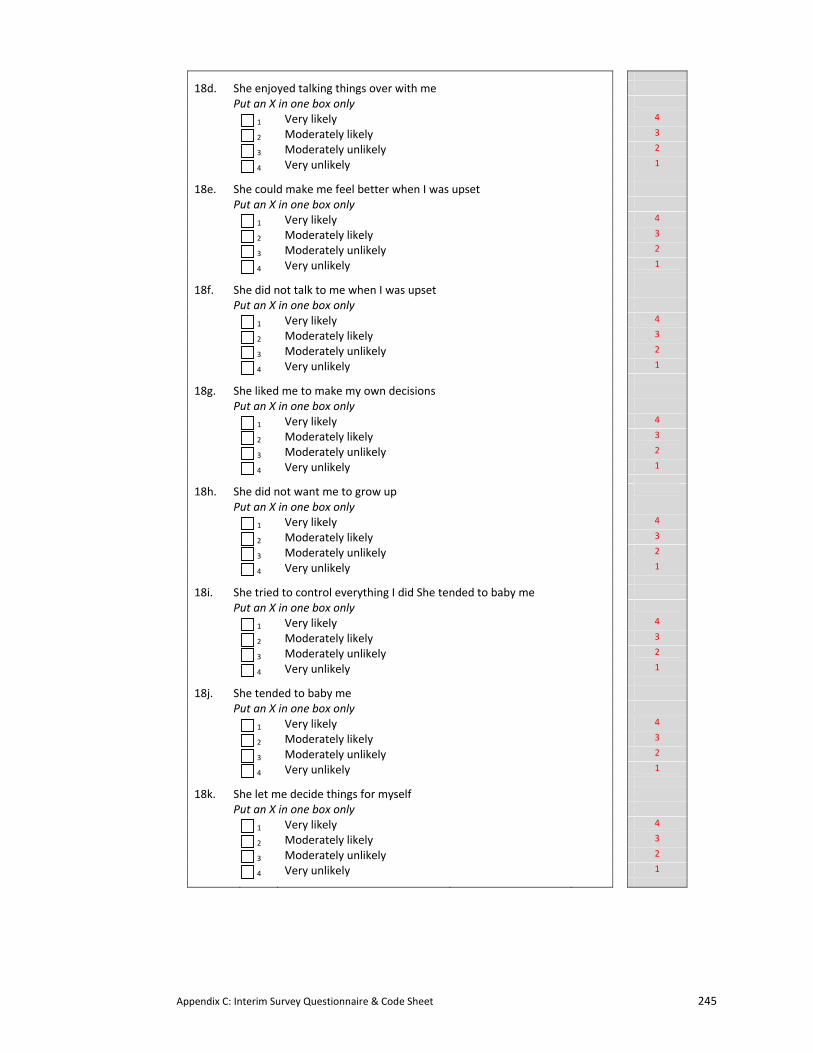
Appendix C: Interim Survey Questionnaire & Code Sheet 245
18d. She enjoyed talking things over with me
Put an X in one box only
1 Very likely 4
2 Moderately likely 3
3 Moderately unlikely 2
4 Very unlikely 1
18e. She could make me feel better when I was upset
Put an X in one box only
1 Very likely 4
2 Moderately likely 3
3 Moderately unlikely 2
4 Very unlikely 1
18f. She did not talk to me when I was upset
Put an X in one box only
1 Very likely 4
2 Moderately likely 3
3 Moderately unlikely 2
4 Very unlikely 1
18g. She liked me to make my own decisions
Put an X in one box only
1 Very likely 4
2 Moderately likely 3
3 Moderately unlikely 2
4 Very unlikely 1
18h. She did not want me to grow up
Put an X in one box only
1 Very likely 4
2 Moderately likely 3
3 Moderately unlikely 2
4 Very unlikely 1
18i. She tried to control everything I did She tended to baby me
Put an X in one box only
1 Very likely 4
2 Moderately likely 3
3 Moderately unlikely 2
4 Very unlikely 1
18j. She tended to baby me
Put an X in one box only
1 Very likely 4
2 Moderately likely 3
3 Moderately unlikely 2
4 Very unlikely 1
18k. She let me decide things for myself
Put an X in one box only
1 Very likely 4
2 Moderately likely 3
3 Moderately unlikely 2
4 Very unlikely 1
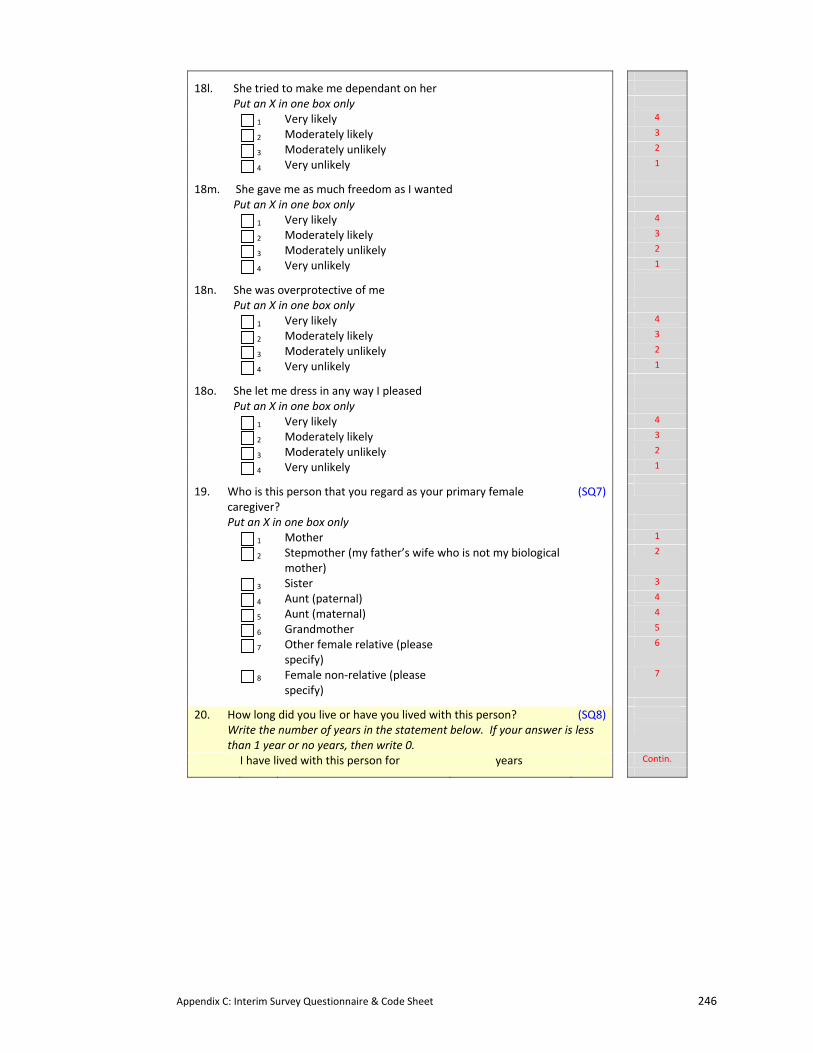
Appendix C: Interim Survey Questionnaire & Code Sheet 246
18l. She tried to make me dependant on her
Put an X in one box only
1 Very likely 4
2 Moderately likely 3
3 Moderately unlikely 2
4 Very unlikely 1
18m. She gave me as much freedom as I wanted
Put an X in one box only
1 Very likely 4
2 Moderately likely 3
3 Moderately unlikely 2
4 Very unlikely 1
18n. She was overprotective of me
Put an X in one box only
1 Very likely 4
2 Moderately likely 3
3 Moderately unlikely 2
4 Very unlikely 1
18o. She let me dress in any way I pleased
Put an X in one box only
1 Very likely 4
2 Moderately likely 3
3 Moderately unlikely 2
4 Very unlikely 1
19. Who is this person that you regard as your primary female caregiver?
(SQ7)
Put an X in one box only
1 Mother 1
2 Stepmother (my father’s wife who is not my biological mother)
2
3 Sister 3
4 Aunt (paternal) 4
5 Aunt (maternal) 4
6 Grandmother 5
7 Other female relative (please specify)
6
8 Female non‐relative (please specify)
7
20. How long did you live or have you lived with this person? (SQ8)
Write the number of years in the statement below. If your answer is less than 1 year or no years, then write 0.
I have lived with this person for years Contin.
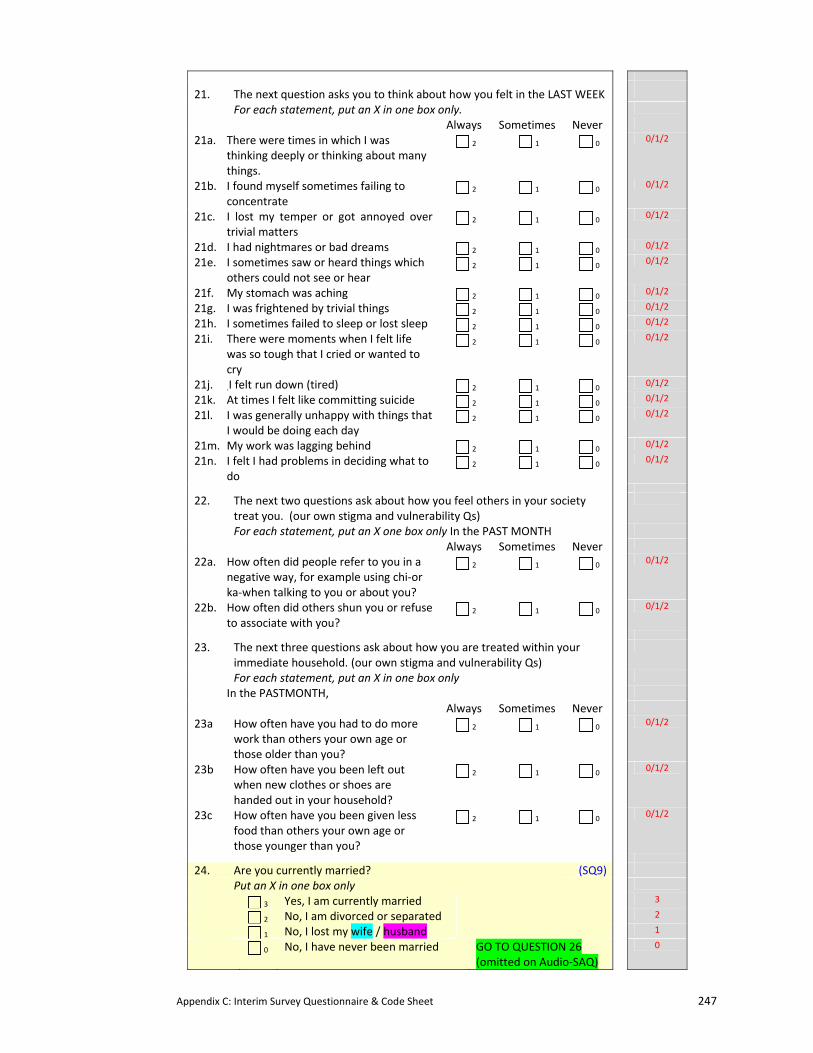
Appendix C: Interim Survey Questionnaire & Code Sheet 247
21. The next question asks you to think about how you felt in the LAST WEEK
For each statement, put an X in one box only.
Always Sometimes Never
21a. There were times in which I was thinking deeply or thinking about many things.
2 1 0 0/1/2
21b. I found myself sometimes failing to concentrate
2 1 0 0/1/2
21c. I lost my temper or got annoyed over trivial matters
2 1 0 0/1/2
21d. I had nightmares or bad dreams 2 1 0 0/1/2
21e. I sometimes saw or heard things which others could not see or hear
2 1 0 0/1/2
21f. My stomach was aching 2 1 0 0/1/2
21g. I was frightened by trivial things 2 1 0 0/1/2
21h. I sometimes failed to sleep or lost sleep 2 1 0 0/1/2
21i. There were moments when I felt life was so tough that I cried or wanted to cry
2 1 0 0/1/2
21j. .I felt run down (tired) 2 1 0 0/1/2
21k. At times I felt like committing suicide 2 1 0 0/1/2
21l. I was generally unhappy with things that I would be doing each day
2 1 0 0/1/2
21m. My work was lagging behind 2 1 0 0/1/2
21n. I felt I had problems in deciding what to do
2 1 0 0/1/2
22. The next two questions ask about how you feel others in your society treat you. (our own stigma and vulnerability Qs)
For each statement, put an X one box only In the PAST MONTH
Always Sometimes Never
22a. How often did people refer to you in a negative way, for example using chi‐or ka‐when talking to you or about you?
2 1 0 0/1/2
22b. How often did others shun you or refuse to associate with you?
2 1 0 0/1/2
23. The next three questions ask about how you are treated within your immediate household. (our own stigma and vulnerability Qs)
For each statement, put an X in one box only
In the PASTMONTH,
Always Sometimes Never
23a How often have you had to do more work than others your own age or those older than you?
2 1 0 0/1/2
23b How often have you been left out when new clothes or shoes are handed out in your household?
2 1 0 0/1/2
23c How often have you been given less food than others your own age or those younger than you?
2 1 0 0/1/2
24. Are you currently married? (SQ9)
Put an X in one box only
3 Yes, I am currently married 3
2 No, I am divorced or separated 2
1 No, I lost my wife / husband 1
0 No, I have never been married GO TO QUESTION 26 (omitted on Audio‐SAQ)
0
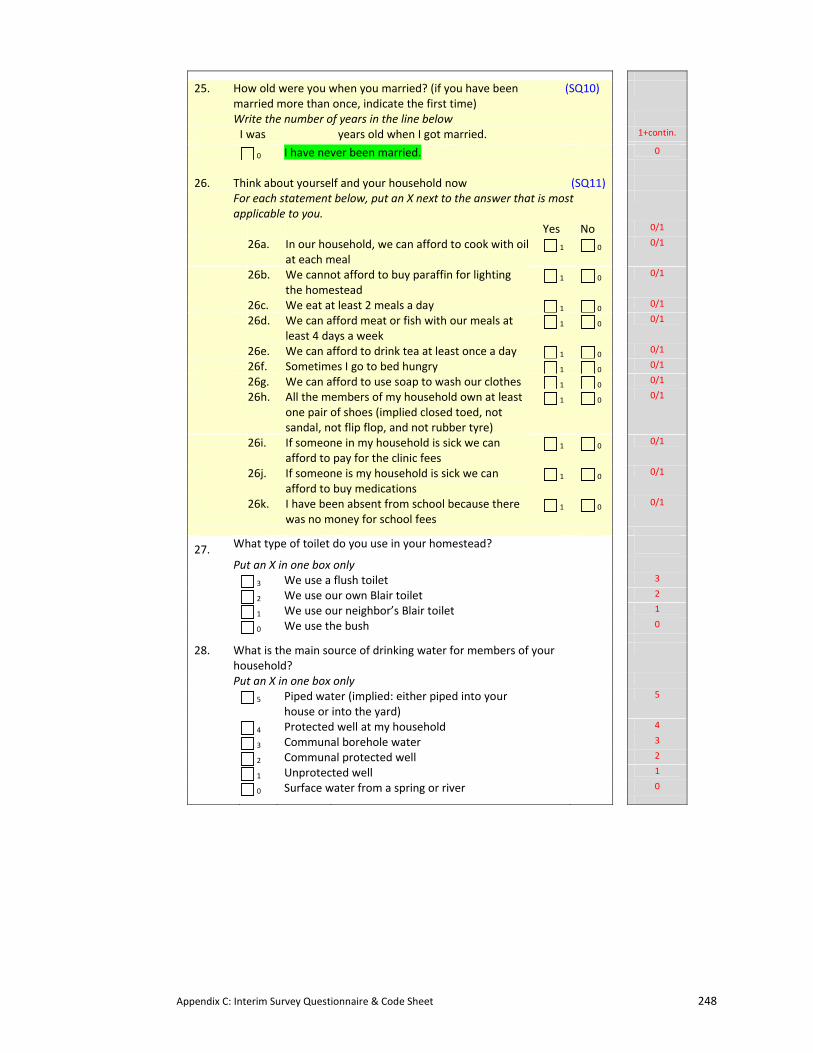
Appendix C: Interim Survey Questionnaire & Code Sheet 248
25. How old were you when you married? (if you have been married more than once, indicate the first time)
(SQ10)
Write the number of years in the line below
I was years old when I got married. 1+contin.
0 I have never been married. 0
26. Think about yourself and your household now (SQ11) For each statement below, put an X next to the answer that is most
applicable to you.
Yes No 0/1
26a. In our household, we can afford to cook with oil at each meal
1 0 0/1
26b. We cannot afford to buy paraffin for lighting the homestead
1 0 0/1
26c. We eat at least 2 meals a day 1 0 0/1
26d. We can afford meat or fish with our meals at least 4 days a week
1 0 0/1
26e. We can afford to drink tea at least once a day 1 0 0/1
26f. Sometimes I go to bed hungry 1 0 0/1
26g. We can afford to use soap to wash our clothes 1 0 0/1
26h. All the members of my household own at least one pair of shoes (implied closed toed, not sandal, not flip flop, and not rubber tyre)
1 0 0/1
26i. If someone in my household is sick we can afford to pay for the clinic fees
1 0 0/1
26j. If someone is my household is sick we can afford to buy medications
1 0 0/1
26k. I have been absent from school because there was no money for school fees
1 0 0/1
27. What type of toilet do you use in your homestead?
Put an X in one box only
3 We use a flush toilet 3
2 We use our own Blair toilet 2
1 We use our neighbor’s Blair toilet 1
0 We use the bush 0
28. What is the main source of drinking water for members of your household?
Put an X in one box only
5 Piped water (implied: either piped into your house or into the yard)
5
4 Protected well at my household 4
3 Communal borehole water 3
2 Communal protected well 2
1 Unprotected well 1
0 Surface water from a spring or river 0
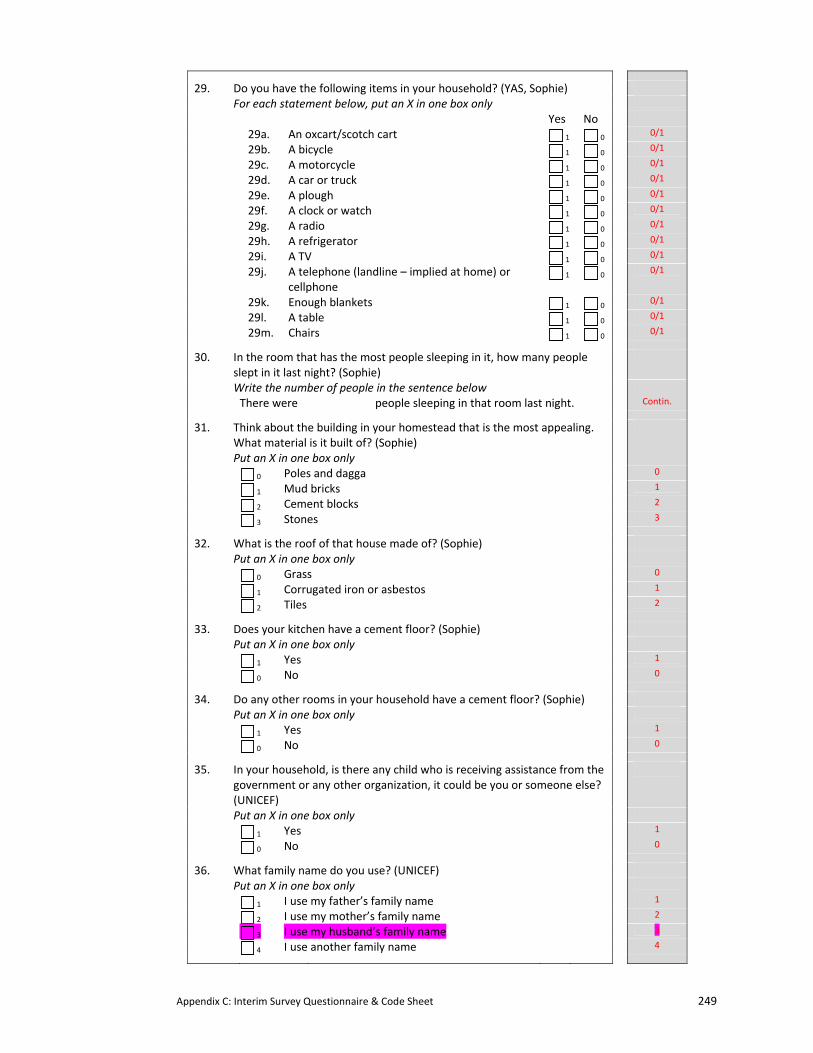
Appendix C: Interim Survey Questionnaire & Code Sheet 249
29. Do you have the following items in your household? (YAS, Sophie) For each statement below, put an X in one box only
Yes No
29a. An oxcart/scotch cart 1 0 0/1
29b. A bicycle 1 0 0/1
29c. A motorcycle 1 0 0/1
29d. A car or truck 1 0 0/1
29e. A plough 1 0 0/1
29f. A clock or watch 1 0 0/1
29g. A radio 1 0 0/1
29h. A refrigerator 1 0 0/1
29i. A TV 1 0 0/1
29j. A telephone (landline – implied at home) or cellphone
1 0 0/1
29k. Enough blankets 1 0 0/1
29l. A table 1 0 0/1
29m. Chairs 1 0 0/1
30. In the room that has the most people sleeping in it, how many people slept in it last night? (Sophie)
Write the number of people in the sentence below
There were people sleeping in that room last night. Contin.
31. Think about the building in your homestead that is the most appealing. What material is it built of? (Sophie)
Put an X in one box only
0 Poles and dagga 0
1 Mud bricks 1
2 Cement blocks 2
3 Stones 3
32. What is the roof of that house made of? (Sophie) Put an X in one box only
0 Grass 0
1 Corrugated iron or asbestos 1
2 Tiles 2
33. Does your kitchen have a cement floor? (Sophie) Put an X in one box only
1 Yes 1
0 No 0
34. Do any other rooms in your household have a cement floor? (Sophie) Put an X in one box only
1 Yes 1
0 No 0
35. In your household, is there any child who is receiving assistance from the government or any other organization, it could be you or someone else? (UNICEF)
Put an X in one box only
1 Yes 1
0 No 0
36. What family name do you use? (UNICEF) Put an X in one box only
1 I use my father’s family name 1
2 I use my mother’s family name 2
3 I use my husband’s family name 3
4 I use another family name 4
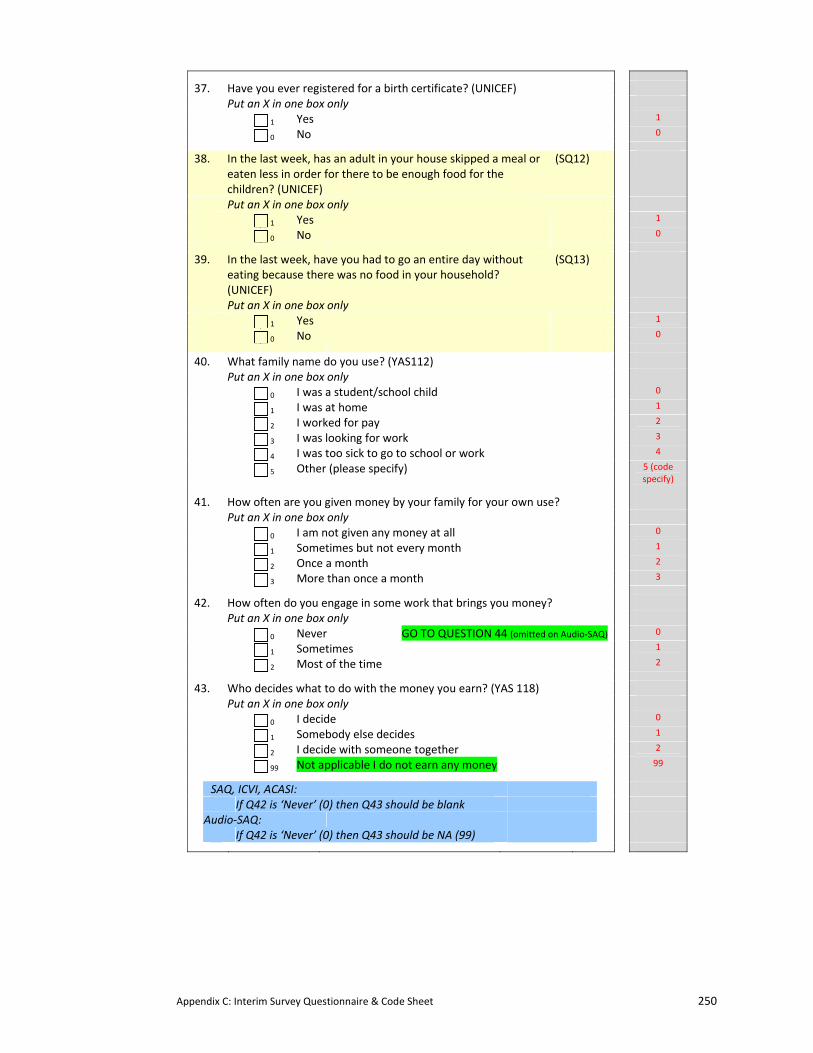
Appendix C: Interim Survey Questionnaire & Code Sheet 250
37. Have you ever registered for a birth certificate? (UNICEF) Put an X in one box only
1 Yes 1
0 No 0
38. In the last week, has an adult in your house skipped a meal or eaten less in order for there to be enough food for the children? (UNICEF)
(SQ12)
Put an X in one box only
1 Yes 1
0 No 0
39. In the last week, have you had to go an entire day without eating because there was no food in your household? (UNICEF)
(SQ13)
Put an X in one box only
1 Yes 1
0 No 0
40. What family name do you use? (YAS112) Put an X in one box only
0 I was a student/school child 0
1 I was at home 1
2 I worked for pay 2
3 I was looking for work 3
4 I was too sick to go to school or work 4
5 Other (please specify) 5 (code specify)
41. How often are you given money by your family for your own use? Put an X in one box only
0 I am not given any money at all 0
1 Sometimes but not every month 1
2 Once a month 2
3 More than once a month 3
42. How often do you engage in some work that brings you money? Put an X in one box only
0 Never GO TO QUESTION 44 (omitted on Audio‐SAQ) 0
1 Sometimes 1
2 Most of the time 2
43. Who decides what to do with the money you earn? (YAS 118) Put an X in one box only
0 I decide 0
1 Somebody else decides 1
2 I decide with someone together 2
99 Not applicable I do not earn any money 99
SAQ, ICVI, ACASI:
If Q42 is ‘Never’ (0) then Q43 should be blank
Audio‐SAQ:
If Q42 is ‘Never’ (0) then Q43 should be NA (99)
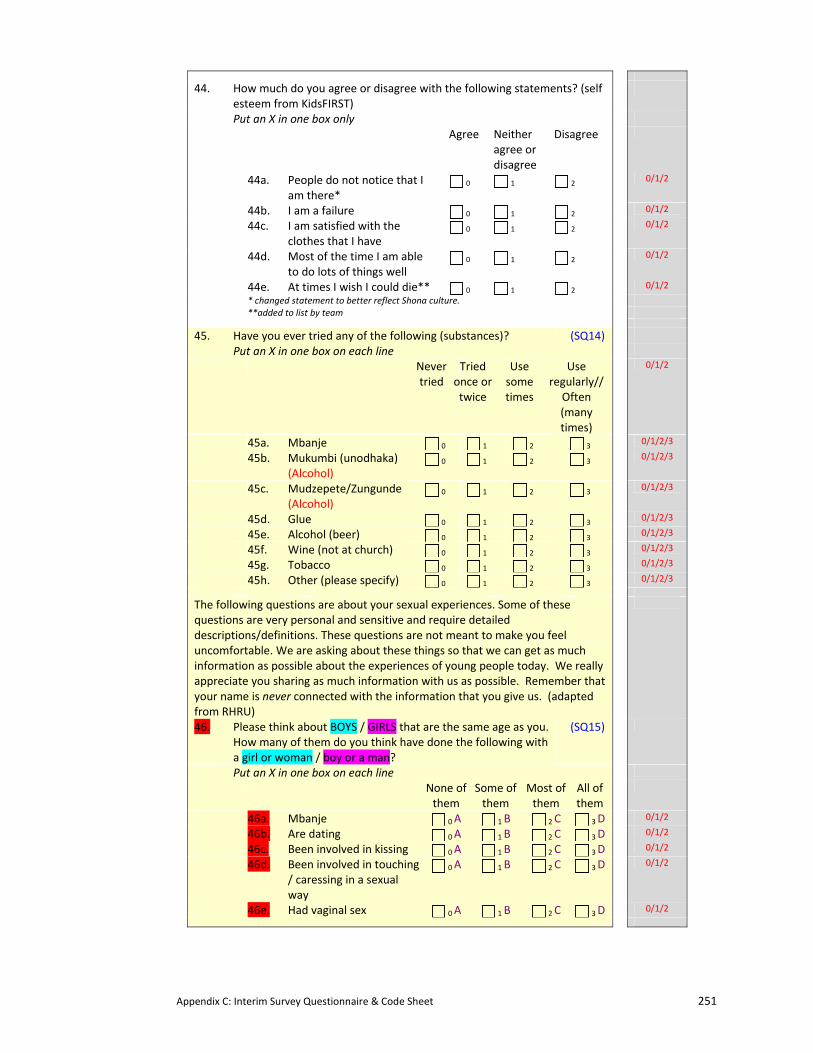
Appendix C: Interim Survey Questionnaire & Code Sheet 251
44. How much do you agree or disagree with the following statements? (self esteem from KidsFIRST)
Put an X in one box only
Agree Neither agree or disagree
Disagree
44a. People do not notice that I am there*
0 1 2 0/1/2
44b. I am a failure 0 1 2 0/1/2
44c. I am satisfied with the clothes that I have
0 1 2 0/1/2
44d. Most of the time I am able to do lots of things well
0 1 2 0/1/2
44e. At times I wish I could die** 0 1 2 0/1/2
* changed statement to better reflect Shona culture. **added to list by team
45. Have you ever tried any of the following (substances)? (SQ14)
Put an X in one box on each line
Never tried
Tried once or twice
Use some times
Use regularly// Often (many times)
0/1/2
45a. Mbanje 0 1 2 3 0/1/2/3
45b. Mukumbi (unodhaka) (Alcohol)
0 1 2 3 0/1/2/3
45c. Mudzepete/Zungunde (Alcohol)
0 1 2 3 0/1/2/3
45d. Glue 0 1 2 3 0/1/2/3
45e. Alcohol (beer) 0 1 2 3 0/1/2/3
45f. Wine (not at church) 0 1 2 3 0/1/2/3
45g. Tobacco 0 1 2 3 0/1/2/3
45h. Other (please specify) 0 1 2 3 0/1/2/3
The following questions are about your sexual experiences. Some of these questions are very personal and sensitive and require detailed descriptions/definitions. These questions are not meant to make you feel uncomfortable. We are asking about these things so that we can get as much information as possible about the experiences of young people today. We really appreciate you sharing as much information with us as possible. Remember that your name is never connected with the information that you give us. (adapted from RHRU)
46. Please think about BOYS / GIRLS that are the same age as you. How many of them do you think have done the following with a girl or woman / boy or a man?
(SQ15)
Put an X in one box on each line
None of them
Some of them
Most of them
All of them
46a. Mbanje 0 A 1 B 2 C 3 D 0/1/2
46b. Are dating 0 A 1 B 2 C 3 D 0/1/2
46c. Been involved in kissing 0 A 1 B 2 C 3 D 0/1/2
46d. Been involved in touching / caressing in a sexual way
0 A 1 B 2 C 3 D 0/1/2
46e. Had vaginal sex 0 A 1 B 2 C 3 D 0/1/2
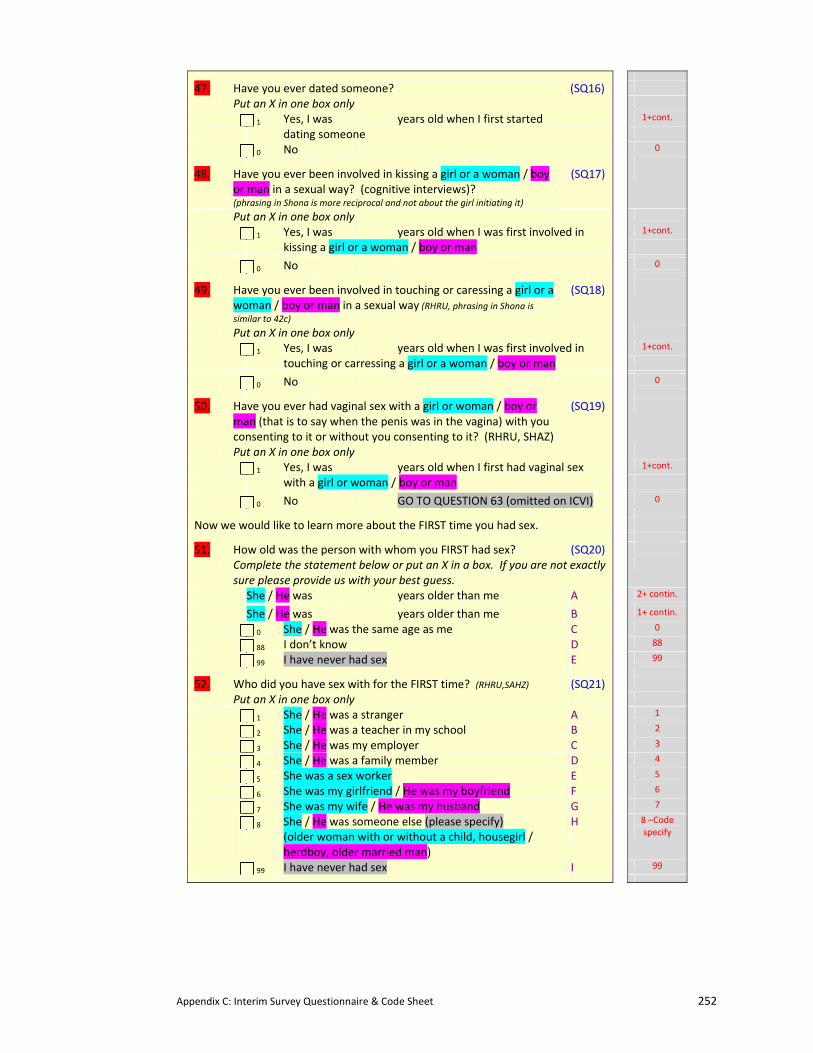
Appendix C: Interim Survey Questionnaire & Code Sheet 252
47. Have you ever dated someone? (SQ16)
Put an X in one box only
1 Yes, I was years old when I first started 1+cont.
dating someone
0 No 0
48. Have you ever been involved in kissing a girl or a woman / boy or man in a sexual way? (cognitive interviews)? (phrasing in Shona is more reciprocal and not about the girl initiating it)
(SQ17)
Put an X in one box only
1 Yes, I was years old when I was first involved in 1+cont.
kissing a girl or a woman / boy or man
0 No 0
49. Have you ever been involved in touching or caressing a girl or a woman / boy or man in a sexual way (RHRU, phrasing in Shona is similar to 42c)
(SQ18)
Put an X in one box only
1 Yes, I was years old when I was first involved in 1+cont.
touching or carressing a girl or a woman / boy or man
0 No 0
50. Have you ever had vaginal sex with a girl or woman / boy or man (that is to say when the penis was in the vagina) with you consenting to it or without you consenting to it? (RHRU, SHAZ)
(SQ19)
Put an X in one box only
1 Yes, I was years old when I first had vaginal sex 1+cont.
with a girl or woman / boy or man
0 No GO TO QUESTION 63 (omitted on ICVI) 0
Now we would like to learn more about the FIRST time you had sex.
51. How old was the person with whom you FIRST had sex? (SQ20)
Complete the statement below or put an X in a box. If you are not exactly sure please provide us with your best guess.
She / He was years older than me A 2+ contin.
She / He was years older than me B 1+ contin.
0 She / He was the same age as me C 0
88 I don’t know D 88
99 I have never had sex E 99
52. Who did you have sex with for the FIRST time? (RHRU,SAHZ) (SQ21)
Put an X in one box only
1 She / He was a stranger A 1
2 She / He was a teacher in my school B 2
3 She / He was my employer C 3
4 She / He was a family member D 4
5 She was a sex worker E 5
6 She was my girlfriend / He was my boyfriend F 6
7 She was my wife / He was my husband G 7
8 She / He was someone else (please specify) H
(older woman with or without a child, housegirl / herdboy, older married man)
8 –Code specify
99 I have never had sex I 99
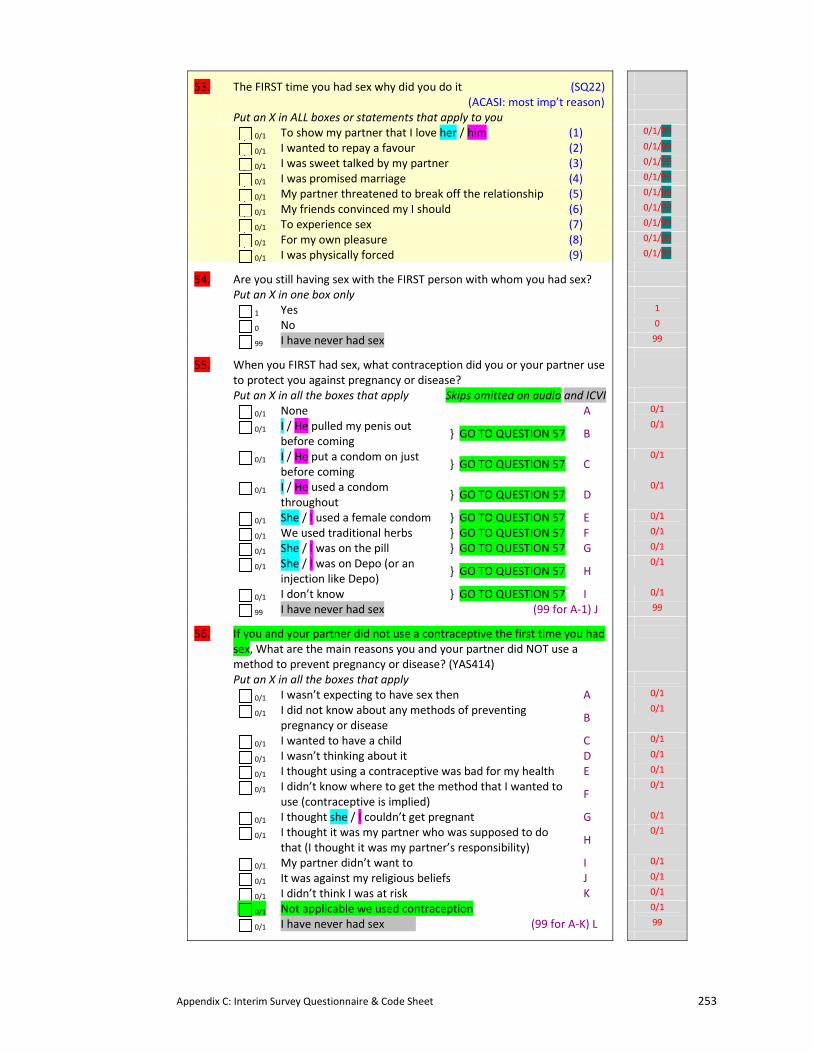
Appendix C: Interim Survey Questionnaire & Code Sheet 253
53. The FIRST time you had sex why did you do it (SQ22)
(ACASI: most imp’t reason)
Put an X in ALL boxes or statements that apply to you
0/1 To show my partner that I love her / him (1) 0/1/99
0/1 I wanted to repay a favour (2) 0/1/99
0/1 I was sweet talked by my partner (3) 0/1/99
0/1 I was promised marriage (4) 0/1/99
0/1 My partner threatened to break off the relationship (5) 0/1/99
0/1 My friends convinced my I should (6) 0/1/99
0/1 To experience sex (7) 0/1/99
0/1 For my own pleasure (8) 0/1/99
0/1 I was physically forced (9) 0/1/99
54. Are you still having sex with the FIRST person with whom you had sex?
Put an X in one box only
1 Yes 1
0 No 0
99 I have never had sex 99
55. When you FIRST had sex, what contraception did you or your partner use to protect you against pregnancy or disease?
Put an X in all the boxes that apply Skips omitted on audio and ICVI
0/1 None A 0/1
0/1 I / He pulled my penis out before coming
} GO TO QUESTION 57 B 0/1
0/1 I / He put a condom on just before coming
} GO TO QUESTION 57 C 0/1
0/1 I / He used a condom throughout
} GO TO QUESTION 57 D 0/1
0/1 She / I used a female condom } GO TO QUESTION 57 E 0/1
0/1 We used traditional herbs } GO TO QUESTION 57 F 0/1
0/1 She / I was on the pill } GO TO QUESTION 57 G 0/1
0/1 She / I was on Depo (or an injection like Depo)
} GO TO QUESTION 57 H 0/1
0/1 I don’t know } GO TO QUESTION 57 I 0/1
99 I have never had sex (99 for A‐1) J 99
56. If you and your partner did not use a contraceptive the first time you had sex, What are the main reasons you and your partner did NOT use a method to prevent pregnancy or disease? (YAS414)
Put an X in all the boxes that apply
0/1 I wasn’t expecting to have sex then A 0/1
0/1 I did not know about any methods of preventing pregnancy or disease
B 0/1
0/1 I wanted to have a child C 0/1
0/1 I wasn’t thinking about it D 0/1
0/1 I thought using a contraceptive was bad for my health E 0/1
0/1 I didn’t know where to get the method that I wanted to use (contraceptive is implied)
F 0/1
0/1 I thought she / I couldn’t get pregnant G 0/1
0/1 I thought it was my partner who was supposed to do that (I thought it was my partner’s responsibility)
H 0/1
0/1 My partner didn’t want to I 0/1
0/1 It was against my religious beliefs J 0/1
0/1 I didn’t think I was at risk K 0/1
0/1 Not applicable we used contraception 0/1
0/1 I have never had sex (99 for A‐K) L 99
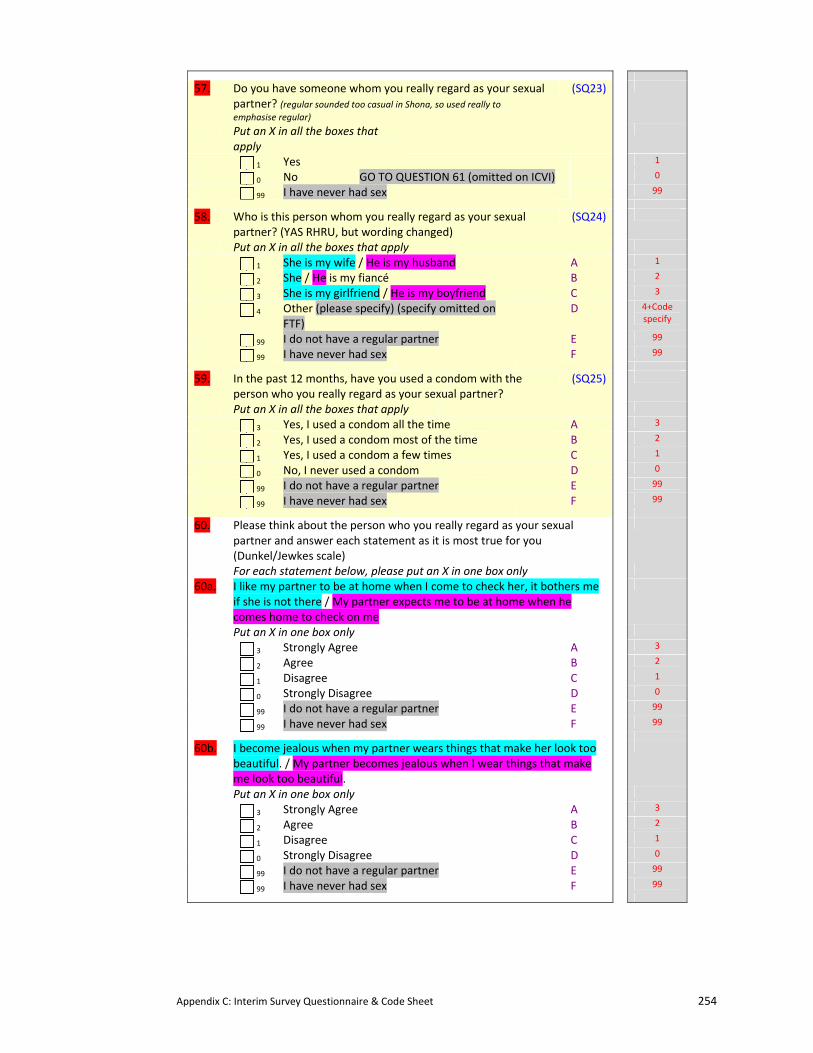
Appendix C: Interim Survey Questionnaire & Code Sheet 254
57. Do you have someone whom you really regard as your sexual partner? (regular sounded too casual in Shona, so used really to emphasise regular)
(SQ23)
Put an X in all the boxes that apply
1 Yes 1
0 No GO TO QUESTION 61 (omitted on ICVI) 0
99 I have never had sex 99
58. Who is this person whom you really regard as your sexual partner? (YAS RHRU, but wording changed)
(SQ24)
Put an X in all the boxes that apply
1 She is my wife / He is my husband A 1
2 She / He is my fiancé B 2
3 She is my girlfriend / He is my boyfriend C 3
4 Other (please specify) (specify omitted on FTF)
D 4+Code specify
99 I do not have a regular partner E 99
99 I have never had sex F 99
59. In the past 12 months, have you used a condom with the person who you really regard as your sexual partner?
(SQ25)
Put an X in all the boxes that apply
3 Yes, I used a condom all the time A 3
2 Yes, I used a condom most of the time B 2
1 Yes, I used a condom a few times C 1
0 No, I never used a condom D 0
99 I do not have a regular partner E 99
99 I have never had sex F 99
60. Please think about the person who you really regard as your sexual partner and answer each statement as it is most true for you (Dunkel/Jewkes scale)
For each statement below, please put an X in one box only
60a. I like my partner to be at home when I come to check her, it bothers me if she is not there / My partner expects me to be at home when he comes home to check on me
Put an X in one box only
3 Strongly Agree A 3
2 Agree B 2
1 Disagree C 1
0 Strongly Disagree D 0
99 I do not have a regular partner E 99
99 I have never had sex F 99
60b. I become jealous when my partner wears things that make her look too beautiful. / My partner becomes jealous when I wear things that make me look too beautiful.
Put an X in one box only
3 Strongly Agree A 3
2 Agree B 2
1 Disagree C 1
0 Strongly Disagree D 0
99 I do not have a regular partner E 99
99 I have never had sex F 99
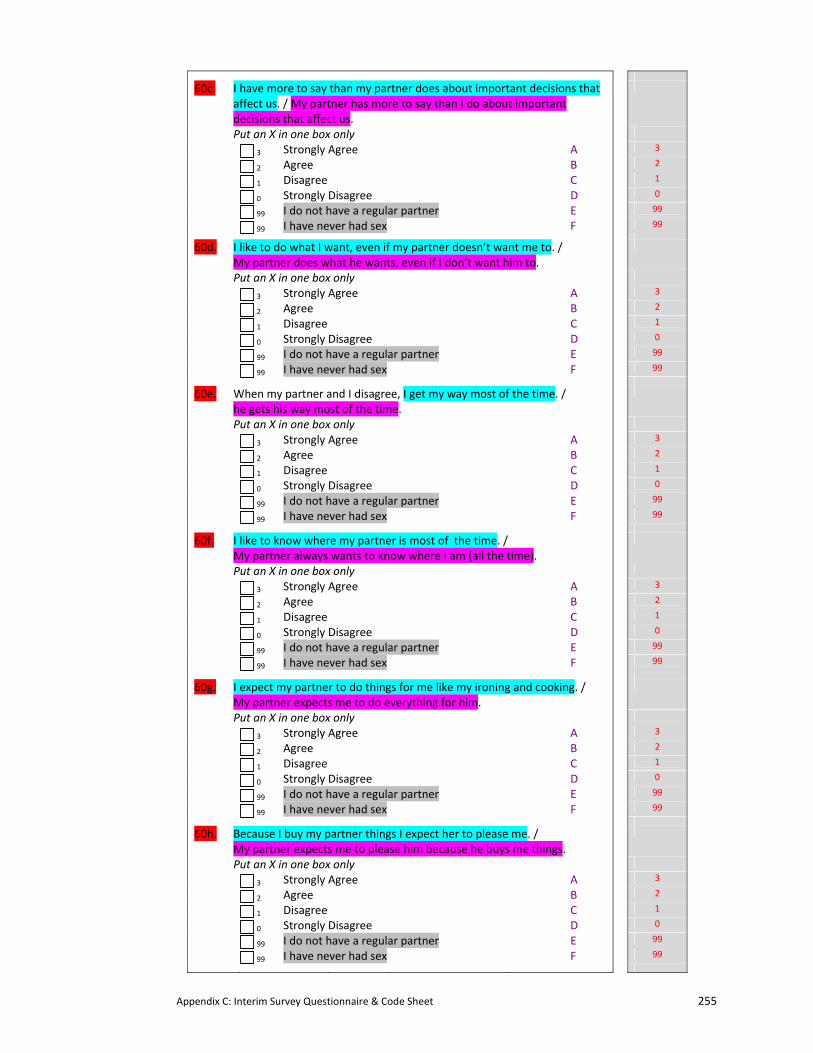
Appendix C: Interim Survey Questionnaire & Code Sheet 255
60c. I have more to say than my partner does about important decisions that affect us. / My partner has more to say than I do about important decisions that affect us.
Put an X in one box only
3 Strongly Agree A 3
2 Agree B 2
1 Disagree C 1
0 Strongly Disagree D 0
99 I do not have a regular partner E 99
99 I have never had sex F 99
60d. I like to do what I want, even if my partner doesn’t want me to. / My partner does what he wants, even if I don’t want him to.
Put an X in one box only
3 Strongly Agree A 3
2 Agree B 2
1 Disagree C 1
0 Strongly Disagree D 0
99 I do not have a regular partner E 99
99 I have never had sex F 99
60e. When my partner and I disagree, I get my way most of the time. / he gets his way most of the time.
Put an X in one box only
3 Strongly Agree A 3
2 Agree B 2
1 Disagree C 1
0 Strongly Disagree D 0
99 I do not have a regular partner E 99
99 I have never had sex F 99
60f. I like to know where my partner is most of the time. / My partner always wants to know where I am (all the time).
Put an X in one box only
3 Strongly Agree A 3
2 Agree B 2
1 Disagree C 1
0 Strongly Disagree D 0
99 I do not have a regular partner E 99
99 I have never had sex F 99
60g. I expect my partner to do things for me like my ironing and cooking. / My partner expects me to do everything for him.
Put an X in one box only
3 Strongly Agree A 3
2 Agree B 2
1 Disagree C 1
0 Strongly Disagree D 0
99 I do not have a regular partner E 99
99 I have never had sex F 99
60h. Because I buy my partner things I expect her to please me. / My partner expects me to please him because he buys me things.
Put an X in one box only
3 Strongly Agree A 3
2 Agree B 2
1 Disagree C 1
0 Strongly Disagree D 0
99 I do not have a regular partner E 99
99 I have never had sex F 99
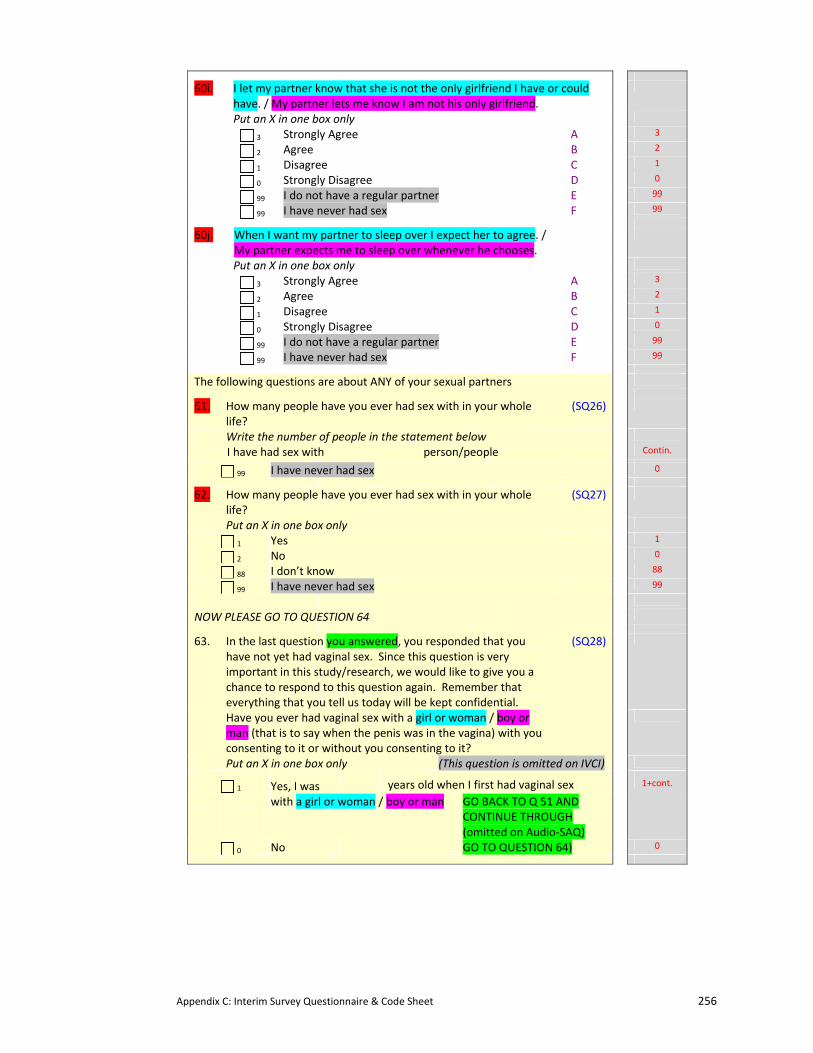
Appendix C: Interim Survey Questionnaire & Code Sheet 256
60i. I let my partner know that she is not the only girlfriend I have or could have. / My partner lets me know I am not his only girlfriend.
Put an X in one box only
3 Strongly Agree A 3
2 Agree B 2
1 Disagree C 1
0 Strongly Disagree D 0
99 I do not have a regular partner E 99
99 I have never had sex F 99
60j. When I want my partner to sleep over I expect her to agree. / My partner expects me to sleep over whenever he chooses.
Put an X in one box only
3 Strongly Agree A 3
2 Agree B 2
1 Disagree C 1
0 Strongly Disagree D 0
99 I do not have a regular partner E 99
99 I have never had sex F 99
The following questions are about ANY of your sexual partners
61. How many people have you ever had sex with in your whole life?
(SQ26)
Write the number of people in the statement below
I have had sex with person/people Contin.
99 I have never had sex 0
62. How many people have you ever had sex with in your whole life?
(SQ27)
Put an X in one box only
1 Yes 1
2 No 0
88 I don’t know 88
99 I have never had sex 99
NOW PLEASE GO TO QUESTION 64
63. In the last question you answered, you responded that you have not yet had vaginal sex. Since this question is very important in this study/research, we would like to give you a chance to respond to this question again. Remember that everything that you tell us today will be kept confidential.
Have you ever had vaginal sex with a girl or woman / boy or man (that is to say when the penis was in the vagina) with you consenting to it or without you consenting to it?
(SQ28)
Put an X in one box only (This question is omitted on IVCI)
1 Yes, I was years old when I first had vaginal sex
with a girl or woman / boy or man GO BACK TO Q 51 AND CONTINUE THROUGH (omitted on Audio‐SAQ)
1+cont.
0 No GO TO QUESTION 64) 0
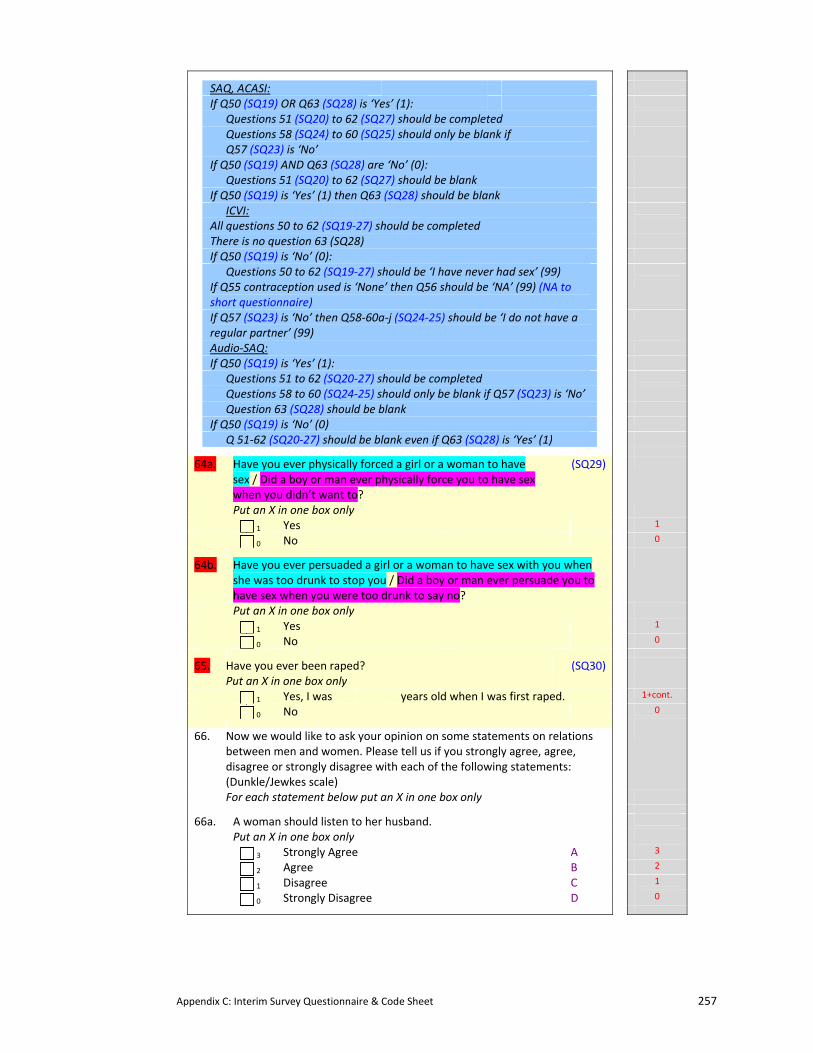
Appendix C: Interim Survey Questionnaire & Code Sheet 257
SAQ, ACASI:
If Q50 (SQ19) OR Q63 (SQ28) is ‘Yes’ (1):
Questions 51 (SQ20) to 62 (SQ27) should be completed
Questions 58 (SQ24) to 60 (SQ25) should only be blank if Q57 (SQ23) is ‘No’
If Q50 (SQ19) AND Q63 (SQ28) are ‘No’ (0):
Questions 51 (SQ20) to 62 (SQ27) should be blank
If Q50 (SQ19) is ‘Yes’ (1) then Q63 (SQ28) should be blank
ICVI:
All questions 50 to 62 (SQ19‐27) should be completed
There is no question 63 (SQ28)
If Q50 (SQ19) is ‘No’ (0):
Questions 50 to 62 (SQ19‐27) should be ‘I have never had sex’ (99)
If Q55 contraception used is ‘None’ then Q56 should be ‘NA’ (99) (NA to short questionnaire)
If Q57 (SQ23) is ‘No’ then Q58‐60a‐j (SQ24‐25) should be ‘I do not have a regular partner’ (99)
Audio‐SAQ:
If Q50 (SQ19) is ‘Yes’ (1):
Questions 51 to 62 (SQ20‐27) should be completed
Questions 58 to 60 (SQ24‐25) should only be blank if Q57 (SQ23) is ‘No’
Question 63 (SQ28) should be blank
If Q50 (SQ19) is ‘No’ (0)
Q 51‐62 (SQ20‐27) should be blank even if Q63 (SQ28) is ‘Yes’ (1)
64a. Have you ever physically forced a girl or a woman to have sex / Did a boy or man ever physically force you to have sex when you didn’t want to?
(SQ29)
Put an X in one box only
1 Yes 1
0 No 0
64b. Have you ever persuaded a girl or a woman to have sex with you when she was too drunk to stop you / Did a boy or man ever persuade you to have sex when you were too drunk to say no?
Put an X in one box only
1 Yes 1
0 No 0
65. Have you ever been raped? (SQ30)
Put an X in one box only
1 Yes, I was years old when I was first raped. 1+cont.
0 No 0
66. Now we would like to ask your opinion on some statements on relations between men and women. Please tell us if you strongly agree, agree, disagree or strongly disagree with each of the following statements: (Dunkle/Jewkes scale)
For each statement below put an X in one box only
66a. A woman should listen to her husband.
Put an X in one box only
3 Strongly Agree A 3
2 Agree B 2
1 Disagree C 1
0 Strongly Disagree D 0
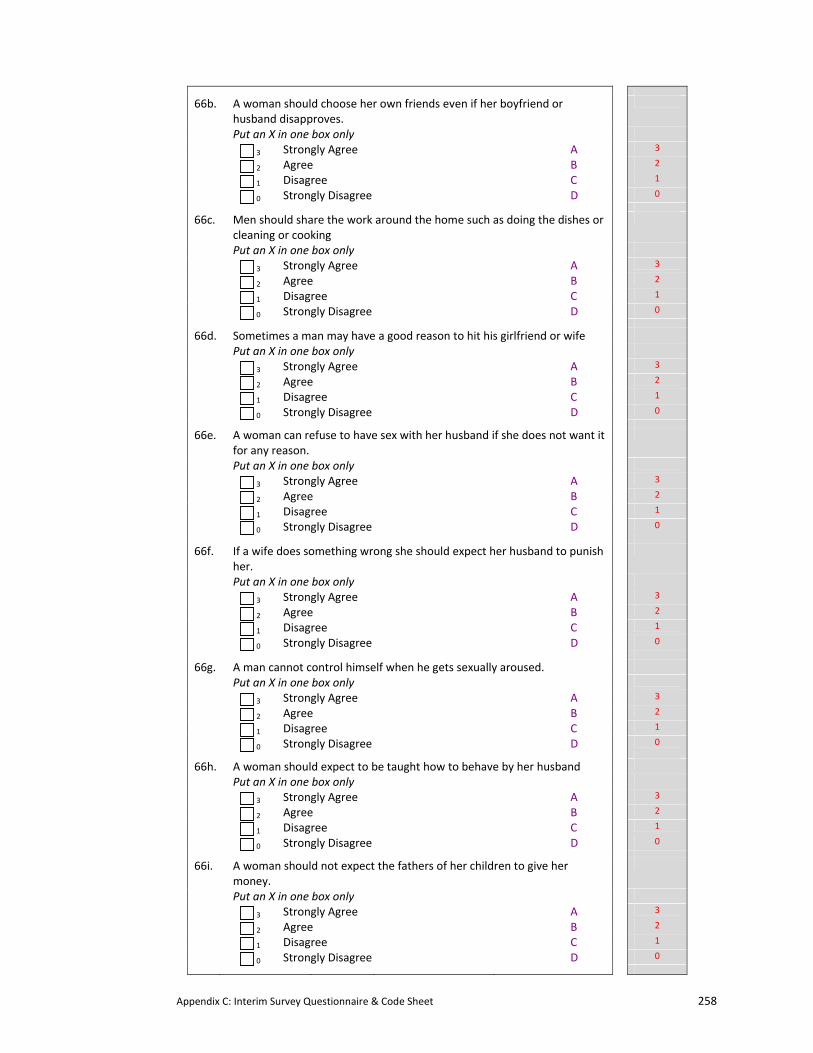
Appendix C: Interim Survey Questionnaire & Code Sheet 258
66b. A woman should choose her own friends even if her boyfriend or husband disapproves.
Put an X in one box only
3 Strongly Agree A 3
2 Agree B 2
1 Disagree C 1
0 Strongly Disagree D 0
66c. Men should share the work around the home such as doing the dishes or cleaning or cooking
Put an X in one box only
3 Strongly Agree A 3
2 Agree B 2
1 Disagree C 1
0 Strongly Disagree D 0
66d. Sometimes a man may have a good reason to hit his girlfriend or wife
Put an X in one box only
3 Strongly Agree A 3
2 Agree B 2
1 Disagree C 1
0 Strongly Disagree D 0
66e. A woman can refuse to have sex with her husband if she does not want it for any reason.
Put an X in one box only
3 Strongly Agree A 3
2 Agree B 2
1 Disagree C 1
0 Strongly Disagree D 0
66f. If a wife does something wrong she should expect her husband to punish her.
Put an X in one box only
3 Strongly Agree A 3
2 Agree B 2
1 Disagree C 1
0 Strongly Disagree D 0
66g. A man cannot control himself when he gets sexually aroused.
Put an X in one box only
3 Strongly Agree A 3
2 Agree B 2
1 Disagree C 1
0 Strongly Disagree D 0
66h. A woman should expect to be taught how to behave by her husband
Put an X in one box only
3 Strongly Agree A 3
2 Agree B 2
1 Disagree C 1
0 Strongly Disagree D 0
66i. A woman should not expect the fathers of her children to give her money.
Put an X in one box only
3 Strongly Agree A 3
2 Agree B 2
1 Disagree C 1
0 Strongly Disagree D 0
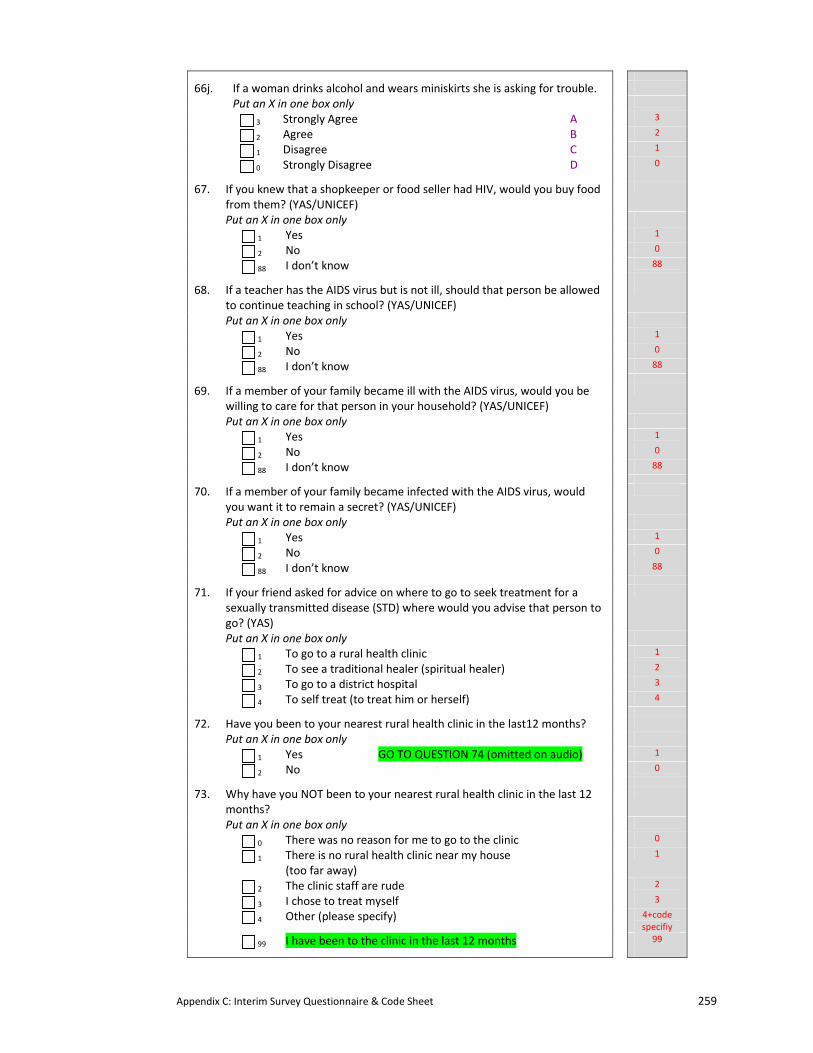
Appendix C: Interim Survey Questionnaire & Code Sheet 259
66j. If a woman drinks alcohol and wears miniskirts she is asking for trouble.
Put an X in one box only
3 Strongly Agree A 3
2 Agree B 2
1 Disagree C 1
0 Strongly Disagree D 0
67. If you knew that a shopkeeper or food seller had HIV, would you buy food from them? (YAS/UNICEF)
Put an X in one box only
1 Yes 1
2 No 0
88 I don’t know 88
68. If a teacher has the AIDS virus but is not ill, should that person be allowed to continue teaching in school? (YAS/UNICEF)
Put an X in one box only
1 Yes 1
2 No 0
88 I don’t know 88
69. If a member of your family became ill with the AIDS virus, would you be willing to care for that person in your household? (YAS/UNICEF)
Put an X in one box only
1 Yes 1
2 No 0
88 I don’t know 88
70. If a member of your family became infected with the AIDS virus, would you want it to remain a secret? (YAS/UNICEF)
Put an X in one box only
1 Yes 1
2 No 0
88 I don’t know 88
71. If your friend asked for advice on where to go to seek treatment for a sexually transmitted disease (STD) where would you advise that person to go? (YAS)
Put an X in one box only
1 To go to a rural health clinic 1
2 To see a traditional healer (spiritual healer) 2
3 To go to a district hospital 3
4 To self treat (to treat him or herself) 4
72. Have you been to your nearest rural health clinic in the last12 months?
Put an X in one box only
1 Yes GO TO QUESTION 74 (omitted on audio) 1
2 No 0
73. Why have you NOT been to your nearest rural health clinic in the last 12 months?
Put an X in one box only
0 There was no reason for me to go to the clinic 0
1 There is no rural health clinic near my house (too far away)
1
2 The clinic staff are rude 2
3 I chose to treat myself 3
4 Other (please specify) 4+code specifiy
99 I have been to the clinic in the last 12 months 99
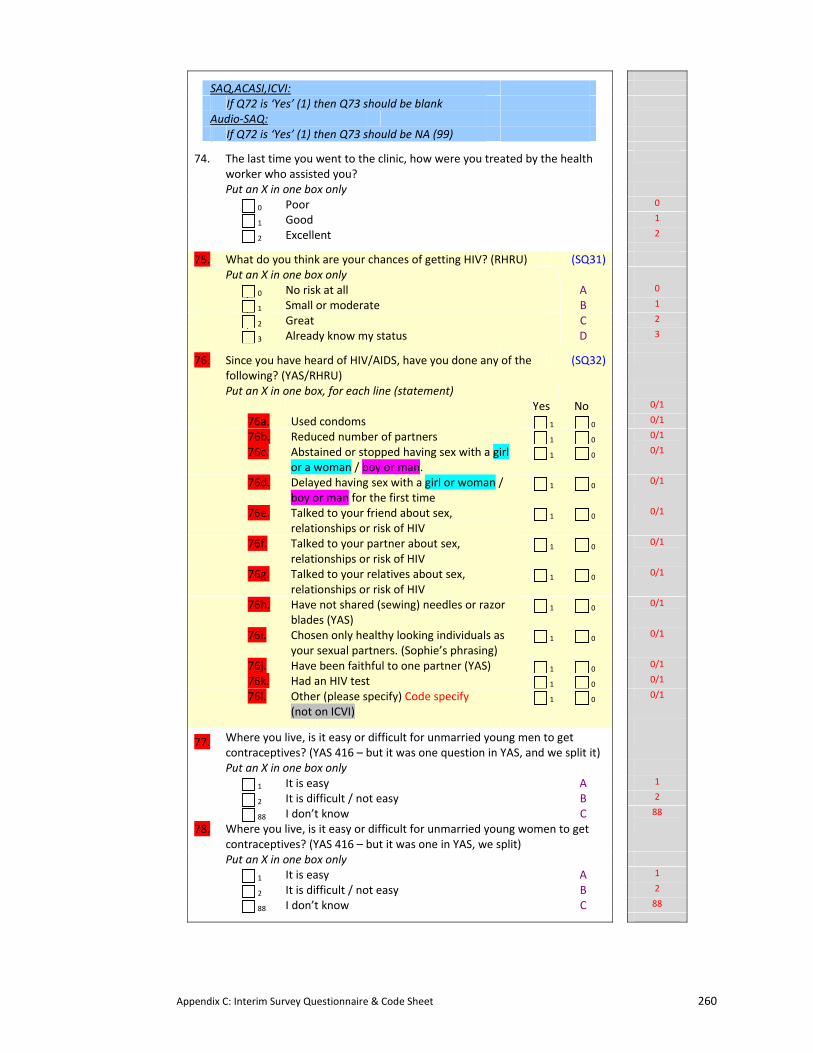
Appendix C: Interim Survey Questionnaire & Code Sheet 260
SAQ,ACASI,ICVI:
If Q72 is ‘Yes’ (1) then Q73 should be blank
Audio‐SAQ:
If Q72 is ‘Yes’ (1) then Q73 should be NA (99)
74. The last time you went to the clinic, how were you treated by the health worker who assisted you?
Put an X in one box only
0 Poor 0
1 Good 1
2 Excellent 2
75. What do you think are your chances of getting HIV? (RHRU) (SQ31)
Put an X in one box only
0 No risk at all A 0
1 Small or moderate B 1
2 Great C 2
3 Already know my status D 3
76. Since you have heard of HIV/AIDS, have you done any of the following? (YAS/RHRU)
(SQ32)
Put an X in one box, for each line (statement)
Yes No 0/1
76a. Used condoms 1 0 0/1
76b. Reduced number of partners 1 0 0/1
76c. Abstained or stopped having sex with a girl or a woman / boy or man.
1 0 0/1
76d. Delayed having sex with a girl or woman / boy or man for the first time
1 0 0/1
76e. Talked to your friend about sex, relationships or risk of HIV
1 0 0/1
76f. Talked to your partner about sex, relationships or risk of HIV
1 0 0/1
76g. Talked to your relatives about sex, relationships or risk of HIV
1 0 0/1
76h. Have not shared (sewing) needles or razor blades (YAS)
1 0 0/1
76i. Chosen only healthy looking individuals as your sexual partners. (Sophie’s phrasing)
1 0 0/1
76j. Have been faithful to one partner (YAS) 1 0 0/1
76k. Had an HIV test 1 0 0/1
76l. Other (please specify) Code specify (not on ICVI)
1 0 0/1
77. Where you live, is it easy or difficult for unmarried young men to get contraceptives? (YAS 416 – but it was one question in YAS, and we split it)
Put an X in one box only
1 It is easy A 1
2 It is difficult / not easy B 2
88 I don’t know C 88
78. Where you live, is it easy or difficult for unmarried young women to get contraceptives? (YAS 416 – but it was one in YAS, we split)
Put an X in one box only
1 It is easy A 1
2 It is difficult / not easy B 2
88 I don’t know C 88
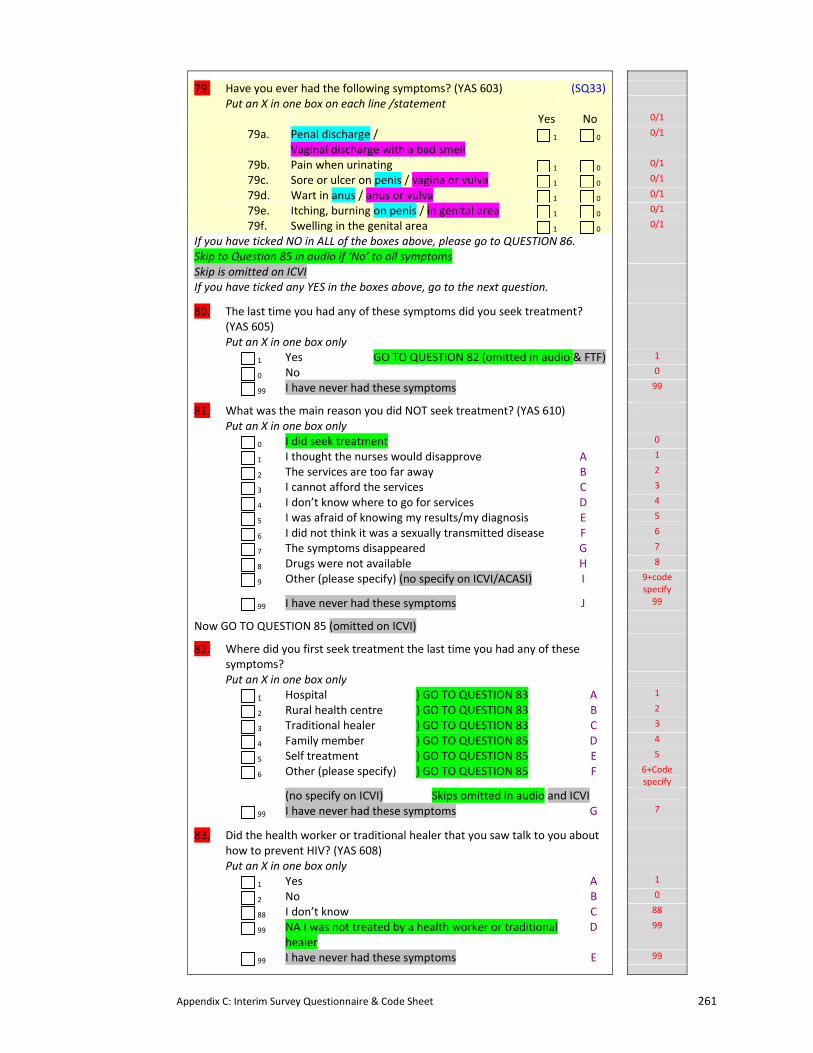
Appendix C: Interim Survey Questionnaire & Code Sheet 261
79. Have you ever had the following symptoms? (YAS 603) (SQ33)
Put an X in one box on each line /statement
Yes No 0/1
79a. Penal discharge / Vaginal discharge with a bad smell
1 0 0/1
79b. Pain when urinating 1 0 0/1
79c. Sore or ulcer on penis / vagina or vulva 1 0 0/1
79d. Wart in anus / anus or vulva 1 0 0/1
79e. Itching, burning on penis / in genital area 1 0 0/1
79f. Swelling in the genital area 1 0 0/1
If you have ticked NO in ALL of the boxes above, please go to QUESTION 86. Skip to Question 85 in audio if ‘No’ to all symptoms
Skip is omitted on ICVI If you have ticked any YES in the boxes above, go to the next question.
80. The last time you had any of these symptoms did you seek treatment? (YAS 605)
Put an X in one box only
1 Yes GO TO QUESTION 82 (omitted in audio & FTF) 1
0 No 0
99 I have never had these symptoms 99
81. What was the main reason you did NOT seek treatment? (YAS 610)
Put an X in one box only
0 I did seek treatment 0
1 I thought the nurses would disapprove A 1
2 The services are too far away B 2
3 I cannot afford the services C 3
4 I don’t know where to go for services D 4
5 I was afraid of knowing my results/my diagnosis E 5
6 I did not think it was a sexually transmitted disease F 6
7 The symptoms disappeared G 7
8 Drugs were not available H 8
9 Other (please specify) (no specify on ICVI/ACASI) I 9+code specify
99 I have never had these symptoms J 99
Now GO TO QUESTION 85 (omitted on ICVI)
82. Where did you first seek treatment the last time you had any of these symptoms?
Put an X in one box only
1 Hospital } GO TO QUESTION 83 A 1
2 Rural health centre } GO TO QUESTION 83 B 2
3 Traditional healer } GO TO QUESTION 83 C 3
4 Family member } GO TO QUESTION 85 D 4
5 Self treatment } GO TO QUESTION 85 E 5
6 Other (please specify) } GO TO QUESTION 85 F 6+Code specify
(no specify on ICVI) Skips omitted in audio and ICVI
99 I have never had these symptoms G 7
83. Did the health worker or traditional healer that you saw talk to you about how to prevent HIV? (YAS 608)
Put an X in one box only
1 Yes A 1
2 No B 0
88 I don’t know C 88
99 NA I was not treated by a health worker or traditional healer
D 99
99 I have never had these symptoms E 99
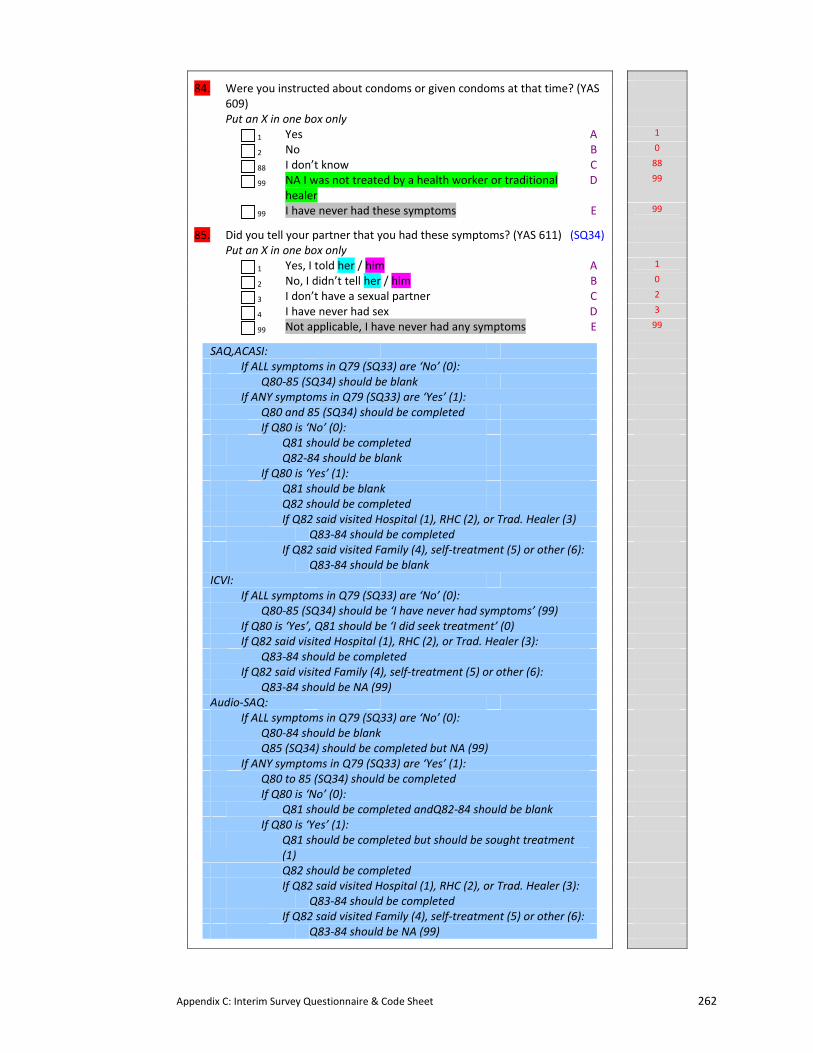
Appendix C: Interim Survey Questionnaire & Code Sheet 262
84. Were you instructed about condoms or given condoms at that time? (YAS 609)
Put an X in one box only
1 Yes A 1
2 No B 0
88 I don’t know C 88
99 NA I was not treated by a health worker or traditional healer
D 99
99 I have never had these symptoms E 99
85. Did you tell your partner that you had these symptoms? (YAS 611) (SQ34)
Put an X in one box only
1 Yes, I told her / him A 1
2 No, I didn’t tell her / him B 0
3 I don’t have a sexual partner C 2
4 I have never had sex D 3
99 Not applicable, I have never had any symptoms E 99
SAQ,ACASI: If ALL symptoms in Q79 (SQ33) are ‘No’ (0): Q80‐85 (SQ34) should be blank If ANY symptoms in Q79 (SQ33) are ‘Yes’ (1): Q80 and 85 (SQ34) should be completed If Q80 is ‘No’ (0): Q81 should be completed Q82‐84 should be blank If Q80 is ‘Yes’ (1): Q81 should be blank Q82 should be completed If Q82 said visited Hospital (1), RHC (2), or Trad. Healer (3) Q83‐84 should be completed If Q82 said visited Family (4), self‐treatment (5) or other (6): Q83‐84 should be blank ICVI: If ALL symptoms in Q79 (SQ33) are ‘No’ (0): Q80‐85 (SQ34) should be ‘I have never had symptoms’ (99) If Q80 is ‘Yes’, Q81 should be ‘I did seek treatment’ (0) If Q82 said visited Hospital (1), RHC (2), or Trad. Healer (3): Q83‐84 should be completed If Q82 said visited Family (4), self‐treatment (5) or other (6): Q83‐84 should be NA (99) Audio‐SAQ: If ALL symptoms in Q79 (SQ33) are ‘No’ (0): Q80‐84 should be blank Q85 (SQ34) should be completed but NA (99) If ANY symptoms in Q79 (SQ33) are ‘Yes’ (1): Q80 to 85 (SQ34) should be completed If Q80 is ‘No’ (0): Q81 should be completed andQ82‐84 should be blank If Q80 is ‘Yes’ (1): Q81 should be completed but should be sought treatment
(1)
Q82 should be completed If Q82 said visited Hospital (1), RHC (2), or Trad. Healer (3): Q83‐84 should be completed If Q82 said visited Family (4), self‐treatment (5) or other (6): Q83‐84 should be NA (99)
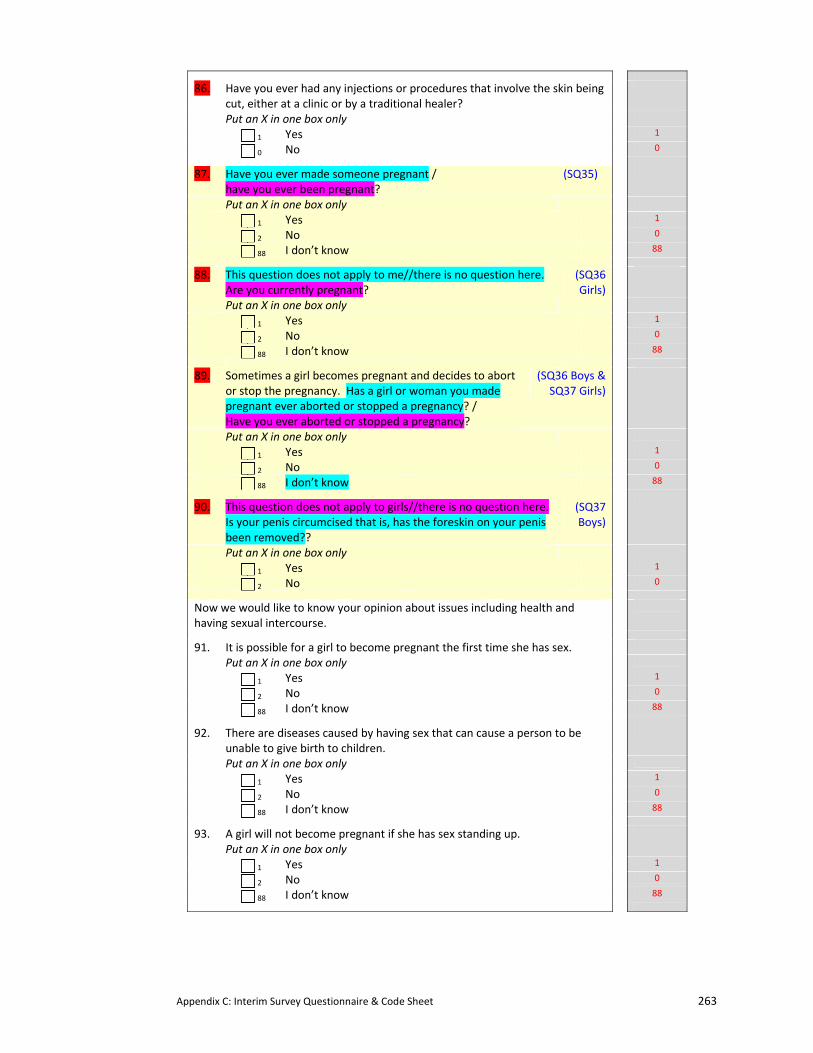
Appendix C: Interim Survey Questionnaire & Code Sheet 263
86. Have you ever had any injections or procedures that involve the skin being cut, either at a clinic or by a traditional healer?
Put an X in one box only
1 Yes 1
0 No 0
87. Have you ever made someone pregnant / have you ever been pregnant?
(SQ35)
Put an X in one box only
1 Yes 1
2 No 0
88 I don’t know 88
88. This question does not apply to me//there is no question here. Are you currently pregnant?
(SQ36 Girls)
Put an X in one box only
1 Yes 1
2 No 0
88 I don’t know 88
89. Sometimes a girl becomes pregnant and decides to abort or stop the pregnancy. Has a girl or woman you made pregnant ever aborted or stopped a pregnancy? / Have you ever aborted or stopped a pregnancy?
(SQ36 Boys & SQ37 Girls)
Put an X in one box only
1 Yes 1
2 No 0
88 I don’t know 88
90. This question does not apply to girls//there is no question here. Is your penis circumcised that is, has the foreskin on your penis been removed??
(SQ37 Boys)
Put an X in one box only
1 Yes 1
2 No 0
Now we would like to know your opinion about issues including health and having sexual intercourse.
91. It is possible for a girl to become pregnant the first time she has sex.
Put an X in one box only
1 Yes 1
2 No 0
88 I don’t know 88
92. There are diseases caused by having sex that can cause a person to be unable to give birth to children.
Put an X in one box only
1 Yes 1
2 No 0
88 I don’t know 88
93. A girl will not become pregnant if she has sex standing up.
Put an X in one box only
1 Yes 1
2 No 0
88 I don’t know 88
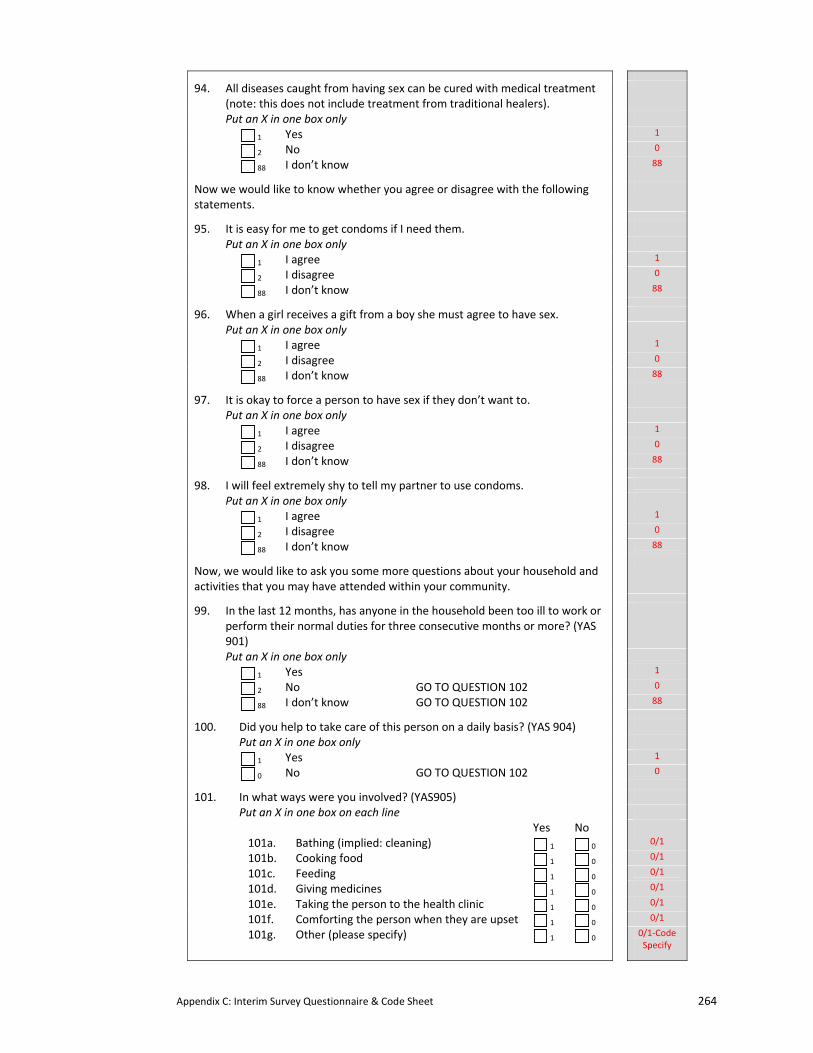
Appendix C: Interim Survey Questionnaire & Code Sheet 264
94. All diseases caught from having sex can be cured with medical treatment (note: this does not include treatment from traditional healers).
Put an X in one box only
1 Yes 1
2 No 0
88 I don’t know 88
Now we would like to know whether you agree or disagree with the following statements.
95. It is easy for me to get condoms if I need them.
Put an X in one box only
1 I agree 1
2 I disagree 0
88 I don’t know 88
96. When a girl receives a gift from a boy she must agree to have sex.
Put an X in one box only
1 I agree 1
2 I disagree 0
88 I don’t know 88
97. It is okay to force a person to have sex if they don’t want to.
Put an X in one box only
1 I agree 1
2 I disagree 0
88 I don’t know 88
98. I will feel extremely shy to tell my partner to use condoms.
Put an X in one box only
1 I agree 1
2 I disagree 0
88 I don’t know 88
Now, we would like to ask you some more questions about your household and activities that you may have attended within your community.
99. In the last 12 months, has anyone in the household been too ill to work or perform their normal duties for three consecutive months or more? (YAS 901)
Put an X in one box only
1 Yes 1
2 No GO TO QUESTION 102 0
88 I don’t know GO TO QUESTION 102 88
100. Did you help to take care of this person on a daily basis? (YAS 904)
Put an X in one box only 1 Yes 1
0 No GO TO QUESTION 102 0
101. In what ways were you involved? (YAS905)
Put an X in one box on each line Yes No 101a. Bathing (implied: cleaning) 1 0
0/1 101b. Cooking food 1 0
0/1 101c. Feeding 1 0
0/1 101d. Giving medicines 1 0
0/1 101e. Taking the person to the health clinic 1 0
0/1 101f. Comforting the person when they are upset 1 0
0/1 101g. Other (please specify) 1 0
0/1‐Code Specify
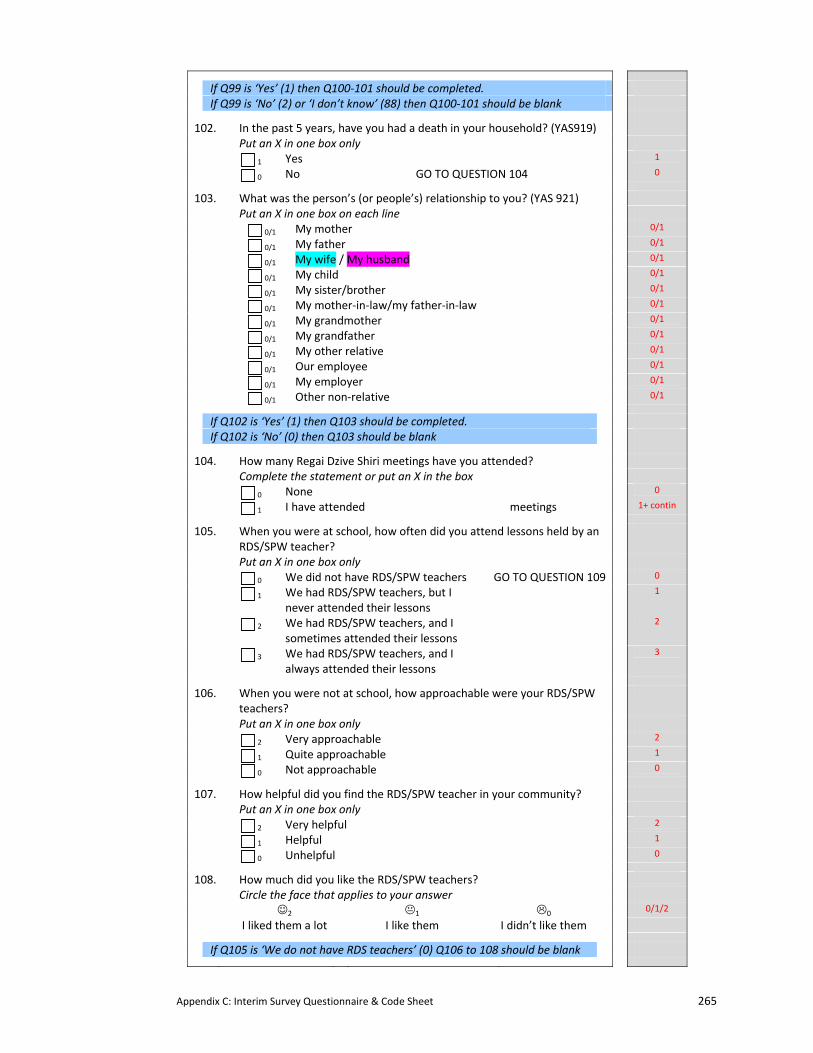
Appendix C: Interim Survey Questionnaire & Code Sheet 265
If Q99 is ‘Yes’ (1) then Q100‐101 should be completed. If Q99 is ‘No’ (2) or ‘I don’t know’ (88) then Q100‐101 should be blank
102. In the past 5 years, have you had a death in your household? (YAS919)
Put an X in one box only 1 Yes 1
0 No GO TO QUESTION 104 0
103. What was the person’s (or people’s) relationship to you? (YAS 921)
Put an X in one box on each line 0/1 My mother 0/1
0/1 My father 0/1
0/1 My wife / My husband 0/1
0/1 My child 0/1
0/1 My sister/brother 0/1
0/1 My mother‐in‐law/my father‐in‐law 0/1
0/1 My grandmother 0/1
0/1 My grandfather 0/1
0/1 My other relative 0/1
0/1 Our employee 0/1
0/1 My employer 0/1
0/1 Other non‐relative 0/1
If Q102 is ‘Yes’ (1) then Q103 should be completed. If Q102 is ‘No’ (0) then Q103 should be blank
104. How many Regai Dzive Shiri meetings have you attended?
Complete the statement or put an X in the box 0 None 0
1 I have attended meetings 1+ contin
105. When you were at school, how often did you attend lessons held by an RDS/SPW teacher?
Put an X in one box only 0 We did not have RDS/SPW teachers GO TO QUESTION 109 0
1 We had RDS/SPW teachers, but I never attended their lessons
1
2 We had RDS/SPW teachers, and I sometimes attended their lessons
2
3 We had RDS/SPW teachers, and I always attended their lessons
3
106. When you were not at school, how approachable were your RDS/SPW teachers?
Put an X in one box only 2 Very approachable 2
1 Quite approachable 1
0 Not approachable 0
107. How helpful did you find the RDS/SPW teacher in your community?
Put an X in one box only 2 Very helpful 2
1 Helpful 1
0 Unhelpful 0
108. How much did you like the RDS/SPW teachers?
Circle the face that applies to your answer ☺2 1 0
0/1/2
I liked them a lot I like them I didn’t like them
If Q105 is ‘We do not have RDS teachers’ (0) Q106 to 108 should be blank
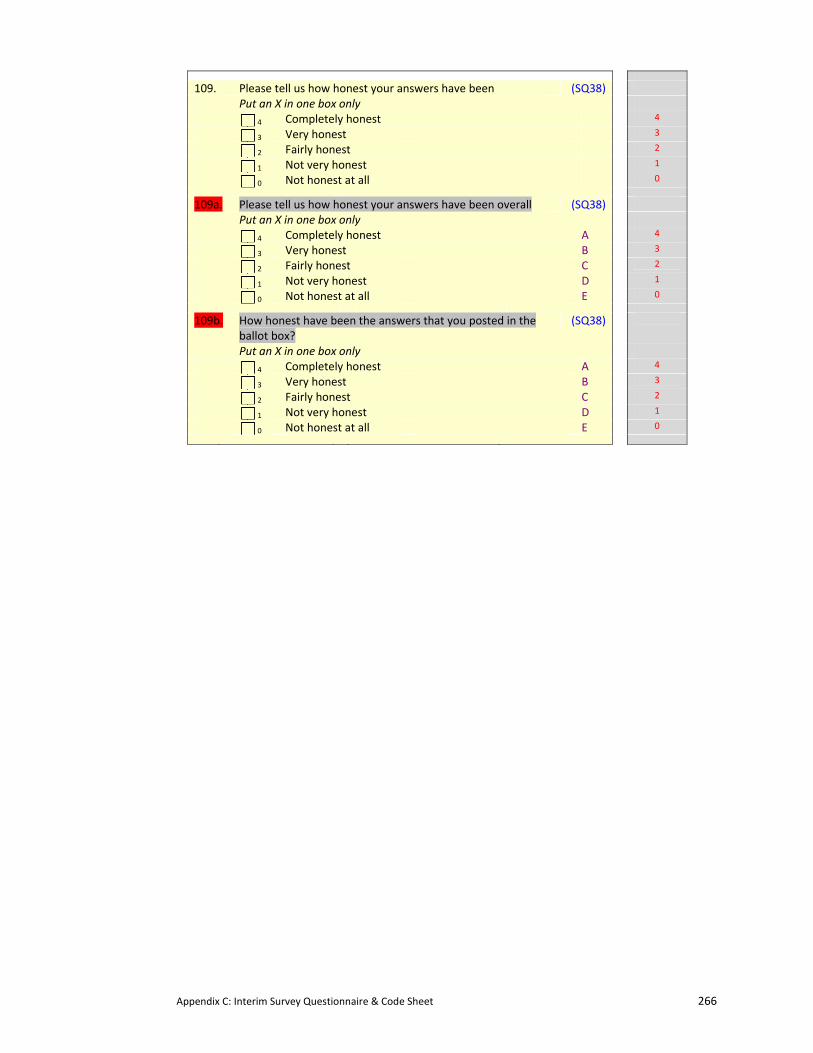
Appendix C: Interim Survey Questionnaire & Code Sheet 266
109. Please tell us how honest your answers have been (SQ38)
Put an X in one box only 4 Completely honest 4
3 Very honest 3
2 Fairly honest 2
1 Not very honest 1
0 Not honest at all 0
109a. Please tell us how honest your answers have been overall (SQ38)
Put an X in one box only 4 Completely honest A 4
3 Very honest B 3
2 Fairly honest C 2
1 Not very honest D 1
0 Not honest at all E 0
109b. How honest have been the answers that you posted in the ballot box?
(SQ38)
Put an X in one box only 4 Completely honest A 4
3 Very honest B 3
2 Fairly honest C 2
1 Not very honest D 1
0 Not honest at all E 0
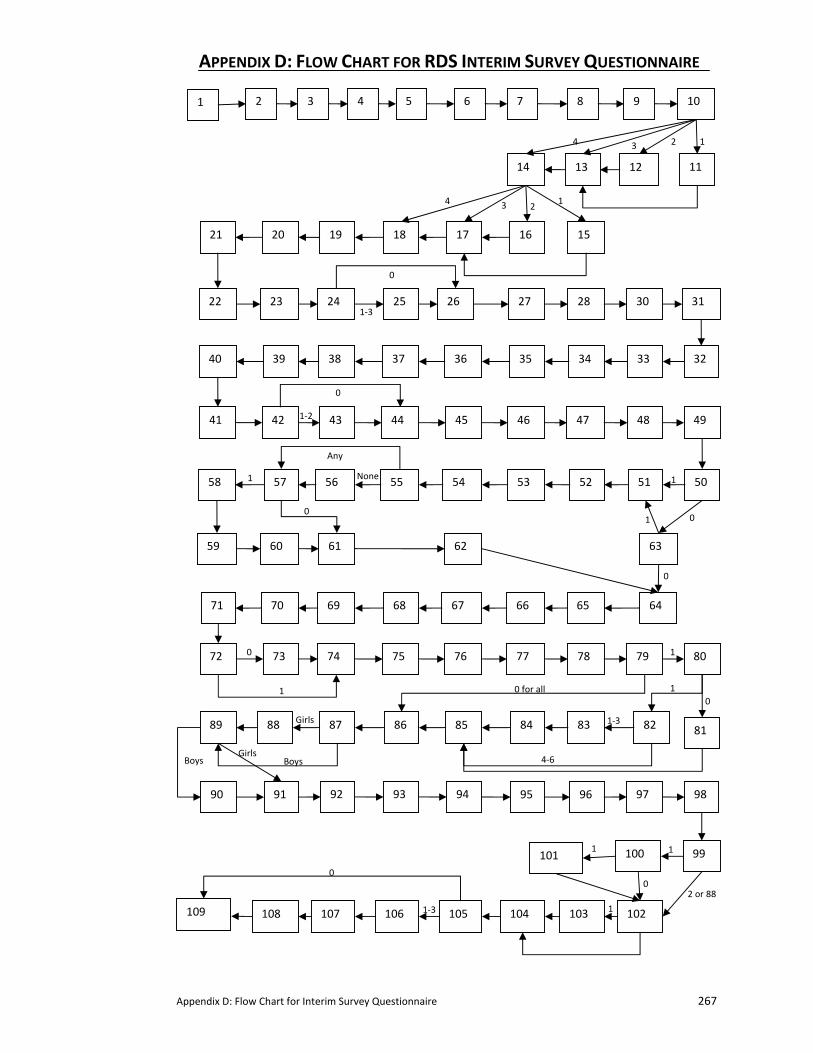
Appendix D: Flow Chart for Interim Survey Questionnaire 267
3 5 7 9
1113
15
2 4 6 8 10
12 14
1617181920 21
22 23 24 25 26 27 28 30 31
3233 34 3536373839 40
41 42 43 44 45 46 47 48 49
5051 52 5354
64
555657 58
59 60 61 62 63
93
65 6667686970 71
72 73 74 75 76 77 78 79
90
80
818284 83 89
9291
88 87 86 85
94 95 96 97 98
99
1
100 101
103 104105106107108 109 102
14 23
124 3
0
1‐2
Any
None
0
1 1
1 0
0
0
1 10
1‐3
4‐6
Girls
Girls Boys Boys
1 1
1
0 0
2 or 88
1‐3
0
1‐3
0 for all
1
APPENDIX D: FLOW CHART FOR RDS INTERIM SURVEY QUESTIONNAIRE
Appendix E: Ballot Sheet for ICVI (QDM Trial) 268
APPENDIX E: BALLOT SHEETS FOR ICVI INTERIM SURVEY (QDM TRIAL) QUESTIONNAIRE‐
The following two pages is a sample of the ballot sheet from Round 1 that was given to
respondents who used the Informal Confidential Voting Instrument (ICVI). Trained interviewers
read out the questions and the respondent marked their answers on the sheet. At the conclusion,
the respondent folded the sheet and placed it in a locked ballot box.
These versions are in English – respondents’ copies were in Shona.
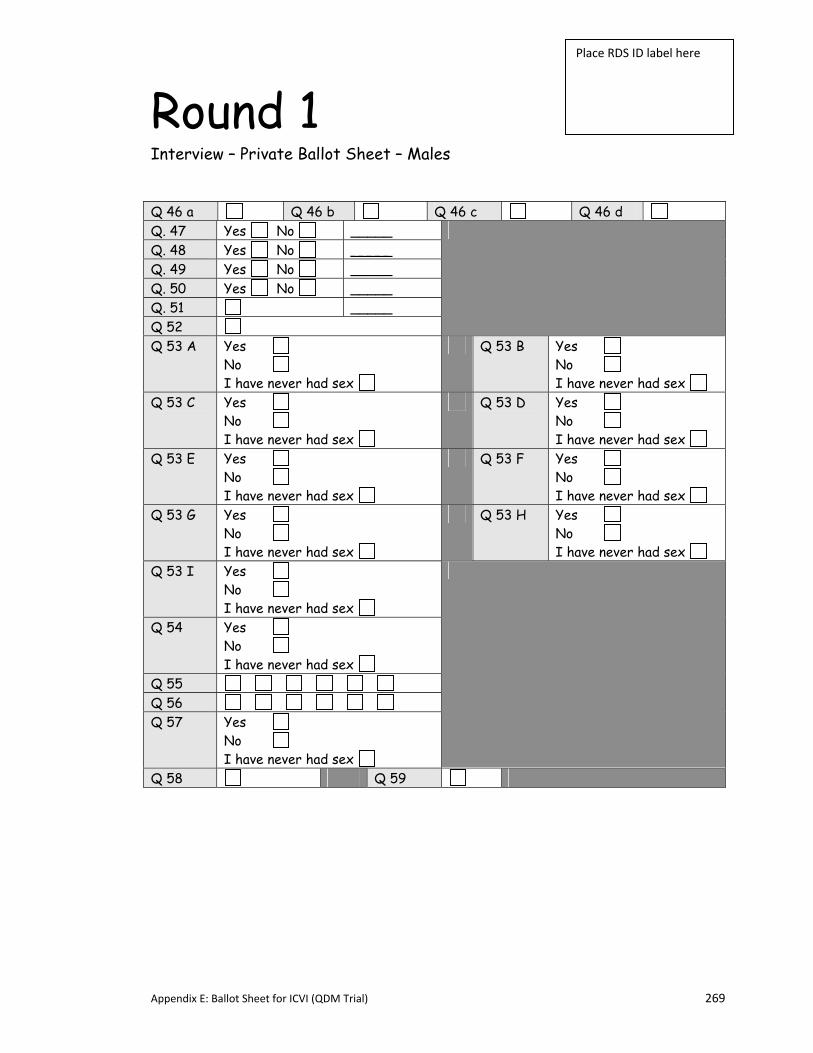
Appendix E: Ballot Sheet for ICVI (QDM Trial) 269
Round 1 Interview – Private Ballot Sheet – Males Q 46 a Q 46 b Q 46 c Q 46 d Q. 47 Yes No _____ Q. 48 Yes No _____ Q. 49 Yes No _____ Q. 50 Yes No _____ Q. 51 _____ Q 52
Q 53 A Yes No I have never had sex
Q 53 B Yes No I have never had sex
Q 53 C Yes No I have never had sex
Q 53 D Yes No I have never had sex
Q 53 E Yes No I have never had sex
Q 53 F Yes No I have never had sex
Q 53 G Yes No I have never had sex
Q 53 H Yes No I have never had sex
Q 53 I Yes No I have never had sex
Q 54 Yes No I have never had sex
Q 55 Q 56 Q 57 Yes
No I have never had sex
Q 58 Q 59
Place RDS ID label here
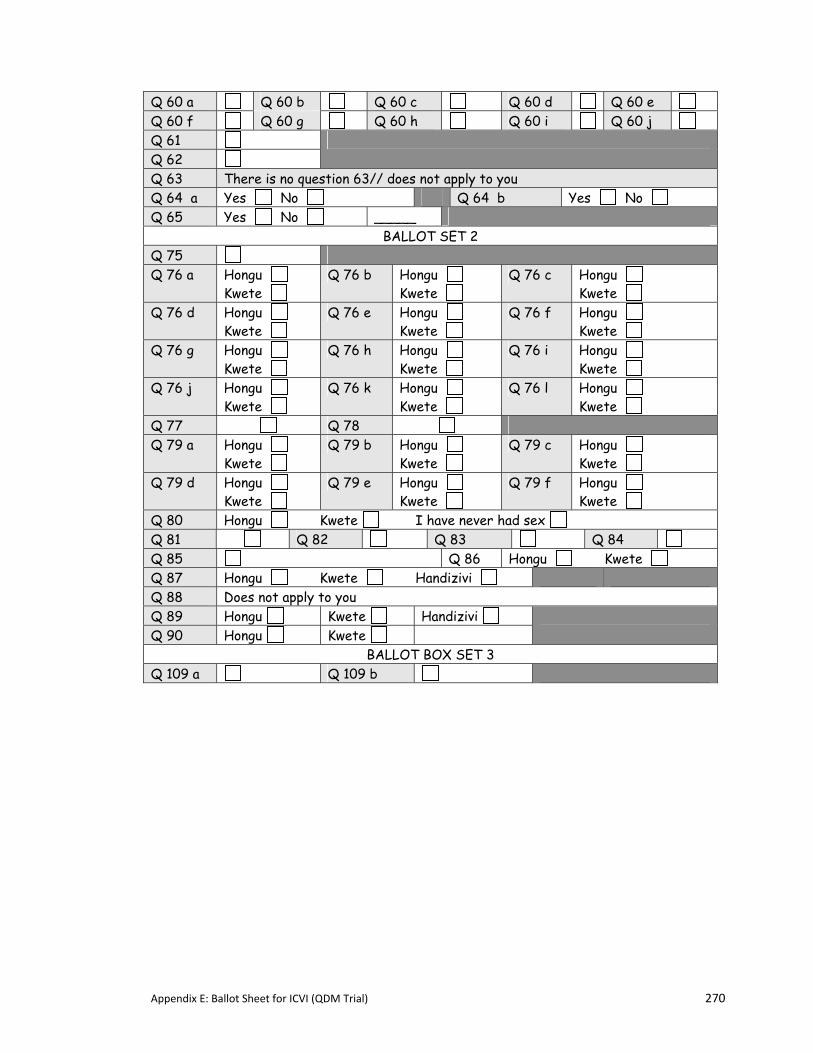
Appendix E: Ballot Sheet for ICVI (QDM Trial) 270
Q 60 a Q 60 b Q 60 c Q 60 d Q 60 e Q 60 f Q 60 g Q 60 h Q 60 i Q 60 j Q 61 Q 62
Q 63 There is no question 63// does not apply to you Q 64 a Yes No Q 64 b Yes No Q 65 Yes No _____
BALLOT SET 2 Q 75 Q 76 a Hongu
Kwete Q 76 b Hongu
Kwete Q 76 c Hongu
Kwete Q 76 d Hongu
Kwete Q 76 e Hongu
Kwete Q 76 f Hongu
Kwete Q 76 g Hongu
Kwete Q 76 h Hongu
Kwete Q 76 i Hongu
Kwete Q 76 j Hongu
Kwete Q 76 k Hongu
Kwete Q 76 l Hongu
Kwete Q 77 Q 78 Q 79 a Hongu
Kwete Q 79 b Hongu
Kwete Q 79 c Hongu
Kwete Q 79 d Hongu
Kwete Q 79 e Hongu
Kwete Q 79 f Hongu
Kwete Q 80 Hongu Kwete I have never had sex Q 81 Q 82 Q 83 Q 84 Q 85 Q 86 Hongu Kwete Q 87 Hongu Kwete Handizivi Q 88 Does not apply to you Q 89 Hongu Kwete Handizivi Q 90 Hongu Kwete
BALLOT BOX SET 3 Q 109 a Q 109 b
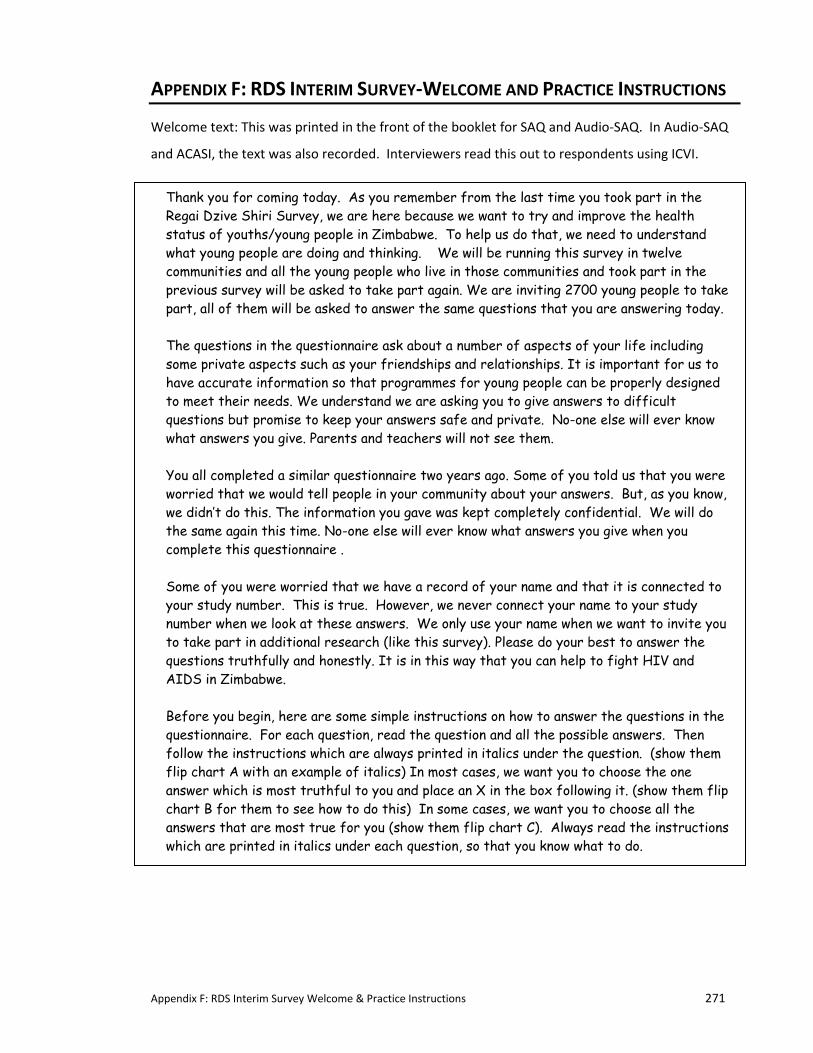
Appendix F: RDS Interim Survey Welcome & Practice Instructions 271
APPENDIX F: RDS INTERIM SURVEY‐WELCOME AND PRACTICE INSTRUCTIONS
Welcome text: This was printed in the front of the booklet for SAQ and Audio‐SAQ. In Audio‐SAQ
and ACASI, the text was also recorded. Interviewers read this out to respondents using ICVI.
Thank you for coming today. As you remember from the last time you took part in the Regai Dzive Shiri Survey, we are here because we want to try and improve the health status of youths/young people in Zimbabwe. To help us do that, we need to understand what young people are doing and thinking. We will be running this survey in twelve communities and all the young people who live in those communities and took part in the previous survey will be asked to take part again. We are inviting 2700 young people to take part, all of them will be asked to answer the same questions that you are answering today. The questions in the questionnaire ask about a number of aspects of your life including some private aspects such as your friendships and relationships. It is important for us to have accurate information so that programmes for young people can be properly designed to meet their needs. We understand we are asking you to give answers to difficult questions but promise to keep your answers safe and private. No-one else will ever know what answers you give. Parents and teachers will not see them. You all completed a similar questionnaire two years ago. Some of you told us that you were worried that we would tell people in your community about your answers. But, as you know, we didn’t do this. The information you gave was kept completely confidential. We will do the same again this time. No-one else will ever know what answers you give when you complete this questionnaire . Some of you were worried that we have a record of your name and that it is connected to your study number. This is true. However, we never connect your name to your study number when we look at these answers. We only use your name when we want to invite you to take part in additional research (like this survey). Please do your best to answer the questions truthfully and honestly. It is in this way that you can help to fight HIV and AIDS in Zimbabwe. Before you begin, here are some simple instructions on how to answer the questions in the questionnaire. For each question, read the question and all the possible answers. Then follow the instructions which are always printed in italics under the question. (show them flip chart A with an example of italics) In most cases, we want you to choose the one answer which is most truthful to you and place an X in the box following it. (show them flip chart B for them to see how to do this) In some cases, we want you to choose all the answers that are most true for you (show them flip chart C). Always read the instructions which are printed in italics under each question, so that you know what to do.
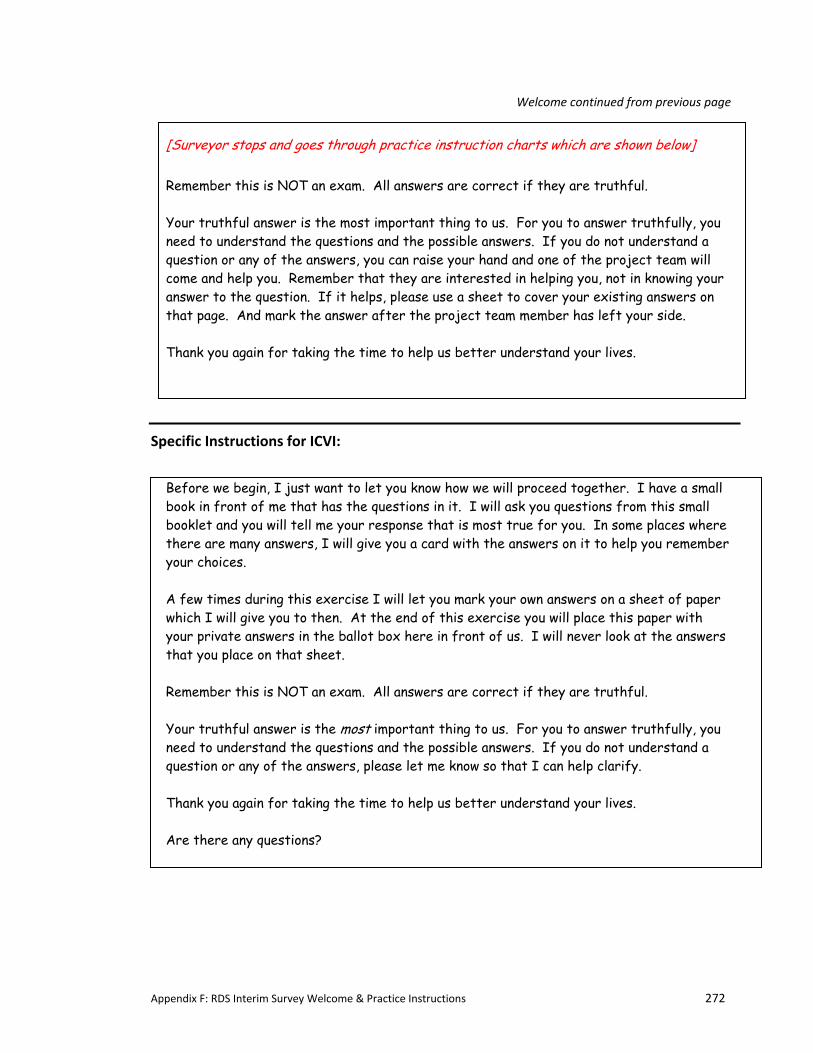
Appendix F: RDS Interim Survey Welcome & Practice Instructions 272
Welcome continued from previous page
[Surveyor stops and goes through practice instruction charts which are shown below] Remember this is NOT an exam. All answers are correct if they are truthful. Your truthful answer is the most important thing to us. For you to answer truthfully, you need to understand the questions and the possible answers. If you do not understand a question or any of the answers, you can raise your hand and one of the project team will come and help you. Remember that they are interested in helping you, not in knowing your answer to the question. If it helps, please use a sheet to cover your existing answers on that page. And mark the answer after the project team member has left your side. Thank you again for taking the time to help us better understand your lives.
Specific Instructions for ICVI:
Before we begin, I just want to let you know how we will proceed together. I have a small book in front of me that has the questions in it. I will ask you questions from this small booklet and you will tell me your response that is most true for you. In some places where there are many answers, I will give you a card with the answers on it to help you remember your choices. A few times during this exercise I will let you mark your own answers on a sheet of paper which I will give you to then. At the end of this exercise you will place this paper with your private answers in the ballot box here in front of us. I will never look at the answers that you place on that sheet. Remember this is NOT an exam. All answers are correct if they are truthful. Your truthful answer is the most important thing to us. For you to answer truthfully, you need to understand the questions and the possible answers. If you do not understand a question or any of the answers, please let me know so that I can help clarify. Thank you again for taking the time to help us better understand your lives. Are there any questions?
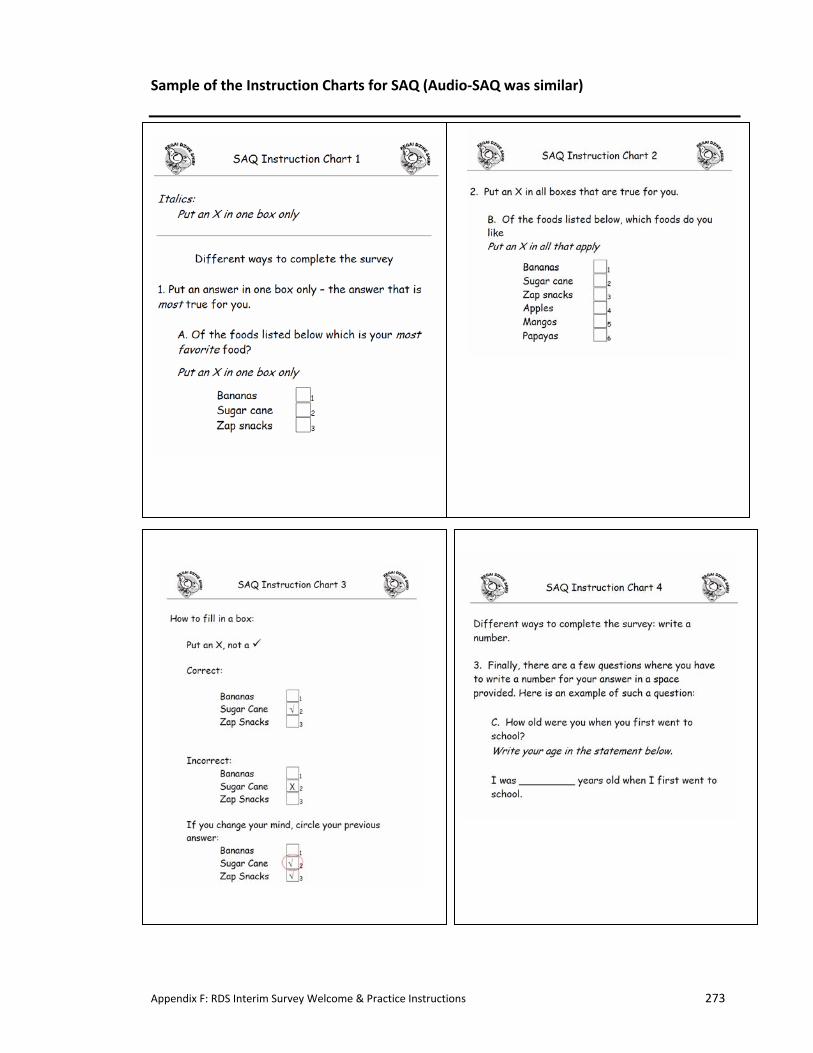
Appendix F: RDS Interim Survey Welcome & Practice Instructions 273
Sample of the Instruction Charts for SAQ (Audio‐SAQ was similar)
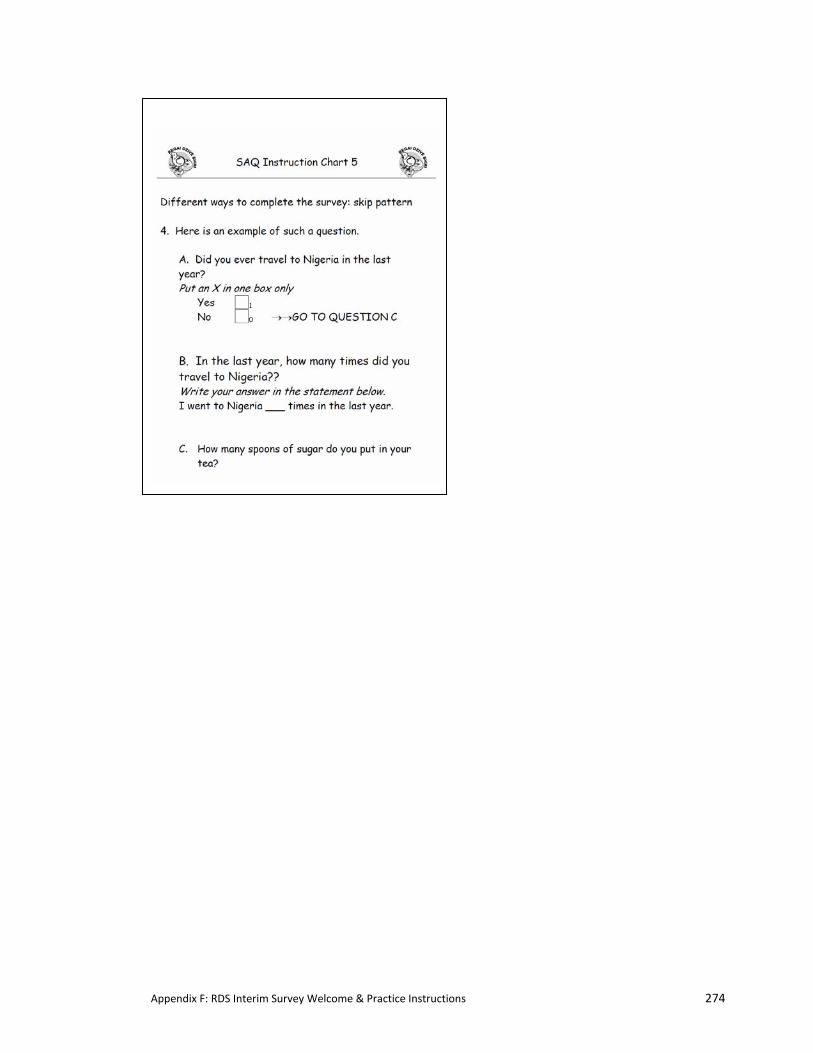
Appendix F: RDS Interim Survey Welcome & Practice Instructions 274
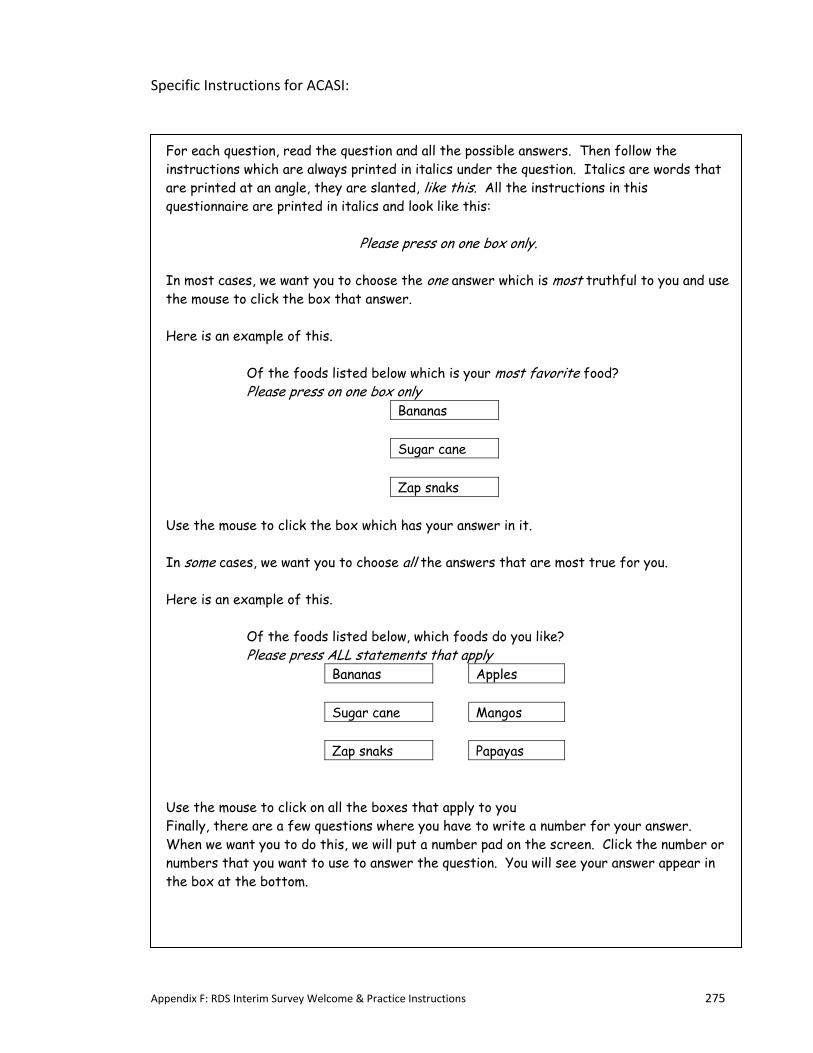
Appendix F: RDS Interim Survey Welcome & Practice Instructions 275
Specific Instructions for ACASI:
For each question, read the question and all the possible answers. Then follow the instructions which are always printed in italics under the question. Italics are words that are printed at an angle, they are slanted, like this. All the instructions in this questionnaire are printed in italics and look like this:
Please press on one box only. In most cases, we want you to choose the one answer which is most truthful to you and use the mouse to click the box that answer. Here is an example of this.
Of the foods listed below which is your most favorite food? Please press on one box only
Bananas Sugar cane Zap snaks
Use the mouse to click the box which has your answer in it. In some cases, we want you to choose all the answers that are most true for you. Here is an example of this.
Of the foods listed below, which foods do you like? Please press ALL statements that apply
Bananas Apples Sugar cane Mangos Zap snaks Papayas
Use the mouse to click on all the boxes that apply to you Finally, there are a few questions where you have to write a number for your answer. When we want you to do this, we will put a number pad on the screen. Click the number or numbers that you want to use to answer the question. You will see your answer appear in the box at the bottom.
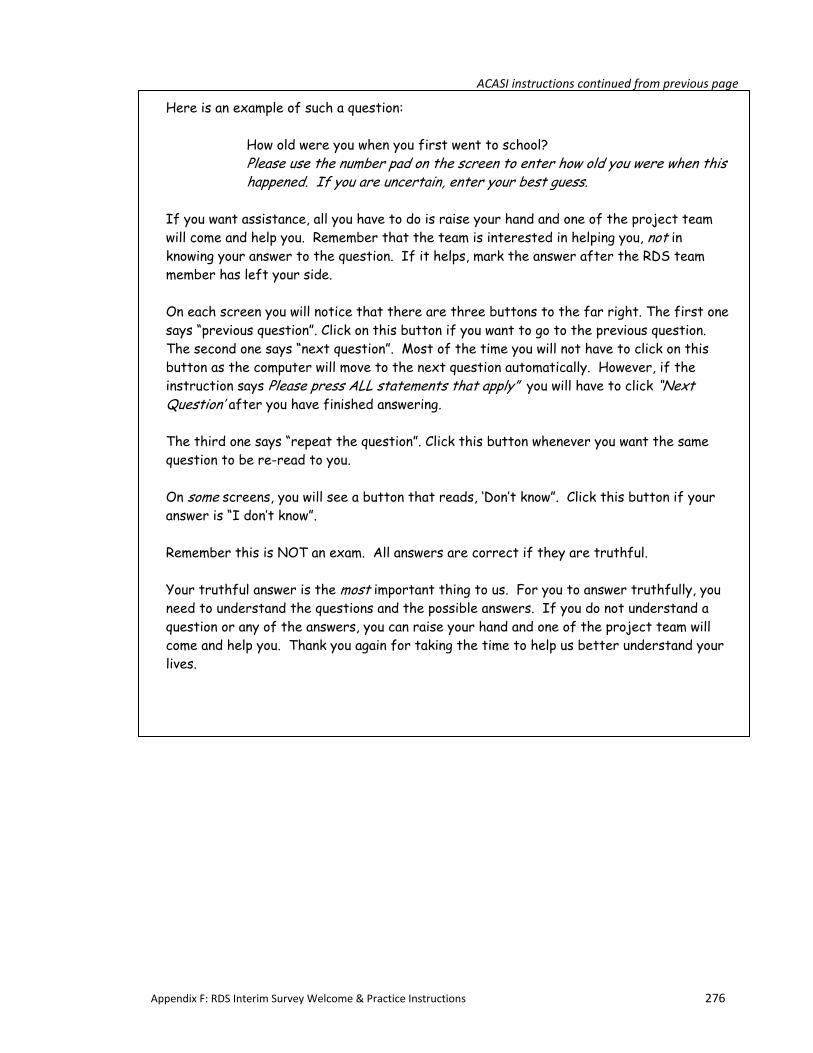
Appendix F: RDS Interim Survey Welcome & Practice Instructions 276
ACASI instructions continued from previous page
Here is an example of such a question:
How old were you when you first went to school? Please use the number pad on the screen to enter how old you were when this happened. If you are uncertain, enter your best guess.
If you want assistance, all you have to do is raise your hand and one of the project team will come and help you. Remember that the team is interested in helping you, not in knowing your answer to the question. If it helps, mark the answer after the RDS team member has left your side. On each screen you will notice that there are three buttons to the far right. The first one says “previous question”. Click on this button if you want to go to the previous question. The second one says “next question”. Most of the time you will not have to click on this button as the computer will move to the next question automatically. However, if the instruction says Please press ALL statements that apply” you will have to click “Next Question’ after you have finished answering. The third one says “repeat the question”. Click this button whenever you want the same question to be re-read to you. On some screens, you will see a button that reads, ‘Don’t know”. Click this button if your answer is “I don’t know”. Remember this is NOT an exam. All answers are correct if they are truthful. Your truthful answer is the most important thing to us. For you to answer truthfully, you need to understand the questions and the possible answers. If you do not understand a question or any of the answers, you can raise your hand and one of the project team will come and help you. Thank you again for taking the time to help us better understand your lives.
Appendix G: RDS Sample Invitation Letter (QDM Trial) 277
APPENDIX G: SAMPLE INVITATION LETTER TO RDS INTERIM SURVEY PARTICIPANTS
This is a sample of the personalized invitation letter sent to each member of the cohort in the
12 communities that participated in the RDS Interim Survey.
The second page is a sample of what appeared on the back of the letter, indicating survey
dates and locations within each community.
Appendix G: RDS Sample Invitation Letter (QDM Trial) 278
FIRSTNAME LASTNAME VILLAGENAME DISTRICT Dear FIRSTNAME LASTNAME,
COME JOIN US FOR A DAY OF LEARNING AND FUN! We are inviting you to come and participate in a fun day of learning with the Regai Dzive Shiri interim survey team which will be happening in your community week of 3 April 2006. This is a follow-up to the survey that you took part in at the beginning of 2003. In addition to participating in the survey, you will have a chance to meet your friends, play games and win prizes. The exact date of the survey will be advertised in your community two weeks before our arrival so look for posters in your community closer to the month of April 2006. RDS community members listed below will also know more specific information about the survey. On the day of the survey, please remember to bring with you some legal form of identification. This could be any of the following:
• your national ID card, • your original birth certificate, or • a certified copy of your birth certificate or national ID card.
Also, don’t forget to bring along this invitation letter as you will have a chance to win a prize.
We look forward to seeing you very soon.
Many thanks,
Lisa Langhaug – Amai Gomo Guru. RDS Evaluation Manager RDS Community Members First name Last name RDS community position Village
Department of Community Medicine, University of Zimbabwe
University College London, London School of Hygiene & Tropical Medicine Zimbabwe-CDC AIDS Project
112 Second Street Mutare Tel: +263 (0)20 66276, Fax: +263 (0) 20 66276 Cellphone: 011 231 925
Appendix G: RDS Sample Invitation Letter (QDM Trial) 279
(What was on the back of e
ach letter)
Her
e ar
e th
e co
mm
unit
y ve
nues
we
are
goin
g to
vis
it a
s we
ll as
the
dat
es a
nd t
imes
of
the
visi
ts
Mon
day
3 A
pril
2006
9 a.
m. t
o 3
p.m
.
Mao
resa
Bus
ines
s Ce
ntre
Tu
esda
y 4
Apr
il 20
06
9
a.m
. to
3 p.
m.
M
ukam
ba C
linic
W
edne
sday
5 A
pril
2006
9
a.m
. to
3 p.
m.
Ch
ipun
za B
usin
ess
Cent
re
We
mea
n yo
ung
wom
en w
ho p
arti
cipa
ted
in t
he R
egai
Dzi
ve S
hiri
sur
vey
in 2
003.
You
ng
mot
hers
wit
h ba
bies
ple
ase
feel
fre
e to
com
e.
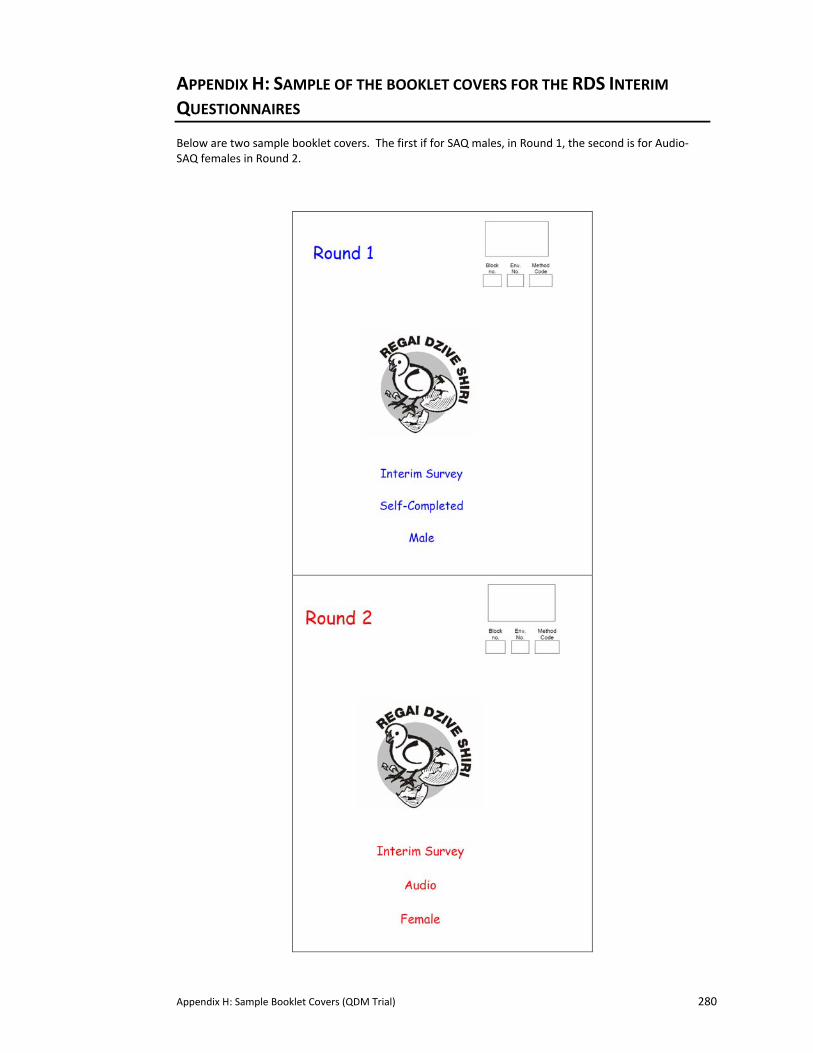
Appendix H: Sample Booklet Covers (QDM Trial) 280
APPENDIX H: SAMPLE OF THE BOOKLET COVERS FOR THE RDS INTERIM
QUESTIONNAIRES
Below are two sample booklet covers. The first if for SAQ males, in Round 1, the second is for Audio‐SAQ females in Round 2.
Appendix I: RDS Interim Survey Information Sheet & Consent Form 281
APPENDIX I: RDS INTERIM SURVEY INFORMATION SHEET AND CONSENT FORM
The following documents are the information sheet and consent form used during the Interim
Survey (QDM Trial).
These version are in English; respondents received these in Shona.
1. Information Sheet (2 pages)
2. Consent form (1 page)
Appendix I: RDS Interim Survey Information Sheet & Consent Form 282
P.O. Box A 178 Avondale DEPARTMENT OF Harare, Zimbabwe COMMUNITY MEDICINE Telephone : 791631 Telex : 26580 UNIVZ ZW Telegrams : UNIVERSITY Fax No: (263) (4) 724912
FACULTY OF MEDICINE UNIVERSITY OF ZIMBABWE
Researcher: Dr. Godfrey Woelk CONFIDENTIAL Information sheet Regai Dzive Shiri - a study for improving adolescent reproductive health in Zimbabwe We are carrying out a health research study in in 30 communities in Zimbabwe. The study is examining whether programmes which are designed to help young people learn about health and reproduction actually reduce their risk of developing sexually transmitted diseases and HIV. In 2003 you and your parents/guardian agreed for you to take part.As we are about to conduct the middle survey we would like to invite you to consent again to taking part in our study. 1. Questions What does the research involve? You are being asked to fill in several questionnaires over a four year period
(2003-2007). These questionnaires will ask you questions about you, what you know about reproductive health, how HIV and STDs are spread and your life experiences.
2. Finger prick blood specimen We will also ask you to give us a small specimen of blood, which will be
collected by pricking your finger. This small specimen of blood will be collected onto special absorbent paper. We would need to collect these specimens on 3 occasions, when the study starts and after 30 months and again after 4 years. The specimen will not be marked with your name or other identifying information. We would like to test this specimen confidentially for antibodies to HIV and herpes virus in order to understand the overall level of infection in the community. We will not be able to give you or your parents or anyone else in your community your results of these tests because YOUR name will not be on the specimen. If at any time you would like to have an HIV test and want to get the result, you can arrange to get one at your local health clinic through our project nurse.
Appendix I: RDS Interim Survey Information Sheet & Consent Form 283
3. Urine Specimens (for girls only) We will also ask you to provide a small specimen of urine, when the study starts
and after 30 months and again after 4 years. The specimen will not be marked with your name or other identifying information. We would like to test this specimen confidentially for pregnancy in order to understand the overall level of pregnancy in young people in the community. We will not be able to give you, your parents, or anyone else in your community, the results of this test because YOUR name will not be on the specimen.
Confidentiality Because we need to be able to collect information from you over a four year period we have had to collect your name, date of birth, and information about how best to reach you over that time. However, this information is kept completely confidentially. Only specified members of the research team have access to the information collected using the questionnaires and blood and urine samples. The information will not be available to anyone outside the research team. Importantly no members of the community will have access to any information on the questionnaires or to the results of your blood sample or urine tests. The information collected by questionnaire and the laboratory results will be stored on computer but without any information that could identify an individual. The information collected by this study will be kept securely for 10 years after the study has been completed. The information will be used to see if reproductive health education can improve the reproductive health of young Zimbabweans. We are glad you agreed to take part in this study in 2003 and hope you will agree to continue taking part in the study. We hope this will help us to improve the health of all young people in Zimbabwe. If you agree to do so please sign the form on the other side. You do not have to continue to take part in this study if you do not want to. If you decide to take part but then change your mind you may withdraw at any time without having to give a reason. Your decision whether to take part or not will not affect your schooling or health care in any way. If you do not wish to take part please sign the form on the other side. An ethics committee reviews all proposals for research using human subjects before they can proceed. The Medical Research Council of Zimbabwe, the Joint UCL/UCLH Committees on Ethics of Human Research and the Ethics Committee of the London School of Hygiene and Tropical Medicine reviewed this proposal. If you have any questions or want to know any more about the research please contact Dr Frances Cowan at University of Zimbabwe (Tel number:263 (0)20 66276)
Appendix I: RDS Interim Survey Information Sheet & Consent Form 284
P.O. Box A 178 Avondale DEPARTMENT OF Harare, Zimbabwe COMMUNITY MEDICINE Telephone : 791631 Telex : 26580 UNIVZ ZW Telegrams : UNIVERSITY Fax No: (263) (4) 724912
FACULTY OF MEDICINE UNIVERSITY OF ZIMBABWE
Researcher: Dr. Godfrey Woelk
CONFIDENTIAL School ID: Consent form - STUDENT Regai Dzive Shiri - a study for improving adolescent reproductive health in Zimbabwe
Have you read the information sheet about this study? Yes No Have you had an opportunity to ask questions and discuss this study? Yes No Have you received satisfactory answers to all your questions? Yes No Have you received enough information about this study? Yes No Do you understand that you are free to withdraw from this study: Yes No * At any time * Without giving a reason for withdrawing * Without affecting your future medical care Do you agree to take part in this study? Yes No I agree / disagree to take part in the questionnaire survey and to provide a finger prick blood sample (and urine sample - girls only) specimen. Signature: ..........................................................................…………………...
Signature RDS Cohort Member Print Name: ………………………………………………………….…………………..
Name of RDS Cohort Member Witness : ………………………………………… Print: …………………………………….. Signature of RDS Staff member Name of RDS Staff member Date: …………… / ……………/ 2006
Place ID label here
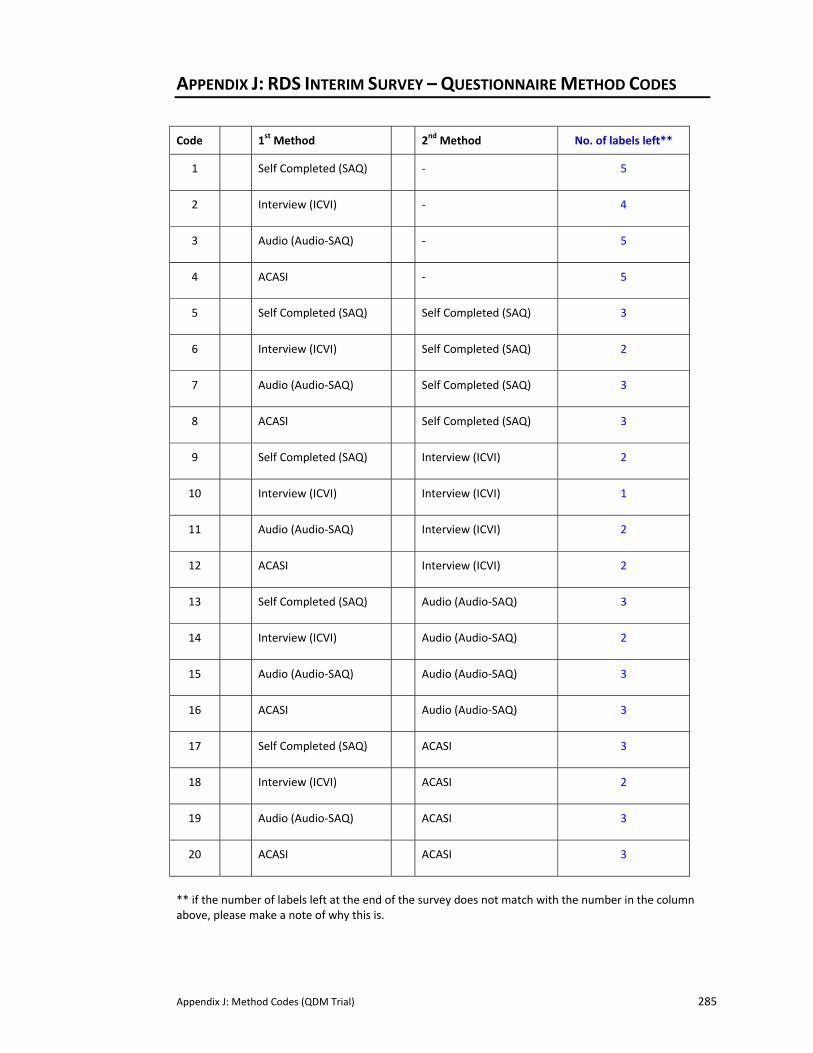
Appendix J: Method Codes (QDM Trial) 285
APPENDIX J: RDS INTERIM SURVEY – QUESTIONNAIRE METHOD CODES
Code 1st Method 2nd Method No. of labels left**
1 Self Completed (SAQ) ‐ 5
2 Interview (ICVI) ‐ 4
3 Audio (Audio‐SAQ) ‐ 5
4 ACASI ‐ 5
5 Self Completed (SAQ) Self Completed (SAQ) 3
6 Interview (ICVI) Self Completed (SAQ) 2
7 Audio (Audio‐SAQ) Self Completed (SAQ) 3
8 ACASI Self Completed (SAQ) 3
9 Self Completed (SAQ) Interview (ICVI) 2
10 Interview (ICVI) Interview (ICVI) 1
11 Audio (Audio‐SAQ) Interview (ICVI) 2
12 ACASI Interview (ICVI) 2
13 Self Completed (SAQ) Audio (Audio‐SAQ) 3
14 Interview (ICVI) Audio (Audio‐SAQ) 2
15 Audio (Audio‐SAQ) Audio (Audio‐SAQ) 3
16 ACASI Audio (Audio‐SAQ) 3
17 Self Completed (SAQ) ACASI 3
18 Interview (ICVI) ACASI 2
19 Audio (Audio‐SAQ) ACASI 3
20 ACASI ACASI 3
** if the number of labels left at the end of the survey does not match with the number in the column above, please make a note of why this is.
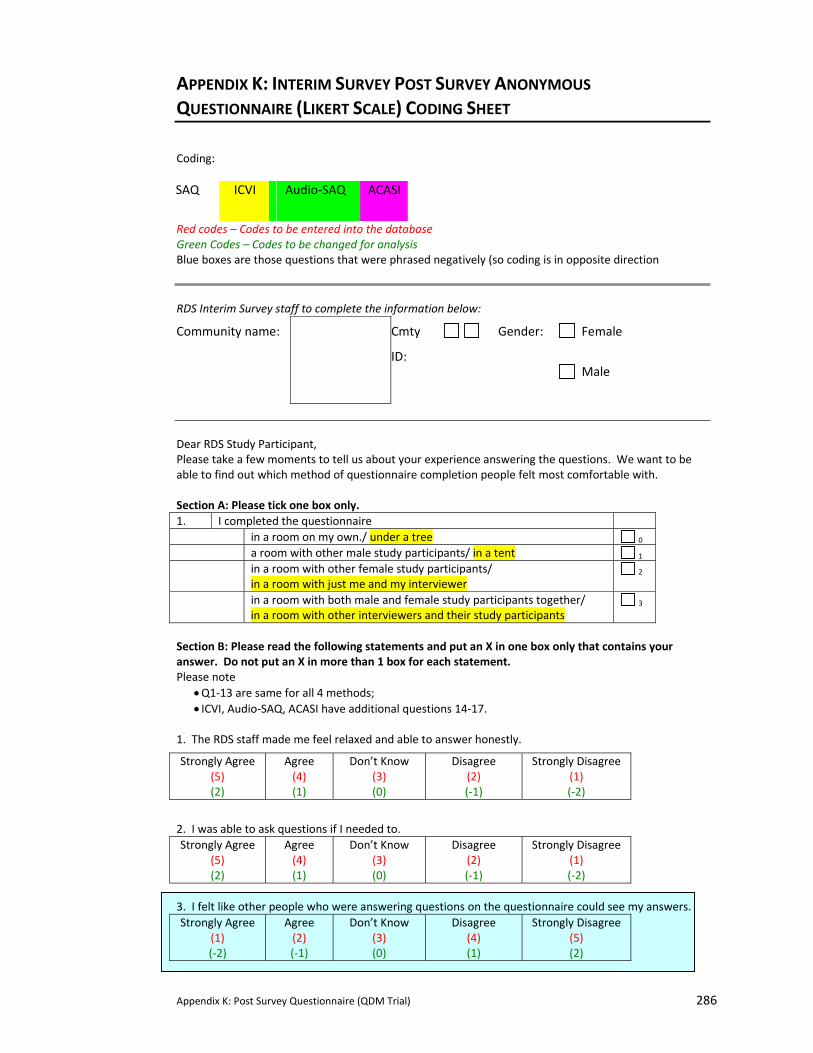
Appendix K: Post Survey Questionnaire (QDM Trial) 286
APPENDIX K: INTERIM SURVEY POST SURVEY ANONYMOUS
QUESTIONNAIRE (LIKERT SCALE) CODING SHEET
Coding: SAQ ICVI Audio‐SAQ ACASI
Red codes – Codes to be entered into the database Green Codes – Codes to be changed for analysis Blue boxes are those questions that were phrased negatively (so coding is in opposite direction
RDS Interim Survey staff to complete the information below:
Community name: Cmty
ID:
Gender: Female
Male
Dear RDS Study Participant, Please take a few moments to tell us about your experience answering the questions. We want to be able to find out which method of questionnaire completion people felt most comfortable with. Section A: Please tick one box only. 1. I completed the questionnaire in a room on my own./ under a tree 0 a room with other male study participants/ in a tent 1 in a room with other female study participants/
in a room with just me and my interviewer 2
in a room with both male and female study participants together/ in a room with other interviewers and their study participants
3
Section B: Please read the following statements and put an X in one box only that contains your answer. Do not put an X in more than 1 box for each statement. Please note
• Q1‐13 are same for all 4 methods; • ICVI, Audio‐SAQ, ACASI have additional questions 14‐17.
1. The RDS staff made me feel relaxed and able to answer honestly.
Strongly Agree (5) (2)
Agree (4) (1)
Don’t Know (3) (0)
Disagree (2) (‐1)
Strongly Disagree (1) (‐2)
2. I was able to ask questions if I needed to. Strongly Agree
(5) (2)
Agree (4) (1)
Don’t Know (3) (0)
Disagree (2) (‐1)
Strongly Disagree (1) (‐2)
3. I felt like other people who were answering questions on the questionnaire could see my answers.
Strongly Agree (1) (‐2)
Agree (2) (‐1)
Don’t Know (3) (0)
Disagree (4) (1)
Strongly Disagree (5) (2)
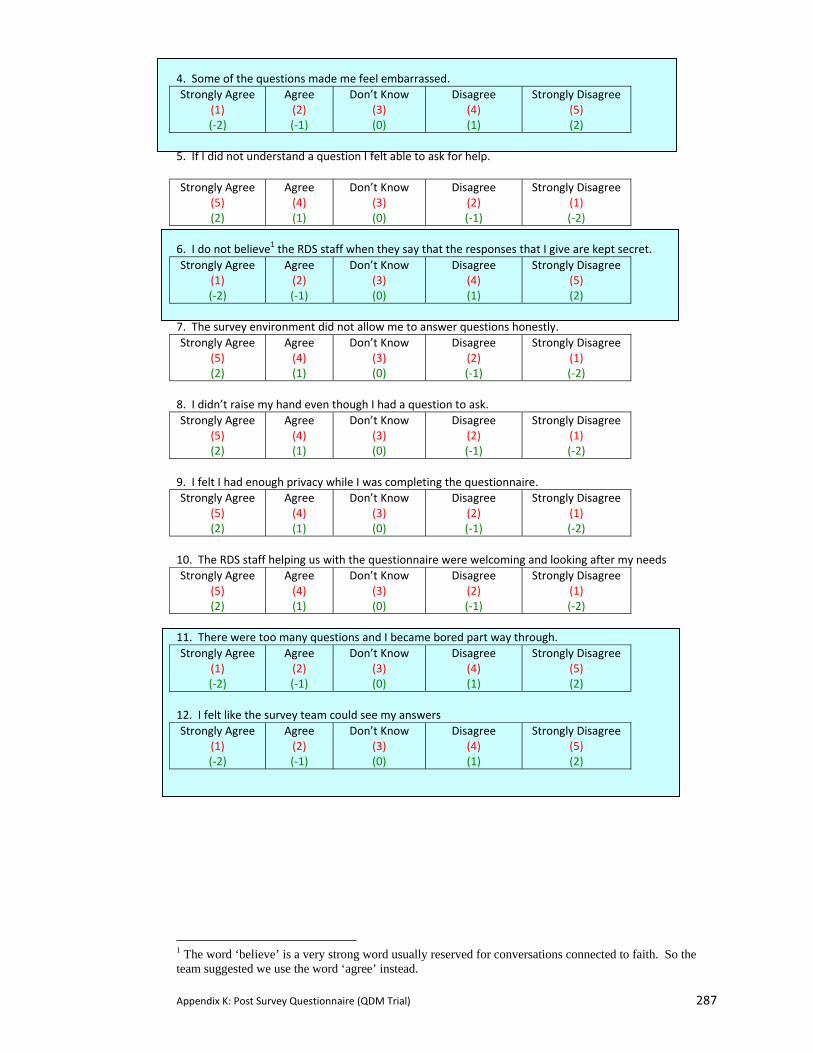
Appendix K: Post Survey Questionnaire (QDM Trial) 287
4. Some of the questions made me feel embarrassed. Strongly Agree
(1) (‐2)
Agree (2) (‐1)
Don’t Know (3) (0)
Disagree (4) (1)
Strongly Disagree (5) (2)
5. If I did not understand a question I felt able to ask for help. Strongly Agree
(5) (2)
Agree (4) (1)
Don’t Know (3) (0)
Disagree (2) (‐1)
Strongly Disagree (1) (‐2)
6. I do not believe1 the RDS staff when they say that the responses that I give are kept secret.
7. The survey environment did not allow me to answer questions honestly. Strongly Agree
(5) (2)
Agree (4) (1)
Don’t Know (3) (0)
Disagree (2) (‐1)
Strongly Disagree (1) (‐2)
8. I didn’t raise my hand even though I had a question to ask. Strongly Agree
(5) (2)
Agree (4) (1)
Don’t Know (3) (0)
Disagree (2) (‐1)
Strongly Disagree (1) (‐2)
9. I felt I had enough privacy while I was completing the questionnaire. Strongly Agree
(5) (2)
Agree (4) (1)
Don’t Know (3) (0)
Disagree (2) (‐1)
Strongly Disagree (1) (‐2)
10. The RDS staff helping us with the questionnaire were welcoming and looking after my needs Strongly Agree
(5) (2)
Agree (4) (1)
Don’t Know (3) (0)
Disagree (2) (‐1)
Strongly Disagree (1) (‐2)
11. There were too many questions and I became bored part way through. Strongly Agree
(1) (‐2)
Agree (2) (‐1)
Don’t Know (3) (0)
Disagree (4) (1)
Strongly Disagree (5) (2)
12. I felt like the survey team could see my answers Strongly Agree
(1) (‐2)
Agree (2) (‐1)
Don’t Know (3) (0)
Disagree (4) (1)
Strongly Disagree (5) (2)
1 The word ‘believe’ is a very strong word usually reserved for conversations connected to faith. So the team suggested we use the word ‘agree’ instead.
Strongly Agree (1) (‐2)
Agree (2) (‐1)
Don’t Know (3) (0)
Disagree (4) (1)
Strongly Disagree (5) (2)
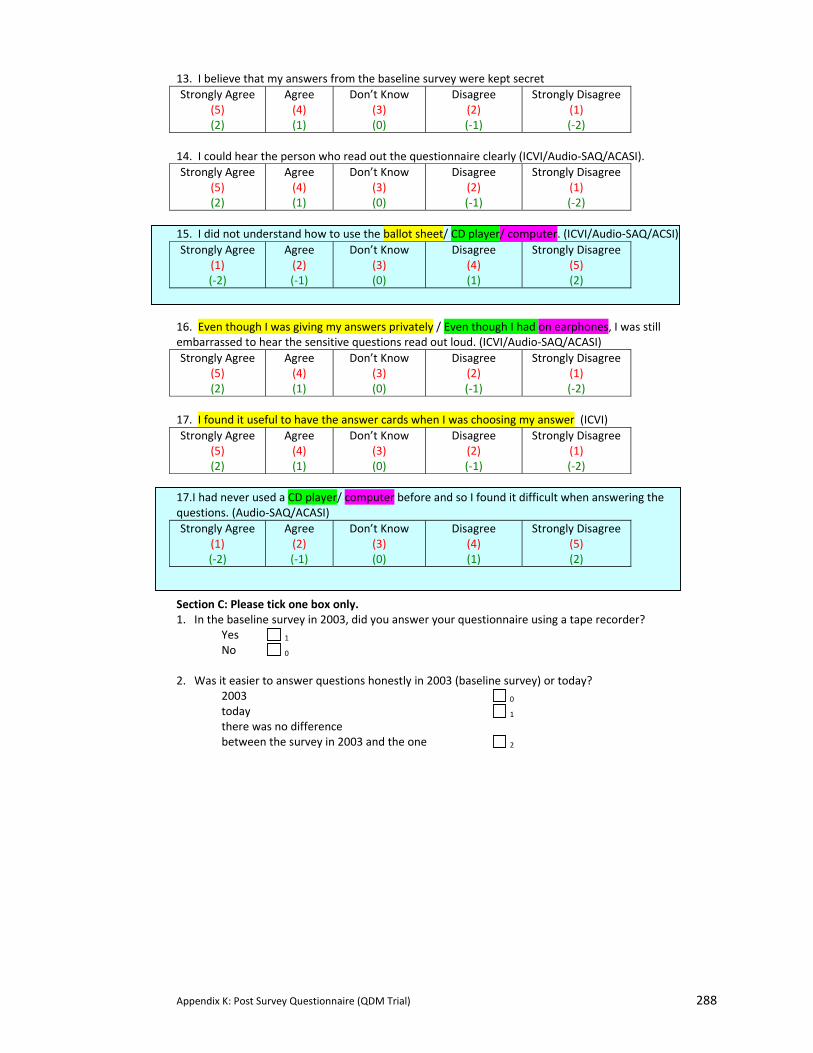
Appendix K: Post Survey Questionnaire (QDM Trial) 288
13. I believe that my answers from the baseline survey were kept secret Strongly Agree
(5) (2)
Agree (4) (1)
Don’t Know (3) (0)
Disagree (2) (‐1)
Strongly Disagree (1) (‐2)
14. I could hear the person who read out the questionnaire clearly (ICVI/Audio‐SAQ/ACASI). Strongly Agree
(5) (2)
Agree (4) (1)
Don’t Know (3) (0)
Disagree (2) (‐1)
Strongly Disagree (1) (‐2)
15. I did not understand how to use the ballot sheet/ CD player/ computer. (ICVI/Audio‐SAQ/ACSI)
16. Even though I was giving my answers privately / Even though I had on earphones, I was still embarrassed to hear the sensitive questions read out loud. (ICVI/Audio‐SAQ/ACASI) Strongly Agree
(5) (2)
Agree (4) (1)
Don’t Know (3) (0)
Disagree (2) (‐1)
Strongly Disagree (1) (‐2)
17. I found it useful to have the answer cards when I was choosing my answer (ICVI) Strongly Agree
(5) (2)
Agree (4) (1)
Don’t Know (3) (0)
Disagree (2) (‐1)
Strongly Disagree (1) (‐2)
17.I had never used a CD player/ computer before and so I found it difficult when answering the questions. (Audio‐SAQ/ACASI)
Section C: Please tick one box only. 1. In the baseline survey in 2003, did you answer your questionnaire using a tape recorder? Yes 1
No 0 2. Was it easier to answer questions honestly in 2003 (baseline survey) or today? 2003 0
today 1 there was no difference between the survey in 2003 and the one 2
Strongly Agree (1) (‐2)
Agree (2) (‐1)
Don’t Know (3) (0)
Disagree (4) (1)
Strongly Disagree (5) (2)
Strongly Agree (1) (‐2)
Agree (2) (‐1)
Don’t Know (3) (0)
Disagree (4) (1)
Strongly Disagree (5) (2)
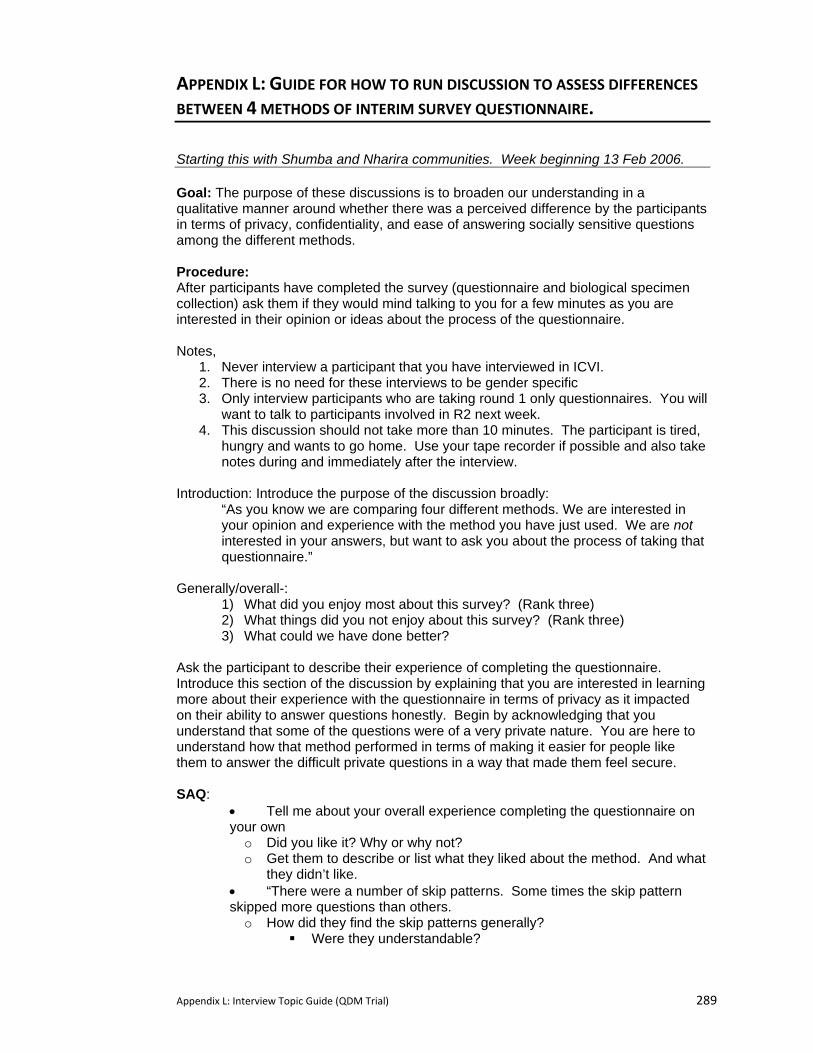
Appendix L: Interview Topic Guide (QDM Trial) 289
APPENDIX L: GUIDE FOR HOW TO RUN DISCUSSION TO ASSESS DIFFERENCES
BETWEEN 4 METHODS OF INTERIM SURVEY QUESTIONNAIRE.
Starting this with Shumba and Nharira communities. Week beginning 13 Feb 2006. Goal: The purpose of these discussions is to broaden our understanding in a qualitative manner around whether there was a perceived difference by the participants in terms of privacy, confidentiality, and ease of answering socially sensitive questions among the different methods. Procedure: After participants have completed the survey (questionnaire and biological specimen collection) ask them if they would mind talking to you for a few minutes as you are interested in their opinion or ideas about the process of the questionnaire. Notes,
1. Never interview a participant that you have interviewed in ICVI. 2. There is no need for these interviews to be gender specific 3. Only interview participants who are taking round 1 only questionnaires. You will
want to talk to participants involved in R2 next week. 4. This discussion should not take more than 10 minutes. The participant is tired,
hungry and wants to go home. Use your tape recorder if possible and also take notes during and immediately after the interview.
Introduction: Introduce the purpose of the discussion broadly:
“As you know we are comparing four different methods. We are interested in your opinion and experience with the method you have just used. We are not interested in your answers, but want to ask you about the process of taking that questionnaire.”
Generally/overall-:
1) What did you enjoy most about this survey? (Rank three) 2) What things did you not enjoy about this survey? (Rank three) 3) What could we have done better?
Ask the participant to describe their experience of completing the questionnaire. Introduce this section of the discussion by explaining that you are interested in learning more about their experience with the questionnaire in terms of privacy as it impacted on their ability to answer questions honestly. Begin by acknowledging that you understand that some of the questions were of a very private nature. You are here to understand how that method performed in terms of making it easier for people like them to answer the difficult private questions in a way that made them feel secure. SAQ:
• Tell me about your overall experience completing the questionnaire on your own o Did you like it? Why or why not? o Get them to describe or list what they liked about the method. And what
they didn’t like. • “There were a number of skip patterns. Some times the skip pattern skipped more questions than others. o How did they find the skip patterns generally?
Were they understandable?
Appendix L: Interview Topic Guide (QDM Trial) 290
Were they confused at any point on how far to go ahead with the skip? What did the SA do that was helpful in getting them to understand the different ways that questions could be answered (probe for use and comprehension of instructions)?
Now that they have gone through the questionnaire are there things that we could explain more clearly in terms of how to handle the skip patterns?
• Have them describe their seating pattern (what was salient to them should emerge from their description) o Did they feel they could answer the questions privately? o Did the seating arrangement that we created give them enough privacy?
How so (or not?) o When they were taking the questionnaire did they feel that they had
privacy? The whole time? And if yes, what made them feel private? If no, what was it that made them feel it wasn’t private.
• What other aspects helped them to feel they were answering questions in a private setting? What made them feel that way? o If they can list other items that helped them feel that they were able to
give information in private, see if they can rank them (which was the most important to them, etc)
• Do they think there are some questions that might be difficult for some people to understand? If so, find out which ones and why? • What did they do if they didn’t understand something (probe to see if they felt able to raise their hand and seek assistance from a survey assistant). • If someone had had sex do you think they would be able to tell us in this type of questionnaire? What makes them think they way they do? • Compare with baseline – see notes at the end.
Audio-SAQ: • Tell me about your overall experience using the CD player to complete the questionnaire. o Did you like it? Why or why not? o Get them to describe or list what they liked about the method. And what
they didn’t like. o “There were a number of skip patterns. Sometimes the skip pattern
skipped more questions than others.” How did they find the skip patterns generally? Were they understandable? Were they confused at any point on how far to go ahead with the
skip? What did the SA do that was helpful in getting them to
understand the different ways that questions could be answered (probe for use and comprehension of instructions)?
Now that they have gone through the questionnaire are there things that we could explain more clearly in terms of how to handle the skip patterns?
• Find out if they found the CD boring or too slow and what they did about this (did they just skip the tape and start completing it as an SAQ?). • Do they think there are some questions that might be difficult for some people to understand? If so, find out which ones and why? • What did they do if they didn’t understand something (probe to see if they felt able to raise their hand and seek assistance from a survey assistant). • Where did they listen to the questionnaire? (Can they describe their room? How many others were in the room, etc) Were their others around them? How did that impact on their writing down their answers privately.
Appendix L: Interview Topic Guide (QDM Trial) 291
• What other aspects helped them feel private? Did they feel that they could answer the questions in a private manner? What made them feel that way? • Were there things that the interim survey team did that made the space feel less private? Have them list other items that helped them feel that they were able to give information in private, see if they can rank them. • Are their other steps we could have taken to make it feel more private? • If someone had had sex do you think they would be able to tell us in this type of questionnaire? What makes them think the way they do? • Compare with baseline – see notes at the end.
ACASI:
• Tell me about your overall experience completing the questionnaire using the computer o Did you like it? Why or why not? o Get them to describe or list what they liked about the method. And what
they didn’t like. (probe re use of mouse, and voice, and screen, etc) • How did your practice session go before they started? Get them to describe it and comment on it. • How did it feel to answer the sensitive questions? Did using the computer help them feel they could answer the questions more privately? • Have them describe their seating arrangement. Did the seating arrangement that we created give them enough privacy? How so (or not?) • What other things helped them feel private? Did they feel that they could answer the questions in a private manner? What made them feel that way? o Were there things that we did that made the space less private?
• If they can list other items that helped them feel that they were able to give information in private, see if they can rank them. • Do they think there are some questions that might be difficult for some people to understand? If so, find out which ones and why? • What did they do if they didn’t understand something (probe to see if they felt able to raise their hand and seek assistance from a survey assistant). • If someone had had sex do you think they would be able to tell us in this type of questionnaire? What makes them think the way they do? • Compare with baseline – see notes at the end.
ICVI:
• Tell me about your overall experience completing the questionnaire using a face to face interview and the ballot box. Describe what you liked and didn’t like. Probe setting and level of comfort. • How was the ballot box introduced to you? Describe it and comment on it. • How did it feel to answer the sensitive questions using a private ballot sheet? Did it feel private enough? If yes, how? If no, why? What other things helped them feel private?// were there other things that helped them feel their answers were private? What made them feel that way? • Were there things that we did that made the space less private? • If they can list other items that helped them feel that they were able to give information in private, see if they can rank them. • Do they think there are some questions that might be difficult for some people to understand? If so, find out which ones and why? • How did they think the interviewer handled the sensitive questions. (did they giggle or stumble?) Were the questions asked of you in a way that made
Appendix L: Interview Topic Guide (QDM Trial) 292
you feel that all answers were okay? What did the survey assistant do to put you at ease? Can you think of other things they could have done to help you feel more at ease? • What did they do if they didn’t understand something (probe to see if they felt able to raise their hand and seek assistance from a survey assistant). • If someone had had sex do you think they would be able to tell us in this type of questionnaire? What makes them think the way they do? • Compare with baseline – see notes at the end.
Other questions • Do they think others using this method will answer sensitive questions honestly?
why or why not? // What makes them believe that? • Why do they think some people answer sensitive questions dishonestly? • Have them describe to you what they think will happen to the responses they gave
in their questionnaire. And what do they think about this/how did it influence them while they were answering questions. How do they think others will have answered the questionnaire if they believed like they did?
Comparison with baseline: • What do they remember about the baseline survey. If they were to compare these
two surveys, could they list what they like better now and what they appreciated about the baseline?
• After the baseline, many participants told us that they were worried that their
responses would be exposed to the community. Do they think that happened? o If yes, then ask them to tell you about that experience. o If no, how did that impact on their experience during the interim?
• Did they worry about their name being linked with their study number? How so? What exactly was their concern?
Round 2 • Target: to reach everyone who completes a Round 2 questionnaire. • Discussion not to exceed 15 minutes. • Trick is to get them to think beyond the time it took to complete round 1 versus
round 2 and to focus on the method itself. This may require you to acknowledge on several occasions that you realize that the second questionnaire was shorter.
1) ask them to describe both methods 2) ask them to compare both methods:
a) what did they like about each one b) what did they consider inconveniences or barriers about each one? c) Were there any questions that were easier to remember using one method over
another (remind them that you are not interested in how they answered their questionnaire, but in the process.)
d) compare ease of use (understanding skip patterns, comprehension of questions).
e) compare sense of privacy during questionnaire completion f) compare acceptability of the two methods: which method did they find most
acceptable to use? Get them to describe aspects of this. g) which method do they think makes it easiest to answer sensitive questions like
those about sexual activity? Why do they think this?
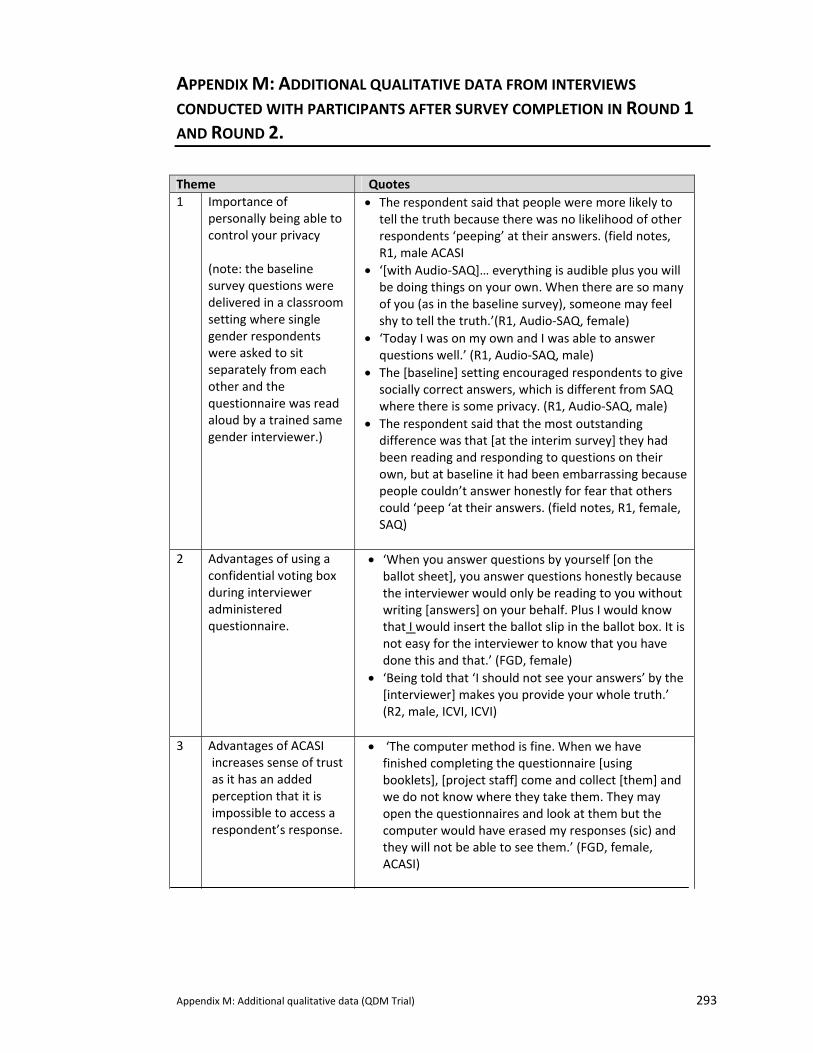
Appendix M: Additional qualitative data (QDM Trial) 293
APPENDIX M: ADDITIONAL QUALITATIVE DATA FROM INTERVIEWS
CONDUCTED WITH PARTICIPANTS AFTER SURVEY COMPLETION IN ROUND 1 AND ROUND 2.
Theme Quotes 1 Importance of
personally being able to control your privacy (note: the baseline survey questions were delivered in a classroom setting where single gender respondents were asked to sit separately from each other and the questionnaire was read aloud by a trained same gender interviewer.)
• The respondent said that people were more likely to tell the truth because there was no likelihood of other respondents ‘peeping’ at their answers. (field notes, R1, male ACASI
• ‘[with Audio‐SAQ]… everything is audible plus you will be doing things on your own. When there are so many of you (as in the baseline survey), someone may feel shy to tell the truth.’(R1, Audio‐SAQ, female)
• ‘Today I was on my own and I was able to answer questions well.’ (R1, Audio‐SAQ, male)
• The [baseline] setting encouraged respondents to give socially correct answers, which is different from SAQ where there is some privacy. (R1, Audio‐SAQ, male)
• The respondent said that the most outstanding difference was that [at the interim survey] they had been reading and responding to questions on their own, but at baseline it had been embarrassing because people couldn’t answer honestly for fear that others could ‘peep ‘at their answers. (field notes, R1, female, SAQ)
2 Advantages of using a
confidential voting box during interviewer administered questionnaire.
• ‘When you answer questions by yourself [on the ballot sheet], you answer questions honestly because the interviewer would only be reading to you without writing [answers] on your behalf. Plus I would know that I would insert the ballot slip in the ballot box. It is not easy for the interviewer to know that you have done this and that.’ (FGD, female)
• ‘Being told that ‘I should not see your answers’ by the [interviewer] makes you provide your whole truth.’ (R2, male, ICVI, ICVI)
3 Advantages of ACASI
increases sense of trust as it has an added perception that it is impossible to access a respondent’s response.
• ‘The computer method is fine. When we have finished completing the questionnaire [using booklets], [project staff] come and collect [them] and we do not know where they take them. They may open the questionnaires and look at them but the computer would have erased my responses (sic) and they will not be able to see them.’ (FGD, female, ACASI)
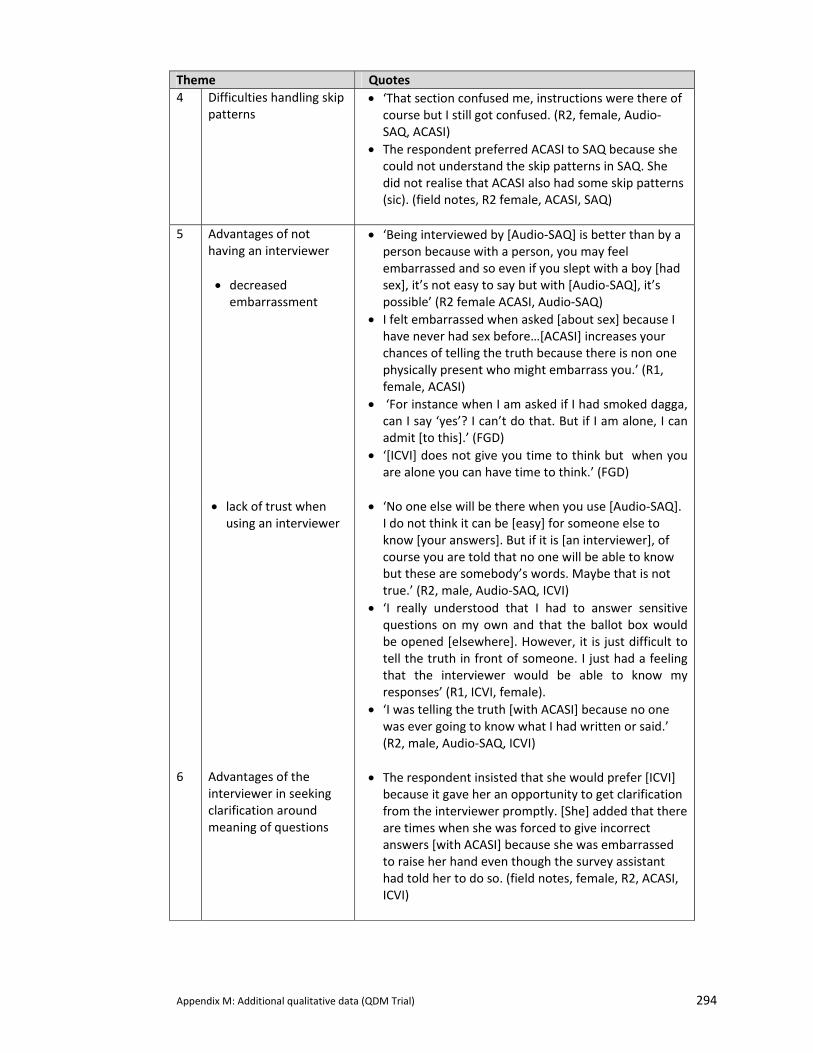
Appendix M: Additional qualitative data (QDM Trial) 294
Theme Quotes 4 Difficulties handling skip
patterns • ‘That section confused me, instructions were there of
course but I still got confused. (R2, female, Audio‐SAQ, ACASI)
• The respondent preferred ACASI to SAQ because she could not understand the skip patterns in SAQ. She did not realise that ACASI also had some skip patterns (sic). (field notes, R2 female, ACASI, SAQ)
5 Advantages of not
having an interviewer • decreased
embarrassment
• ‘Being interviewed by [Audio‐SAQ] is better than by a person because with a person, you may feel embarrassed and so even if you slept with a boy [had sex], it’s not easy to say but with [Audio‐SAQ], it’s possible’ (R2 female ACASI, Audio‐SAQ)
• I felt embarrassed when asked [about sex] because I have never had sex before…[ACASI] increases your chances of telling the truth because there is non one physically present who might embarrass you.’ (R1, female, ACASI)
• ‘For instance when I am asked if I had smoked dagga, can I say ‘yes’? I can’t do that. But if I am alone, I can admit [to this].’ (FGD)
• ‘[ICVI] does not give you time to think but when you are alone you can have time to think.’ (FGD)
• lack of trust when
using an interviewer • ‘No one else will be there when you use [Audio‐SAQ].
I do not think it can be [easy] for someone else to know [your answers]. But if it is [an interviewer], of course you are told that no one will be able to know but these are somebody’s words. Maybe that is not true.’ (R2, male, Audio‐SAQ, ICVI)
• ‘I really understood that I had to answer sensitive questions on my own and that the ballot box would be opened [elsewhere]. However, it is just difficult to tell the truth in front of someone. I just had a feeling that the interviewer would be able to know my responses’ (R1, ICVI, female).
• ‘I was telling the truth [with ACASI] because no one was ever going to know what I had written or said.’ (R2, male, Audio‐SAQ, ICVI)
6 Advantages of the
interviewer in seeking clarification around meaning of questions
• The respondent insisted that she would prefer [ICVI] because it gave her an opportunity to get clarification from the interviewer promptly. [She] added that there are times when she was forced to give incorrect answers [with ACASI] because she was embarrassed to raise her hand even though the survey assistant had told her to do so. (field notes, female, R2, ACASI, ICVI)
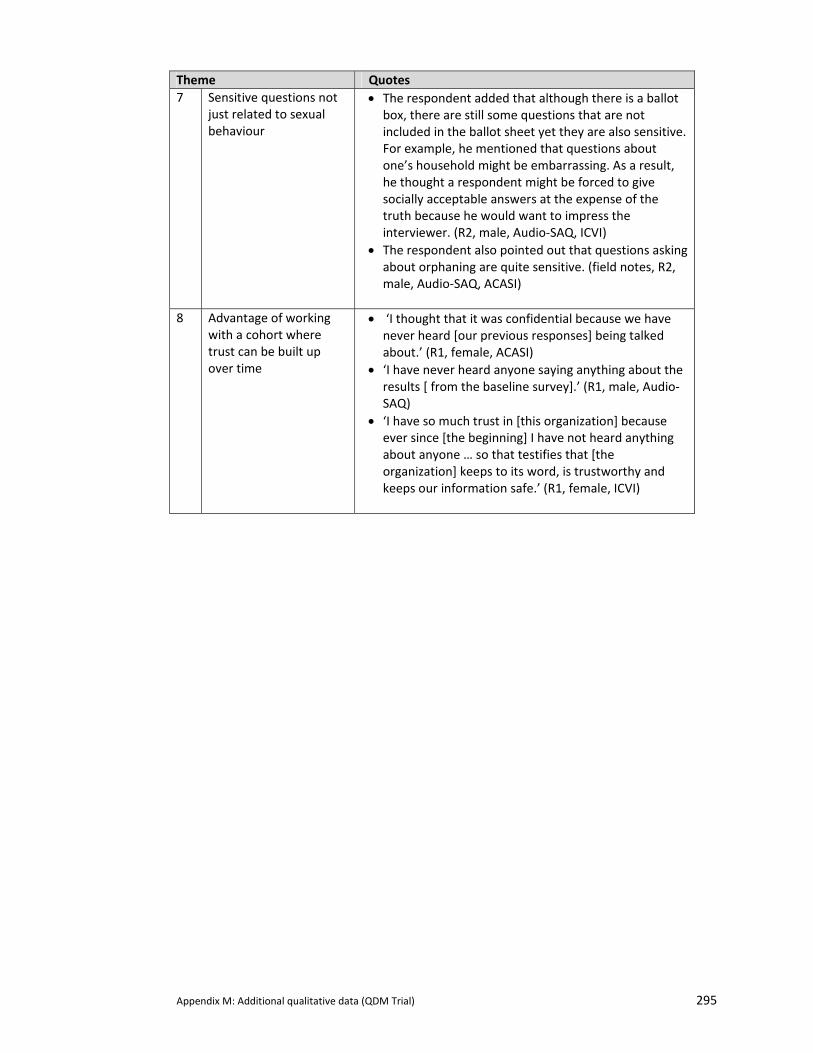
Appendix M: Additional qualitative data (QDM Trial) 295
Theme Quotes 7 Sensitive questions not
just related to sexual behaviour
• The respondent added that although there is a ballot box, there are still some questions that are not included in the ballot sheet yet they are also sensitive. For example, he mentioned that questions about one’s household might be embarrassing. As a result, he thought a respondent might be forced to give socially acceptable answers at the expense of the truth because he would want to impress the interviewer. (R2, male, Audio‐SAQ, ICVI)
• The respondent also pointed out that questions asking about orphaning are quite sensitive. (field notes, R2, male, Audio‐SAQ, ACASI)
8 Advantage of working
with a cohort where trust can be built up over time
• ‘I thought that it was confidential because we have never heard [our previous responses] being talked about.’ (R1, female, ACASI)
• ‘I have never heard anyone saying anything about the results [ from the baseline survey].’ (R1, male, Audio‐SAQ)
• ‘I have so much trust in [this organization] because ever since [the beginning] I have not heard anything about anyone … so that testifies that [the organization] keeps to its word, is trustworthy and keeps our information safe.’ (R1, female, ICVI)
Appendix N: RDS ACASI Final Survey Practice Instructions 296
APPENDIX N: PRACTICE INSTRUCTIONS FOR ACASI FINAL SURVEY
These are the practice instructions for the final survey for ACASI that incorporate the concept of a repeated matrix. Simple questions about shopping in a town were used to demonstrate this.
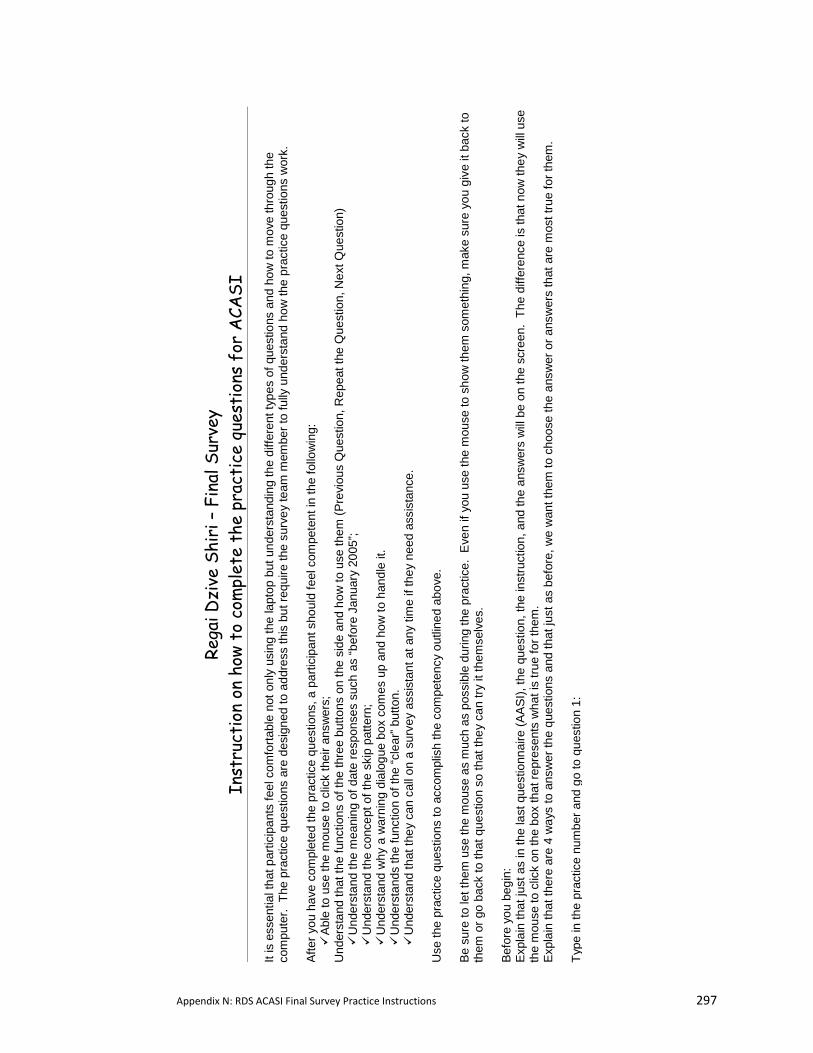
Appendix N: RDS ACASI Final Survey Practice Instructions 297
Rega
i Dzi
ve S
hiri
– F
inal
Sur
vey
Inst
ruct
ion
on h
ow t
o co
mpl
ete
the
prac
tice
que
stio
ns f
or A
CASI
It
is e
ssen
tial t
hat p
artic
ipan
ts fe
el c
omfo
rtabl
e no
t onl
y us
ing
the
lapt
op b
ut u
nder
stan
ding
the
diffe
rent
type
s of
que
stio
ns a
nd h
ow to
mov
e th
roug
h th
e co
mpu
ter.
The
pra
ctic
e qu
estio
ns a
re d
esig
ned
to a
ddre
ss th
is b
ut re
quire
the
surv
ey te
am m
embe
r to
fully
und
erst
and
how
the
prac
tice
ques
tions
wor
k.
Afte
r you
hav
e co
mpl
eted
the
prac
tice
ques
tions
, a p
artic
ipan
t sho
uld
feel
com
pete
nt in
the
follo
win
g:
Abl
e to
use
the
mou
se to
clic
k th
eir a
nsw
ers;
U
nder
stan
d th
at th
e fu
nctio
ns o
f the
thre
e bu
ttons
on
the
side
and
how
to u
se th
em (P
revi
ous
Que
stio
n, R
epea
t the
Que
stio
n, N
ext Q
uest
ion)
U
nder
stan
d th
e m
eani
ng o
f dat
e re
spon
ses
such
as
“bef
ore
Janu
ary
2005
”; U
nder
stan
d th
e co
ncep
t of t
he s
kip
patte
rn;
Und
erst
and
why
a w
arni
ng d
ialo
gue
box
com
es u
p an
d ho
w to
han
dle
it.
Und
erst
ands
the
func
tion
of th
e “c
lear
” but
ton.
U
nder
stan
d th
at th
ey c
an c
all o
n a
surv
ey a
ssis
tant
at a
ny ti
me
if th
ey n
eed
assi
stan
ce.
Use
the
prac
tice
ques
tions
to a
ccom
plis
h th
e co
mpe
tenc
y ou
tline
d ab
ove.
Be
sur
e to
let t
hem
use
the
mou
se a
s m
uch
as p
ossi
ble
durin
g th
e pr
actic
e. E
ven
if yo
u us
e th
e m
ouse
to s
how
them
som
ethi
ng, m
ake
sure
you
giv
e it
back
to
them
or g
o ba
ck to
that
que
stio
n so
that
they
can
try
it th
emse
lves
. Be
fore
you
beg
in:
Expl
ain
that
just
as
in th
e la
st q
uest
ionn
aire
(AA
SI),
the
ques
tion,
the
inst
ruct
ion,
and
the
answ
ers
will
be
on th
e sc
reen
. Th
e di
ffere
nce
is th
at n
ow th
ey w
ill u
se
the
mou
se to
clic
k on
the
box
that
repr
esen
ts w
hat i
s tru
e fo
r the
m.
Ex
plai
n th
at th
ere
are
4 w
ays
to a
nsw
er th
e qu
estio
ns a
nd th
at ju
st a
s be
fore
, we
wan
t the
m to
cho
ose
the
answ
er o
r ans
wer
s th
at a
re m
ost t
rue
for t
hem
. Ty
pe in
the
prac
tice
num
ber a
nd g
o to
que
stio
n 1:
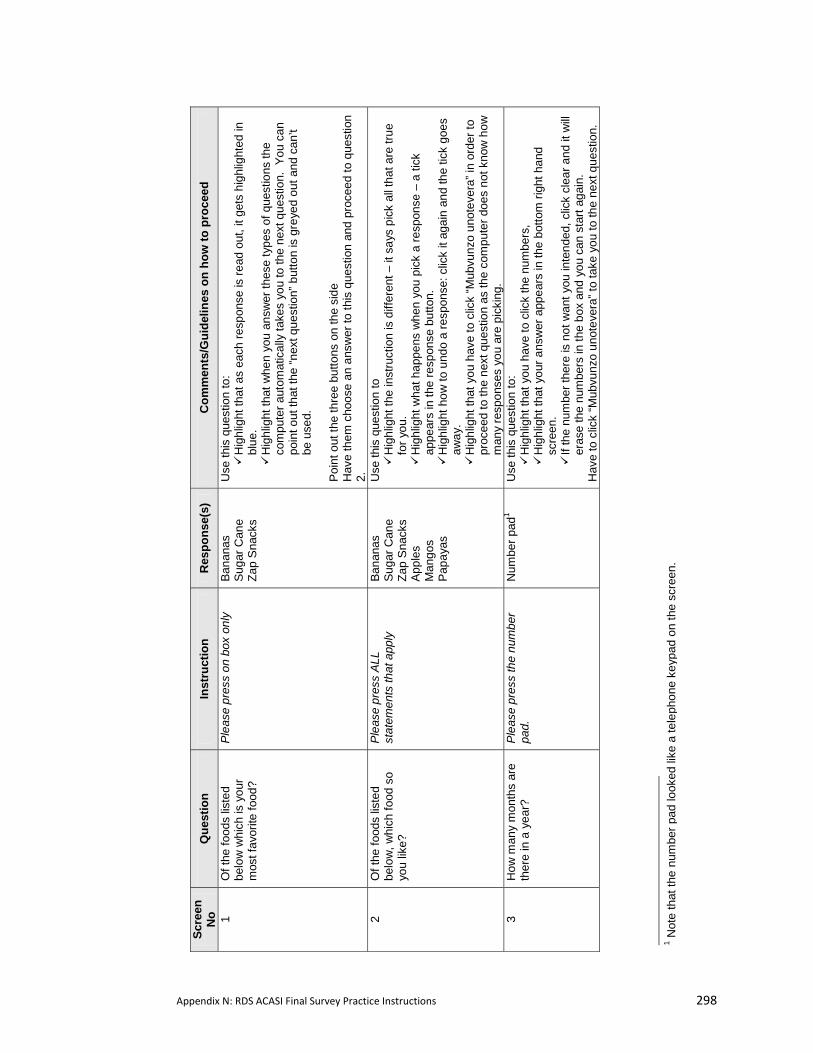
Appendix N: RDS ACASI Final Survey Practice Instructions 298
Scre
en
No
Que
stio
n In
stru
ctio
n R
espo
nse(
s)
Com
men
ts/G
uide
lines
on
how
to p
roce
ed
1 O
f the
food
s lis
ted
belo
w w
hich
is y
our
mos
t fav
orite
food
?
Plea
se p
ress
on
box
only
Bana
nas
Suga
r Can
e Za
p S
nack
s
Use
this
que
stio
n to
: H
ighl
ight
that
as
each
resp
onse
is re
ad o
ut, i
t get
s hi
ghlig
hted
in
blue
. H
ighl
ight
that
whe
n yo
u an
swer
thes
e ty
pes
of q
uest
ions
the
com
pute
r aut
omat
ical
ly ta
kes
you
to th
e ne
xt q
uest
ion.
You
can
po
int o
ut th
at th
e “n
ext q
uest
ion”
but
ton
is g
reye
d ou
t and
can
’t be
use
d.
Po
int o
ut th
e th
ree
butto
ns o
n th
e si
de
Hav
e th
em c
hoos
e an
ans
wer
to th
is q
uest
ion
and
proc
eed
to q
uest
ion
2.
2 O
f the
food
s lis
ted
belo
w, w
hich
food
so
you
like?
Plea
se p
ress
ALL
st
atem
ents
that
app
ly
Bana
nas
Suga
r Can
e Za
p S
nack
s Ap
ples
M
ango
s P
apay
as
Use
this
que
stio
n to
H
ighl
ight
the
inst
ruct
ion
is d
iffer
ent –
it s
ays
pick
all
that
are
true
fo
r you
. H
ighl
ight
wha
t hap
pens
whe
n yo
u pi
ck a
resp
onse
– a
tick
ap
pear
s in
the
resp
onse
but
ton.
H
ighl
ight
how
to u
ndo
a re
spon
se: c
lick
it ag
ain
and
the
tick
goes
aw
ay.
Hig
hlig
ht th
at y
ou h
ave
to c
lick
“Mub
vunz
o un
otev
era”
in o
rder
to
proc
eed
to th
e ne
xt q
uest
ion
as th
e co
mpu
ter d
oes
not k
now
how
m
any
resp
onse
s yo
u ar
e pi
ckin
g.
3 H
ow m
any
mon
ths
are
ther
e in
a y
ear?
Pl
ease
pre
ss th
e nu
mbe
r pa
d.
Num
ber p
ad1
U
se th
is q
uest
ion
to:
Hig
hlig
ht th
at y
ou h
ave
to c
lick
the
num
bers
, H
ighl
ight
that
you
r ans
wer
app
ears
in th
e bo
ttom
righ
t han
d sc
reen
. If
the
num
ber t
here
is n
ot w
ant y
ou in
tend
ed, c
lick
clea
r and
it w
ill er
ase
the
num
bers
in th
e bo
x an
d yo
u ca
n st
art a
gain
. H
ave
to c
lick
“Mub
vunz
o un
otev
era”
to ta
ke y
ou to
the
next
que
stio
n.
1 Not
e th
at th
e nu
mbe
r pad
look
ed li
ke a
tele
phon
e ke
ypad
on
the
scre
en.
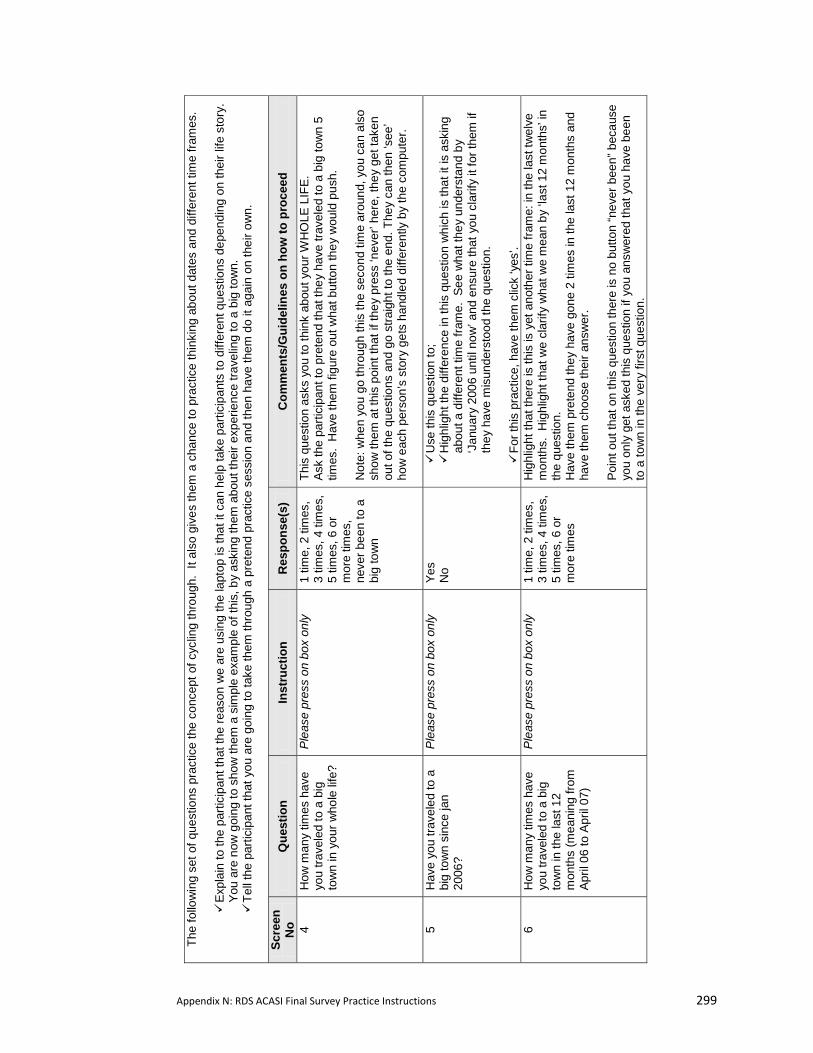
Appendix N: RDS ACASI Final Survey Practice Instructions 299
The
follo
win
g se
t of q
uest
ions
pra
ctic
e th
e co
ncep
t of c
yclin
g th
roug
h. I
t als
o gi
ves
them
a c
hanc
e to
pra
ctic
e th
inki
ng a
bout
dat
es a
nd d
iffer
ent t
ime
fram
es.
E
xpla
in to
the
parti
cipa
nt th
at th
e re
ason
we
are
usin
g th
e la
ptop
is th
at it
can
hel
p ta
ke p
artic
ipan
ts to
diff
eren
t que
stio
ns d
epen
ding
on
thei
r life
sto
ry.
You
are
now
goi
ng to
sho
w th
em a
sim
ple
exam
ple
of th
is, b
y as
king
them
abo
ut th
eir e
xper
ienc
e tra
velin
g to
a b
ig to
wn.
T
ell t
he p
artic
ipan
t tha
t you
are
goi
ng to
take
them
thro
ugh
a pr
eten
d pr
actic
e se
ssio
n an
d th
en h
ave
them
do
it ag
ain
on th
eir o
wn.
Scre
en
No
Que
stio
n In
stru
ctio
n R
espo
nse(
s)
Com
men
ts/G
uide
lines
on
how
to p
roce
ed
4 H
ow m
any
times
hav
e yo
u tra
vele
d to
a b
ig
tow
n in
you
r who
le li
fe?
Plea
se p
ress
on
box
only
1 tim
e, 2
tim
es,
3 tim
es, 4
tim
es,
5 tim
es, 6
or
mor
e tim
es,
neve
r bee
n to
a
big
tow
n
This
que
stio
n as
ks y
ou to
thin
k ab
out y
our W
HO
LE L
IFE.
As
k th
e pa
rtici
pant
to p
rete
nd th
at th
ey h
ave
trave
led
to a
big
tow
n 5
times
. H
ave
them
figu
re o
ut w
hat b
utto
n th
ey w
ould
pus
h.
Not
e: w
hen
you
go th
roug
h th
is th
e se
cond
tim
e ar
ound
, you
can
als
o sh
ow th
em a
t thi
s po
int t
hat i
f the
y pr
ess
‘nev
er’ h
ere,
they
get
take
n ou
t of t
he q
uest
ions
and
go
stra
ight
to th
e en
d. T
hey
can
then
‘see
’ ho
w e
ach
pers
on’s
sto
ry g
ets
hand
led
diffe
rent
ly b
y th
e co
mpu
ter.
5
Hav
e yo
u tra
vele
d to
a
big
tow
n si
nce
jan
2006
?
Plea
se p
ress
on
box
only
Yes
No
Use
this
que
stio
n to
; H
ighl
ight
the
diffe
renc
e in
this
que
stio
n w
hich
is th
at it
is a
skin
g ab
out a
diff
eren
t tim
e fra
me.
See
wha
t the
y un
ders
tand
by
‘Jan
uary
200
6 un
til n
ow’ a
nd e
nsur
e th
at y
ou c
larif
y it
for t
hem
if
they
hav
e m
isun
ders
tood
the
ques
tion.
For
this
pra
ctic
e, h
ave
them
clic
k ‘y
es’.
6 H
ow m
any
times
hav
e yo
u tra
vele
d to
a b
ig
tow
n in
the
last
12
mon
ths
(mea
ning
from
Ap
ril 0
6 to
Apr
il 07
)
Plea
se p
ress
on
box
only
1 tim
e, 2
tim
es,
3 tim
es, 4
tim
es,
5 tim
es, 6
or
mor
e tim
es
Hig
hlig
ht th
at th
ere
is th
is is
yet
ano
ther
tim
e fra
me:
in th
e la
st tw
elve
m
onth
s. H
ighl
ight
that
we
clar
ify w
hat w
e m
ean
by ‘l
ast 1
2 m
onth
s’ in
th
e qu
estio
n.
Hav
e th
em p
rete
nd th
ey h
ave
gone
2 ti
mes
in th
e la
st 1
2 m
onth
s an
d ha
ve th
em c
hoos
e th
eir a
nsw
er.
Poin
t out
that
on
this
que
stio
n th
ere
is n
o bu
tton
“nev
er b
een”
bec
ause
yo
u on
ly g
et a
sked
this
que
stio
n if
you
answ
ered
that
you
hav
e be
en
to a
tow
n in
the
very
firs
t que
stio
n.
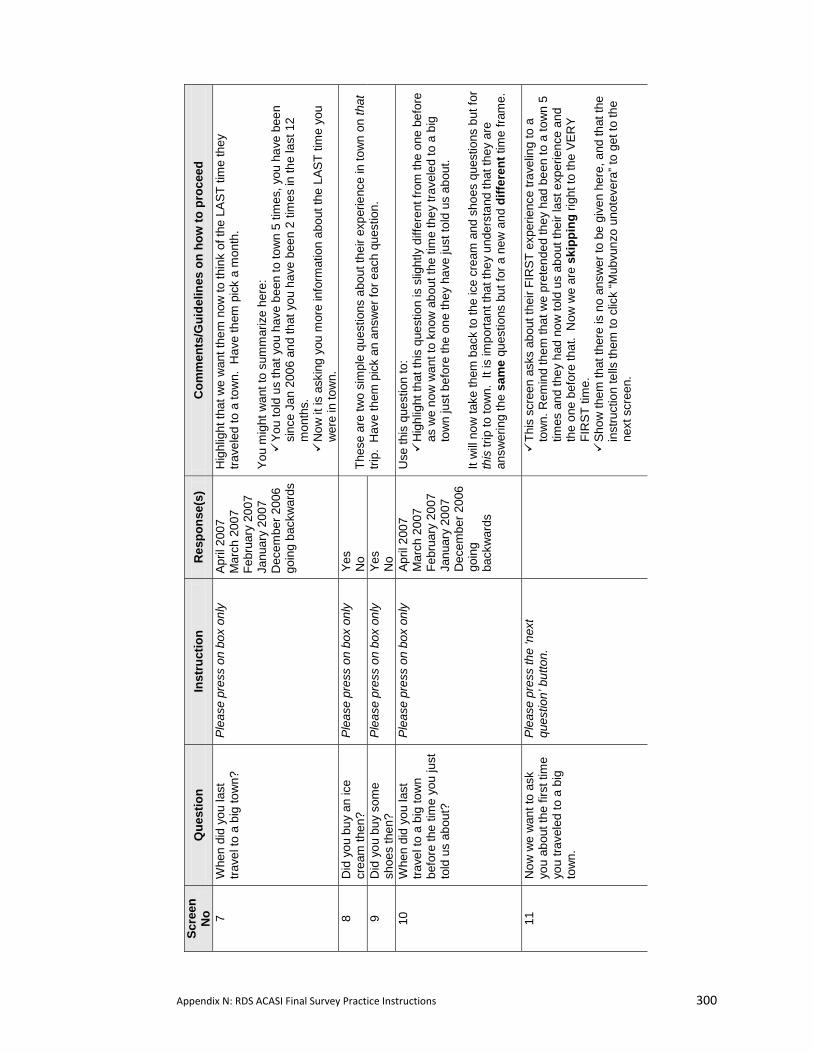
Appendix N: RDS ACASI Final Survey Practice Instructions 300
Scre
en
No
Que
stio
n In
stru
ctio
n R
espo
nse(
s)
Com
men
ts/G
uide
lines
on
how
to p
roce
ed
7 W
hen
did
you
last
tra
vel t
o a
big
tow
n?
Plea
se p
ress
on
box
only
April
200
7 M
arch
200
7 Fe
brua
ry 2
007
Janu
ary
2007
D
ecem
ber 2
006
goin
g ba
ckw
ards
Hig
hlig
ht th
at w
e w
ant t
hem
now
to th
ink
of th
e LA
ST ti
me
they
tra
vele
d to
a to
wn.
Hav
e th
em p
ick
a m
onth
. Yo
u m
ight
wan
t to
sum
mar
ize
here
: Y
ou to
ld u
s th
at y
ou h
ave
been
to to
wn
5 tim
es, y
ou h
ave
been
si
nce
Jan
2006
and
that
you
hav
e be
en 2
tim
es in
the
last
12
mon
ths.
N
ow it
is a
skin
g yo
u m
ore
info
rmat
ion
abou
t the
LAS
T tim
e yo
u w
ere
in to
wn.
8
Did
you
buy
an
ice
crea
m th
en?
Plea
se p
ress
on
box
only
Yes
No
9 D
id y
ou b
uy s
ome
shoe
s th
en?
Plea
se p
ress
on
box
only
Yes
No
Thes
e ar
e tw
o si
mpl
e qu
estio
ns a
bout
thei
r exp
erie
nce
in to
wn
on th
at
trip.
Hav
e th
em p
ick
an a
nsw
er fo
r eac
h qu
estio
n.
10
Whe
n di
d yo
u la
st
trave
l to
a bi
g to
wn
befo
re th
e tim
e yo
u ju
st
told
us
abou
t?
Plea
se p
ress
on
box
only
April
200
7 M
arch
200
7 Fe
brua
ry 2
007
Janu
ary
2007
D
ecem
ber 2
006
goin
g ba
ckw
ards
Use
this
que
stio
n to
: H
ighl
ight
that
this
que
stio
n is
slig
htly
diff
eren
t fro
m th
e on
e be
fore
as
we
now
wan
t to
know
abo
ut th
e tim
e th
ey tr
avel
ed to
a b
ig
tow
n ju
st b
efor
e th
e on
e th
ey h
ave
just
told
us
abou
t.
It w
ill no
w ta
ke th
em b
ack
to th
e ic
e cr
eam
and
sho
es q
uest
ions
but
for
this
trip
to to
wn.
It i
s im
porta
nt th
at th
ey u
nder
stan
d th
at th
ey a
re
answ
erin
g th
e sa
me
ques
tions
but
for a
new
and
diff
eren
t tim
e fra
me.
11
Now
we
wan
t to
ask
you
abou
t the
firs
t tim
e yo
u tra
vele
d to
a b
ig
tow
n.
Plea
se p
ress
the
‘nex
t qu
estio
n’ b
utto
n.
T
his
scre
en a
sks
abou
t the
ir FI
RST
exp
erie
nce
trave
ling
to a
to
wn.
Rem
ind
them
that
we
pret
ende
d th
ey h
ad b
een
to a
tow
n 5
times
and
they
had
now
told
us
abou
t the
ir la
st e
xper
ienc
e an
d th
e on
e be
fore
that
. N
ow w
e ar
e sk
ippi
ng ri
ght t
o th
e VE
RY
FIR
ST ti
me.
S
how
them
that
ther
e is
no
answ
er to
be
give
n he
re, a
nd th
at th
e in
stru
ctio
n te
lls th
em to
clic
k “M
ubvu
nzo
unot
ever
a” to
get
to th
e ne
xt s
cree
n.
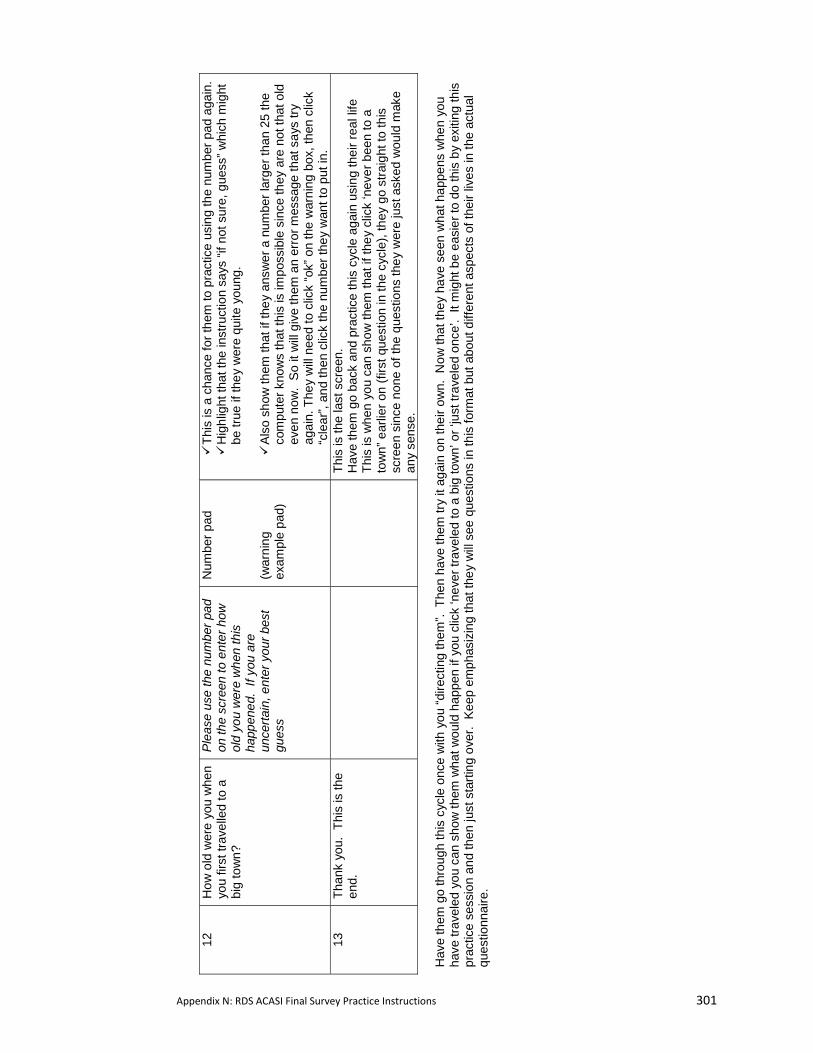
Appendix N: RDS ACASI Final Survey Practice Instructions 301
12
How
old
wer
e yo
u w
hen
you
first
trav
elle
d to
a
big
tow
n?
Ple
ase
use
the
num
ber p
ad
on th
e sc
reen
to e
nter
how
ol
d yo
u w
ere
whe
n th
is
happ
ened
. If
you
are
unce
rtain
, ent
er y
our b
est
gues
s
Num
ber p
ad
(war
ning
ex
ampl
e pa
d)
Thi
s is
a c
hanc
e fo
r the
m to
pra
ctic
e us
ing
the
num
ber p
ad a
gain
. H
ighl
ight
that
the
inst
ruct
ion
says
“if n
ot s
ure,
gue
ss” w
hich
mig
ht
be tr
ue if
they
wer
e qu
ite y
oung
.
Als
o sh
ow th
em th
at if
they
ans
wer
a n
umbe
r lar
ger t
han
25 th
e co
mpu
ter k
now
s th
at th
is is
impo
ssib
le s
ince
they
are
not
that
old
ev
en n
ow.
So it
will
give
them
an
erro
r mes
sage
that
say
s try
ag
ain.
The
y w
ill n
eed
to c
lick
“ok”
on
the
war
ning
box
, the
n cl
ick
“cle
ar”,
and
then
clic
k th
e nu
mbe
r the
y w
ant t
o pu
t in.
13
Th
ank
you.
Thi
s is
the
end.
Th
is is
the
last
scr
een.
H
ave
them
go
back
and
pra
ctic
e th
is c
ycle
aga
in u
sing
thei
r rea
l life
Th
is is
whe
n yo
u ca
n sh
ow th
em th
at if
they
clic
k ‘n
ever
bee
n to
a
tow
n” e
arlie
r on
(firs
t que
stio
n in
the
cycl
e), t
hey
go s
traig
ht to
this
sc
reen
sin
ce n
one
of th
e qu
estio
ns th
ey w
ere
just
ask
ed w
ould
mak
e an
y se
nse.
H
ave
them
go
thro
ugh
this
cyc
le o
nce
with
you
“dire
ctin
g th
em”.
The
n ha
ve th
em tr
y it
agai
n on
thei
r ow
n. N
ow th
at th
ey h
ave
seen
wha
t hap
pens
whe
n yo
u ha
ve tr
avel
ed y
ou c
an s
how
them
wha
t wou
ld h
appe
n if
you
clic
k ‘n
ever
trav
eled
to a
big
tow
n’ o
r ‘ju
st tr
avel
ed o
nce’
. It
mig
ht b
e ea
sier
to d
o th
is b
y ex
iting
this
pr
actic
e se
ssio
n an
d th
en ju
st s
tarti
ng o
ver.
Kee
p em
phas
izin
g th
at th
ey w
ill se
e qu
estio
ns in
this
form
at b
ut a
bout
diff
eren
t asp
ects
of t
heir
lives
in th
e ac
tual
qu
estio
nnai
re.
Appendix N: RDS ACASI Final Survey Practice Instructions 302
APPENDIX O: PUBLICATIONS RELATED TO THE RDS PROJECT
1. Copies of papers related to this thesis
2. Summary of papers and presentations made relating to this thesis and to the RDS project as
a whole.
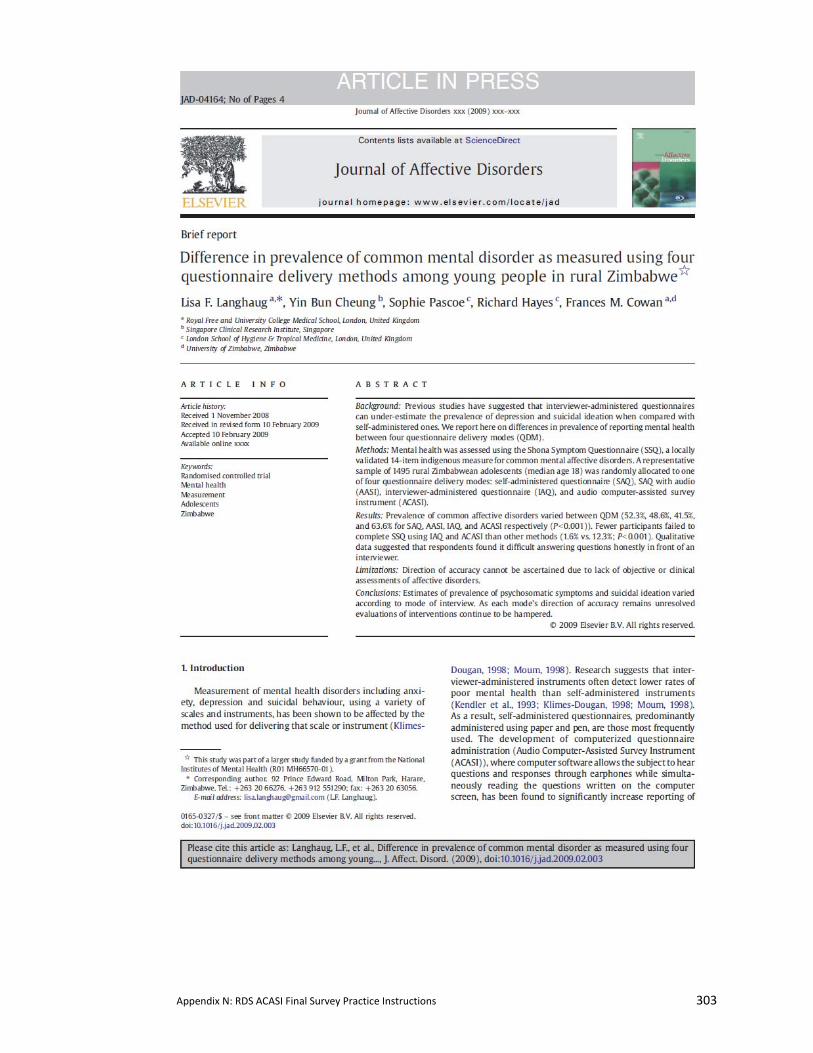
Appendix N: RDS ACASI Final Survey Practice Instructions 303
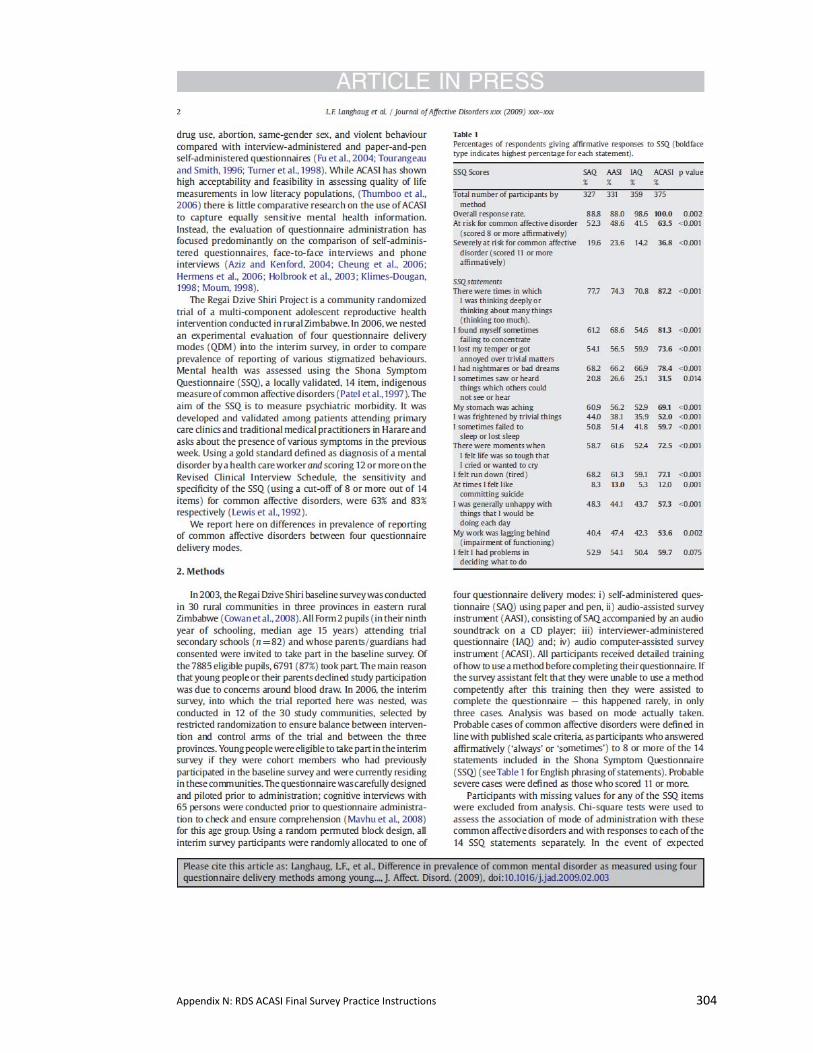
Appendix N: RDS ACASI Final Survey Practice Instructions 304
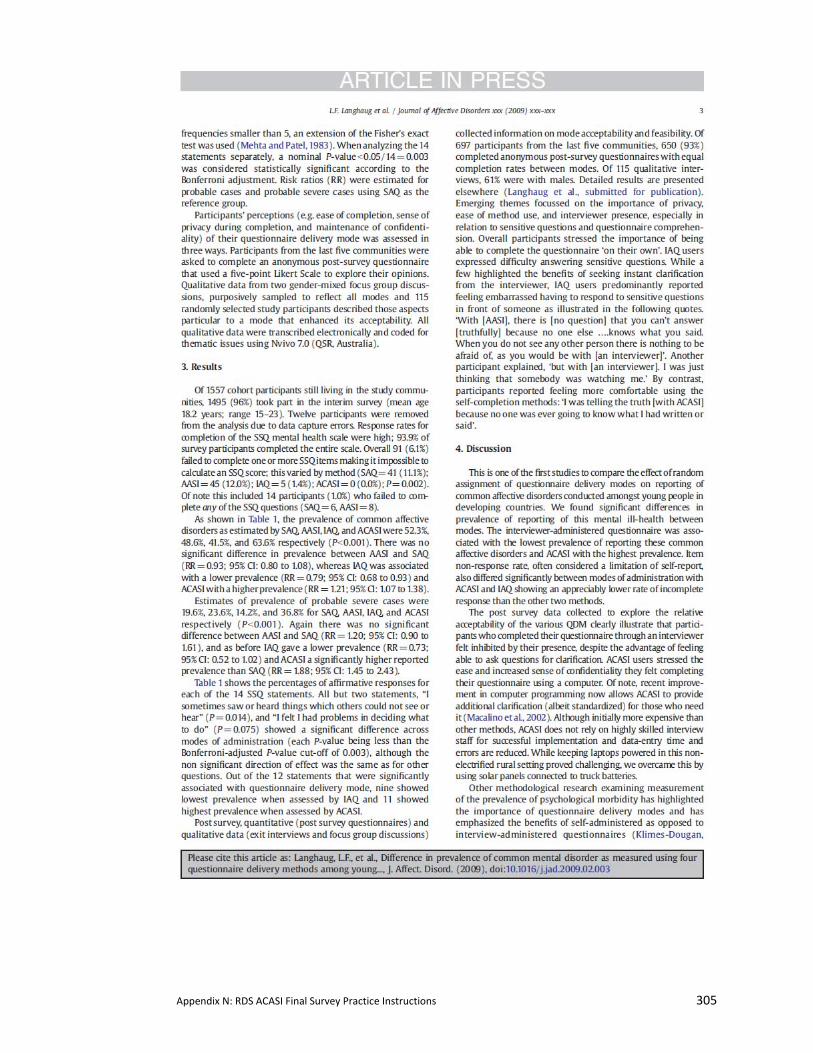
Appendix N: RDS ACASI Final Survey Practice Instructions 305
Appendix N: RDS ACASI Final Survey Practice Instructions 306
Appendix N: RDS ACASI Final Survey Practice Instructions 307
Abstracts of papers submitted for publication Title: How you ask the question really matters: a randomized comparison of four questionnaire delivery modes to assess validity and reliability of self-reported data on sexual behaviour in young people in rural Zimbabwe.
Lisa F. Langhaug (MPH)1, Yin Bun Cheung (PhD)2,3, Sophie J. Pascoe (MSc)2, Petronella Chirawu (BA)4, Godfrey Woelk (PhD)4, Richard Hayes (DSc)2, Frances M. Cowan (MSc)1. 1University College London 2London School of Hygiene and Tropical Medicine 3Clinical Trials and Epidemiology Research Unit, Singapore 4University of Zimbabwe
Abstract: Formatted for British Medical Journal
Objective To compare the reliability and validity of sexual behaviour questions across four questionnaire delivery modes in rural Zimbabwean youth. Design Randomized control trial Setting 12 rural communities in South-Eastern Zimbabwe, randomly selected from the 30 communities that comprise the Regai Dzive Shiri trial. Participants Cohort members of the RDS main trial (827 males and 668 females; mean age 18.2 years, range 15-23) residing in these 12 communities. Intervention Cohort members were randomly allocated to one of the following: self-administered questionnaire (SAQ=373), SAQ accompanied by an audio soundtrack (Audio-SAQ=376); face-to-face interview using an informal confidential voting box (ballot-sheet-interview=365); and audio computer-assisted survey instrument (ACASI=381). Main outcome measures Key questions were selected a priori to compare item non-response and rates of reporting sensitive behaviours between questionnaire delivery modes. Biomarkers for sexual activity included incident HIV, HSV2 and current pregnancy in females. Additional qualitative and quantitative data were collected on method acceptability. Results Item non-response was significantly higher with SAQ and Audio-SAQ than with ballot-sheet-interview and ACASI (p<0.001). After adjusting for covariates, Audio-SAQ and ACASI users were twice as likely to report sexual activity when compared to SAQ users (Audio-SAQ AOR=2.05 [95%CI: 1.2-3.4]; ACASI AOR=2.0 [95%CI: 1.2-3.2]), with no reporting difference between ballot-sheet-interview and SAQ users (ballot-sheet-interview AOR=1.0 [95%CI: 0.6-1.8). ACASI users reported a lower age at first sex (0.7-1.7 years lower) (p<0.045). ACASI users reported increased ability to answer questions honestly (p=0.004) and believed their answers would be kept secret. Participants claimed increased comprehension when hearing questions while reading them. Ballot-sheet-interview users expressed difficulty answering sensitive questions, despite understanding that their answers would not be known by the interviewer. Conclusion ACASI appears to significantly reduce bias, is feasible and acceptable in resource-poor settings with low computer literacy. Its increased use would likely improve the quality of questionnaire data in general and sexual behaviour data specifically. Trial registration The Regai Dzive Shiri trial has been registered retrospectively and trial number will follow. Keywords: adolescents, sexual behaviour, survey methodology, Zimbabwe, HIV Seroprevalence, randomized controlled trial
Appendix N: RDS ACASI Final Survey Practice Instructions 308
Title: A Systematic Review of Questionnaire Delivery Modes in Developing Countries Which Focuses on How to Improve the Validity of Sexual Behaviour Reporting Lisa F. Langhaug1§, Lorraine Sherr1, Frances M Cowan1,2 1 Centre for Sexual Health & HIV Research, University College London, Mortimer Market Centre, off Capper Street, London, WC1E 6JB 2 Department of Community Medicine, University of Zimbabwe, Harare, Zimbabwe
Abstract‐ formatted for AIDS Background To systematically review comparative research from developing countries on questionnaire delivery mode effects. Methods Three databases (Medline, EMbase, and PsychINFO) and ISSTDR conference proceedings were searched. Randomized‐controlled trials and quasi‐experimental studies were included if they compared two or more questionnaire delivery modes, were conducted in a developing country, reported on sexual behaviours, and occurred after 1980. Twenty‐eight articles reporting on 26 studies met the inclusion criteria. Main outcome measures: Item non response rates and rates of reporting sexual behaviours. Heterogeneity of reported trial outcomes between studies made it inappropriate to combine trial outcomes. Results: Eighteen studies compared audio computer‐assisted survey instruments (ACASI) or its derivatives (PDA or CAPI) against another questionnaire delivery method (self‐administered questionnaires, face‐to‐face interviews, random response technique). Despite wide‐variation in geography and populations sampled, there was strong evidence that computer‐assisted interviews decreased item‐response rates and increased rates of reporting of sensitive behaviours. ACASI also improved data entry quality. A wide range of sexual behaviours were reported including vaginal, oral, anal and/or forced sex, age of sexual debut, condom use at first and/or last sex. Validation of self‐reports using biomarkers was rare. Discussion These data reaffirm that questionnaire delivery modes do affect self‐reported sexual behaviours and that use of ACASI can significantly reduce reporting bias. Its acceptability and feasibility in developing country settings should encourage researchers to consider its use when conducting sexual health research. Triangulation of self‐reported data using biomarkers is recommended. Standardising sexual behaviour measures used in comparison would allow for meta‐analysis. Key words: developing country; systematic review, validity, method comparison
Appendix N: RDS ACASI Final Survey Practice Instructions 309
1. Papers related to this thesis: Langhaug LF., Cheung YB, Pascoe SJS., Hayes RJ, CowanFM (2009). Difference in prevalence of common mental disorder as measured using four questionnaire delivery methods among young people in rural Zimbabwe. Journal of Affective Disorders, (in press).
Langhaug LF, Cheung YB, Pascoe SJS, Chirawu P, Woelk G, Hayes RJ. Cowan, FM. (2009). How you ask the question really matters: a randomized comparison of four questionnaire delivery modes to assess validity and reliability of self‐reported data on sexual behaviour in young people in rural Zimbabwe. (submitted for publication)
Langhaug LF, Sherr L, Cowan, FM. A systematic review of questionnaire delivery modes in developing countries which focuses on how to improve the validity of sexual behaviour reporting. (submitted for publication)
Mavhu, W., Langhaug, L. F., Manyonga, B., Power, R., & Cowan, F. M. (2008). What is 'sex' exactly? Using cognitive interviewing to improve validity of sexual behaviour reporting among young people in rural Zimbabwe . Culture, Health, and Sexuality, 10, 563‐572.
Pascoe, SJS, Langhaug, LF, Hayes, RJ, Cowan FM ‘How poor are you?’ – A comparison of four questionnaire delivery modes for assessing wealth in rural Zimbabwe (in preparation) 2. Oral presentations related to this thesis: 2007 – 17th International Society for Sexually Transmitted Diseases Research (ISSTDR), Seattle, Washington, USA • Oral: Lisa F Langhaug, Yin Bun Cheung, Sophie Pascoe, Webster Mavhu, Petronella
Chirawu, Frances M Cowan. Comparing 4 Questionnaire Delivery Methods for Collection of Self Reported Sexual Behaviour Data in Rural Zimbabwean Youth
3. Papers related to the RDS project in its entirety (ordered chronologically): Cowan FM, Langhaug LF, Mashungupa GP, Nyamurera T, Hargrove J, Jaffar S, Peeling RW, Brown DW, Power R, Johnson AM, Stephenson JM, Bassett MT, Hayes RJ; Regai Dzive Shiri Project. School based HIV prevention in Zimbabwe: feasibility and acceptability of evaluation trials using biological outcomes. AIDS. 2002 Aug 16;16(12):1673‐8.
Cowan, F. M., Langhaug, L. F., Mashungupa, G. P., Nyamurera, T., Hargrove, J. W., Jaffar, S. et al. (2002). School based HIV prevention in Zimbabwe: feasibility and acceptability of evaluation trials using biological outcomes. AIDS, 16, 1673‐1678.
Langhaug LF, Cowan FM, Nyamurera T, Power R. Improving young people's access to reproductive health care in rural Zimbabwe. AIDS Care. 2003;15(2):147‐57.
Power, R., Langhaug, L. F., Nyamurera, T., Wilson, D., Bassett, M. T., & Cowan, F. M. (2004). Developing complex interventions for rigorous evaluation ‐ a case study from rural Zimbabwe. Health Education Research, 19, 570‐575.
Power, R., Langhaug, L. F., & Cowan, F. M. (2007). "But there are no snakes in the wood": risk mapping as an outcome measure in evaluating complex interventions. Sexually Transmitted Infections, 83, 232‐236.
Cowan, F. M., Pascoe, S. J. S., Langhaug, L. F., Dirawo, J., Chidiya, S., Jaffar, S. et al. (2008). The Regai Dzive Shiri Project: a cluster randomised controlled trial to determine the effectiveness of a multi‐component community based HIV prevention intervention for rural youth in Zimbabwe ‐ study design and baseline results. Tropical Medicine and International Health, 13, 1235‐1244.
Appendix N: RDS ACASI Final Survey Practice Instructions 310
Pascoe, SJS, Langhaug, LF, Mudzori, J, Burke, E., Hayes, R., Cowan, FM. Field evaluation of diagnostic accuracy of an oral fluid rapid test for HIV, tested at point‐of‐service sites in rural Zimbabwe. AIDS Patient Care and STDs (in press)
Chirawu, P., Langhaug, L. F., Mavhu, W., Pascoe, S. J. S., Dirawo, J., & Cowan, F. M. (2009). Acceptability and challenges of implementing voluntary counselling and testing (VCT) in rural Zimbabwe: Evidence from the Regai Dzive Shiri Project. AIDS Care, (in press).
Pascoe, S. J. S., Langhaug, L. F., Durawo, J., Woelk, G., Ferrand, R., Jaffar, S. et al. (2009). Increased risk of HIV‐infection among school‐attending orphans in rural Zimbabwe. AIDS Care.
Submitted manuscripts: Langhaug LF, Pascoe SJS, Mavhu W, Woelk G, Sherr L, Hayes RJ, Cowan FM, High prevalence of mental ill‐health among adolescents living in rural Zimbabwe. Submitted to the International Journal of STIs) 4. Oral and Poster presentations (first author only): 2007 – 17th International Society for Sexually Transmitted Diseases Research (ISSTDR), Seattle, Washington, USA • Poster: Langhaug LF, Pascoe SJS, Sherr L, Cowan FM. The mental health burden in
adolescents may impact on HIV risk in rural Zimbabwe 2007 ‐ South African AIDS Conference, Durban, South Africa • Poster: Langhaug LF, Cheung YB, Pascoe SJS, Hayes RJ, Cowan FM What really matters? A
comparison of 4 different questionnaire delivery methods: a sub study of the Regai Dzive Shiri Project.
• Poster: Langhaug LF, Pascoe SJS, Sherr L, Cowan FM The mental health burden on adolescents living in high HIV incidence communities in rural Zimbabwe.
2005 – 16th International Society for Sexually Transmitted Diseases Research (ISSTDR)‐Amsterdam • Oral: Langhaug LF, Mutisi M, Gore O, Manyonga B, Mutanga O, Masiyiwa M, Power R,
Cowan FM. Using participatory methods to assess the riskiness of rural communities for adolescents: an analysis of risk maps in the Regai Dzive Shiri Project
• Poster: Langhaug LF, Mutisi MC, Power RM, Cowan FM Exploring the context of sexual behavior among rural Zimbabwean adolescents
2005 – 2nd South African AIDS Conference, Durban, South Africa • Oral: Langhaug LF, Mutisi M, Power R, Cowan FM Using participatory methods to assess
the riskiness of rural communities for adolescents: an analysis of risk maps in the Regai Dzive Shiri Project.
• Poster: Langhaug LF, Mutisi M, Gore O, Manyonga B, Masiyiwa M, Mutanga O, Power RM,
Cowan FM Exploring the context of the evolution of sexual behavior among rural Zimbabwean adolescents.
• Poster: Langhaug LF, Mutisi M, Gore O, Manyonga B, Masiyiwa M, Mutanga O, Power RM,
Cowan FM Exploring the context of vulnerability: analysis of a subset of the Regai Dzive Shiri Project cohort.
2005 ‐ 12th Reproductive Health Priorities Conference, Stellenbocsh, South Africa Priorities • Poster: Langhaug LF, Mavhu W, Cowan FM Unlocking sensitive questions: using cognitive
interviewing to improve the validity of sexual behavoiur measurement in rural Zimbabwe: a sub‐study of the Regai Dzive Shiri project.
Appendix N: RDS ACASI Final Survey Practice Instructions 311
2004 – 11th Reproductive Health Priorities Conference, Sun City, South Africa. • Poster: Langhaug LF , Power RM, Cowan FM Assessing the validity of behaviour measurement in rural Zimbabwe: a sub‐study of the Regai Dzive Shiri Project.
Related Documents