A Quantitative Overview to Gene Expression Profiling in Animal Genetics Armidale Animal Breeding Summer Course, UNE, Feb. 20 Co- Expression Reverter et al. 2005 Bioinformatics 21:1112 Validation of alternative methods of data normalization in gene co- expression studies

A Quantitative Overview to Gene Expression Profiling in Animal Genetics
Jan 08, 2016
A Quantitative Overview to Gene Expression Profiling in Animal Genetics. Co-Expression. Validation of alternative methods of data normalization in gene co-expression studies. Reverter et al. 2005 Bioinformatics 21:1112. Armidale Animal Breeding Summer Course, UNE, Feb. 2006. - PowerPoint PPT Presentation
Welcome message from author
This document is posted to help you gain knowledge. Please leave a comment to let me know what you think about it! Share it to your friends and learn new things together.
Transcript

A Quantitative Overview to Gene Expression Profiling in Animal Genetics
Armidale Animal Breeding Summer Course, UNE, Feb. 2006
Co-Expression
Reverter et al. 2005Bioinformatics 21:1112
Validation of alternative methods of datanormalization in gene co-expression studies

A Quantitative Overview to Gene Expression Profiling in Animal Genetics
Armidale Animal Breeding Summer Course, UNE, Feb. 2006
Co-ExpressionMotivation
Statistics are like a bikini,what they reveal is suggestive,but what they conceal is vital.
Aaron Levenstein
A Quantitative Overview to Gene Expression Profiling in Animal Genetics
Armidale Animal Breeding Summer Course, UNE, Feb. 2006
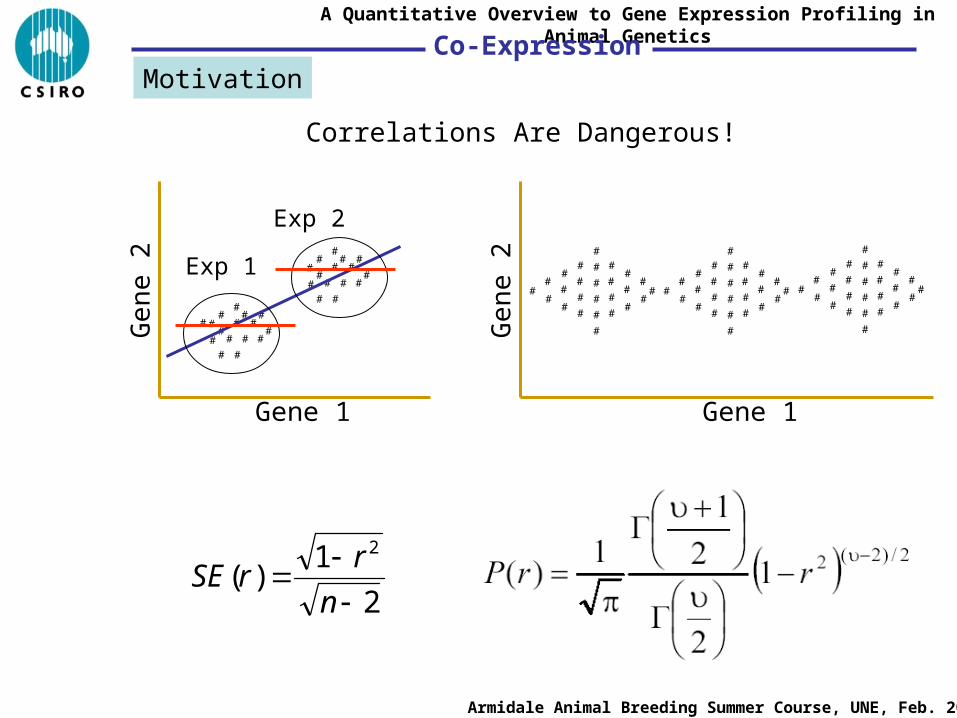
Co-ExpressionMotivation
Correlations Are Dangerous!
##
##
# ###
##
#
#
#
##
#
##
##
# ###
##
#
#
#
#
#Exp 1
Exp 2
Gene 1
Gen
e 2
Gene 1
Gen
e 2
##
##
#
#
#
#
#
##
#
#
#
#
#
#
#
#
#
#
#
#
#
## #
#
##
#
#
#
#
#
##
#
#
#
#
#
#
#
#
#
#
#
#
#
## #
#
##
#
#
#
#
#
##
#
#
#
#
#
#
#
#
#
#
#
#
#
##
2
1)(
2
n
rrSE

A Quantitative Overview to Gene Expression Profiling in Animal Genetics
Armidale Animal Breeding Summer Course, UNE, Feb. 2006
Co-ExpressionIntroduction
Validation of alternative methods of data normalization in gene co-expression studies. Bioinformatics 2005, 21:1112
A. Reverter, W. Barris, S.M. McWilliam, K.A. Byrne, Y.H. Wang, S.H. Tan, N. Hudson, and B.P. Dalrymple
Experimenta Hybs. Cond. Signalsb
N Mean STD
1. Two breeds by two diets 7 4 193,175 7.61 2.99
2. Three diets 14 3 361,320 8.52 2.84
3. Two diets at three ages 24 6 801,807 11.60 1.89
4. Two breeds at three ages 18 6 459,978 8.34 3.28
5. Two fat treatments at two ages 15 4 418,817 7.04 3.31
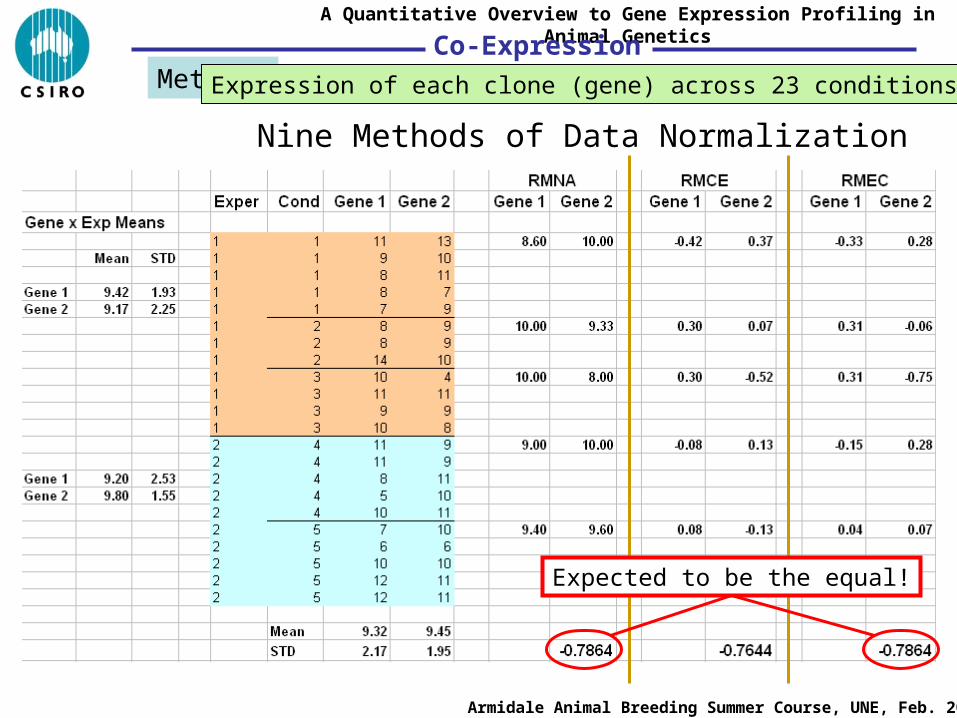
Expression of each clone (gene) across 23 conditions

A Quantitative Overview to Gene Expression Profiling in Animal GeneticsCo-Expression
Introduction
Armidale Animal Breeding Summer Course, UNE, Feb. 2006
1
2
3
4
5

A Quantitative Overview to Gene Expression Profiling in Animal Genetics
Armidale Animal Breeding Summer Course, UNE, Feb. 2006
Co-ExpressionMethods
Nine Methods of Data Normalization
######################
Clone i
Exp
erim
ent 1
( E
1, E
1)E
xper
imen
t 2
(E
2, E
2)
Cond
1
2
3
4
5
(Ci, Ci)
1x
2x
3x
4x
5x
1E1E1 /)x(
1E1E2 /)x(
1E1E3 /)x(
2E2E4 /)x(
2E2E5 /)x(
ii CC1 /)x(
ii CC2 /)x(
ii CC3 /)x(
CiCi4 /)x(
CiCi5 /)x(
1. RMNA 2. RMCE 3. RMEC
Expression of each clone (gene) across 23 conditions

A Quantitative Overview to Gene Expression Profiling in Animal Genetics
Armidale Animal Breeding Summer Course, UNE, Feb. 2006
Co-ExpressionMethods
Nine Methods of Data Normalization
Expression of each clone (gene) across 23 conditions

A Quantitative Overview to Gene Expression Profiling in Animal Genetics
Armidale Animal Breeding Summer Course, UNE, Feb. 2006
Co-ExpressionMethods
Nine Methods of Data Normalization
Expression of each clone (gene) across 23 conditions

A Quantitative Overview to Gene Expression Profiling in Animal Genetics
Armidale Animal Breeding Summer Course, UNE, Feb. 2006
Co-ExpressionMethods
Nine Methods of Data Normalization
Expression of each clone (gene) across 23 conditions
93.142.960.8
55.180.900.10

A Quantitative Overview to Gene Expression Profiling in Animal Genetics
Armidale Animal Breeding Summer Course, UNE, Feb. 2006
Co-ExpressionMethods
Nine Methods of Data Normalization
Expression of each clone (gene) across 23 conditions
17.232.960.8
95.145.900.10
A Quantitative Overview to Gene Expression Profiling in Animal Genetics
Armidale Animal Breeding Summer Course, UNE, Feb. 2006
Co-ExpressionMethods
Nine Methods of Data Normalization
Expression of each clone (gene) across 23 conditions
Expected to be the equal!

A Quantitative Overview to Gene Expression Profiling in Animal Genetics
Armidale Animal Breeding Summer Course, UNE, Feb. 2006
Co-ExpressionMethods
Nine Methods of Data Normalization
eTv
Ta
Ta
Tg VVDDAAGGXMVNY ,~
Log2Intensities
Comparison GroupArray|Block|Dye
(FIXED)Main GeneEffect(RANDOM)
Gene xVariety(RANDOM)
Residual(RANDOM)
DE GenesGene x
Array|Block(RANDOM)
Gene x Dye(RANDOM)
Mixed-Model Equations

A Quantitative Overview to Gene Expression Profiling in Animal Genetics
Armidale Animal Breeding Summer Course, UNE, Feb. 2006
Co-ExpressionMethods
Nine Methods of Data Normalization
4. MM1NA 5. MM1CE 6. MM1EC
7. MM5NA 8. MM5CE 9. MM5EC

A Quantitative Overview to Gene Expression Profiling in Animal Genetics
Armidale Animal Breeding Summer Course, UNE, Feb. 2006
Co-ExpressionMethods
Nine Methods of Data Normalization
4. MM1NA 5. MM1CE 6. MM1EC
7. MM5NA 8. MM5CE 9. MM5EC
ct̂E
Ecc
/
ˆ t
c
cEc
/
ˆ t
cEt̂
Vector of BLUPClone x Condition
Interaction
E
EccE
/
ˆ t
c
cEcE
/
ˆ t

A Quantitative Overview to Gene Expression Profiling in Animal Genetics
Armidale Animal Breeding Summer Course, UNE, Feb. 2006
Co-Expression
Observed (RED) vs Expected (BLUE)Results

A Quantitative Overview to Gene Expression Profiling in Animal Genetics
Armidale Animal Breeding Summer Course, UNE, Feb. 2006
Co-ExpressionResults
Average across all pair-wise gene correlations (bold, italics and on the diagonal); Correlation of correlations (above diagonal); and
maximum absolute discrepancy between methods (below diagonal)
1 2 3 4 5 6 7 8 9
1. RMNA 0.53 0.20 0.98 0.11 0.12 0.11 0.06 0.07 0.06
2. RMCE 1.84 0.15 0.21 0.14 0.14 0.14 0.09 0.10 0.09
3. RMEC 0.76 1.79 0.51 0.12 0.12 0.12 0.07 0.07 0.07
4. MM1NA 1.78 1.72 1.74 0.02 0.94 0.99 0.57 0.60 0.56
5. MM1CE 1.75 1.75 1.74 0.51 0.01 0.94 0.61 0.69 0.61
6. MM1EC 1.79 1.71 1.74 0.50 0.55 0.02 0.57 0.61 0.58
7. MM5NA 1.80 1.75 1.79 1.25 1.14 1.21 0.01 0.91 0.99
8. MM5CE 1.78 1.74 1.77 1.19 1.09 1.19 0.59 0.01 0.90
9. MM5EC 1.80 1.75 1.79 1.25 1.13 1.20 0.55 0.66 0.01

A Quantitative Overview to Gene Expression Profiling in Animal Genetics
Armidale Animal Breeding Summer Course, UNE, Feb. 2006
Co-ExpressionResults
Redundant genes (ie. those with many probes on the array) allow for Validation

A Quantitative Overview to Gene Expression Profiling in Animal Genetics
Armidale Animal Breeding Summer Course, UNE, Feb. 2006
Co-ExpressionResults Redundant genes allow for Validation

A Quantitative Overview to Gene Expression Profiling in Animal Genetics
Armidale Animal Breeding Summer Course, UNE, Feb. 2006
Co-ExpressionResults
624
Ge
ne
Co
-Exp
ress
ion
(Alp
ha
betic
al o
rder
)
Robisomal Proteins
A Quantitative Overview to Gene Expression Profiling in Animal Genetics
Armidale Animal Breeding Summer Course, UNE, Feb. 2006
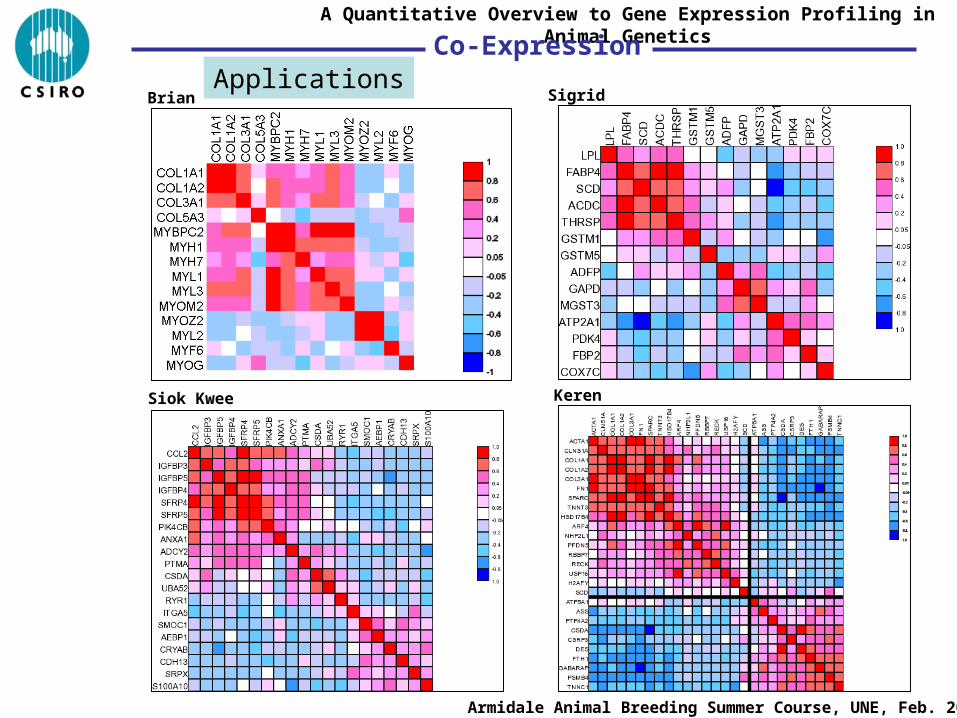
Co-Expression
Brian Sigrid
Siok Kwee Keren
Applications

A Quantitative Overview to Gene Expression Profiling in Animal Genetics
Armidale Animal Breeding Summer Course, UNE, Feb. 2006
Co-ExpressionApplications
False Discovery Rate as a Function of Correlation

A Quantitative Overview to Gene Expression Profiling in Animal Genetics
Armidale Animal Breeding Summer Course, UNE, Feb. 2006
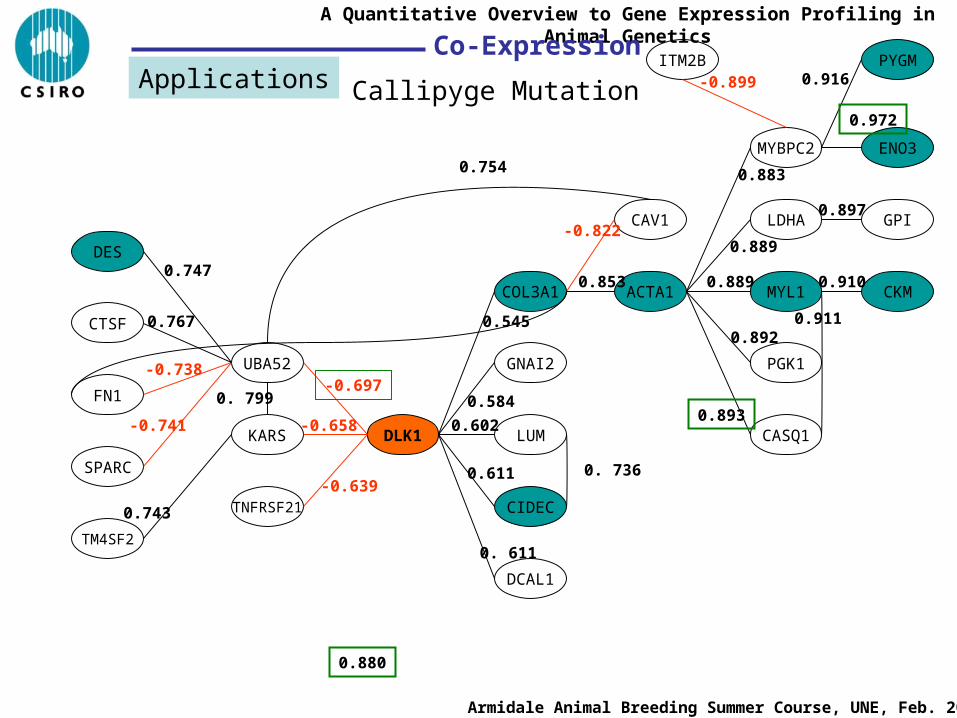
Co-ExpressionApplications
DLK1
COL3A1
LUM
GNAI2
DCAL1
CIDEC
KARS
UBA52
TNFRSF21
0.584
0.602
0.611
0. 611
0.545
-0.639
-0.658
-0.697
Callipyge Mutation

A Quantitative Overview to Gene Expression Profiling in Animal Genetics
Armidale Animal Breeding Summer Course, UNE, Feb. 2006
Co-ExpressionApplications
DLK1
COL3A1
LUM
GNAI2
DCAL1
CIDEC
KARS
UBA52
TNFRSF21
DES
FN1
CTSF
SPARC
CAV1
ACTA1
TM4SF2
0.853
0.880
0.584
0.602
0.611 0. 736
0. 611
0.545
-0.639
-0.658
-0.697
-0.822
0.754
0.747
0.767
0.743
-0.741
-0.738
0. 799
Callipyge Mutation

A Quantitative Overview to Gene Expression Profiling in Animal Genetics
Armidale Animal Breeding Summer Course, UNE, Feb. 2006
Co-ExpressionApplications
DLK1
COL3A1
LUM
GNAI2
DCAL1
CIDEC
KARS
UBA52
TNFRSF21
DES
FN1
CTSF
SPARC
CAV1
ACTA1
TM4SF2
MYBPC2
MYL1
LDHA
PGK1
CASQ1
0.883
0.889
0.889
0.892
0.893
0.853
0.880
0.584
0.602
0.611 0. 736
0. 611
0.545
-0.639
-0.658
-0.697
-0.822
0.754
0.747
0.767
0.743
-0.741
-0.738
0. 799
Callipyge Mutation
A Quantitative Overview to Gene Expression Profiling in Animal Genetics
Armidale Animal Breeding Summer Course, UNE, Feb. 2006
Co-ExpressionApplications
DLK1
COL3A1
LUM
GNAI2
DCAL1
CIDEC
KARS
UBA52
TNFRSF21
DES
FN1
CTSF
SPARC
CAV1
ACTA1
TM4SF2
MYBPC2
MYL1
LDHA
PGK1
CASQ1
0.883
0.889
0.889
0.892
0.893
0.853
0.880
0.584
0.602
0.611 0. 736
0. 611
0.545
-0.639
-0.658
-0.697
-0.822
0.754
0.747
0.767
0.743
-0.741
-0.738
0. 799
0.911
ITM2B
ENO3
PYGM-0.899 0.916
0.972
GPI0.897
CKM0.910
Callipyge Mutation
Related Documents