THETA: The Higher Education Technology Agenda. Hobart: 7-10 April 2013 1 A qualitative analysis of an LMS usage by staff Kevin Ashford-Rowe and Claire Sinsua Introduction The Learning Management System (LMS) has emerged as one of the preferred information and communication technology solutions by which the higher education sector seeks to manage and support the learning experience that it provides to its students. It has also become an increasingly valuable tool which has the ability to record and capture data about users, unlocking the unprecedented potential of data captured for informed decision making and evidence- based strategies. Present literature illustrates a growing interest and increased use of analytics within the LMS to support and enhance the quality of learning and teaching; however, much of the focus has been on student learning and engagement. While educators can greatly benefit from data on learners, there is also a potential value in exploring and understanding the usage and engagement from the teaching staff perspective, as they are the key technological interfaces in the education institutions (Noeth & Volkov, 2004) who provide access to virtual learning content and support to students as part of the enhanced overall student learning experience. In 2008, the Learning Management System (LMS) Usage Framework was conceived by Griffith University and the University of Western Sydney as a joint initiative to undertake a benchmarking exercise to measure the level of uptake of the LMS and the associated tools at both universities This project and its outcomes were reported at ASCILITE 2009; Benchmarking across universities: A framework for LMS analysis (Rankine, Stevenson, Malfroy, Ashford-Rowe). This framework was a dynamic process model designed to define, describe and measure elements common to the online courses at given points in time, which enabled the selection of data according to specified criteria. Its principal elements were Content, Communication, Collaboration, Assessment, and Explicit Learner Support. Each element was then further broken into subcategories with respect to the use of particular online tools and educational content. Since 2008, and in collaboration with Educational Designers embedded within the academic community known at Griffith as Blended Learning Advisors, the framework that was developed in 2008 has undergone an evolutionary transformation to better fit and reflect the current Griffith learning and teaching context. However, its principal pedagogical delivery elements remain as Content, Communication, Collaboration, Assessment, and Explicit Learner Support , noting that each element is further broken into subcategories, which contain data on the use of particular online tools and educational content. In 2011/12 Griffith University initiated a further project, based upon this work, the purpose of which was to measure the level of academic uptake of the LMS. The revised LMS Usage Framework was adopted to develop algorithms capturing the relevant LMS data. This quantitative data was then analysed to measure the level of academic uptake and usage of the tools within the LMS. The data was structured to enable analysis at a range of academic grouping levels (Faculty/Department/School etc.) as well as to illustrate the overall performance of the respective academic element in terms of uptake and usage of technology tools in education delivery. This data extracted provided new and useful insights on the LMS tools usage patterns. This particularly activity was conducted as an exploratory study aimed at building on the previous work in this area, as noted above. However, it also unearthed new possibilities in the gathering and analysis of the LMS data to assist academic teachers, their managers and those administrators tasked with supporting academic professional development, in particular where it relates to evaluating the effectiveness of technological applications and strategies implemented to support an enhanced student learning experience and achievement.

Welcome message from author
This document is posted to help you gain knowledge. Please leave a comment to let me know what you think about it! Share it to your friends and learn new things together.
Transcript
THETA: The Higher Education Technology Agenda. Hobart: 7-10 April 2013 1
A qualitative analysis of an LMS usage by staff
Kevin Ashford-Rowe and Claire Sinsua
Introduction
The Learning Management System (LMS) has emerged as one of the preferred information and
communication technology solutions by which the higher education sector seeks to manage and support
the learning experience that it provides to its students. It has also become an increasingly valuable tool
which has the ability to record and capture data about users, unlocking the unprecedented potential of data
captured for informed decision making and evidence- based strategies.
Present literature illustrates a growing interest and increased use of analytics within the LMS to support
and enhance the quality of learning and teaching; however, much of the focus has been on student
learning and engagement. While educators can greatly benefit from data on learners, there is also a
potential value in exploring and understanding the usage and engagement from the teaching staff
perspective, as they are the key technological interfaces in the education institutions (Noeth & Volkov,
2004) who provide access to virtual learning content and support to students as part of the enhanced
overall student learning experience.
In 2008, the Learning Management System (LMS) Usage Framework was conceived by Griffith
University and the University of Western Sydney as a joint initiative to undertake a benchmarking
exercise to measure the level of uptake of the LMS and the associated tools at both universities This
project and its outcomes were reported at ASCILITE 2009; Benchmarking across universities: A
framework for LMS analysis (Rankine, Stevenson, Malfroy, Ashford-Rowe). This framework was a
dynamic process model designed to define, describe and measure elements common to the online courses
at given points in time, which enabled the selection of data according to specified criteria. Its principal
elements were Content, Communication, Collaboration, Assessment, and Explicit Learner Support. Each
element was then further broken into subcategories with respect to the use of particular online tools and
educational content.
Since 2008, and in collaboration with Educational Designers embedded within the academic community
known at Griffith as Blended Learning Advisors, the framework that was developed in 2008 has
undergone an evolutionary transformation to better fit and reflect the current Griffith learning and
teaching context. However, its principal pedagogical delivery elements remain as Content,
Communication, Collaboration, Assessment, and Explicit Learner Support, noting that each element is
further broken into subcategories, which contain data on the use of particular online tools and educational
content.
In 2011/12 Griffith University initiated a further project, based upon this work, the purpose of which was
to measure the level of academic uptake of the LMS. The revised LMS Usage Framework was adopted to
develop algorithms capturing the relevant LMS data. This quantitative data was then analysed to measure
the level of academic uptake and usage of the tools within the LMS. The data was structured to enable
analysis at a range of academic grouping levels (Faculty/Department/School etc.) as well as to illustrate
the overall performance of the respective academic element in terms of uptake and usage of technology
tools in education delivery.
This data extracted provided new and useful insights on the LMS tools usage patterns. This particularly
activity was conducted as an exploratory study aimed at building on the previous work in this area, as
noted above. However, it also unearthed new possibilities in the gathering and analysis of the LMS data
to assist academic teachers, their managers and those administrators tasked with supporting academic
professional development, in particular where it relates to evaluating the effectiveness of technological
applications and strategies implemented to support an enhanced student learning experience and
achievement.
THETA: The Higher Education Technology Agenda. Hobart: 7-10 April 2013 2
Project Outline
The project was conducted over a number of stages, the first of which ensured the redevelopment of the
original 2008 framework and the review of the methodology used. This activity enabled the enhancement
of the audit tool to improve its accuracy in capturing the data, as well the development of a more
sophisticated reporting tool that could be used by stakeholders to enable data-driven decision making to
enhance and optimise the University’s LMS usage for learning and teaching.
Project Findings
Whilst it is noted that a large amount of detailed LMS activity information was found to be available from
this audit activity, this paper provides analysis of only a small selection of the data, in particular that
which focussed upon a whole of a specific academic grouping level. Thus this paper reports on the overall
usage of the LMS by features and academic grouping for the periods Semesters 1 and 2, from 2008 until
2011. (The analysis was conducted with data current as of 10 August 2011). It should be noted, however,
that the intention of this paper is not to provide specific data upon the current level of performance of a
particular university but to establish the principle that it is possible to determine such information from
the currently available LMS. In this respect, the data provided within this paper has been amended to
ensure that it is cannot be used to make any specific determinations as to the level of performance of any
particular university.
THETA: The Higher Education Technology Agenda. Hobart: 7-10 April 2013 3
Total Usable Course Sites
Generally, all courses at many universities are automatically provided with their own Learning
Management System (LMS) sites each semester. However, in the context of this project only a
proportion of these sites were what the project defined as ‘Usable Course Sites’ (the term ‘Usable Course
Sites’ refers to sites within the LMS which are populated with instructors and enrolled students, thus it is
considered that these sites are ready to be used by instructors to develop and manage online learning
resources and activities).
To identify these sites the following approach was applied:
Exclude joined course sites: where multiple course sites have been merged into a single/primary
course site. For example course that are offered across multiple campuses are merged into the
primary Course Site. This step is taken to avoid replication of results.
Exclude course sites where there are no students enrolled.
Exclude course sites where there are no instructors assigned to teach that specific course.
Although the Joined Course Sites are excluded from the analysis, it is important to note that this may
affect the number of created Usable Course Sites. From time to time, academics may merge or combine
multiple course sites into a single/primary course site of the same course and/or if the learning content
and materials for these courses are identical. This can be helpful if academics teach cross-campus courses
as it allows them to manage all learning materials and activities on one course site.
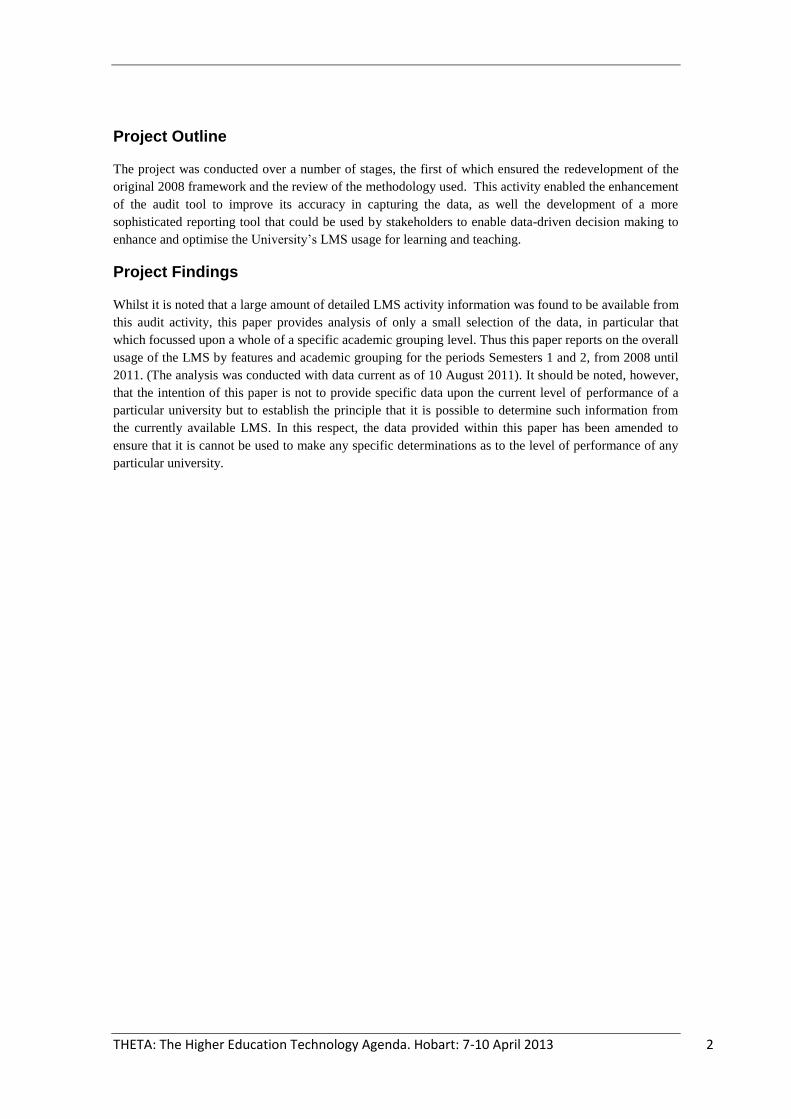
Of the four academic groupings reviewed in this instance, be it at the Faculty, School or Departmental
level the data suggests that Grouping 1 had the largest number of LMS sites, accounting for nearly half of
the overall total of Usable course sites whereas the Grouping 3 and 4 had the smallest number of course
sites (see Figure 1). This of course needs to take into account the relative size of each of the academic
groupings being considered.
Figure 1: The above graph demonstrates the potential user groups of the LMS from within the academic
community by specific academic grouping from 2008-2011 (averaged).
47%
16%
19%
19%
Total Average of Usable Course Sites by Academic Faculty/Department/School etc Academic
Grouping
Grouping One
Grouping Two
Grouping Three
Grouping Four
THETA: The Higher Education Technology Agenda. Hobart: 7-10 April 2013 4
Overall usage of the total Usable Course Sites
Whilst the Usable Course Sites were provided as a resource to all academic staff as a means for
distributing and managing learning materials and activities, only proportion of these sites are actually
used.
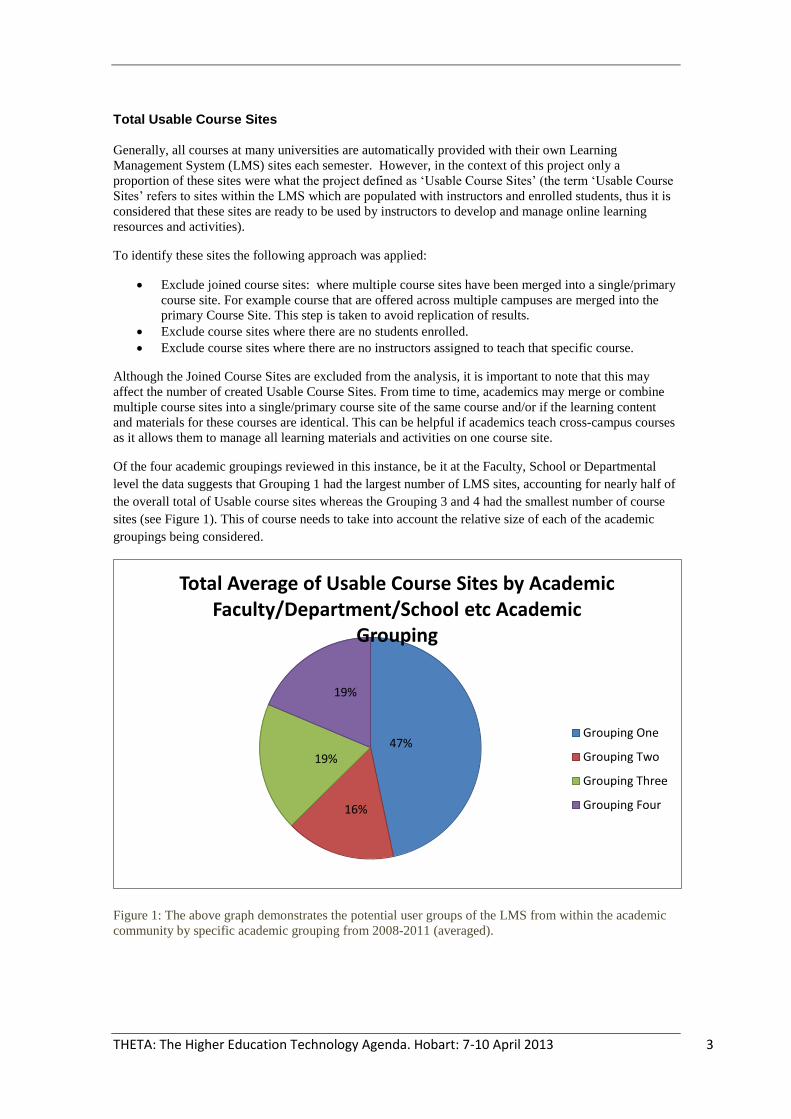
The following graph and accompanying table (Figure 2 and Table 2) show the percentage of course sites
in each group that are actually being used. These figures were obtained by dividing the total number of
identified Active Course Sites by the total number of the Usable Course Sites in each group. The term
Active Course Site is defined as one that contained more than a course outline/profile indicating effort
made by the academic staff to develop their course sites.
The following sections provides an overview of the degree of LMS tools usage within the Active Course
Sites and may provide some insight as to which aspects of the features were well used and which were
not.
Figure 2: The percentage of courses each semester with active LMS sites from 2008 to 2011.
Study Period
S1-08 S2-08 S1-09 S2-09 S1-10 S2-10 S1-11
Grouping One 73% 67% 68% 64% 65% 64% 67%
Grouping Two 93% 94% 96% 95% 94% 97% 95%
Grouping
Three 74% 80% 72% 73% 90% 79% 75%
Grouping Four 70% 69% 73% 75% 73% 76% 77%
Table 2: Shows the total percentage of Active Course Sites in relation to Usable Course Sites within the
academic community from 2008 to 2011.
0
20
40
60
80
100
120
S1-08 S2-08 S1-09 S2-09 S1-10 S2-10 S1-11
Overall % of Active Course Sites by Grouping
Grouping One
Grouping Two
Grouping Three
Grouping Four
THETA: The Higher Education Technology Agenda. Hobart: 7-10 April 2013 5
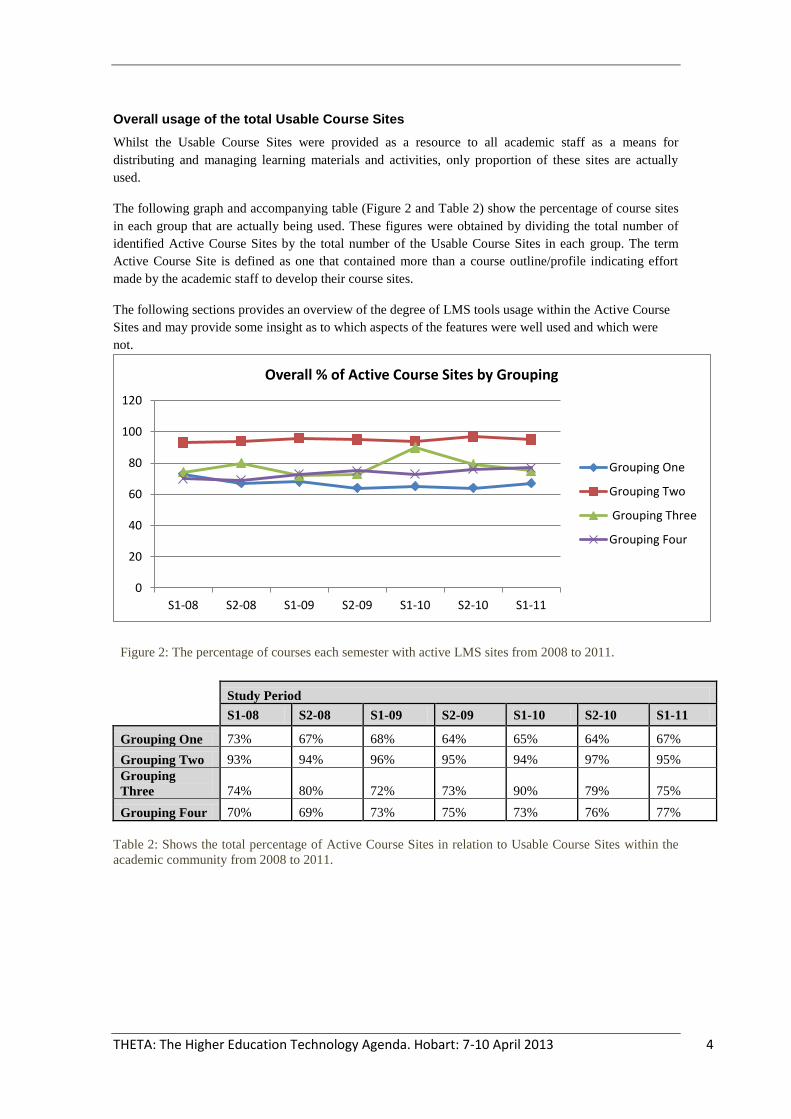
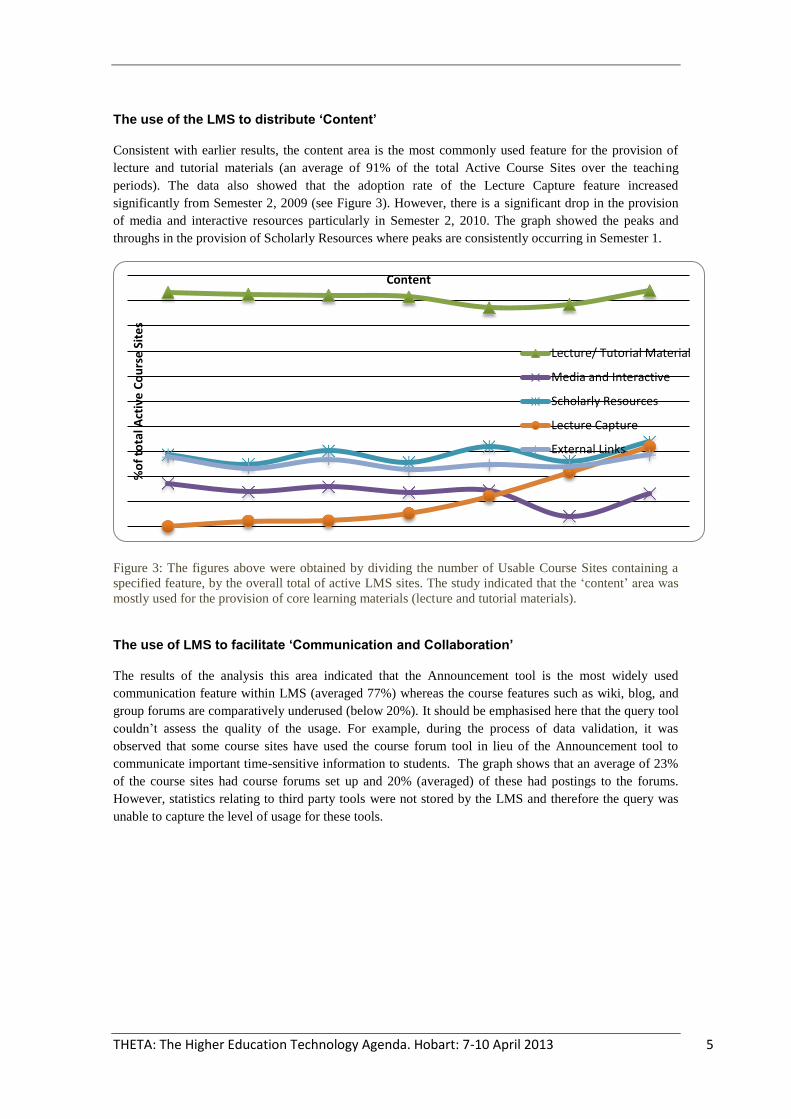
The use of the LMS to distribute ‘Content’
Consistent with earlier results, the content area is the most commonly used feature for the provision of
lecture and tutorial materials (an average of 91% of the total Active Course Sites over the teaching
periods). The data also showed that the adoption rate of the Lecture Capture feature increased
significantly from Semester 2, 2009 (see Figure 3). However, there is a significant drop in the provision
of media and interactive resources particularly in Semester 2, 2010. The graph showed the peaks and
throughs in the provision of Scholarly Resources where peaks are consistently occurring in Semester 1.
Figure 3: The figures above were obtained by dividing the number of Usable Course Sites containing a
specified feature, by the overall total of active LMS sites. The study indicated that the ‘content’ area was
mostly used for the provision of core learning materials (lecture and tutorial materials).
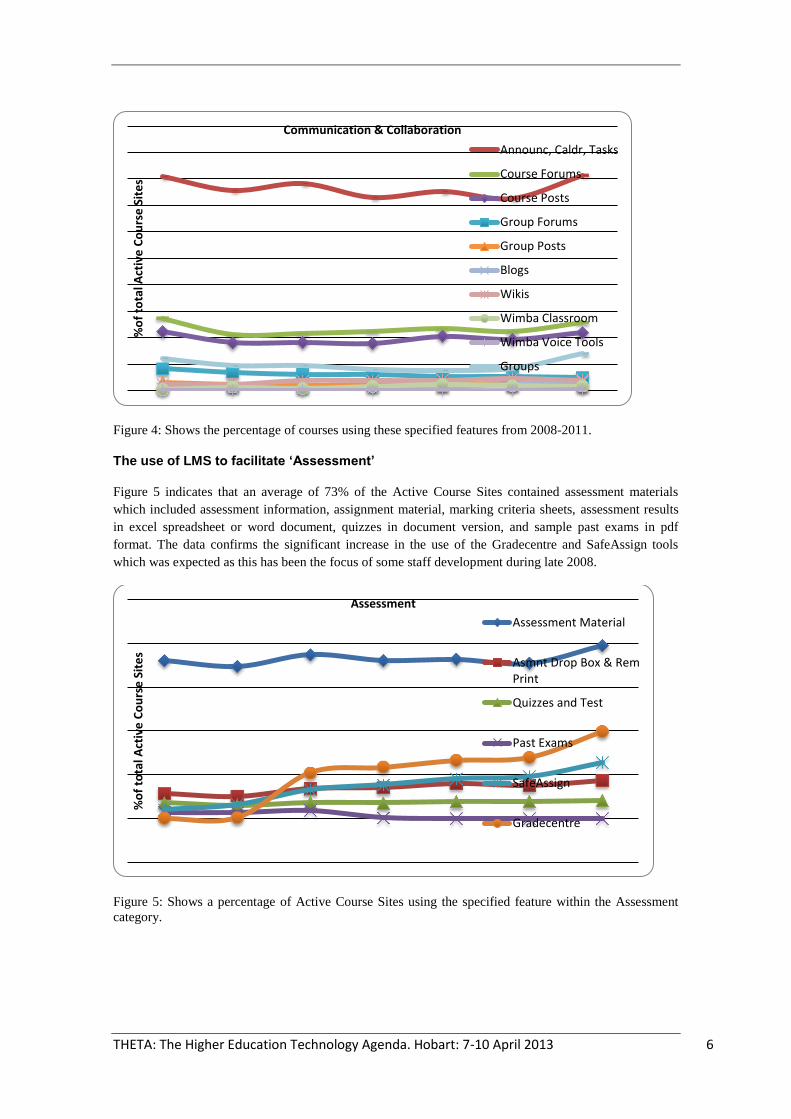
The use of LMS to facilitate ‘Communication and Collaboration’
The results of the analysis this area indicated that the Announcement tool is the most widely used
communication feature within LMS (averaged 77%) whereas the course features such as wiki, blog, and
group forums are comparatively underused (below 20%). It should be emphasised here that the query tool
couldn’t assess the quality of the usage. For example, during the process of data validation, it was
observed that some course sites have used the course forum tool in lieu of the Announcement tool to
communicate important time-sensitive information to students. The graph shows that an average of 23%
of the course sites had course forums set up and 20% (averaged) of these had postings to the forums.
However, statistics relating to third party tools were not stored by the LMS and therefore the query was
unable to capture the level of usage for these tools.
%o
f to
tal A
ctiv
e C
ou
rse
Sit
es
Content
Lecture/ Tutorial Material
Media and Interactive
Scholarly Resources
Lecture Capture
External Links
THETA: The Higher Education Technology Agenda. Hobart: 7-10 April 2013 6
Figure 4: Shows the percentage of courses using these specified features from 2008-2011.
The use of LMS to facilitate ‘Assessment’
Figure 5 indicates that an average of 73% of the Active Course Sites contained assessment materials
which included assessment information, assignment material, marking criteria sheets, assessment results
in excel spreadsheet or word document, quizzes in document version, and sample past exams in pdf
format. The data confirms the significant increase in the use of the Gradecentre and SafeAssign tools
which was expected as this has been the focus of some staff development during late 2008.
Figure 5: Shows a percentage of Active Course Sites using the specified feature within the Assessment
category.
%o
f to
tal A
ctiv
e C
ou
rse
Sit
es
Communication & Collaboration
Announc, Caldr, Tasks
Course Forums
Course Posts
Group Forums
Group Posts
Blogs
Wikis
Wimba Classroom
Wimba Voice Tools
Groups
%o
f to
tal A
ctiv
e C
ou
rse
Sit
es
Assessment
Assessment Material
Asmnt Drop Box & RemPrint
Quizzes and Test
Past Exams
SafeAssign
Gradecentre
THETA: The Higher Education Technology Agenda. Hobart: 7-10 April 2013 7
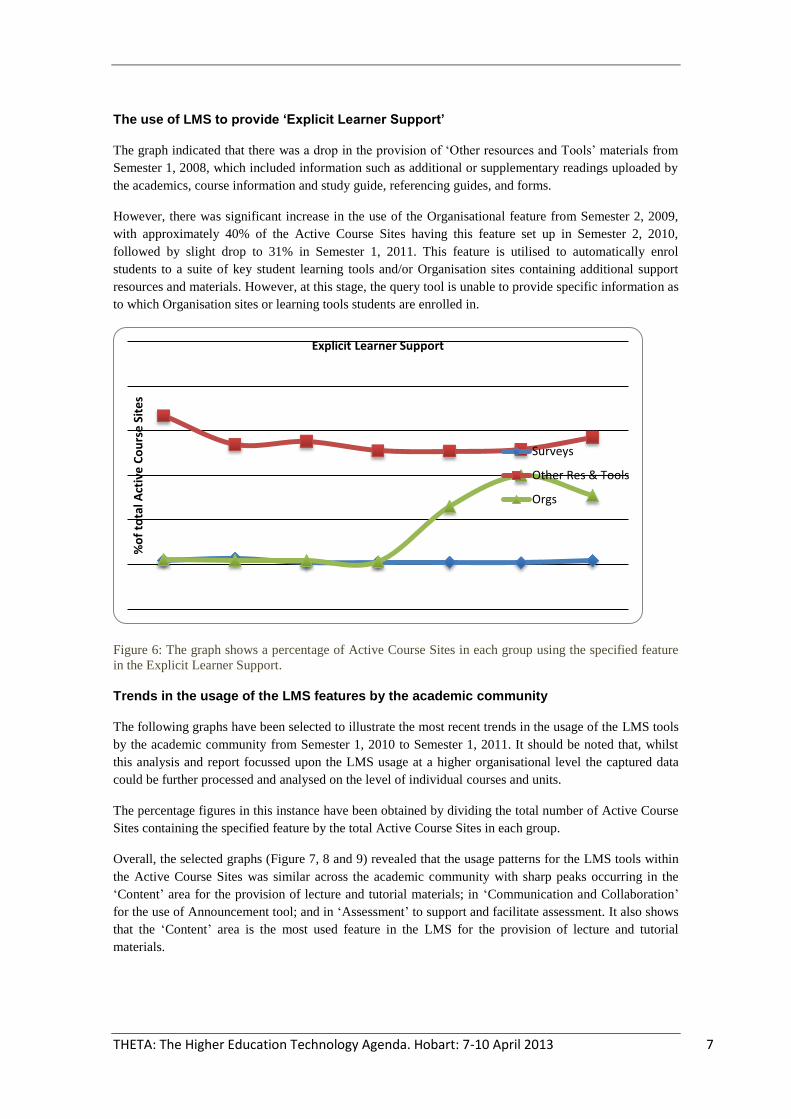
The use of LMS to provide ‘Explicit Learner Support’
The graph indicated that there was a drop in the provision of ‘Other resources and Tools’ materials from
Semester 1, 2008, which included information such as additional or supplementary readings uploaded by
the academics, course information and study guide, referencing guides, and forms.
However, there was significant increase in the use of the Organisational feature from Semester 2, 2009,
with approximately 40% of the Active Course Sites having this feature set up in Semester 2, 2010,
followed by slight drop to 31% in Semester 1, 2011. This feature is utilised to automatically enrol
students to a suite of key student learning tools and/or Organisation sites containing additional support
resources and materials. However, at this stage, the query tool is unable to provide specific information as
to which Organisation sites or learning tools students are enrolled in.
Figure 6: The graph shows a percentage of Active Course Sites in each group using the specified feature
in the Explicit Learner Support.
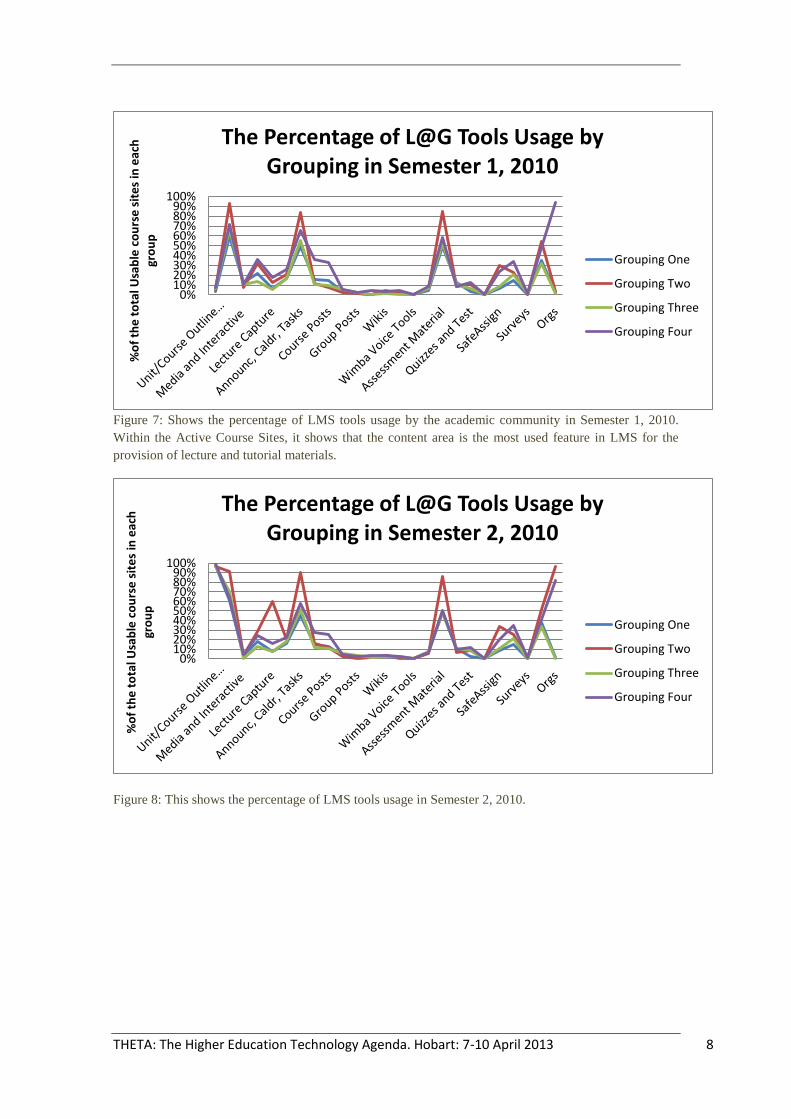
Trends in the usage of the LMS features by the academic community
The following graphs have been selected to illustrate the most recent trends in the usage of the LMS tools
by the academic community from Semester 1, 2010 to Semester 1, 2011. It should be noted that, whilst
this analysis and report focussed upon the LMS usage at a higher organisational level the captured data
could be further processed and analysed on the level of individual courses and units.
The percentage figures in this instance have been obtained by dividing the total number of Active Course
Sites containing the specified feature by the total Active Course Sites in each group.
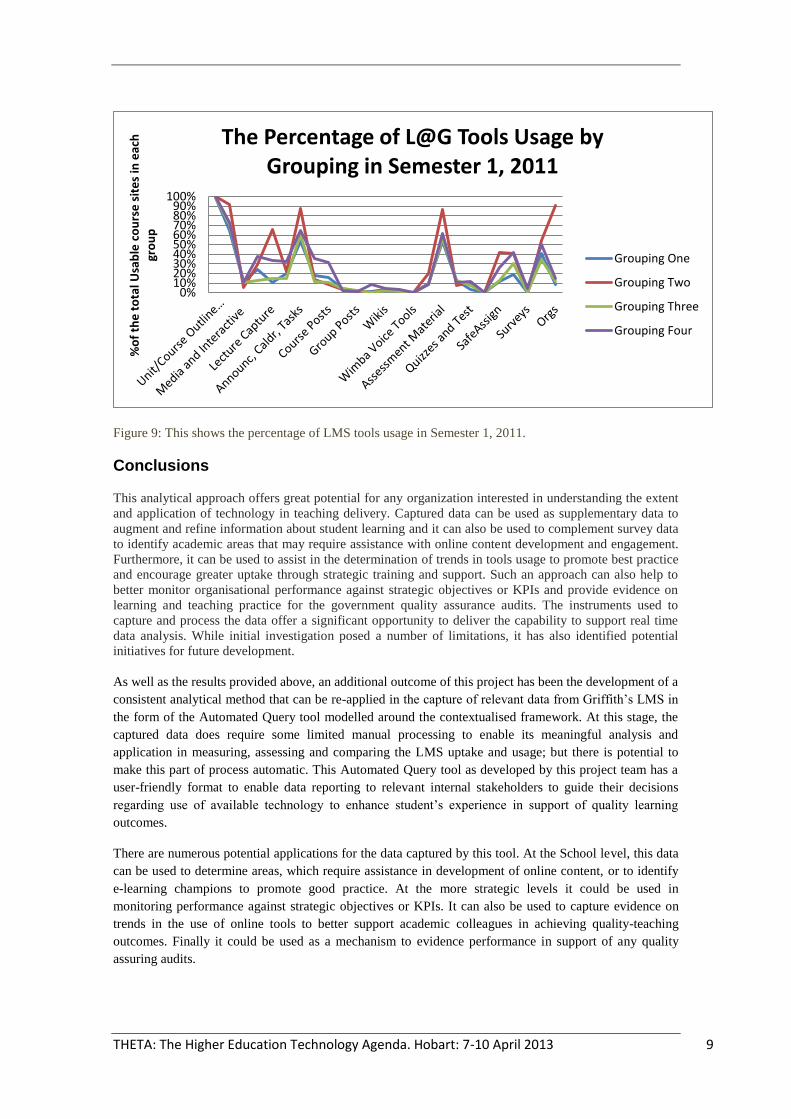
Overall, the selected graphs (Figure 7, 8 and 9) revealed that the usage patterns for the LMS tools within
the Active Course Sites was similar across the academic community with sharp peaks occurring in the
‘Content’ area for the provision of lecture and tutorial materials; in ‘Communication and Collaboration’
for the use of Announcement tool; and in ‘Assessment’ to support and facilitate assessment. It also shows
that the ‘Content’ area is the most used feature in the LMS for the provision of lecture and tutorial
materials.
%o
f to
tal A
ctiv
e C
ou
rse
Sit
es
Explicit Learner Support
Surveys
Other Res & Tools
Orgs
THETA: The Higher Education Technology Agenda. Hobart: 7-10 April 2013 8
Figure 7: Shows the percentage of LMS tools usage by the academic community in Semester 1, 2010.
Within the Active Course Sites, it shows that the content area is the most used feature in LMS for the
provision of lecture and tutorial materials.
Figure 8: This shows the percentage of LMS tools usage in Semester 2, 2010.
0%10%20%30%40%50%60%70%80%90%
100%
%o
f th
e t
ota
l Usa
ble
co
urs
e s
ite
s in
eac
h
gro
up
The Percentage of L@G Tools Usage by
Grouping in Semester 1, 2010
Grouping One
Grouping Two
Grouping Three
Grouping Four
0%10%20%30%40%50%60%70%80%90%
100%
%o
f th
e t
ota
l Usa
ble
co
urs
e s
ite
s in
eac
h
gro
up
The Percentage of L@G Tools Usage by Grouping in Semester 2, 2010
Grouping One
Grouping Two
Grouping Three
Grouping Four
THETA: The Higher Education Technology Agenda. Hobart: 7-10 April 2013 9
Figure 9: This shows the percentage of LMS tools usage in Semester 1, 2011.
Conclusions
This analytical approach offers great potential for any organization interested in understanding the extent
and application of technology in teaching delivery. Captured data can be used as supplementary data to
augment and refine information about student learning and it can also be used to complement survey data
to identify academic areas that may require assistance with online content development and engagement.
Furthermore, it can be used to assist in the determination of trends in tools usage to promote best practice
and encourage greater uptake through strategic training and support. Such an approach can also help to
better monitor organisational performance against strategic objectives or KPIs and provide evidence on
learning and teaching practice for the government quality assurance audits. The instruments used to
capture and process the data offer a significant opportunity to deliver the capability to support real time
data analysis. While initial investigation posed a number of limitations, it has also identified potential
initiatives for future development.
As well as the results provided above, an additional outcome of this project has been the development of a
consistent analytical method that can be re-applied in the capture of relevant data from Griffith’s LMS in
the form of the Automated Query tool modelled around the contextualised framework. At this stage, the
captured data does require some limited manual processing to enable its meaningful analysis and
application in measuring, assessing and comparing the LMS uptake and usage; but there is potential to
make this part of process automatic. This Automated Query tool as developed by this project team has a
user-friendly format to enable data reporting to relevant internal stakeholders to guide their decisions
regarding use of available technology to enhance student’s experience in support of quality learning
outcomes.
There are numerous potential applications for the data captured by this tool. At the School level, this data
can be used to determine areas, which require assistance in development of online content, or to identify
e-learning champions to promote good practice. At the more strategic levels it could be used in
monitoring performance against strategic objectives or KPIs. It can also be used to capture evidence on
trends in the use of online tools to better support academic colleagues in achieving quality-teaching
outcomes. Finally it could be used as a mechanism to evidence performance in support of any quality
assuring audits.
0%10%20%30%40%50%60%70%80%90%
100%
%o
f th
e t
ota
l Usa
ble
co
urs
e s
ite
s in
eac
h
gro
up
The Percentage of L@G Tools Usage by
Grouping in Semester 1, 2011
Grouping One
Grouping Two
Grouping Three
Grouping Four
THETA: The Higher Education Technology Agenda. Hobart: 7-10 April 2013 10
However, alongside these benefits, are a number of challenges and limitations, which should be
acknowledged. To remain applicable, the framework has to be kept up to date to reflect any changes to
the LMS and available online tools. As the data is recorded in excel spreadsheet format, it requires
manual processing to enable meaningful interpretation, as well as random crosschecking with actual
course sites to assure the accuracy. The inherent limitations of the query mean that captured data will
never be 100% accurate and requires contextual interpretation to be utilised in a meaningful manner.
Nonetheless, the developed framework and the Automated Query tool do present significant opportunities
to assist in better focussing of the range of support services and initiatives that Griffith University
provides in order to improve the student’s access to their virtual learning experience as a part of an
enhanced overall student learning experience at Griffith. Whilst there are a number of limitations, it is
recommended that this tool be used until the adoption of more sophisticated reporting tool, or the further
development of this tool to enable it to reach a higher level of sophistication itself. This approach, as
supported by the data provided by this tool offers a significant opportunity to deliver the capability to
support real time data analysis and present it visually in an interactive format.
References
Rankine, L., Stevenson, L., Malfroy, J. & Ashford-Rowe, K. (2009). Benchmarking across universities: a
framework for LMS analysis. Ascilite Conference ‘Same places, different spaces’ 6-9 December 2009,
Auckland New Zealand.
Noeth, R.J., & Volkov, B.B. (2004). Evaluating the effectiveness of technology in our schools: ACT
Policy Report. Retrieved 02 Jan 2012 from
http://elementarypgms.sp.brevardschools.org/RTI/Documents/MTSS%20-
%20Secondary%20Level/MTSS%20Secondary%20Day%203%20State%20Training/Academic%20Enga
gement/Digital%20Literacy/Resources/Evaluating%20the%20Effectiveness%20of%20Technology%20in
%20Our%20Schools.pdf
Related Documents