A Prototype RF Dosimeter for Independent Measurement of the Average Specific Absorption Rate (SAR) During MRI John P Stralka, MS 1 and Paul A Bottomley, PhD 1,2,* 1Department of Electrical and Computer Engineering, Johns Hopkins University, Baltimore, Maryland, USA 2Division of MR Research, Department of Radiology, Johns Hopkins University, Baltimore, Maryland, USA Abstract Purpose—To develop a scanner-independent dosimeter for measuring the average radio frequency (RF) power deposition and specific absorption rates (SAR) for human MRI exposure. Materials and Methods—A prototype dosimeter has a transducer with orthogonal conducting loops surrounding a small signal-generating MRI sample. The loops contain resistors whose values are adjusted to load the scanner’s MRI coils equivalent to an average head or body during MRI. The scanner adjusts its power output to normal levels during setup, using the MRI sample. Following calibration, the total power and average SAR deposited in the transducer are measured from the root- mean-square (rms) power induced in the transducer during MRI. Results—A 1.5 Tesla head transducer was adjusted to elicit the same load as the average of nine adult volunteers. Once adjusted, the transducer loads other head coils the same as the head does. The dosimeter is calibrated at up to 20 W total deposited power and 4.5 W/kg SAR in the average head, with about 5% accuracy. Conclusion—This dosimeter provides a simple portable means of measuring the power deposited in a body-equivalent sample load, independent of the scanner. Further work will develop SAR dosimetry for the torso and for higher fields. Keywords RF power deposition; safety; specific absorption rate; dosimetry; MRI THERE ARE CURRENTLY over 20,000 MRI scanners performing over 60 million studies world-wide (1). About half of these scans are performed in the United States, where the number of scans has been doubling about every three years for the past decade. In the United States, over one-half of the existing scanners operate at 1.5T (2), while most luminary institutions active in medical imaging research have added 3T MRI systems, and 4T (3) and 7T (4) whole body systems are also commercially available. While MRI is not considered a significant risk (5), it is not hazard-free. The potential for radio frequency (RF) power deposition and heating in human MRI was realized as early as 1978 (6). The mechanism for heating is the induction of eddy currents in the body by the time-dependent RF magnetic field in accordance with Faraday’s Law, due to the finite conductivity of the body. Models comprised of homogeneous cylinders of tissue of measured conductivity and dielectric constant, were solved analytically for various * Address reprint requests to: P.B., Division of MR Research, Department of Radiology, Johns Hopkins University, 601 N Caroline Street Baltimore, Maryland 21287-0843. E-mail: [email protected] NIH Public Access Author Manuscript J Magn Reson Imaging. Author manuscript; available in PMC 2008 November 24. Published in final edited form as: J Magn Reson Imaging. 2007 November ; 26(5): 1296–1302. doi:10.1002/jmri.21141. NIH-PA Author Manuscript NIH-PA Author Manuscript NIH-PA Author Manuscript

Welcome message from author
This document is posted to help you gain knowledge. Please leave a comment to let me know what you think about it! Share it to your friends and learn new things together.
Transcript
A Prototype RF Dosimeter for Independent Measurement of theAverage Specific Absorption Rate (SAR) During MRI
John P Stralka, MS1 and Paul A Bottomley, PhD1,2,*
1Department of Electrical and Computer Engineering, Johns Hopkins University, Baltimore, Maryland, USA
2Division of MR Research, Department of Radiology, Johns Hopkins University, Baltimore, Maryland, USA
AbstractPurpose—To develop a scanner-independent dosimeter for measuring the average radio frequency(RF) power deposition and specific absorption rates (SAR) for human MRI exposure.
Materials and Methods—A prototype dosimeter has a transducer with orthogonal conductingloops surrounding a small signal-generating MRI sample. The loops contain resistors whose valuesare adjusted to load the scanner’s MRI coils equivalent to an average head or body during MRI. Thescanner adjusts its power output to normal levels during setup, using the MRI sample. Followingcalibration, the total power and average SAR deposited in the transducer are measured from the root-mean-square (rms) power induced in the transducer during MRI.
Results—A 1.5 Tesla head transducer was adjusted to elicit the same load as the average of nineadult volunteers. Once adjusted, the transducer loads other head coils the same as the head does. Thedosimeter is calibrated at up to 20 W total deposited power and 4.5 W/kg SAR in the average head,with about 5% accuracy.
Conclusion—This dosimeter provides a simple portable means of measuring the power depositedin a body-equivalent sample load, independent of the scanner. Further work will develop SARdosimetry for the torso and for higher fields.
KeywordsRF power deposition; safety; specific absorption rate; dosimetry; MRI
THERE ARE CURRENTLY over 20,000 MRI scanners performing over 60 million studiesworld-wide (1). About half of these scans are performed in the United States, where the numberof scans has been doubling about every three years for the past decade. In the United States,over one-half of the existing scanners operate at 1.5T (2), while most luminary institutionsactive in medical imaging research have added 3T MRI systems, and 4T (3) and 7T (4) wholebody systems are also commercially available. While MRI is not considered a significant risk(5), it is not hazard-free.
The potential for radio frequency (RF) power deposition and heating in human MRI wasrealized as early as 1978 (6). The mechanism for heating is the induction of eddy currents inthe body by the time-dependent RF magnetic field in accordance with Faraday’s Law, due tothe finite conductivity of the body. Models comprised of homogeneous cylinders of tissue ofmeasured conductivity and dielectric constant, were solved analytically for various
*Address reprint requests to: P.B., Division of MR Research, Department of Radiology, Johns Hopkins University, 601 N Caroline StreetBaltimore, Maryland 21287-0843. E-mail: [email protected]
NIH Public AccessAuthor ManuscriptJ Magn Reson Imaging. Author manuscript; available in PMC 2008 November 24.
Published in final edited form as:J Magn Reson Imaging. 2007 November ; 26(5): 1296–1302. doi:10.1002/jmri.21141.
NIH
-PA Author Manuscript
NIH
-PA Author Manuscript
NIH
-PA Author Manuscript
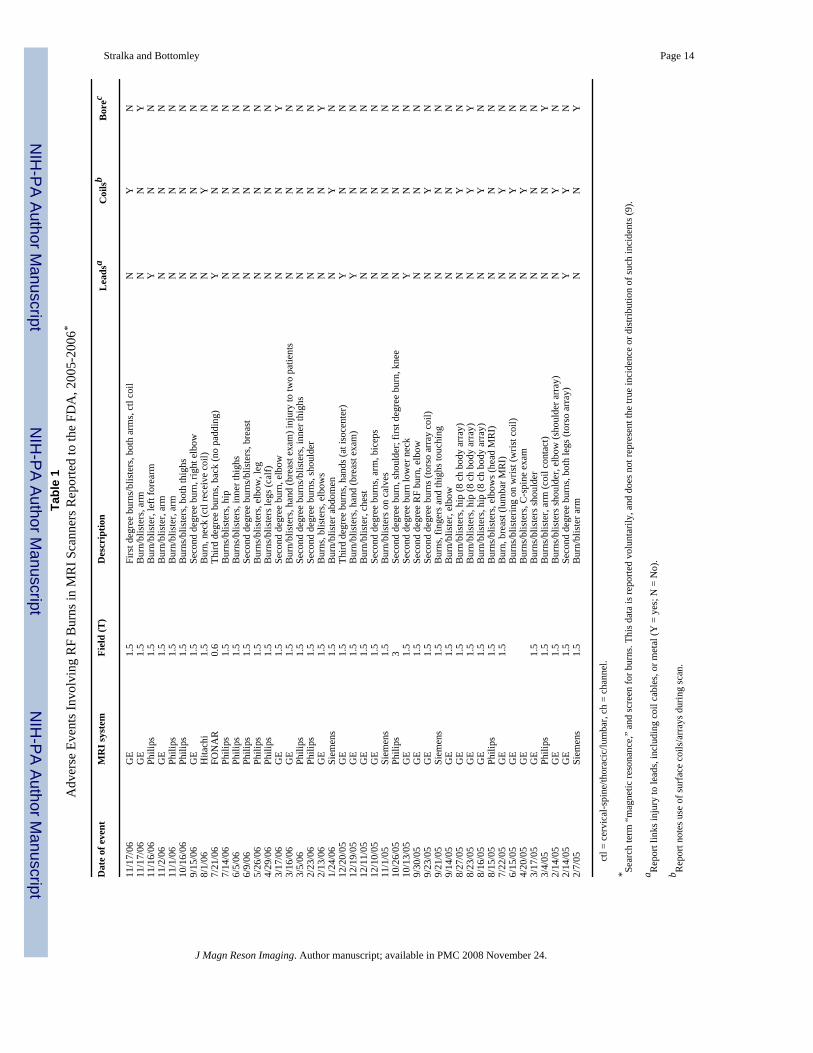
configurations (6-8). The key results were: 1) local peak and average specific power absorptionrates (SARs) in W/kg or W/cm3 can be determined from the known RF pulse width, duty cycle,flip-angle, and sample size using relatively simple formulae (6-8); 2) SAR variesapproximately quadratically with MRI frequency or field strength, and with sample radius atlower frequencies (<100 MHz); and 3) peak SAR is related to the average SAR by simplenumerical factors (7). That excess RF power deposition can cause heating and burns isevidenced by voluntary reports to the U.S. Food and Drug Administration (FDA) of injuriesreceived during clinical MRI, as summarized in Table 1 for 2005 and 2006 (9). Many of theseinjury reports are not linked to patient proximity to leads, metal, separate receiver coils, or themagnet bore, which may pose additional risk.
The safety of RF exposure during clinical MRI is regulated via government and industryguidelines (10,11). RF exposure is also a factor in assessing the safety of MRI in humanresearch overseen by Institutional Review Boards (IRBs). Consequently, accurate RFdosimetry is central to the safe operation of thousands of MRI scanners and millions of humanMRI scans. Indeed, issues relating to SAR are listed among the top three unsolved problemsand unmet needs by each of three study groups of the International Society of MagneticResonance in Medicine (ISMRM) (12), underscoring the need for providing accurate andindependent methods of measuring it. In Europe, the International ElectrotechnicalCommission (IEC) defines the whole-body SAR as the absorbed RF power (PA in Watts)divided by patient mass (m), and the partial body SAR is calculated based on the body massin the coil, which may be modeled by homogeneous cylinders (11). The local SAR in 1 g (9)or 10 g (11) of tissue is determined from experimentally-validated models or by experimentson phantoms (11). For homogeneous cylinders and spheres, the models yield a local SAR twoto four times the average SAR (7). Heterogeneous models with quadrature excitation yieldratios of 4.5-6 for the head at 63-175 MHz (13-15), and 10-16 for male and female torsos at1.5T and 3T (16,17). Thus, once an average SAR is determined via PA/m, a model-based localmaximum can be obtained by simple multiplication by the corresponding model factor, at leastfor the above frequency ranges.
One simple method of measuring SAR that satisfies the IEC guidelines and does not requireMRI parameters, determines PA from the incident (forward minus reflected) root-mean-square(rms) power PI at the transmitter coil, but requires the coil’s quality factors (Q) measured with(QL), and without (QU), the subject load (18,19). The amount of power deposited in the subjectis:
(1)
Although determining these parameters at each exam would provide a straightforwardapproach to measuring SAR, various expediencies are commonly adopted for reporting andlimiting SAR in many commercial clinical MRI scanners. For example, the Qs and PI aregenerally not measured at the coil terminals by the scanner during setup for a patient study,particularly in older scanners. Instead, fixed factory-determined parameters characterizing theselected coil-type are typically entered into scanner configuration files to calculate the SARfor a desired duty cycle, with conservative safety factors added to accommodate variations thatmay occur in the field. These “scanner SAR” values are utilized by the scanner for limitingpulse sequence parameters, and are generally accessible to the MRI operator.
The accuracy with which such “scanner SAR” values measure the true average SAR may becompromised when coil Qs and power losses in the transmit line change with time, and/orwhen such conservative safety factors are introduced into the scanner’s SAR calculation bythe manufacturer. This uncertainty is further compounded by those cases in which RF burnsare sustained by patients undergoing MRI (9,20) (Table 1). Although such cases represent atiny fraction of the millions of clinical MRI scans performed annually, they are evidence that
Stralka and Bottomley Page 2
J Magn Reson Imaging. Author manuscript; available in PMC 2008 November 24.
NIH
-PA Author Manuscript
NIH
-PA Author Manuscript
NIH
-PA Author Manuscript
“scanner SAR” was incorrect, or at least not limiting, at the time of the injury. Thus, theaccuracy of “scanner SARs” reported by MRI scanners today, is a concern, and in any case,the SAR is currently not verifiable independent of the scanner.
Indeed, if one seeks to independently measure deposited power via Eq. [1], access to the coilfor power as well as QL and QU measurements is generally unavailable to scanner users,researchers, or medical physicists running routine checks on clinical units. Further problemsarise with the testing of implanted devices, whose use in patients in need of diagnostic MRIgrows exponentially. Devices that test safe at a specified “scanner SAR” level, may not bereliable if the “scanner SAR” includes unknown factors, or is scanner-dependent, as has beenrecently reported (21,22). A device testing as safe at a “scanner SAR” level of 4 W/kg, forexample, may in fact have only been tested at, say, 2 W/kg if SAR is being conservativelyoverstated. In summary: 1) if patients report burning sensations during MRI (Table 1); or 2) ifinternal device/implant makers wish to determine that their devices are safe at a certain SARexposure level; or 3) if questions arise during IRB assessment concerning the safe conduct ofresearch studies, there are currently no convenient scanner-independent means of determiningwhether the machine is operating within regulatory SAR guidelines, other than performingthermal testing of instrumented phantoms (23).
We propose and demonstrate herein a novel prototype RF dosimeter for measuring averagehead or body SAR, entirely independent of the MRI scanner. Peak SAR can then be determinedfrom average SAR by applying an appropriate model factor as above (7,13-17). The dosimeterhas a transducer that is placed in the magnet during an MRI scan, from which the time-averagedSAR is read. Because the scanner automatically sets the flip-angle based on MRI signal andload, the transducer contains a small signal-generating sample which the scanner uses for setup.The sample is surrounded by resistively-loaded orthogonal conducting loops, such that thetransducer provides a load to the scanner that is equivalent to the head or torso. Such atransducer can also be used for SNR measurements as described previously (24). The time-averaged (rms) RF voltage is measured across the loop loads, from which PA and the equivalentbody or head SAR are determined after calibration.
MATERIALS AND METHODSTransducer
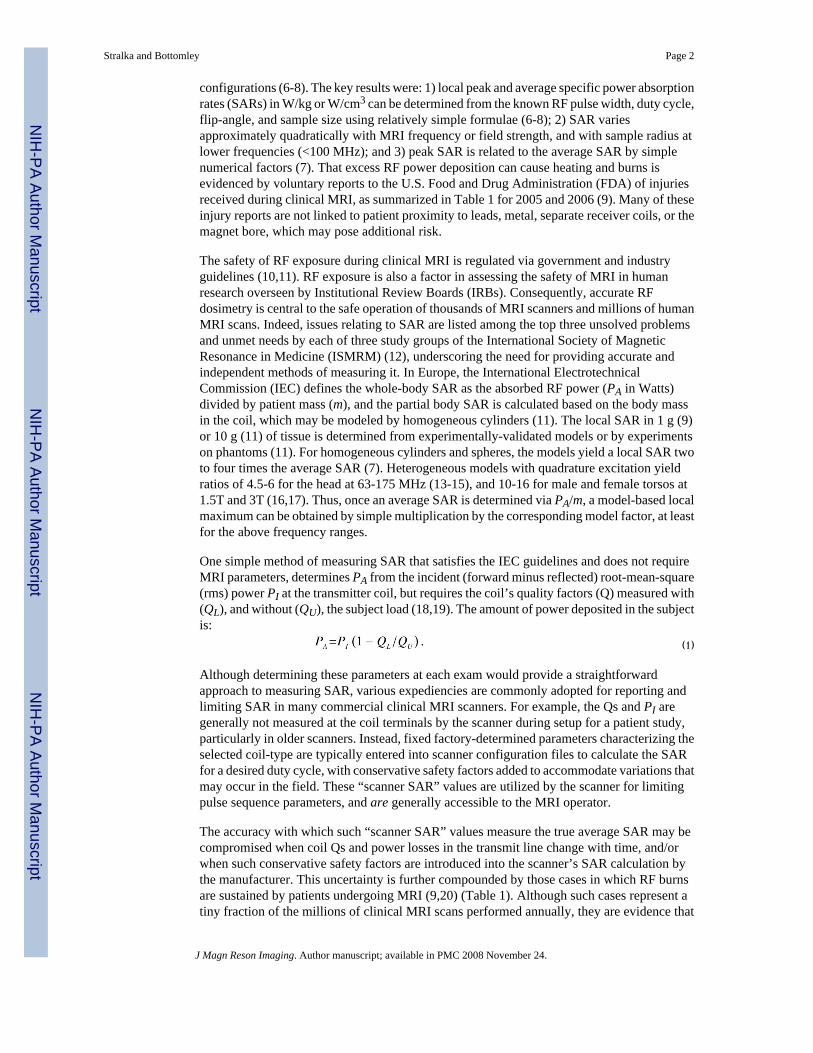
A prototype 1.5T SAR dosimeter transducer that is accommodated in the bore of a head coilfor measuring average head SAR, is fabricated from two 18-cm square copper loops, affixedto acrylic board. The loops are oriented orthogonal to each other to permit detection of bothcomponents of a quadrature excitation field in the XY-plane, should one exist. They are tunedto the 1.5T MRI frequency, and loaded with resistors. The center of each board is removed toaccommodate a small spherical CuSO4-doped water phantom whose only purpose is togenerate just enough MRI signal for the scanner to adjust its pulse power level and/or set upthe pulse sequence flip-angles. The transducer and the circuit formed by each loop areillustrated in Fig. 1.
To determine the value of the total load resistance, RL, for each loop such that the transducerpresents a load equivalent to that of the head to the MRI scanner, QU and QL of a standard GE1.5T Signa MRI quadrature birdcage head-coil are measured with the heads of a number ofvolunteers, and the average head QL is calulated. The head is replaced by the dosimeter’stransducer, and the load resistance on the transducer is adjusted to reproduce the average headQL. Different head coils will, of course, have different Qs, but all that is required is that thetransducer produces the same QL in each head coil that the average head produces. This isexperimentally tested with Q measurements of different head coils. Note that the net load
Stralka and Bottomley Page 3
J Magn Reson Imaging. Author manuscript; available in PMC 2008 November 24.
NIH
-PA Author Manuscript
NIH
-PA Author Manuscript
NIH
-PA Author Manuscript
resistance presented to the head coils by the transducer after calibration of RL is greater thanRL by an amount attributable to the water phantom and other losses in the dosimeter.
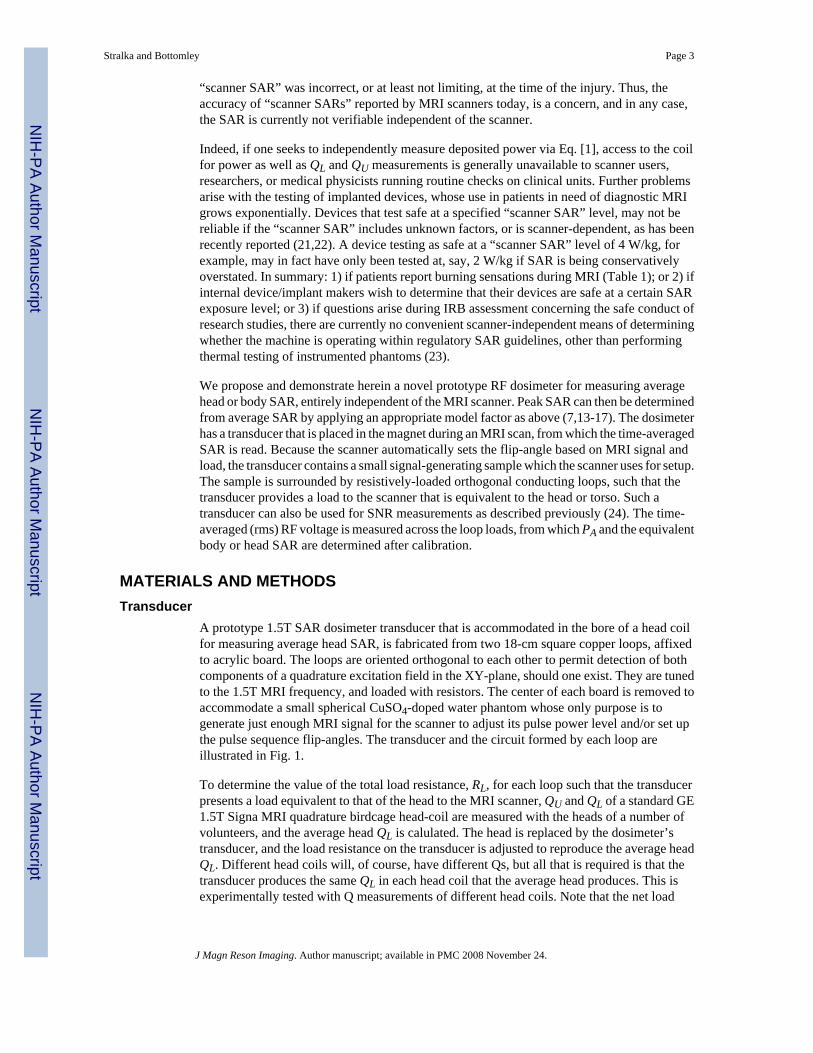
Power MeasurementWith the head-coil connected to the scanner and the transducer inside the MRI coil, an RFvoltage with rms value Vrms, is induced on the transducer during MRI, in direct proportion tothe input RF voltage. This can be measured with an RF oscilloscope, or a true rms RF voltmeteras exemplified in Fig. 2. The power on the head-equivalent transducer measures the total powerin the head after calibration. Indeed, if power losses in the water phantom and monitoring leadsare negligible, the total power deposited in the transducer loops is equal to the power depositedin the head. PA measured in the transducer is proportional to Vrms
2 over the time-course of theMRI experiment.
MRI typically utilizes a pulse sequence that repeats with period TR. This period includes shortperiods (∼1-4 msec) during which one or more type of AM and/or FM modulated high power(≫1 kW peak) RF pulses are applied, separated by longer periods (∼4-1000 msec or more)during which no RF is applied. Thus, determining Vrms will generally involve a measurementof the rms voltage during the ith RF pulse, vi
rms and the duty cycle where τi is the widthof the ith RF pulse. Thus for each loop:
(2)
With the phantom in the middle of the transducer, the total power deposited in the two loopsis:
(3)
where RL is the measured total resistance of each loaded transducer loop at the RF frequency.The average SAR is then just PA/m with m as the average head mass, in accordance with theIEC definitions (11).
However, in most cases it is prudent to calibrate the SAR dosimeter by measuring the powerin the resistive load of each transducer loop as a function of the total power deposited in thedosimeter. Because RL can have a number of values depending on the sample load it is designedto represent, it is convenient for the purpose of calibration to divide the total load resistance,RL, into a smaller standard reference resistor, RR, in series with a load adjusted to provide thecorrect QL, and to measure the power in RR (Fig. 1b). This also reduces the amplitude of thepeak RF voltage that must be detected. To minimize the effects of connecting cable impedanceon transducer power measurements, connection cables are tuned to integral multiples of thewavelength and preferably include in-line baluns.
CalibrationThe SAR dosimeter is calibrated independent of the MRI scanner, by connecting a true rmsRF Wattmeter or RF voltmeter to the MRI coil input to measure PI during excitation, with thedosimeter placed in the coil. Bench experiments with head MRI coils can use a continuouswave (cw) RF amplifier of lower power than the scanner’s peak power (e.g., a few hundredWatts) but which still produces average SAR levels that are comparable to those used in MRI.Different power levels, PI are applied to the MRI coil, and the fraction of that power depositedin the dosimeter, PA, is determined from Eq. [1]. PA is plotted against either Vrms
2 or the powermeasured by an rms Wattmeter in each transducer loop. The result is a linear calibration curverelating the observed power deposited in the dosimeter’s load resistors, to the actual powerdeposited in the dosimeter in Watts. The IEC “exposed body SAR” can be derived using meangirth measurements to calculate the mean body mass enclosed by the coils for the average adult,
Stralka and Bottomley Page 4
J Magn Reson Imaging. Author manuscript; available in PMC 2008 November 24.
NIH
-PA Author Manuscript
NIH
-PA Author Manuscript
NIH
-PA Author Manuscript
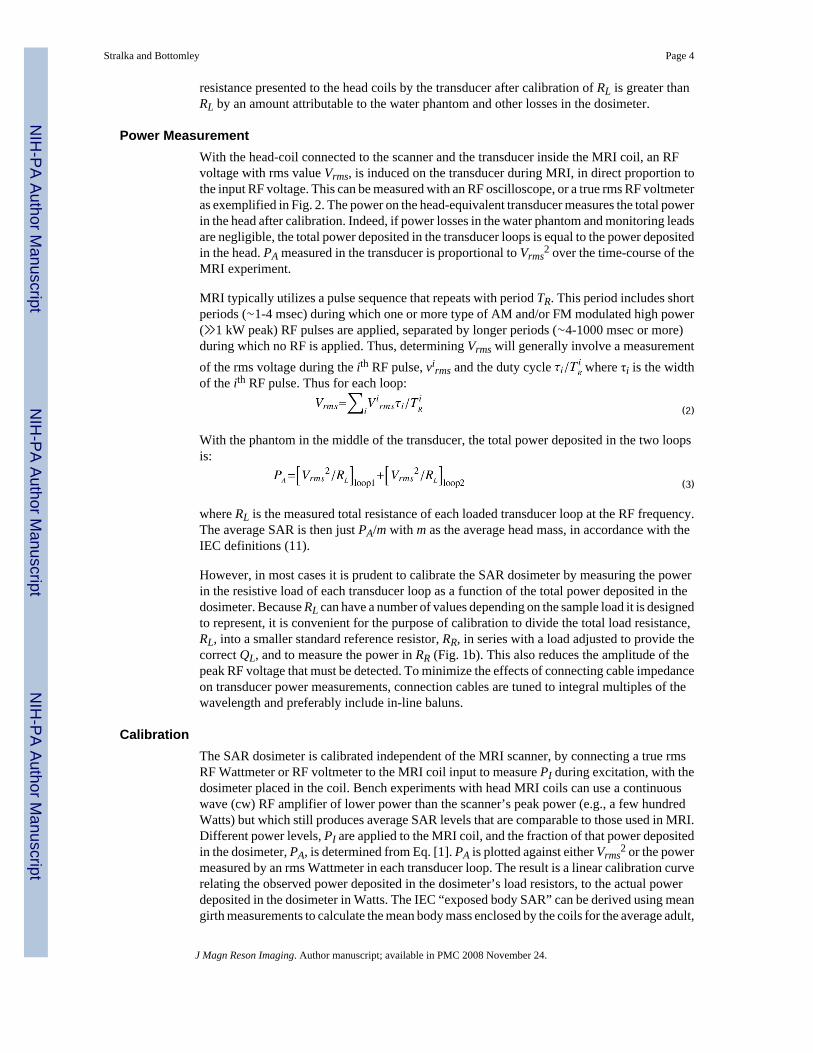
and dividing PA by that, as reported previously (18). Peak SAR is obtained from the modelfactor relating average and peak SAR, as noted above (7,13-17). A block diagram of thecomplete dosimeter placed in a standard MRI “bird-cage” RF coil for calibration is depictedin Fig. 3.
Protocol for UseThe SAR dosimeter is used as follows:
1. The SAR transducer is placed in the scanner and MRI coil whose SAR is beingmeasured, and advanced to the normal scan position. The transducer is connected toa true rms RF voltage or power measuring device (Fig. 3) outside the magnet (e.g., atthe end of the patient table).
2. The scanner is started using the MRI pulse sequence for which the SAR measurementis desired, entering the average weight of the load for which the dosimeter is calibratedfor, as the “patient weight.”
3. The rms power is measured during MRI, and the average and/or peak SAR for theaverage subject is calculated using the average subject mass and average-to-peakmodel factor.
4. The transducer is removed and replaced by a subject for scanning.
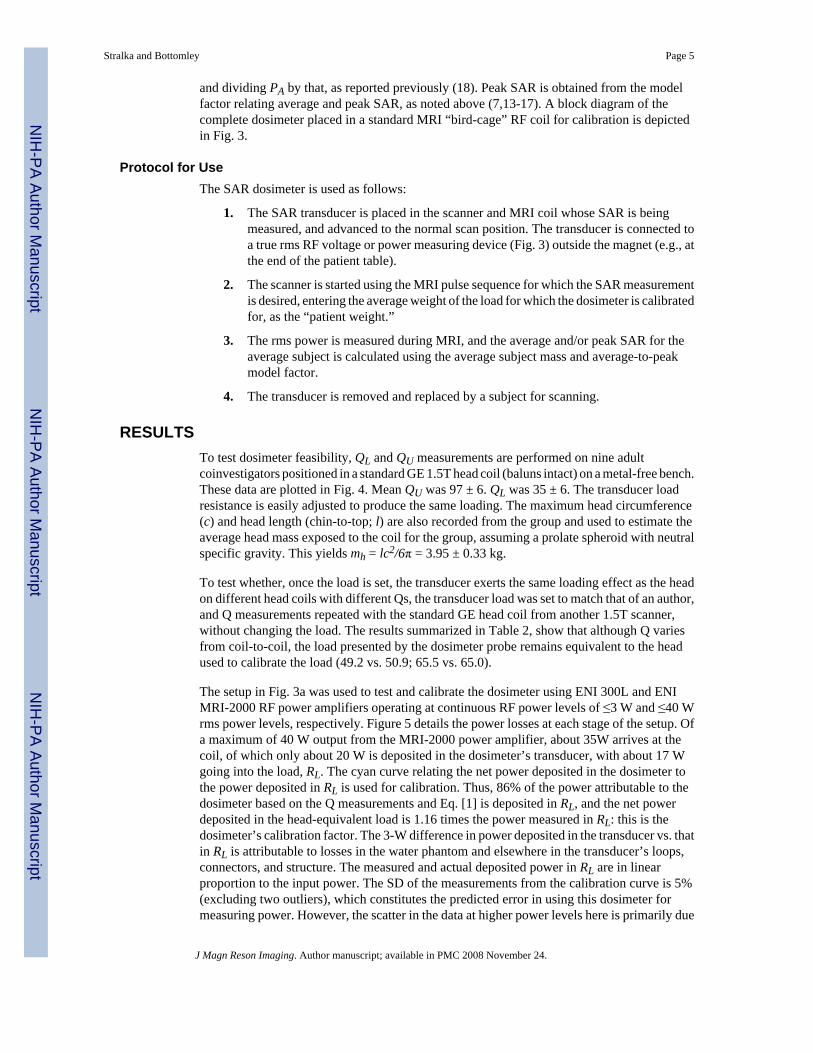
RESULTSTo test dosimeter feasibility, QL and QU measurements are performed on nine adultcoinvestigators positioned in a standard GE 1.5T head coil (baluns intact) on a metal-free bench.These data are plotted in Fig. 4. Mean QU was 97 ± 6. QL was 35 ± 6. The transducer loadresistance is easily adjusted to produce the same loading. The maximum head circumference(c) and head length (chin-to-top; l) are also recorded from the group and used to estimate theaverage head mass exposed to the coil for the group, assuming a prolate spheroid with neutralspecific gravity. This yields mh = lc2/6π = 3.95 ± 0.33 kg.
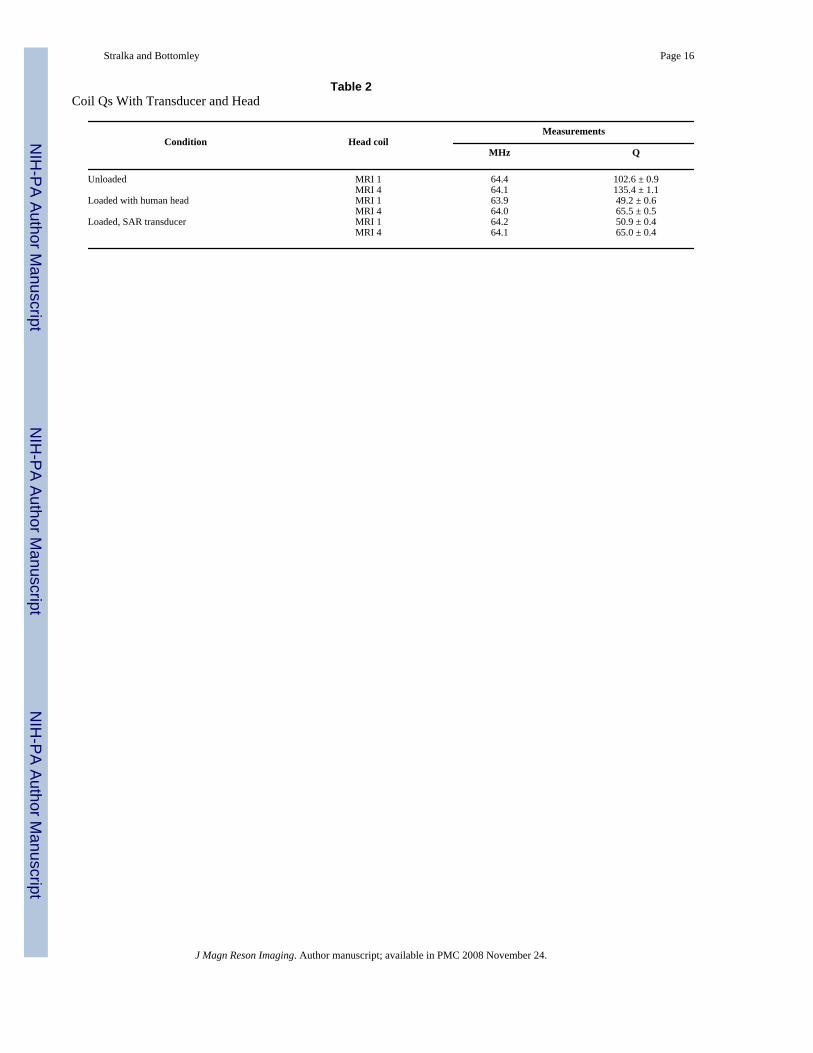
To test whether, once the load is set, the transducer exerts the same loading effect as the headon different head coils with different Qs, the transducer load was set to match that of an author,and Q measurements repeated with the standard GE head coil from another 1.5T scanner,without changing the load. The results summarized in Table 2, show that although Q variesfrom coil-to-coil, the load presented by the dosimeter probe remains equivalent to the headused to calibrate the load (49.2 vs. 50.9; 65.5 vs. 65.0).
The setup in Fig. 3a was used to test and calibrate the dosimeter using ENI 300L and ENIMRI-2000 RF power amplifiers operating at continuous RF power levels of ≤3 W and ≤40 Wrms power levels, respectively. Figure 5 details the power losses at each stage of the setup. Ofa maximum of 40 W output from the MRI-2000 power amplifier, about 35W arrives at thecoil, of which only about 20 W is deposited in the dosimeter’s transducer, with about 17 Wgoing into the load, RL. The cyan curve relating the net power deposited in the dosimeter tothe power deposited in RL is used for calibration. Thus, 86% of the power attributable to thedosimeter based on the Q measurements and Eq. [1] is deposited in RL, and the net powerdeposited in the head-equivalent load is 1.16 times the power measured in RL: this is thedosimeter’s calibration factor. The 3-W difference in power deposited in the transducer vs. thatin RL is attributable to losses in the water phantom and elsewhere in the transducer’s loops,connectors, and structure. The measured and actual deposited power in RL are in linearproportion to the input power. The SD of the measurements from the calibration curve is 5%(excluding two outliers), which constitutes the predicted error in using this dosimeter formeasuring power. However, the scatter in the data at higher power levels here is primarily due
Stralka and Bottomley Page 5
J Magn Reson Imaging. Author manuscript; available in PMC 2008 November 24.
NIH
-PA Author Manuscript
NIH
-PA Author Manuscript
NIH
-PA Author Manuscript
to instability in the RF power amplifier operating in continuous mode, and not to the dosimeteror measurement devices per se. The red curve relates the power measured in the dosimeter’sreference load, to the average SAR in the mh = 3.95 kg head on the right hand scale.
DISCUSSIONWe have presented and demonstrated the feasibility of a novel SAR dosimeter for measuringthe average SAR for a subject whose load it mimics, with bench measurements employingdifferent coils and subject loading. In practice, the interaction between volume MRI coils andthe scanner bore that typically alters MRI coil resonant frequencies, also necessitates thattransducer tuning and final calibration be performed in the scanner or in a scanner-equivalentbore. Once calibrated for a given load and MRI frequency, the dosimeter provides SARmeasurements that are independent of the MRI scanner. We are aware of no other scanner-independent SAR dosimeter devices for MRI.
Independent determinations of the deposited power using Eq. [1], require direct access to thecoil ports during MRI to measure incident power, QL and QU during an exam, which is generallynot feasible for scanner users and patient protocols. However, access to the bore is readilyavailable for researchers or medical physicists performing routine safety assessment, and theproposed dosimeter is amenable to such practice since no such connections are required. Thepurpose of adjusting the dosimeter’s load to that of the head (or body) is not to obtain measuresfor Eq. [1], but to ensure that the scanner applies a level of RF power during setup and MRIthat is equivalent to that applied to a standard head (or body). The rms power deposited ismeasured directly from the transducer’s loads: no other scanner measurements are required.In our case, the need for an independent SAR assessment was prompted by loss of confidencein “scanner SAR” values for setting up MRI safety evaluations of devices being developed forimplantation, as well as a need to provide an independent means of assessing scanner functionwhen investigating RF burns in an albeit small number of clinical MRI cases reported to ourmedical physicist. Even so, RF power deposition in MRI is far less of a risk than that posedby ionizing radiation in nuclear scanning, positron emission tomography (PET), X-ray, andcomputed tomography (CT), where failure to independently monitor exposure would not bean option.
While we have tested this SAR dosimeter concept with a head prototype at 1.5T, the importanceof RF dosimetry increases with field and body size, upon which SAR depends approximatelyquadratically (6-8). Thus, at fields of 3T and higher, the IEC and FDA guidelines already limitthe use of some MRI pulse sequences that are in routine clinical use at lower fields. We areplanning to develop transducers for the torso, for 3T MRI, and possibly even for 7T systems,which are currently limited to research applications. Dosimeter transducers for different sizedheads and torsos are also envisaged: for example, the adult head and body, the youth or infanthead and body, and transducers designed for given weight ranges are conceivable. It is alsopossible that one dosimeter could be used for several study groups simply by applying differentcalibration factors. In such studies it will be important to obtain data that establishes morerepresentative average loads for the dosimeter transducers than the limited group studied here.Finally, although we measured the power deposited in the prototype transducer with anoscilloscope, the setup envisaged is a transducer in the magnet connected to a meter that readsSAR directly (Fig. 3b). This involves incorporating the calibration factor into the meter, withallowance for the entry of different factors for different study groups.
ACKNOWLEDGMENTAnanda Kumar helped with discussions on performing Q measurements and fabricating the transducer.
Contract grant sponsor: National Institutes of Health; Contract grant number: RR15396/EB007829.
Stralka and Bottomley Page 6
J Magn Reson Imaging. Author manuscript; available in PMC 2008 November 24.
NIH
-PA Author Manuscript
NIH
-PA Author Manuscript
NIH
-PA Author Manuscript
REFERENCES1. The Nobel Prize in Physiology or Medicine. Press Release. Oct 62003 [Last accessed: August 22,
2007]. Available at: http://nobelprize.org/nobel_prizes/medicine/laureates/2003/press.html.2. Bottomley PA, Hart HR, Edelstein WA, et al. NMR imaging/spectroscopy system to study both
anatomy and metabolism. Lancet 1983;2:273–274. [PubMed: 6135092]3. Hardy CJ, Bottomley PA, Roemer PB, Redington RW. Rapid 31P spectroscopy on a 4 Tesla whole-
body system. Magn Reson Med 1988;8:104–109. [PubMed: 3173064]4. Vaughan JT, Garwood M, Collins CM, et al. 7T vs. 4T: RF power, homogeneity, and signal-to-noise
comparison in head images. Magn Reson Med 2001;46:24–30. [PubMed: 11443707]5. Young FE, Food and Drug Administration. Fed Regist 1988;53:7575–7579.6. Bottomley PA, Andrew ER. RF magnetic field penetration, phaseshift and power dissipation in
biological tissue: Implications for NMR imaging. Phys Med Biol 1978;23:630–643. [PubMed:704667]
7. Bottomley PA, Roemer RB. Homogeneous tissue model estimates of RF power deposition in humanNMR studies. Local elevations predicted in surface coil decoupling. Ann NY Acad Sci 1992;649:144–159. [PubMed: 1580488]
8. Bottomley PA, Edelstein WA. Power deposition in whole body NMR imaging. Med Phys 1981;8:510–512. [PubMed: 7322070]
9. U.S. Food and Drug Administration. Center for Devices and Radiological Health. MAUDE data basereports of adverse events involving medical devices. [Last accessed: August 22, 2007]. Available at:http://www.accessdata.fda.gov/scripts/cdrh/cfdocs/cfMAUDE/search.CFM
10. U.S. Food & Drug Administration. Guidance for Industry and FDA Staff Criteria for Significant RiskInvestigations of Magnetic Resonance Diagnostic Devices. Jul 142003 [Last accessed: August 22,2007]. Available at: http://www.fda.gov/cdrh/ode/guidance/793.pdf
11. European Committee for Electrotechnical Standardization Central Secretariat: rue de Stassart 35,B-1050 Brussels. Particular requirements for the safety of magnetic resonance equipment for medicaldiagnosis (IEC 60601-2-33:2002). Available at:http://webstore.ich.ch/webstore/webstore.nsf/artnum/035706
12. Unsolved Problems and Unmet Needs in MR: Results from a survey of ISMRM Study Groups.Dec2005 [Last accessed: August 22, 2007]. Available at:http://www.ismrm.org/07/UnsolvedProblems_Results.htm
13. Collins CM, Li S, Smith MB. SAR and B1 field distributions in a heterogeneous human head modelwithin a birdcage coil. Magn Reson Med 1998;40:847–856. [PubMed: 9840829]
14. Collins CM, Liu WZ, Wang JH, et al. Temperature and SAR calculations for a human head withinvolume and surface coils at 64 and 300 MHz. J Magn Reson Imaging 2004;19:650–656. [PubMed:15112317]
15. Nguyen UD, Brown JS, Chang IA, Krycia J, Mirotznik MS. Numerical evaluation of heating of thehuman head due to magnetic resonance imaging. IEEE Trans Biomed Eng 2004;51:1301–1309.[PubMed: 15311814]
16. Simunic D. Calculation of energy absorption in a human body model in a homogeneous pulsed high-frequency field. Bioelectrochem Bioenerg 1998;47:221–230.
17. Liu W, Collins CM, Smith MB. Calculations of B1 distribution specific energy absorption rate andintrinsic signal-to-noise ratio for a body-size birdcage coil loaded with different human subjects at64 and 128 MHz. Appl Magn Reson 2005;29:5–18.
18. Bottomley PA, Redington RW, Edelstein WA, Schenck JF. Estimating RF power deposition in bodyNMR imaging. Magn Reson Med 1985;2:336–349. [PubMed: 4094551]
19. Mansfield, P.; Morris, PG. NMR imaging in biomedicine. Academic Press; New York: 1982. p. 31320. Dempsey MF, Condon B, Hadley DM. Investigation of the factors responsible for burns during MRI.
J Magn Reson Imaging 2001;13:627–631. [PubMed: 11276109]21. Baker KB, Tkach JA, Nyenhuis JA, et al. Evaluation of specific absorption rate as a dosimeter of
MRI-related Implant Heating. J Magn Reson Imaging 2004;20:315–320. [PubMed: 15269959]
Stralka and Bottomley Page 7
J Magn Reson Imaging. Author manuscript; available in PMC 2008 November 24.
NIH
-PA Author Manuscript
NIH
-PA Author Manuscript
NIH
-PA Author Manuscript
22. Baker KB, Tkach JA, Phillips M, Rezai AR. Variability in RF-induced heating of a deep brainstimulation implant across MR systems. J Magn Reson Imaging 2006;24:1236–1242. [PubMed:17078088]
23. Bottomley, PA.; Lardo, AC.; Tully, S.; Karmarker, P.; Viohl, I. Safety and internal MRI coils. 2001Syllabus. Special cross-specialty categorical course in diagnostic radiology: practical MR safetyconsiderations for physicians, physicists, physicists and technologists. Radiological Society of NorthAmerica; Oak Brook, IL: 2001. p. 85-90.
24. Edelstein WA, Bottomley PA, Pfeifer PM. A signal-to-noise calibration procedure for NMR imagingsystems. Med Phys 1983;11:180–185. [PubMed: 6727793]
Stralka and Bottomley Page 8
J Magn Reson Imaging. Author manuscript; available in PMC 2008 November 24.
NIH
-PA Author Manuscript
NIH
-PA Author Manuscript
NIH
-PA Author Manuscript
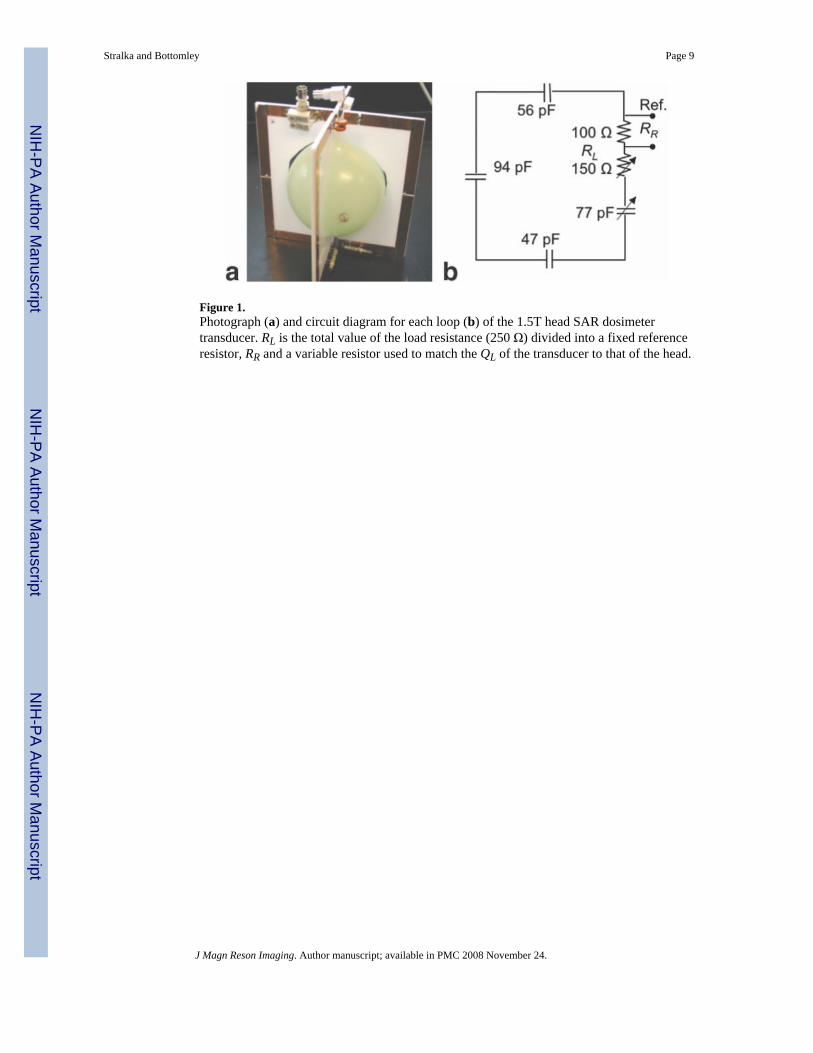
Figure 1.Photograph (a) and circuit diagram for each loop (b) of the 1.5T head SAR dosimetertransducer. RL is the total value of the load resistance (250 Ω) divided into a fixed referenceresistor, RR and a variable resistor used to match the QL of the transducer to that of the head.
Stralka and Bottomley Page 9
J Magn Reson Imaging. Author manuscript; available in PMC 2008 November 24.
NIH
-PA Author Manuscript
NIH
-PA Author Manuscript
NIH
-PA Author Manuscript
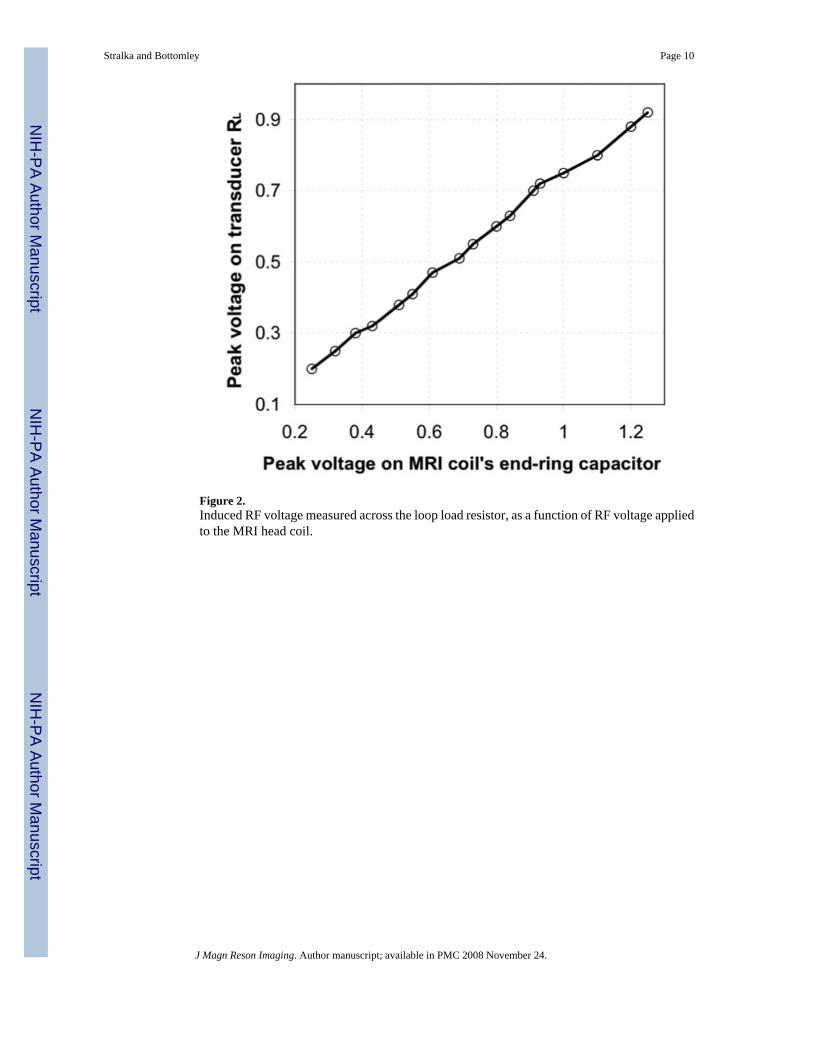
Figure 2.Induced RF voltage measured across the loop load resistor, as a function of RF voltage appliedto the MRI head coil.
Stralka and Bottomley Page 10
J Magn Reson Imaging. Author manuscript; available in PMC 2008 November 24.
NIH
-PA Author Manuscript
NIH
-PA Author Manuscript
NIH
-PA Author Manuscript
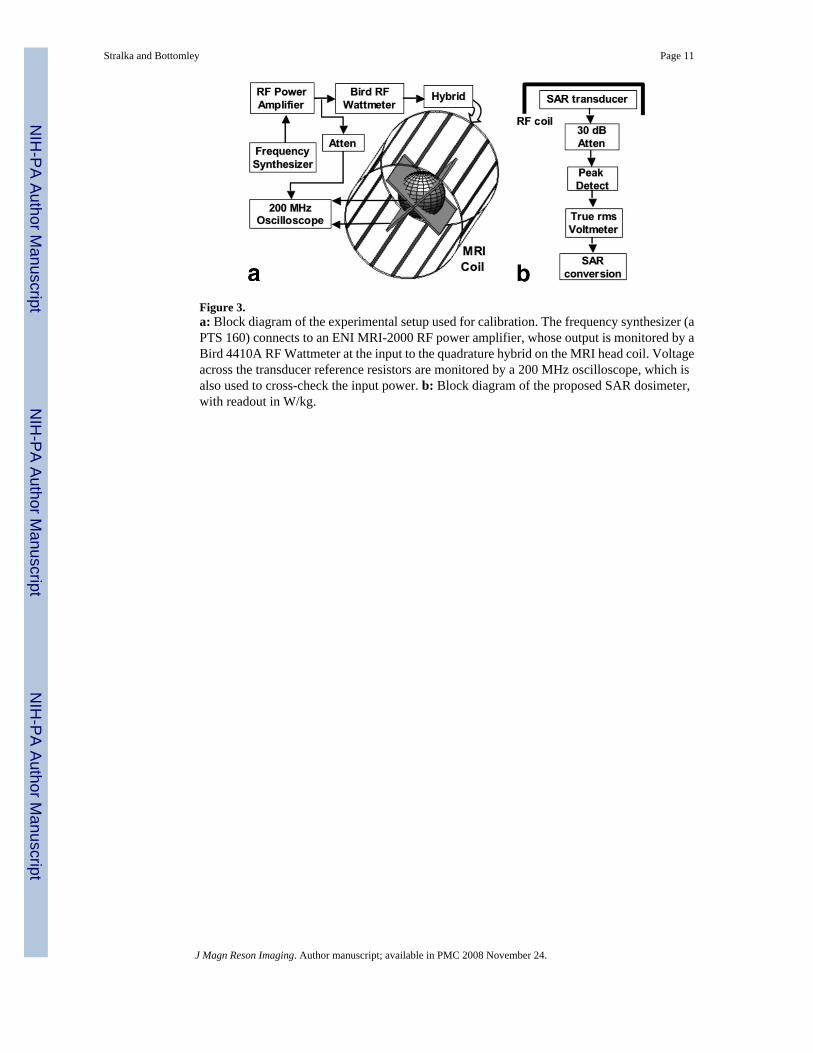
Figure 3.a: Block diagram of the experimental setup used for calibration. The frequency synthesizer (aPTS 160) connects to an ENI MRI-2000 RF power amplifier, whose output is monitored by aBird 4410A RF Wattmeter at the input to the quadrature hybrid on the MRI head coil. Voltageacross the transducer reference resistors are monitored by a 200 MHz oscilloscope, which isalso used to cross-check the input power. b: Block diagram of the proposed SAR dosimeter,with readout in W/kg.
Stralka and Bottomley Page 11
J Magn Reson Imaging. Author manuscript; available in PMC 2008 November 24.
NIH
-PA Author Manuscript
NIH
-PA Author Manuscript
NIH
-PA Author Manuscript
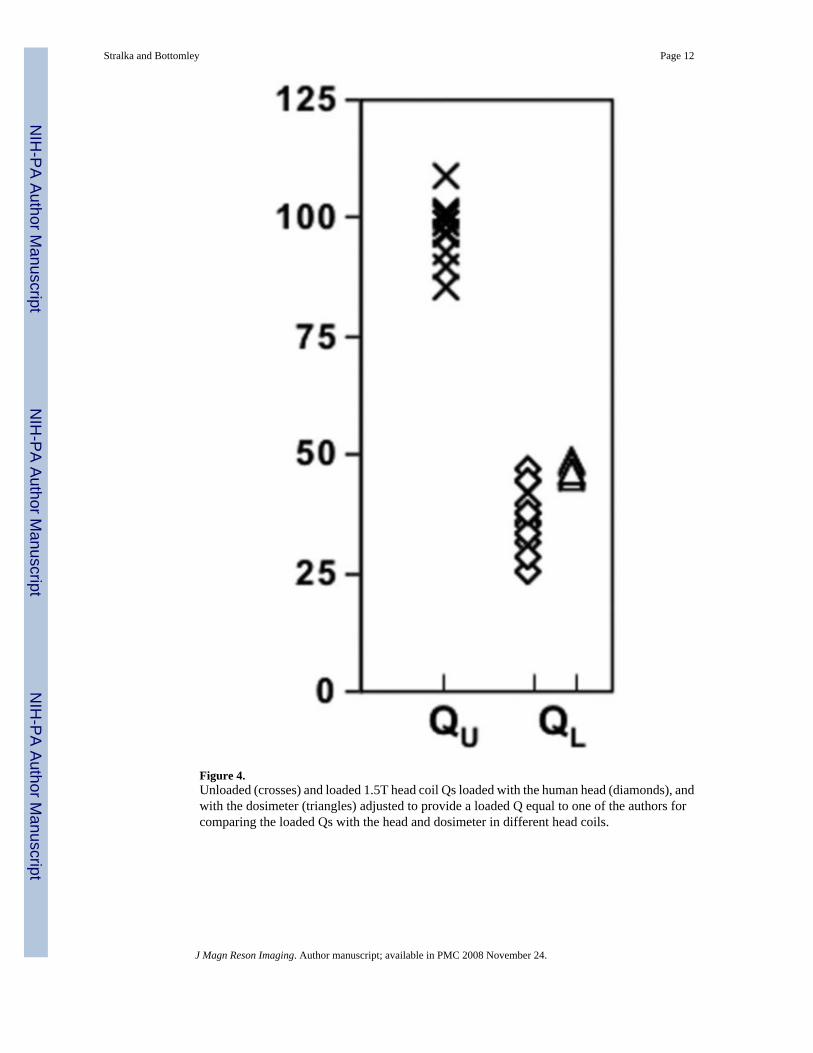
Figure 4.Unloaded (crosses) and loaded 1.5T head coil Qs loaded with the human head (diamonds), andwith the dosimeter (triangles) adjusted to provide a loaded Q equal to one of the authors forcomparing the loaded Qs with the head and dosimeter in different head coils.
Stralka and Bottomley Page 12
J Magn Reson Imaging. Author manuscript; available in PMC 2008 November 24.
NIH
-PA Author Manuscript
NIH
-PA Author Manuscript
NIH
-PA Author Manuscript
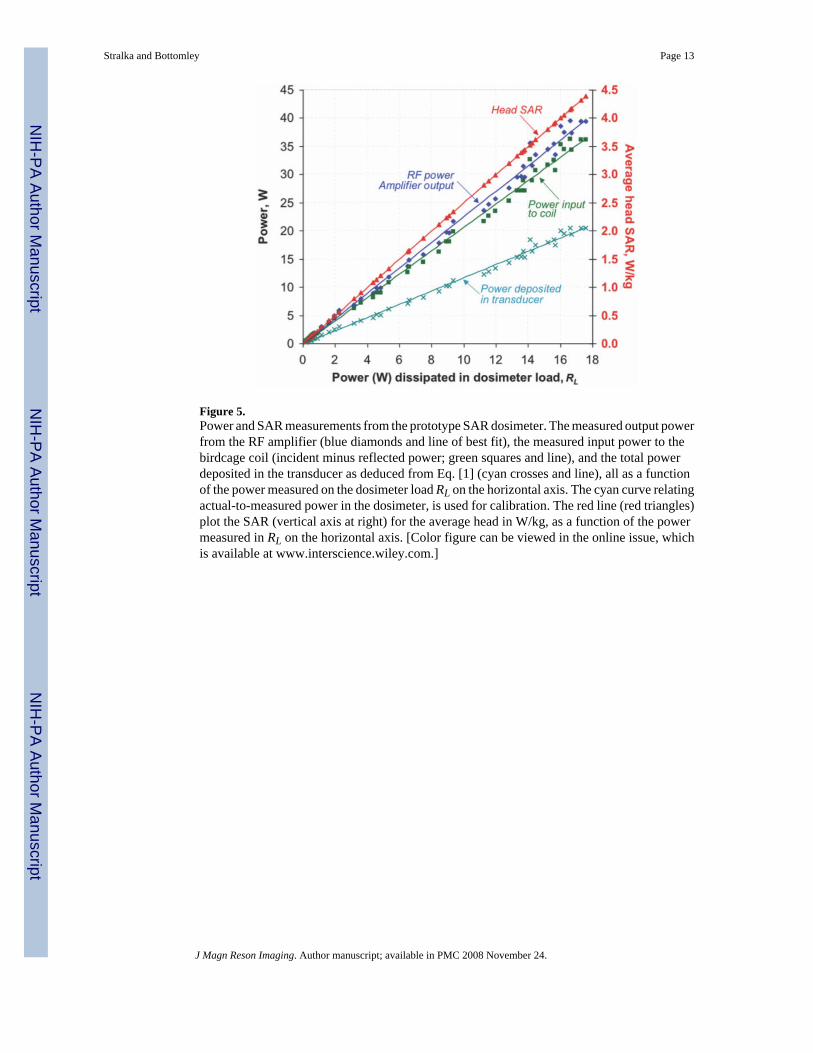
Figure 5.Power and SAR measurements from the prototype SAR dosimeter. The measured output powerfrom the RF amplifier (blue diamonds and line of best fit), the measured input power to thebirdcage coil (incident minus reflected power; green squares and line), and the total powerdeposited in the transducer as deduced from Eq. [1] (cyan crosses and line), all as a functionof the power measured on the dosimeter load RL on the horizontal axis. The cyan curve relatingactual-to-measured power in the dosimeter, is used for calibration. The red line (red triangles)plot the SAR (vertical axis at right) for the average head in W/kg, as a function of the powermeasured in RL on the horizontal axis. [Color figure can be viewed in the online issue, whichis available at www.interscience.wiley.com.]
Stralka and Bottomley Page 13
J Magn Reson Imaging. Author manuscript; available in PMC 2008 November 24.
NIH
-PA Author Manuscript
NIH
-PA Author Manuscript
NIH
-PA Author Manuscript
NIH
-PA Author Manuscript
NIH
-PA Author Manuscript
NIH
-PA Author Manuscript
Stralka and Bottomley Page 14Ta
ble
1A
dver
se E
vent
s Inv
olvi
ng R
F B
urns
in M
RI S
cann
ers R
epor
ted
to th
e FD
A, 2
005-
2006
*
Dat
e of
eve
ntM
RI s
yste
mFi
eld
(T)
Des
crip
tion
Lea
dsa
Coi
lsb
Bor
ec
11/1
7/06
GE
1.5
Firs
t deg
ree
burn
s/bl
iste
rs, b
oth
arm
s, ct
l coi
lN
YN
11/1
7/06
GE
1.5
Bur
n/bl
iste
rs, a
rmN
NY
11/1
6/06
Phili
ps1.
5B
urn/
blis
ter,
left
fore
arm
YN
N11
/2/0
6G
E1.
5B
urn/
blis
ter,
arm
NN
N11
/1/0
6Ph
ilips
1.5
Bur
n/bl
iste
r, ar
mN
NN
10/1
6/06
Phili
ps1.
5B
urns
/blis
ters
, bot
h th
ighs
NN
N9/
15/0
6G
E1.
5Se
cond
deg
ree
burn
, rig
ht e
lbow
NN
N8/
1/06
Hita
chi
1.5
Bur
n, n
eck
(ctl
rece
ive
coil)
NY
N7/
21/0
6FO
NA
R0.
6Th
ird d
egre
e bu
rns,
back
(no
padd
ing)
YN
N7/
14/0
6Ph
ilips
1.5
Bur
ns/b
liste
rs, h
ipN
NN
6/5/
06Ph
ilips
1.5
Bur
ns/b
liste
rs, i
nner
thig
hsN
NN
6/9/
06Ph
ilips
1.5
Seco
nd d
egre
e bu
rns/
blis
ters
, bre
ast
NN
N5/
26/0
6Ph
ilips
1.5
Bur
ns/b
liste
rs, e
lbow
, leg
NN
N4/
29/0
6Ph
ilips
1.5
Bur
ns/b
liste
rs le
gs (c
alf)
NN
N3/
17/0
6G
E1.
5Se
cond
deg
ree
burn
, elb
owN
NY
3/16
/06
GE
1.5
Bur
n/bl
iste
rs, h
and
(bre
ast e
xam
) inj
ury
to tw
o pa
tient
sN
NN
3/5/
06Ph
ilips
1.5
Seco
nd d
egre
e bu
rns/
blis
ters
, inn
er th
ighs
NN
N2/
23/0
6Ph
ilips
1.5
Seco
nd d
egre
e bu
rns,
shou
lder
NN
N2/
13/0
6G
E1.
5B
urns
, blis
ters
, elb
ows
NN
Y1/
24/0
6Si
emen
s1.
5B
urn/
blis
ter a
bdom
enN
YN
12/2
0/05
GE
1.5
Third
deg
ree
burn
s, ha
nds (
at is
ocen
ter)
YN
N12
/19/
05G
E1.
5B
urn/
blis
ters
, han
d (b
reas
t exa
m)
YN
N12
/11/
05G
E1.
5B
urn/
blis
ter,
ches
tN
NN
12/1
0/05
GE
1.5
Seco
nd d
egre
e bu
rns,
arm
, bic
eps
NN
N11
/1/0
5Si
emen
s1.
5B
urn/
blis
ters
on
calv
esN
NN
10/2
6/05
Phili
ps3
Seco
nd d
egre
e bu
rn, s
houl
der;
first
deg
ree
burn
, kne
eN
NN
10/1
3/05
GE
1.5
Seco
nd d
egre
e bu
rn lo
wer
nec
kY
NN
9/30
/05
GE
1.5
Seco
nd d
egre
e R
F bu
rn, e
lbow
NN
N9/
23/0
5G
E1.
5Se
cond
deg
ree
burn
s (to
rso
arra
y co
il)N
YN
9/21
/05
Siem
ens
1.5
Bur
ns, f
inge
rs a
nd th
ighs
touc
hing
NN
N9/
14/0
5G
E1.
5B
urn/
blis
ter,
elbo
wN
NN
8/27
/05
GE
1.5
Bur
n/bl
iste
rs, h
ip (8
ch
body
arr
ay)
NY
N8/
23/0
5G
E1.
5B
urn/
blis
ters
, hip
(8 c
h bo
dy a
rray
)N
YY
8/16
/05
GE
1.5
Bur
n/bl
iste
rs, h
ip (8
ch
body
arr
ay)
NY
N8/
15/0
5Ph
ilips
1.5
Bur
ns/b
liste
rs, e
lbow
s (he
ad M
RI)
NN
N7/
22/0
5G
E1.
5B
urn,
bre
ast (
lum
bar M
RI)
NY
N6/
15/0
5G
EB
urns
/blis
terin
g on
wris
t (w
rist c
oil)
NY
N4/
20/0
5G
EB
urns
/blis
ters
, C-s
pine
exa
mN
YN
3/17
/05
GE
1.5
Bur
ns/b
liste
rs sh
ould
erN
NN
3/4/
05Ph
ilips
1.5
Bur
ns/b
liste
r, ar
m (c
oil c
onta
ct)
NN
Y2/
14/0
5G
E1.
5B
urns
/blis
ters
shou
lder
, elb
ow (s
houl
der a
rray
)N
YN
2/14
/05
GE
1.5
Seco
nd d
egre
e bu
rns,
both
legs
(tor
so a
rray
)Y
YN
2/7/
05Si
emen
s1.
5B
urn/
blis
ter a
rmN
NY
ctl =
cer
vica
l-spi
ne/th
orac
ic/lu
mba
r, ch
= c
hann
el.
* Sear
ch te
rm “
mag
netic
reso
nanc
e,”
and
scre
en fo
r bur
ns. T
his d
ata
is re
porte
d vo
lunt
arily
, and
doe
s not
repr
esen
t the
true
inci
denc
e or
dis
tribu
tion
of su
ch in
cide
nts (
9).
a Rep
ort l
inks
inju
ry to
lead
s, in
clud
ing
coil
cabl
es, o
r met
al (Y
= y
es; N
= N
o).
b Rep
ort n
otes
use
of s
urfa
ce c
oils
/arr
ays d
urin
g sc
an.
J Magn Reson Imaging. Author manuscript; available in PMC 2008 November 24.
NIH
-PA Author Manuscript
NIH
-PA Author Manuscript
NIH
-PA Author Manuscript
Stralka and Bottomley Page 15c R
epor
t not
es in
jury
was
ass
ocia
ted
with
bor
e co
ntac
t.
J Magn Reson Imaging. Author manuscript; available in PMC 2008 November 24.
NIH
-PA Author Manuscript
NIH
-PA Author Manuscript
NIH
-PA Author Manuscript
Stralka and Bottomley Page 16
Table 2Coil Qs With Transducer and Head
Condition Head coilMeasurements
MHz Q
Unloaded MRI 1 64.4 102.6 ± 0.9MRI 4 64.1 135.4 ± 1.1
Loaded with human head MRI 1 63.9 49.2 ± 0.6MRI 4 64.0 65.5 ± 0.5
Loaded, SAR transducer MRI 1 64.2 50.9 ± 0.4MRI 4 64.1 65.0 ± 0.4
J Magn Reson Imaging. Author manuscript; available in PMC 2008 November 24.
Related Documents