Access in Appalachia A Primer for Measurement and Decision-Making

Welcome message from author
This document is posted to help you gain knowledge. Please leave a comment to let me know what you think about it! Share it to your friends and learn new things together.
Transcript

Access in Appalachia A Primer for Measurement and Decision-Making

Acknowledgements
Appalachia Regional Commission The Appalachian Regional Commission (ARC) provided funding, leadership, and project
management for the project. ARC is an economic development agency of the federal
government and 13 state governments focusing on 420 counties across the Appalachian
Region. ARC’s mission is to innovate, partner, and invest to build community capacity and
strengthen economic growth in Appalachia to help the Region achieve socioeconomic parity
with the nation. Ryan Brumfield, Senior Transportation Advisor, served as the Project Director.
Report Authors Mark Sieber, Naomi Stein, Glen Weisbrod, Ralph Straumann, and Adam Blair
EBP US, Inc., formerly Economic Development Research Group, Inc.
Research Report Reference This primer is derived from the research report “Access in Appalachia” developed by ARC,
together with EBP (formerly EDR Group), as a methodological framework for accessibility
measurement specifically for the needs and purposes of the Appalachian Region. The report
can be downloaded from www.arc.gov
Contents
PRIMER PURPOSE AND AUDIENCE ..................................................................................... 1
OVERVIEW ....................................................................................................................... 3
ACCESS AND ECONOMIC OPPORTUNITY ........................................................................... 10
ACCESSIBILITY MEASUREMENT IN DECISION MAKING ........................................................ 13
A FRAMEWORK FOR MEASUREMENT ................................................................................ 16
DEVELOPING ACCESSIBILITY METRICS ............................................................................. 19
MOVING FORWARD ......................................................................................................... 24
REFERENCES ................................................................................................................. 25

1 Access in Appalachia: A Primer for Measurement and Decision-Making
Primer Purpose and Audience
Primer Purpose and Audience Why Consider Access in Transportation Planning?
Why Consider Accessibility? The field of transportation planning has been evolving in recent
years, with growing recognition of the importance of “accessibility” as a central objective and
performance measure. Accessibility refers to the ability of people to reach desired destinations
and activities (or conversely, the ability of business activities to reach workers and customers).
This is the fundamental reason why transportation infrastructure and services exist, yet the
concept had until recently been difficult for many transportation agencies to measure. While
measuring travel times and costs is still a major part of benefit evaluation, agencies today can
now make use of new datasets and tools to measure and monitor levels of accessibility in their
jurisdiction and utilize this information to make more effective investment decisions. This
document shows how.
The need to measure and improve accessibility is particularly important for regions of the United
States, including Appalachian States, where there are constraints on accessibility and
challenges for economic development due to topographic, service availability, and spatial
factors. The Appalachian Regional Commission was established in part to help address the
Region’s isolation and accessibility limitations, and since its founding has worked with its
partners across the region to improve access and economic opportunity. The primary goal of the
Appalachian Development Highway System (ADHS) is to help reduce isolation and better
connect residents of the Appalachian Region to broader markets. Although the ADHS is now
nearly 90% complete, many parts of Appalachia still suffer from isolation and poor access.
Thus, it becomes important for state and regional agencies to take further action to improve
accessibility to jobs, health care, and education for their residents.
Primer Purpose. This primer is designed to:
• Provide a simple overview of what access is and why it matters
• Highlight the link between access and social and economic opportunity
• Outline the types of access that are most relevant in Appalachia
• Provide guidance to effectively incorporate accessibility in transportation decision-
making by making use of available information sources and analysis methods.
Audience. This primer is intended for use by transportation and economic development
professionals in state, regional, and local government. Those who have never explored
accessibility concepts and measurement approaches will find guidance on where to start. More
seasoned analysts can use this primer to understand how accessibility analysis can extend
beyond the traditional focus of access to jobs to other types of access, and to learn about
special consideration for accessibility in rural areas. This primer is particularly appropriate for
those tasked with directing transportation investments based on assessments of needs and
opportunities.

2 Access in Appalachia: A Primer for Measurement and Decision-Making
Primer Purpose and Audience
Structure. The primer is structured to mirror the process for building accessibility considerations
into decision-making, as shown in Figure 1. It starts with an overview to give readers an
understanding of accessibility concepts. The second chapter focuses on the goals of
accessibility measurement, namely support for economic development. The third chapter
situates accessibility within the decision-making process, to help readers determine the scope of
their analysis. The fourth chapter dives into different definitions of accessibility that can be
employed to address the needs of businesses and people. The fifth chapter focuses on the
process for assembling data and analytical resources to implement selected measures. Finally,
the last chapter addresses opportunities to create change and how ARC and its partners can
move forward together.
FIGURE 1 S IX STEPS TO BUILD ACCESSIBILITY CONSIDERATIONS INTO DECISION-MAKING
3 Access in Appalachia: A Primer for Measurement and Decision-Making
Overview
Overview What Is Accessibility?
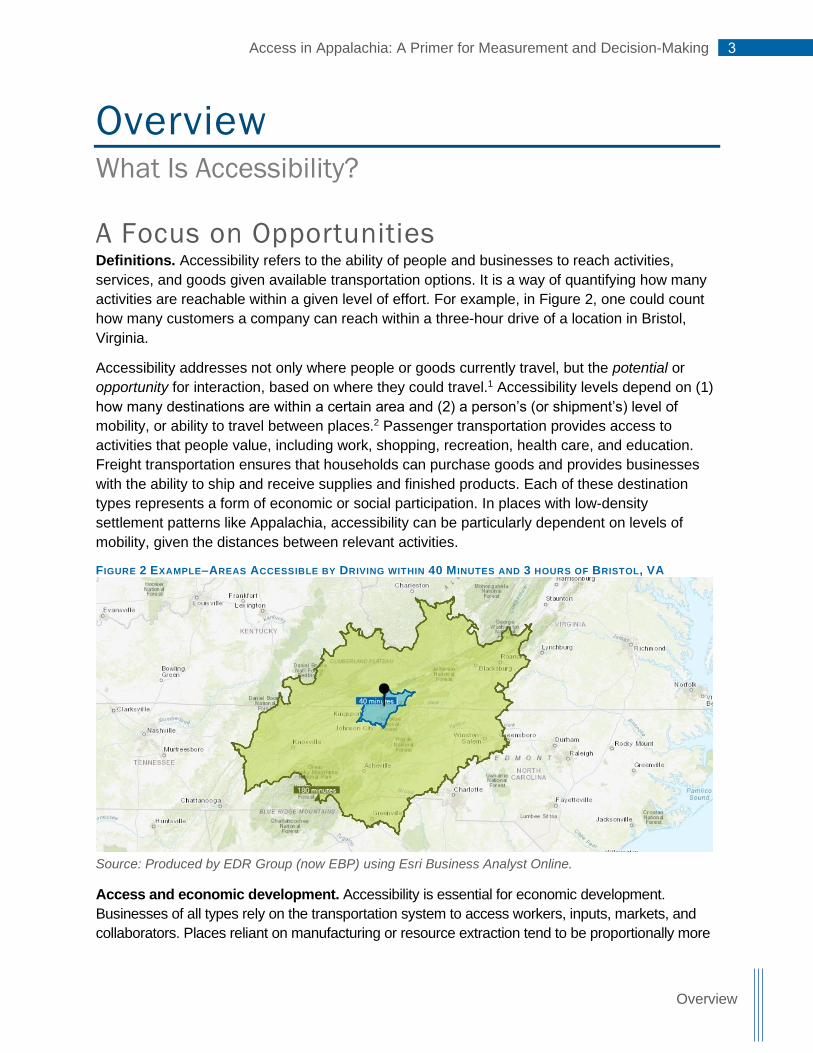
A Focus on Opportunities Definitions. Accessibility refers to the ability of people and businesses to reach activities,
services, and goods given available transportation options. It is a way of quantifying how many
activities are reachable within a given level of effort. For example, in Figure 2, one could count
how many customers a company can reach within a three-hour drive of a location in Bristol,
Virginia.
Accessibility addresses not only where people or goods currently travel, but the potential or
opportunity for interaction, based on where they could travel.1 Accessibility levels depend on (1)
how many destinations are within a certain area and (2) a person’s (or shipment’s) level of
mobility, or ability to travel between places.2 Passenger transportation provides access to
activities that people value, including work, shopping, recreation, health care, and education.
Freight transportation ensures that households can purchase goods and provides businesses
with the ability to ship and receive supplies and finished products. Each of these destination
types represents a form of economic or social participation. In places with low-density
settlement patterns like Appalachia, accessibility can be particularly dependent on levels of
mobility, given the distances between relevant activities.
FIGURE 2 EXAMPLE–AREAS ACCESSIBLE BY DRIVING WITHIN 40 M INUTES AND 3 HOURS OF BRISTOL, VA
Source: Produced by EDR Group (now EBP) using Esri Business Analyst Online.
Access and economic development. Accessibility is essential for economic development.
Businesses of all types rely on the transportation system to access workers, inputs, markets, and
collaborators. Places reliant on manufacturing or resource extraction tend to be proportionally more

4 Access in Appalachia: A Primer for Measurement and Decision-Making
Overview
concerned with freight access to supplier and customer markets via transportation connections.
Places that are service-oriented, on the other hand, have proportionally greater requirements for
access to skilled workers, broadband, and educational institutions.
Accessibility improvements can generate economic development by attracting new businesses to a
region or increasing the productivity of existing businesses. When businesses decide where to open
new locations or relocate, many list accessibility factors among their top criteria.3 Through increased
market access, firms can increase their sales and use capital and labor more efficiently. The term
“agglomeration economies” refers to the business productivity benefits associated with industry
clustering and improved access to workers, suppliers, and customers. These economic forces tend
to encourage spatial clustering at various geographic scales and lead to firms being more productive
when they have better access.4
Accessibility is also necessary for ameliorating economic distress. The World Bank considers
“access for all to economic and social opportunities” as central to their mission of reducing
poverty and improving health and human development outcomes.5
Challenges in Appalachia. Remote areas like those throughout Appalachia tend to be poorly
served by freight and transit operators due to lower demand. Because of the effects of poverty and
aging in Appalachia, specific accessibility challenges arise for people who lack access to a personal
automobile and therefore have difficulty reaching jobs, school, or other destinations. Some areas
also have limited roadway network coverage because of high construction costs associated with
topographical barriers like mountains or rivers, coupled with less dense settlement patterns and
other spatial constraints.6 Each of these challenges can make access in rural areas a major
impediment to people’s well-being and businesses’ economic viability.
Recognizing both the opportunities associated with good access and the considerable
challenges derived from constrained access, access measurement is a way to better
understanding opportunities, pinpointing problem areas, and providing a platform for action.
Three Dimensions of Measurement Accessibility measures typically address three dimensions as shown in Figure 3: (1) the user
group, defining the perspective of the measure, (2) the attractions, destinations, or opportunities
to which access is being considered, and (3) network availability and performance, which
dictates whether trips are possible by a given mode and how easy or hard the connection is.
FIGURE 3 THREE DIMENSIONS OF ACCESSIBILITY DEFINITION
Table 1 describes at a high level the options available for each of these dimensions, along with
guidance and special considerations for rural areas. Because access measures always assess
opportunities that are accessible from a given location, the user group options represent
User Group
Access for whom/from where?
Attractions/Destinations
Access to where/what?How well does the
destination meet the need?
Network Availability and Performance
Can you get there? How easy or hard is it?

5 Access in Appalachia: A Primer for Measurement and Decision-Making
Overview
different choices on how to select that starting point when conducting an analysis of access
across a region. The options for attractions/destinations address the question of how to
represent the number and importance of accessible opportunities. Finally, the network
availability and performance options relate to which attributes of transportation system
performance and which networks should be considered when trying to determine the relative
ease or difficulty of accessing a given opportunity. Not included in this table is guidance on how
to determine which opportunities are “counted” as accessible—i.e., how travel
time/distance/cost mediate the value of accessible opportunities. This is addressed through the
functional form of an accessibility measure, which is discussed in the next section.
TABLE 1 OPTIONS AND CONSIDERATIONS FOR DEFINING AN ACCESSIBILITY MEASURE
Options Considerations and guidance
User
Gro
up
Measure access for users based on analysis of access:
▪ From all centroids within a zonal system
▪ From all cells in a standard grid
▪ From key locations (e.g., major employment centers)
▪ For all zones or cells, but weighted by the number of users affected
▪ Using standard geographic units (e.g., from the Census) can help with reproducible comparisons across different areas
▪ Consider weighting accessibility scores by affected users, particularly in sparsely developed rural areas
▪ Consider also weighting scores by measures of economic disadvantage (to focus on equity)
Att
racti
on
s /
Desti
nati
on
s
▪ Counting discrete opportunities (e.g., number of schools)
▪ Defining hierarchies of importance by granting a greater number of points to activities of a certain kind, quality, or scale (e.g., more points for a level I trauma center than levels II–IV).
▪ Counting using indicators of magnitude (e.g., population or employment).
▪ Prioritize destinations based on a hierarchy of needs, guided by planning goals or stakeholder input
▪ Given the sparseness of the transportation network in some parts of Appalachia, measures that focus on network rather than activity access (e.g., access to rail terminals, ports) may also be appropriate.
Netw
ork
Av
ailab
ilit
y &
Perf
orm
an
ce
Units of “impedance:”
▪ Travel distance
▪ Travel time
▪ Travel cost
Network definitions:
▪ By mode (e.g., drive, transit, walk, bike)
▪ Time of day
▪ Truck restrictions/routes
▪ Travel time is the most commonly used “impedance” measure as it both conveys outcomes of transportation network performance from a user’s perspective and is easy to interpret
▪ Given the significant challenges faced by those without private vehicles, consider analyzing non-car accessibility
▪ Depending on the focus of analysis, other units of “impedance,” such as generalized cost or special network definitions (i.e., truck networks), may merit consideration
6 Access in Appalachia: A Primer for Measurement and Decision-Making
Overview
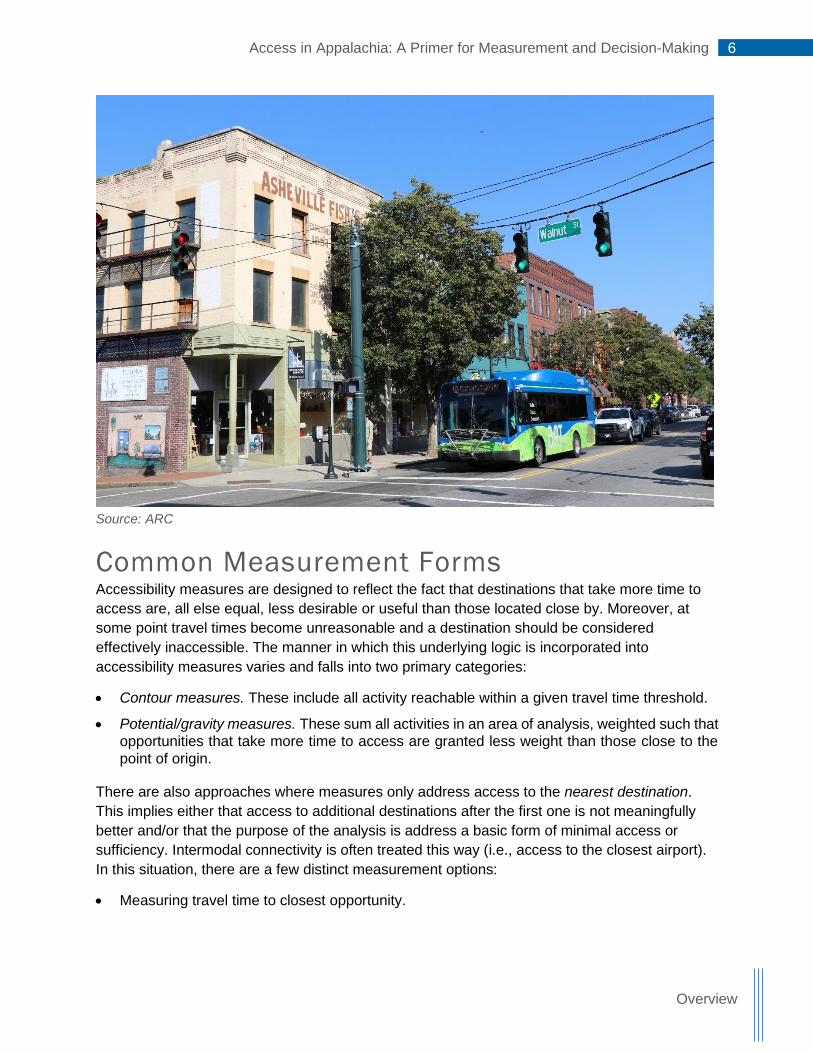
Source: ARC
Common Measurement Forms Accessibility measures are designed to reflect the fact that destinations that take more time to
access are, all else equal, less desirable or useful than those located close by. Moreover, at
some point travel times become unreasonable and a destination should be considered
effectively inaccessible. The manner in which this underlying logic is incorporated into
accessibility measures varies and falls into two primary categories:
• Contour measures. These include all activity reachable within a given travel time threshold.
• Potential/gravity measures. These sum all activities in an area of analysis, weighted such that
opportunities that take more time to access are granted less weight than those close to the
point of origin.
There are also approaches where measures only address access to the nearest destination.
This implies either that access to additional destinations after the first one is not meaningfully
better and/or that the purpose of the analysis is address a basic form of minimal access or
sufficiency. Intermodal connectivity is often treated this way (i.e., access to the closest airport).
In this situation, there are a few distinct measurement options:
• Measuring travel time to closest opportunity.

7 Access in Appalachia: A Primer for Measurement and Decision-Making
Overview
• Constructing a measure of the general form where
Access = (Measure of the importance of the destination) / (Travel time). For example, one
might measure volume at the port as a proxy for its relative importance.
• Binary sufficiency measures. i.e., a yes or no as to whether at least one destination is accessible within a defined threshold.
Figure 4 illustrates how these different functional forms of accessibility measures would treat the
same spatial configuration of users and destinations. Note that these diagrams are presented in
terms of straight-line distance (meaning thresholds appear as circles) but actual measures
would use travel time and therefore not have perfectly circular boundaries.
In the case of the contour measure, only the two destinations within the threshold matter. They
also “count” at the exact same level of importance even though one is considerably close. The
diagram also highlights the somewhat arbitrary nature of threshold selection. The third closest
destination lies just outside the boundary but is treated as providing no value, compared to the
one just inside the threshold. On the other hand, the potential/gravity type measure instead
recognizes all the destinations along a continuum of importance based on how far away they
are. Finally, the nearest destination/sufficiency type measures only recognize the one closest
destination, with all others treated as irrelevant.
FIGURE 4 ILLUSTRATION OF D IFFERENT FUNCTIONAL FORMS OF ACCESSIBILITY MEASURES

8 Access in Appalachia: A Primer for Measurement and Decision-Making
Overview
Source: ARC
Table 2 presents some of the pros and cons of contour versus potential/gravity measures. They
each have strengths and weaknesses for different audiences and applications.
TABLE 2 PROS AND CONS OF CONTOUR V. POTENTIAL/GRAVITY MEASURES7
Pros Cons
Co
nto
ur ▪ Easier to interpret, communicate,
calculate
▪ May be more attractive to general users/high-level decision makers
▪ Thresholds are inherently arbitrary
▪ No differentiation of opportunities within isochrone
▪ Can be very sensitive to travel time changes, which can make it harder to use in evaluating changes
Po
ten
tial/
Gra
vit
y ▪ Addresses many of the theoretical
issues of contour measures
▪ May be more attractive to researchers interested in detailed comparisons
▪ Harder to interpret/communicate
▪ Requires selection of a specific decay function
9 Access in Appalachia: A Primer for Measurement and Decision-Making
Overview
Selecting Thresholds or Distance Decay Functions Thresholds or parameters of spatial decay functions are typically chosen to reflect travel behavior.
In practice, this can mean either (a) selecting “rule of thumb” thresholds (e.g., 60 minutes), or (b)
selecting thresholds or parameterizing decay functions through analysis of empirical data on
spatial travel behavior. The latter approach relies on data describing the distribution of trip
durations, stratified by variables of interest—namely trip purpose, mode, and location/area type.
The National Household Travel Survey (2017) offers a recently updated national data set of this
type, but individual regions and states may have their own data from custom surveys.
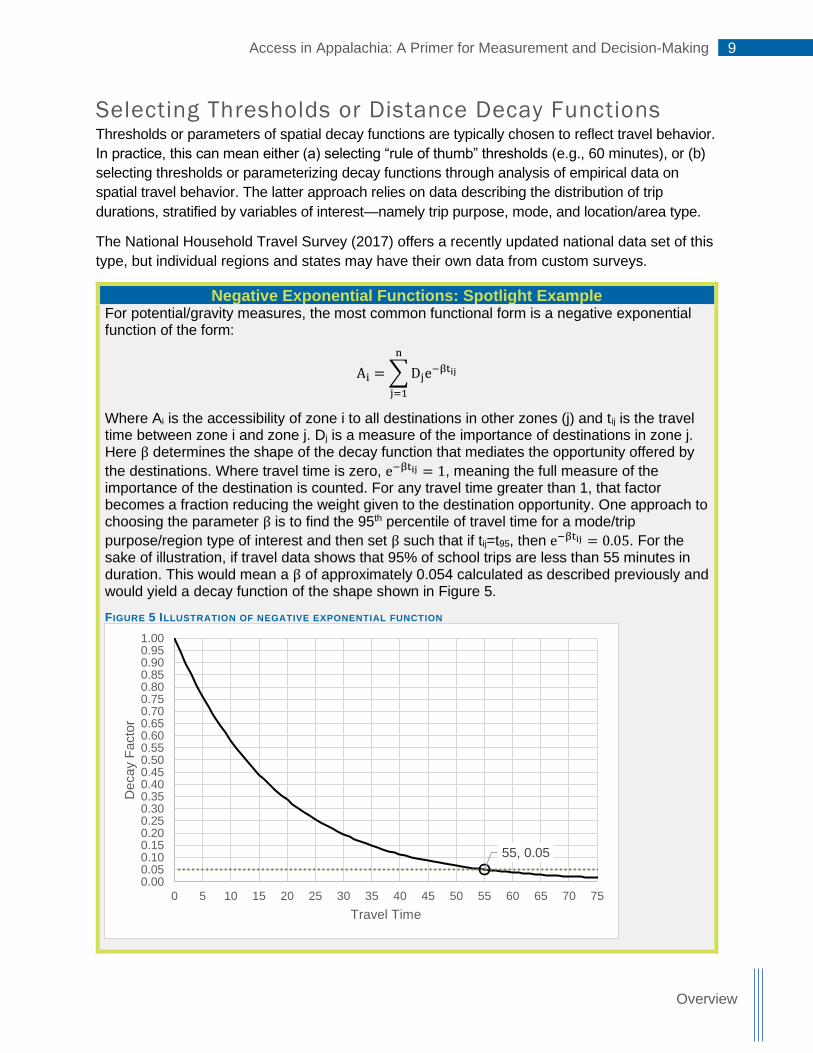
Negative Exponential Functions: Spotlight Example For potential/gravity measures, the most common functional form is a negative exponential function of the form:
Ai = ∑Dje−βtij
n
j=1
Where Ai is the accessibility of zone i to all destinations in other zones (j) and tij is the travel time between zone i and zone j. Dj is a measure of the importance of destinations in zone j. Here β determines the shape of the decay function that mediates the opportunity offered by
the destinations. Where travel time is zero, e−βtij = 1, meaning the full measure of the importance of the destination is counted. For any travel time greater than 1, that factor becomes a fraction reducing the weight given to the destination opportunity. One approach to choosing the parameter β is to find the 95th percentile of travel time for a mode/trip
purpose/region type of interest and then set β such that if tij=t95, then e−βtij = 0.05. For the sake of illustration, if travel data shows that 95% of school trips are less than 55 minutes in duration. This would mean a β of approximately 0.054 calculated as described previously and would yield a decay function of the shape shown in Figure 5.
FIGURE 5 ILLUSTRATION OF NEGATIVE EXPONENTIAL FUNCTION
55, 0.05
0.000.050.100.150.200.250.300.350.400.450.500.550.600.650.700.750.800.850.900.951.00
0 5 10 15 20 25 30 35 40 45 50 55 60 65 70 75
Decay
Facto
r
Travel Time

10 Access in Appalachia: A Primer for Measurement and Decision-Making
Access and Economic Opportunity
Access and Economic
Opportunity How Does Accessibility Support Economic
Opportunity?
Access Needs Accessibility is about connecting people and businesses to the activities and resources they
need to participate fully in the economy and society. The following table summarizes key types
of access, as identified from research literature on economic development and opportunity.
People and Businesses Need Access To...
Jobs and Workers–Labor Market Access
Businesses are more productive when they have access to broader labor markets as this enables better matching between their requirements and the skills of available workers.8 This is proportionally more important for service or knowledge-based industries, but workforce is, in fact, one of the top site selection criteria across all industries.9 Accessibility is also key to ensuring people can access and maintain gainful employment. In places with high unemployment, improving access can increase the number of job opportunities available to residents.10
Customers, Suppliers–Access to Goods and Services
Businesses also need access to their customer base, whether that’s individual consumers or other companies to which they provide goods and services. Conversely, businesses are also dependent on transportation for access to suppliers, whether of material goods or of services that require in-person support. Transportation access can dictate the effective service area of businesses, defined either by people’s willingness to travel, or by the performance of freight transportation networks in supply chains. Customer access can range from very local (e.g., for a convenience store) to highly global (e.g., for a specialized manufacturer). Nevertheless, research shows that same-day truck delivery markets are particularly important indicators of competitiveness.11 Finally, providing access to consumer goods and services is a fundamental purpose of transportation and can make a community more attractive.
Network Access - Intermodal Terminals and Key Nodes
Connectivity to long-distance transportation networks (airports, marine ports, intermodal rail) broadens the geography of market access, particularly in a globalized economy and may be considered as its own dimension of access as well. For example, in Amazon’s highly publicized request for proposals for a second headquarters, the company defined a set of minimal transportation access

11 Access in Appalachia: A Primer for Measurement and Decision-Making
Access and Economic Opportunity
requirements including “Proximity to major highways and arterial roads” within 1–2 miles and “Proximity to International Airport” within approximately 45 minutes.12
Access to Education
Economic development may be hindered where potential students do not have good access to colleges and other schools and where employers do not have access to an adequately educated workforce. While 42% of the nation’s young people between age 18 and 24 are enrolled in a higher education institution, only 29% of rural people are.13 While there are other individual and social barriers to higher education, research shows that distance to college also correlates with students’ choices to apply or enroll. This is the case even more so in rural areas, since lower socioeconomic status is more common in rural areas and substantial savings can be achieved when college students are able to live at home.14 For many rural people, community colleges provide the only accessible opportunity for higher education. About two-thirds of public two-year colleges serve rural communities, providing a critical path to careers and four-year universities.15 Research has shown that rural counties with an established community college or university have experienced greater job growth over time than counties without institutions of higher education.16
Healthcare Access
The ability to access medical care is critical to the overall health and welfare of society. This is especially true for vulnerable rural populations, including older adults, people with disabilities, low-income individuals and families, and veterans or those who otherwise have unique healthcare needs.17 Lack of accessibility to care can lead to delayed or missed appointments, disruption to care for chronic conditions, increase in stress for patients, and decline in use of some medication.18 Approximately 3.6 million Americans miss or delay non-emergency medical care each year because of transportation-related issues.19 Older adults tend to have lower mobility levels, which negatively affects their ability to access health facilities and services.20 Vehicle availability is also consistently associated with increased access to health care.21 Out of the 420 counties in the Appalachian Region, 149 rank in the worst national quintile regarding years of potential life lost (YPLL).22 Transportation is one of three main barriers to health care for rural populations.23 Opioid addiction is considered a public health epidemic in the United States and especially in some Appalachian states. Opioid deaths and injuries have increased the most in rural areas where emergency medical response times are longer. In addition, opioid addicts living in rural areas face greater barriers to treatment given a lack of public transportation and longer travel distances relative to urban areas.24
Broadband Availability and Access
In an increasingly networked economy, broadband connectivity is critically important to the business community, contributing to increased productivity, competitiveness, and efficiency.25 Access to broadband internet is also increasingly being recognized as a prerequisite for people’s access to various other services, such as health care, education, employment.26 While only 7% of the United States’ population does not have broadband access in their neighborhoods (25 Mbps download or faster), in rural America this share is 27.4%.27 Where educational institutions, health care providers, and employers are not sufficiently accessible to people, broadband access can serve as a partial substitute for physical access.

12 Access in Appalachia: A Primer for Measurement and Decision-Making
Access and Economic Opportunity
Transportation Barriers to Access While accessibility is a product of both the spatial pattern of available activities and the
transportation system, there are cases where transportation creates a barrier to access. The
most commonly cited transportation access barriers are described below.
Transportation Barriers to Access
Vehicle Availability / Ability to Drive
Even though driving is the predominant mode for most people in Appalachia, those without vehicle access or who cannot or choose not to drive face particularly harsh barriers to access in rural areas where transit service is sparse or non-existent and where distances to desired destinations are considerably longer. This barrier is exacerbated by poverty and the aging population of many rural communities.
Network Coverage
Some areas have limited roadway or rail network coverage because of high construction costs associated with topographical barriers like mountains or rivers, coupled with less dense settlement patterns and other spatial constraints.28
Service Availability and Scheduling
Remote areas like those throughout Appalachia tend to be poorly served by freight and transit operators due to low demand. When service is available, schedules may be inconvenient and create significant schedule coordination burdens.
Geometry
The physical design of a roadway can constrain the ability of larger trucks to pass. Relevant dimensions include road width, clearance, turning radius, weight limits, and the existence of passing lanes or shoulders. Similarly, some rail routes may lack the vertical clearance for double-stacked container movements.
Congestion
Particularly in the vicinity of more urbanized areas and major terminals, congestion can constrain mobility. Delay and unreliability associated with congestion reduce the number of activities that can be reliably reached within a given time and cost and thus reduce the level of access provided by the transportation system.
13 Access in Appalachia: A Primer for Measurement and Decision-Making
Accessibility Measurement in Decision Making
Accessibility Measurement in
Decision Making How Can Accessibility Measurement Help?
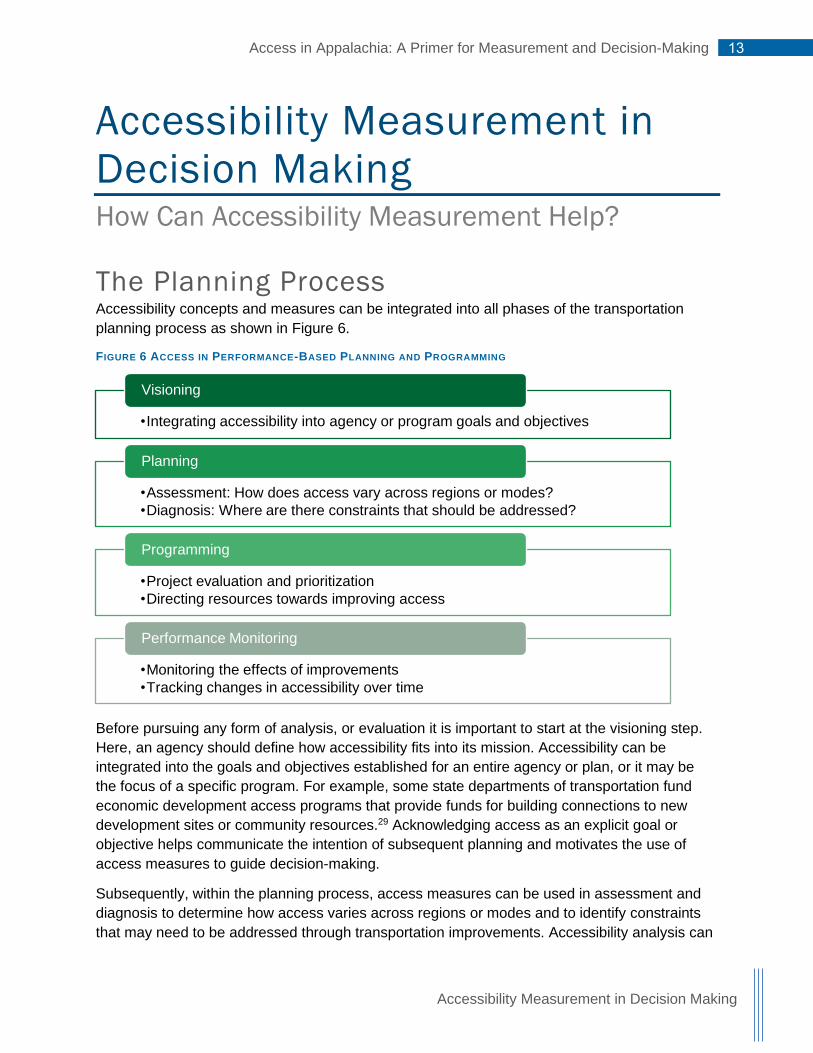
The Planning Process Accessibility concepts and measures can be integrated into all phases of the transportation
planning process as shown in Figure 6.
FIGURE 6 ACCESS IN PERFORMANCE-BASED PLANNING AND PROGRAMMING
Before pursuing any form of analysis, or evaluation it is important to start at the visioning step.
Here, an agency should define how accessibility fits into its mission. Accessibility can be
integrated into the goals and objectives established for an entire agency or plan, or it may be
the focus of a specific program. For example, some state departments of transportation fund
economic development access programs that provide funds for building connections to new
development sites or community resources.29 Acknowledging access as an explicit goal or
objective helps communicate the intention of subsequent planning and motivates the use of
access measures to guide decision-making.
Subsequently, within the planning process, access measures can be used in assessment and
diagnosis to determine how access varies across regions or modes and to identify constraints
that may need to be addressed through transportation improvements. Accessibility analysis can
•Integrating accessibility into agency or program goals and objectives
Visioning
•Assessment: How does access vary across regions or modes?
•Diagnosis: Where are there constraints that should be addressed?
Planning
•Project evaluation and prioritization
•Directing resources towards improving access
Programming
•Monitoring the effects of improvements
•Tracking changes in accessibility over time
Performance Monitoring

14 Access in Appalachia: A Primer for Measurement and Decision-Making
Accessibility Measurement in Decision Making
be integrated into state and metropolitan planning organization (MPO) long-range plans in the
context of evaluating current or forecasted future needs. Developing data and maps highlighting
areas with lower levels of access can support the targeting of investments both by those
developing the plans and by local planning partners.
Moving from broad diagnostics to developing programs of projects, access measures can serve
as criteria for project evaluation and prioritization. In this context projects can be scored based
on (1) the level of existing accessibility constraint in the areas served, (2) the degree to which
the proposed project would ameliorate that deficiency, or (3) some combination of the above.
Scoring can be based on quantitative access measures or may involve qualitative scoring (e.g.,
from 1 to 5) based on the judgement of planners with local knowledge. Incorporating
accessibility criteria into prioritization helps decision-makers direct resources towards their goal
of improving access in a way that is transparent and consistent across projects.
Finally, access measures may be incorporated into performance monitoring to track changes
over time, including monitoring the effects of project improvements. This is perhaps the least
developed area of access measurement but represents an opportunity as states and regions
more fully implement federal guidance on performance-based planning and programming.30 To
build accessibility into performance monitoring requires measurement approaches that use data
that is cyclically and consistently updated over time. While federal sources such as the U.S.
Census Bureau provide this for many forms of activity data, transportation network performance
data is more varied in its availability and how frequently it is updated. Data availability is
discussed more fully in the section that starts on page 16 of this primer.
Source: ARC

15 Access in Appalachia: A Primer for Measurement and Decision-Making
Accessibility Measurement in Decision Making
Comparative Analyses Accessibility measures, like many performance measures,
are most useful for decision support when interpreted
comparatively. This can include:
• Comparing across places to identify locations that
face access disadvantages. For example, one
might choose to focus specifically on areas within
the bottom 10% of accessibility scores.
• Comparing relative to benchmark or standard of acceptable access. For example, a
2002 directive from the Ministries of Health Services and Health Planning in British
Columbia, Canada, sets minimum requirements for access to acute health care,
including “Access will be provided to emergency services on a 24/7/52 basis within a
one hour travel time for 98% of residents within the region.”31
• Comparing accessibility with and without a project. To make a comparison, an
analyst must use forecasting tools to estimate changes in travel time or cost from a
transportation project and calculate the accessibility metric in both the base and build
cases.
• Comparing among projects. Particularly for prioritization, projects can be ranked
according to their accessibility or their accessibility improvement scores. Alternately,
accessibility scores may be integrated into a weighted multicriteria evaluation framework
where projects are ranked according to composite performance across many categories.
• Comparing over time. As describe above, this supports performance management and
tracking of how well transportation agencies are meeting their goals.
• Comparing across user groups. Sometimes specific groups are disproportionately
affected by access constraints. In this case it can be helpful to compare accessibility
across user groups. For example, one might weight accessibility scores by measures of
the number of people below the poverty level in that zone or by the proportion of
households without cars. Alternately, an analyst might first select areas that fall below or
above a certain threshold–i.e., a designated level representing high unemployment–and
then compare accessibility scores for areas in that subgroup to accessibility for those
that are not.
Application The application of access measurement to decision-making includes (1) a combining of spatial
and transportation network data in an analysis to understand what is accessible from different
points in a region. This information is then used (2) in a comparative fashion to rank levels of
access across communities. Finally (3), when considering projects, this information can be used
to give greater priority to projects that address current access deficiencies and are expected (or
modeled) to yield access improvements. Within a planning process, steps 1 and 2 might happen
in the context of a long-range plan or special study, while step 3 could occur in the context of
programming projects.
COMPARE ▪ Across places ▪ Relative to a standard ▪ With and without a project ▪ Among projects ▪ Over time ▪ For different users

16 Access in Appalachia: A Primer for Measurement and Decision-Making
A Framework for Measurement
A Framework for Measurement Focus on the Success of People and Businesses
Key Metrics Both people and businesses rely on access. While businesses need access to labor, suppliers,
and markets to be economically successful, people need access for both economic and social
well-being.
As people’s needs are not limited to work, destinations to be considered go far beyond potential
employers. Education, health care, shopping, and recreation are also needs that people have
and should be addressed. Corresponding destinations should also be accessible and are of
great importance for economic outcomes. Education provides qualification for a wider range of
jobs with higher earnings; accessible health care supports people’s workforce participation and
productivity; and recreational opportunities help people stay healthy, make communities more
attractive, and can themselves be a driver of economic activity.
Such a broad view of accessibility requires a wide range of accessibility metrics. As described in
Figure 3, the user group and the destination are their main descriptors. In their combination, the
user group may make a metric more specific by defining for whom the specific destination is
important. Schools as a destination, for example, are most important for students under age 18.
Theoretically, a system of metrics based on all possible combinations of user groups and
destinations, including the mode by which the destination can be reached, would give full
flexibility to choose the metrics that seem most appropriate for the intended use. However, to
focus analysis on what is most important, it is helpful to limit the number of metrics. Appalachia
serves as the guiding principle for that step.
The following suggestion of key metrics is based on a literature review and on interviews within
the Appalachian Region. The set of metrics is intended to cover major accessibility, businesses
and people may have. Additional detail on the reasons behind these selections and the types of
data that can be used to support these measures can be found in the full research report,
Access in Appalachia: Concept and Methodologies, available on the ARC website. The report
also lists complementary metrics that can add information and address individual agency needs.

17 Access in Appalachia: A Primer for Measurement and Decision-Making
A Framework for Measurement
Access for Businesses Businesses have three main access needs: for workers, supply chain, and delivery. Intermodal
nodes may serve as destinations for both supply chain and delivery to extend the geographic
reach of businesses.
As destinations for specific businesses are unknown and can only be captured in the abstract,
the spatial distribution of employment is suggested for use as a representation of potential
suppliers, while the distribution of population may serve as the representation of potential
consumers.
TABLE 3 SUGGESTED KEY METRICS FOR BUSINESSES’ ACCESS
Business Specification Access to …
Destination Specification
All Labor Associate's or higher
Manufacturing Supply chain Employment
All
Trade & Warehousing Delivery Consumers Population
Manufacturing and Trade & Warehousing Intermodal
connectivity
a) Rail facility All freight rail facilities
b) Port Coastal port
All c) Airport All
Access for People People’s needs to access places center on employment, education, health care, shopping, and
recreation. While some of these destinations are important to everybody, employment and
education are more important for certain age groups than for others. Defining the user group
more specifically may help the metric to portray accessibility more accurately. Note that town
centers were identified as a way to represent locations where retail and other services tend to
be concentrated in rural areas.
TABLE 4: SUGGESTED KEY METRICS FOR PEOPLE’S ACCESS
Population Specification
Access to …
Destination specification
Age 18–65 Job Employment
Age 18–24 Education College All
All Health care
a) Primary care General practice
b) Trauma center All
c) Addiction treatment center All substance abuse
All Town centers All
All Tourist destination National and State Designated
18 Access in Appalachia: A Primer for Measurement and Decision-Making
A Framework for Measurement
Broadband Access Broadband internet can assist in bridging gaps where physical accessibility is insufficient for any
or all groups of the population. To work from home, to attend online educational programs, or to
use telehealth services may make a place with poor physical access more livable. However,
each of these requires broadband internet of a sufficient speed/quality.
TABLE 5: SUGGESTED KEY METRICS FOR BROADBAND ACCESS
Access to … Sufficient Speed/Technology
Mobile Broadband (i.e., cell phones) LTE
Fixed Broadband (i.e., at home) ≥ 25/3 Mbps download/upload
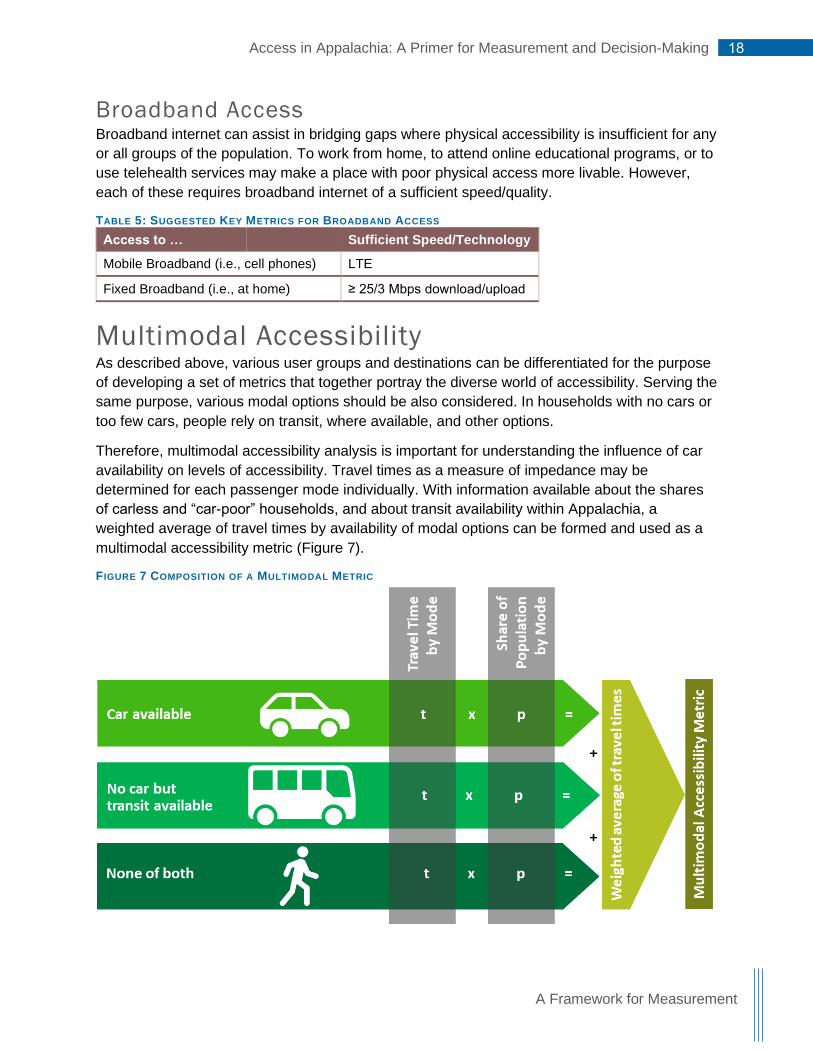
Multimodal Accessibility As described above, various user groups and destinations can be differentiated for the purpose
of developing a set of metrics that together portray the diverse world of accessibility. Serving the
same purpose, various modal options should be also considered. In households with no cars or
too few cars, people rely on transit, where available, and other options.
Therefore, multimodal accessibility analysis is important for understanding the influence of car
availability on levels of accessibility. Travel times as a measure of impedance may be
determined for each passenger mode individually. With information available about the shares
of carless and “car-poor” households, and about transit availability within Appalachia, a
weighted average of travel times by availability of modal options can be formed and used as a
multimodal accessibility metric (Figure 7).
FIGURE 7 COMPOSITION OF A MULTIMODAL METRIC

19 Access in Appalachia: A Primer for Measurement and Decision-Making
Developing Accessibility Metrics
Developing Accessibility Metrics How to Get Started
Identifying Methods, Data, and Resources There is a variety of data for potential use to measure accessibility. The main purpose of this
primer is to prompt engagement by transportation decision-makers with accessibility metrics. It
is expected that approaches to accessibility measurement will vary across states, MPOs and
agencies in the Appalachian Region. Each organization will have their own data, tools, and
partners involved in accessibility measurement. This primer’s intention is to show how to
measure accessibility, recognizing that any given approach may be right for some parts of the
Region but not for others.
However, identifying identical data and metrics for the entire Region would provide interesting
opportunities to compare accessibility across Appalachia in a consistent manner.
For User Groups The user group is at the origin from which any accessibility measure is calculated. It includes
both the specific constituency for which accessibility is measured and the geographic point that
represents where the constituency is located.
The geography can be captured in different ways. The first option is to use a pre-existing zonal
system like traffic analysis which are used in travel demand models or census-defined statistical
zones. Within each zone, a population-weighted, employment-weighted, or geographic centroid
is chosen to represent the zone and to be the starting point of accessibility measurements. A
second option is to use a standardized grid system, where accessibility is measured for each
cell (e.g., 1 km x 1 km). Each option offers a different scale, leading to a more or less granular
description of accessibility.
A third option for geographic definition of origins may be to measure access for each location of
interest, e.g., for each business of a certain size. A fourth option is to calculate a level of
accessibility for each zone, weighted by measure of the number of affected users, e.g., a policy-
targeted measure such as number of people living below the poverty line.
For the Appalachian Region, given its scale and assuming a desire to conduct consistent
comparative analysis, using a pre-defined standardized geography may be preferable. Because
significant portions of Appalachia are sparsely populated, population or employment affected
should be used as a weight. Insufficient access should not be deplored where areas are largely
uninhabited. Weighting of user groups may additionally be extended to specific criteria that
capture dimensions of economic disadvantage of people or businesses.

20 Access in Appalachia: A Primer for Measurement and Decision-Making
Developing Accessibility Metrics
For Destinations There are two fundamentally different approaches to defining destinations in an analysis. The
first one is access to locations where activities happen, e.g., work (jobs), education, health care,
or other services for people, or access to employees, markets, or customers for businesses.
Some analyses simply count the number of establishments of a certain type (e.g., schools,
restaurants), while others use indicators of magnitude, such as employment or population, to
account for the scale of the destination’s attractiveness. The second understanding of
destinations is access to important nodes on the transportation network such as highway
interchanges, transit stations, or intermodal freight terminals. Such measures bring attention to
the availability of modal options or proxy for the greater levels of access provided by these
network “entry points.”
Source: ARC
The Appalachian Region with its specific characteristics may call for a selection of destinations
based on a hierarchy of need. However, given the sparseness of the transportation network in
some parts of Appalachia, measures that focus on network access may also be appropriate. It
should be considered that gains in access achieved by projects in the more sparsely populated
rural areas can be smaller in magnitude but represent greater proportional gains relative to
existing conditions when compared to similar changes in urban areas.

21 Access in Appalachia: A Primer for Measurement and Decision-Making
Developing Accessibility Metrics
Specific data for user groups and their specific geo-
graphic location (origins) as well as for destinations
can be found in both the public and private realm. For
population and employment, public census data is
broadly available with a great level of detail. This
gives a lot of flexibility when designing accessibility
metrics, because they can be targeted to specific
population groups or business industries. However,
the use of both geographic and industry detail for
employment may require the purchase of proprietary
data, which is available from different vendors.
Some data about destinations is collected by non-governmental organizations. This is for
example the case for location data for health care providers.
For Network Availability and Conditions Network availability and performance determines (a) whether access is possible by a given
mode, and (b) the “impedance” or effective resistance limiting access between the selected
users and destinations of interest. Typical transportation performance variables like travel time,
distance, and reliability, as well as direct costs like tolls/fares, determine the barriers to access
perceived by travelers. A specific functional form dictates how impedance is quantified in the
access measure.
There exist several categories of network data:
• Network data may contain the network topology
and characteristics like speed, from which travel
times can be determined. Examples of this
include OpenStreetMap, the Highway
Performance Monitoring System (HPMS), and
the Freight Analysis Framework (FAF).
• Other sources contain pre-calculated travel time information, which may be estimated
based on network characteristics or actually
observed travel times. Examples for the latter
include the National Performance Management
Research Data Set (NPMRDS), HERE data,
TomTom, and Esri StreetMap Premium.
• Routing systems provide a way to find the fastest routes between points and calculate
associated travel times. They may be network data agnostic (e.g., Esri’s Network Analyst) or
comprise integrated network data and routing systems. Examples for the latter include Esri
ArcGIS Online (AGOL) and Google Maps.
• Tools for importing network data into routing systems provide interoperability between routing
tools and data sets. For example, there are many ways to process and import OpenStreetMap
data into routing systems.
Attributes of Origin / Destination Data ▪ Geographic resolution of data ▪ Zonal or point data ▪ Availability of data ▪ Public or proprietary data ▪ Commercially offered or publicly
available NGO data
Categories of Net-work Data and Tools ▪ Network data (topology and
characteristics) ▪ Pre-calculated travel times ▪ Routing systems ▪ Tools to import network data into
routing systems ▪ Non-network transportation nodes
and coverage data

22 Access in Appalachia: A Primer for Measurement and Decision-Making
Developing Accessibility Metrics
• Non-network transportation nodes and coverage data do not allow full network-based routing
but contain data on the location of key multimodal transportation nodes or coverage of service.
In this category, the National Transportation Atlas Database (NTAD) includes location data
for intermodal freight facilities, ports, and airports. The Federal Communications Commission
publishes data on fixed broadband and mobile wireless coverage.
Example Implementation We calculate and map an access to trauma centers metric for four counties in West Virginia,
according to the following methodology:
User Group: While for certain health care facilities it may seem reasonable to focus on specific
age groups, for level 1 and 2 trauma centers all population is seen as the user group. We use
census block groups as the geographic units for measurement at users’ origin. Access to
trauma centers is a population-oriented measure. Therefore, the centroids from which travel
times to trauma centers are measured are population-weighted block group centroids, with
corrections to geometric centroids as necessary where the population-weighted centroid is
located outside of the block group.
Destinations: Level 1 and 2 trauma
centers located within the vicinity of our
test area were identified by address, using
the American Trauma Society’s “Find Your
Local Trauma Center” tool.32 These
addresses were then geocoded using
ArcGIS Online. Only four trauma centers
were considered, all of which are situated
outside of the study region. A full
implementation of this measure would
involve mapping other relevant trauma
centers as well.
Network/Impedance: Travel times were
calculated using the “Find Closest
Facilities” tool of ArcGIS Online,
calculating car drive times for this metric,
without identifying a specific time of day for
the calculations.
Results and Recommendations. Figure 8
maps accessibility to the closest trauma
center within our test area. As accessibility
in this case is not weighted by the
importance of the destination or the
number of trauma centers within a given
area, accessibility is mapped directly as the travel time. The demonstration illustrates how a
Source: ARC

23 Access in Appalachia: A Primer for Measurement and Decision-Making
Developing Accessibility Metrics
nearest destination metric can be developed and mapped to show where access is more or less
constrained.
FIGURE 8 TRAVEL TIME TO THE CLOSEST LEVEL 1 AND 2 TRAUMA CENTER (SAMPLE MAP)
Source: EBP analysis using data from the census, extracted using IPUMS NHGIS, the American Trauma
Society, and ArcGIS Online.

24 Access in Appalachia: A Primer for Measurement and Decision-Making
Moving Forward
Moving Forward
Opportunity It is now becoming possible to build upon existing information sources and analysis tools to
measure and portray levels of access among areas and constituencies. If desired, this can be
done in terms of access to jobs, customers, health care, education, and other fields. The
resulting insights can be critical in improving various transportation planning and decision
processes:
• To improve areawide long-range transportation planning, by identifying areas of greatest
accessibility deficiency and need for improvement;
• To improve transportation investment prioritization, by giving weight to projects that address
the most critical accessibility improvement needs;
• To improve project planning, by identifying project alternatives that maximize improvement
in accessibility and economic opportunity.
There are many ways for regional and state agencies to work together to acquire and apply
relevant datasets, develop mutual learning, and share knowledge to apply accessibility
measurement methods.
Outlook ARC’s continued mission is to “innovate, partner, and invest to build community capacity and
strengthen economic growth in Appalachia.33” It is in this spirit that ARC has been advocating for
issues concerning rural Appalachia. Accessibility has been one of ARC’s major concerns when
looking at obstacles to economic outcomes.
Through this research and the resulting guidance document, ARC has developed an overview
of specific Appalachian needs for access and ways to measure those types of access. In the
future, ARC will continue to work collaboratively with and support state and regional partners in
identifying access constraints and opportunities for improvements, including possible additional
research and development of technical assistance tools.

25 Access in Appalachia: A Primer for Measurement and Decision-Making
Moving Forward
References
1 W. G. Hansen, “How Accessibility Shapes Land Use,” Journal of the American Institute of Planners 25, no. 2 (1952): 73-
76.
2 Susan Hanson, “Introducing Urban Transportation,” in The Geography of Urban Transportation, eds. G. Giuliano and S.
Hanson, 4th ed. (New York, NY: Guilford).
3 Economic Development Research Group, Inc., and Investment Consulting Associates, The Role of Transportation in
Private Firm Site Selection Decisions: A Primer for Transportation Planners and Decision-makers (Washington, D.C.:
United States Department of Transportation, September 2018), Weblink.
4 Glen Weisbrod et al., Assessing Productivity Impacts of Transportation Investments, NCHRP Report 786 (Washington,
D.C.: Transportation Research Board, 2014), Weblink.
5 World Bank, “Transport and Accessibility,” October 28, 2016, Weblink.
6 Naomi Stein, “Accessibility,” in Encyclopedia of the UN Sustainable Development Goals, eds. W. L. Filho, U. Azeiteiro, A.
M. Azul, L. Brandli, G. Özuyar, and T. Wall (New York, NY: Springer, 2009).
7 Derived in part from: Geurs and Wee. Accessibility measures: a literature review. Weblink.
8 Glen Weisbrod et al., Assessing Productivity Impacts of Transportation Investments, NCHRP Report 786 (Washington,
D.C.: Transportation Research Board, 2014), Weblink.
9 Economic Development Research Group, Inc., and Investment Consulting Associates, The Role of Transportation in
Private Firm Site Selection Decisions: A Primer for Transportation Planners and Decision-makers (Washington, D.C.:
United States Department of Transportation, September 2018), Weblink.
10 EDR Group and WSP/Parsons Brinkerhoff, 2017.
11 Brian Alstadt, Glen Weisbrod, and Derek Cutler, “The Relationship of Transportation Access and Connectivity to Local
Economic Outcomes: A Statistical Analysis,” Transportation Research Record 2297, accessed December 11, 2018,
Weblink.
12 Amazon, “Amazon HQ2 RFP,” 2017, Weblink.
13 National Center for Education Statistics: Rural Education in America, Data for 2015, Weblink.
14 Molefe, A., Burke, M. R., Collins, N., Sparks, D., & Hoyer, K. (2017), “Postsecondary education expectations and
attainment of rural and nonrural students” (REL 2017–257), Washington, DC: U.S. Department of Education, Institute
of Education Sciences, National Center for Education Evaluation and Regional Assistance, Regional Educational
Laboratory Midwest, Weblink.
15 Science Foundation Arizona, “Making a Difference: Community Colleges Are Key Drivers of Rural Development,”
accessed December 11, 2018, Weblink.
16 Andrew Crookston and Gregory Hooks, “Community Colleges, Budget Cuts, and Jobs: The Impact of Community Colleges
on Employment Growth in Rural U.S. Counties, 1976-2004,” Sociology of Education 84, no. 4 (2012): 350-372.
17 Rural Health Information Hub, “Transportation to Support Rural Healthcare,” January 11, 2016, Weblink.
18 Rural Health Information Hub, “Transportation to Support Rural Healthcare,” January 11, 2016, Weblink.
19 National Academies of Sciences, Engineering, and Medicine, “Cost-Benefit Analysis of Providing Non-Emergency
Medical Transportation,” Washington, D.C.: The National Academies Press, 2005, Weblink.
20 Antonio Paez, et al., “Accessibility to health care facilities in Montreal Island: an application of relative accessibility
indicators from the perspective of senior and non-senior residents,” International Journal of Health Geographies 9
(2010), accessed December 11, 2018, Weblink.
21 Samina T. Syed, Ben S. Gerber, and Lisa K. Sharp, “Traveling Towards Disease: Transportation Barriers to Health Care
Access,” Journal of Community Health 38 (2013): 976-993.
22 Appalachian Regional Commission, “Health Disparities in Appalachia,” August 2017.
23 National Association of Community Health Centers: Removing Barriers to Care: Community Health Centers in Rural
Areas, Weblink.
24 Christine Hancock, et. al, “Treating the Rural Opioid Epidemic,” National Rural Health Association, February 2017,
Weblink.
25 Sara Lawrence, Zachary Oliver, Michael Hogan, and Sara VanLear, “Program Evaluation of the Appalachian Regional
Commission’s Telecommunications and Technology Projects: FY 2004-FY 2010,” Washington, D.C.: Appalachian
Regional Commission, November 2015, Weblink.
26 Access in Appalachia: A Primer for Measurement and Decision-Making
Moving Forward
26 Federal Communications Commission, “Remarks of Commissioner Mignon L. Clyburn at the Launch of the Mapping
Broadband Health in America Platform,” Microsoft Innovation and Policy Center, August 2, 2016.
27 Tomer, A., et al., “Signs of Digital Distress,” The Brookings Institute, Metropolitan Policy Program, September 2017.
28 Stein, 2009.
29 For example, Virginia DOT’s Local Assistance Access Programs: Weblink.
30 FHWA. Performance Based Planning and Programming. Weblink.
31 British Columbia Ministries of Health Services and Health Planning, “Standards of Accessibility and Guidelines for
Provision of Sustainable Acute Care Services,” 2002. Weblink.
32 American Trauma Society, “Find Your Local Trauma Center,” Weblink
33 Appalachian Regional Commission, “Investing in Appalachia’s Future, The Appalachian Regional Commission’s Five-
Year Strategic Plan for Capitalizing on Appalachia’s Opportunities, 2016−2020,” Weblink
Related Documents