1 A Premier Mid-Tier Zinc Producer Trevali Mining Corporation – Corporate Presentation TSX: TV BVL: TV | www.trevali.com | September 2017

Welcome message from author
This document is posted to help you gain knowledge. Please leave a comment to let me know what you think about it! Share it to your friends and learn new things together.
Transcript

1
A Premier
Mid-Tier Zinc Producer
Trevali Mining Corporation – Corporate Presentation
TSX: TV BVL: TV | www.trevali.com | September 2017

Disclaimer1
21Please refer to Appendix: Disclosures for important items relating to the resource estimates and production plans.
Certain statements contained in this document, including, without limitation, those concerning the economic outlook for the mining industry, expectations regarding
metal prices and production, the potential acquisition transaction described herein (the “Transaction”) and the expected benefits thereof, the commercial
operations of certain of Trevali Mining Corporation’s (“TV”) projects, and its liquidity and capital resources and expenditures, contain certain forward-looking
statements regarding TV’s economic performance, financial condition as well as assumptions regarding normal operating conditions, cost guidance and production
guidance with respect to its operations, including pro forma operations, and assuming completion of the Transaction. Although TV believes that the expectations
reflected in such forward-looking statements are reasonable, no assurance can be given that such expectations will prove to have been correct. Accordingly,
results could differ materially from those set out in the forward-looking statements as a result of, among other factors, changes in economic and market conditions,
success of business initiatives, changes in the regulatory environment and other government actions, fluctuations in metal prices and exchange rates, and
business and operational risk management. TV undertakes no obligation to update publicly or release any revisions to these forward-looking statements to reflect
events or circumstances after the date of the annual report. All subsequent written or oral forward-looking statements attributable to TV or any person acting on its
behalf are qualified by the cautionary statements herein.
Trevali's production plan at the Caribou Mine is based only on measured, indicated and inferred resources, and not mineral reserves, and does not have
demonstrated economic viability. Trevali’s production plan at the Santander Mine is based only on measured, indicated and inferred mineral resources, and not
mineral reserves, and does not have demonstrated economic viability. Production plans at the Rosh Pinah and Perkoa mines are based on both proven and
probable reserves in addition to measured, indicated and inferred resources. Mineral resources that are not mineral reserves do not have demonstrated economic
viability. Inferred mineral resources are considered too speculative geologically to have the economic considerations applied to them that would enable them to be
categorized as mineral reserves, and there is therefore no certainty that the conclusions of the production plans and Preliminary Economic Assessment (PEA) will
be realized. Additionally, where Trevali discusses exploration/expansion potential herein, any potential quantity and grade is conceptual in nature and there has
been insufficient exploration to define a mineral resource and it is uncertain if further exploration will result in the target being delineated as a mineral resource.
There can be no assurance that the Transaction will be successfully completed as it will be subject to the satisfaction of a number of conditions including, without
limitation, Trevali shareholder approval and Transaction financing.

Zinc: Demand and Supply
3
➢ Global zinc demand continues to rise (from 2-4%
per year, approx. 280,000-560,000 tonnes/year) -
driven by GDP growth, urbanization & infrastructure
development, and as a “mid-cycle” commodity with
expanding markets for consumer goods
(automobiles, appliances, etc.)
➢ Primary zinc supply is in deficit following the
closures of a number of global marquee mines
(Brunswick 12, Century and Lisheen) over that past
few years, plus production cutbacks from major
producers
➢ Consensus forecast of significantly tightening zinc
market over the next several years
➢ Benchmark zinc smelter treatment charges (“TCs”)
dropped significantly in 2016, and even further in
2017 down to approx. US$172/tonne with no
smelter price participation (0% escalators) – a drop
from approx. US$260/tonne realized price in Q4-
2016
➢ Wood Mackenzie forecasting US$1.23/lb
(US$2700/tonne) zinc long-term price
➢ Zinc smelters scaling back/curtailing refined zinc
metal production due to concentrate shortages
Global zinc inventories (LME & SHFE) are approaching an 8-year low while prices are
forecast to increase

A Premier Zinc Producer
4
● Santander zinc mine in Peru in fourth year of commercial production and has delivered
consistent, strong operational performance
● Caribou zinc mine in Canada successfully achieved commercial production in 2016
Production in
Peru and
Canada
● 2017 YTD average daily trading volume of approximately 4 million sharesStrong trading
liquidity
➢ A Global Pure-Play Zinc Producer – Strong zinc leverage with
approximately 85% of revenue derived from zinc production*
➢ Successfully brought two zinc mines into production and acquired two
additional producing zinc mines to become a Global Top-10 Zinc Producer
➢ Zinc production now to take advantage of zinc deficits now
➢ Strong organic growth potential at all projects
➢ Proven management and technical teams
Please refer to Appendix: Disclosures for important items relating to the resource estimates, PEA and production plans.*Represents forward looking information (including metal/commodity price forecasts); assumes normal operating conditions, achievement of production and cost
guidance.
● Completely refinanced balance sheet significantly reduces cost of capital
● Increased covenant flexibility to pursue additional growth opportunities
● Glencore a cornerstone, strategic shareholder (25.6%)
Strengthened
Position
● Recently acquired the Rosh Pinah mine in Namibia and Perkoa mine in Burkina Faso
from Glencore
● More than a 150% increase in Trevali’s forecast annual zinc production - creating a
Global Top-10 Zinc Producer
Acquired
additional zinc
mines in Africa

5
Transforms Trevali
into a Premier
Intermediate Zinc
Company
Significantly
Increases Production
Scale While
Maintaining Attractive
Margins
Enhances Cash Flow
Generation and
Maintains
Conservative Balance
Sheet
Creates Platform for
Future Growth
➢ Significantly enhances Trevali’s position as the “go-to” name for zinc exposure
➢ Increases capital markets profile with market capitalization of plus-C$1 billion
➢ Enhances asset diversification with four producing assets across global platform
➢ Maintains conservative balance sheet with strong free cash flow generation*
➢ More than doubles Trevali’s 2017E production to approx. 410* million lbs. Zn and approx. 470* million lbs. ZnEq
➢ Maintains current operating margins and attractive leverage to zinc prices
➢ Increases leverage to zinc with zinc representing about 85%* of total metal production revenue
➢ Completely refinanced balance sheet significantly reduces cost of capital and increases covenant flexibility to
pursue potential M&A opportunities
➢ Low cost debt (terms of LIBOR + 3-4% and 5-year term)
➢ Transaction more than doubles Trevali’s projected 2017E EBITDA
➢ Maintains conservative balance sheet and low debt-to-EBITDA ratio
➢ Increases scale and creates a platform to enable future growth
➢ Positions Trevali to compete for world’s best zinc / base metal assets from a position of strength
➢ Further builds on long standing strategic relationship, with Glencore becoming a cornerstone investor (25.6%) in
Trevali
➢ Addition of Glencore’s industry leading operating and management teams
Glencore African Zinc Mines Acquisition: Benefits to Trevali
Shareholders*
Attractive Transaction
Economics
➢ Transaction is expected to be accretive to existing Trevali shareholders on a projected cash flow* per share and
projected NAV* per share basis at spot prices
Source: Company data, management estimates.
Analysis shown on attributable basis using mid-point of guidance; based on spot pricing of US$1.30/lb Zn, US$1.05/lb Pb, US$2.70/lb Cu, US$1,235/oz Au, and US$17.85/oz Ag.
Perkoa reflects effective 100% interest based on current LOM.*Represents forward looking information (including metal/commodity price forecasts); assumes normal operating conditions, achievement of production and cost guidance.

6
603
570
463
406 405
326
263 255 244
232
174 166 163 163 156
1% 16% 19% 14% 68% 74% 11% 86% 11% 20% 7% n.a. 20% 7% 3% 20% 3% 2% 73%
Glencore Vedanta Teck Boliden Volcan Milpo MitsuiMining
ProFormaTrevali
DowaHoldings
LundinMining
Goldcorp SociedadMinera El
Brocal
Hudbay Nyrstar South32 KAZMinerals
SouthernCopper
GrupoMéxico
Trevali
2,412 1,854 1,459 726
Source: Company data, FactSet, SNL
Analysis shown on consolidated basis using 2016 actual production in million lbs; excludes MMG due to mine shutdown in 2016; excludes Hindustan Zinc due to consolidation by
Vedanta; Teck excludes refined zinc production/sales.
Zinc % of total revenue calculated based on zinc production at an assumed price of US$0.93/lb Zn for 2016 divided by total revenue; Glencore % based on industrial metals revenue.
Trevali based on attributable 2017E metrics due to expected ramp-up. Represents forward looking information (including metal/commodity price forecasts); assumes normal operating
conditions, achievement of production and cost guidance.
Trevali Moves to 8th Largest Zinc Producer Globally1
1
FY2016 Zinc % of Total Revenue (%)
FY2016 Zinc Production (mm lb)
Trevali is projected to sit in the middle of the C1
cost curve1

7
Source: Trevali data, Glencore data and management estimates
Analysis shown on attributable basis using mid-point of 2017 guidance and full year production.
Perkoa reflects effective 100% interest based on current LOM. Caribou commenced commercial production on July 1, 2016.*Represents forward looking information (including metal/commodity price forecasts); assumes normal operating conditions, achievement of production and cost guidance.
2016 Zinc
Production
Perkoa, Burkina Faso
➢ Producing since 2013
➢ 2017E zinc production guidance of 165-170* million payable lb
➢ 2017E total site cash cost guidance of US$95-100/tonne* milled
➢ 2017E AISC guidance of US$0.83-0.87/lb* Zinc
Rosh Pinah, Namibia
➢ Producing since 1969
➢ 2017E zinc production guidance of 80-84* million payable lb
➢ 2017E total site cash cost guidance of US$45-50/tonne* milled
➢ 2017E AISC guidance of US$0.68-0.72/lb* Zinc
Santander, Peru
➢ Producing since 2013
➢ 2017E zinc production guidance of 52-56* million payable lb
➢ 2017E total site cash cost guidance of US$35-40/tonne* milled
➢ 2017E AISC guidance of US$0.66-0.70/lb* Zinc
Caribou, Canada
➢ Producing since 2015
➢ 2017E zinc production guidance of 90-93* million payable lb
➢ 2017E total site cash cost guidance of US$55-60/tonne* milled
➢ 2017E AISC guidance of US$0.84-0.88/lb* Zinc
Caribou68 mm lb
Caribou*90-93 mm lb
Santander61 mm lb
Santander*63-65 mm lb
Rosh Pinah*80-84 mm lb
Perkoa*165-170 mm lb
129 mm lb
2016 2017E
398-412* mm lb
Production and Cost Profile*
2017E Zinc
Guidance
~215%

Trevali Capital Structure
81 Details of outstanding options and warrants can be found in the Appendix: Options and Warrants
TSX:TV | BVL(Lima):TV | US-OTCQX: TREVF
Trevali one-year share price performance
Share Capital
(as of Sept 18, 2017, C$1.41/share)
Shares issued/outstanding: 823 million
Shares fully diluted: 837 million
Market Capitalization: C$1.2 billion
Stock Options1: 11 million
Warrants1: 2.8 million

Trevali Management & Directors
9
DR. MARK CRUISE – PRESIDENT & CEO
Base metal deposit specialist with over 20-years project experience from grass-roots
exploration through resource definition to permitting and production in Europe and the
America’s on behalf of Pasminco Exploration, Anglo American and TSX-listed
companies. Geology Ph.D. on the Irish zinc-lead orefield and was a member of Anglo
American’s Lisheen Zinc-Lead Mine feasibility/technical team in Ireland. Co-founded
Trevali in 2007 to position the Company for anticipated global Zn deficits.
PAUL KELLER, P.ENG. – CHIEF OPERATING OFFICER
28 years of mine operations experience in Canada, most recently as Manager of
Technical Services for a major Canadian mining contractor where he led a team of
engineers and designers on various mining contracts for major mining companies.
Paul began his career with Rio Algom and has also worked in various management
roles with Barrick Gold's Hemlo mine in operations, engineering and maintenance.
ANNA LADD, CMA – CHIEF FINANCIAL OFFICER
Over 15 years experience in the finance and mining industry. Served as VP Finance
and CFO of Sulliden Gold, Crowflight Minerals, Kria Resources and other privately
held exploration companies, in addition to senior positions with mining companies
including Kinross Gold Corporation and has also worked in Thompson and Sudbury
operations for Vale Inco. Ms. Ladd is a Certified Public Accountant and received her
Masters of Arts in Economics from Queen's University, and a Bachelor of Commerce
degree in Finance from the University of British Columbia.
DANIEL MARINOV – VP OF EXPLORATION
Over 24 years of international experience in exploration and underground mining,
and has held senior management roles with Rio Tinto and Anglo American (including
project manager at Anglo's Michiquillay porphyry Cu-Au-Mo deposit in Peru).
STEVE STAKIW – VP CORPORATE COMMUNICATIONS
Over 25 years of geology/mining industry and research/finance market experience.
Steve has held a senior management role with a leading mining research and
investment publication and has consulted to resource-focused investment funds.
DR. MARK CRUISE, PRESIDENT, CEO & DIRECTOR
DAVID HUBERMAN, CHAIRMAN & DIRECTOR
Experienced lawyer specializing in corporate, commercial, banking, securities,
regulatory and mining law. Director of Ivanhoe Mines Ltd. (renamed Turquoise Hill
Resources) from 2003-2012 and its Chairman from 2011-2012.
CHRIS ESKDALE, DIRECTOR
Global Head Industrial Zinc for Glencore Plc.
DAN MYERSON, DIRECTOR
Manages Glencore’s Canadian zinc business and has worked closely with Trevali at
both the corporate and operations level, specifically facilitating technical support to the
Caribou operations.
MIKE HOFFMAN, DIRECTOR - OPERATIONS
Over 25 years global mine development experience including Vice President
Operations at Yamana Gold, Desert Sun and Goldcorp.
CATHERINE GIGNAC, DIRECTOR
Geologist and mining analyst with over 25 years experience at mining companies and
several global brokerage firms (UBS, RBC and Merrill Lynch Canada) as well as
independent firms (Wellington West, Loewen Ondaatje McCutcheon and Dundee).
DAVID KORBIN, DIRECTOR
Chartered Accountant and former Director of Callinan Royalties Corporation,
Turquoise Hill Resources Ltd. (formerly Ivanhoe Mines) and Ivanhoe Mines Australia.
Previous managing partner of Deloitte Touche LLC and also was a Director of
Seaspan Corporation and Chairman of it’s Audit Committee.
ANTON DRESCHER, DIRECTOR
Certified Management Accountant with extensive public company board and officer
experience.
Directors

10
Analysis shown on attributable basis using mid-point of guidance; based on spot pricing of US$1.30/lb Zn, US$1.05/lb Pb, US$2.70/lb Cu, US$1,235/oz Au, and US$17.85/oz Ag.
Perkoa reflects effective 100% interest based on current LOM.*Represents forward looking information (including metal/commodity price forecasts); assumes normal operating conditions, achievement of production and cost guidance.
High-Quality Diversified Assets in Mining-Friendly Jurisdictions
Rosh Pinah
(Namibia)
Perkoa
(Burkina Faso)
Caribou /
Halfmile-Stratmat
(Canada)
Santander
(Peru)
Ruttan
(Canada)
Heath Steele
(Canada)
Zinc Mines
Projects / Other Assets
2017E Attributable Production* (mm lb Zn Eq.)
Caribou128 27%
Santander85
18%Rosh Pinah
90 19%
Perkoa168 36%
Gergarub
(Namibia)

Peru
11

12
● 2,000 tonne-per-day Zinc-Lead-Silver mine and mill complex in
the Central Peruvian Polymetallic Belt
● 2016 production statistics:
▪ 89% Zinc recovery producing 61.3 million payable lbs
▪ 86% Lead recovery producing 19.3 million payable lbs
▪ 71% Silver recovery producing 813,807 payable ozs
● 2016 site cash costs of US$0.32/lb ZnEq1 (payable produced)
or US$34.17/tonne (includes mining, milling and site G&A).
Total (all in) cash cost of US$0.75/lb ZnEq1 (payable produced)
includes site costs plus smelting, refining, freight, royalty and
sustaining capex.
● 2017 metal production guidance:
▪ Zinc – 52-57 million payable pounds
▪ Lead – 12-14 million payable pounds
▪ Silver – 700,000-900,000 payable ounces
▪ Total site cash costs of US$35-40/tonne milled
● Significant exploration potential to expand current resource; all
the deposits remaining open; successful, ongoing drill program
Santander Mine, Peru
Please refer to Appendix: Disclosures for important items relating to the resource estimates and production plans.
* Mineral Reserves (Proven & Probable) included in Mineral Resources1ZnEq Payable Pounds Produced = ((Zn Payable lbs Produced x Zn Price)+(Pb Payable lbs Produced x Pb
Price)+(Cu Payable lbs Produced x Cu Price)+(Au oz Payable Produced x Au Price)+(Ag oz Payable Produced x Ag
Price))/Zn Price.
Location Peru
Ownership 100% controlled
Type of deposit Carbonate Replacement Deposit
Primary metals Zn, Pb, Ag
Processing Standard milling with flotation recovery
End product Zn and Pb-Ag concentrates
Infrastructure Underground mining operation, 2,000 tonne-per-
day processing mill, tailings facility and camp
Santander mine, mill, and infrastructure, Peru
Resource Tonnes Zn (%) Pb (%) Ag (oz/ton)
Proven &
Probable*2,540,000 4.51 0.69 1.09
Measured &
Indicated3,800,000 4.85 0.83 1.23
Inferred 12,000,000 4.22 0.23 0.56

13
1
Santander Mine Development Workings
1

New Brunswick, Canada
14

15
● 3,000 tonne-per-day Zinc-Lead-Silver mine and mill complex in
the Bathurst Mining Camp of New Brunswick, Canada
● 2016 production statistics*:
▪ 77% Zinc recovery producing 36.7 million payable lbs
▪ 58% Lead recovery producing 13.8 million payable lbs
▪ 36% Silver recovery producing 402,067 payable ozs
● 2016 site cash costs of US$0.45/lb ZnEq1 (payable produced) or
US$56.39/tonne (includes mining, milling and site G&A). Total
(all in) cash cost of US$0.92/lb ZnEq1 (payable produced)
includes site costs plus smelting, refining, freight, royalty and
sustaining capex
● 2017 production guidance:
▪ Zinc – 90-93 million payable pounds
▪ Lead – 30-32 million payable pounds
▪ Silver – 800,000-900,000 payable ounces
▪ Total site cash costs of US$55-60/tonne milled
● Deposit remains open to depth
* Declared commercial production July 1/2016
Caribou Mine - Bathurst Mining Camp, New BrunswickLocation Bathurst Mining Camp, New Brunswick
Ownership 100% controlled
Type of deposit VMS polymetallic
Primary metals Zn, Pb, Ag, Cu, Au
Processing Standard milling with flotation recovery
End product Zn, Pb-Ag and planned Cu-Au concentrates
Infrastructure 3,000 tonne-per-day underground mining
operation and processing mill
Caribou mine and milling complex, Bathurst, New BrunswickPlease refer to Appendix: Disclosures for important items relating to the resource estimates and
production plans.1ZnEq Payable Pounds Produced = ((Zn Payable lbs Produced x Zn Price)+(Pb Payable lbs
Produced x Pb Price)+(Cu Payable lbs Produced x Cu Price)+(Au oz Payable Produced x Au
Price)+(Ag oz Payable Produced x Ag Price))/Zn Price.
Resource Tonnes Zn% Cu% Pb% Ag (g/t) Au (g/t)
Measured &
Indicated7,230,000 6.99 0.43 2.93 84.4 0.9
Inferred 3,660,000 6.95 0.32 2.81 78.3 1.2

16
▪ Seven zones in the deposit and
remains open
▪ Copper feeder zones never
previously targeted
▪ Recent deep drilling encountered
massive sulphides approx. 450
metres below current defined
resource
▪ Historic deep holes encountered
significant mineralized intervals
(including DDH076 with 5.8 metres
of 8.4% Zn, 3.9% Pb, 0.3% Cu, 147
g/t Ag and 1.2 g/t Au)
Caribou Exploration Upside
Resources of Caribou Deposit
Tonnes Zn% Cu% Pb% Ag (g/t) Au (g/t)
Measured &
Indicated7,230,000 6.99 0.43 2.93 84.4 0.9
Inferred 3,660,000 6.95 0.32 2.81 78.3 1.2
Please refer to Appendix: Disclosures for important items relating to the resource estimates and production plans.

Namibia
17
18
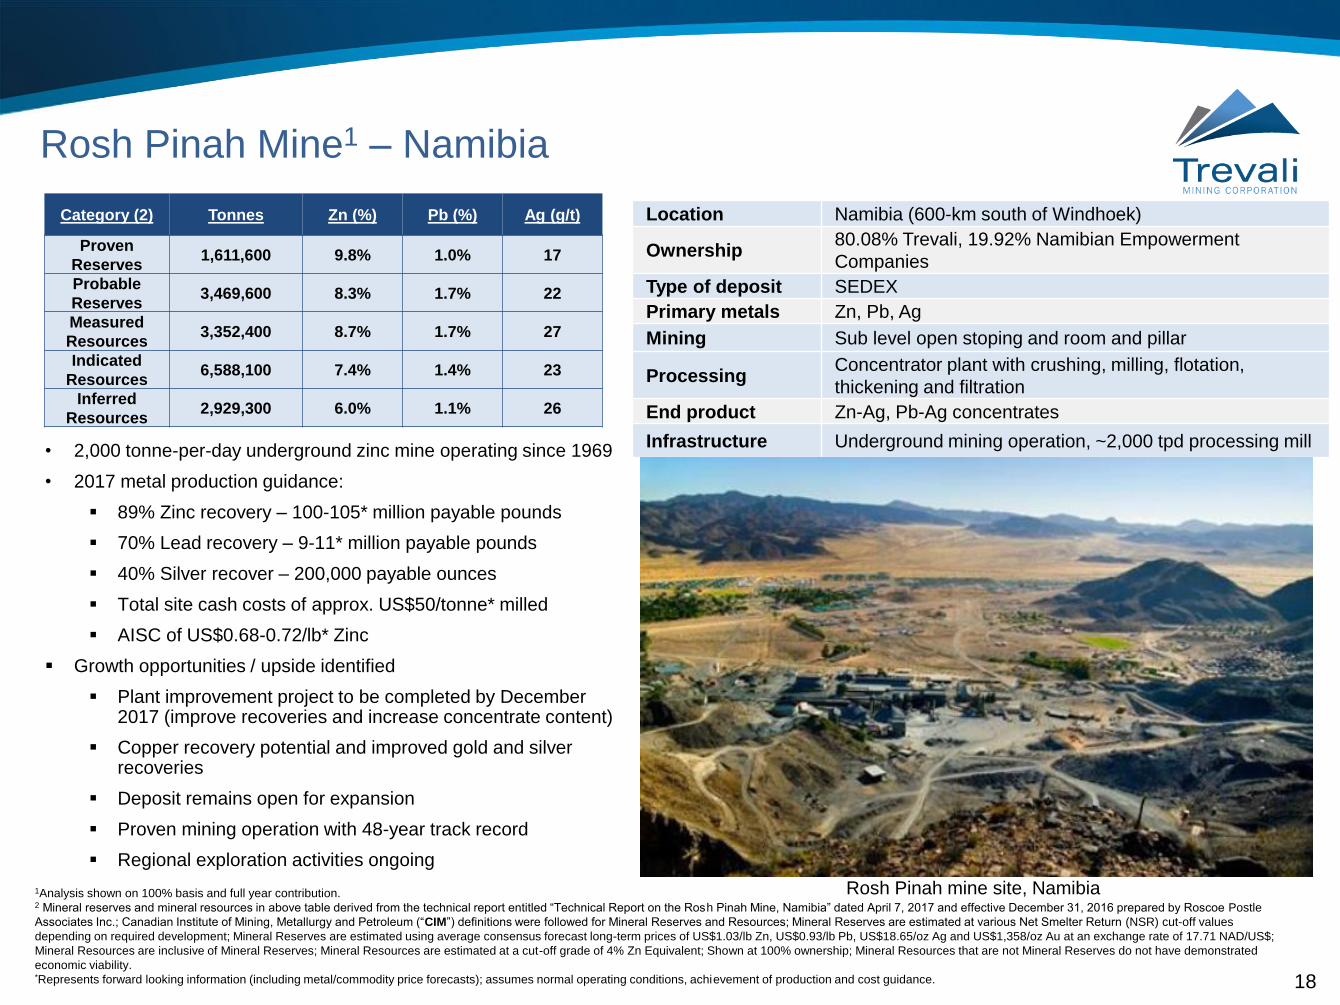
Category (2) Tonnes Zn (%) Pb (%) Ag (g/t)
Proven
Reserves1,611,600 9.8% 1.0% 17
Probable
Reserves3,469,600 8.3% 1.7% 22
Measured
Resources3,352,400 8.7% 1.7% 27
Indicated
Resources6,588,100 7.4% 1.4% 23
Inferred
Resources2,929,300 6.0% 1.1% 26
1Analysis shown on 100% basis and full year contribution. 2 Mineral reserves and mineral resources in above table derived from the technical report entitled “Technical Report on the Rosh Pinah Mine, Namibia” dated April 7, 2017 and effective December 31, 2016 prepared by Roscoe Postle
Associates Inc.; Canadian Institute of Mining, Metallurgy and Petroleum (“CIM”) definitions were followed for Mineral Reserves and Resources; Mineral Reserves are estimated at various Net Smelter Return (NSR) cut-off values
depending on required development; Mineral Reserves are estimated using average consensus forecast long-term prices of US$1.03/lb Zn, US$0.93/lb Pb, US$18.65/oz Ag and US$1,358/oz Au at an exchange rate of 17.71 NAD/US$;
Mineral Resources are inclusive of Mineral Reserves; Mineral Resources are estimated at a cut-off grade of 4% Zn Equivalent; Shown at 100% ownership; Mineral Resources that are not Mineral Reserves do not have demonstrated
economic viability.*Represents forward looking information (including metal/commodity price forecasts); assumes normal operating conditions, achievement of production and cost guidance.
Rosh Pinah mine site, Namibia
• 2,000 tonne-per-day underground zinc mine operating since 1969
• 2017 metal production guidance:
▪ 89% Zinc recovery – 100-105* million payable pounds
▪ 70% Lead recovery – 9-11* million payable pounds
▪ 40% Silver recover – 200,000 payable ounces
▪ Total site cash costs of approx. US$50/tonne* milled
▪ AISC of US$0.68-0.72/lb* Zinc
▪ Growth opportunities / upside identified
▪ Plant improvement project to be completed by December 2017 (improve recoveries and increase concentrate content)
▪ Copper recovery potential and improved gold and silver recoveries
▪ Deposit remains open for expansion
▪ Proven mining operation with 48-year track record
▪ Regional exploration activities ongoing
Location Namibia (600-km south of Windhoek)
Ownership80.08% Trevali, 19.92% Namibian Empowerment
Companies
Type of deposit SEDEX
Primary metals Zn, Pb, Ag
Mining Sub level open stoping and room and pillar
ProcessingConcentrator plant with crushing, milling, flotation,
thickening and filtration
End product Zn-Ag, Pb-Ag concentrates
Infrastructure Underground mining operation, ~2,000 tpd processing mill
Rosh Pinah Mine1 – Namibia

19
Rosh Pinah Exploration Potential*
*Outside of the currently delineated reserves and resources, the exploration potential quality and grade is conceptual in nature and there has been insufficient exploration to define additional
mineral resources. It is uncertain if further exploration will result in the target being delineated as a mineral resource.
Represents forward looking information (including metal/commodity price forecasts); assumes normal operating conditions, achievement of production and cost guidance.
▪ Located on the same underexplored belt as Skorpion, Black
Mountain and Gamsberg
▪ Limited historic exploration – discovery of Gergarub (EM target)
▪ Several quality targets remain
▪ Significant exploration potential remains on EPL2616
▪ Underground exploration activities ongoing – main mining zone –
WF3
▪ Open to the NW
Satellite image of Rosh Pinah and surrounding projects, Namibia
• Drilling from the known to the unknown and extending existing ore
lenses laterally e.g.: North of WF3.
• Low to medium potential targets exist as depth extensions of current ore
bodies, e.g. the down-plunge extensions of the AAB, S1S and WF3.

Burkina Faso
20

21
• 2,000 tonne-per-day underground zinc mine commenced
production in 2013
• 2017 metal production guidance:
▪ 92% Zinc recovery – 165-170* million payable pounds
▪ Total site cash costs of US$95-100/tonne* milled
▪ AISC of US$0.83-0.87/lb* Zinc
• Simple metallurgy – high zinc recoveries (plus-90%)
• Strong CSR receiving recognition for 2 national awards for
community development and significant contribution to
community health program
• Significant exploration potential on 4 adjacent properties /
historical gold occurrences assayed
Perkoa mine infrastructure, Burkina Faso
Location Burkina Faso
Ownership 90% Trevali, 10% Government of Burkina Faso
Type of deposit VMS
Primary metals Zn
Mining Transversal and retreat
Processing Concentrator plant with crushing, milling, flotation,
thickening and filtration
End product Zn concentrate
Infrastructure Underground mining operation, ~2,000 tpd
processing mill
Category (2) Tonnes Zn (%)
Proven Reserves 1,700,000 15.8
Probable Reserves 780,000 13.7
Measured Resources 3,040,000 15.5
Indicated Resources 1,220,000 12.4
Inferred Resources 1,640,000 12.9
1Analysis shown on 100% basis and full year contribution.2Mineral reserves and mineral resources in above table derived from the technical report entitled “Technical Report on the Perkoa Mine, Burkina Faso” dated April 7, 2017 and effective December 31, 2016 prepared by Roscoe Postle
Associates Inc.; CIM definitions were followed for Mineral Reserves and Resources; Mineral Reserves are estimated at an NSR cut-off value of $100/tonne inclusive of capital expenditure, incremental stopes greater than US$78/tonne
are included based on individual financial analysis; Mineral Reserves are estimated using an average consensus forecast zinc price of US$0.99 per pound and a €/US$ exchange rate of 1.11; Shown at 100% ownership; Mineral
Resources are inclusive of Mineral Reserves; Mineral Resources are estimated at a cut-off grade of 5% Zn; Mineral Resources that are not Mineral Reserves do not have demonstrated economic viability).*Represents forward looking information (including metal/commodity price forecasts); assumes normal operating conditions, achievement of production and cost guidance.
Perkoa Mine1 – Burkina Faso

22
Perkoa Exploration Potential*
Perkoa 3D Model illustrating planned resource conversion
and expansion drilling*
Regional geophysics highlighted 46 conductors for follow-up screening
▪ Mineralization remains open at depth
▪ Drill testing in progress
▪ Regionally – 46 EM anomalies identified for follow-up
▪ Licenses never explored for base metals – gold only
*Outside of the currently delineated reserves and resources, the exploration potential quality and grade is conceptual in nature and there has been insufficient exploration to define additional
mineral resources. It is uncertain if further exploration will result in the target being delineated as a mineral resource.
Represents forward looking information (including metal/commodity price forecasts); assumes normal operating conditions, achievement of production and cost guidance.

23
Halfmile Mine - Bathurst Mining Camp, New Brunswick
Location Bathurst Mining Camp, New Brunswick
Ownership 100% controlled
Type of deposit VMS polymetallic
Primary metals Zn, Pb, Ag, Cu, Au
Processing Standard milling with flotation recovery
End product Zn, Pb-Ag and Cu-Au concentrates
Infrastructure Fully permitted and developed underground
mining operation
Resource Tonnes Zn% Pb% Cu% Ag (g/t) Au (g/t)
Indicated 6,262,043 8.13 2.58 0.22 30.8 n/a
Inferred 6,078,200 6.69 1.83 0.14 20.5 n/a
• Fully permitted underground mine with production levels in
place
• Halfmile Mine developed in 2011 with trial underground
mining/production in 2012 of over 100,000 tonnes of material
processed on a toll-basis through the Brunswick 12 Mill -
providing metallurgical/recovery data
• Produced quality, saleable concentrates (Zn, Pb-Ag and Cu-
Au) averaging:
53.7% Zn concentrate
45.8% Pb concentrate (with 680 g/t Ag)
27% Cu concentrate (with 325 g/t Ag and 2.7 g/t Au)
• Significant exploration upside beyond Upper and Lower Zones
that host current resource
• Remains open for expansion -- 3D seismic survey indicates a
large, deep reflector (Deep Zone) that returned multiple,
mineralized drill intercepts including:
5.7 m of 9.88% Zn, 2.33% Pb and 3.9 m of 9.42% Zn, 1% Pb
4.5 m of 10.61% Zn, 1.41% Pb and 0.22% Cu
6 m of 9.61% Zn, 1.93% Pb
5 m of 9.77% Zn, 3.46% Pb and 4.8 m of 7% Zn, 2.27% Pb
• PEA study underway on potential combined Halfmile-Stratmat
development plan
Source: Company data, resource is NI 43-101 compliant. Please refer to Appendix: Disclosures for important items relating to the resource estimates and production
plans.

24
• Multi-lens zinc-lead-silver-copper-gold rich volcanogenic
massive sulphide
• Near-surface sulphide body remains open for expansion
along strike and at depth
• Multi-phase 30,000-metre drill program has returned
results including: Hole RST-752 intersecting 26.75
metres grading 7.42% Zn, 1.37% Pb, 1.26% Cu, 94.2 g/t
Ag and 2.45 g/t Au
• Discovery of new multi-lens zones of copper-gold
mineralization including: Hole ST-793 intersecting 5.7
metres of 15.9% Zn, 7% Pb, 0.54% Cu and 98 g/t Ag
plus a higher-grade copper zone of 35 metres of 2.36%
Cu, both in the S-5 Lens; Hole ST-769 returned 9.2
metres of 7% Zn and 3.8% Pb in the S-1 Zone
• PEA study underway on potential combined Halfmile-
Stratmat development plan
Stratmat Deposit - Bathurst Mining Camp, New Brunswick
Source: Company data, resource is NI 43-101 compliant. Please refer to Appendix: Disclosures for important items relating to the resource estimates and production plans.
Location Bathurst Mining Camp, New Brunswick
Ownership 100% controlled
Type of deposit VMS polymetallic
Primary metals Zn, Pb, Ag, Cu, Au
Processing Potential standard milling with flotation recovery
Potential end
productPotential Zn, Pb-Ag and Cu-Au concentrates
Infrastructure In permitting stage, drill delineated deposit
Resource Tonnes Zn% Pb% Cu% Ag (g/t) Au (g/t)
Indicated 4,700,000 5.31 2.07 0.41 48.5 0.6
Inferred 2,400,000 4.76 2.07 0.70 38.8 0.4
24

25
2007➢ Trevali established to identify, acquire and develop zinc assets
➢ Acquired Santander Zinc project in Peru
2008 ➢ Discovered significant new Zn-mineralized zones at Santander
2009➢ Initial Santander resource estimate
➢ MOU agreement with Glencore to develop Santander
2010 ➢ Finalized agreement with Glencore for mine development at Santander
2011➢ Acquired Halfmile and Stratmat zinc deposits in New Brunswick
➢ Permitted and commenced development at both Santander and Halfmile mines
2012
➢ Trial mining commenced at Halfmile Mine in New Brunswick
➢ Commence construction at Santander Mine in Peru
➢ Acquired Caribou Mine and Mill in New Brunswick
2013 ➢ Commenced operations and commissioning at Santander Mine
2014
➢ Declared Commercial Production at Santander Mine
➢ Positive Preliminary Economic Assessment (PEA) study on Caribou Mine
➢ Santander Mine production exceeds 2014 guidance
2015
➢ Commenced operations and commissioning at Caribou Mine
➢ Discovered multiple new zones of high-grade Zn-Pb-Ag mineralization at Santander Mine
➢ Santander Zinc Mine production exceeds 2015 guidance
2016
➢ Declared Commercial Production at Caribou Zinc Mine
➢ Expanded new zones of high-grade Zn-Pb-Ag mineralization at Santander Mine
➢ Record annual zinc production from Santander Mine in 2016
2017➢ Invests in Caribou Mine future with new mining fleet
➢ Transformational acquisition of Perkoa and Rosh Pinah zinc mines from Glencore
Appendix: Trevali - Track Record of Successful Execution
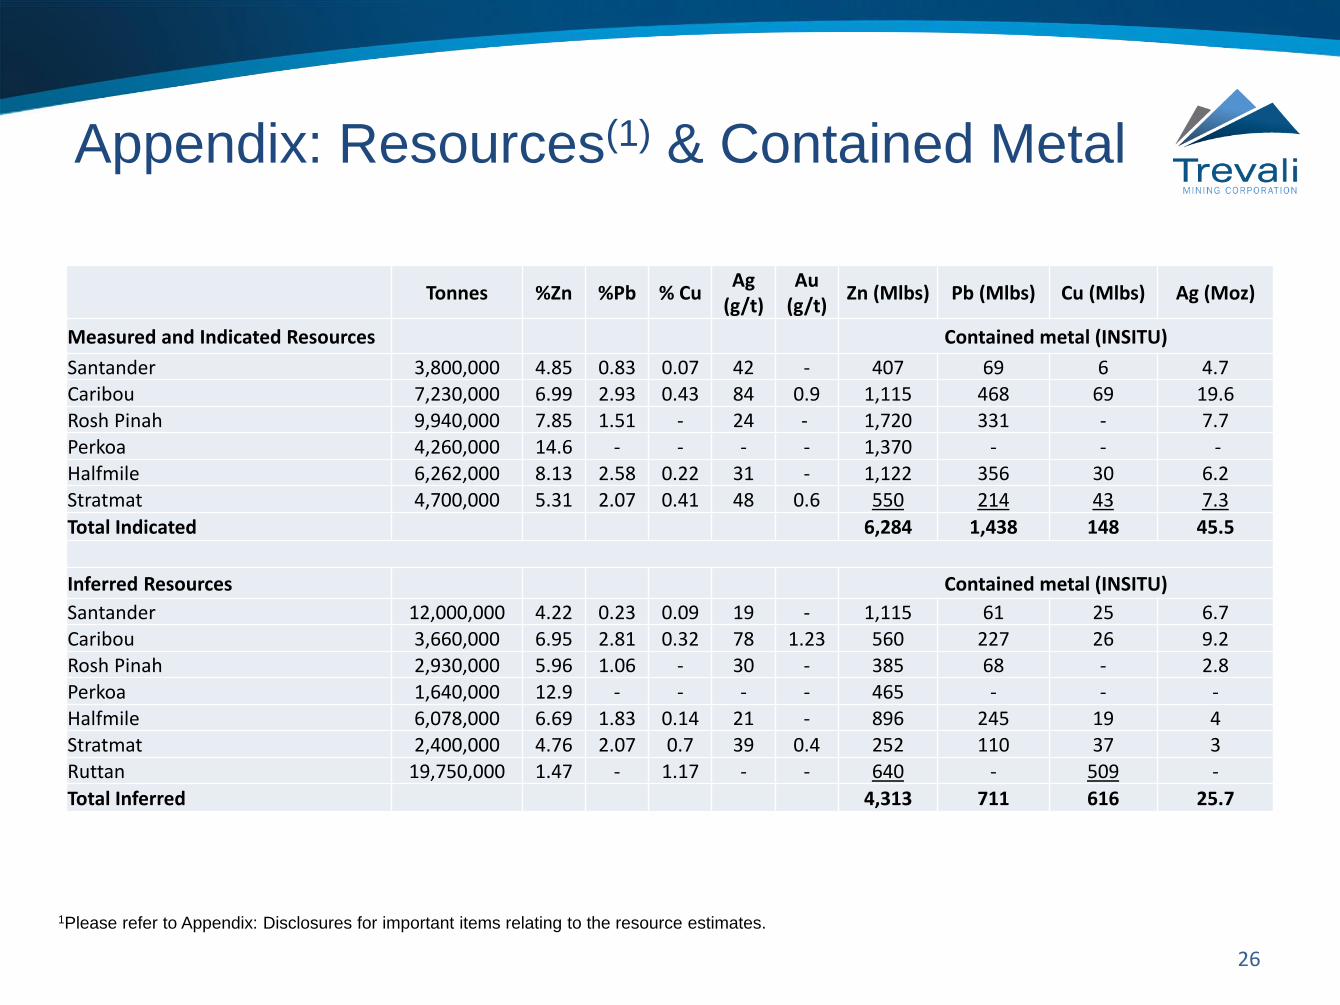
Appendix: Resources(1) & Contained Metal
26
1Please refer to Appendix: Disclosures for important items relating to the resource estimates.
Tonnes %Zn %Pb % CuAg
(g/t)Au
(g/t)Zn (Mlbs) Pb (Mlbs) Cu (Mlbs) Ag (Moz)
Measured and Indicated Resources Contained metal (INSITU)
Santander 3,800,000 4.85 0.83 0.07 42 - 407 69 6 4.7Caribou 7,230,000 6.99 2.93 0.43 84 0.9 1,115 468 69 19.6Rosh Pinah 9,940,000 7.85 1.51 - 24 - 1,720 331 - 7.7Perkoa 4,260,000 14.6 - - - - 1,370 - - -Halfmile 6,262,000 8.13 2.58 0.22 31 - 1,122 356 30 6.2Stratmat 4,700,000 5.31 2.07 0.41 48 0.6 550 214 43 7.3
Total Indicated 6,284 1,438 148 45.5
Inferred Resources Contained metal (INSITU)
Santander 12,000,000 4.22 0.23 0.09 19 - 1,115 61 25 6.7Caribou 3,660,000 6.95 2.81 0.32 78 1.23 560 227 26 9.2Rosh Pinah 2,930,000 5.96 1.06 - 30 - 385 68 - 2.8Perkoa 1,640,000 12.9 - - - - 465 - - -Halfmile 6,078,000 6.69 1.83 0.14 21 - 896 245 19 4Stratmat 2,400,000 4.76 2.07 0.7 39 0.4 252 110 37 3Ruttan 19,750,000 1.47 - 1.17 - - 640 - 509 -
Total Inferred 4,313 711 616 25.7
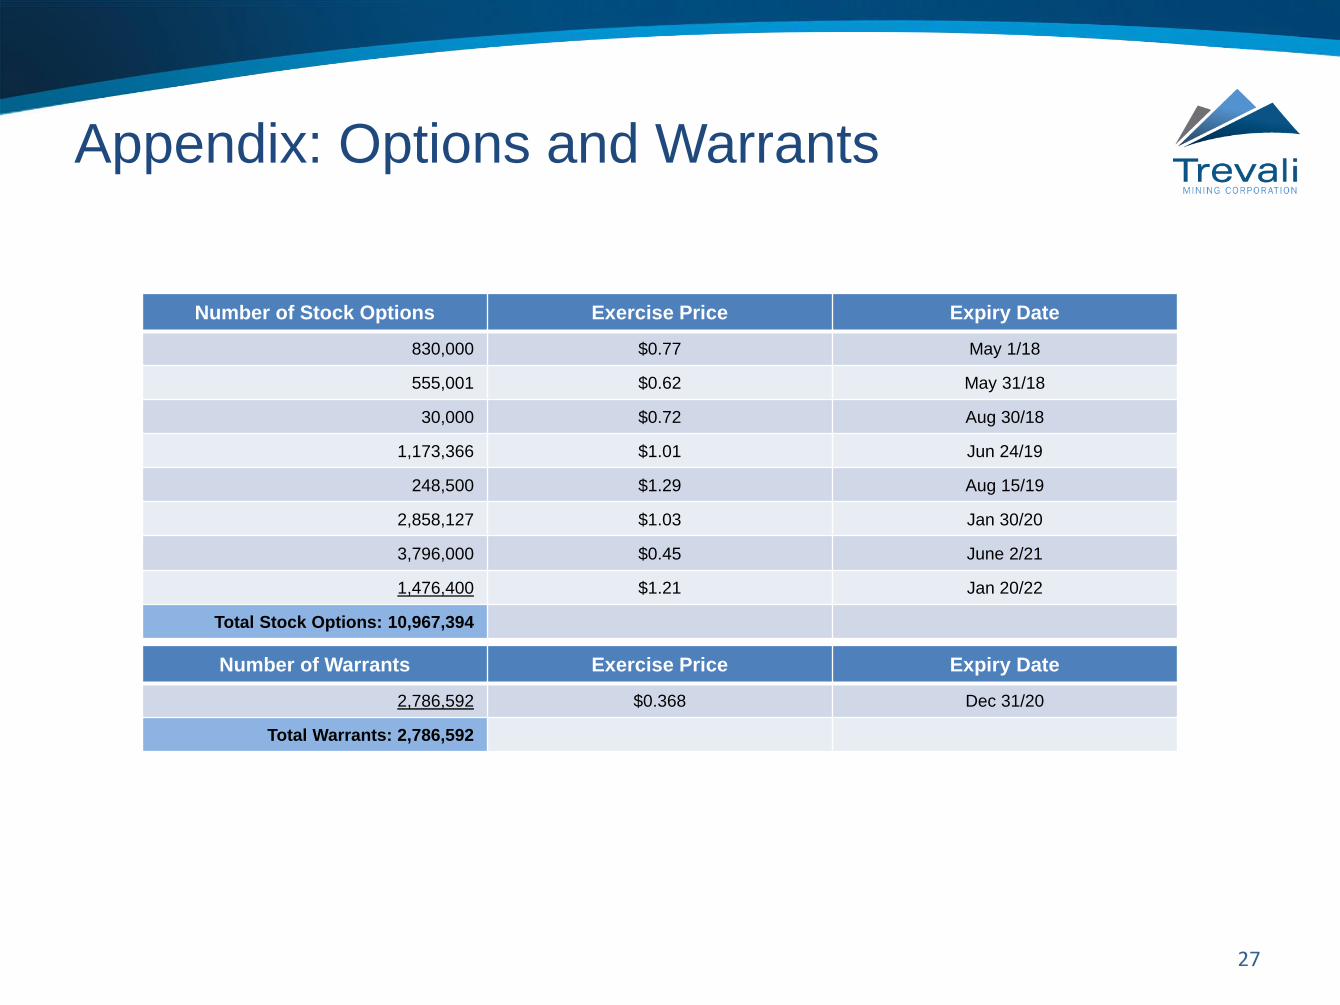
Appendix: Options and Warrants
27
Number of Warrants Exercise Price Expiry Date
2,786,592 $0.368 Dec 31/20
Total Warrants: 2,786,592
Number of Stock Options Exercise Price Expiry Date
830,000 $0.77 May 1/18
555,001 $0.62 May 31/18
30,000 $0.72 Aug 30/18
1,173,366 $1.01 Jun 24/19
248,500 $1.29 Aug 15/19
2,858,127 $1.03 Jan 30/20
3,796,000 $0.45 June 2/21
1,476,400 $1.21 Jan 20/22
Total Stock Options: 10,967,394

Appendix: Mining Analyst Coverage
28
Firm Analyst Location
BMO Capital Markets Alex Terentiew Toronto, Canada
Cormark Securities Inc. Stefan Ioannou Toronto, Canada
Eight Capital Jacques Wortman Toronto, Canada
GMP Securities L.P. Ian Parkinson Toronto, Canada
Haywood Securities Inc. Pierre Vaillancourt Toronto, Canada
Kallpa Securities S.A.B Sebastian Cruz Lima, Peru
Paradigm Capital Inc. Jeff Woolley Toronto, Canada
Scotiabank Orest Wowkodaw Toronto, Canada
TD Securities Inc. Craig Hutchison Toronto, Canada
The above investment firms and equity analysts provide research reports on Trevali Mining Corporation. Any opinions, estimates,
forecasts or other analyses, including prior or future Trevali performance from any source is the opinion of the writer and is theirs
alone and does not represent the opinions, estimates or forecasts of Trevali or its management. Trevali does not, by any
reference, imply any endorsement of, or concurrence with, such information, conclusions or recommendations. Trevali does not
distribute research reports.
29
EurGeol Dr. Mark D. Cruise, Trevali's President and CEO, and a qualified person as defined by NI 43-101, has reviewed the scientific and technical
information that forms the basis for this presentation. Dr. Cruise is not independent of the Company as he is an officer, director and shareholder.
Trevali's production plan at the Caribou Mine is based only on measured, indicated and inferred mineral resources, and not mineral reserves, and does
not have demonstrated economic viability. Trevali’s production plans at the Perkoa Mine, Rosh Pinah Mine and Santander Mine are based on both
proven and probable reserves and on measured, indicated and inferred mineral resources; mineral resources by definition do not have demonstrated
economic viability. Inferred mineral resources are considered too speculative geologically to have the economic considerations applied to them that
would enable them to be categorized as mineral reserves, and there is therefore no certainty that the conclusions of the production plans and
Preliminary Economic Assessment (PEA) will be realized. Additionally, where Trevali discusses exploration/expansion potential, any potential quantity
and grade is conceptual in nature and there has been insufficient exploration to define a mineral resource and it is uncertain if further exploration will
result in the target being delineated as a mineral resource.
The Santander resource estimate was independently estimated by the Company’s consultant Arseneau Consulting Services Ltd. The resource
estimates were prepared by and under the supervision of Dr. Gilles Arseneau, an appropriate "independent qualified person" as this term is defined in
National Instrument 43-101. Dassault Systemes Geovia Gems version 6.7 (Gems) software was used to review and modify the geological solids
provided by Trevali, prepare assay data for geostatistical analysis, construct the block model, estimate metal grades and tabulate mineral resources.
The Geostatistical Software SAGE2001 was used for geostatistical analysis and variography. A cut-off-grade of US$40 was utilized which is the
nominal base-case estimated grade of material that can be mined and processed considering all applicable costs. For reference, the Company’s
Santander 2017 site cash cost guidance (mining, milling and site G&A) is US$35-$40 per tonne. The mineral resources identified in Table 1 are based
on Ordinary Kriged (OK) capped values inside 5-by-5-by-5-metre blocks for the Magistral deposits and 10-by-10-by-5-metre blocks for the Puajanca
and Santander Pipe deposits. Assays were capped prior to compositing and assays were composited to 2 metres for the Magistral and Puajanca
deposit and 3.5 metres for the Santander deposit. Resource estimates for Santander Pipe and Puajanca South are unchanged from 2012 but have
been updated to reflect 2016 metal prices. The US dollar value cut-off is based on the formula:
Dollar Value = ((Ag Price x Ag Recovery x Ag Grade) + (Pb Price x Pb Recovery x Pb Grade)+(Zn Price x Zn Recovery x (Zn Grade)). Price for silver is
($16.50/oz) and that for Pb ($0.95), Zn ($1.15) and Cu ($2.50) is per pound. A recovery of 74% was applied to Ag, 85% for Pb, 89% for Zn and 0% for
Cu for calculating the dollar value formula. Santander zinc equivalent is calculated by dividing the dollar value by the zinc price.
Caribou resource estimate was completed by SRK Consulting (Canada) Inc. in January 2013. The tabled resource estimate utilizes a 5% zinc
equivalent (ZnEQ) cut-off grade. ZnEq=((Cu Grade*Cu Price*Cu Recovery)+(Pb Grade*Pb Price*Pb Recovery)+(Zn Grade*Zn Price*Zn Recover)+(Au
Grade*Au Price*Au Recovery)+(Ag Grade*Ag Price*Ag Recovery))/Zn Price. In calculating ZnEq, SRK Consulting (Canada) Inc. utilized the long term
metal prices provide by Energy & Metals Consensus Forecast. Price for Au is $1470 per ounce, Ag is $26 per ounce, Cu is $3.39 per pound, Pb is
$1.18 per pound, and Zn is $1.14 per pound. A recovery of 83% was applied to Zn, 71% was applied to Pb, 57% was applied to Cu, 45% was applied
to Ag, and 40% was applied to Au. The pounds of metal are in-situ and have not had any mining factors applied to them.
Appendix: Disclosures I

30
Caribou PEA study was conducted in accordance with the definitions in Canadian National Instrument 43-101. SRK Consulting (Canada) Inc. was the
lead independent consultant, with contributions from other independent consultants commissioned by Trevali – Holland & Holland Consulting and
Stantec Consulting. The base case Caribou Mine Project PEA uses price assumptions of US$1.00/lb zinc, US$1.00/lb lead, US$3.00/lb copper,
US$21.00/oz silver and US$1,200/oz gold. These prices are based on a review of consensus price forecasts from financial institutions and similar
studies that recently have been published. The PEA is considered preliminary in nature and includes economic analysis that is based, in part, on
inferred mineral resources. Inferred mineral resources are considered too speculative geologically to have the economic considerations applied to them
that would allow them to be categorized as mineral reserves, and there is no certainty that the results will be realized. Mineral resources are not
mineral reserves because they do not have demonstrated economic viability.
Halfmile Deposit resource estimate completed by Tetra Tech Wardrop and prepared by Tim Maunula, P.Geo. and Christopher Moreton, Ph.D., P.Geo.
Stratmat Deposit resource estimate completed by SRK Consulting (Canada) Inc. and prepared by Dr. Gilles Arseneau, P.Geo.
Rosh Pinah mineral reserves and mineral resources are derived from the technical report entitled “Technical Report on the Rosh Pinah Mine, Namibia”
dated April 7, 2017 and effective December 31, 2016 prepared by Roscoe Postle Associates Inc.; Canadian Institute of Mining, Metallurgy and
Petroleum (“CIM”) definitions were followed for Mineral Reserves and Resources; Mineral Reserves are estimated at various Net Smelter Return
(NSR) cut-off values depending on required development; Mineral Reserves are estimated using average consensus forecast long-term prices of
US$1.03/lb Zn, US$0.93/lb Pb, US$18.65/oz Ag and US$1,358/oz Au at an exchange rate of 17.71 NAD/US$; Mineral Resources are inclusive of
Mineral Reserves; Mineral Resources are estimated at a cut-off grade of 4% Zn Equivalent; Shown at 100% ownership; Mineral Resources that are not
Mineral Reserves do not have demonstrated economic viability.
Perkoa mineral reserves and mineral resources are derived from the technical report entitled “Technical Report on the Perkoa Mine, Burkina Faso”
dated April 7, 2017 and effective December 31, 2016 prepared by Roscoe Postle Associates Inc.; CIM definitions were followed for Mineral Reserves
and Resources; Mineral Reserves are estimated at an NSR cut-off value of $100/tonne inclusive of capital expenditure, incremental stopes greater
than US$78/tonne are included based on individual financial analysis; Mineral Reserves are estimated using an average consensus forecast zinc price
of US$0.99 per pound and a €/US$ exchange rate of 1.11; Shown at 100% ownership; Mineral Resources are inclusive of Mineral Reserves; Mineral
Resources are estimated at a cut-off grade of 5% Zn; Mineral Resources that are not Mineral Reserves do not have demonstrated economic viability).
Appendix: Disclosures II

31
In Canada, an issuer is required to provide technical information with respect to mineralization, including reserves and resources, if any, on its mineral
exploration properties in accordance with Canadian requirements, which differ significantly from the requirements of the SEC applicable to registration
statements and reports filed by U.S. companies pursuant to the U.S. Securities Act or the U.S. Securities Exchange Act of 1934, as amended. As such,
information contained in this presentation concerning descriptions of mineralization under Canadian standards may not be comparable to similar
information made public by U.S. companies subject to the reporting and disclosure requirements of the SEC.
The terms “mineral reserve”, “proven mineral reserve” and “probable mineral reserve” are Canadian mining terms as defined in accordance with
Canadian National Instrument 43-101 – Standards of Disclosure for Mineral Projects (“NI 43-101”) and the Canadian Institute of Mining, Metallurgy and
Petroleum (the “CIM”) — CIM Definition Standards on Mineral Resources and Mineral Reserves, adopted by the CIM Council, as amended. These
definitions differ from the definitions in Industry Guide 7 (“Industry Guide 7”) under the U.S. Securities Act. Under Industry Guide 7 standards, a “final”
or “bankable” feasibility study is required to report reserves, the three-year historical average price is used in any reserve or cash flow analysis to
designate reserves and the primary environmental analysis or report must be filed with the appropriate governmental authority.
In addition, the terms “mineral resource”, “measured mineral resource”, “indicated mineral resource” and “inferred mineral resource” are defined in and
required to be disclosed by NI 43-101; however, these terms are not defined terms under Industry Guide 7 and are normally not permitted to be used in
reports and registration statements filed with the SEC. You are cautioned not to assume that any part or all of mineral deposits in these categories will
ever be converted into reserves. “Inferred mineral resources” have a great amount of uncertainty as to their existence, and great uncertainty as to their
economic and legal feasibility. It cannot be assumed that all or any part of an inferred mineral resource will ever be upgraded to a higher category.
Under Canadian rules, estimates of inferred mineral resources may not form the basis of feasibility or pre-feasibility studies, except in rare cases. You
are cautioned not to assume that all or any part of an inferred mineral resource exists or is economically or legally mineable. Disclosure of “contained
ounces” in a resource is permitted disclosure under Canadian regulations; however, the SEC normally only permits issuers to report mineralization that
does not constitute “reserves” by SEC standards as in place tonnage and grade without reference to unit measures.
Accordingly, information contained in this presentation containing descriptions of any mineral deposits may not be comparable to similar information
made public by U.S. companies subject to the reporting and disclosure requirements under the United States federal securities laws and the rules and
regulations thereunder. You are cautioned that the reserves presented in this presentation while in compliance with Canadian standards and
regulations, may not meet the requirements of reserve disclosure under SEC guidelines.
Appendix: Cautionary Note Regarding United States Laws

Contact Information
32
TREVALI MINING CORPORATION
1400-1199 West Hastings Street
Vancouver, BC, V6E 3T5, CANADA
Phone: 1-604-488-1661
Fax: 1-604-408-7499
www.trevali.com
CONTACT:Steve Stakiw
Vice President, Investor Relations and Corporate Communications
Direct phone:1-604-638-5623
A member of the
Related Documents