technologies Article A Preliminary Assessment of the Initial Compression Power Requirement in CO 2 Pipeline “Carbon Capture and Storage (CCS) Technologies” Abdussalam El-Suleiman 1, *, Nnamdi B. Anosike 2 and Pericles Pilidis 3 1 Department of Mechanical Engineering Technology, Federal Polytechnic, Nasarawa 962101, Nigeria 2 Department of Mechanical Engineering, Nnamdi Azikiwe University, Awka 420107, Nigeria; [email protected] 3 Centre for Propulsion Engineering, Cranfield University, Cranfield MK43 0AL, UK; p.pilidis@cranfield.ac.uk * Correspondence: [email protected]; Tel.: +234-803-458-9003 Academic Editor: Manoj Gupta Received: 29 February 2016; Accepted: 17 May 2016; Published: 23 May 2016 Abstract: CO 2 captured from fossil-fueled power generation plants is said to be economically transported via pipelines over long distances. The CO 2 must be compressed to pipeline specifications using compressors and pumps that are driven by gas turbine (GT) or other prime movers. This paper presents the evaluation of actual work transfer or required prime power by modeling the governing equations of compression using the Peng–Robinson equation of state (PR-EOS). A computer code was developed to carry out the modeling and subsequent simulation of the compression power requirement. The simulation of prime mover power was carried out for different technology (head per stage) of the compressor ranging from 10-staged compression to double stage compression. The results show that the current technology of the centrifugal compressor could require as much as 23MW of prime mover power to compress 1.5 million tonnes per year of CO 2 —a projected equivalent CO 2 released from a 530MW combined cycle gas turbine (CCGT) power generation plant. Keywords: CO 2 ; pipeline; prime mover; CO 2 compression; combined cycle gas turbine (CCGT) 1. Introduction Sustainability of fossil fuel-fired power generation plants require the removal of carbon in the form of carbon dioxide (CO 2 ) from either the fuel before combustion or flue gas after combustion. This becomes necessary because CO 2 emission, which is a consequence of combustion or oxidation of fossil fuel, has been identified as a main greenhouse gas [1,2]. Once the CO 2 is removed, it is usually compressed and transported to the point of storage away from the atmosphere. The point of CO 2 storage is usually far from the source of emission; hence, transportation over long distance is highly envisaged. As a result, the CO 2 is envisaged to be transported via pipelines, which primarily have gained wide acceptance for long-distance transportation [2–5]. Prior to transport, equipment driven by gas turbines is used to compress the captured CO 2 to a dense-phase state, which is said to be the most efficient and economical state for CO 2 pipeline transport [3,4]. The required power for compression or compression duty using appropriately sized GT is addressed in this paper. It is worth mentioning that the quantification of compression duty has been conducted by many researchers, especially in areas that deal with cost prediction models of CO 2 pipeline transport [6]. In such studies, the required energy for compression is either treated as an efficiency penalty on the overall power generation plant’s efficiency or assumed to be supplied from the grid [7–10]. The power consumption of the compression process is said to be about 40% of the auxiliary load and could constitute 7%–12% of the power plants output [11,12]. This energy consumption is huge in economic Technologies 2016, 4, 15; doi:10.3390/technologies4020015 www.mdpi.com/journal/technologies

Welcome message from author
This document is posted to help you gain knowledge. Please leave a comment to let me know what you think about it! Share it to your friends and learn new things together.
Transcript
technologies
Article
A Preliminary Assessment of the Initial CompressionPower Requirement in CO2 Pipeline “Carbon Captureand Storage (CCS) Technologies”
Abdussalam El-Suleiman 1,*, Nnamdi B. Anosike 2 and Pericles Pilidis 3
1 Department of Mechanical Engineering Technology, Federal Polytechnic, Nasarawa 962101, Nigeria2 Department of Mechanical Engineering, Nnamdi Azikiwe University, Awka 420107, Nigeria;
[email protected] Centre for Propulsion Engineering, Cranfield University, Cranfield MK43 0AL, UK; [email protected]* Correspondence: [email protected]; Tel.: +234-803-458-9003
Academic Editor: Manoj GuptaReceived: 29 February 2016; Accepted: 17 May 2016; Published: 23 May 2016
Abstract: CO2 captured from fossil-fueled power generation plants is said to be economicallytransported via pipelines over long distances. The CO2 must be compressed to pipeline specificationsusing compressors and pumps that are driven by gas turbine (GT) or other prime movers. This paperpresents the evaluation of actual work transfer or required prime power by modeling the governingequations of compression using the Peng–Robinson equation of state (PR-EOS). A computer codewas developed to carry out the modeling and subsequent simulation of the compression powerrequirement. The simulation of prime mover power was carried out for different technology(head per stage) of the compressor ranging from 10-staged compression to double stage compression.The results show that the current technology of the centrifugal compressor could require as much as23MW of prime mover power to compress 1.5 million tonnes per year of CO2—a projected equivalentCO2 released from a 530MW combined cycle gas turbine (CCGT) power generation plant.
Keywords: CO2; pipeline; prime mover; CO2 compression; combined cycle gas turbine (CCGT)
1. Introduction
Sustainability of fossil fuel-fired power generation plants require the removal of carbon in theform of carbon dioxide (CO2) from either the fuel before combustion or flue gas after combustion.This becomes necessary because CO2 emission, which is a consequence of combustion or oxidation offossil fuel, has been identified as a main greenhouse gas [1,2]. Once the CO2 is removed, it is usuallycompressed and transported to the point of storage away from the atmosphere. The point of CO2
storage is usually far from the source of emission; hence, transportation over long distance is highlyenvisaged. As a result, the CO2 is envisaged to be transported via pipelines, which primarily havegained wide acceptance for long-distance transportation [2–5]. Prior to transport, equipment driven bygas turbines is used to compress the captured CO2 to a dense-phase state, which is said to be the mostefficient and economical state for CO2 pipeline transport [3,4]. The required power for compression orcompression duty using appropriately sized GT is addressed in this paper.
It is worth mentioning that the quantification of compression duty has been conducted by manyresearchers, especially in areas that deal with cost prediction models of CO2 pipeline transport [6].In such studies, the required energy for compression is either treated as an efficiency penalty on theoverall power generation plant’s efficiency or assumed to be supplied from the grid [7–10]. The powerconsumption of the compression process is said to be about 40% of the auxiliary load and couldconstitute 7%–12% of the power plants output [11,12]. This energy consumption is huge in economic
Technologies 2016, 4, 15; doi:10.3390/technologies4020015 www.mdpi.com/journal/technologies
Technologies 2016, 4, 15 2 of 9
terms, and the need for a separate source of energy for compression becomes desirable. Similarly,the requirement for booster stations in remote locations along a trunk pipeline where the cost oftransporting electricity becomes prohibitive necessitates a suitable prime mover. Thus, GTs beingextensively used in pipelines to compress gas at suitable points becomes a prime mover of choice forthis duty. While considerable operational experience has been gathered in natural gas transmission,the same is not true for CO2 transmission, especially since the properties and behavior of the gases arequite different. The distinguishing feature of this work hinges on the close coupling of the compressionsystem with the GT prime mover, with a view of assessing the CO2 compression power requirement.Analysis of this kind becomes imperative to aid the techno-economic assessment of deploying thisprime mover in a CO2 pipeline transport.
2. The Pipeline Transmission of CO2
The economics for transporting large volumes of CO2 over long distance in the gaseous phaseis quite unfavorable [13,14]. This is because such pure gas phase transportation will be restricted tooperate below 30–50 bar at which the densities and capacities will be too small. However, the pure gasphase will fit a system where the CO2 is initially transported on gathering lines from low CO2 producersfor connection to larger trunk pipelines [13]. Low-pressure liquid phase is not desirable either exceptfor transportation in vessels, tanks, and barges. The liquid phase for pipeline transportation comeswith problems of frost formation in cold climates and the need for pipeline material suitable forcryogenic application. Furthermore, unlike natural gas, the critical point of CO2 is near the potentialcompressor (and pipeline) operating point such that slight changes in ambient temperature or soiltemperature for a buried pipeline can result in two-phase flow [3].
Abrupt pressure drops occasioned by two-phase flows and the detrimental effect of impuritiesmust be avoided during CO2 transmission in pipelines. Hence, the CO2 is transported in thedense-phase state especially for onshore pipelines, as has been earlier highlighted [3,4]. In addition,the dense-phase transport gives an advantage for high delivery pressure at injection to sink [2]. Thepipeline operating pressure in this state is between 10 and 15 MPa [5,7,15]. In general though, the CO2
can be transported at temperature and pressure ranges of 12–44 ˝C and 85–150 bar, respectively [5,16].The upper temperature limit is fixed by the compressor-station discharge temperature, while the lowerlimit is fixed by winter ground temperature for buried pipelines. The lower pressure limit is dictatedby the phase behavior of CO2, especially with impurities present and the need to maintain supercriticalconditions, while the upper pressure limit is mostly due to economic concerns [5].
Highly recommended within this pipeline operating conditions is the “API 5L X-70” line pipespecification in the US Code of Federal Regulations—CFR (the CFR regulates the design, constructionand operation of CO2 pipeline transport in the USA) [8,17]. Similarly, the ASME/ANSI class 900#flanges are quite suitable since they can tolerate an operating pressure of about 153 bar (15.3 MPa) at atemperature of about 311.15 K (38 ˝C) [3,16].
3. Methodology
This work was carried out by adapting the TERA (Techno-Economic and Environmental RiskAnalysis) framework developed in Cranfield University, UK [18,19]. The core of the TERA is theperformance module, which is a detailed and rigorous thermodynamic representation of the componentparameters and power plant achieved by simulating the design, off-design, and degraded performanceof the power plant. The economic, environmental, and risk modules are built around the performancemodule and integrated with an optimizer to compare power plants optimized for a particular dutysuch as fuel consumption and operating cost. Applying this to the GT-driven transmission of CO2
in pipelines, the adapted framework consists of four sets of FORTRAN-coded integrated modules,i.e., a compression module, an engine performance module, an emission module, and an economicmodule. The compression module addressed in this paper involved code development to simulatethe centrifugal compressor power requirement using the Peng–Robinson equation of state (PR-EOS),
Technologies 2016, 4, 15 3 of 9
said to be among the most precise and proper for engineering application [4,20]. The CO2 is assumedto be compressed from atmospheric pressure (1 bar) to the pipeline intake pressure of 10 MPa (100 bars)using a centrifugal compressor. A maximum temperature of 40 ˝C was maintained at the suction endof the centrifugal compressor. Considering the limitation imposed by maximum head achievable andallowable temperature in the compressor, multistage compression with intercooling was simulated.The CO2 was assumed to be pure and the required CO2 properties of density and viscosity werecalculated using the code developed by McCollum and Ogden [9].
4. Physical Properties of Pure CO2
Since the captured CO2 will be compressed to a dense-phase state, an insight into the phasebehavior of pure CO2 depicted by Figure 1 is worthwhile. CO2 in its pure state is colorless, odorless,and non-inflammable at ambient temperature and pressure [5].
Technologies 2016, 4, 15 3 of 9
engineering application [4,20]. The CO2 is assumed to be compressed from atmospheric pressure (1 bar) to the pipeline intake pressure of 10 MPa (100 bars) using a centrifugal compressor. A maximum temperature of 40 °C was maintained at the suction end of the centrifugal compressor. Considering the limitation imposed by maximum head achievable and allowable temperature in the compressor, multistage compression with intercooling was simulated. The CO2 was assumed to be pure and the required CO2 properties of density and viscosity were calculated using the code developed by McCollum and Ogden [9].
4. Physical Properties of Pure CO2
Since the captured CO2 will be compressed to a dense-phase state, an insight into the phase behavior of pure CO2 depicted by Figure 1 is worthwhile. CO2 in its pure state is colorless, odorless, and non-inflammable at ambient temperature and pressure [5].
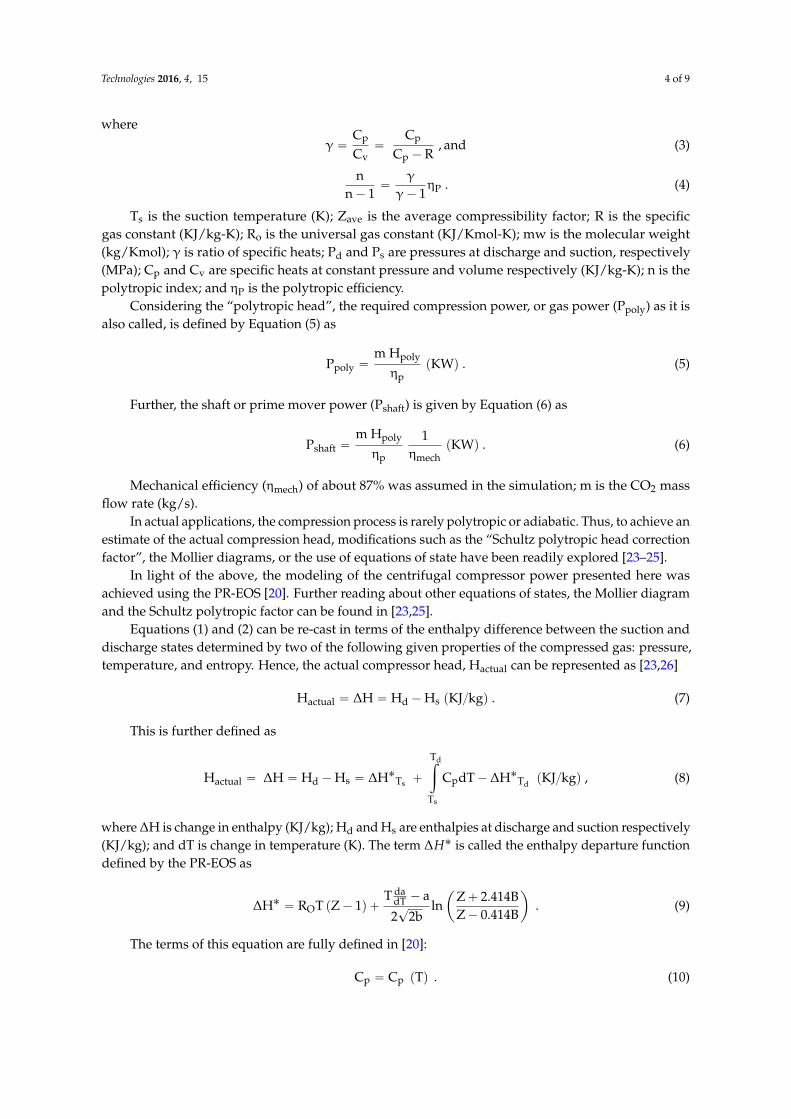
Figure 1. Phase diagram for pure CO2. Adapted from [21].
Two distinct points can be observed, namely the triple point (5 bar, −56 °C) and the critical point (74 bar, 31 °C). At the triple point, CO2 can exist as solid, liquid, or gas. Above the critical point, the pure CO2 is in a supercritical phase where it acts as neither gas nor liquid [21]. At pressures above the critical pressure but below the critical temperature, a fluid is said to be in a dense phase; otherwise, it is in a non-dense phase. Note from Figure 1 above that the dense phase could be achieved without passing the liquid area. The dense phase is a very peculiar state in that, on one hand, it is not a liquid because it has a viscosity similar to that of a gas while, on the other hand, its density is closer to that of a liquid and has similar flow conditions as that of a liquid [13].
5. Modeling the Compressor Power (Head) Requirement
Equations for evaluating the head, work or power of a centrifugal compressor in units of Nm/kg, Nm or Nm/sec respectively have been presented in the literature. These equations are primarily used to evaluate the adiabatic head (Had) (Equation(1)) and, with slight modification, the polytropic head (Hpoly) (Equation(2)) as expressed below [22–24].
H = T Z Rmw γγ − 1 PP − 1 (KJ/kg), and (1)
Figure 1. Phase diagram for pure CO2. Adapted from [21].
Two distinct points can be observed, namely the triple point (5 bar, ´56 ˝C) and the critical point(74 bar, 31 ˝C). At the triple point, CO2 can exist as solid, liquid, or gas. Above the critical point,the pure CO2 is in a supercritical phase where it acts as neither gas nor liquid [21]. At pressures abovethe critical pressure but below the critical temperature, a fluid is said to be in a dense phase; otherwise,it is in a non-dense phase. Note from Figure 1 above that the dense phase could be achieved withoutpassing the liquid area. The dense phase is a very peculiar state in that, on one hand, it is not a liquidbecause it has a viscosity similar to that of a gas while, on the other hand, its density is closer to that ofa liquid and has similar flow conditions as that of a liquid [13].
5. Modeling the Compressor Power (Head) Requirement
Equations for evaluating the head, work or power of a centrifugal compressor in units of Nm/kg,Nm or Nm/sec respectively have been presented in the literature. These equations are primarily usedto evaluate the adiabatic head (Had) (Equation (1)) and, with slight modification, the polytropic head(Hpoly) (Equation (2)) as expressed below [22–24].
Had “ TsZaveRo
mwγ
γ´ 1
»
–
ˆ
PdPs
˙
γ´1γ
´ 1
fi
fl pKJ{kgq, and (1)
Hpoly “ TsZaveRo
mwn
n´ 1
«
ˆ
PdPs
˙n´1
n´ 1
ff
pKJ{kgq , (2)
Technologies 2016, 4, 15 4 of 9
where
γ “Cp
Cv“
Cp
Cp ´R, and (3)
nn´ 1
“γ
γ´ 1ηP . (4)
Ts is the suction temperature (K); Zave is the average compressibility factor; R is the specificgas constant (KJ/kg-K); Ro is the universal gas constant (KJ/Kmol-K); mw is the molecular weight(kg/Kmol); γ is ratio of specific heats; Pd and Ps are pressures at discharge and suction, respectively(MPa); Cp and Cv are specific heats at constant pressure and volume respectively (KJ/kg-K); n is thepolytropic index; and ηP is the polytropic efficiency.
Considering the “polytropic head”, the required compression power, or gas power (Ppoly) as it isalso called, is defined by Equation (5) as
Ppoly “m Hpoly
ηppKWq . (5)
Further, the shaft or prime mover power (Pshaft) is given by Equation (6) as
Pshaft “m Hpoly
ηp
1ηmech
pKWq . (6)
Mechanical efficiency (ηmech) of about 87% was assumed in the simulation; m is the CO2 massflow rate (kg/s).
In actual applications, the compression process is rarely polytropic or adiabatic. Thus, to achieve anestimate of the actual compression head, modifications such as the “Schultz polytropic head correctionfactor”, the Mollier diagrams, or the use of equations of state have been readily explored [23–25].
In light of the above, the modeling of the centrifugal compressor power presented here wasachieved using the PR-EOS [20]. Further reading about other equations of states, the Mollier diagramand the Schultz polytropic factor can be found in [23,25].
Equations (1) and (2) can be re-cast in terms of the enthalpy difference between the suction anddischarge states determined by two of the following given properties of the compressed gas: pressure,temperature, and entropy. Hence, the actual compressor head, Hactual can be represented as [23,26]
Hactual “ ∆H “ Hd ´Hs pKJ{kgq . (7)
This is further defined as
Hactual “ ∆H “ Hd ´Hs “ ∆H˚Ts `
Tdż
Ts
CpdT´ ∆H˚Td pKJ{kgq , (8)
where ∆H is change in enthalpy (KJ/kg); Hd and Hs are enthalpies at discharge and suction respectively(KJ/kg); and dT is change in temperature (K). The term ∆H˚ is called the enthalpy departure functiondefined by the PR-EOS as
∆H˚ “ ROT pZ´ 1q `T da
dT ´ a
2?
2blnˆ
Z` 2.414BZ´ 0.414B
˙
. (9)
The terms of this equation are fully defined in [20]:
Cp “ Cp pTq . (10)
Technologies 2016, 4, 15 5 of 9
The mathematical expression for Equation (10) specifically for CO2 is found in [26]. T istemperature (K).
6. Modeling the PR-EOS for Compressibility Factor (Z)
To fully solve Equation (8) for the actual head, the CO2 compressibility factor (Z) needs to bedetermined by using the PR-EOS to evaluate ∆H˚. From [20],
Z3 ´ p1´ BqZ2 `´
A´ 3B2 ´ 2B¯
Z´´
AB´ B2 ´ B3¯
“ 0 , (11)
whereA “
aPRo2T2 , (12)
B “bP
RoT, and (13)
Z “Pv
RoT. (14)
The terms A and B are fully defined in [20].
7. The Simulation of the Required Compression Power
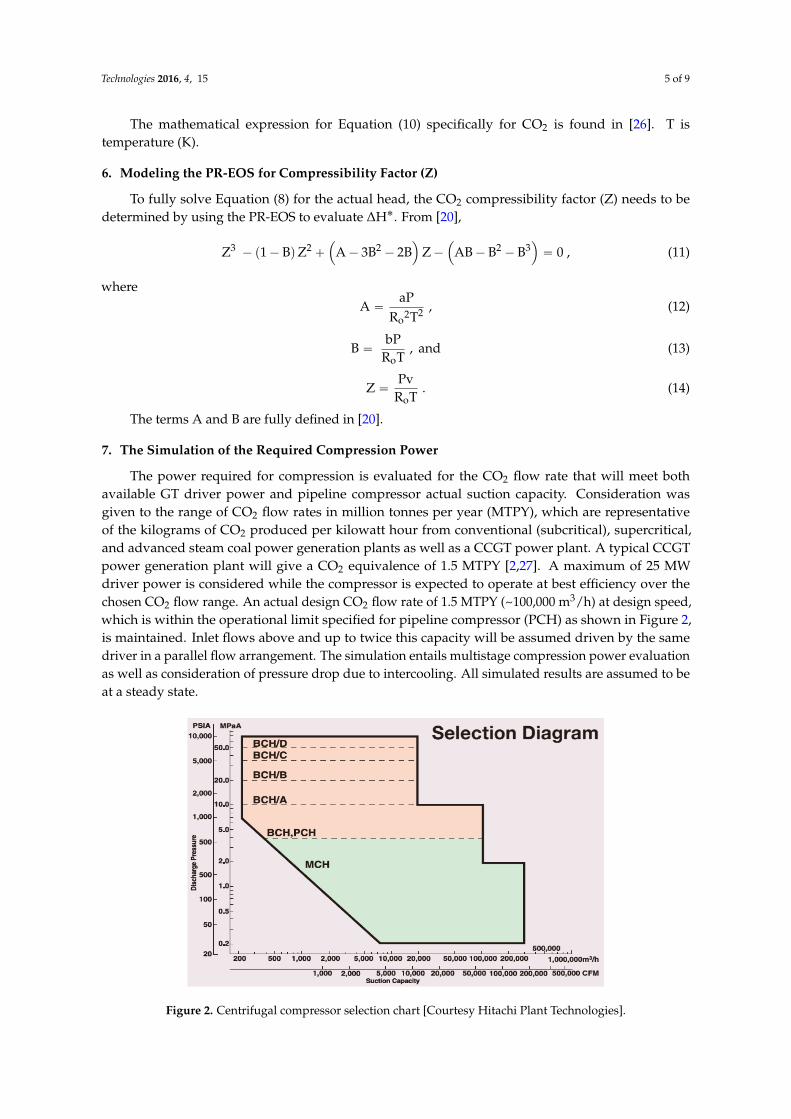
The power required for compression is evaluated for the CO2 flow rate that will meet bothavailable GT driver power and pipeline compressor actual suction capacity. Consideration wasgiven to the range of CO2 flow rates in million tonnes per year (MTPY), which are representativeof the kilograms of CO2 produced per kilowatt hour from conventional (subcritical), supercritical,and advanced steam coal power generation plants as well as a CCGT power plant. A typical CCGTpower generation plant will give a CO2 equivalence of 1.5 MTPY [2,27]. A maximum of 25 MWdriver power is considered while the compressor is expected to operate at best efficiency over thechosen CO2 flow range. An actual design CO2 flow rate of 1.5 MTPY (~100,000 m3/h) at design speed,which is within the operational limit specified for pipeline compressor (PCH) as shown in Figure 2,is maintained. Inlet flows above and up to twice this capacity will be assumed driven by the samedriver in a parallel flow arrangement. The simulation entails multistage compression power evaluationas well as consideration of pressure drop due to intercooling. All simulated results are assumed to beat a steady state.
Technologies 2016, 4, 15 5 of 9
6. Modeling the PR-EOS for Compressibility Factor (Z)
To fully solve Equation(8)for the actual head, the CO2 compressibility factor (Z) needs to be determined by using the PR-EOS to evaluate ∆H∗. From [20], Z − (1 − B)Z + (A − 3B − 2B)Z − (AB − B − B ) = 0 , (11)
where A = aPR T , (12)
B = bPR T , and (13)
Z = PvR T . (14)
The terms A and B are fully defined in [20].
7. The Simulation of the Required Compression Power
The power required for compression is evaluated for the CO2 flow rate that will meet both available GT driver power and pipeline compressor actual suction capacity. Consideration was given to the range of CO2 flow rates in million tonnes per year (MTPY), which are representative of the kilograms of CO2 produced per kilowatt hour from conventional (subcritical), supercritical, and advanced steam coal power generation plants as well as a CCGT power plant. A typical CCGT power generation plant will give a CO2 equivalence of 1.5 MTPY [2,27]. A maximum of 25 MW driver power is considered while the compressor is expected to operate at best efficiency over the chosen CO2 flow range. An actual design CO2 flow rate of 1.5 MTPY (~100,000 m3/h) at design speed, which is within the operational limit specified for pipeline compressor (PCH) as shown in Figure 2, is maintained. Inlet flows above and up to twice this capacity will be assumed driven by the same driver in a parallel flow arrangement. The simulation entails multistage compression power evaluation as well as consideration of pressure drop due to intercooling. All simulated results are assumed to be at a steady state.
Figure 2. Centrifugal compressor selection chart [Courtesy Hitachi Plant Technologies]. Figure 2. Centrifugal compressor selection chart [Courtesy Hitachi Plant Technologies].
Technologies 2016, 4, 15 6 of 9
A constant compressor polytropic efficiency value of 80% per stage was assumed for the simulationconsidering existing technology [24]. However, it should be noted that the compressor efficiencyvalue decreases in successive stages for multi-stage compression due to fouling, speed matching,and mechanical constraints. A polytropic efficiency value of 90% was also used in the simulation toevaluate the effect of change in efficiency on the compressor head. A 10% increment on simulatedpower is applied to meet the API 617 minimum power margin specification for GT driver selection.
8. A Validation of the Simulated Compressibility Factor (Z)
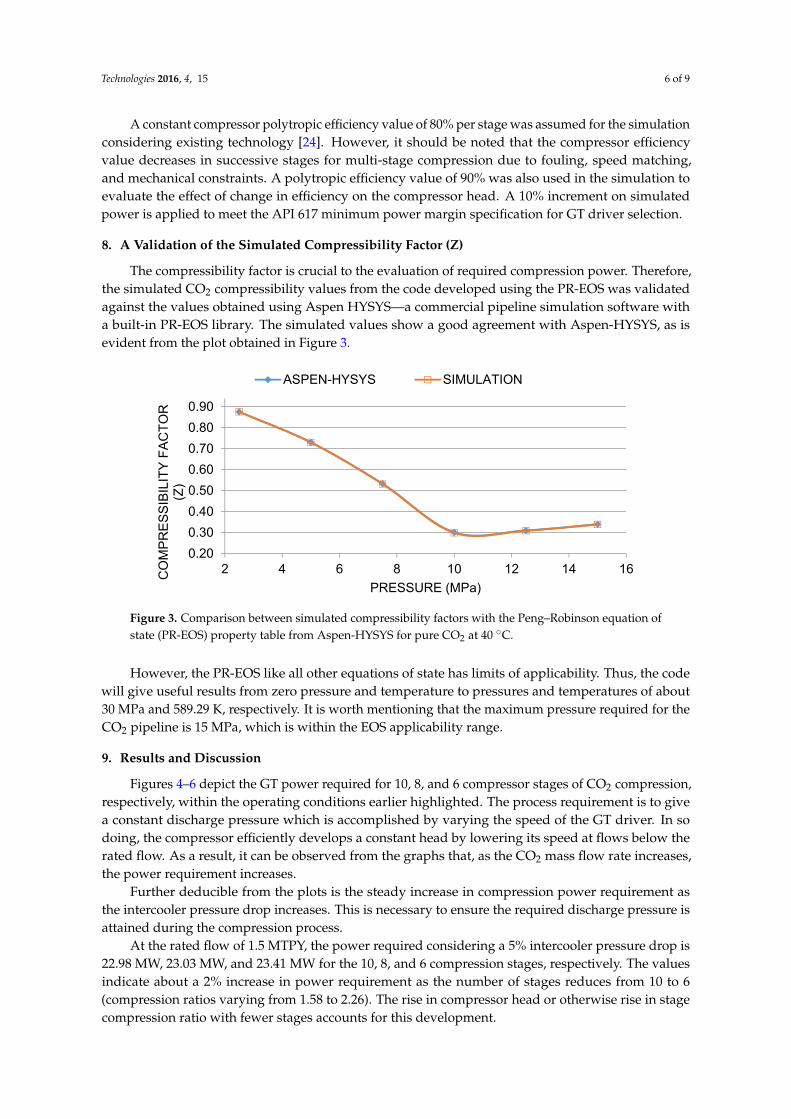
The compressibility factor is crucial to the evaluation of required compression power. Therefore,the simulated CO2 compressibility values from the code developed using the PR-EOS was validatedagainst the values obtained using Aspen HYSYS—a commercial pipeline simulation software witha built-in PR-EOS library. The simulated values show a good agreement with Aspen-HYSYS, as isevident from the plot obtained in Figure 3.
Technologies 2016, 4, 15 6 of 9
A constant compressor polytropic efficiency value of 80% per stage was assumed for the simulation considering existing technology [24]. However, it should be noted that the compressor efficiency value decreases in successive stages for multi-stage compression due to fouling, speed matching, and mechanical constraints. A polytropic efficiency value of 90% was also used in the simulation to evaluate the effect of change in efficiency on the compressor head. A 10% increment on simulated power is applied to meet the API 617 minimum power margin specification for GT driver selection.
8. A Validation of the Simulated Compressibility Factor (Z)
The compressibility factor is crucial to the evaluation of required compression power. Therefore, the simulated CO2 compressibility values from the code developed using the PR-EOS was validated against the values obtained using Aspen HYSYS—a commercial pipeline simulation software with a built-in PR-EOS library. The simulated values show a good agreement with Aspen-HYSYS, as is evident from the plot obtained in Figure 3.
Figure 3. Comparison between simulated compressibility factors with the Peng–Robinson equation of state (PR-EOS) property table from Aspen-HYSYS for pure CO2 at 40 °C.
However, the PR-EOS like all other equations of state has limits of applicability. Thus, the code will give useful results from zero pressure and temperature to pressures and temperatures of about 30 MPa and 589.29 K, respectively. It is worth mentioning that the maximum pressure required for the CO2 pipeline is 15 MPa, which is within the EOS applicability range.
9. Results and Discussion
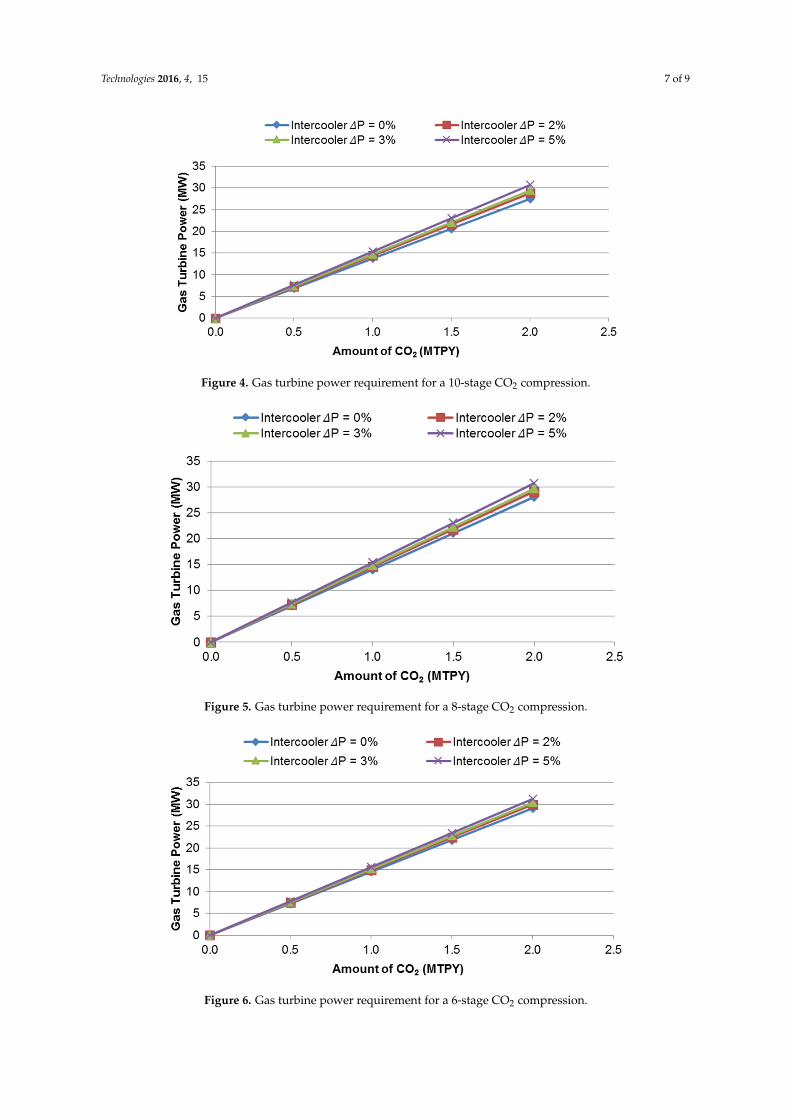
Figures 4–6 depict the GT power required for 10, 8, and 6 compressor stages of CO2 compression, respectively, within the operating conditions earlier highlighted. The process requirement is to give a constant discharge pressure which is accomplished by varying the speed of the GT driver. In so doing, the compressor efficiently develops a constant head by lowering its speed at flows below the rated flow. As a result, it can be observed from the graphs that, as the CO2 mass flow rate increases, the power requirement increases.
0.20
0.30
0.40
0.50
0.60
0.70
0.80
0.90
2 4 6 8 10 12 14 16CO
MP
RE
SS
IBIL
ITY
FA
CT
OR
(Z
)
PRESSURE (MPa)
ASPEN-HYSYS SIMULATION
Figure 3. Comparison between simulated compressibility factors with the Peng–Robinson equation ofstate (PR-EOS) property table from Aspen-HYSYS for pure CO2 at 40 ˝C.
However, the PR-EOS like all other equations of state has limits of applicability. Thus, the codewill give useful results from zero pressure and temperature to pressures and temperatures of about30 MPa and 589.29 K, respectively. It is worth mentioning that the maximum pressure required for theCO2 pipeline is 15 MPa, which is within the EOS applicability range.
9. Results and Discussion
Figures 4–6 depict the GT power required for 10, 8, and 6 compressor stages of CO2 compression,respectively, within the operating conditions earlier highlighted. The process requirement is to givea constant discharge pressure which is accomplished by varying the speed of the GT driver. In sodoing, the compressor efficiently develops a constant head by lowering its speed at flows below therated flow. As a result, it can be observed from the graphs that, as the CO2 mass flow rate increases,the power requirement increases.
Further deducible from the plots is the steady increase in compression power requirement asthe intercooler pressure drop increases. This is necessary to ensure the required discharge pressure isattained during the compression process.
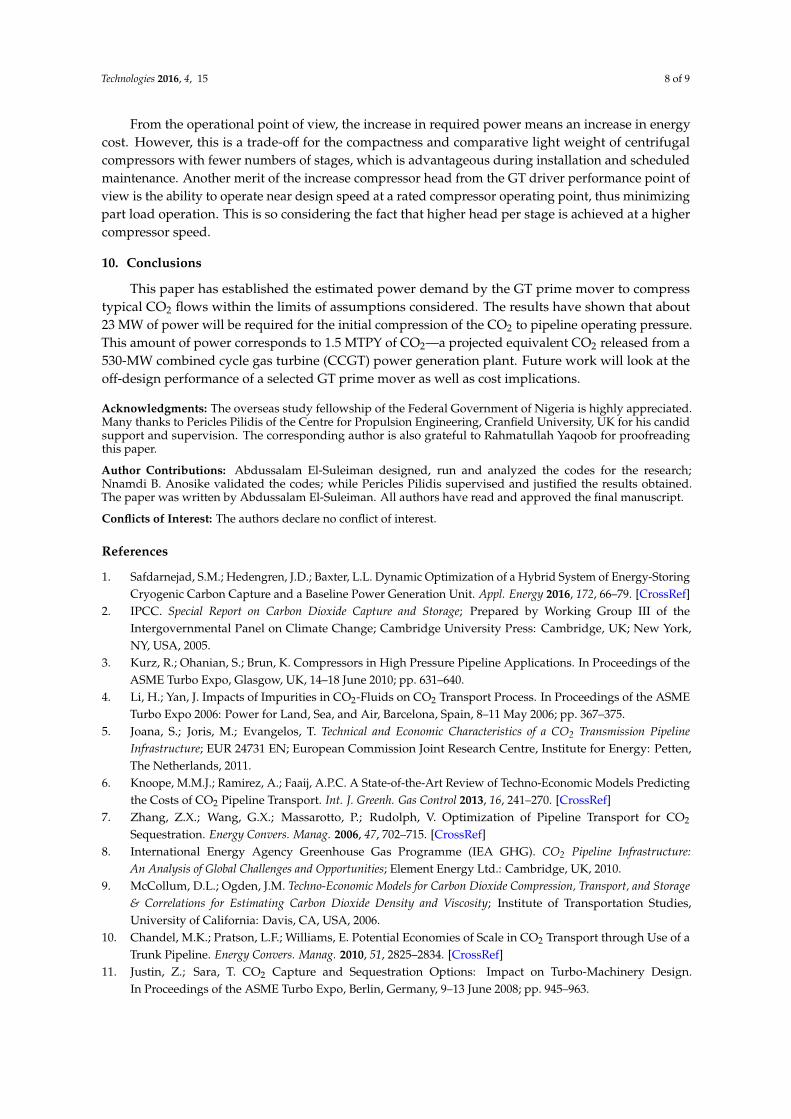
At the rated flow of 1.5 MTPY, the power required considering a 5% intercooler pressure drop is22.98 MW, 23.03 MW, and 23.41 MW for the 10, 8, and 6 compression stages, respectively. The valuesindicate about a 2% increase in power requirement as the number of stages reduces from 10 to 6(compression ratios varying from 1.58 to 2.26). The rise in compressor head or otherwise rise in stagecompression ratio with fewer stages accounts for this development.
Technologies 2016, 4, 15 7 of 9Technologies 2016, 4, 15 7 of 9
Figure 4. Gas turbine power requirement for a 10-stage CO2 compression.
Figure 5. Gas turbine power requirement for a 8-stage CO2 compression.
Figure 6. Gas turbine power requirement for a 6-stage CO2 compression.
Figure 4. Gas turbine power requirement for a 10-stage CO2 compression.
Technologies 2016, 4, 15 7 of 9
Figure 4. Gas turbine power requirement for a 10-stage CO2 compression.
Figure 5. Gas turbine power requirement for a 8-stage CO2 compression.
Figure 6. Gas turbine power requirement for a 6-stage CO2 compression.
Figure 5. Gas turbine power requirement for a 8-stage CO2 compression.
Technologies 2016, 4, 15 7 of 9
Figure 4. Gas turbine power requirement for a 10-stage CO2 compression.
Figure 5. Gas turbine power requirement for a 8-stage CO2 compression.
Figure 6. Gas turbine power requirement for a 6-stage CO2 compression. Figure 6. Gas turbine power requirement for a 6-stage CO2 compression.
Technologies 2016, 4, 15 8 of 9
From the operational point of view, the increase in required power means an increase in energycost. However, this is a trade-off for the compactness and comparative light weight of centrifugalcompressors with fewer numbers of stages, which is advantageous during installation and scheduledmaintenance. Another merit of the increase compressor head from the GT driver performance point ofview is the ability to operate near design speed at a rated compressor operating point, thus minimizingpart load operation. This is so considering the fact that higher head per stage is achieved at a highercompressor speed.
10. Conclusions
This paper has established the estimated power demand by the GT prime mover to compresstypical CO2 flows within the limits of assumptions considered. The results have shown that about23 MW of power will be required for the initial compression of the CO2 to pipeline operating pressure.This amount of power corresponds to 1.5 MTPY of CO2—a projected equivalent CO2 released from a530-MW combined cycle gas turbine (CCGT) power generation plant. Future work will look at theoff-design performance of a selected GT prime mover as well as cost implications.
Acknowledgments: The overseas study fellowship of the Federal Government of Nigeria is highly appreciated.Many thanks to Pericles Pilidis of the Centre for Propulsion Engineering, Cranfield University, UK for his candidsupport and supervision. The corresponding author is also grateful to Rahmatullah Yaqoob for proofreadingthis paper.
Author Contributions: Abdussalam El-Suleiman designed, run and analyzed the codes for the research;Nnamdi B. Anosike validated the codes; while Pericles Pilidis supervised and justified the results obtained.The paper was written by Abdussalam El-Suleiman. All authors have read and approved the final manuscript.
Conflicts of Interest: The authors declare no conflict of interest.
References
1. Safdarnejad, S.M.; Hedengren, J.D.; Baxter, L.L. Dynamic Optimization of a Hybrid System of Energy-StoringCryogenic Carbon Capture and a Baseline Power Generation Unit. Appl. Energy 2016, 172, 66–79. [CrossRef]
2. IPCC. Special Report on Carbon Dioxide Capture and Storage; Prepared by Working Group III of theIntergovernmental Panel on Climate Change; Cambridge University Press: Cambridge, UK; New York,NY, USA, 2005.
3. Kurz, R.; Ohanian, S.; Brun, K. Compressors in High Pressure Pipeline Applications. In Proceedings of theASME Turbo Expo, Glasgow, UK, 14–18 June 2010; pp. 631–640.
4. Li, H.; Yan, J. Impacts of Impurities in CO2-Fluids on CO2 Transport Process. In Proceedings of the ASMETurbo Expo 2006: Power for Land, Sea, and Air, Barcelona, Spain, 8–11 May 2006; pp. 367–375.
5. Joana, S.; Joris, M.; Evangelos, T. Technical and Economic Characteristics of a CO2 Transmission PipelineInfrastructure; EUR 24731 EN; European Commission Joint Research Centre, Institute for Energy: Petten,The Netherlands, 2011.
6. Knoope, M.M.J.; Ramirez, A.; Faaij, A.P.C. A State-of-the-Art Review of Techno-Economic Models Predictingthe Costs of CO2 Pipeline Transport. Int. J. Greenh. Gas Control 2013, 16, 241–270. [CrossRef]
7. Zhang, Z.X.; Wang, G.X.; Massarotto, P.; Rudolph, V. Optimization of Pipeline Transport for CO2
Sequestration. Energy Convers. Manag. 2006, 47, 702–715. [CrossRef]8. International Energy Agency Greenhouse Gas Programme (IEA GHG). CO2 Pipeline Infrastructure:
An Analysis of Global Challenges and Opportunities; Element Energy Ltd.: Cambridge, UK, 2010.9. McCollum, D.L.; Ogden, J.M. Techno-Economic Models for Carbon Dioxide Compression, Transport, and Storage
& Correlations for Estimating Carbon Dioxide Density and Viscosity; Institute of Transportation Studies,University of California: Davis, CA, USA, 2006.
10. Chandel, M.K.; Pratson, L.F.; Williams, E. Potential Economies of Scale in CO2 Transport through Use of aTrunk Pipeline. Energy Convers. Manag. 2010, 51, 2825–2834. [CrossRef]
11. Justin, Z.; Sara, T. CO2 Capture and Sequestration Options: Impact on Turbo-Machinery Design.In Proceedings of the ASME Turbo Expo, Berlin, Germany, 9–13 June 2008; pp. 945–963.
Technologies 2016, 4, 15 9 of 9
12. Cohen, S.M.; Rochelle, G.T.; Webber, M.E. Optimizing Post-Combustion CO2 Capture in Response to VolatileElectricity Prices. Int. J. Greenh. Gas Control 2012, 8, 180–195. [CrossRef]
13. Skovholt, O. CO2 Transportation System. Energy Convers. Manag. 1993, 34, 1095–1103. [CrossRef]14. Koornneef, J.; Ramírez, A.; Turkenburg, W.; Faaij, A. The Environmental Impact and Risk Assessment of
CO2 Capture, Transport and Storage—An Evaluation of the Knowledge Base. Prog. Energy Combust. Sci.2012, 38, 62–86. [CrossRef]
15. Safdarnejad, S.M.; Kennington, L.; Baxter, L.L.; Hedengren, J.D. Investigating the Impact of CryogenicCarbon Capture on Power Plant Performance. In Proceedings of the American Control Conference, PalmerHouse Hilton, Chicago, IL, USA, 1–3 July 2015; pp. 5016–5021.
16. Mohitpour, M.; Golshan, H.; Murray, A. Pipeline Design and Construction: A Practical Approach, 2nd ed.;ASME Press: New York, NY, USA, 2003.
17. McCoy, S.T.; Rubin, E.S. An Engineering-Economic Model of Pipeline Transport of CO2 with Application toCarbon Capture and Storage. Int. J. Greenh. Gas Control 2008, 2, 219–229. [CrossRef]
18. Ogaji, S.; Pilidis, P.; Sethi, V. Power Plant Selection in a Carbon Constrained World the TERA (TechnoeconomicEnvironmental Risk Analysis). J. Aerosp. Power 2009, 24, 896–902.
19. MacCapani, M.; Khan, R.S.R.; Burgmann, P.J.; Lorenzo, G.D.; Ogaji, S.O.T.; Pilidis, P.; Bennett, I. A TERABased Comparison of Heavy Duty Engines and their Artificial Design Variants for Liquefied Natural GasService. J. Eng. Gas Turbines Power 2014, 136. [CrossRef]
20. Peng, D.-Y.; Robinson, D.B. A New Two—Constant Equation of State. Ind. Eng. Chem. Fundam. 1976,15, 59–64. [CrossRef]
21. Maroto-Valer, M.M. Developments and Innovation in Carbon Dioxide (CO2) Capture and Storage Technology;CRC Press: Boca Raton, FL, USA; Oxford, UK, 2010.
22. Kurz, R. The Physics of Centrifugal Compressor Performance; Pipeline Simulation Interest Group: Palm Springs,CA, USA, 2004.
23. Paresh, G. Performance Evaluation of Pumps and Compressors, 1st ed.; Lulu.com: Raleigh, NC, USA, 2008.24. Boyce, M.P. Centrifugal Compressors: A Basic Guide; PennWell: Tulsa, OK, USA, 2003.25. Mokhatab, S.; Poe, W.A.; Speight, J.G. Natural Gas Compression. In Handbook of Natural Gas Transmission and
Processing; Gulf Professional Pub.: Burlington, MA, USA, 2006; pp. 295–322.26. Walsh, P.P.; Fletcher, P. Gas Turbine Performance, 2nd ed.; Blackwell Science: Oxford, UK, 2004.27. Coal Industry Advisory Board (CIAB). Power Generation from Coal: Measuring and Reporting Efficiency
Performance and CO2 Emissions; OECD/IEA: Paris, France, 2010.
© 2016 by the authors; licensee MDPI, Basel, Switzerland. This article is an open accessarticle distributed under the terms and conditions of the Creative Commons Attribution(CC-BY) license (http://creativecommons.org/licenses/by/4.0/).
Related Documents