A Predominant European Ancestry of Paternal Lineages from Canary Islanders C. Flores 1,2 , N. Maca-Meyer 1 , J. A. P ´ erez 1 , A. M. Gonz ´ alez 1 , J. M. Larruga 1 and V. M. Cabrera 1, ∗ 1 Departamento de Gen´ etica, Universidad de La Laguna, Canary Islands 2 Unidad de Investigaci´ on, Hospital Universitario N.S. de Candelaria, Canary Islands Summary We genotyped 24 biallelic sites and 5 microsatellites from the non-recombining portion of the Y chromosome in 652 males from the Canary Islands. The results indicate that, contrary to mtDNA data, paternal lineages of the current population are overwhelmingly (>90%) of European origin, arguing for a highly asymmetric pattern of mating after European occupation. However, the presence of lineages of indisputable African assignation demonstrates that an aboriginal background still persists (<10%). On the basis of distribution and dating of some of these lineages we derived a genetic perspective of settlement processes of the archipelago in two stages, congruent with anthropological, archaeological and linguistic findings. Introduction The Canarian archipelago, formed by seven main is- lands, is located between latitudes 27 ◦ 37 and 29 ◦ 25 N and longitudes 13 ◦ 20 and 18 ◦ 10 W, geographically belonging to the African continent (Fig. 1). Unlike the rest of Macaronesian archipelagos, the Canary Islands were inhabited by aboriginal people, uniformly known as “Guanches,” at the time of European occupation in the 15 th Century (de Abreu-Galindo, 1977). From the beginning their dialects, and some cultural traits, were related, by conquest chroniclers, to the Berber popula- tion of neighbouring Africa. Since then, anthropology, archaeology and philology have bolstered the hypoth- esis of the North African origin of the Canarian in- digenous population (Navarro, 1997). Furthermore, the different human types discovered, and the heterogene- ity of cultural remains, point to successive arrivals of North African settlers (Verneau, 1887; Hooton, 1925; Fust´ e, 1958; Schwidetzky, 1963; Berm´ udez de Castro, 1987; Arco & Navarro, 1987; Onrubia-Pintado, 1987; ∗ Correspondence: Vicente M. Cabrera, Departamento de Gen´ etica, Facultad de Biolog´ ıa, Universidad de La Laguna, Tener- ife, 38271 SPAIN. Phone: 34-922-318350. Fax: 34-922-318311. E-mail: [email protected] Navarro, 1991, 1997), with the exceptions of some western islands (Arnay & Gonz´ alez-Reimers, 1985– 87; Gonz´ alez & Tejera, 1990). The most ancient hu- man settlement seems to be no earlier than the 1 st mil- lennium B.C., according to absolute C 14 dating (Billy, 1982; Onrubia-Pintado, 1987). In spite of the aggres- sive European conquest (Su´ arez et al. 1988), and sub- sequent massive immigration of Normans, Spaniards, Portuguese, and African slaves (Lobo-Cabrera, 1993), at the end of the 16 th Century approximately two-thirds of the Canarian population were Africans and aborigines (W¨ olfel, 1930). Furthermore, osteological studies com- paring aboriginal remains and modern rural populations support the persistence of indigenous traits even in the current population (Fust´ e, 1958; Schwidetzky, 1975). Past demographic events can be inferred through the analysis of gene pools from modern populations. The first genetic approaches to decipher the origin of Ca- narian aborigines and their influence in the present- day populations date from the nineteen-fifties (Guash et al. 1952; Bravo & de las Casas, 1958; Roberts et al. 1966; Parejo, 1966; Schwarzfischer & Liebrich, 1963; R¨ ossing, 1967). Using the so-called classical markers, such as blood groups and red-blood-cell enzyme loci, these works and subsequent studies (Martell et al. 1986; 138 Annals of Human Genetics (2003) 67,138–152 C University College London 2003

Welcome message from author
This document is posted to help you gain knowledge. Please leave a comment to let me know what you think about it! Share it to your friends and learn new things together.
Transcript

A Predominant European Ancestry of Paternal Lineagesfrom Canary Islanders
C. Flores1,2, N. Maca-Meyer1, J. A. Perez1, A. M. Gonzalez1, J. M. Larruga1 and V. M. Cabrera1,∗1Departamento de Genetica, Universidad de La Laguna, Canary Islands2Unidad de Investigacion, Hospital Universitario N.S. de Candelaria, Canary Islands
Summary
We genotyped 24 biallelic sites and 5 microsatellites from the non-recombining portion of the Y chromosome in 652males from the Canary Islands. The results indicate that, contrary to mtDNA data, paternal lineages of the currentpopulation are overwhelmingly (>90%) of European origin, arguing for a highly asymmetric pattern of mating afterEuropean occupation. However, the presence of lineages of indisputable African assignation demonstrates that anaboriginal background still persists (<10%). On the basis of distribution and dating of some of these lineages wederived a genetic perspective of settlement processes of the archipelago in two stages, congruent with anthropological,archaeological and linguistic findings.
Introduction
The Canarian archipelago, formed by seven main is-lands, is located between latitudes 27◦ 37′ and 29◦ 25′
N and longitudes 13◦ 20′ and 18◦ 10′ W, geographicallybelonging to the African continent (Fig. 1). Unlike therest of Macaronesian archipelagos, the Canary Islandswere inhabited by aboriginal people, uniformly knownas “Guanches,” at the time of European occupation inthe 15th Century (de Abreu-Galindo, 1977). From thebeginning their dialects, and some cultural traits, wererelated, by conquest chroniclers, to the Berber popula-tion of neighbouring Africa. Since then, anthropology,archaeology and philology have bolstered the hypoth-esis of the North African origin of the Canarian in-digenous population (Navarro, 1997). Furthermore, thedifferent human types discovered, and the heterogene-ity of cultural remains, point to successive arrivals ofNorth African settlers (Verneau, 1887; Hooton, 1925;Fuste, 1958; Schwidetzky, 1963; Bermudez de Castro,1987; Arco & Navarro, 1987; Onrubia-Pintado, 1987;
∗Correspondence: Vicente M. Cabrera, Departamento deGenetica, Facultad de Biologıa, Universidad de La Laguna, Tener-ife, 38271 SPAIN. Phone: 34-922-318350. Fax: 34-922-318311.E-mail: [email protected]
Navarro, 1991, 1997), with the exceptions of somewestern islands (Arnay & Gonzalez-Reimers, 1985–87; Gonzalez & Tejera, 1990). The most ancient hu-man settlement seems to be no earlier than the 1st mil-lennium B.C., according to absolute C14 dating (Billy,1982; Onrubia-Pintado, 1987). In spite of the aggres-sive European conquest (Suarez et al. 1988), and sub-sequent massive immigration of Normans, Spaniards,Portuguese, and African slaves (Lobo-Cabrera, 1993), atthe end of the 16th Century approximately two-thirds ofthe Canarian population were Africans and aborigines(Wolfel, 1930). Furthermore, osteological studies com-paring aboriginal remains and modern rural populationssupport the persistence of indigenous traits even in thecurrent population (Fuste, 1958; Schwidetzky, 1975).
Past demographic events can be inferred through theanalysis of gene pools from modern populations. Thefirst genetic approaches to decipher the origin of Ca-narian aborigines and their influence in the present-day populations date from the nineteen-fifties (Guashet al. 1952; Bravo & de las Casas, 1958; Roberts et al.1966; Parejo, 1966; Schwarzfischer & Liebrich, 1963;Rossing, 1967). Using the so-called classical markers,such as blood groups and red-blood-cell enzyme loci,these works and subsequent studies (Martell et al. 1986;
138 Annals of Human Genetics (2003) 67,138–152 C© University College London 2003

Y-Chromosome Variation in Canary Islands
Figure 1 Map showing the location of Canary Islands and pie charts of relative frequencies for Northwest African (dashed)and Saharan (black) markers by island.
Morilla et al. 1988; Afonso et al. 1989; Perez et al.1991; Pinto et al. 1994, 1996b; Moral et al. 1997)supposed that Iberians, sub-Saharans and NorthwestAfricans were the most probable parental populations ofcurrent Canary Islanders, considering that the presentNorthwest African gene pool represents the Canarianaborigines. In general, the genes surveyed were not in-formative due to the absence of clear genetic differ-ences between South Europeans and North Africans.When an unambiguous African contribution was de-tected, it was due to the presence of Negroid alleles.This was supposed to be from an aboriginal source,though a sub-Saharan African slave trade origin can-not be ruled out. Similar results were obtained withhaplotype data from other nuclear genes (Esteban et al.1998; Flores et al. 2001b). These markers indicated con-sistent admixture proportions of roughly 70% for Iberi-ans, 20% for North Africans and 10% for Black Africans,with notable heterogeneity between islands. However,mitochondrial DNA (mtDNA) studies predicted largermaternal contributions of African descent: 25–43% forNorth Africans and 5–21% for Black Africans (Pintoet al. 1996a; Rando et al. 1999), although supportinga predominantly Iberian influence (36–62%). This dis-crepancy between admixture proportions has been in-
terpreted in terms of unequal contributions of males andfemales from parental populations produced by Spanishoccupation (Pinto et al. 1996a; Flores et al. 2001a).Moreover, mtDNA analysis has also clarified the abo-riginal settlement process, suggesting that there was onedominant initial colonization from Northwest Africathat affected all the islands from East to West (Randoet al. 1999). However, Rando et al. (1999) did not ex-clude the possibility of additional immigrations fromNorth Africa.
In this study we approach the same Canarian is-sues from a male perspective, using different mutabilitymarkers from the haploid part of the Y-chromosome.This analysis offers several advantages with respect toautosomal or maternal markers. As in mtDNA, the en-tire region is free of recombination, but the use of slowlyevolving biallelic markers practically avoids problemsof clade-sharing due to convergence. These markersidentify well-defined composite clusters or haplogroups.Quickly evolving microsatellites further separate hap-logroups into closely related lineages, enabling us toanalyse population processes on a micro-evolutionaryscale. Furthermore, genetic differences among humanpopulations are greater for the Y-chromosome than formtDNA or autosomal markers (Jorde et al. 2000), which
C© University College London 2003 Annals of Human Genetics (2003) 67,138–152 139

C. Flores et al.
facilitates the analysis of relative affinities and more ac-curate admixture estimates.
Materials and Methods
Samples
A total of 652 unrelated male subjects from the CanaryIslands were analysed. Samples were collected in hos-pitals and health care centres of the archipelago withappropriate informed consent. Paternal grandfatherbirthplaces were used to classify the samples as 47 in-dividuals from El Hierro, 85 from La Palma, 92 fromLa Gomera, 178 from Tenerife, 78 from Gran Canaria,97 from Lanzarote and 75 from Fuerteventura. Addi-tionally, data on 45 Basques (Underhill et al. 2000) and16 Catalans (Bosch et al. 2001), along with data on 568general Iberians (non-Basque, non-Catalan), 26 Nor-mans, 99 Northwest Africans and 90 West sub-Saharans(C. Flores, unpublished) were included for comparativeanalysis.
Y-Chromosome Polymorphisms
We chose 24 biallelic markers from the non-recombining portion of the Y chromosome that re-flect unique events from the literature. Eight of thesemarkers have been typed according to published pro-tocols: DYS287 as in Hammer & Horai (1995), p12f2(Casanova et al. 1985) as in Sun et al. (2000), DYS271 asin Seielstad et al. (1994), 92R7 as in Forster et al. (2000),SRY 10831 (Whitfield et al. 1995) as in Kwok et al. (1996),SRY 2627 as in Veitia et al. (1997), Tat as in Zerjal et al.(1997), and M9 (Underhill et al. 1997) as in Hurles et al.(1998). The remaining sixteen include: PN2 (Hammeret al. 1997); M13 (Underhill et al. 1997); M26, M67,M70, M81, M89, M170, M172, and M173 (Shen et al.2000; Underhill et al. 2000); M34, M52, M78, M123and M153 (Underhill et al. 2000); and M201 (Seminoet al. 2000). The majority of these sixteen polymor-phisms (excepting M34, M70, M78, M81 and M153) donot change sites recognized by available restriction en-zymes. Consequently, we developed PCR-RFLP pro-tocols for all of them. Primer sequences were as previ-ously described (Underhill et al. 1997, 2000), or werechanged by introducing a mismatched base to build a
variable restriction site on amplification products. Con-ditions for PCR-RFLP of each of these 16 markers areshown in Table 1. For each marker, over 10% of the ther-mal cycling reactions were positive and negative controlsto monitor the PCR-RFLP typing.
Five Y-linked tetranucleotide-repeat microsatel-lites were also analysed. DYS391, DYS393 andDYS434 were genotyped as previously de-scribed (Ayub et al. 2000; Kayser et al. 2001).For DYS391, we used another primer pair (5′-CTATTCATTCAATCATACACCCA-3′ and 5′-AGGTAGGCAGGCAGATAGGC-3′ ) to reduce theproduct length. In addition, DYS466 and DYS467were also typed with a new protocol that will bedescribed elsewhere (C. Flores, unpublished). DYS466was discarded for coalescence estimates, as there isevidence of stepwise mutation model violation (Flores,2002).
PCR amplifications were carried out in an MJ Re-search PTC-100 thermal cycler in 10 µl reactions con-taining: 0.4 U EcoTaq DNA polymerase (Ecogen), 3pmol of each primer, 0.2 mM dNTPs, 2.5 mM MgCl2,16.6 mM (NH4)SO4, 67 mM Tris-HCl pH = 8.8, and10–30 ng of template DNA extracted from whole bloodas in Rudbeck & Dissing (1998). For biallelic markers,cycling programs were standard three-step PCR pro-files, plus a first step of 94◦C for 2 min. and a finalextension step of 5 min. at 72◦C. Habitually, the PCRconditions were 35 cycles of 5–30 sec. at 94◦C, 5–30sec. at the adequate annealing temperature, and 5–30sec. at 72◦C. For RFLP analysis, 0.5–1 U of the appro-priate restriction enzyme was used to directly digest thewhole volume of PCR product under the manufactur-ers’ recommendations. RFLP patterns and microsatel-lite alleles were resolved on 6% PAGE (29:1 and 19:1acrylamide: bis-acrylamide, respectively) in 1X TBEbuffer using an X-CellTM MiniCell (NOVEX) and thenstained with ethidium bromide (1 µg/ml) for 15 min.For microsatellite allele size calibration, a mixture ofdifferent sequenced alleles was included in each run.
We used the term haplogroup to designate the com-bination of allelic states of the biallelic markers, andreserved the term haplotype to define distinct sublin-eages within haplogroups characterized by variations atmicrosatellite loci. Haplogroup tree and nomenclature,identified by lineage, is shown in Fig. 2 on the basis
140 Annals of Human Genetics (2003) 67,138–152 C© University College London 2003

Y-Chromosome Variation in Canary Islands
Table 1 PCR-RFLP protocols developed for sixteen biallelic markers
Marker Primer pairs (above, forward; below, reverse) Tb tc Sized Digestion Fragment/s (allele)e
PN2 5′- AAGGAGCATTAATAAAACTAAAGC-3′ a 54 15 104 Alu I 69/35 (C) → 46/35/23 (T)5′-GAACTCCCGATTCCCCTCTA-3′
M13 f 54 10 231 Nde II 160/71 (C) → 231 (G)M26 5′-TTTTTCTGAATTAGAATGATC-3′ a 48 10 239 Bcl I 239 (G) → 222/17 (A)
5′-GTACACCTTTCTTAGGTTGC-3′
M34 5′-ATGTTAATGCCTGGCTTCCA-3′ 55 5 259 Hinf I 169/90 (G) → 143/90/26 (T)5′-AGTCATTCCAGGGACATCCA-3′
M52 5′-ATACCTATAAGAATATTGCCTCCA-3′ a 50 10 82 Sty I 60/22 (A) → 82 (C)5′-GACGAAGCAAACATTTCAAG-3′
M67 5′-GACAAACTCCCCTGCACACT-3′ 58 10 264 Nde I 264 (A) → 243/21 (T)5′-GTTCGTGGACCCCTCTACAT-3′ a
M70 g 48 10 257 Bsa I 257 (A) → 218/39 (C)M78 g 50 20 301 Aci I 196/105 (C) → 301 (T)M81 g 54 20 422 HpyCH4 IV 276/146 (C) → 422 (T)M89 5′-AAGAACTCTGCCCCATTCAA-3′ 58 20 191 Nla III 93/79/19 (C) → 98/93 (T)
5′-CAACTCAGGCAAAGTGAGACAT-3′ a
M123 5′-CACAGTATCTGAACTAGCATCTCA-3′ a 50 20 257 Dde I 102/76/58/21 (G) →5′-CAGCGAATTAGATTTTCTTGC-3′ 123/76/58 (A)
M153 g 45 10 459 Tsp 509I 168/130/82/79 (T) →168/130/79/48/34 (A)
M170 5′-CTATTTTATTTACTTAAAAATCATTGATC-3′ a 50 10 88 Bcl I 63/25 (A) → 88 (C)5′-AGACCACACAAAAACAGGTC-3′
M172 5′-AAATTAGGAGCCAGATGACC-3′ 52 5 176 Hinf I 176 (T) → 151/25 (G)5′-AATAATAATTGAAGACCTTTTGAGT-3′ a
M173 5′-AAGTTGATGCCACTTTTCAG-3′ 48 10 199 Dra III 178/21 (A) → 199 (C)5′-TTCTGAATATTAACAGATCACAAAG-3′ a
M201 5′-CTAATAATCCAGTACCAACTGAGG-3′ a 55 10 207 Bsl I 108/78/21 (G) → 129/78 (T)5′-TGAAAGTTCAAACGTCAAACAG-3′
aMismatched primer. bPCR annealing temperature in ◦C. cTime (sec.) for the three PCR steps. dPCR product size in base pairs.eRFLP fragments in base pairs. fFrom Underhill et al. (1997). gFrom Underhill et al. (2000).
of those of the YCC (Y Chromosome Consortium,2002).
Statistical Analysis
Haplogroup frequency distributions was inspected byan exact test of population differentiation (Raymond& Rousset, 1995) implemented in ARLEQUIN 2000(Schneider et al. 2000). Significance of these tests wereassessed by comparison of the observed frequency dis-tributions to 10,000 explorations of Markov Chainsteps. This software was also used to analyse the amongpopulation variability based on haplogroup frequen-cies (AMOVA), and to test for correlations betweengeographic and genetic distances through a Manteltest (Mantel, 1967) with 1000 permutation steps. Ge-netic distances, as pairwise FST from haplogroup fre-quencies, were calculated by means of the PHYLIP
ver. 3.5 package (Felsenstein, 1993), and representedin two-dimensional space with multidimensional scal-ing (MDS) (Kruskal & Wish, 1978), with the programALSCAL included in the SPSS ver. 9 package. Geo-graphical distances were drawn from the Great CircleDistance program (http://www.mercury.demon.co.uk/dist/dodist.html) by comparison of geographical coor-dinates. The geographical distribution of some hap-logroups was also inspected by Spearman ranked cor-relations, comparing major cities of the Canarianarchipelago with respect to Cape Juby, the nearestAfrican point.
Admixture estimates were calculated by two differ-ent estimators. We used Long’s measure, or mL (Long,1991) to obtain an estimate based only on haplogroupfrequencies. This also allowed us to calculate, in the ab-sence of selection, the amount of variance in the hybridpopulation not explained by the admixture model. This
C© University College London 2003 Annals of Human Genetics (2003) 67,138–152 141

C. Flores et al.
Figure 2 Phylogenetic network of 26 Y-chromosome haplogroups potentiallydetected by the 24 biallelic markers shown on branches.
variation was transformed to an inbreeding coefficient,an FST distance, by computing equation 9 from Long(1991) substituting 2N by N chromosomes. The sec-ond estimator was mY (Bertorelle & Excoffier, 1998),which also incorporates the molecular differences intocalculations, counted as the number of differences for
haplogroups and as squared differences in microsatelliteallele sizes for haplotype data.
Haplogroup ages were calculated as follows: first, as inBertranpetit & Calafell (1996), we computed the meannumber of mutational steps from a root haplotype (cho-sen as the haplotype with the least number of mutational
142 Annals of Human Genetics (2003) 67,138–152 C© University College London 2003
Y-Chromosome Variation in Canary Islands
steps from all the others); then we transformed it for hap-logroup dating, assuming a generation time of 30 yearsand a mutation rate of 2.1 × 10⁻³ (95% CI 0.6–4.9 ×10⁻³ [Heyer et al. 1997]). Divergence percentages ofhaplogroups between the Canarian population and theirparental populations were assessed following Hurles et al.(1999). By means of the Microsat 1.5d program (Minch,1997), we computed ASD distances (Thomas et al.1998) between all haplotypes within a haplogroup andthe root haplotype (“ASDr”), and ASD between Ca-narian and European-African compound chromosomes(“ASDcr”). Dividing ASDcr by twice ASDr we ob-tained a percentage of divergence by haplogroup. Thisdivergence was translated into years by multiplying it bythe age of the haplogroup calculated as above.
Results and Discussion
Haplogroup Distribution
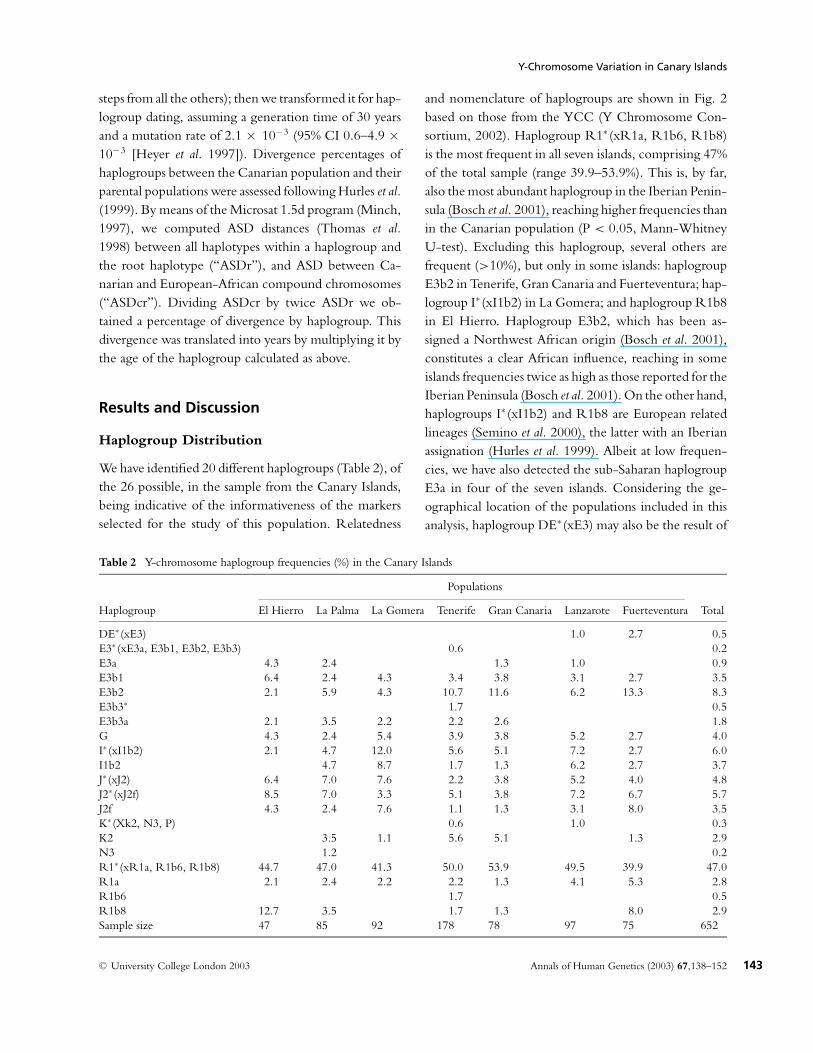
We have identified 20 different haplogroups (Table 2), ofthe 26 possible, in the sample from the Canary Islands,being indicative of the informativeness of the markersselected for the study of this population. Relatedness
Table 2 Y-chromosome haplogroup frequencies (%) in the Canary Islands
Populations
Haplogroup El Hierro La Palma La Gomera Tenerife Gran Canaria Lanzarote Fuerteventura Total
DE∗ (xE3) 1.0 2.7 0.5E3∗ (xE3a, E3b1, E3b2, E3b3) 0.6 0.2E3a 4.3 2.4 1.3 1.0 0.9E3b1 6.4 2.4 4.3 3.4 3.8 3.1 2.7 3.5E3b2 2.1 5.9 4.3 10.7 11.6 6.2 13.3 8.3E3b3∗ 1.7 0.5E3b3a 2.1 3.5 2.2 2.2 2.6 1.8G 4.3 2.4 5.4 3.9 3.8 5.2 2.7 4.0I∗ (xI1b2) 2.1 4.7 12.0 5.6 5.1 7.2 2.7 6.0I1b2 4.7 8.7 1.7 1.3 6.2 2.7 3.7J∗ (xJ2) 6.4 7.0 7.6 2.2 3.8 5.2 4.0 4.8J2∗ (xJ2f) 8.5 7.0 3.3 5.1 3.8 7.2 6.7 5.7J2f 4.3 2.4 7.6 1.1 1.3 3.1 8.0 3.5K∗ (Xk2, N3, P) 0.6 1.0 0.3K2 3.5 1.1 5.6 5.1 1.3 2.9N3 1.2 0.2R1∗ (xR1a, R1b6, R1b8) 44.7 47.0 41.3 50.0 53.9 49.5 39.9 47.0R1a 2.1 2.4 2.2 2.2 1.3 4.1 5.3 2.8R1b6 1.7 0.5R1b8 12.7 3.5 1.7 1.3 8.0 2.9Sample size 47 85 92 178 78 97 75 652
and nomenclature of haplogroups are shown in Fig. 2based on those from the YCC (Y Chromosome Con-sortium, 2002). Haplogroup R1∗ (xR1a, R1b6, R1b8)is the most frequent in all seven islands, comprising 47%of the total sample (range 39.9–53.9%). This is, by far,also the most abundant haplogroup in the Iberian Penin-sula (Bosch et al. 2001), reaching higher frequencies thanin the Canarian population (P < 0.05, Mann-WhitneyU-test). Excluding this haplogroup, several others arefrequent (>10%), but only in some islands: haplogroupE3b2 in Tenerife, Gran Canaria and Fuerteventura; hap-logroup I∗ (xI1b2) in La Gomera; and haplogroup R1b8in El Hierro. Haplogroup E3b2, which has been as-signed a Northwest African origin (Bosch et al. 2001),constitutes a clear African influence, reaching in someislands frequencies twice as high as those reported for theIberian Peninsula (Bosch et al. 2001). On the other hand,haplogroups I∗ (xI1b2) and R1b8 are European relatedlineages (Semino et al. 2000), the latter with an Iberianassignation (Hurles et al. 1999). Albeit at low frequen-cies, we have also detected the sub-Saharan haplogroupE3a in four of the seven islands. Considering the ge-ographical location of the populations included in thisanalysis, haplogroup DE∗ (xE3) may also be the result of
C© University College London 2003 Annals of Human Genetics (2003) 67,138–152 143

C. Flores et al.
African influence. It must be noted that haplogroups E3aand DE∗ (xE3) have not been detected in Iberian sam-ples to date (Semino et al. 2000; Bosch et al. 2001). Also,it is striking that both an Iberian haplogroup (R1b8)and a sub-Saharan African haplogroup (E3a) were attheir highest frequencies in the archipelago in El Hierro.The presence of some haplogroups of widespread distri-bution in Europe, in combination with others of clearNorthwest and sub-Saharan African assignation, reflectthe complex demographic patterns that have shaped thecurrent Canarian population.
Population Structure and Affinities
Haplogroup distribution in the archipelago is heteroge-neous (P = 0.001), although few (29%) pairwise com-parisons gave results at a significant level (Table 3). Fur-thermore, when we carried out an AMOVA analysis,a low amount (0.3%) of variance was attributed to dif-ferences between populations within the archipelago.This value is 4.5 and 8 times lower than that obtainedfor the European and Northwest African populationsconsidered here, respectively, although Canarian popu-lations are distributed with a mean distance of 228 km,those of Europe with a mean of 587 km, and North-west Africans with a mean of 668 km. This result couldbe perfectly explained by the way that European occu-pation occurred, with groups of people of mixed ori-gin (Suarez et al. 1988). This event, and subsequentgene flow, would have reduced the between island vari-ance. Even though some neighbouring islands werealso genetically related (Table 3), a Mantel test revealedthat genetic and geographic distances are not correlated(r = −0.081, P = 0.612).
Table 3 FST distances (below diagonal) and exact probability values of differentiation (above diagonal) between Canarian populations
El Hierro La Palma La Gomera Tenerife G. Canaria Lanzarote Fuerteventura
El Hierro — 0.637 0.008 0.008 0.089 0.042 0.353La Palma 0.012 — 0.273 0.295 0.886 0.525 0.307La Gomera 0.026 0.012 — 0.003 0.064 0.522 0.004Tenerife 0.023 0.007 0.020 — 0.997 0.075 0.019G. Canaria 0.027 0.009 0.026 0.002 — 0.249 0.164Lanzarote 0.020 0.005 0.010 0.008 0.010 — 0.120Fuerteventura 0.016 0.014 0.020 0.017 0.023 0.018 —
P < 0.05 in bold.
Table 4 Percentages of variation among different geographicalareas resulting from the AMOVA analysis
Northwest sub-SaharanEurope Africa Africa
El Hierro 0.005 0.344 0.371La Palma 0.000 0.319 0.371La Gomera 0.014 0.308 0.362Tenerife 0.001 0.299 0.380Gran Canaria 0.000 0.327 0.412Lanzarote 0.000 0.328 0.386Fuerteventura 0.015 0.258 0.361Europe — — —Northwest Africa 0.323 — —Sub-Saharan Africa 0.373 0.503 —Canary Islands 0.003 0.279 0.342
P > 0.05 in bold.
When AMOVA was calculated between populationspooled by geographical areas (Table 4), the lowest, al-though significant, level of variation was observed inthe European-Canarian comparison, being two ordersof magnitude lower than the comparison with bothAfrican groups. This clearly indicates that Canarianpopulations have greater differences from Africans thanfrom Europeans. Even so, the percentage of variancebetween Canarians and Africans is lower than percent-ages between Europeans and Africans, showing againan African paternal influence on the archipelago pop-ulations. Looking at each island, all are significantlydifferent from both African groups, but only La Gomeraand Fuerteventura are significantly different from theEuropean pool (Table 4). More precisely, these two is-lands have the lowest differentiation values from both,Northwest and sub-Saharan Africans.
Genetic affinities were also inspected from a MDSplot of FST genetic distances between populations
144 Annals of Human Genetics (2003) 67,138–152 C© University College London 2003

Y-Chromosome Variation in Canary Islands
Figure 3 Two-dimensional MDS plot relating Canarian andcontinental populations.
(Fig. 3). The correlation between FST and the newdistances derived from a two-dimensional plot wasvery high (r = 0.971). In the same way, the obtainedstress value (0.127) indicates that the chosen dimen-sionality is appropriate, and that a plot in a higherdimension is not necessary (http://www.analytictech.com/borgatti/mds.htm). Europeans, Northwest andsub-Saharan African populations constituted three dif-ferent clusters. The Canarian populations formed arelatively tight cluster near the European group, butwith some islands dispersed towards Northwest Africans.From the European group, clearly the general Iberianshave the highest affinities with Canarian populations.
Table 5 Relative admixture contributions to the Canarian populations inferred from haplogroup frequencies
Population Estimator Europe Northwest Africa sub-Saharan Africa FSTa
El Hierro mL 0.957 ± 0.036 — 0.043 ± 0.036 0.003mY 0.959 ± 0.063 — 0.041 ± 0.063 —
La Palma mL 0.961 ± 0.053 0.019 ± 0.049 0.021 ± 0.024 0.007mY 0.929 ± 0.054 0.051 ± 0.049 0.021 ± 0.027 —
La Gomera mL 0.997 ± 0.057 0.003 ± 0.057 — 0.019mY 0.899 ± 0.050 0.092 ± 0.051 0.009 ± 0.024 —
Tenerife mL 0.926 ± 0.041 0.074 ± 0.041 — 0.003mY 0.894 ± 0.044 0.097 ± 0.040 0.009 ± 0.013 —
G. Canaria mL 0.897 ± 0.043 0.093± 0.041 0.010 ± 0.012 -0.005mY 0.885 ± 0.063 0.096± 0.059 0.019 ± 0.023 —
Lanzarote mL 0.956 ± 0.046 0.035 ± 0.044 0.009 ± 0.015 0.003mY 0.940 ± 0.049 0.051 ± 0.046 0.009 ± 0.022 —
Fuerteventura mL 0.832 ± 0.107 0.171 ± 0.107 — 0.006mY 0.877 ± 0.069 0.123 ± 0.069 — —
Canary Is. Total mL 0.934 ± 0.030 0.059 ± 0.029 0.006 ± 0.008 0.003mY 0.910 ± 0.026 0.082 ± 0.026 0.008 ± 0.011 —
aVariation not explained by the model (Long, 1991).
Admixture Estimates
In previous genetic approaches, to explain the colonisa-tion of the Canary Islands admixture proportions havebeen inferred considering the extant people on the is-lands as a hybrid population with a Northwest Africanancestry, contributed, most probably, by Berber abo-riginal founders and, to a lesser degree, by sub-SaharanAfricans introduced after the conquest as a result of slavetrade. The other main contribution is from the Euro-pean population that, since the beginning of the oc-cupation, was steadily colonising the islands. However,the high paternal differentiation between these clustersof populations makes it possible to estimate their contri-butions to the current Canarian populations more accu-rately. Our admixture results (Table 5) were similar whenmL or mY estimators were used, although African mY
estimates always gave slightly higher values. For all com-parisons the highest paternal contribution resulted fromEuropean descent. Northwest Africans would have alsocontributed significantly, but the sub-Saharan Africancontribution was almost negligible, excepting the caseof El Hierro island. Differences between islands are ev-ident, as the Northwest African contribution dimin-ishes towards the westernmost islands, being insignifi-cant in El Hierro. The opposite occurs for Europeancontributions. As suggested from results on AMOVA
C© University College London 2003 Annals of Human Genetics (2003) 67,138–152 145

C. Flores et al.
analyses and genetic distances, the Europeans were themajor contributors to the current Canarian paternalgene pool, explaining about 90% of its whole variability,while Northwest and sub-Saharan Africans contributedno more than 6–8%, and less than 1%, respectively(Table 5). Clearly, there is a sharp contrast between pa-ternal admixture results and those from mtDNA andautosomal loci. As mentioned above, the higher Africancontribution to the Canarian mtDNA pool comparedto the contribution estimated from the autosomal locihas been explained by an asymmetry of female and maleaboriginal contribution to the current Canarian popu-lation (Pinto et al. 1996a; Flores et al. 2001a). During theSpanish conquest the European migration was consti-tuted mainly of soldiers, who displaced autochthonousmales by death or deportation, but mixed with abo-rigine females. A corollary of these results is that theaboriginal Y-chromosome contribution to the present-day Canarians has to be lower than those estimatedfrom autosomal and mtDNA polymorphisms. This isexactly what we found with our experimental data. Al-though with stronger directional mating, similar resultshave been obtained for Amerind populations, whichwere also profoundly influenced by Iberian conquerors(Carvajal-Carmona et al. 2000; Sans, 2000; Carvalho-Silva et al. 2001).
Regarding the portion of variance not explained bythe admixture model (Table 5), and so due to geneticdrift, the highest value, by one order of magnitude, wasobtained for La Gomera, the second smallest island. Pre-cisely, for mtDNA data La Gomera is the only islandsignificantly different to the others and characterized bythe highest frequency of the North African U6 cluster(Rando et al. 1998, 1999). In this regard, genetic driftcould be responsible for the contrasting difference inAfrican ancestry detected with maternal (51% of Africanlineages) and paternal markers (0.3–10% of African lin-eages). Alternatively, it could reflect the dramatic waythe island was conquered, producing the strongest sexualasymmetry in the archipelago (Suarez et al. 1988).
Aborigine Settlement Process
Three lineages deserve special attention due to their dis-tribution in the archipelago and in populations fromSouth western Europe and Africa: haplogroups J∗ (xJ2),
E3b1 and E3b2. Haplogroup J∗ (xJ2) has been suggestedto have originated in Middle East populations and spreadto Europe with the dispersion of farming during the Ne-olithic period (Semino et al. 2000; Rosser et al. 2000;Bosch et al. 2001; Nebel et al. 2001). Its arrival to North-west Africa could have occurred at the same time as inMediterranean Europe (Bosch et al. 2001) or more re-cently, during the Islamization of the area (Nebel et al.2002). Nevertheless, it reaches higher frequencies inNorth Africa than in the Iberian Peninsula (Bosch et al.2001), being especially high in Ethiopians (Semino et al.2002). Although a clear North African origin has beenassigned to haplogroup E3b1 (Bosch et al. 2001), it alsocharacterizes most of the European YAP+ haplogroups,as pointed out by Semino et al. (2002). Again, it reachesthe highest frequencies in Ethiopians (Underhill et al.2000; Semino et al. 2002). Strikingly, both haplogroupsare coincidentally distributed in the Canary Islands,reaching highest frequencies in western islands and de-creasing eastwards (Fig. 1). Furthermore, they appearedin higher frequencies in the archipelago than in the Eu-ropean populations considered. On the other hand, forhaplogroup E3b2 an unambiguous Northwest Africanorigin has also been suggested (Bosch et al. 2001). Ithas been detected in Iberian populations (Bosch et al.2001; Flores, 2002), but never in frequencies so high asthose reported for Northwest Africa. Moreover, its fre-quency in Canarians as a whole is nearly double thosefor the European populations considered, being partic-ularly abundant in eastern islands (Fig. 1). At this point,there are at least three different explanations for the ap-pearance of these three haplogroups in Canary Islandsin such relatively high frequencies with respect to conti-nental populations. First, they arrived in the archipelagowith Iberian colonizers, as they are also influenced byAfricans (Flores et al. 2000, 2001c; Bosch et al. 2001),and then augmented in frequency by genetic drift. Sec-ond, some could have come with Iberian populationsand some directly from Northwest African influence.And third, they are an exclusive contribution fromaboriginal inhabitants. Genetic drift could hardlyexplain a simultaneous increase of frequency for thethree haplogroups, considering that they are preciselythe three major haplogroups within North Africa (Un-derhill et al. 2000; Bosch et al. 2001). Furthermore,STR diversity within haplogroups by area (Table 6)
146 Annals of Human Genetics (2003) 67,138–152 C© University College London 2003

Y-Chromosome Variation in Canary Islands
Table 6 STR diversity within hap-logroups by area and mY haplotype con-tributions to the Canary Islands
Haplogroup
Population E3b1 E3b2 J∗ (xJ2)
Northwest Africa 1.83 ± 1.31 0.66 ± 0.51 1.12 ± 0.78Europe 0.93 ± 0.68 0.54 ± 0.46 0.58 ± 0.50Canary Islands 1.33 ± 0.86 0.75 ± 0.56 1.37 ± 0.87C/NWAa 0.168 ± 0.131 0.551 ± 0.677 0.334 ± 0.127C/Eb 0.832 ± 0.131 0.449 ± 0.677 0.666 ± 0.127
aContributions from Northwest Africa.bContributions from Europe.
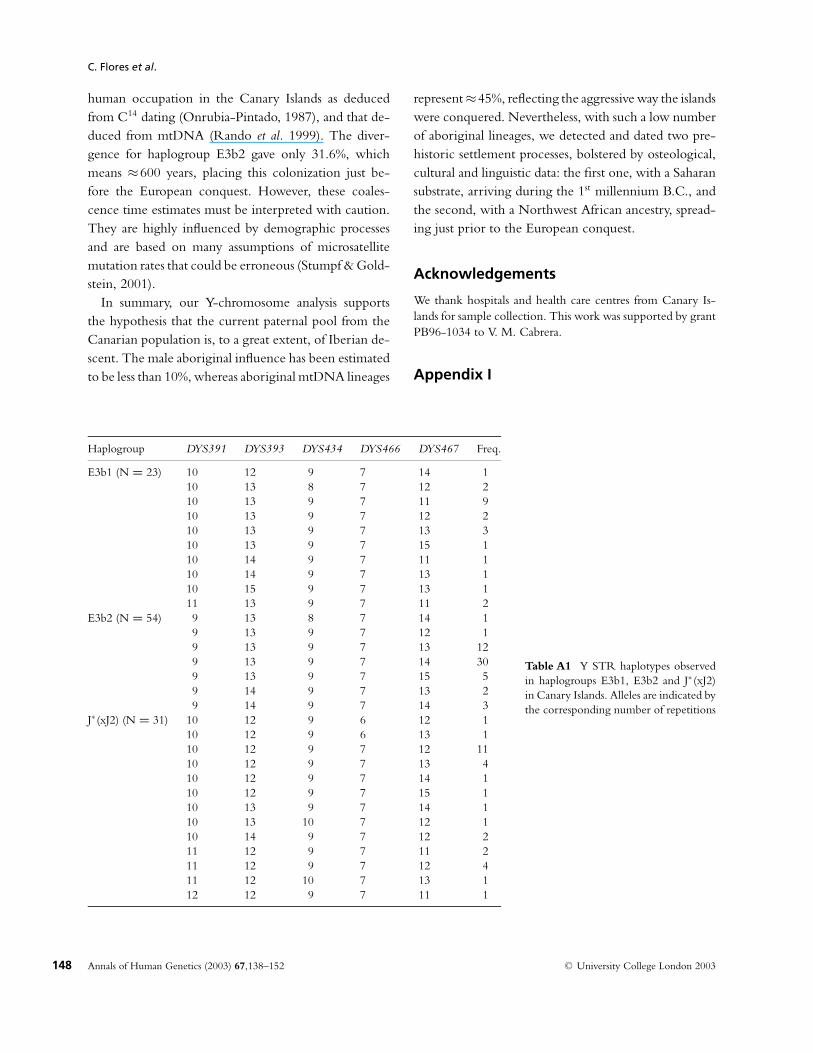
argues against drift being the only factor responsible forthat increase. Note that Canarian diversities, calculatedfrom STR haplotypes (Appendix I), are always higherthan those of Iberians and, in two instances, even thanthose of Northwest Africans. However, we must notethat the particular comparison with Northwest Africansamples could be biased by the comparatively low num-ber of samples used. We then applied mY estimator, us-ing STR haplotypes and their molecular differences, toclarify the percentage of influence by which an area hascontributed to Canarians for these haplogroups. Theresults (Table 6) supported a compound origin of thesethree haplogroups in the Canary Islands, making thesecond scenario more likely. Although J∗ (xJ2) is notconsidered a genuine African marker, it seems that itspresence in the Canary Islands has an important Africancause. Even though it simplified the picture, we haveconsidered haplogroups J∗ (xJ2) and E3b1 as indicatorsof a movement of people coming from Southern partsof North Africa (“Saharan marker”), and haplogroupE3b2 as their Northwest African counterpart (“North-west African marker”). In fact, the Saharan markershowed a trend of increasing frequencies westwards(rs = 0.714, P = 0.072, two-tailed test), and the con-trary is observed for the Northwest African marker(rs = −0.857, P = 0.014, two-tailed test). Similar cli-nal patterns have been found for unlinked loci, suchas mtDNA (Rando et al. 1999) and CD4/Alu haplo-types (Flores et al. 2001b), pointing to demographicevents as a major cause, as selection would affect sin-gle genes. Even though the aboriginal population thatoccupied the archipelago was probably not a homoge-neous group, the discrepant distribution of these hap-logroups in relation to their distribution in Africa couldbe compatible with the hypothesis of more than oneprehistoric settlement, particularly in the eastern islands
(Onrubia-Pintado, 1987). Congruent with this hypoth-esis, cultural (Onrubia-Pintado, 1987; Navarro, 1992;Martınez, 1996) and dialectal (Reyes-Garcıa, 2000) abo-rigine heterogeneities have been revealed within islands,supporting more than one arrival from Africa. Further-more, linguistic investigation supports the idea that ma-jor dialectal influence in aborigines, common to all theislands, could have come from southern Algeria, butwas also notably affected by Central Moroccan dialects(Reyes-Garcıa, pers. comm.). However, this possibilitycould not be confirmed in a previous mtDNA analysis(Rando et al. 1999), as the significant westward decreaseof diversity and number of mtDNA African lineageswas considered concordant to one dominant initial set-tlement from the African shore following a westwardstepping-stone process.
Dating the Aboriginal Colonisations
Assuming that more than one aborigine settlementdispersed part of these three haplogroups in thearchipelago, we tentatively tried to date those processes.Considering all the chromosomes from the Canary Is-lands, Europe and Northwest Africa, haplogroup J∗ (xJ2)would have originated ≈3760 (CI 1610–13147) yearsago, haplogroup E3b1 ≈6060 (CI 2598–22221) yearsago, and haplogroup E3b2 ≈1840 (CI 788–6433) yearsago. We then calculated divergence percentages of hap-logroups between the Canarian population and theirparental populations. The results showed again con-gruent values for haplogroup J∗ (xJ2) and E3b1, 52.7and 52.6% respectively, bolstering the hypothesis oftheir coincident dispersal in the Canarian archipelago.Translating into years, haplogroup J∗ (xJ2) gave an age of≈2000 years and haplogroup E3b1 ≈3200 years. Theseestimates match perfectly with the most ancient age of
C© University College London 2003 Annals of Human Genetics (2003) 67,138–152 147
C. Flores et al.
human occupation in the Canary Islands as deducedfrom C14 dating (Onrubia-Pintado, 1987), and that de-duced from mtDNA (Rando et al. 1999). The diver-gence for haplogroup E3b2 gave only 31.6%, whichmeans ≈600 years, placing this colonization just be-fore the European conquest. However, these coales-cence time estimates must be interpreted with caution.They are highly influenced by demographic processesand are based on many assumptions of microsatellitemutation rates that could be erroneous (Stumpf & Gold-stein, 2001).
In summary, our Y-chromosome analysis supportsthe hypothesis that the current paternal pool from theCanarian population is, to a great extent, of Iberian de-scent. The male aboriginal influence has been estimatedto be less than 10%, whereas aboriginal mtDNA lineages
Table A1 Y STR haplotypes observedin haplogroups E3b1, E3b2 and J∗ (xJ2)in Canary Islands. Alleles are indicated bythe corresponding number of repetitions
Haplogroup DYS391 DYS393 DYS434 DYS466 DYS467 Freq.
E3b1 (N = 23) 10 12 9 7 14 110 13 8 7 12 210 13 9 7 11 910 13 9 7 12 210 13 9 7 13 310 13 9 7 15 110 14 9 7 11 110 14 9 7 13 110 15 9 7 13 111 13 9 7 11 2
E3b2 (N = 54) 9 13 8 7 14 19 13 9 7 12 19 13 9 7 13 129 13 9 7 14 309 13 9 7 15 59 14 9 7 13 29 14 9 7 14 3
J∗ (xJ2) (N = 31) 10 12 9 6 12 110 12 9 6 13 110 12 9 7 12 1110 12 9 7 13 410 12 9 7 14 110 12 9 7 15 110 13 9 7 14 110 13 10 7 12 110 14 9 7 12 211 12 9 7 11 211 12 9 7 12 411 12 10 7 13 112 12 9 7 11 1
represent≈45%, reflecting the aggressive way the islandswere conquered. Nevertheless, with such a low numberof aboriginal lineages, we detected and dated two pre-historic settlement processes, bolstered by osteological,cultural and linguistic data: the first one, with a Saharansubstrate, arriving during the 1st millennium B.C., andthe second, with a Northwest African ancestry, spread-ing just prior to the European conquest.
Acknowledgements
We thank hospitals and health care centres from Canary Is-lands for sample collection. This work was supported by grantPB96-1034 to V. M. Cabrera.
Appendix I
148 Annals of Human Genetics (2003) 67,138–152 C© University College London 2003

Y-Chromosome Variation in Canary Islands
References
Afonso, J. M., Hernandez, M., Larruga, J. M., Cabrera, V. M.& Gonzalez, A. M. (1989) Human enzyme polymorphismon the Canary Islands. III. Tenerife Island population. HumBiol 61, 542–549.
Arco, M. C. & Navarro, J. F. (1987) Historia popular de Canarias.Vol. 1. Los aborıgenes. Tenerife, Centro de la Cultura PopularCanaria.
Arnay, M. & Gonzalez-Reimers, E. (1985–1987) La ceramicadecorada prehispanica de Tenerife. Tabona 6, 241–277.
Ayub, Q., Mohyuddin, A., Qamar, R., Mazhar, K., Zerjal,T., Mehdi, S. Q. & Tyler-Smith, C. (2000) Identificationand characterisation of novel human Y-chromosomal mi-crosatellites from sequence database information. NucleicAcids Res 28, e8.
Bermudez de Castro, J. M. (1987) Quantitative analysis of themolar-size sequence in human prehistoric populations ofthe Canary Isles. Am J Phys Anthropol 47, 81–86.
Bertorelle, G. & Excoffier, L. (1998) Inferring admixture pro-portions from molecular data. Mol Biol Evol 15, 1298–1311.
Bertranpetit, J. & Calafell, F. (1996) Genetic and geographicvariability in cystic fibrosis: evolutionary considerations. In:Variation in the human genome (eds. D. Chadwick & G.Cardew), pp. 97–118. Chichester, John Wiley and Sons.
Billy, G. (1982) Le peuplement prehistorique de l’ArchipelCanarien. El Museo Canario 41, 59–74.
Bosch, E., Calafell, F., Comas, D., Oefner, P. J., Underhill, P.A. & Bertranpetit, J. (2001) High-resolution analysis of hu-man Y-chromosome variation shows a sharp discontinuityand limited gene flow between Northwestern Africa andthe Iberian Peninsula. Am J Hum Genet 68, 1019–1029.
Bravo, A. M. & de las Casas, M. T. (1958) Distribucion degrupos sanguıneos en los habitantes de la isla de La Palma.Acta Medica de Tenerife 10, 114–117.
Carvajal-Carmona, L. G., Soto, I. D., Pineda, N., Ortiz-Barrientos, D., Duque, C., Ospina-Duque, J., McCarthy,M., Montoya, P., Alvarez, V. M., Bedoya, G. & Ruiz-Linares, A. (2000) Strong Amerind/white sex bias and apossible Sephardic contribution among the founders of apopulation in Northwestern Colombia. Am J Hum Genet67, 1287–1295.
Carvalho-Silva, D. R., Santos, F. R., Rocha, J. & Pena, S. D.J. (2001) The phylogeography of Brazilian Y-chromosomelineages. Am J Hum Genet 68, 281–286.
Casanova, M., Leroy, P., Boucekkine, C., Weissenbach, J.,Bishop, C., Fellous, M., Purrello, M., Fiori, G. & Sinis-calco, M. A. (1985) Human Y-linked DNA polymorphismand its potential for estimating genetic and evolutionarydistance. Science 230, 1403–1406.
de Abreu-Galindo, F. J. (1977) Historia de la conquista de las sieteIslas de Canarias. Tenerife, Goya.
Esteban, E., Dugoujon, J. M., Valveny, N., Gonzalez-Reimers, E. & Moral, P. (1998) Spanish and African con-tribution to the genetic pool of the Canary islanders:data from GM and KM haplotypes and RFLPs in theimmunoglobulin IGHG loci. Ann Hum Genet 62, 33–45.
Felsenstein, J. (1993) Phylogeny inference package (PHYLIP), ver-sion 3.5. Seattle, University of Washington.
Flores, C. (2002) Composicion genetica y posible origen paterno delas poblaciones humanas canarias, deducidos de su polimorfismoen el cromosoma Y . Ph.D. diss. Tenerife, Universidad de LaLaguna.
Flores, C., Hernandez, M., Gonzalez, A. M. & Cabrera, V.M. (2000) Genetic affinities among human populations in-habiting the sub-Saharan area, Northwest Africa and theIberian Peninsula. In: Prehistoric Iberia: Genetics, Anthropol-ogy and Linguistics (ed. A. Arnaiz-Villena), pp. 33–50. NewYork: Kluwer Academic/Plenum Press.
Flores, C., Larruga, J. M., Gonzalez, A. M., Hernandez, M.,Pinto, F. M. & Cabrera, V. M. (2001a) The origin of the Ca-nary Island aborigines and their contribution to the modernpopulation: a molecular genetics perspective. Curr Anthro-pol 42, 749–755.
Flores, C., Maca-Meyer, N., Perez, J. A. & Cabrera, V. M.(2001b) The peopling of the Canary Islands: a CD4/Alumicrosatellite haplotype perspective. Hum Immunol 62,949–953.
Flores, C., Maca-Meyer, N., Perez, J. A., Hernandez, M. &Cabrera, V. M. (2001c) Y-Chromosome differentiation inNorthwest Africa. Hum Biol 73, 513–524.
Forster, P., Rohl, A., Lunnemann, P., Brinkmann, C., Zer-jal, T., Tyler-Smith, C. & Brinkmann, B. A. (2000) Shorttandem repeat-based phylogeny for the human Y chromo-some. Am J Hum Genet 67, 182–196.
Fuste, A. M. (1958) Algunas observaciones acerca de la antropologıade las poblaciones prehistoricas y actual de Gran Canaria. LasPalmas, Publicaciones del Museo Canario.
Gonzalez, R. & Tejera, A. (1990) Los aborigenes canarios. GranCanaria y Tenerife. Oviedo, Ediciones Istmo.
Guasch, J., Florensa, G., Diaz de Yraola, G., Gavilanes, C.,Rio, R., Tabuenca, J. & Raichs, A. (1952) Los factoreshematicos en Espana, excepto en el Paıs Vasco. MedicinaClınica 18, 268–271.
Hammer, M. F. & Horai, S. (1995) Y chromosomal DNAvariation and the peopling of Japan. Am J Hum Genet 56,951–962.
Hammer, M. F., Spurdle, A. B., Karafet, T., Bonner, M. R.,Wood, E. T., Novelletto, A., Malaspina, P., Mitchell, R. J.,Horai, S., Jenkins, T. & Zegura, S. L. (1997) The geographicdistribution of human Y chromosome variation. Genetics145, 787–805.
Heyer, E., Puymirat, J., Dieltjes, P., Bakker, E. & de Knijff,P. (1997) Estimating Y chromosome specific microsatellite
C© University College London 2003 Annals of Human Genetics (2003) 67,138–152 149

C. Flores et al.
mutation frequencies using deep rooting pedigrees. HumMol Genet 6, 799–803.
Hooton, E. A. (1925) The ancient inhabitants of the CanaryIslands. Harvard African Studies, 7.
Hurles, M. E., Irven, C., Nicholson, J., Taylor, P. G., Santos,F. R., Loughlin, J., Jobling, M. A. & Sykes, B. C. (1998)European Y-chromosomal lineages in Polynesians: A con-trast to the population structure revealed by mtDNA. AmJ Hum Genet 63, 1793–1806.
Hurles, M. E., Veitia, R., Arroyo, E., Armenteros, M.,Bertranpetit, J., Perez-Lezaun, A., Bosch, E., Shlumukova,M., Chambon-Thomsen, A., McElreavey, K., Lopez deMunain, A., Rohl, A., Wilson, I. J., Singh, L., Pandya,A., Santos, F. R., Tyler-Smith, C. & Jobling, M. A. (1999)Recent male-mediated gene flow over a linguistic barrierin Iberia, suggested by analysis of a Y-chromosomal DNApolymorphism. Am J Hum Genet 65, 1437–1448.
Jorde, L. B., Watkins, W. S., Bamshad, M. J., Dixon, M. E.,Ricker, C. E., Seielstad, M. T. & Batzer, M. A. (2000) Thedistribution of human genetic diversity: a comparison ofmitochondrial, autosomal, and Y-chromosome data. Am JHum Genet 66, 979–988.
Kayser, M., Krawczak, M., Excoffier, L., Dieltjes, P., Corach,D., Pascali, V., Gehrig, C., Bernini, L. F., Jespersen, J.,Bakker, E., Roewer, L. & de Knijff, P. (2001) An exten-sive analysis of Y-chromosomal microsatellite haplotypes inglobally dispersed human populations. Am J Hum Genet 68,990–1018.
Kruskal, J. B. & Wish, M. (1978) Multidimensional scaling. Bev-erly Hills, CA, Sage Publications.
Kwok, C., Tyler-Smith, C., Mendonca, B. B., Hughes, I.,Berkovitz, G. D., Goodfellow, P. N. & Hawkins, J. R. (1996)Mutation analysis of the 2 kb 5′ to SRY in XY females andXY intersex subjects. J Med Genet 33, 465–468.
Lobo-Cabrera, M. (1993) La esclavitud en Fuerteventura enlos Siglos XVI y XVII. V Jornadas de estudios sobre Fuerteven-tura y Lanzarote I, 13–40.
Long, J. C. (1991) The genetic structure of admixed popula-tions. Genetics 127, 417–428.
Mantel, N. (1967) The detection of disease clustering and ageneralized regression approach. Cancer Res 27, 209–220.
Martell, M., Padron, G., Hernandez, M., Afonso, J. M. &Cabrera, V. M. (1986) Human enzyme polymorphism onthe Canary Islands I. Gran Canaria Island population. HumHered 36, 41–44.
Martınez, V. M. F. (1996) Arqueologıa prehistorica de Africa.Madrid, Editorial Sıntesis.
Minch, E. (1997) Microsat 1.5d. Stanford, Department of Ge-netics, University of Stanford.
Moral, P., Esteban, E., Vives, S., Valveny, N., Toja, D. I. &Gonzalez, D. (1997) Genetic study of the population ofTenerife (Canary Islands, Spain): protein markers and re-
view of classical polymorphisms. Am J Phys Anthopol 102,337–349.
Morilla, J. M., Afonso, J. M., Hernandez, M., Pestano, J. M.& Larruga, J. M. (1988) Human enzyme polymorphismon the Canary Islands II. African influence. Hum Hered 38,101–105.
Navarro, J. F. (1991) El poblamiento prehistorico. In: Historiade Canarias (ed. F. Morales Padron), pp. 41–60. Madrid,Editorial Prensa Iberica.
Navarro, J. F. (1992) La prehistoria de Canarias. Vol. 5. LaGomera y Los Gomeros. Tenerife, Centro de la Cultura Pop-ular Canaria.
Navarro, J. F. (1997) Arqueologıa de las Islas Canarias. Espacio,Tiempo y Forma: Prehistoria y Arqueologıa 10, 201–232.
Nebel, A., Filon, D., Brinkmann, B., Majumder, P. P., Faer-man, M. & Oppenheim, A. (2001) The Y chromosomepool of Jews as a part of the Genetic Landscape of the Mid-dle East. Am J Hum Genet 69, 1095–1112.
Nebel, A., Landau-Tasseron, E., Filon, D., Oppenheim, A. &Faerman, M. (2002) Genetic evidence for the expansion ofArabian tribes into the Southern Levant and North Africa.Am J Hum Genet 70, 1594–1596.
Onrubia-Pintado, J. (1987) Les cultures prehistoriques des IlesCanaries etat de la question. L’Anthropologie 91, 653–678.
Parejo, M. (1966) El sistema AB0 en la poblacion actual de lasIslas Canarias. Actas del V Congreso Panafricano de prehistoriay estudios del Cuaternario II, 213–217.
Perez, M. J., Hierro, J. M., Marrero, M. J., Gonzalez, A. M.& Cabrera, V. M. (1991) Human enzyme polymorphismon the Canary Islands. IV. Eastern Islands. Hum Hered 41,385–390.
Pinto, F., Cabrera, V., Gonzalez, A. M., Larruga, J. M., Noya,A. & Hernandez, M. (1994) Human enzyme polymor-phism in the Canary Islands. VI. Northwest African influ-ence. Hum Hered 44, 156–161.
Pinto, F., Gonzalez, A. M., Hernandez, M., Larruga, J. M. &Cabrera, V. M. (1996a) Genetic relationship between theCanary Islanders and their African and Spanish ancestorsinferred from mitochondrial DNA sequences. Ann HumGenet 60, 321–330.
Pinto, F., Rando, J. C., Lopez, M., Morilla, J. M. & Larruga,J. M. (1996b) Blood group polymorphisms in the CanaryIslands. Gene Geography 10, 171–179.
Rando, J. C., Cabrera, V. M., Larruga, J. M., Hernandez, M.,Gonzalez, A. M., Pinto, F. & Bandelt, H. J. (1999) Phylo-geographic patterns of mtDNA reflecting the colonizationof the Canary Islands. Ann Hum Genet 63, 413–428.
Rando, J. C., Pinto, F., Gonzalez, A. M., Hernandez, M.,Larruga, J. M., Cabrera, V. M. & Bandelt, H. J. (1998) Mi-tochondrial DNA analysis of northwest African populationsreveals genetic exchanges with European, near-eastern, andsub-Saharan populations. Ann Hum Genet 62, 531–550.
150 Annals of Human Genetics (2003) 67,138–152 C© University College London 2003

Y-Chromosome Variation in Canary Islands
Raymond, M. & Rousset, F. (1995) An exact test of popula-tion differentiation. Evolution 49, 1280–1283.
Reyes-Garcıa, I. (2000) Consideraciones metodologicas en tornoal estudio de la antigua lengua de Canarias. Las Palmas, Ca-bildo de Gran Canaria, Acta del XIII coloquio de HistoriaCanario Americana.
Roberts, D. F., Evans, M., Ikin, E. W. & Mourant, A. E. (1966)Blood groups and the affinities of the Canary Islanders. Man1, 512.
Rosing, I. S. (1967) AB0-blutgruppen und Rh-Faktoren aufTeneriffa unter besonderer Berucksichtigung des Vergleichszwischen vorspanischer und heutiger Bevolkerung. Homo18, 96–104.
Rosser, Z. H., Zerjal, T., Hurles, M. E., Adojaan, M., Alavan-tic, D., Amorim, A., Amos, W., Armenteros, M., Arroyo,E., Barbujani, G., Beckman, G., Beckman, L., Bertranpetit,J., Bosch, E., Bradley, D. G., Brede, G., Cooper, G., Corte-Real, H. B. S. M., Knijff, P., Decorte, R., Dubrova, Y. E.,Evgrafov, O., Gilissen, A., Glisic, S., Golge, M., Hill, E.W., Jeziorowska, A., Kalaydjieva, L., Kayser, M., Kivisild,T., Kravchenco, S. A., Krumina, A., Kucinskas, V., Lavinha,J., Livshits, L. A., Malaspina, P., Maria, S., McElreavey, K.,Meitinger, T. A., Mikelsaar, A.-V., Mitchell, R. J., Nafa,K., Nicholson, J., Nørby, S., Pandya, A., Parik, J., Pat-salis, P. C., Pereira, L., Peterlin, B., Pielberg, G., Prata, M.J., Previdere, C., Roewer, L., Rootsi, S., Rubinsztein, D.C., Saillard, J., Santos, F. R., Stefanescu, G., Sykes, B. C.,Tolun, A., Villems, R., Tyler-Smith, C. & Jobling, M. A.(2000) Y-chromosomal diversity in Europe is clinal and in-fluenced primarily by geography, rather than by language.Am J Hum Genet 67, 1526–1543.
Rudbeck, L. & Dissing, J. (1998) Rapid, simple alkaline ex-traction of human genomic DNA from whole blood, buccalepithelial cells, semen and forensic stains for PCR. BioTech-niques 25, 588–590.
Sans, M. (2000) Admixture studies in Latin America: Fromthe 20th to the 21st Century. Hum Biol 72, 155–177.
Schneider, S., Roessli, D. & Excoffier, L. (2000) Arlequin ver.2000: A software for population genetics data analysis. Switzer-land, Genetics and Biometry Laboratory, University ofGeneva.
Schwarzfischer, F. & Liebrich, K. (1963) Serologische unter-suchungen an prahistorische bevolkerungen insbesonderean altkanarischen Mumien. Homo 14, 129–133.
Schwidetzky, I. (1963) La poblacion prehispanica de las Islas Ca-narias. Tenerife, Publicaciones del Museo Arqueologico deTenerife.
Schwidetzky, I. (1975) Investigaciones antropologicas en las IslasCanarias: estudio comparativo entre la poblacion actual y la pre-hispanica. Tenerife, Publicaciones del Museo Arqueologicode Tenerife.
Seielstad, M. T., Hebert, J. M., Lin, A. A., Underhill, P. A.,Ibrahim, M., Vollrath, D. & Cavalli-Sforza, L. L. (1994)
Construction of human Y-chromosomal haplotypes usinga new polymorphic A to G transition. Hum Mol Genet 3,2159–2161.
Semino, O., Passarino, G., Oefner, P. J., Lin, A. A., Arbuzova,S., Beckman, L. E., De Benedictis, G., Francalacci, P., Kou-vatsi, A., Limborska, S., Marcikiae, M., Mika, A., Mika,B., Primorac, D., Santachiara-Benerecetti, A. S., Cavalli-Sforza, L. L. & Underhill, P. A. (2000) The genetic legacyof Paleolithic Homo sapiens sapiens in extant Europeans: aY chromosome perspective. Science 290, 1155–1159.
Semino, O., Santachiara-Benerecetti, A. S., Falaschi, F.,Cavalli-Sforza, L. L. & Underhill, P. A. (2002) Ethiopi-ans and Khoisan share the deepest clades of the humanY-chromosome phylogeny. Am J Hum Genet 70, 265–268.
Shen, P., Wang, F., Underhill, P., Franco, C., Yang, W.-H.,Roxas, A., Sung, R., Lin, A. A., Hyman, R. W., Vollrath,D., Davis, R. W., Cavalli-Sforza, L. L. & Oefner, P. (2000)Population genetic implications from sequence variation infour Y chromosome genes. Proc Natl Acad Sci USA 97,7354–7359.
Stumpf, M. P. H. & Goldstein, D. B. (2001) Genealogical andevolutionary inference with the human Y chromosome.Science 291, 1738–1742.
Suarez, J. J., Rodrıguez, F. & Quintero, C. L. (1988) Historiapopular de Canarias. Vol. 2. Conquista y colonizacion. Tenerife,Centro de la Cultura Popular Canaria.
Sun, C., Skaletsky, H., Rozen, S., Gromoll, J., Nieschlag, E.,Oates, R. & Page, D. C. (2000) Deletion of azoospermiafactor a (AZFa) region of human Y chromosome causedby recombination between HERV15 proviruses. Hum MolGenet 9, 2291–2296.
Thomas, M. G., Skorecki, K., Ben-Ami, H., Parfitt, T., Brad-man, N. & Goldstein, D. B. (1998) Origins of Old Testa-ment priests. Nature 394, 138–140.
Underhill, P. A., Jin, L., Lin, A. A., Mehdi, S. Q., Jenkins, T.,Vollrath, D., Davis, R. W., Cavalli-Sforza, L. L. & Oefner,P. J. (1997) Detection of numerous Y chromosome bial-lelic polymorphisms by denaturing high-performance liq-uid chromatography. Genome Res 7, 996–1005.
Underhill, P. A., Shen, P., Lin, A. A., Jin, L., Passarino, G.,Yang, W. H., Kauffman, E., Bonne-Tamir, B., Bertran-petit, J., Francalacci, P., Ibrahim, M., Jenkins, T., Kidd, J.R., Mehdi, S. Q., Seielstad, M. T., Wells, R. S., Piazza,A., Davis, R. W., Feldman, M. W., Cavalli-Sforza, L. L.& Oefner, P. J. (2000) Y chromosome sequence variationand the history of human populations. Nat Genet 26, 358–361.
Veitia, R., Ion, A., Barbaux, S., Jobling, M. A., Souleyreau,N., Ennis, K., Ostrer, H., Tosi, M., Meo, T., Chibani, J.,Fellous, M. & McElreavey, K. (1997) Mutations and se-quence variants in the testis-determining region of the Ychromosome in individuals with a 46,XY female pheno-type. Hum Genet 99, 648–652.
C© University College London 2003 Annals of Human Genetics (2003) 67,138–152 151

C. Flores et al.
Verneau, R. (1887) Rapport d’une mission scientifique dansl’Archipel Canarien. Archives des Missions Sc. et Litte (3er ser)XVIII, 567–817.
Whitfield, L. S., Sulston, J. E. & Goodfellow, P. N. (1995)Sequence variation of the human Y chromosome. Nature378, 379–380.
Wolfel, D. J. (1930) Sind die Ureinwohner der Kanaren aus-gestorben? Zeitschrift fur Ethnologie 62, 282–302.
Y Chromosome Consortium (2002) A nomenclature systemfor the tree of human Y-chromosomal binary haplogroups.Genome Res 12, 339–348.
Zerjal, T., Dashnyam, B., Pandya, A., Kayser, M., Roewer, L.,Santos, F. R., Schiefenhovel, W., Fretwell, N., Jobling, M.A., Harihara, S., Shimizu, K., Semjidmaa, D., Sajantila, A.,Salo, P., Crawford, M. H., Ginter, E. K., Evgrafov, O. V. &Tyler-Smith, C. (1997) Genetic relationships of Asians andNorthern Europeans, revealed by Y-chromosomal DNAanalysis. Am J Hum Genet 60, 1174–83.
Received: 29 July 2002Accepted: 29 October 2002
152 Annals of Human Genetics (2003) 67,138–152 C© University College London 2003
Related Documents