International Journal of Data Mining & Knowledge Management Process (IJDKP) Vol.5, No.1, January 2015 DOI : 10.5121/ijdkp.2015.5103 29 A PREDICTIVE SYSTEM FOR DETECTION OF BANKRUPTCY USING MACHINE LEARNING TECHNIQUES Kalyan Nagaraj and Amulyashree Sridhar PES Institute of Technology, India ABSTRACT Bankruptcy is a legal procedure that claims a person or organization as a debtor. It is essential to ascertain the risk of bankruptcy at initial stages to prevent financial losses. In this perspective, different soft computing techniques can be employed to ascertain bankruptcy. This study proposes a bankruptcy prediction system to categorize the companies based on extent of risk. The prediction system acts as a decision support tool for detection of bankruptcy KEYWORDS Bankruptcy, soft computing, decision support tool 1. INTRODUCTION Bankruptcy is a situation in which a firm is incapable to resolve its monetary obligations leading to legal threat. The financial assets of companies are sold out to clear the debt which results in huge financial losses to the investors. Bankruptcy results in decreased liquidity of capital and minimized financial improvement. It is reported by World Bank data that Indian government resolves the insolvency in an average of 4.3 years [1]. There is a need to design effective strategies for prediction of bankruptcy at an earlier stage to avoid financial crisis. Bankruptcy can be predicted using mathematical techniques, hypothetical models as well as soft computing techniques [2]. Mathematical techniques are primary methods used for estimation of bankruptcy based on financial ratios. These methods are based on single or multi variable models. Hypothetical models are developed to support the theoretical principles. These models are statistically very complex based on their assumptions. Hence soft computing techniques are extensively used for developing predictive models in finance. Some of the popular soft computing techniques include Bayesian networks, logistic regression, decision tress, support vector machines and neural networks. In this study, different machine learning techniques are employed to predict bankruptcy. Further based on the performance of the classifiers, the best model is chosen for development of a decision support system in R programming language. The support system can be utilized by stock holders and investors to predict the performance of a company based on the nature of risk associated.

A predictive system for detection of bankruptcy using machine learning techniques
Jul 16, 2015
Welcome message from author
This document is posted to help you gain knowledge. Please leave a comment to let me know what you think about it! Share it to your friends and learn new things together.
Transcript

International Journal of Data Mining & Knowledge Management Process (IJDKP) Vol.5, No.1, January 2015
DOI : 10.5121/ijdkp.2015.5103 29
A PREDICTIVE SYSTEM FOR DETECTION OF
BANKRUPTCY USING MACHINE LEARNING
TECHNIQUES
Kalyan Nagaraj and Amulyashree Sridhar
PES Institute of Technology, India
ABSTRACT
Bankruptcy is a legal procedure that claims a person or organization as a debtor. It is essential to
ascertain the risk of bankruptcy at initial stages to prevent financial losses. In this perspective, different
soft computing techniques can be employed to ascertain bankruptcy. This study proposes a bankruptcy
prediction system to categorize the companies based on extent of risk. The prediction system acts as a
decision support tool for detection of bankruptcy
KEYWORDS
Bankruptcy, soft computing, decision support tool
1. INTRODUCTION
Bankruptcy is a situation in which a firm is incapable to resolve its monetary obligations leading
to legal threat. The financial assets of companies are sold out to clear the debt which results in
huge financial losses to the investors. Bankruptcy results in decreased liquidity of capital and
minimized financial improvement. It is reported by World Bank data that Indian government
resolves the insolvency in an average of 4.3 years [1]. There is a need to design effective
strategies for prediction of bankruptcy at an earlier stage to avoid financial crisis. Bankruptcy can
be predicted using mathematical techniques, hypothetical models as well as soft computing
techniques [2]. Mathematical techniques are primary methods used for estimation of bankruptcy
based on financial ratios. These methods are based on single or multi variable models.
Hypothetical models are developed to support the theoretical principles. These models are
statistically very complex based on their assumptions. Hence soft computing techniques are
extensively used for developing predictive models in finance. Some of the popular soft computing
techniques include Bayesian networks, logistic regression, decision tress, support vector machines
and neural networks.
In this study, different machine learning techniques are employed to predict bankruptcy. Further
based on the performance of the classifiers, the best model is chosen for development of a
decision support system in R programming language. The support system can be utilized by stock
holders and investors to predict the performance of a company based on the nature of risk
associated.

International Journal of Data Mining & Knowledge Management Process (IJDKP) Vol.5, No.1, January 2015
30
2. BACKGROUND
Several studies have been conducted in the recent past reflecting the importance of machine
learning techniques in predictive modelling. The studies and the technologies implemented are
briefly discussed below.
2.1. MACHINE LEARNING
Machine learning techniques are employed to explore the hidden patterns in data by developing
models. It is broadly referred as knowledge discovery in database (KDD). Different learning
algorithms are implemented to extract patterns from data. These algorithms can either be
supervised or unsupervised. Supervised learning is applied when the output of a function is
previously known. Unsupervised learning is applied when the target function is unknown. The
general layout for machine learning process is described below:
Data collection: The data related to domain of concern is extracted from public platforms and
data warehouses. The data will be raw and unstructured format. Hence pre-processing measures
must be adopted
Data pre-processing: The initial dataset is subjected for pre-processing. Pre-processing is
performed to remove the outliers and redundant data. The missing values are replaced by
normalization and transformation
Development of models: The pre-processed data is subjected to different machine learning
algorithms for development of models. The models are constructed based on classification,
clustering, pattern recognition and association rules
Knowledge Extraction: The models are evaluated to represent the knowledge captured. This
knowledge attained can be used for better decision making process [3].
2.2. CLASSIFICATION ALGORITHMS
Several classification algorithms are implemented in recent past for financial applications. They
are discussed briefly below:
Logistic Regression: It is a classifier that predicts the outcome based probabilities of logistic
function. It estimates the relationship between different independent variables and the dependent
outcome variable based on probabilistic value. It may be either binary or multinomial classifier.
The logistic function is denoted as:
F(x) = 1
1+e-(β0+β1x)
β0 and β1are coefficients for input variable x. The value of F(x) ranges from zero to one. The
logistic regression model generated is also called as generalized linear model [4].
Naïve Bayes classifier: It is a probabilistic classifier based on the assumptions of Bayes theorem
[5]. It is based on independent dependency among all the features in the dataset. Each feature
contributes independently to the total probability in model. The classifier is used for supervised
learning. The Bayesian probabilistic model is defined as:
International Journal of Data Mining & Knowledge Management Process (IJDKP) Vol.5, No.1, January 2015
31
)(
)|()()|(
xp
CxpCpxCp
k
k
k=
p(Ck|x) = posterior probability
p(Ck)=prior probability
p(x)= probability of estimate
p(x|Ck)=likelihood of occurrence of x
Random Forest: They are classifier which construct decision trees for building the model and
outputs the mode value of individual trees as result of prediction. The algorithm was developed
by Breiman [6]. Classification is performed by selecting a new input vector from training set. The
vector is placed at the bottom of each of the trees in the forest. The proximity is computed for the
tree. If the tree branches are at the same level, then proximity is incremented by one. The
proximity evaluated is standardized as a function of the number of trees generated. Random forest
algorithms compute the important features in a dataset based on the out of bag error estimate. The
algorithm also reduces the rate of overfitting observed in decision tree models.
Neural networks: They are learning algorithms inspired from the neurons in human brain. The
network comprises of interconnected neurons as a function of input data [7]. Based on the
synapse received from input data, weights are generated to compute the output function. The
networks can either be feed-forward or feed-back in nature depending upon the directed path of
the output function. The error in input function is minimized by subjecting the network for back-
propagation which optimizes the error rate. The network may also be computed from several
layers of input called as multilayer perceptron. Neural networks have immense applications in
pattern recognition, speech recognition and financial modeling.
Support vector machine: They are supervised learning algorithms based on non-probabilistic
classification of dataset into categories in high dimensional space. The algorithm was proposed
by Vapnik [8]. The training dataset is assumed as a p-dimensional vector which is to be classified
using (p-1) dimensional hyperplane. The largest separation achieved between data points is
considered optimal. Hyperplane function is represented as:
).(),,( bxwsignbwxf +=><
w = normalized vector to the hyperplane
x = p-dimensional input vector
b = bias value
The marginal separator is defined as 2|k|/||w||. ‘k’ represents the number of support vectors
generated by the model. The data instances are classified based on the below criteria
If (w · x +b) = k, indicates all the positive instances.
If (w · x +b) = -k, indicates the set of negative instances.
If (w · x +b) = 0, indicates the set of neutral instances.
3. RELATED WORK
Detection of bankruptcy is a typical classification problem in machine learning application.
Development of mathematical and statistical models for bankruptcy prediction was initiated by
Beaver in the year 1960 [9]. The study focused on the univariate analysis of different financial
factors to detect bankruptcy. An important development in this arena was recognized by Altman
who developed a multivariate Z-score model of five variables [10]. Z-score model is considered
as a standard model for estimating the probability of default in bankruptcy. Logistic regression
was also instigated to evaluate bankruptcy [11]. These techniques are considered as standard

International Journal of Data Mining & Knowledge Management Process (IJDKP) Vol.5, No.1, January 2015
32
estimates for prediction of financial distress. But these models pose statistical restrictions leading
to their limitations. To overcome these limitations probit [12] and logit models [13] were
implemented for financial applications. In later years, neural networks were implemented for
estimating the distress in financial organizations [14, 15, and 16]. Neural networks are often
subjected to overfitting leading to false predictions. Decision trees were also applied for
predicting financial distress [17, 18]. Support vector machines have also been used employed in
predicting bankruptcy for financial companies [19, 20]. In recent years, several hybrid models
have been adopted to improve the performance of individual classifiers for detection of
bankruptcy [21, 22].
4. METHODOLOGY
4.1. Collection of Bankruptcy dataset
The qualitative bankruptcy dataset was retrieved from UCI Machine Learning Repository [23].
The dataset comprised of 250 instances based on 6 attributes. The output had two classes of
nominal type describing the instance as ‘Bankrupt’ (107 cases) or ‘Non-bankrupt’ (143 cases).
4.2. Feature Selection
It is important to remove the redundant attributes from the dataset. Hence correlation based
feature selection technique was employed. The feature based algorithm selects the significant
attributes based on the class value. If the attribute is having high correlation with the class
variable and minimal correlation with other attributes of the dataset it is presumed to be a good
attribute. If the attribute have high correlation with the attributes then they are discarded from the
study.
4.3. Implementing machine learning algorithms
The features selected after correlational analysis are subjected to data partitioning followed by
application of different machine learning algorithms. The dataset is split into training (2/3rd
of the
dataset) and test dataset (1/3rd
of the dataset) respectively. In the training phase different
classifiers are applied to build an optimal model. The model is validated using the test set in the
testing phase. Once the dataset is segregated, different learning algorithms was employed on the
training dataset. The algorithms include logistic regression, Bayesian classifier, random forest,
neural network and support vector machines. Models generated from each of the classifier were
assessed for their performance using the test dataset. A ten-fold cross validation strategy was
adopted to test the accuracy. In this procedure, the test dataset is partitioned into ten subsamples
and each subsample is used to test the performance of the model generated from training dataset.
This step is performed to minimize the probability of overfitting. The accuracy of each algorithm
was estimated from the cross validated outcomes.
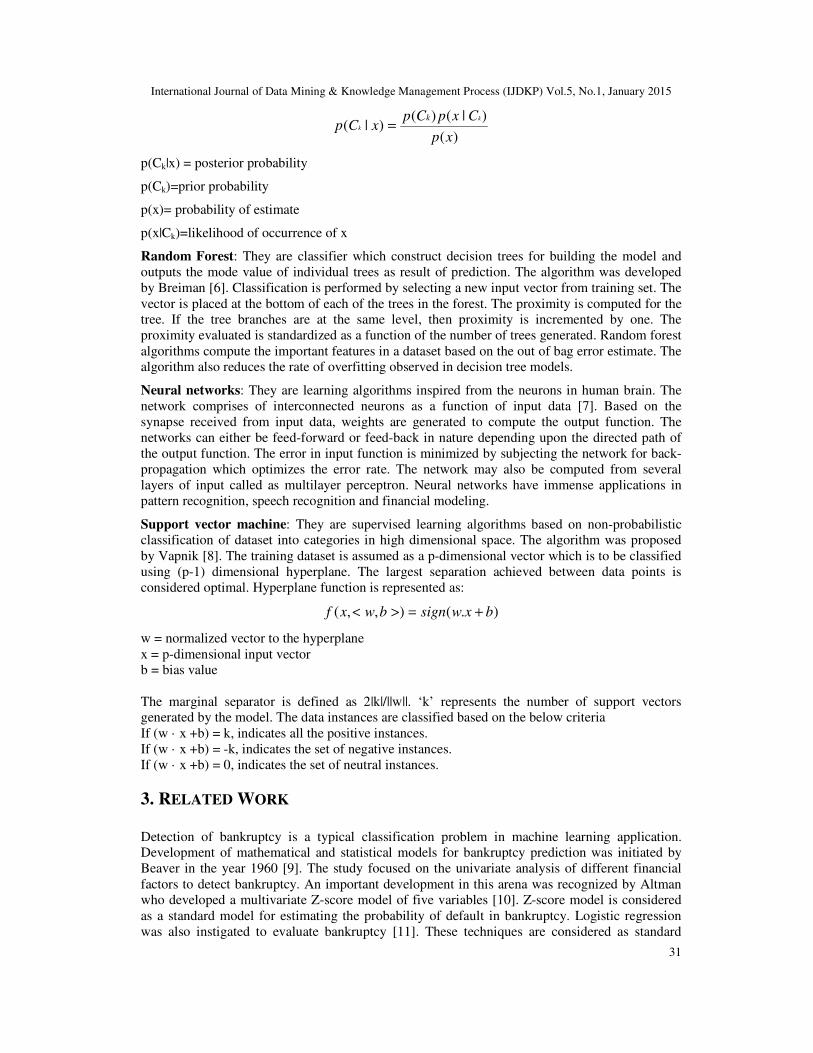
4.4. Developing a predictive decision support system
From the previous step, the classifier with highest prediction accuracy is selected for developing a
decision support system to predict the nature of bankruptcy. The prediction system was
implemented in RStudio interface, a statistical programming toolkit. Different libraries were
invoked for development of the predictive system including ‘gWidgets ’and ‘RGtk2’. The
predictive tool develops a model for evaluating the outcome bankruptcy class for user input data.
Predicted class is compared with the actual class value from the dataset to compute the percentage
of error prediction from the system. The support system estimates the probability of bankruptcy
International Journal of Data Mining & Knowledge Management Process (IJDKP) Vol.5, No.1, January 2015
33
among customers. It can be used as an initial screening tool to strengthen the default estimate of a
customer based on his practises.
The methodology of this study is illustrated in Figure 1.
Figure 1: The flowchart for developing a decision support system to predict bankruptcy
5. RESULTS AND DISCUSSION
5.1. Description of Qualitative Bankruptcy dataset
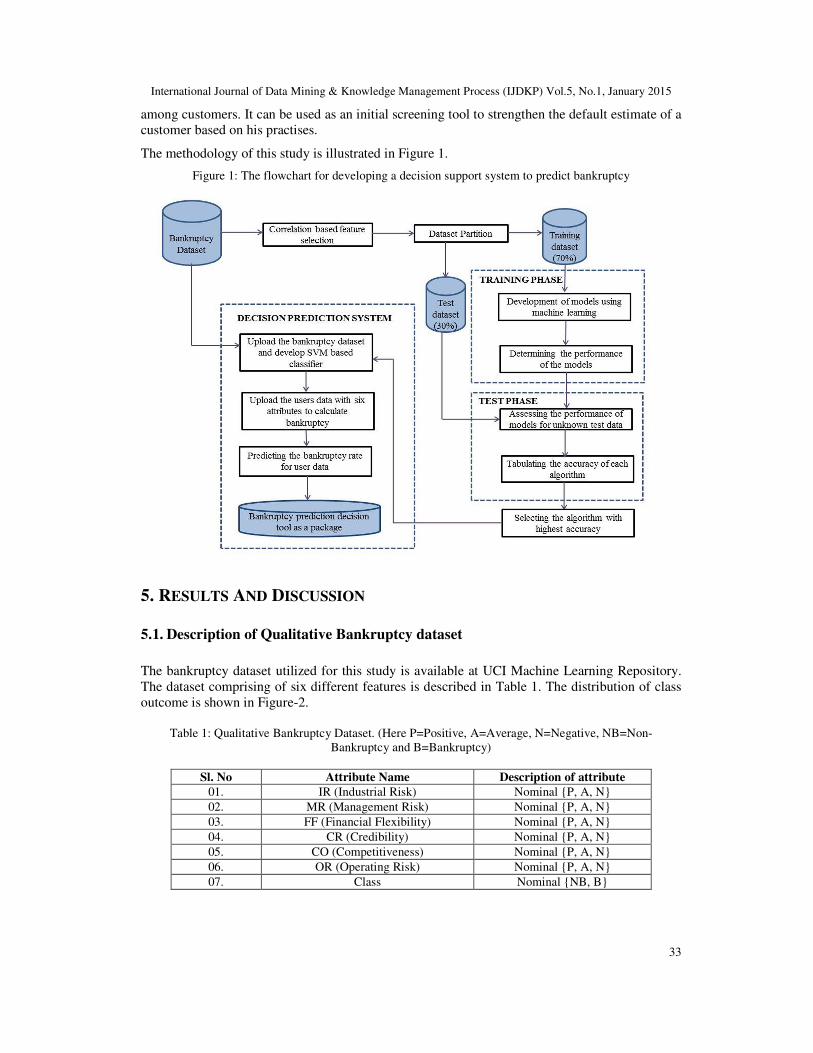
The bankruptcy dataset utilized for this study is available at UCI Machine Learning Repository.
The dataset comprising of six different features is described in Table 1. The distribution of class
outcome is shown in Figure-2.
Table 1: Qualitative Bankruptcy Dataset. (Here P=Positive, A=Average, N=Negative, NB=Non-
Bankruptcy and B=Bankruptcy)
Sl. No Attribute Name Description of attribute
01. IR (Industrial Risk) Nominal {P, A, N}
02. MR (Management Risk) Nominal {P, A, N}
03. FF (Financial Flexibility) Nominal {P, A, N}
04. CR (Credibility) Nominal {P, A, N}
05. CO (Competitiveness) Nominal {P, A, N}
06. OR (Operating Risk) Nominal {P, A, N}
07. Class Nominal {NB, B}

International Journal of Data Mining & Knowledge Management Process (IJDKP) Vol.5, No.1, January 2015
34
Figure 2: The distribution of class output representing Non Bankruptcy and Bankruptcy
5.2. Correlation based Attribute selection
The bankruptcy dataset was subjected for feature selection to extract the relevant attributes. The
nominal values in bankruptcy dataset were converted to numeric values for performing feature
selection. The values of each of the descriptors were scaled as P=1, A=0.5 and N=0 representing
the range for positive, average and negative values. The procedure was repeated for all the six
attributes in dataset. Pearson correlation filter was applied for the numerical dataset to remove the
redundant features with a threshold value of 0.7. The analysis revealed that all the six attributes
were highly correlated with the outcome variable. In order to confirm the results from correlation,
another feature selection method was applied for the dataset. Information gain ranking filter
method was applied to test the importance of features. The algorithm discovered similar results as
that of correlation. Hence all the six attributes from the dataset were considered for the study. The
correlational plot for the features is shown in Figure 3.
Figure 3: The correlational plot illustrating the importance of each feature
5.3. Machine learning algorithms
The features extracted from previous step were subjected for different machine learning
algorithms in R. The algorithms were initially applied for the training set to develop predictive
models. These models were further evaluated using the test set. Performance of each model was
adjudged using different statistical parameters like confusion matrix and receiver operating
characteristics (ROC) curve. Confusion matrix is a contingency table that represents the
performance of machine learning algorithms [24]. It represents the relationship between actual
class outcome and predicted class outcome based on the following four estimates:

International Journal of Data Mining & Knowledge Management Process (IJDKP) Vol.5, No.1, January 2015
35
a) True positive (TP): The actual negative class outcome is predicted as negative class from
the model
b) False positive (FP): The actual negative class outcome is predicted as a positive class
outcome. It leads to Type-1 error
c) False negative (FN): The actual positive class outcome is predicted as negative class from
the model. It leads to Type-2 error
d) True negative (TN): The actual class outcome excluded is also predicted to be excluded
from the model
Based on these four parameters the performance of algorithms can be adjudged by calculating the
following ratios.
FNTNFPTP
TNTPAccuracy
+++
+=(%)
FNTP
TPTPR
+
=(%)
TNFP
FPFPR
+
=(%)
FPTP
TPprecision
+
=(%)
ROC curve is a plot of false positive rate (X-axis) versus true positive rate (Y-axis). It is
represents the accuracy of a classifier [25].
The accuracy for all the models was computed and represented in Table 2. SVM classifier
achieved better accuracy compared to other machine learning algorithms. Henceforth the ROC
plot of RBF-based SVM classifier is represented in Figure 4.
Table 2: The accuracy of bankruptcy prediction of machine learning algorithms
Sl. No Algorithm Library
used in R
Accuracy
of
prediction
(%)
True
positive
rate
False
positive
rate
Precision
01. Logistic
regression
glmnet 97.2 0.972 0.028 0.97
02. Rotation
forest
randomForest 97.4 0.974 0.026 0.97
03. Naïve Bayes e1071 98.3 0.983 0.017 0.98
04. Neural
network
neuralnet 98.6 0.986 0.014 0.98
05. RBF-based
Support
vector
machine
e1071 99.6 0.996 0.004 0.99

International Journal of Data Mining & Knowledge Management Process (IJDKP) Vol.5, No.1, January 2015
36
Figure 4: The ROC curve representing the accuracy of SVM classifier
5.4. SVM based decision supportive system in R
Based on the accuracy in previous step, it was seen that support vector based classifier
outperformed other machine learning techniques. The classifier was implemented using radial
basis function (RBF) kernel [26]. It is also referred as Gaussian RBF kernel. The kernel
representation creates a decision boundary for the non-linear attributes in high dimensional space.
The attributes are converted to linear form by mapping using this kernel function. An optimal
hyperplane is constructed in feature space by considering the inner product of the kernel.
Hyperplane is considered as optimal if it creates a widest gap from the input attributes to the
target class. Furthermore, to achieve optimization C and gamma parameters are used. C is used to
minimize the misclassification in training dataset. If the value of C is smaller it is soft margin
creating a wider hyperplane, whereas the value of C being larger leads to overfitting called as
hard margin. Hence the value of C must be selected by balancing between the soft and hard
margin. Gamma is used for non-linear classifiers for constructing the hyperplane. It is used to
control the shape of the classes to be separated. If the value of gamma is small it results in high
variance and minimal bias producing a pointed thrust. While a bigger gamma value leads to
minimal variance and maximum bias producing a broader and soft thrust. The values of C and
gamma were optimized and selected for classification. The classified instances from RBF kernel
is observed in Figure 5.
Figure 5: RBF classifier based classification for bankruptcy dataset as either NB or B
Based on the RBF classifier the prediction system was constructed in R. The bankruptcy dataset
is initially loaded into the predictive system as a .csv file. The home page of predictive tool
loaded with bankruptcy dataset is shown in Figure 6.

International Journal of Data Mining & Knowledge Management Process (IJDKP) Vol.5, No.1, January 2015
37
Figure 6: SVM based predictive tool with the bankruptcy dataset
The system fetches the dataset and stores as a dataframe. Dataframe is a vector list used to store
the data as a table in R. RBF-kernel SVM model is developed for the bankruptcy dataset. It is
displayed in Figure 7.
Figure 7: Radial based SVM model developed for bankruptcy dataset
After the model is developed, users can enter their data in the text input boxes for predicting
bankruptcy. Each of the six input parameters have values as 1, 0.5 or 0 (positive, average and
negative) respectively. Based on SVM model built for the initial dataset, the predictive system
estimates the probability of bankruptcy as either B (Bankruptcy) or NB (Non Bankruptcy). The

International Journal of Data Mining & Knowledge Management Process (IJDKP) Vol.5, No.1, January 2015
38
predictive tool was tested for both non-bankruptcy and bankruptcy conditions. The results from
prediction are shown in Figure 8 and 9 respectively.
Figure 8: The predicted result as NB (Non-Bankruptcy) for user input data based on RBF-kernel.
Figure 9: The predicted result as B (Bankruptcy) for user input data based on RBF-kernel.
The performance of the tool was computed by comparing the predicted value with the actual
bankruptcy value for user data. It was found that the predictions were in par with the actual

International Journal of Data Mining & Knowledge Management Process (IJDKP) Vol.5, No.1, January 2015
39
outcomes for both the cases (NB and B). The predicted outcome is saved as a .csv file in the local
directory of user’s system to view the results represented in Figure 10.
Figure 10: The predicted results for bankruptcy from the tool are saved
5.5. Developing the prediction system as a package
The predictive system for detecting bankruptcy was encoded as a package in RStudio. The
package was developed using interdependent libraries ‘devtools’ and ‘roxygen2’. The package
can be downloaded by users in their local machines followed by installing and running the
package in RStudio. Once the package is installed users can run the predictive system for
detection of bankruptcy using their input data.
6. CONCLUSIONS
The results suggest that machine learning techniques can be implemented for prediction of
bankruptcy. To serve the financial organizations for identifying risk oriented customers a
prediction system was implemented. The predictive system helps to predict bankruptcy for a
customer dataset based on the SVM model.
REFERENCES
[1] Personal Bankruptcy or Insolvency laws in India. (http://blog.ipleaders.in/personal-bankruptcy-or-
insolvency-laws-in-india/). Retrieved on Nov, 2014.
[2] Hossein Rezaie Doolatabadi, Seyed Mohsen Hoseini, Rasoul Tahmasebi. “Using Decision Tree
Model and Logistic Regression to Predict Companies Financial Bankruptcy in Tehran Stock
Exchanges.” International Journal of Emerging Research in Management &Technology, 2(9): pp. 7-
16.
[3] M. Kantardzic (2003). “Data mining: Concepts, models, methods, and algorithms.” John Wiley &
Sons.
[4] X. Wu et. al (2008). “Top 10 algorithms in data mining”. Knowl Inf Syst. 14: pp 1-37.
[4] Hosmer David W, Lemeshow, Stanley (2000). “Applied Logistic Regression”. Wiley.

International Journal of Data Mining & Knowledge Management Process (IJDKP) Vol.5, No.1, January 2015
40
[5] Rish, Irina (2001). "An empirical study of the naive Bayes classifier". IJCAI Workshop on Empirical
Methods in AI.
[6] Breiman, Leo (2001). "Random Forests.” Machine Learning 45 (1):pp. 5–32.
[7] McCulloch, Warren; Walter Pitts (1943). "A Logical Calculus of Ideas Immanent in Nervous
Activity". Bulletin of Mathematical Biophysics 5 (4): pp. 115–133.
[8] Cortes, C.; Vapnik, V. (1995). "Support-vector networks". Machine Learning 20 (3): 273.
[9] Altman E (1968). Financial ratios, discriminant analysis and prediction of corporate bankruptcy. The
Journal of Finance. 23(4), 589-609.
[10] Martin, D (1977). Early warning of bank failures: A logit regression approach. Journal of Banking
and Finance. 1, 249-276.
[11] Lo, A (1984). Essays in financial and quantitative economics. Ph.D. dissertation, Harvard University.
[12] J. A. Ohlson (1980). “Financial ratios and the probabilistic prediction of bankruptcy,” Journal of
Accounting Research, 18(1), pp. 109-131.
[13] B. Back et. al (1996). “Choosing Bankruptcy Predictors using Discriminant Analysis, Logit Analysis
and Genetic Algorithms,” Turku School of Economics and Business Administration.
[14] J. E. Boritz, D. B. Kennedy (1995) “Effectiveness of neural network types for prediction of business
failure,” Expert Systems with Applications. 9(4): pp. 95-112.
[15] P. Coats, L. Fant (1992). “A neural network approach to forecasting financial distress,” Journal of
Business Forecasting, 10(4), pp. 9-12.
[16] M. D.Odom, R. Sharda (1990), “A neural network model for bankruptcy prediction,” IJC NN
International Joint Conference on Neural Networks, 2, p. 163-168.
[17] J. Sun, H. Li (2008). “Data mining method for listed companies’ financial distress prediction,”
Knowledge-Based Systems. 21(1): pp. 1-5. 2008.
[18] İ. H. Ekşi (2011). “Classification of firm failure with classification and regression trees,” International
Research Journal of Finance and Economics. 76, pp. 113-120.
[19] V. Fan, v. Palaniswami (2000).“Selecting bankruptcy bredictors using a support vector machine
approach,” Proceedings of the Internal Joint Conference on Neural Networks. pp. 354-359.
[20] S. Falahpour, R. Raie (2005). “Application of support vector machine to predict financial distress
using financial ratios”. Journal of Accounting and Auditing Studies. 53, pp. 17-34.
[21] Hyunchul Ahn, Kyoung-jae Kim (2009). “Bankruptcy prediction modeling with hybrid case-based
reasoning and genetic algorithms approach”. Applied Soft Computing. 9(2): pp. 599-607.
[22] Ming-Yuan Leon Li, Peter Miu (2010). “A hybrid bankruptcy prediction model with dynamic
loadings on accounting-ratio-based and market-based information: A binary quantile regression
approach”. Journal of Empirical Finance. 17(4): pp. 818-833.
[23] A. Martin, T Miranda Lakshmi, Prasanna Venkateshan (2014). “An Analysis on Qualitative
Bankruptcy Prediction rules using Ant-miner”. IJ Intelligent System and Applications. 01: pp. 36-44.
[24] Stehman, Stephen V. (1997). "Selecting and interpreting measures of thematic classification
accuracy". Remote Sensing of Environment. 62 (1): pp. 77–89.
[25] Fawcett, Tom (2006). "An Introduction to ROC Analysis". Pattern Recognition Letters. 27 (8): pp.
861 – 874.
[26] Vert, Jean-Philippe, Koji Tsuda, and Bernhard Schölkopf (2004). "A primer on kernel methods".
Kernal Methods in Computational Biology.
Related Documents