sustainability Article A Predictive Approach to Optimize a HHO Generator Coupled with Solar PV as a Standalone System Osama Majeed Butt 1,2 , Tareq Saeed 3 , Hassan Elahi 4,† , Usman Masud 5,† , Usman Ghafoor 6, * , Hang Seng Che 1 , Nasrudin Abd Rahim 1 and Muhammad Shakeel Ahmad 1, * Citation: Butt, O.M.; Saeed, T.; Elahi, H.; Masud, U.; Ghafoor, U.; Che, H.S.; Rahim, N.A.; Ahmad, M.S. A Predictive Approach to Optimize a HHO Generator Coupled with Solar PV as a Standalone System. Sustainability 2021, 13, 12110. https://doi.org/10.3390/su132112110 Academic Editors: Aritra Ghosh and Pablo García Triviño Received: 15 September 2021 Accepted: 27 October 2021 Published: 2 November 2021 Publisher’s Note: MDPI stays neutral with regard to jurisdictional claims in published maps and institutional affil- iations. Copyright: © 2021 by the authors. Licensee MDPI, Basel, Switzerland. This article is an open access article distributed under the terms and conditions of the Creative Commons Attribution (CC BY) license (https:// creativecommons.org/licenses/by/ 4.0/). 1 Higher Institution Centre of Excellence (HICoE), UM Power Energy Dedicated Advanced Centre (UM-PEDAC), University of Malaya, Kuala Lumpur 59990, Malaysia; [email protected] (O.M.B.); [email protected] (H.S.C.); [email protected] (N.A.R.) 2 Institute of Electrical, Electronics & Computer Engineering, University of the Punjab, Lahore 54590, Pakistan 3 Nonlinear Analysis and Applied Mathematics (NAAM)-Research Group, Department of Mathematics, Faculty of Science, King Abdulaziz University, P.O. Box 80203, Jeddah 21589, Saudi Arabia; [email protected] 4 Department of Mechanical and Aerospace Engineering, Sapienza University of Rome, 00185 Rome, Italy; [email protected] 5 Department of Electronics Engineering, University of Engineering and Technology, Taxila 47050, Pakistan; [email protected] 6 Department of Mechanical Engineering, Institute of Space Technology, Islamabad 44000, Pakistan * Correspondence: [email protected] (U.G.); [email protected] (M.S.A.) † H.E. and U.M. have equally contributed as the third authors of the manuscript. Abstract: Production of hydrogen by means of renewable energy sources is a way to eliminate dependency of the system on the electric grid. This study is based on a technique involving coupling of an oxyhydrogen (HHO) electrolyzer with solar PV to produce clean HHO gas as a fuel. One of objectives of this study was to develop a strategy to make the electrolyzer independent of other energy sources and work as a standalone system based on solar PV only. A DC-DC buck convertor is used with an algorithm that can track the maximum power and can be fed to the electrolyzer by PV while addressing its intermittency. The electrolyzer is considered to be an electrical load that is connected to solar PV by means of a DC-DC convertor. An algorithm is designed for this DC-DC convertor that allows maximization and control of power transferred from solar PV to the electrolyzer to produce the maximum HHO gas. This convertor is also responsible for operating the electrolyzer in its optimum operating region to avoid overheating. The DC-DC converter has been tested under simulated indoor conditions and uncontrolled outdoor conditions. Analysis of this DC-DC convertor based on maximum power tracking algorithm showed 94% efficiency. Keywords: electrolyzer; solar PV; convertor; HHO 1. Introduction Demand of energy is peaking day-by-day relative to the available traditional fossil based resources [1,2]. Furthermore, the huge consumption of fossil fuels results not only in decreasing reserves but also increasing greenhouse gases [3,4]. While the ability to produce renewable electricity has achieved considerable technological maturity and dramatically lower costs in the past decade, it is now imperative to focus attention on reliable energy storage, transportation and deep de-carbonization of hard to electrify industrial sectors. Green fuels and their means of production are always a fascination for researchers to overcome both energy and environmental issues. On-demand HHO gas is considered as one of the alternative green fuel options. The HHO gas can be cost effectively generated and consumed on-demand in various engineering and combustion applications [5,6]. Various studies have proved the blending HHO with other fuels is an efficient and cost effective way to reduce the carbon footprint and improve the thermal efficiency of Sustainability 2021, 13, 12110. https://doi.org/10.3390/su132112110 https://www.mdpi.com/journal/sustainability

Welcome message from author
This document is posted to help you gain knowledge. Please leave a comment to let me know what you think about it! Share it to your friends and learn new things together.
Transcript

sustainability
Article
A Predictive Approach to Optimize a HHO Generator Coupledwith Solar PV as a Standalone System
Osama Majeed Butt 1,2 , Tareq Saeed 3, Hassan Elahi 4,† , Usman Masud 5,† , Usman Ghafoor 6,* ,Hang Seng Che 1 , Nasrudin Abd Rahim 1 and Muhammad Shakeel Ahmad 1,*
�����������������
Citation: Butt, O.M.; Saeed, T.; Elahi,
H.; Masud, U.; Ghafoor, U.; Che, H.S.;
Rahim, N.A.; Ahmad, M.S. A
Predictive Approach to Optimize a
HHO Generator Coupled with Solar
PV as a Standalone System.
Sustainability 2021, 13, 12110.
https://doi.org/10.3390/su132112110
Academic Editors: Aritra Ghosh and
Pablo García Triviño
Received: 15 September 2021
Accepted: 27 October 2021
Published: 2 November 2021
Publisher’s Note: MDPI stays neutral
with regard to jurisdictional claims in
published maps and institutional affil-
iations.
Copyright: © 2021 by the authors.
Licensee MDPI, Basel, Switzerland.
This article is an open access article
distributed under the terms and
conditions of the Creative Commons
Attribution (CC BY) license (https://
creativecommons.org/licenses/by/
4.0/).
1 Higher Institution Centre of Excellence (HICoE), UM Power Energy Dedicated AdvancedCentre (UM-PEDAC), University of Malaya, Kuala Lumpur 59990, Malaysia; [email protected] (O.M.B.);[email protected] (H.S.C.); [email protected] (N.A.R.)
2 Institute of Electrical, Electronics & Computer Engineering, University of the Punjab, Lahore 54590, Pakistan3 Nonlinear Analysis and Applied Mathematics (NAAM)-Research Group, Department of Mathematics,
Faculty of Science, King Abdulaziz University, P.O. Box 80203, Jeddah 21589, Saudi Arabia;[email protected]
4 Department of Mechanical and Aerospace Engineering, Sapienza University of Rome, 00185 Rome, Italy;[email protected]
5 Department of Electronics Engineering, University of Engineering and Technology, Taxila 47050, Pakistan;[email protected]
6 Department of Mechanical Engineering, Institute of Space Technology, Islamabad 44000, Pakistan* Correspondence: [email protected] (U.G.); [email protected] (M.S.A.)† H.E. and U.M. have equally contributed as the third authors of the manuscript.
Abstract: Production of hydrogen by means of renewable energy sources is a way to eliminatedependency of the system on the electric grid. This study is based on a technique involving couplingof an oxyhydrogen (HHO) electrolyzer with solar PV to produce clean HHO gas as a fuel. One ofobjectives of this study was to develop a strategy to make the electrolyzer independent of otherenergy sources and work as a standalone system based on solar PV only. A DC-DC buck convertoris used with an algorithm that can track the maximum power and can be fed to the electrolyzer byPV while addressing its intermittency. The electrolyzer is considered to be an electrical load that isconnected to solar PV by means of a DC-DC convertor. An algorithm is designed for this DC-DCconvertor that allows maximization and control of power transferred from solar PV to the electrolyzerto produce the maximum HHO gas. This convertor is also responsible for operating the electrolyzerin its optimum operating region to avoid overheating. The DC-DC converter has been tested undersimulated indoor conditions and uncontrolled outdoor conditions. Analysis of this DC-DC convertorbased on maximum power tracking algorithm showed 94% efficiency.
Keywords: electrolyzer; solar PV; convertor; HHO
1. Introduction
Demand of energy is peaking day-by-day relative to the available traditional fossilbased resources [1,2]. Furthermore, the huge consumption of fossil fuels results not only indecreasing reserves but also increasing greenhouse gases [3,4]. While the ability to producerenewable electricity has achieved considerable technological maturity and dramaticallylower costs in the past decade, it is now imperative to focus attention on reliable energystorage, transportation and deep de-carbonization of hard to electrify industrial sectors.Green fuels and their means of production are always a fascination for researchers toovercome both energy and environmental issues. On-demand HHO gas is considered asone of the alternative green fuel options. The HHO gas can be cost effectively generatedand consumed on-demand in various engineering and combustion applications [5,6].
Various studies have proved the blending HHO with other fuels is an efficient andcost effective way to reduce the carbon footprint and improve the thermal efficiency of
Sustainability 2021, 13, 12110. https://doi.org/10.3390/su132112110 https://www.mdpi.com/journal/sustainability

Sustainability 2021, 13, 12110 2 of 16
combustion-related applications [7–13]. Combustion engines in particular show promisingresults towards increased efficiency of brake power and brake thermal by 5 and 7%,respectively, while reducing HC, NOx and smoke by 88, 94 and 18% respectively. HHOgas can be used as a fuel to power catalytic boilers, gas powered heat pumps and directflame combustion boilers that are more-or-less the same as natural gas boilers. A largevariety of district heating techniques can be redesigned so they can use oxyhydrogen asfuel. HHO gas is not limited for use in combustion engines and industrial applications. Itcan also be used for house heating purposes. It is a beneficial substitute during thermalcoating processes. It can be an alternative of plasma gas or can be mixed as an additivegas during thermal spray processes for depositing metallic or nonmetallic materials in amolten or semi-molten condition [14].
HHO gas has generally been produced by using an electrolyzer which is essentiallya stack of multiple positive and negative plates so arranged to produce hydrogen at thecathode and oxygen at the anode when a direct current (DC) has been applied. No separatoris used generally in between the cathode and anode to avoid separator-related resistivelosses. Production is directly proportional to current as given in Equation (1):
V = [a0 + a1T + b· ln(T)− (r0/T)I]Ns (1)
Here, V is voltage of cell which is normally kept as 2 Volt DC for electrolysis, Irepresents the current, T represents temperature, a0, a1, and b are electrolysis parameterswhich are determined experimentally depending on the type of electrolysis, r0 is the initialresistance of the electrolyzer and Ns are number of cells. Also it was seen that in realityelectrolyzer work as a non-linear load (resistance) [15] and will extract more current fromthe source during the period it remains turned on. This nonlinear behavior is dependenton the pressure, temperature and chemical structure of the solution which leads to arise in temperature [16,17]. Studies shows that the optimal range of temperature for theelectrolyzer is less than 70 ◦C [13].
Research is underway to use PV for energizing different applications like waterpumps [18,19]. Direct coupling of PV with an application is always a challenge due to itsintermittent nature. Recently, attempts have been made to directly couple electrolyzers(HHO generators) with solar PV due to the drive towards green energy and to minimizebattery-related costs for on-demand HHO generation for various combustion-relatedapplications [20]. Various studies have suggested pulse width modulation (PWM) as auseful technique for this purpose [21–25]. PWM is a control technique that helps to regulatethe input current of electrolyzer by setting its duty cycle and frequency. The duty cycle ofa PWM signal is defined as the ratio of “on” times over the full signal period [26,27]. Byadjusting the duty cycle of the PWM, the input current can be regulated accordingly so thatit can control the current of the electrolyzer. This PWM adjusts the operating voltage on thePV array I-V curve to keep its maximum power point and convert that power into voltageand current according to the requirements of the electrolyzer. A recent study concludedthat electronic coupling of a PV by mean of an optimizer can increase the efficiency 5%more than other strategies [28], but the exact efficiency of electronic coupling over directcoupling of PV and electrolyzer is dependent on different parameters such as their I–Vbehavior, selection of PV, geographic location and scale.
The DC-DC buck convertor has also been used for efficiently connecting electrolyzerswith a DC bus bar. Different topologies of DC-DC convertors were considered based onthe conversion ratio [29–32]. Convertors with high conversion ratio have been deemedbeneficial for electrolyzer applications due to their use of very low DC voltages comparedto the high DC bus voltage [33]. The conversion ratio is not only an important parameterin designing of the convertor for electrolyzer applications. Some requirements should betaken in consideration which include: (1) the output current ripple that must be as smallas possible in order to optimize the electrolyzer lifespan [34], (2) energy efficiency [35],and (3) cost [36]. Based on all these factors, the classic DC-DC buck convertor is the mostmature and used topology to couple an electrolyzer with a DC bus bar

Sustainability 2021, 13, 12110 3 of 16
In this article a DC-DC convertor has been designed to directly couple the HHOelectrolyzer with solar PV. The prior performance has been investigated under simulatedindoor and uncontrolled outdoor conditions. Furthermore, an attempt has been made tomeasure and adjust necessary parameters using specially designed solar simulator.
2. Design & Technique
The system was comprised of three main parts: (i) PV, (ii) convertor, (iii) electrolyzer(model: 12 V, 30 plate, supplied by: greenfuelh2o, Orem, UT, USA, https://www.greenfuelh2o.com/ accessed on 31 September 2021). As per the objective of the study, the electrolyzerhas been directly coupled with solar PV. The convertor is responsible for delivering themaximum available power from the PV to electrolyzer by keeping it in the operating region.
2.1. Experimental Setup
In this study a prefabricated electrolyzer has been used. This electrolyzer was coupledwith solar PV by using an electronic convertor. A complete schematic diagram of thesystem is shown in Figure 1. A 30% KOH solution has been used as an electrolyte whichis fed to the electrolyzer from a container by means of gravity. A schematic diagram ofinternal architecture of the electrolyzer and the installed setup is presented in Figure 2a,b.Detailed specifications of the solar PV system are given in Table 1.
Sustainability 2021, 13, x 3 of 17
ciency [35], and (3) cost [36]. Based on all these factors, the classic DC-DC buck convertor is the most mature and used topology to couple an electrolyzer with a DC bus bar
In this article a DC-DC convertor has been designed to directly couple the HHO electrolyzer with solar PV. The prior performance has been investigated under simulated indoor and uncontrolled outdoor conditions. Furthermore, an attempt has been made to measure and adjust necessary parameters using specially designed solar simulator.
2. Design & Technique The system was comprised of three main parts: (i) PV, (ii) convertor, (iii) electrolyzer
(model: 12 V, 30 plate, supplied by: greenfuelh2o, Orem, UT, USA, https://www.greenfuelh2o.com/ accessed on 31 September 2021). As per the objective of the study, the electrolyzer has been directly coupled with solar PV. The convertor is re-sponsible for delivering the maximum available power from the PV to electrolyzer by keeping it in the operating region.
2.1. Experimental Setup In this study a prefabricated electrolyzer has been used. This electrolyzer was cou-
pled with solar PV by using an electronic convertor. A complete schematic diagram of the system is shown in Figure 1. A 30% KOH solution has been used as an electrolyte which is fed to the electrolyzer from a container by means of gravity. A schematic diagram of internal architecture of the electrolyzer and the installed setup is presented in Figure 2a,b. Detailed specifications of the solar PV system are given in Table 1.
Figure 1. Schematic diagram of PV electrolysis.
An electrolyzer as shown in Figure 2a,b was used with 30 plates of SS316 in such a configuration that they form six stacks comprising six cells each. From the literature it was established that the cells required from 1.8–2.2 volts [37] which depends upon the reversible thermodynamic decomposition voltage, anode over-potential, cathode over-potential and the inter-electrode Ohmic drop. The characteristic size itself is de-pendent on the cell configuration (such as cell and electrode geometry) and operational parameters (such as current density, electrolyte flow conditions, temperature and pres-sure). As the electrolyzer under investigation is comprised of six cells in each stack so it required between 11 volts to 13.2 volts for efficient working.
Figure 1. Schematic diagram of PV electrolysis.Sustainability 2021, 13, x 4 of 17
Figure 2. (a) Configuration layout of the electrolyzer under test; (b) electrolyzer test rig.
Table 1. Specifications of the solar PV system under test.
Parameter Value Maximum Power 300 W
Voltage at Pmax 33 V Current at Pmax 9.1 A
Short-circuit current Isc 9.8 A Open-circuit voltage Voc 38.7 V
2.1.1. Indoor Setup A simulated laboratory environment was used as shown in Figure 3.
Figure 3. Test rig for testing the PV-ELE system, coupled with a DC-DC convertor.
Figure 2. (a) Configuration layout of the electrolyzer under test; (b) electrolyzer test rig.

Sustainability 2021, 13, 12110 4 of 16
Table 1. Specifications of the solar PV system under test.
Parameter Value
Maximum Power 300 WVoltage at Pmax 33 VCurrent at Pmax 9.1 A
Short-circuit current Isc 9.8 AOpen-circuit voltage Voc 38.7 V
An electrolyzer as shown in Figure 2a,b was used with 30 plates of SS316 in such aconfiguration that they form six stacks comprising six cells each. From the literature it wasestablished that the cells required from 1.8–2.2 volts [37] which depends upon the reversiblethermodynamic decomposition voltage, anode over-potential, cathode over-potential andthe inter-electrode Ohmic drop. The characteristic size itself is dependent on the cellconfiguration (such as cell and electrode geometry) and operational parameters (such ascurrent density, electrolyte flow conditions, temperature and pressure). As the electrolyzerunder investigation is comprised of six cells in each stack so it required between 11 volts to13.2 volts for efficient working.
2.1.1. Indoor Setup
A simulated laboratory environment was used as shown in Figure 3.
Sustainability 2021, 13, x 4 of 17
Figure 2. (a) Configuration layout of the electrolyzer under test; (b) electrolyzer test rig.
Table 1. Specifications of the solar PV system under test.
Parameter Value Maximum Power 300 W
Voltage at Pmax 33 V Current at Pmax 9.1 A
Short-circuit current Isc 9.8 A Open-circuit voltage Voc 38.7 V
2.1.1. Indoor Setup A simulated laboratory environment was used as shown in Figure 3.
Figure 3. Test rig for testing the PV-ELE system, coupled with a DC-DC convertor. Figure 3. Test rig for testing the PV-ELE system, coupled with a DC-DC convertor.
For irradiance on the solar PV system, 160 DECOSTAR halogen lamps (with UV filter,colour temperature 2950 K, Osram, Munich, Germany) of 50 Watts each were used. A HTSOLAR02 Remote Unit along with a HT HT304N reference cell (HT Italia srl, Via dellaBoaria, Italy) was used to monitor the irradiance level on the PV. Different irradiance levelswere set by changing the light intensity of the bulbs.
Sustainability 2021, 13, 12110 5 of 16
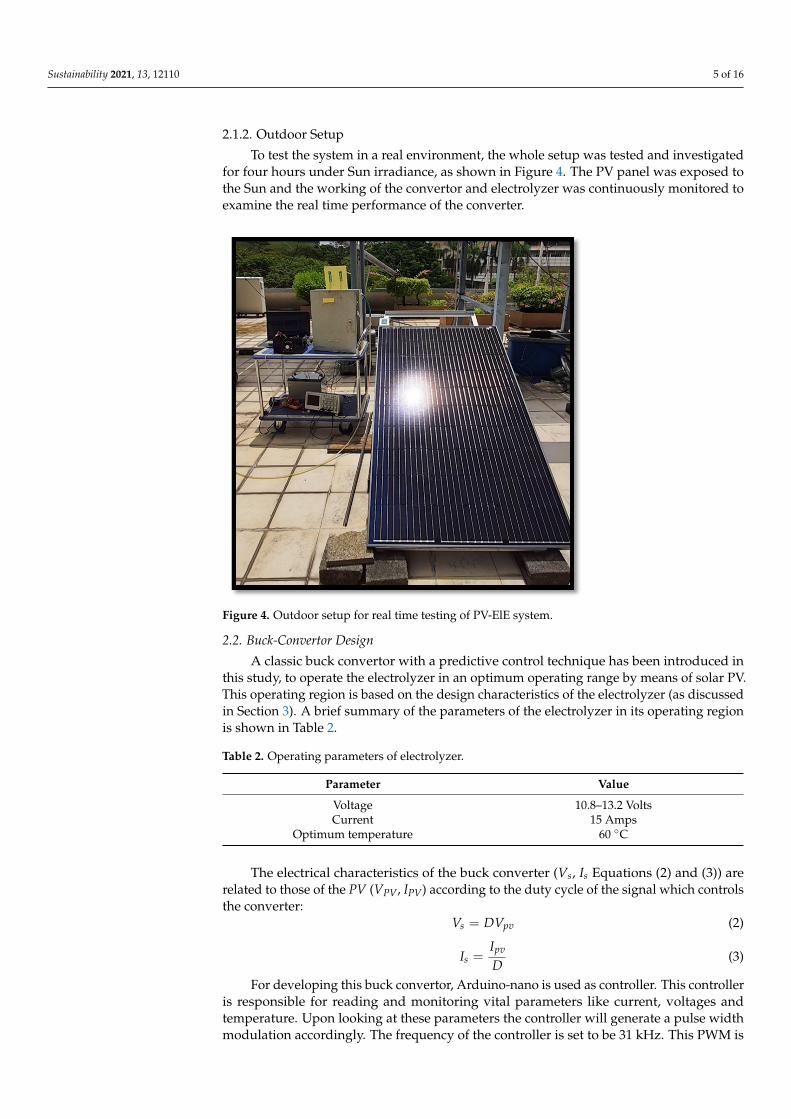
2.1.2. Outdoor Setup
To test the system in a real environment, the whole setup was tested and investigatedfor four hours under Sun irradiance, as shown in Figure 4. The PV panel was exposed tothe Sun and the working of the convertor and electrolyzer was continuously monitored toexamine the real time performance of the converter.
Sustainability 2021, 13, x 5 of 17
For irradiance on the solar PV system, 160 DECOSTAR halogen lamps (with UV filter, colour temperature 2950 K, Osram, Munich, Germany) of 50 Watts each were used. A HT SOLAR02 Remote Unit along with a HT HT304N reference cell (HT Italia srl, Via della Boaria, Italy) was used to monitor the irradiance level on the PV. Different irradi-ance levels were set by changing the light intensity of the bulbs.
2.1.2. Outdoor Setup To test the system in a real environment, the whole setup was tested and investi-
gated for four hours under Sun irradiance, as shown in Figure 4. The PV panel was ex-posed to the Sun and the working of the convertor and electrolyzer was continuously monitored to examine the real time performance of the converter.
Figure 4. Outdoor setup for real time testing of PV-ElE system.
2.2. Buck-Convertor Design A classic buck convertor with a predictive control technique has been introduced in
this study, to operate the electrolyzer in an optimum operating range by means of solar PV. This operating region is based on the design characteristics of the electrolyzer (as discussed in Section 3). A brief summary of the parameters of the electrolyzer in its op-erating region is shown in Table 2.
Table 2. Operating parameters of electrolyzer.
Parameter Value Voltage 10.8–13.2 Volts Current 15 Amps
Optimum temperature 60 °C
The electrical characteristics of the buck converter (Vs, Is Equations (2) and (3)) are related to those of the PV (VPV, IPV) according to the duty cycle of the signal which controls the converter: 𝑉 = 𝐷𝑉 (2)
Figure 4. Outdoor setup for real time testing of PV-ElE system.
2.2. Buck-Convertor Design
A classic buck convertor with a predictive control technique has been introduced inthis study, to operate the electrolyzer in an optimum operating range by means of solar PV.This operating region is based on the design characteristics of the electrolyzer (as discussedin Section 3). A brief summary of the parameters of the electrolyzer in its operating regionis shown in Table 2.
Table 2. Operating parameters of electrolyzer.
Parameter Value
Voltage 10.8–13.2 VoltsCurrent 15 Amps
Optimum temperature 60 ◦C
The electrical characteristics of the buck converter (Vs, Is Equations (2) and (3)) arerelated to those of the PV (VPV, IPV) according to the duty cycle of the signal which controlsthe converter:
Vs = DVpv (2)
Is =Ipv
D(3)
For developing this buck convertor, Arduino-nano is used as controller. This controlleris responsible for reading and monitoring vital parameters like current, voltages andtemperature. Upon looking at these parameters the controller will generate a pulse widthmodulation accordingly. The frequency of the controller is set to be 31 kHz. This PWM is

Sustainability 2021, 13, 12110 6 of 16
than feed to a MOSFET (IRF 4115, International Rectifier IR, El Segundo, CA, USA) withthe help of a current driver (IR 2110, International Rectifier IR, El Segundo, CA, USA). Aschematic diagram of the convertor is shown in Figure 5. Solar PV systems have non-linearbehavior due to their intermittency because of the change in irradiance and temperature onthe PV array, so this convertor is also responsible for tracking the maximum current that canbe fed from the PV. In this way the electrolyzer can utilize the maximum power availablefrom solar energy within its operating region (shown in Table 2). It also monitors thetemperature of the electrolyzer and control the current in order to maintain the temperatureof the electrolyzer to optimize HHO production so that it does not affect the quality of theHHO gas produced.
Sustainability 2021, 13, x 6 of 17
𝐼 = 𝐼𝐷 (3)
For developing this buck convertor, Arduino-nano is used as controller. This con-troller is responsible for reading and monitoring vital parameters like current, voltages and temperature. Upon looking at these parameters the controller will generate a pulse width modulation accordingly. The frequency of the controller is set to be 31 kHz. This PWM is than feed to a MOSFET (IRF 4115, International Rectifier IR, El Segundo, CA, USA) with the help of a current driver (IR 2110, International Rectifier IR, El Segundo, CA, USA). A schematic diagram of the convertor is shown in Figure 5. Solar PV systems have non-linear behavior due to their intermittency because of the change in irradiance and temperature on the PV array, so this convertor is also responsible for tracking the maximum current that can be fed from the PV. In this way the electrolyzer can utilize the maximum power available from solar energy within its operating region (shown in Table 2). It also monitors the temperature of the electrolyzer and control the current in order to maintain the temperature of the electrolyzer to optimize HHO production so that it does not affect the quality of the HHO gas produced.
Figure 5. Schematic diagram of DC-DC convertor.
2.3. Control Strategy When a traditional control is used for a buck-convertor by adjusting duty for
achieving the required voltages and current, the convertor decreases the efficiency of the system. This happens because control of the convertor adjusts the duty of the convertor not only by keeping it in the operating region, but the intermittency of the PV was not taken into account. Therefore, an advanced strategy was used to track the maximum point of power that can be available from the PV by keeping the electrolyzer in its oper-ating region while keeping the non-linear behavior (due to intermittency) of PV.
Normally for MPPT strategies of solar PV, monitoring of the parameters is done for PV in order to track the maximum power obtained from it. As the current system is a standalone and the electrolyzer is expected to work in its operating region as mentioned in Table 2, so this strategy was implemented in the electrolyzer by monitoring its pa-rameters (current and voltage). This was done because the electrolyzer is required to run on the maximum available current (if under electrolyzer limitation of current) regulated by the operating voltage. Another reason to implement a control technique on the elec-trolyzer, because the electrolyzer itself is a non-linear load, so it is important to monitor the electrolyzer parameters in order to run it for maximum production of HHO gas. This control technique is represented in the flowchart shown in Figure 6.
Figure 5. Schematic diagram of DC-DC convertor.
2.3. Control Strategy
When a traditional control is used for a buck-convertor by adjusting duty for achievingthe required voltages and current, the convertor decreases the efficiency of the system.This happens because control of the convertor adjusts the duty of the convertor not onlyby keeping it in the operating region, but the intermittency of the PV was not taken intoaccount. Therefore, an advanced strategy was used to track the maximum point of powerthat can be available from the PV by keeping the electrolyzer in its operating region whilekeeping the non-linear behavior (due to intermittency) of PV.
Normally for MPPT strategies of solar PV, monitoring of the parameters is done forPV in order to track the maximum power obtained from it. As the current system is astandalone and the electrolyzer is expected to work in its operating region as mentioned inTable 2, so this strategy was implemented in the electrolyzer by monitoring its parameters(current and voltage). This was done because the electrolyzer is required to run on themaximum available current (if under electrolyzer limitation of current) regulated by theoperating voltage. Another reason to implement a control technique on the electrolyzer,because the electrolyzer itself is a non-linear load, so it is important to monitor the elec-trolyzer parameters in order to run it for maximum production of HHO gas. This controltechnique is represented in the flowchart shown in Figure 6.
For maximum power point tracking of the system a predictive approach was used.In this control technique, instant temperature and voltage is measured and kept in theoperating range as mentioned earlier in Table 2. As the voltage is to be kept constant forworking of the electrolyzer the current is to be taken into account for tracking the maximumpower algorithm of the control measures instant operating current of the electrolyzer andcompare it with last measured current. If the current is increased by the perturbation, thenthe current is kept changing by increasing of duty in the same direction. Otherwise thedirection of perturbation is changed by decreasing the duty. As an increase or decrease of

Sustainability 2021, 13, 12110 7 of 16
duty cycle are dependent upon the limitations of the electrolyzer as well as the PV the stepsize remains constant throughout the algorithm. In this way by applying the algorithmon the load (electrolyzer) side, the maximum available power from PV can be tracked bykeeping the electrolyzer in its optimum operating region.
Sustainability 2021, 13, x 7 of 17
For maximum power point tracking of the system a predictive approach was used. In this control technique, instant temperature and voltage is measured and kept in the operating range as mentioned earlier in Table 2. As the voltage is to be kept constant for working of the electrolyzer the current is to be taken into account for tracking the max-imum power algorithm of the control measures instant operating current of the electro-lyzer and compare it with last measured current. If the current is increased by the per-turbation, then the current is kept changing by increasing of duty in the same direction. Otherwise the direction of perturbation is changed by decreasing the duty. As an increase or decrease of duty cycle are dependent upon the limitations of the electrolyzer as well as the PV the step size remains constant throughout the algorithm. In this way by applying the algorithm on the load (electrolyzer) side, the maximum available power from PV can be tracked by keeping the electrolyzer in its optimum operating region.
Figure 6. Flowchart for the control strategy for the convertor.
3. Results To determine the characteristics of the electrolyzer as well as PV, IV testing was
performed to see the working behavior of the PV and electrolyzer. The IV curves of the solar PV and electrolyzer based on the tests, are shown in Figure 7a,b, respectively. From Figure 7b we can easily analyze the operating parameters of the electrolyzer.
Figure 6. Flowchart for the control strategy for the convertor.
3. Results
To determine the characteristics of the electrolyzer as well as PV, IV testing wasperformed to see the working behavior of the PV and electrolyzer. The IV curves of thesolar PV and electrolyzer based on the tests, are shown in Figure 7a,b, respectively. FromFigure 7b we can easily analyze the operating parameters of the electrolyzer.
To see the working of the electrolyzer coupled with the solar PV, the test rig shownin Figure 3 was allowed to run under different irradiance levels. Data of voltage, currentand power for the PV and electrolyzer were recorded as seen in in Figure 8 by using anoscilloscope. Voltages and current for both PV and electrolyzer at different irradiancescan be seen in (i) part of all figures in Figure 8. In the (ii) part of all figures of Figure 8, it

Sustainability 2021, 13, 12110 8 of 16
can be seen that electrolyzer power is following the power that is delivered from PV dueto DC-DC convertor. The system was allowed to run for an equal time interval for eachirradiance until steady state was reached. Further data was analyzed and is summarizedin Table 3. Power for the PV and electrolyzer was analyzed for the steady state by usinga weighted moving average. This was used to calculate the efficiency of the convertorand its working for tracking maximum power point. Although at 200 W/m2 of irradiance,mathematically the convertor was working at 89% but the system was actually not working,hence resulting in 0% yield of the HHO. This is because at this low level of irradiance theelectrolyzer was not working in its operating region, so no HHO production ocurred.
Sustainability 2021, 13, x 8 of 17
To see the working of the electrolyzer coupled with the solar PV, the test rig shown in Figure 3 was allowed to run under different irradiance levels. Data of voltage, current and power for the PV and electrolyzer were recorded as seen in in Figure 8 by using an oscilloscope. Voltages and current for both PV and electrolyzer at different irradiances can be seen in (i) part of all figures in Figure 8. In the (ii) part of all figures of Figure 8, it can be seen that electrolyzer power is following the power that is delivered from PV due to DC-DC convertor. The system was allowed to run for an equal time interval for each irradiance until steady state was reached. Further data was analyzed and is summarized in Table 3. Power for the PV and electrolyzer was analyzed for the steady state by using a weighted moving average. This was used to calculate the efficiency of the convertor and its working for tracking maximum power point. Although at 200 W/m2 of irradiance, mathematically the convertor was working at 89% but the system was actually not working, hence resulting in 0% yield of the HHO. This is because at this low level of ir-radiance the electrolyzer was not working in its operating region, so no HHO production ocurred.
Figure 7. (a) IV curve for the solar PV under test; (b) IV curve for the electrolyzer under test.
Figure 7. (a) IV curve for the solar PV under test; (b) IV curve for the electrolyzer under test.
Sustainability 2021, 13, x 8 of 17
To see the working of the electrolyzer coupled with the solar PV, the test rig shown in Figure 3 was allowed to run under different irradiance levels. Data of voltage, current and power for the PV and electrolyzer were recorded as seen in in Figure 8 by using an oscilloscope. Voltages and current for both PV and electrolyzer at different irradiances can be seen in (i) part of all figures in Figure 8. In the (ii) part of all figures of Figure 8, it can be seen that electrolyzer power is following the power that is delivered from PV due to DC-DC convertor. The system was allowed to run for an equal time interval for each irradiance until steady state was reached. Further data was analyzed and is summarized in Table 3. Power for the PV and electrolyzer was analyzed for the steady state by using a weighted moving average. This was used to calculate the efficiency of the convertor and its working for tracking maximum power point. Although at 200 W/m2 of irradiance, mathematically the convertor was working at 89% but the system was actually not working, hence resulting in 0% yield of the HHO. This is because at this low level of ir-radiance the electrolyzer was not working in its operating region, so no HHO production ocurred.
Figure 7. (a) IV curve for the solar PV under test; (b) IV curve for the electrolyzer under test.
Figure 8. Cont.

Sustainability 2021, 13, 12110 9 of 16Sustainability 2021, 13, x 9 of 17
Figure 8. Cont.

Sustainability 2021, 13, 12110 10 of 16Sustainability 2021, 13, x 10 of 17
Figure 8. Voltage and current of the PV and electrolyzer monitored on oscilloscope and power was being calculated for each at different irradiance level: (a) 1200 W/m2; (b) 1000 W/m2; (c) 800 W/m2; (d) 600 W/m2; (e) 400 W/m2; (f) 200 W/m2.
Table 3. Summary of the analysis of the convertor and PV-ELE based on different irradiance levels.
Irradiance (W/m2) PV Power (W) Electrolyzer Power (W)
Efficiency of Convertor (ƞc)
HHO Production (LPM) STH Efficiency (ƞSTH)
1200 235.5 222 94.4% 0.885 12.60% 1000 195.5 185.6 94.9% 0.800 11.47% 800 146.1 140.6 96.2% 0.620 10.88% 600 105.7 101.2 95.7% 0.440 10.59% 400 67.57 64.23 95.0% 0.300 10.10% 200 32.88 29.37 89.3% 0.000 00.00%
From Figure 8 it was observed that the convertor was tracking the maximum power available from the PV to electrolyzer by keeping the electrolyzer in its operating region. As the irradiance was decreased the power output was lowered, which eventually low-ered the power of electrolyzer and as a result decreased the production of HHO. For the overall efficiency, that is solar to hydrogen (STH) for this system, the total hydrogen production in moles and the size and design of the electrolyzer are required. As in this case the HHO production is dependent on the current and voltage of electrolyzer which
Figure 8. Voltage and current of the PV and electrolyzer monitored on oscilloscope and power was being calculated for eachat different irradiance level: (a) 1200 W/m2; (b) 1000 W/m2; (c) 800 W/m2; (d) 600 W/m2; (e) 400 W/m2; (f) 200 W/m2.
Table 3. Summary of the analysis of the convertor and PV-ELE based on different irradiance levels.
Irradiance (W/m2) PV Power (W) ElectrolyzerPower (W)
Efficiency ofConvertor (ηc)
HHO Production(LPM)
STH Efficiency(ηSTH)
1200 235.5 222 94.4% 0.885 12.60%1000 195.5 185.6 94.9% 0.800 11.47%800 146.1 140.6 96.2% 0.620 10.88%600 105.7 101.2 95.7% 0.440 10.59%400 67.57 64.23 95.0% 0.300 10.10%200 32.88 29.37 89.3% 0.000 00.00%
From Figure 8 it was observed that the convertor was tracking the maximum poweravailable from the PV to electrolyzer by keeping the electrolyzer in its operating region. Asthe irradiance was decreased the power output was lowered, which eventually loweredthe power of electrolyzer and as a result decreased the production of HHO. For the overallefficiency, that is solar to hydrogen (STH) for this system, the total hydrogen production inmoles and the size and design of the electrolyzer are required. As in this case the HHOproduction is dependent on the current and voltage of electrolyzer which is dependent

Sustainability 2021, 13, 12110 11 of 16
on its design (internal resistance, electrolyte, overpotential), the equation for STH can bewritten as follows:
STH =IEle × VEleApv × ρsol
ηsys (4)
Here, IEle and VEle are the current and voltage of the electrolyzer that are requiredto split water, Apv is the area of the solar PV system and ρsol is the irradiance in W/m2,while ηsys includes the efficiency of the panel, efficiency of the convertor and efficiency ofthe electrolyzer. For this instant values of the current and voltage of the electrolyzer wererecorded as the outcome of all these efficiencies.
It is also seen from Table 3 that the maximum efficiency of the convertor is availablewhen the solar PV is working in the electrolyzer operating range. Furthermore, IV-curvesand power curves were analyzed to see the behavior of the working of the electrolyzerwith the solar PV. Power curves and IV-curves were drawn in Figure 9 by keeping in viewthe actual data of the PV and the duty of the convertor at the respective irradiance in orderto correlate the analysis with the electrolyzer curves. From Figure 9 it is more clearly seenthat the convertor kept the electrolyzer to its operating region while tracking the maximumpower of the PV. In all (i) parts of Figure 9, maximum point of power is tracked for aparticular irradiance while keeping the electrolyzer in operating mode. On the other (ii)part of all figures in Figure 9, IV curve is drawn while displaying maximum operating pointfor electrolyzer. It can also further have determined from Figure 9, that control strategy forthe convertor is not analyzing maximum power point of PV (in Figure 9, tracked powerpoint is not on the tip of curve for this system as happens in case for traditional MPPTs) asit is dependent on operating region of electrolyzer as shown in Table 2. So it is determiningthe maximum operating point of electrolyzer from available PV power.
Sustainability 2021, 13, x 12 of 17
Figure 9. Cont.

Sustainability 2021, 13, 12110 12 of 16Sustainability 2021, 13, x 13 of 17
Figure 9. Cont.

Sustainability 2021, 13, 12110 13 of 16Sustainability 2021, 13, x 14 of 17
Figure 9. VI and Power curves of Solar PV and Electrolyzer under test: (a) 1200 W/m2; (b) 1000 W/m2; (c) 800 W/m2; (d) 600 W/m2; (e) 400 W/m2; (f) 200 W/m2.
To see the effect of changing irradiance on runtime and tracking of maximum pow-er, the test rig was allowed to run for 20 min while the irradiance was changed by changing the intensity of the bulbs. The intensity was thus gradually changed from 1200 W/m2 to 200 W/m2. This tracking power can be analyzed from Figure 10.
From Figure 9 it can be seen that after a certain irradiance (in the experiment it was below 200 W/m2) the PV panel is not able to provide enough power for the electrolyzer to be in the operating region (the non-operating region is shown by shading). The same can be seen for higher irradiance, even though at 1200 W/m2 more power was available for the electrolyzer and the convertor was keeping the electrolyzer in its region of operation (i-e 10.8–13.2 Volts and 15 Amps).
It was investigated that at lower irradiance, the convertor was working at high duty regardless of the power of the PV in order to maintain the operating range of the voltages for the electrolyzer to work. At low irradiance, Vpv becomes so low that even at high duty, VELE does not remain in the operating range. This can be mathematically seen by using Equation (2). In this non-operating region the duty of the convertor was fully increased up to 90%. This situation makes it difficult and very slow for the convertor to reduce the duty when the irradiance is again high after a low irradiance period. This is because of the slow response nature of the alkaline electrolyzer. This means that lower duty is more beneficial for the efficiency of the PV-ELE system.
Finally, a test of four hours under Sun irradiance was performed to see the behavior of the convertor and electrolyzer due to intermittency. The power of the PV system was recorded for each interval of time depending upon the intermittent nature of solar irra-diance along with the power delivered to the electrolyzer due to convertor keeping the electrolyzer in its operating region. From Figure 11, it can be seen that the convertor is tracking and delivering the maximum power available in the PV system by keeping itself in the operating region of the electrolyzer. It was also concluded that at some instants not enough power is available from the PV system to energize the electrolyzer so in that in-stance the electrolyzer is not in its operating region and hence no HHO is produced.
Figure 9. VI and Power curves of Solar PV and Electrolyzer under test: (a) 1200 W/m2; (b) 1000 W/m2; (c) 800 W/m2;(d) 600 W/m2; (e) 400 W/m2; (f) 200 W/m2.
After 200 W/m2 of irradiance, the PV system was unable to provide enough power forkeep the electrolyzer working in its operating region. Although at this level of irradiance,the DC-DC convertor tries to keep the electrolyzer operating, the electrolyzer does notoperate (Figure 9f(i)) shows that less than 10.7 Volts are available for electrolyzer).
To see the effect of changing irradiance on runtime and tracking of maximum power,the test rig was allowed to run for 20 min while the irradiance was changed by changingthe intensity of the bulbs. The intensity was thus gradually changed from 1200 W/m2 to200 W/m2. This tracking power can be analyzed from Figure 10.
Sustainability 2021, 13, x 15 of 17
Figure 10. Voltage (left) and current (right) power; measured for PV and Electrolyzer in a 30mins continuous test (results from the indoor test rig). The shaded region shows the non-operating region of the electrolyzer.
Figure 11. Delivery of the maximum available power from PV to the electrolyzer by tracking the power while keeping the electrolyzer in its operating region (4 h under actual Sun irradiance).
4. Conclusions This study helped determine an approach to use solar energy independently to
power an electrolyzer with PV. It was seen that it is important to operate the electrolyzer in its operating region. The strategy of the convertor that was used in this study was successfully established with 94% efficiency by considering two objectives: (i) working of the electrolyzer in its operating region, (ii) delivering the maximum available power of the PV system to the electrolyzer directly by tracking the maximum power of the PV. It was seen that this strategy works in achieving these objectives. It was further explored that due to the slow response nature of alkaline electrolyzers it makes the convertor slow while the tracking power is in a high intermittency situation as it increases the duty to a high level. It was established that duty of the DC-DC convertor plays a crucial role for the system. It was further recommended that increasing in number of PV panels can help in lowering the optimized duty necessary for tracking the maximum power during high intermittency periods by keeping the electrolyzer in its operating region. Another solu-
Figure 10. Voltage (left) and current (right) power; measured for PV and Electrolyzer in a 30mins continuous test (resultsfrom the indoor test rig). The shaded region shows the non-operating region of the electrolyzer.
From Figure 9 it can be seen that after a certain irradiance (in the experiment it wasbelow 200 W/m2) the PV panel is not able to provide enough power for the electrolyzer tobe in the operating region (the non-operating region is shown by shading). The same canbe seen for higher irradiance, even though at 1200 W/m2 more power was available for theelectrolyzer and the convertor was keeping the electrolyzer in its region of operation (i-e10.8–13.2 Volts and 15 Amps).
It was investigated that at lower irradiance, the convertor was working at high dutyregardless of the power of the PV in order to maintain the operating range of the voltagesfor the electrolyzer to work. At low irradiance, Vpv becomes so low that even at high duty,VELE does not remain in the operating range. This can be mathematically seen by usingEquation (2). In this non-operating region the duty of the convertor was fully increased upto 90%. This situation makes it difficult and very slow for the convertor to reduce the duty

Sustainability 2021, 13, 12110 14 of 16
when the irradiance is again high after a low irradiance period. This is because of the slowresponse nature of the alkaline electrolyzer. This means that lower duty is more beneficialfor the efficiency of the PV-ELE system.
Finally, a test of four hours under Sun irradiance was performed to see the behaviorof the convertor and electrolyzer due to intermittency. The power of the PV systemwas recorded for each interval of time depending upon the intermittent nature of solarirradiance along with the power delivered to the electrolyzer due to convertor keepingthe electrolyzer in its operating region. From Figure 11, it can be seen that the convertoris tracking and delivering the maximum power available in the PV system by keepingitself in the operating region of the electrolyzer. It was also concluded that at some instantsnot enough power is available from the PV system to energize the electrolyzer so in thatinstance the electrolyzer is not in its operating region and hence no HHO is produced.
Sustainability 2021, 13, x 15 of 17
Figure 10. Voltage (left) and current (right) power; measured for PV and Electrolyzer in a 30mins continuous test (results from the indoor test rig). The shaded region shows the non-operating region of the electrolyzer.
Figure 11. Delivery of the maximum available power from PV to the electrolyzer by tracking the power while keeping the electrolyzer in its operating region (4 h under actual Sun irradiance).
4. Conclusions This study helped determine an approach to use solar energy independently to
power an electrolyzer with PV. It was seen that it is important to operate the electrolyzer in its operating region. The strategy of the convertor that was used in this study was successfully established with 94% efficiency by considering two objectives: (i) working of the electrolyzer in its operating region, (ii) delivering the maximum available power of the PV system to the electrolyzer directly by tracking the maximum power of the PV. It was seen that this strategy works in achieving these objectives. It was further explored that due to the slow response nature of alkaline electrolyzers it makes the convertor slow while the tracking power is in a high intermittency situation as it increases the duty to a high level. It was established that duty of the DC-DC convertor plays a crucial role for the system. It was further recommended that increasing in number of PV panels can help in lowering the optimized duty necessary for tracking the maximum power during high intermittency periods by keeping the electrolyzer in its operating region. Another solu-
Figure 11. Delivery of the maximum available power from PV to the electrolyzer by tracking thepower while keeping the electrolyzer in its operating region (4 h under actual Sun irradiance).
4. Conclusions
This study helped determine an approach to use solar energy independently to poweran electrolyzer with PV. It was seen that it is important to operate the electrolyzer in itsoperating region. The strategy of the convertor that was used in this study was success-fully established with 94% efficiency by considering two objectives: (i) working of theelectrolyzer in its operating region, (ii) delivering the maximum available power of the PVsystem to the electrolyzer directly by tracking the maximum power of the PV. It was seenthat this strategy works in achieving these objectives. It was further explored that due tothe slow response nature of alkaline electrolyzers it makes the convertor slow while thetracking power is in a high intermittency situation as it increases the duty to a high level. Itwas established that duty of the DC-DC convertor plays a crucial role for the system. Itwas further recommended that increasing in number of PV panels can help in loweringthe optimized duty necessary for tracking the maximum power during high intermittencyperiods by keeping the electrolyzer in its operating region. Another solution is to use ahybrid system which includea a battery to account for this intermittency effect.
Author Contributions: Conceptualization, N.A.R.; Data curation, O.M.B.; Funding acquisition, T.S.;Investigation, U.M.; Methodology, M.S.A.; Project administration, H.E.; Resources, U.G.; Software,H.S.C.; Supervision, N.A.R.; Validation, H.S.C.; Visualization, U.G.; Writing—original draft, O.M.B.;Writing—review & editing, U.G. and M.S.A. All authors have read and agreed to the publishedversion of the manuscript.

Sustainability 2021, 13, 12110 15 of 16
Funding: The authors thank the financial support from InnovateUM and UM Power Energy Dedi-cated Advanced Centre (UMPEDAC), the Higher Institution Centre of Excellence (HICoE) ProgramResearch Grant, UMPEDAC-2020 (MOHE HICOE-UMPEDAC), Ministry of Education Malaysia,TOP100UMPEDAC, RU003-2020, University of Malaya.
Data Availability Statement: The prepared samples to support the findings of this study are availablefrom the corresponding authors upon reasonable request.
Acknowledgments: The authors thank the technical and financial assistance of InnovateUM andUM Power Energy Dedicated Advanced Centre (UMPEDAC), the Higher Institution Centre of Excel-lence (HICoE) Program Research Grant, UMPEDAC-2020 (MOHE HICOE-UMPEDAC), Ministry ofEducation Malaysia, TOP100UMPEDAC, RU003-2020, University of Malaya.
Conflicts of Interest: The authors declare no conflict of interest.
References1. Manieniyan, V.; Thambidurai, M.; Selvakumar, R. Study on energy crisis and the future of fossil fuels. Proc. SHEE 2009, 10,
2234–3689.2. Fayaz, H.; Ahmad, M.S.; Pandey, A.; Abd Rahim, N.; Tyagi, V. A Novel nanodiamond/Zinc nanocomposite as potential counter
electrode for flexible dye sensitized solar cell. Sol. Energy 2020, 197, 1–5. [CrossRef]3. Höök, M.; Tang, X. Depletion of fossil fuels and anthropogenic climate change—A review. Energy Policy 2013, 52, 797–809.
[CrossRef]4. Watany, M. Variability in vehicle’exhaust emissions and fuel consumption in urban driving pattern. Am. J. Veh. Des. 2015, 3,
31–38.5. Butt, O.M.; Ahmad, M.S.; Che, H.S.; Abd Rahim, N. Design of a small scale fluidized-bed incinerator for MSW with ability to
utilize HHO as auxiliary fuel. IOP Conf. Ser. Mater. Sci. Eng. 2021, 1127, 012040. [CrossRef]6. Butt, O.M.; Ahmad, M.S.; Che, H.S.; Rahim, N.A. Usage of on-demand oxyhydrogen gas as clean/renewable fuel for combustion
applications: A review. Int. J. Green Energy 2021, 18, 1–25. [CrossRef]7. Uludamar, E.; Tosun, E.; Tüccar, G.; Yıldızhan, S.; Çalık, A.; Yıldırım, S.; Serin, H.; Özcanlı, M. Evaluation of vibration
characteristics of a hydroxyl (HHO) gas generator installed diesel engine fuelled with different diesel–biodiesel blends. Int. J.Hydrogen Energy 2017, 42, 23352–23360. [CrossRef]
8. Ozcanli, M.; Akar, M.A.; Calik, A.; Serin, H. Using HHO (Hydroxy) and hydrogen enriched castor oil biodiesel in compressionignition engine. Int. J. Hydrogen Energy 2017, 42, 23366–23372. [CrossRef]
9. Park, K.-H.; Kim, J.-Y.; Kim, C.-J.; Lee, E.-J.; Son, K.; Park, S.-H. The effect of hho gas on the performance of industrial dieselengine using biodiesel blended fuel. J. Korean Soc. Mar. Eng. 2011, 35, 1022–1027. [CrossRef]
10. Thangaraj, S.; Govindan, N. Evaluating combustion, performance and emission characteristics of diesel engine using karanja oilmethyl ester biodiesel blends enriched with HHO gas. Int. J. Hydrogen Energy 2018, 43, 6443–6455. [CrossRef]
11. Krishna, V.M. Emissions control and performance evaluation of spark ignition engine with oxy-hydrogen blending. Int. J. HeatTechnol. 2018, 36, 118–124. [CrossRef]
12. Sharma, D.; Pathak, D.K.; Chhikara, K. Performance analysis of a four stroke multi-cylinder spark ignition engine powered by ahydroxy gas booster. J. Aeronaut. Automot. Eng. 2015, 2, 11–15.
13. Bhardwaj, S.; Verma, A.S.; Sharma, S.K. Effect of Brown gas on the performance of a four stroke gasoline engine. Int. J. Emerg.Technol. Adv. Eng. 2014, 4, 300–307.
14. Klein, D.J. Thermal Spray Coating Processes Using HHO Gas Generated from an Electrolyzer Generator. U.S. PatentUS20080038478A1, 7 May 2008.
15. Sahin, M.E.; Okumus, H.I.; Aydemir, M.T. Implementation of an electrolysis system with DC/DC synchronous buck converter.Int. J. Hydrogen Energy 2014, 39, 6802–6812. [CrossRef]
16. Sudarmanta, B.; Darsopuspito, S.; Sungkono, D. Application of dry cell HHO gas generator with pulse width modulation onsinjai spark ignition engine performance. Int. J. Res. Eng. Technol. 2016, 5, 105–112.
17. El Kady, M.; Farrag, A.E.F.; Gad, M.; El Soly, A.; Hashish, H.A. Parametric study and experimental investigation of hydroxy(HHO) production using dry cell. Fuel 2020, 282, 118825. [CrossRef]
18. Jegha, A.; Subathra, M.; Kumar, N.M.; Ghosh, A. Optimally Tuned Interleaved Luo Converter for PV Array Fed BLDC MotorDriven Centrifugal Pumps Using Whale Optimization Algorithm—A Resilient Solution for Powering Agricultural Loads.Electronics 2020, 9, 1445. [CrossRef]
19. Ba, A.; Aroudam, E.; Chighali, O.E.; Hamdoun, O.; Mohamed, M.L. Performance optimization of the PV pumping system.Procedia Manuf. 2018, 22, 788–795. [CrossRef]
20. Niaz, H.; Lakouraj, M.M.; Liu, J. Techno-economic feasibility evaluation of a standalone solar-powered alkaline water electrolyzerconsidering the influence of battery energy storage system: A Korean case study. Korean J. Chem. Eng. 2021, 38, 1–14. [CrossRef]
21. Arat, H.T.; Baltacioglu, M.K.; Özcanli, M.; Aydin, K. Effect of using Hydroxy–CNG fuel mixtures in a non-modified diesel engineby substitution of diesel fuel. Int. J. Hydrogen Energy 2016, 41, 8354–8363. [CrossRef]

Sustainability 2021, 13, 12110 16 of 16
22. Baltacioglu, M.K.; Arat, H.T.; Özcanli, M.; Aydin, K. Experimental comparison of pure hydrogen and HHO (hydroxy) enrichedbiodiesel (B10) fuel in a commercial diesel engine. Int. J. Hydrogen Energy 2016, 41, 8347–8353. [CrossRef]
23. Kumar, S.S.; Kumar, K.S. Optimization and Control of Fuel by Producing Brown Gas by HHO Generating Device Controlled byVHDL and Implementing In FPGA. Int. J. Mech. Eng. Robot. Res. 2015, 4, 154.
24. Kumar, K.P.; Arora, N.S.; Mahesh, M. Development of constant current power system for hho cell operations to reduce fuelconsumption. In Proceedings of the 2016 IEEE International Power Electronics and Motion Control Conference (PEMC), Varna,Bulgaria, 25–28 September 2016; pp. 273–279.
25. Worawat, S.-N.; AURASOPON, A. Application of microcontroller for controlling HHO dry cell in small trucks. Mahasarakham Int.J. Eng. Technol. 2015, 1, 10–13.
26. Butt, O.M.; Aslam, A.N.; Muazzam, H. DESIGN OF AN AC VOLTAGE STABILIZER BY USING INSULATED GATE BIPOLARTRANSISTORS. J. Fac. Eng. Technol. 2015, 22, 45–50.
27. Butt, O.; Ahmed, M. Alternating Current Voltage Stabilizer by Using Pulse Width Modulation. Int. J. Sci. Eng. Res. 2014, 5, 928–931.Available online: https://www.ijser.org/paper/Alternating-Current-Voltage-Stabilizer-by-Using-Pulse-Width-Modulation.html(accessed on 31 September 2021).
28. Sriramagiri, G.M.; Luc, W.; Jiao, F.; Ayers, K.; Dobson, K.D.; Hegedus, S.S. Computation and assessment of solar electrolyzer fieldperformance: Comparing coupling strategies. Sustain. Energy Fuels 2019, 3, 422–430. [CrossRef]
29. Tabanjat, A.; Becherif, M.; Emziane, M.; Hissel, D.; Ramadan, H.; Mahmah, B. Fuzzy logic-based water heating controlmethodology for the efficiency enhancement of hybrid PV–PEM electrolyser systems. Int. J. Hydrogen Energy 2015, 40, 2149–2161.[CrossRef]
30. Özgirgin, E.; Devrim, Y.; Albostan, A. Modeling and simulation of a hybrid photovoltaic (PV) module-electrolyzer-PEM fuel cellsystem for micro-cogeneration applications. Int. J. Hydrogen Energy 2015, 40, 15336–15342. [CrossRef]
31. Becherif, M.; Ramadan, H.; Cabaret, K.; Picard, F.; Simoncini, N.; Béthoux, O. Hydrogen energy storage: New techno-economicemergence solution analysis. Energy Procedia 2015, 74, 371–380. [CrossRef]
32. Blinov, A.; Andrijanovits, A. New DC/DC converter for electrolyser interfacing with stand-alone renewable energy system. Electr.Control Commun. Eng. 2012, 1, 24–29. [CrossRef]
33. Guilbert, D.; Collura, S.M.; Scipioni, A. DC/DC converter topologies for electrolyzers: State-of-the-art and remaining key issues.Int. J. Hydrogen Energy 2017, 42, 23966–23985. [CrossRef]
34. Guilbert, D.; N’Diaye, A.; Luberda, P.; Djerdir, A. Fuel cell lifespan optimization by developing a power switch fault-tolerantcontrol in a floating interleaved boost converter. Fuel Cells 2017, 17, 196–209. [CrossRef]
35. Garland, N.L. US Department of Energy Fuel Cell Technologies Program. In Proceedings of the 18th World Hydrogen EnergyConference 2010–WHEC 2010 Proceedings Speeches and Plenary Talks, Essen, Germany, 16–20 May 2010.
36. Kolli, A.; Gaillard, A.; De Bernardinis, A.; Bethoux, O.; Hissel, D.; Khatir, Z. A review on DC/DC converter architectures forpower fuel cell applications. Energy Convers. Manag. 2015, 105, 716–730. [CrossRef]
37. Subramani, V.; Basile, A.; Veziroglu, T.N. Compendium of Hydrogen Energy: Hydrogen Production and Purification; WoodheadPublishing: Sawston, UK, 2015.
Related Documents