1991, 57(4):910. Appl. Environ. Microbiol. G L Kleman, J J Chalmers, G W Luli and W R Strohl fed-batch fermentations. maintains a constant glucose concentration in A predictive and feedback control algorithm http://aem.asm.org/content/57/4/910 Updated information and services can be found at: These include: CONTENT ALERTS more» cite this article), Receive: RSS Feeds, eTOCs, free email alerts (when new articles http://journals.asm.org/site/misc/reprints.xhtml Information about commercial reprint orders: http://journals.asm.org/site/subscriptions/ To subscribe to to another ASM Journal go to: on October 10, 2014 by guest http://aem.asm.org/ Downloaded from on October 10, 2014 by guest http://aem.asm.org/ Downloaded from

Welcome message from author
This document is posted to help you gain knowledge. Please leave a comment to let me know what you think about it! Share it to your friends and learn new things together.
Transcript
1991, 57(4):910. Appl. Environ. Microbiol.
G L Kleman, J J Chalmers, G W Luli and W R Strohl fed-batch fermentations.maintains a constant glucose concentration in A predictive and feedback control algorithm
http://aem.asm.org/content/57/4/910Updated information and services can be found at:
These include:
CONTENT ALERTS more»cite this article),
Receive: RSS Feeds, eTOCs, free email alerts (when new articles
http://journals.asm.org/site/misc/reprints.xhtmlInformation about commercial reprint orders: http://journals.asm.org/site/subscriptions/To subscribe to to another ASM Journal go to:
on October 10, 2014 by guest
http://aem.asm
.org/D
ownloaded from
on O
ctober 10, 2014 by guesthttp://aem
.asm.org/
Dow
nloaded from
Vol. 57, No. 4APPLIED AND ENVIRONMENTAL MICROBIOLOGY, Apr. 1991, p. 910-9170099-2240/91/040910-08$02.00/0Copyright © 1991, American Society for Microbiology
A Predictive and Feedback Control Algorithm Maintains a ConstantGlucose Concentration in Fed-Batch Fermentations
GARY L. KLEMAN,1 JEFFREY J. CHALMERS,2 GREGORY W. LULI,lt AND WILLIAM R. STROHL1*Departments of Microbiology' and Chemical Engineering,2 The Ohio State University, Columbus, Ohio 43210
Received 21 September 1990/Accepted 18 January 1991
A combined predictive and feedback control algorithm based on measurements of the concentration ofglucose on-line has been developed to control fed-batch fermentations of Escherichia coli. The predictivecontrol algorithm was based on the on-line calculation of glucose demand by the culture and plotting a linearregression to the next datum point to obtain a predicted glucose demand. This provided a predictive "coarse"control for the glucose-based nutrient feed. A direct feedback control using a proportional controller, based onglucose measurements every 2 min, fine-tuned the feed rate. These combined control schemes were used tomaintain glucose concentrations in fed-batch fermentations as tight as 0.49 0.04 g/liter during growth of E.coli to high cell densities.
Fed-batch fermentation is commonly used to obtain highcell densities and/or maximal product formation (21, 41). Theoptimal strategy for the fed-batch fermentation of mostorganisms is to feed the growth-limiting substrate at thesame rate that the organism utilizes the substrate, i.e., tomatch the feed rate with demand for the substrate (25). Thisis important, since an accumulation of substrate due tounbalanced feeding can be toxic to the organisms (5), cancause the formation of inhibitory by-products (13, 15, 26,32), and can inhibit recombinant DNA (rDNA) productformation (2, 9, 16, 19). Four basic approaches have beenused in attempts to balance substrate feed with demand(listed in order of increasing accuracy and/or complexity): (i)open-loop control schemes in which feeds were addedaccording to historical data (34, 41, 43) or predicted growth(25); (ii) indirect control of substrate feeds based on non-feedsource parameters (e.g., pH [28, 36, 37], offgas CO2 [35, 37],dissolved 02 [7, 23, 31, 42]) including concentrations oforganic products (e.g., ethanol [4, 40], acetone, and butanol[17]); (iii) indirect control schemes based on mass balanceequations (24), the values of which are calculated from dataobtained by gateway sensors; and (iv) control schemes basedon direct, on-line measurements of organic (3, 8, 14) ornitrogen (12, 38) substrate concentrations. A major limita-tion is that most of the current control strategies used and/orproposed, which are based on on-line measurements, re-spond only to a current change in the measured variable;they do not predict future changes in the substrate demand.This limitation can be particularly detrimental to fed-batchcultures, in which an exponential increase in substratedemand with time is present.We have recently described the construction and use of a
glucose feedback control system (14) which was used togrow several Escherichia coli strains to high cell densities infed-batch fermentation cultures while maintaining relativelylow glucose concentrations (15). This system, however, wasnot sufficiently robust to control glucose concentrationsconsistently at the desired levels. Here we describe thedevelopment of a remarkably simple, two-component con-trol scheme which predicts future glucose demands (GD) on
* Corresponding author.t Present address: Microlife Technics, Inc., Sarasota, FL 34230.
the basis of recent rates of glucose consumed by the culture(feed-forward component), and corrects for minor offsets(feedback component). This control scheme has been usedto grow E. coli from 1 to 65 g/liter while maintaining thesoluble glucose concentration as tight as 0.49 ± 0.04 g/literduring the entire growth period. In an accompanying paper,we explain how we have adapted this control scheme for usewith continuous, glucose-controlled nutristat cultures (11).
MATERIALS AND METHODS
Organism and inoculum preparation. E. coli B was ob-tained from the Ohio State University Culture Collection(OSU 333) and was maintained as slant cultures at 4°Cbetween experiments. E. coli B was grown at 30°C for 48 hon Trypticase soy agar plates. The seed cultures, consistingof 400 ml of Trypticase soy broth, were inoculated from theTrypticase soy agar plates and incubated for 18 h at 32°C at150 rpm on a rotary shaker.Fed-batch fermentation medium. The base fermentation
medium (7.0 liters) consisted of the following (in grams perliter) casein hydrolysate (Delltown CE9OM), 40; KH2PO4,7.5; Na2HPO4, 7.5; and K2SO4, 0.85. Mazu DF-60P antifoam(Mazer Chemicals, Gurnee, Ill.) was used at 0.625 ml.liter-'. The following nutrients (in grams per liter) wereautoclaved separately in a volume of 100 ml and addedto the fermentation base medium after cooling: MgSO47H20, 0.17; glucose, 0.5; trace elements solution, 0.8 mlliter-'. The trace elements solution was modified fromthat described by Pan et al. (26) and contained (in grams perliter of 5 N HCl) FeSO4 7H20, 40; MnSO4 H20, 10;AlSO4. 18H20, 28.25; CoCl2. 6H20, 4; ZnSO4 7H20, 2;Na2MoO4 H20, 2; CuCl2 - 2H20, 1; and H3BO4, 0.5. Thefinal volume of the initial medium was 7.5 liters (7.0 liters ofbase medium, 0.1 liter of glucose-salts solution, and 0.4 literof inoculum).Four feed solutions were used for fed-batch fermentation:
(i) 2.0-liter solution of glucose (35 g - liter-'); (ii) 1.5-litersolution of glucose (250 g- liter-') and MgSO4 7H20 (0.85g liter-'); (iii) 2.0-liter solution of glucose (780 g liter-1)and MgSO4. 7H20 (8.58 g liter-'); and (iv) 1.0-liter solu-tion of casein hydrolysate (400 g. liter-') and trace elements(32 ml liter-'). The flow rates of the different feed pumpswere considered when determining the glucose concentra-
910
on October 10, 2014 by guest
http://aem.asm
.org/D
ownloaded from
GLUCOSE-CONTROLLED FED-BATCH FERMENTATION
tions of the feeds. The system is able to deliver glucose tothe vessel over a wide range of rates, from approximately 0.5to 700 g of glucose per h.The feed solutions were aseptically added to the fermentor
by three different pumps, each controlled separately by thecomputer-ISAAC system (34) using a 4- to 20-mA RCA plug.Feed solutions i and ii were added separately by Cole-Parmer (model 7534-30) pumps (model 7013 pump head),whereas a single Cole-Parmer (model 7520-25) pumpequipped with model 7013 and 7014 pump heads was used forfeeds iii and iv, respectively. The pumps were calibratedbefore each run by pumping the feed into a sterile 1-literErlenmeyer flask placed on a Mettler PJ6000 balance (14,15). The change of weight over time determined the flow ratefor each setting. A linear regression was performed on thecalibrations to obtain a slope and intercept for the feed rate,and this information was entered into the computer todetermine the needed electrical output for the calculatedfeed rate. When calibrating the pump for feed iii, the weightwas divided by 1.2 as a correction factor for the density of a78% glucose solution.
Fermentation setup. The fermentation hardware (34) andgeneral on-line glucose measurement procedures (14) havebeen described previously. To shorten the lag time betweenthe glucose analyzer and the sampling stream, the methodfor obtaining a clean stream from the Megaflow TM100tangential-flow filter was modified from the previously de-scribed procedure (14). A hole was cut in the filtrate tubeapproximately 8 cm from the filter assembly, and the model7014-13 tubing (Cole-Parmer) was inserted to run up to thefilter plate within the filtrate tube. The hole with the model7014-13 tubing was sealed with silicone glue. The number ofstrokes of the glucose analyzer sample pump per minute wasset so that the glucose sample was taken directly from thefilter plate. The response time of this modified system wasfound to be less than 1 min (data not shown). The filtrationmembrane used in the Megaflow was a Millipore GVLPOHV 0.22-jm-pore-size filter cut to fit the Megaflow design.The on-line glucose analysis system, which used a proto-
type YSI 2000 glucose analyzer (YSI, Inc., Yellow Springs,Ohio) and an Apple Ile computer linked with an ISAAC-91AA/D-D/A convertor, has been described by Luli et al. (14).Concentrations of 2 and 7 g of glucose liter-' were used forstandardization of the on-line system for fermentations con-trolled at 0.5 and 5.0 g of glucose liter-', respectively. Thedissolved oxygen was monitored by a Braun MRR-1 dis-solved oxygen meter and an Ingold polarographic oxygenprobe. The dissolved 02 was kept at the desired level (70%)by adding pure oxygen while decreasing the amount of air tokeep the total gas flow rate at 10 liters min-1. When theoxygen demand required that more than 10 liters of pureoxygen. min-1 be added, the total gas flow (of pure oxygen)was increased according to the demand until it reached 20liters min-'. The pH was controlled at 7.0 by using aHorizon Ecology Co. pH controller (model 5997) with asterile 4 M NH40H solution.
Control scheme. The control scheme consists of two parts:a feed-forward component which is a "coarse controller"that predicts the future GD and a feed-back componentwhich corrects for minor errors in the predicted GD (fine-tuning of the controller). Both components are based onon-line glucose concentration measurements taken at 2-minintervals.
Since a bacterial fed-batch culture is by definition anon-steady-state process, the rate of glucose consumptionby the culture (GD) will be an exponentially increasing
-
E
-j0
az
wawCn00-J0
0.07
0.06
0.05
0.04 _60 65 70 75 80
TIME (min)
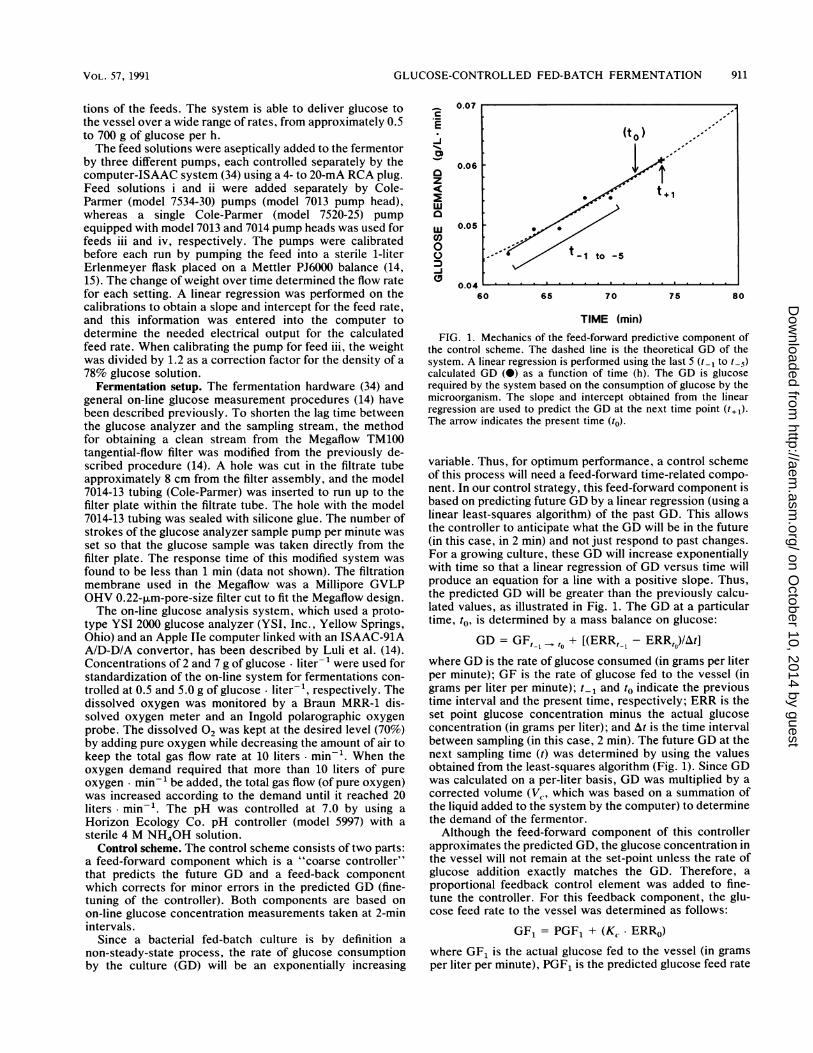
FIG. 1. Mechanics of the feed-forward predictive component ofthe control scheme. The dashed line is the theoretical GD of thesystem. A linear regression is performed using the last 5 (t_1 to t-5)calculated GD (0) as a function of time (h). The GD is glucoserequired by the system based on the consumption of glucose by themicroorganism. The slope and intercept obtained from the linearregression are used to predict the GD at the next time point (t,l).The arrow indicates the present time (to).
variable. Thus, for optimum performance, a control schemeof this process will need a feed-forward time-related compo-nent. In our control strategy, this feed-forward component isbased on predicting future GD by a linear regression (using alinear least-squares algorithm) of the past GD. This allowsthe controller to anticipate what the GD will be in the future(in this case, in 2 min) and not just respond to past changes.For a growing culture, these GD will increase exponentiallywith time so that a linear regression of GD versus time willproduce an equation for a line with a positive slope. Thus,the predicted GD will be greater than the previously calcu-lated values, as illustrated in Fig. 1. The GD at a particulartime, to, is determined by a mass balance on glucose:
GD = GF,, ,t + [(ERR, 1 - ERR,o)/At]where GD is the rate of glucose consumed (in grams per literper minute); GF is the rate of glucose fed to the vessel (ingrams per liter per minute); t1, and to indicate the previoustime interval and the present time, respectively; ERR is theset point glucose concentration minus the actual glucoseconcentration (in grams per liter); and At is the time intervalbetween sampling (in this case, 2 min). The future GD at thenext sampling time (t) was determined by using the valuesobtained from the least-squares algorithm (Fig. 1). Since GDwas calculated on a per-liter basis, GD was multiplied by acorrected volume (Vl, which was based on a summation ofthe liquid added to the system by the computer) to determinethe demand of the fermentor.
Although the feed-forward component of this controllerapproximates the predicted GD, the glucose concentration inthe vessel will not remain at the set-point unless the rate ofglucose addition exactly matches the GD. Therefore, aproportional feedback control element was added to fine-tune the controller. For this feedback component, the glu-cose feed rate to the vessel was determined as follows:
GF1 = PGF1 + (Kc.. ERRo)where GF1 is the actual glucose fed to the vessel (in gramsper liter per minute), PGF1 is the predicted glucose feed rate
911VOL. 57, 1991
on October 10, 2014 by guest
http://aem.asm
.org/D
ownloaded from
912 KLEMAN ET AL.
(i.e., expected requirement for the next datum point; ingrams per liter per minute), based on the linear regression,Kc is the proportional constant, and ERR represents the setpoint glucose concentration minus the actual glucose con-
centration. The combination of these two components yieldsa type of control which essentially is a feedback proportionalcontrol around a moving feed rate set point in which the setpoint is changed to the predicted value from the linearregression of the last five calculated GD datum points.Computer simulations to optimize adaptive control algo-
rithm. To optimize this control scheme, i.e., to adjust thegain on the proportional constant (K,.) and to determine thenumber of datum points used for the linear regression (N),computer simulations were conducted with the control algo-rithm. The simulation is based on a basic exponential in-crease of the dry cell weight (DCW) calculated every 2 min.The theoretical GD is based on a constant yield of biomassfrom glucose. The glucose concentration is determined bycomparing the theoretical GD with the amount of glucose fedover the last 2 min. The error that was normally observedwith the glucose analyzer, i.e., random errors of up to ±0.02g of glucose. liter-' were added to the simulated on-lineglucose concentrations. With these assumptions in mind, weperformed the simulations by using the control schemeoutlined above. In addition, the actual delay experimentallyobserved between the sampling point and the time at whichthe calculation was made (ca. 2 min) was included in thesimulation. Various values for specific growth rate (p. [perhour]) and cell yield (Yg; grams [DCW] per gram of glucoseutilized) were considered during the preliminary stages ofthis optimization process. It was assumed, however, thatthese values were constant during a particular simulatedfermentation.
Culture analyses. Cell growth was monitored during thefermentations by measuring culture turbidity with a Klett-Summerson colorimeter using a red filter. DCW was deter-mined by removing 20-ml samples from the culture andpelleting the organisms by centrifugation at 10,000 x g for 10min. The resulting pellets were washed twice with 20 ml ofdistilled water and repelleted each time as just described.The final pellets were resuspended in 10 ml of distilled waterand poured into preweighed aluminum pans. These panswere then baked at 80°C for 24 h and weighed. All biomassmeasurements described in this study were the result ofdirect measurement of DCW (i.e., not derived from conver-
sions from turbidity data). Off-line glucose concentrationswere determined by using a YSI model 2000 glucose ana-
lyzer. Acetate concentrations of the culture broth were
determined by high-pressure liquid chromatography as de-scribed by Luli and Strohl (15).
RESULTS AND DISCUSSION
Construction of predictive control algorithm governinggross glucose concentration. We have previously used a
scheduled feed-forward coupled with a glucose feedbackcontrol system (14) to grow several E. coli strains to high celldensities in fed-batch fermentation cultures (15). This con-
trol algorithm, however, was unable to adjust rapidly enoughto dynamic changes in rapidly growing cultures to maintainthe desired control of glucose concentration. The predictivecontrol algorithm described herein solves this problem.A computer simulation was run with the control algorithm
to optimize the number of calculated GD datum points to beincluded in the linear regression (N,) and the value of theproportional constant (Kc). In this simulation, the following
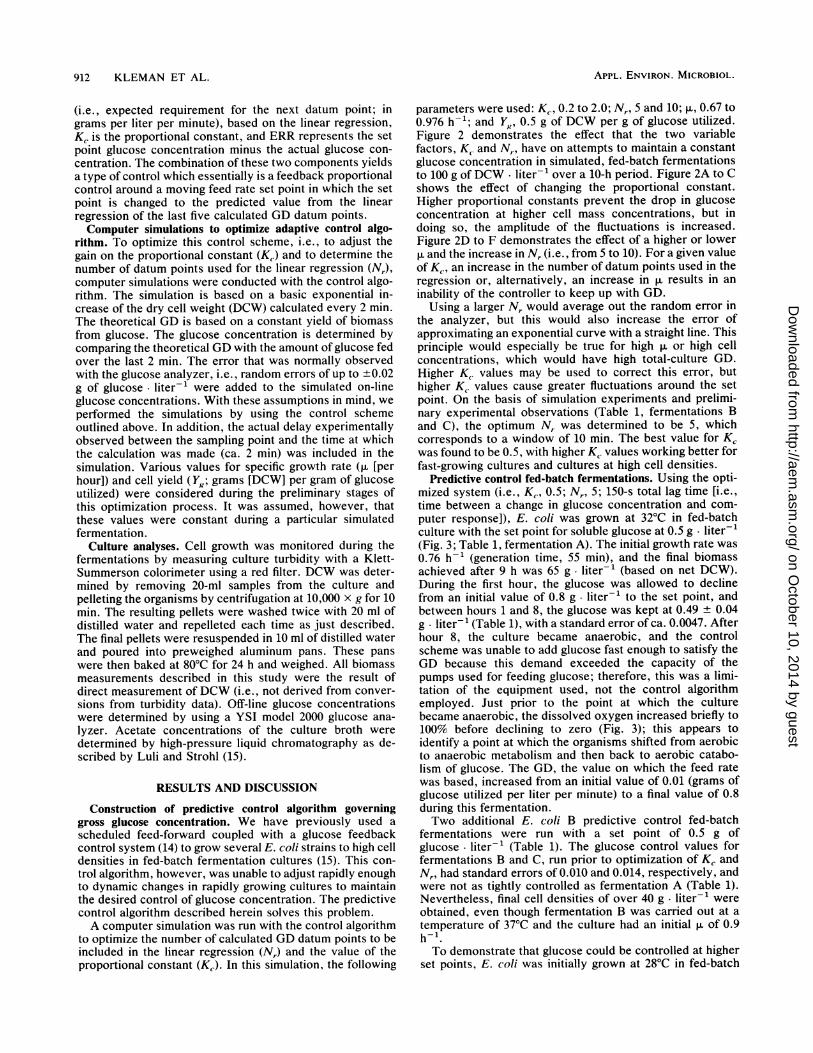
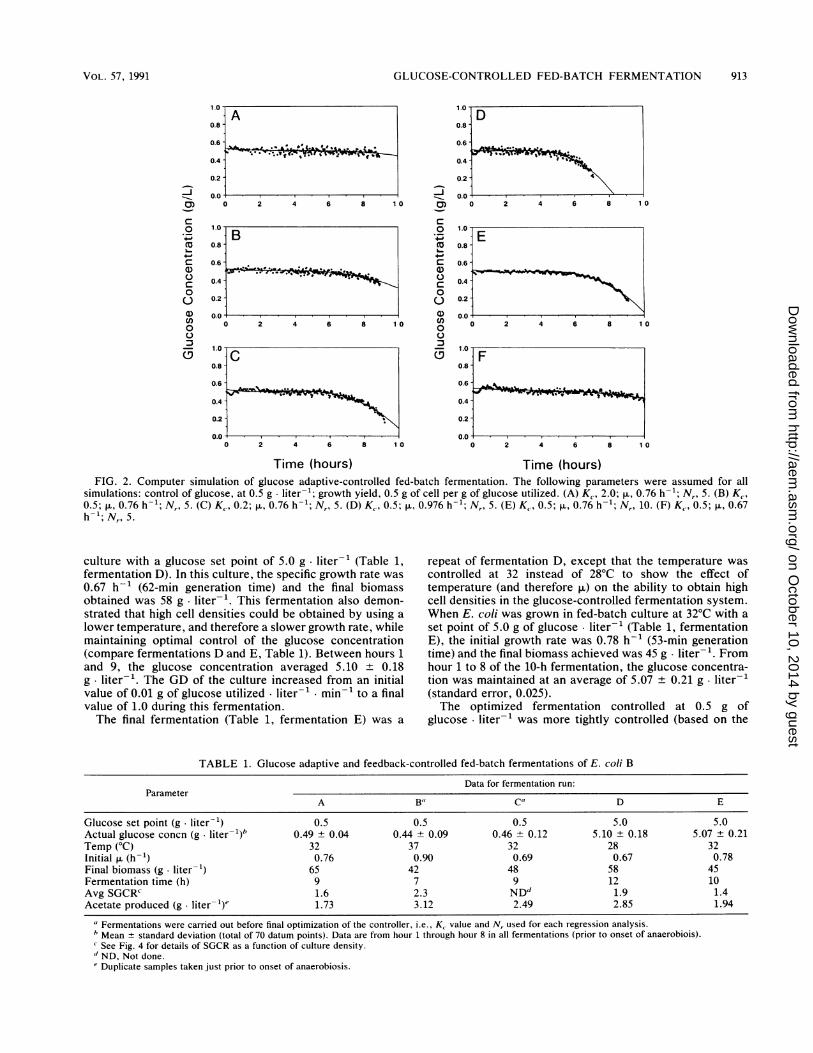
parameters were used: K., 0.2 to 2.0; Nr, 5 and 10; p., 0.67 to0.976 h-i; and Y,, 0.5 g of DCW per g of glucose utilized.Figure 2 demonstrates the effect that the two variablefactors, Kc and Nr, have on attempts to maintain a constantglucose concentration in simulated, fed-batch fermentationsto 100 g of DCW liter-1 over a 10-h period. Figure 2A to Cshows the effect of changing the proportional constant.Higher proportional constants prevent the drop in glucoseconcentration at higher cell mass concentrations, but indoing so, the amplitude of the fluctuations is increased.Figure 2D to F demonstrates the effect of a higher or lowerp. and the increase in Nr (i.e., from 5 to 10). For a given valueof K., an increase in the number of datum points used in theregression or, alternatively, an increase in p. results in an
inability of the controller to keep up with GD.Using a larger Nr would average out the random error in
the analyzer, but this would also increase the error ofapproximating an exponential curve with a straight line. Thisprinciple would especially be true for high p. or high cellconcentrations, which would have high total-culture GD.Higher Kc values may be used to correct this error, buthigher K{ values cause greater fluctuations around the setpoint. On the basis of simulation experiments and prelimi-nary experimental observations (Table 1, fermentations Band C), the optimum Nr was determined to be 5, whichcorresponds to a window of 10 min. The best value for K,was found to be 0.5, with higher K. values working better forfast-growing cultures and cultures at high cell densities.
Predictive control fed-batch fermentations. Using the opti-mized system (i.e., Kc, 0.5; Nr, 5; 150-s total lag time [i.e.,time between a change in glucose concentration and com-
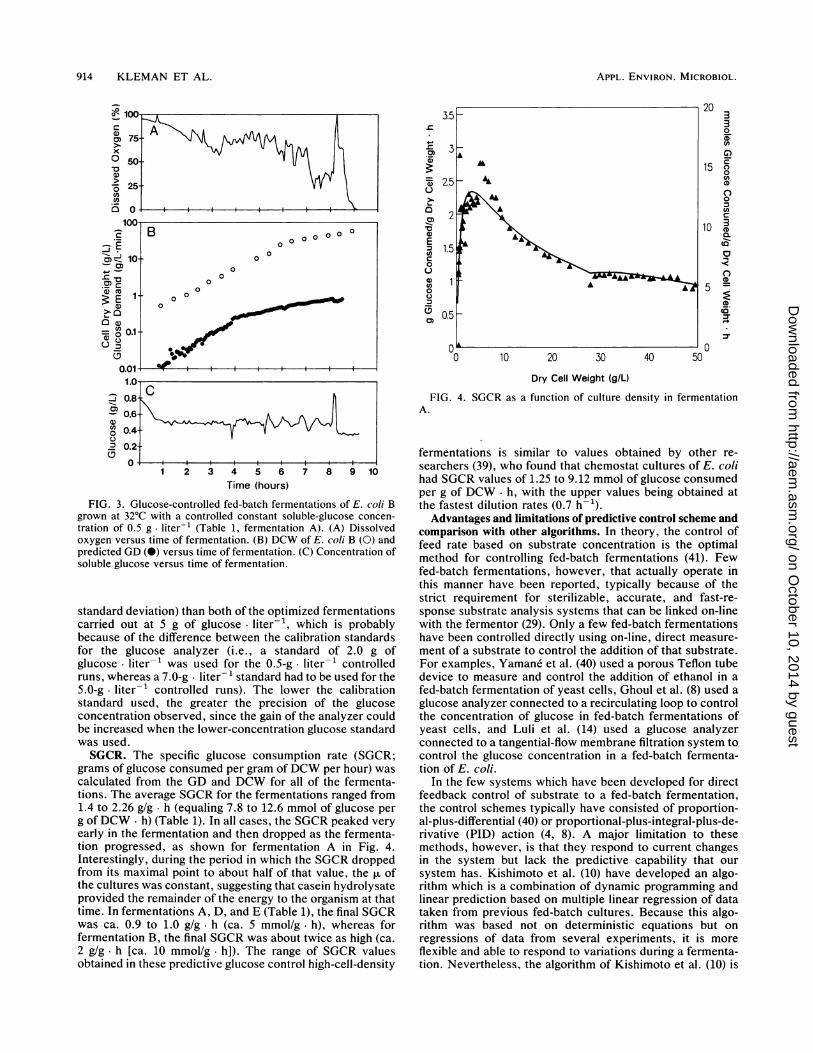
puter response]), E. coli was grown at 32°C in fed-batchculture with the set point for soluble glucose at 0.5 g fiter-'(Fig. 3; Table 1, fermentation A). The initial growth rate was0.76 h-1 (generation time, 55 min), and the final biomassachieved after 9 h was 65 g. liter-' (based on net DCW).During the first hour, the glucose was allowed to declinefrom an initial value of 0.8 g- liter-' to the set point, andbetween hours 1 and 8, the glucose was kept at 0.49 + 0.04g fiter-1 (Table 1), with a standard error of ca. 0.0047. Afterhour 8, the culture became anaerobic, and the controlscheme was unable to add glucose fast enough to satisfy theGD because this demand exceeded the capacity of thepumps used for feeding glucose; therefore, this was a limi-tation of the equipment used, not the control algorithmemployed. Just prior to the point at which the culturebecame anaerobic, the dissolved oxygen increased briefly to100% before declining to zero (Fig. 3); this appears toidentify a point at which the organisms shifted from aerobicto anaerobic metabolism and then back to aerobic catabo-lism of glucose. The GD, the value on which the feed ratewas based, increased from an initial value of 0.01 (grams ofglucose utilized per liter per minute) to a final value of 0.8during this fermentation.Two additional E. coli B predictive control fed-batch
fermentations were run with a set point of 0.5 g ofglucose liter-' (Table 1). The glucose control values forfermentations B and C, run prior to optimization of KC andNr, had standard errors of 0.010 and 0.014, respectively, andwere not as tightly controlled as fermentation A (Table 1).Nevertheless, final cell densities of over 40 g. liter-' wereobtained, even though fermentation B was carried out at atemperature of 37°C and the culture had an initial p. of 0.9h-1.To demonstrate that glucose could be controlled at higher
set points, E. coli was initially grown at 28°C in fed-batch
APPL. ENVIRON. MICROBIOL.
on October 10, 2014 by guest
http://aem.asm
.org/D
ownloaded from
GLUCOSE-CONTROLLED FED-BATCH FERMENTATION
1.0 r
0.81
0 '60.4 { - ~ ~ ~ -
0.2
0 2 4 6 8 1(
1-B0.8 -
0.4
0.2 -
0 2 4 6 8 14
1.0, _.w
0.8 -
0.6 --._ sh ---8_ -
0.4-
0.2
0.0
-
o 0)
c
0
4-J
co.-_
C
C.)C0
L)0
0
° o(
0 2 4 6 8 10
Time (hours)
0.8
0.6 -
0.4
0.2
--10.00 2 4 6 8 1t
1.0F
0.8
0.6
0.4
0.2
0.00 2 4 6 8 11
0.81
0.2-
0.0 2 4 6 8 10
Time (hours)FIG. 2. Computer simulation of glucose adaptive-controlled fed-batch fermentation. The following parameters were assumed for all
simulations: control of glucose, at 0.5 g liter-1; growth yield, 0.5 g of cell per g of glucose utilized. (A) K, 2.0; ,u, 0.76 h-'; N,, 5. (B) K,,0.5; p., 0.76 h-1; N,, 5. (C) K, 0.2; p., 0.76 h-; N,, 5. (D) K, 0.5; p., 0.976 h-; N,, 5. (E) K, 0.5; p., 0.76 h-1; Nr, 10. (F) Kc, 0.5; p., 0.67h-1; N,, 5.
culture with a glucose set point of 5.0 g liter-' (Table 1,fermentation D). In this culture, the specific growth rate was0.67 h-' (62-min generation time) and the final biomassobtained was 58 g liter-'. This fermentation also demon-strated that high cell densities could be obtained by using alower temperature, and therefore a slower growth rate, whilemaintaining optimal control of the glucose concentration(compare fermentations D and E, Table 1). Between hours 1and 9, the glucose concentration averaged 5.10 + 0.18g. liter-'. The GD of the culture increased from an initialvalue of 0.01 g of glucose utilized liter-' min-' to a finalvalue of 1.0 during this fermentation.The final fermentation (Table 1, fermentation E) was a
repeat of fermentation D, except that the temperature was
controlled at 32 instead of 28°C to show the effect oftemperature (and therefore ,u) on the ability to obtain highcell densities in the glucose-controlled fermentation system.When E. coli was grown in fed-batch culture at 32°C with aset point of 5.0 g of glucose liter-' (Table 1, fermentationE), the initial growth rate was 0.78 h-1 (53-min generationtime) and the final biomass achieved was 45 g. liter-'. Fromhour 1 to 8 of the 10-h fermentation, the glucose concentra-tion was maintained at an average of 5.07 + 0.21 g- liter-'(standard error, 0.025).The optimized fermentation controlled at 0.5 g of
glucose liter-' was more tightly controlled (based on the
TABLE 1. Glucose adaptive and feedback-controlled fed-batch fermentations of E. coli B
Data for fermentation run:Parameter
A Ba Ca D E
Glucose set point (g. liter-) 0.5 0.5 0.5 5.0 5.0Actual glucose concn (g. liter-l)b 0.49 + 0.04 0.44 + 0.09 0.46 + 0.12 5.10 + 0.18 5.07 + 0.21Temp (°C) 32 37 32 28 32Initial p. (h-1) 0.76 0.90 0.69 0.67 0.78Final biomass (g liter-') 65 42 48 58 45Fermentation time (h) 9 7 9 12 10Avg SGCRC 1.6 2.3 NDd 1.9 1.4Acetate produced (g- liter-s)e 1.73 3.12 2.49 2.85 1.94
" Fermentations were carried out before final optimization of the controller, i.e., K, value and N, used for each regression analysis.b Mean ± standard deviation (total of 70 datum points). Data are from hour 1 through hour 8 in all fermentations (prior to onset of anaerobiois).'See Fig. 4 for details of SGCR as a function of culture density." ND, Not done.e Duplicate samples taken just prior to onset of anaerobiosis.
D
Om...'b.-III.~~~~~
J
a3)
c
04-j
al)0co
C)
(1)
0)
0
(D C
VOL. 57, 1991 913
I
on October 10, 2014 by guest
http://aem.asm
.org/D
ownloaded from
APPL. ENVIRON. MICROBIOL.
8g 100
:n 75x
O 50a)> 25Z
100
m 10- ca.2' c
E1a)
- O 0.1
0.011.0
I 0.8
0.6O 0.4' 0.2
1 2 3 4 5 6 7 8 9Time (hours)
._02)
=
01)
cncuCDaC,)I
0En
0
0
0)
50
20 330CDtn
c)15 O0
CA,CD
00cnc
10 3CDco
0CD
5 =
O
Dry Cell Weight (g/L)
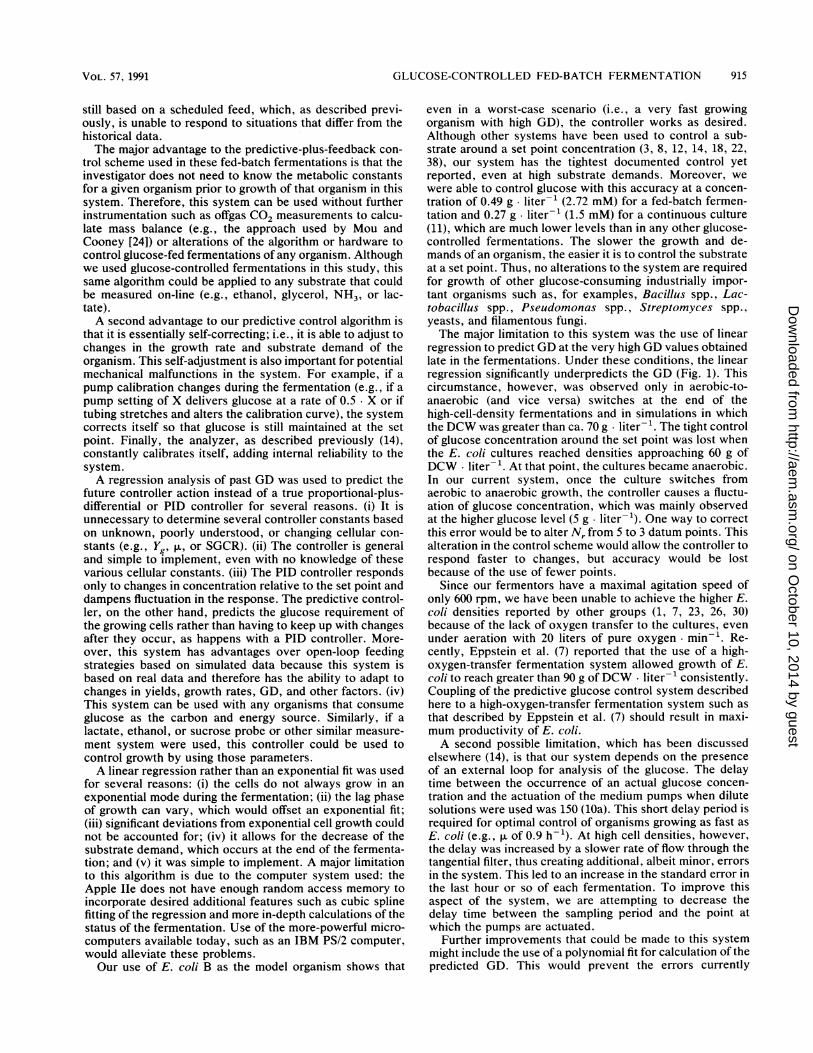
FIG. 4. SGCR as a function of culture density in fermentationA.
10
FIG. 3. Glucose-controlled fed-batch fermentations of E. coli Bgrown at 32°C with a controlled constant soluble-glucose concen-tration of 0.5 g. liter-' (Table 1, fermentation A). (A) Dissolvedoxygen versus time of fermentation. (B) DCW of E. coli B (0) andpredicted GD (0) versus time of fermentation. (C) Concentration ofsoluble glucose versus time of fermentation.
standard deviation) than both of the optimized fermentationscarried out at 5 g of glucose liter-', which is probablybecause of the difference between the calibration standardsfor the glucose analyzer (i.e., a standard of 2.0 g ofglucose liter-' was used for the 0.5-g liter-1 controlledruns, whereas a 7.0-g liter-1 standard had to be used for the5.0-g. liter-1 controlled runs). The lower the calibrationstandard used, the greater the precision of the glucoseconcentration observed, since the gain of the analyzer couldbe increased when the lower-concentration glucose standardwas used.SGCR. The specific glucose consumption rate (SGCR;
grams of glucose consumed per gram ofDCW per hour) wascalculated from the GD and DCW for all of the fermenta-tions. The average SGCR for the fermentations ranged from1.4 to 2.26 g/g h (equaling 7.8 to 12.6 mmol of glucose perg of DCW. h) (Table 1). In all cases, the SGCR peaked veryearly in the fermentation and then dropped as the fermenta-tion progressed, as shown for fermentation A in Fig. 4.Interestingly, during the period in which the SGCR droppedfrom its maximal point to about half of that value, the ,. ofthe cultures was constant, suggesting that casein hydrolysateprovided the remainder of the energy to the organism at thattime. In fermentations A, D, and E (Table 1), the final SGCRwas ca. 0.9 to 1.0 g/g. h (ca. 5 mmol/g h), whereas forfermentation B, the final SGCR was about twice as high (ca.2 g/g. h [ca. 10 mmol/g- h]). The range of SGCR valuesobtained in these predictive glucose control high-cell-density
fermentations is similar to values obtained by other re-searchers (39), who found that chemostat cultures of E. colihad SGCR values of 1.25 to 9.12 mmol of glucose consumedper g of DCW. h, with the upper values being obtained atthe fastest dilution rates (0.7 h-1).
Advantages and limitations of predictive control scheme andcomparison with other algorithms. In theory, the control offeed rate based on substrate concentration is the optimalmethod for controlling fed-batch fermentations (41). Fewfed-batch fermentations, however, that actually operate inthis manner have been reported, typically because of thestrict requirement for sterilizable, accurate, and fast-re-sponse substrate analysis systems that can be linked on-linewith the fermentor (29). Only a few fed-batch fermentationshave been controlled directly using on-line, direct measure-ment of a substrate to control the addition of that substrate.For examples, Yamane et al. (40) used a porous Teflon tubedevice to measure and control the addition of ethanol in afed-batch fermentation of yeast cells, Ghoul et al. (8) used aglucose analyzer connected to a recirculating loop to controlthe concentration of glucose in fed-batch fermentations ofyeast cells, and Luli et al. (14) used a glucose analyzerconnected to a tangential-flow membrane filtration system tocontrol the glucose concentration in a fed-batch fermenta-tion of E. coli.
In the few systems which have been developed for directfeedback control of substrate to a fed-batch fermentation,the control schemes typically have consisted of proportion-al-plus-differential (40) or proportional-plus-integral-plus-de-rivative (PID) action (4, 8). A major limitation to thesemethods, however, is that they respond to current changesin the system but lack the predictive capability that oursystem has. Kishimoto et al. (10) have developed an algo-rithm which is a combination of dynamic programming andlinear prediction based on multiple linear regression of datataken from previous fed-batch cultures. Because this algo-rithm was based not on deterministic equations but onregressions of data from several experiments, it is moreflexible and able to respond to variations during a fermenta-tion. Nevertheless, the algorithm of Kishimoto et al. (10) is
B 0 0 0 0
00
00
00
0
0 0
0~~~~~OP --. .o
C
914 KLEMAN ET AL.
on October 10, 2014 by guest
http://aem.asm
.org/D
ownloaded from
GLUCOSE-CONTROLLED FED-BATCH FERMENTATION
still based on a scheduled feed, which, as described previ-ously, is unable to respond to situations that differ from thehistorical data.The major advantage to the predictive-plus-feedback con-
trol scheme used in these fed-batch fermentations is that theinvestigator does not need to know the metabolic constantsfor a given organism prior to growth of that organism in thissystem. Therefore, this system can be used without furtherinstrumentation such as offgas CO2 measurements to calcu-late mass balance (e.g., the approach used by Mou andCooney [24]) or alterations of the algorithm or hardware tocontrol glucose-fed fermentations of any organism. Althoughwe used glucose-controlled fermentations in this study, thissame algorithm could be applied to any substrate that couldbe measured on-line (e.g., ethanol, glycerol, NH3, or lac-tate).A second advantage to our predictive control algorithm is
that it is essentially self-correcting; i.e., it is able to adjust tochanges in the growth rate and substrate demand of theorganism. This self-adjustment is also important for potentialmechanical malfunctions in the system. For example, if a
pump calibration changes during the fermentation (e.g., if apump setting of X delivers glucose at a rate of 0.5 X or iftubing stretches and alters the calibration curve), the systemcorrects itself so that glucose is still maintained at the setpoint. Finally, the analyzer, as described previously (14),constantly calibrates itself, adding internal reliability to thesystem.A regression analysis of past GD was used to predict the
future controller action instead of a true proportional-plus-differential or PID controller for several reasons. (i) It isunnecessary to determine several controller constants basedon unknown, poorly understood, or changing cellular con-stants (e.g., Yg, ,u, or SGCR). (ii) The controller is generaland simple to implement, even with no knowledge of thesevarious cellular constants. (iii) The PID controller respondsonly to changes in concentration relative to the set point anddampens fluctuation in the response. The predictive control-ler, on the other hand, predicts the glucose requirement ofthe growing cells rather than having to keep up with changesafter they occur, as happens with a PID controller. More-over, this system has advantages over open-loop feedingstrategies based on simulated data because this system isbased on real data and therefore has the ability to adapt tochanges in yields, growth rates, GD, and other factors. (iv)This system can be used with any organisms that consumeglucose as the carbon and energy source. Similarly, if a
lactate, ethanol, or sucrose probe or other similar measure-
ment system were used, this controller could be used tocontrol growth by using those parameters.A linear regression rather than an exponential fit was used
for several reasons: (i) the cells do not always grow in an
exponential mode during the fermentation; (ii) the lag phaseof growth can vary, which would offset an exponential fit;(iii) significant deviations from exponential cell growth couldnot be accounted for; (iv) it allows for the decrease of thesubstrate demand, which occurs at the end of the fermenta-tion; and (v) it was simple to implement. A major limitationto this algorithm is due to the computer system used: theApple IIe does not have enough random access memory toincorporate desired additional features such as cubic splinefitting of the regression and more in-depth calculations of thestatus of the fermentation. Use of the more-powerful micro-computers available today, such as an IBM PS/2 computer,would alleviate these problems.Our use of E. coli B as the model organism shows that
even in a worst-case scenario (i.e., a very fast growingorganism with high GD), the controller works as desired.Although other systems have been used to control a sub-strate around a set point concentration (3, 8, 12, 14, 18, 22,38), our system has the tightest documented control yetreported, even at high substrate demands. Moreover, wewere able to control glucose with this accuracy at a concen-tration of 0.49 g liter-1 (2.72 mM) for a fed-batch fermen-tation and 0.27 g liter-' (1.5 mM) for a continuous culture(11), which are much lower levels than in any other glucose-controlled fermentations. The slower the growth and de-mands of an organism, the easier it is to control the substrateat a set point. Thus, no alterations to the system are requiredfor growth of other glucose-consuming industrially impor-tant organisms such as, for examples, Bacillus spp., Lac-tobacillus spp., Pseudomonas spp., Streptomyces spp.,yeasts, and filamentous fungi.The major limitation to this system was the use of linear
regression to predict GD at the very high GD values obtainedlate in the fermentations. Under these conditions, the linearregression significantly underpredicts the GD (Fig. 1). Thiscircumstance, however, was observed only in aerobic-to-anaerobic (and vice versa) switches at the end of thehigh-cell-density fermentations and in simulations in whichthe DCW was greater than ca. 70 g liter-'. The tight controlof glucose concentration around the set point was lost whenthe E. coli cultures reached densities approaching 60 g ofDCW liter-1. At that point, the cultures became anaerobic.In our current system, once the culture switches fromaerobic to anaerobic growth, the controller causes a fluctu-ation of glucose concentration, which was mainly observedat the higher glucose level (5 g liter-'). One way to correctthis error would be to alter N, from 5 to 3 datum points. Thisalteration in the control scheme would allow the controller torespond faster to changes, but accuracy would be lostbecause of the use of fewer points.
Since our fermentors have a maximal agitation speed ofonly 600 rpm, we have been unable to achieve the higher E.coli densities reported by other groups (1, 7, 23, 26, 30)because of the lack of oxygen transfer to the cultures, evenunder aeration with 20 liters of pure oxygen min-1. Re-cently, Eppstein et al. (7) reported that the use of a high-oxygen-transfer fermentation system allowed growth of E.coli to reach greater than 90 g of DCW liter-' consistently.Coupling of the predictive glucose control system describedhere to a high-oxygen-transfer fermentation system such asthat described by Eppstein et al. (7) should result in maxi-mum productivity of E. coli.A second possible limitation, which has been discussed
elsewhere (14), is that our system depends on the presenceof an external loop for analysis of the glucose. The delaytime between the occurrence of an actual glucose concen-
tration and the actuation of the medium pumps when dilutesolutions were used was 150 (lOa). This short delay period isrequired for optimal control of organisms growing as fast as
E. coli (e.g., ,u of 0.9 h-1). At high cell densities, however,the delay was increased by a slower rate of flow through thetangential filter, thus creating additional, albeit minor, errors
in the system. This led to an increase in the standard error inthe last hour or so of each fermentation. To improve thisaspect of the system, we are attempting to decrease thedelay time between the sampling period and the point atwhich the pumps are actuated.
Further improvements that could be made to this systemmight include the use of a polynomial fit for calculation of thepredicted GD. This would prevent the errors currently
VOL. 57, 1991 915
on October 10, 2014 by guest
http://aem.asm
.org/D
ownloaded from
916 KLEMAN ET AL.
obtained from linear approximation of exponential increasesin GD. This improvement, however, will require greatercomputing power than we currently have with the Apple Ilesystem. A second improvement will be to increase the valueof the proportional gain constant as the GD increases. Eithera scheduled gain increase or a simple input command for theincrease could be used.
Production of acetate by E. coli in glucose-controlled fer-mentations. It is well established that E. coli cultures grow-ing aerobically in the presence of excess glucose produceacidic by-products, particularly acetate (9, 13, 15, 16, 25, 26,32). This glucose-mediated aerobic acidogenesis is known asthe bacterial Crabtree effect (5, 15, 27). The formation ofacetate may be caused by an imbalance between glucosemetabolism and respiration (5). This is a condition in whichthe influx of carbon into the cell exceeding demands forbiosynthesis, the presence of excess NADH, the repressionof tricarboxylic acid cycle enzymes, and uncoupled metab-olism are all likely to be involved (15). In the fed-batchfermentations reported here, the concentration of acetateproduced by E. coli B reached approximately 1.5 to 3.1g liter-'just prior to anaerobiosis, regardless of the glucosecontrol set point (i.e., 0.5 or 5.0 g. liter-'). This is roughlythe same concentration of acetate produced by E. coli B inbatch cultures and in less tightly controlled fed-batch cul-tures (15). When the controlling glucose concentration wasat 0.5 g liter-', however, fermentation A, which was themost tightly controlled run, yielded 30 to 40% less acetatethan the other two runs with glucose at 0.5 g liter-1, whichwere more loosely controlled. This suggests that oscillationsin glucose concentration may promote acetate production.Nevertheless, at these low acetate concentrations (ca. 2g- liter-1), the concentration of the protonated form(CH3COOH; pH 7.0; derived by the Henderson-Hasselbalchequation), which can cause uncoupling (33), would be ca. 10mg. liter-', a concentration which was probably too low toinhibit the growth of E. coli to an observable degree (15). Inthe fed-batch experiments carried out here, the concentra-tion of acetate produced did not appear to be detrimental tocell growth, since 65 g ofE. coli B liter-1 was obtained (andeventually limited by oxygen transfer in our system).The ability of microorganisms to uncouple catabolism
from anabolism is very important to those interested inprocess control. It is becoming apparent that the physiolog-ical state of the host cell greatly affects the expression ofrDNA products and, thereby, the productivity of the fermen-tation process (2, 9, 16, 19, 27). There is apparently a linkbetween the accumulation of acetate caused by the bacterialCrabtree effect and several important factors in rDNAfermentations, such as final cell concentration, cell yield,genetic stability, and product stability (43). Both rapidgrowth (5, 20) and high glucose levels (5) apparently contrib-ute to the bacterial Crabtree effect. Using turbidostats,Doelle et al. (6) found that switchover from normal coupledrespiration to the bacterial Crabtree effect occurred at 1.5 to2.0 g of glucose liter-'. Our previous data and the datashown here suggest that control of fed-batch cultures at 0.5g. liter-' is still above the cutoff point for the Crabtreeeffect. Nevertheless, when strains that do not accumulatelarge amounts of acetate, such as E. coli B, are used (15),only minimal effects on the cultures are observed, even athigh cell densities. E. coli B, however, is not used as a hostfor the expression of rDNA products, so that ability tocontrol glucose at low, consistent levels coupled with low-ering of growth rates and perhaps other, strain-specificfactors may assist in limiting the amount of acidic by-
products produced by various recombinant strains. It will beimportant to determine if the control scheme employed inthis work will have an effect on the ability of recombinant E.coli strains to produce their rDNA products at high celldensities. This may be particularly important when otherstrains of E. coli that may accumulate considerably moreacetate than strain B are used as recombinant hosts (15).
ACKNOWLEDGMENTS
This work was partially supported by YSI, Inc., Yellow Springs,Ohio.We thank Don Ordaz in the Ohio State University Fermentation
Facility for his technical assistance during these investigations.
REFERENCES1. Allen, B., and G. W. Luli. 1987. A gradient-feed process for E.
coli fermentations. Biopharm. Manuf. 1:38-41.2. Brown, S. W., H.-P. Meyer, and A. Fiechter. 1985. Continuous
production of human leukocyte interferon with Escherichia coliand continuous cell lysis in a two stage chemostat. Appl.Microbiol. Biotechnol. 23:5-9.
3. Cleland, N., and S. Enfors. 1983. Control of glucose-fed batchcultivations of E. coli by means of an oxygen stabilized enzymeelectrode. Eur. J. Appl. Microbiol. Biotechnol. 18:141-147.
4. Dairaku, K., Y. Yamasaki, K. Kuki, S. Shioya, and T. Taka-matsu. 1981. Maximum production in a bakers' yeast fed-batchculture by a tubing method. Biotechnol. Bioeng. 23:2069-2081.
5. Doelle, H. W., K. N. Ewings, and N. W. Hollywood. 1982.Regulation of glucose metabolism in bacterial systems. Adv.Biochem. Eng. 23:1-35.
6. Doelle, H. W., N. W. Hollywood, and A. W. Westwood. 1974.Effect of glucose concentration on a number of enzymes in-volved in the aerobic and anaerobic utilization of glucose inturbidostat-cultures of Escherichia coli. Microbios 9:221-232.
7. Eppstein, L., J. Shevitz, X.-M. Yang, and S. Weiss. 1989.Increased biomass production in a benchtop fermentor. Bio/Technology 7:1178-1181.
8. Ghoul, M., E. Ronat, and J. Engasser. 1986. An automatic andsterilizable sampler for laboratory fermentors: application to theon-line control of glucose concentration. Biotechnol. Bioeng.28:119-121.
9. Jensen, E. B., and S. Carlsen. 1990. Production of recombinanthuman growth hormone in Escherichia coli: expression ofdifferent precursors and physiological effects of glucose, ace-tate, and salts. Biotechnol. Bioeng. 36:1-11.
10. Kishimoto, M., T. Yoshida, and H. Taguchi. 1980. Optimizationof fed-batch culture by dynamic programming and regressionanalysis. Biotechnol. Lett. 2:403-408.
10a.Kleman, G. L. Unpublished data.11. Kleman, G. L., J. J. Chalmers, G. W. Luli, and W. R. Strohl.
1991. Glucose-stat: a glucose-controlled continuous culture.Appl. Environ. Microbiol. 57:918-923.
12. Kole, M. M., D. Ward, and D. F. Gerson. 1986. Simultaneouscontrol of ammonium and glucose concentrations in Escherichiacoli fermentations. J. Ferment. Technol. 64:233-238.
13. Lee, Y. L., and H. N. Chang. 1990. High cell density culture ofa recombinant Escherichia coli producing penicillin acylase in amembrane cell recycle fermentor. Biotechnol. Bioeng. 36:330-337.
14. Luli, G. W., S. M. Schlasner, D. Ordaz, M. Mason, and W. R.Strohl. 1987. An automatic, on-line glucose analyzer for feed-back control of fed-batch growth of Escherichia coli. Biotech-nol. Tech. 1:225-230.
15. Luli, G. W., and W. R. Strohl. 1990. Comparison of growth,acetate production, and acetate inhibition of Escherichia colistrains in batch and fed-batch fermentations. AppI. Environ.Microbiol. 56:1004-1011.
16. MacDonald, H. L., and J. 0. Neway. 1990. Effects of mediumquality on the expression of human interleukin-2 at high celldensity in fermentor cultures of Escherichia coli K-12. Appl.Environ. Microbiol. 56:640-645.
APPL. ENVIRON. MICROBIOL.
on October 10, 2014 by guest
http://aem.asm
.org/D
ownloaded from
GLUCOSE-CONTROLLED FED-BATCH FERMENTATION
17. McLaughlin, J. K., C. L. Meyer, and E. T. Papoutsakis. 1985.Gas chromatography and gateway sensors for on-line stateestimation of complex fermentations (butanol-acetone fermen-tations). Biotechnol. Bioeng. 27:1246-1257.
18. Meschke, J., H. Bennemann, H. Herbst, S. Dormeier, and D. C.Hempel. 1988. On-line HPLC-measurement and control of sub-strate in a continuously operated biological tank reactor. Bio-process Eng. 3:151-157.
19. Meyer, H.-P., H.-J. Kuhn, S. W. Brown, and A. Fiechter. 1984.Production of human leukocyte interferon by Escherichia coli,p. 499-505. In Proceedings of the Third European Congress onBiotechnology, vol. 1. Verlag Chemie GmbH, Weinheim, Fed-eral Republic of Germany.
20. Meyer, H.-P., C. Leist, and A. Fiechter. 1984. Acetate formationin continuous culture of Escherichia coli K12 Dl on defined andcomplex media. J. Biotechnol. 1:355-358.
21. Minihane, B. J., and D. E. Brown. 1986. Fed-batch culturetechnology. Biotechnol. Adv. 4:207-218.
22. Mori, H., T. Yamane, T. Kobayashi, and S. Shimizu. 1983. Newcontrol strategies for continuous cultures based upon a micro-computer-aided nutristat. J. Ferment. Technol. 61:305-314.
23. Mori, H., T. Yano, T. Kobayashi, and S. Shimizu. 1979. Highdensity cultivation of biomass in fed-batch system with DO-stat.J. Chem. Eng. 12:313-319.
24. Mou, D.-G., and C. L. Cooney. 1983. Growth monitoring andcontrol through computer-aided on-line mass balancing in afed-batch penicillin fermentation. Biotechnol. Bioeng. 25:225-255.
25. Paalme, T., K. Tiisma, A. Kahru, K. Vanatalu, and R. Vilu.1990. Glucose-limited fed-batch cultivation of Escherichia coliwith computer-controlled fixed growth rate. Biotechnol. Bio-eng. 35:312-319.
26. Pan, J. G., J. S. Rhee, and J. M. Lebeault. 1987. Physiologicalconstraints in increasing biomass concentration of Escherichiacoli B in fed-batch culture. Biotechnol. Lett. 9:89-94.
27. Rinas, U., H.-A. Kracke-Helm, and K. Schugerl. 1989. Glucoseas a substrate in recombinant strain fermentation technology.By-product formation, degradation and intracellular accumula-tion of recombinant protein. Appl. Microbiol. Biotechnol. 31:163-167.
28. Robbins, J. W., Jr., and K. B. Taylor. 1989. Optimization ofEscherichia coli growth by controlled addition of glucose.Biotechnol. Bioeng. 34:1289-1294.
29. Schugerl, K., T. Lorenz, A. Lubbert, J. Niehoff, T. Scheper, andW. Schmidt. 1986. Pros and cons: on-line versus off-line analysisof fermentations. Trends Biotechnol. 4:11-15.
30. Shay, L. K., H. R. Hunt, and G. H. Wegner. 1987. High-productivity fermentation process for cultivating industrial mi-croorganisms. J. Ind. Microbiol. 2:79-85.
31. Shiloach, J., and S. Bauer. 1975. High-yield growth of E. coli at
different temperatures in a bench scale fermentor. Biotechnol.Bioeng. 17:227-239.
32. Smirnova, G. V., and 0. N. Oktyabr'skii. 1985. Influence ofacetate on the growth of Escherichia coli under aerobic andanaerobic conditions. Mikrobiologiya 54:252-256. (Translatedin Microbiology [USSR] 54:205-209.)
33. Smirnova, G. V., and 0. N. Oktyabr'skii. 1988. Effect of activityof primary proton pumps on growth of Escherichia coli in thepresence of acetate. Mikrobiologiya 57:554-559. (Translated inMicrobiology [USSR] 57:446-451.)
34. Strohl, W. R., P. L. Lorensen, and S. M. Schlasner. 1986.Microcomputer-control of fermentation processes. Biotech-niques 4:336-343.
35. Suzuki, T., T. Yamane, and S. Shimizu. 1986. Control of carbonsource supply and dissolved oxygen by use of carbon dioxideconcentration of exhaust gas in fed-batch culture. J. Ferment.Technol. 64:317-326.
36. Suzuki, T., T. Yamane, and S. Shimizu. 1987. Mass productionof thiostrepton by fed-batch culture of Streptomyces laurentiiwith pH-stat modal feeding of multi-substrate. Appl. Microbiol.Biotechnol. 25:526-531.
37. Suzuki, T., T. Yamane, and S. Shimizu. 1988. Effect and controlof glucose feeding on bacitracin production by fed-batch cultureof Bacillus licheniformis. J. Ferment. Technol. 66:85-91.
38. Suzuki, T., T. Yasuda, T. Yamane, and S. Shimizu. 1986.Detection and automatic control of ammonium ion concentra-tion in microbial culture with an ammonium ion selectiveelectrode. J. Ferment. Technol. 64:63-70.
39. Tempest, D. W., and 0. M. Neijssel. 1987. Growth and energydistribution, p. 797-806. In F. C. Neidhardt, J. L. Ingraham, K.B. Low, B. Magasanik, M. Schaechter, and H. E. Umbarger(ed.), Escherichia coli and Salmonella typhimurium: cellularand molecular biology, vol. 1. American Society for Microbiol-ogy, Washington, D.C.
40. Yamane, T., M. Matsuda, and E. Sada. 1981. Application ofporous Teflon tubing method to automatic fed-batch culture ofmicroorganisms. II. Automatic constant-value control of fedsubstrate (ethanol) concentration in semibatch culture of yeast.Biotechnol. Bioeng. 23:2509-2524.
41. Yamane, T., and S. Shimizu. 1984. Fed-batch techniques inmicrobial processes, p. 147-194. In A. Fiechter (ed.), Advancesin biochemical engineering/biotechnology. Springer-Verlag,Berlin.
42. Yano, T., T. Kobayashi, and S. Shimizu. 1981. Control system ofdissolved oxygen concentration employing a microcomputer. J.Ferment. Technol. 59:295-301.
43. Zabriskie, D. W., and E. J. Arcuri. 1986. Factors influencingproductivity of fermentations employing recombinant microor-ganisms. Enzyme Microb. Technol. 9:706-717.
917VOL. 57, 1991
on October 10, 2014 by guest
http://aem.asm
.org/D
ownloaded from
Related Documents